The Out-of-Pocket Cost Burden of Cancer Care—A Systematic Literature Review


1
Institute of Health Policy, Management & Evaluation, Dalla Lana School of Public Health, University of Toronto, Toronto, ON M5T 3M7, Canada
2
The Canadian Partnership Against Cancer, Toronto, ON M5H 1J8, Canada
3
Centre for Health Economics and Hull York Medical School, University of York, Heslington, York YO10 5DD, UK
4
Centre for Addiction and Mental Health, Institute for Mental Health Policy Research and Campbell Family Mental Health Research Institute, Toronto, ON M6J 1H4, Canada
*
Author to whom correspondence should be addressed.
Curr. Oncol. 2021, 28(2), 1216-1248; https://0-doi-org.brum.beds.ac.uk/10.3390/curroncol28020117
Submission received: 15 October 2020
/
Revised: 5 March 2021
/
Accepted: 11 March 2021
/
Published: 15 March 2021
Abstract
:Background: Out-of-pocket costs pose a substantial economic burden to cancer patients and their families. The purpose of this study was to evaluate the literature on out-of-pocket costs of cancer care. Methods: A systematic literature review was conducted to identify studies that estimated the out-of-pocket cost burden faced by cancer patients and their caregivers. The average monthly out-of-pocket costs per patient were reported/estimated and converted to 2018 USD. Costs were reported as medical and non-medical costs and were reported across countries or country income levels by cancer site, where possible, and category. The out-of-pocket burden was estimated as the average proportion of income spent as non-reimbursable costs. Results: Among all cancers, adult patients and caregivers in the U.S. spent between USD 180 and USD 2600 per month, compared to USD 15–400 in Canada, USD 4–609 in Western Europe, and USD 58–438 in Australia. Patients with breast or colorectal cancer spent around USD 200 per month, while pediatric cancer patients spent USD 800. Patients spent USD 288 per month on cancer medications in the U.S. and USD 40 in other high-income countries (HICs). The average costs for medical consultations and in-hospital care were estimated between USD 40–71 in HICs. Cancer patients and caregivers spent 42% and 16% of their annual income on out-of-pocket expenses in low- and middle-income countries and HICs, respectively. Conclusions: We found evidence that cancer is associated with high out-of-pocket costs. Healthcare systems have an opportunity to improve the coverage of medical and non-medical costs for cancer patients to help alleviate this burden and ensure equitable access to care.
1. Introduction
Cancer is a major international health issue due to its considerable impact on mortality and morbidity. Over 22 million people are expected to be diagnosed with cancer in 2030, worldwide [1]. Similar to other chronic conditions, cancer patients require long-term medical attention, posing a considerable economic burden to healthcare systems, patients and their families [2]. Furthermore, rising costs of cancer care have been associated with higher out-of-pocket expenses, medical debt, and even bankruptcy [3]. As such, there is an imperative to understand and measure the economic burden to help mitigate the impact of cancer [4].
Conceptually, the economic burden of cancer can be divided into three categories: psychosocial costs, indirect costs (mostly productivity losses), and direct costs [5]. In turn, direct costs can be divided into medical and non-medical costs paid either by third-party payers (e.g., healthcare systems or private insurers), or by patients out-of-pocket. Studies have extensively evaluated the direct medical costs associated with cancer that are paid by healthcare systems [6,7]. However, there are less data on the medical and non-medical out-of-pocket expenses borne by cancer patients and their caregivers across international settings. Studies that have measured the out-of-pocket burden of cancer have usually focused on estimating a given cost category (e.g., medication copayments) among specific cancer patients (e.g., breast cancer survivors) from a single country perspective [8]. However, cancer is a heterogeneous condition, and the out-of-pocket burden is expected to depend on multiple factors, such as cancer site, patient age and sex, or insurance coverage arrangements in place in each context. Previous research has shown that out-of-pocket costs are expected to pose a heavier burden among cancer populations with lower income [9]. Moreover, out-of-pocket costs contribute to the economic burden of cancer patients, regardless of the country they live in. Although healthcare insurance coverage differs across jurisdictions, the literature suggests that medical debt is not just a problem in low- and middle-income countries (LMICs); it also extends to insured individuals in high-income countries (HICs) [10]. This is specifically due to new and costly therapies that create a greater demand on strained resources [11]. A synthesis of the evidence presents the opportunity to characterize and compare the out-of-pocket burden across settings, to help identify at-risk populations and understand which specific types of out-of-pocket expenses contribute more/less to the burden. Therefore, the objective of this study was to provide a comprehensive overview of the international literature on out-of-pocket costs associated with cancer and to provide a source that compiles these data and discusses the associated strengths and weaknesses of measuring these costs across diverse patient populations.
2. Methods
2.1. Data Sources and Search Strategies
A systematic review of electronic databases was conducted to identify studies, which estimated costs paid out-of-pocket by patients with cancer and their caregivers. In particular, we searched MEDLINE, EMBASE (Excerpta Medical Database), EconLit, and CINAHL, between database inception and 7 May 2019. Search terms combined medical subject headings (MeSH), Embase subject headings (Emtree), and keywords for out-of-pocket costs (e.g., deductibles, copayments), and cancer. No electronic search filters for date or language were used. The reference lists of all included papers were reviewed to identify potentially relevant papers. Google Scholar was searched using keywords from the main search strategy. The search strategies can be found in Supplementary 1. The review was registered in Prospero (ID: CRD42019133508). We followed the Preferred Reporting Items for Systematic Reviews and Meta-Analyses (PRISMA) guidelines [12]; the checklist can be found in Supplementary 4.
2.2. Eligibility Criteria
We included any study that estimated out-of-pocket costs for patients with any type of cancer, paid either by patients or their caregiver(s). No restriction was applied to the study design or the type of cost (e.g., medication, transport, etc). Costs were identified across the entire cancer care continuum from diagnosis to end-of-life care. Studies were excluded if any of the following criterion was met: (a) the population of interest was not cancer patients or their caregivers; (b) out-of-pocket costs were not explicitly estimated as a primary or secondary outcome; (c) the studies included duplicate data sources; and (d) a full-text article was unavailable. The search results were screened first by title and abstract, then by full text by two independent reviewers (NI and BE). Any article that either reviewer included at the title and abstract review stage was included for full-text review. The kappa statistic was estimated to evaluate inter-observer agreement [13]. Disagreements between reviewers were settled by discussion with a third reviewer (CdO) until a consensus was reached.
2.3. Data Extraction
A data extraction template was designed from a sample of studies that measured different dimensions of the economic burden of cancer. We extracted the following study characteristics: authors, publication year, setting, country, data sources, study population, sample size, cancer site, cancer care continuum stage, mean age of patients, percentage of female population, percentage insured, and mean income of patients. The outcomes of interest were non-reimbursed medical and non-medical out-of-pocket costs, however defined. This included non-reimbursed co-payments and deductibles. The tool (e.g., surveys, cost diaries), time frame, currency, and currency year were extracted to estimate mean monthly out-of-pocket costs. Authors were contacted if further information was required.
2.4. Data Synthesis
The out-of-pocket costs reported by individual studies were reported and synthesized. Studies that estimated mean out-of-pocket costs per month per patient and reported the standard deviation were extracted and did not require further synthesis. Standard deviations were estimated from confidence intervals assuming critical values of t distributions [14]. Median estimates were transformed to mean costs using mathematical inequalities and statistical approximations, as described by Hozo et al. [15]. To do so, studies had to report a median cost, the interquartile range (or range), and the sample size. To ensure comparability, all mean costs were transformed to reflect monthly expenditure (e.g., annual mean out-of-pocket costs were divided by 12 to obtain a mean per-month estimate). Furthermore, exchange rates were used to convert all non-USD costs to USD costs, which were then adjusted for inflation to establish a single metric to allow controlling for any changes in nominal prices. Exchange rates and pharma consumer price indices from the World Bank’s Global Economic Monitor were used to convert costs to 2018 USD [16]. Once all costs were converted to a single measure (mean out-of-pocket cost per month per patient), estimates were stratified and presented separately by country, country income-level (as defined by the World Bank [17]), or type of healthcare system (e.g., HICs with and without universal health coverage), depending on data availability; where possible, estimates were stratified and presented by cancer site within country. Costs were reported or estimated only from studies that provided sufficient information (i.e., currency, currency year, mean cost, standard deviation/measure of spread, time frame). Studies that failed to provide a measure of spread (e.g., standard deviation), or a time frame, could not be used to compute a weighted average. Furthermore, we estimated a weighted average cost across expenditure categories (medications, medical consultations, in-hospital care, transport/travel, and caregiver costs) and across cancer sites. Finally, the proportion of household income spent on out-of-pocket expenses for cancer-related care was reported and calculated for the studies that reported a measure of income (distribution or mean value) among the studied population
2.5. Quality Assessment
Quality assessment was conducted in duplicate (NI and BE) using the Ottawa-Newcastle Assessment Tool for Cohort Studies [18]. Cross-sectional studies were evaluated with a variation of the Ottawa-Newcastle tool [18]. Three domains were evaluated for prospective cohort and cross-sectional studies: selection (i.e., representativeness of the sample), comparability (i.e., comparability of subjects, confounding factors), and outcome (i.e., assessment of outcome, statistical test used). Each domain was assessed for risk of bias (low, unclear, or high) by two reviewers (NI and BE).
3. Results
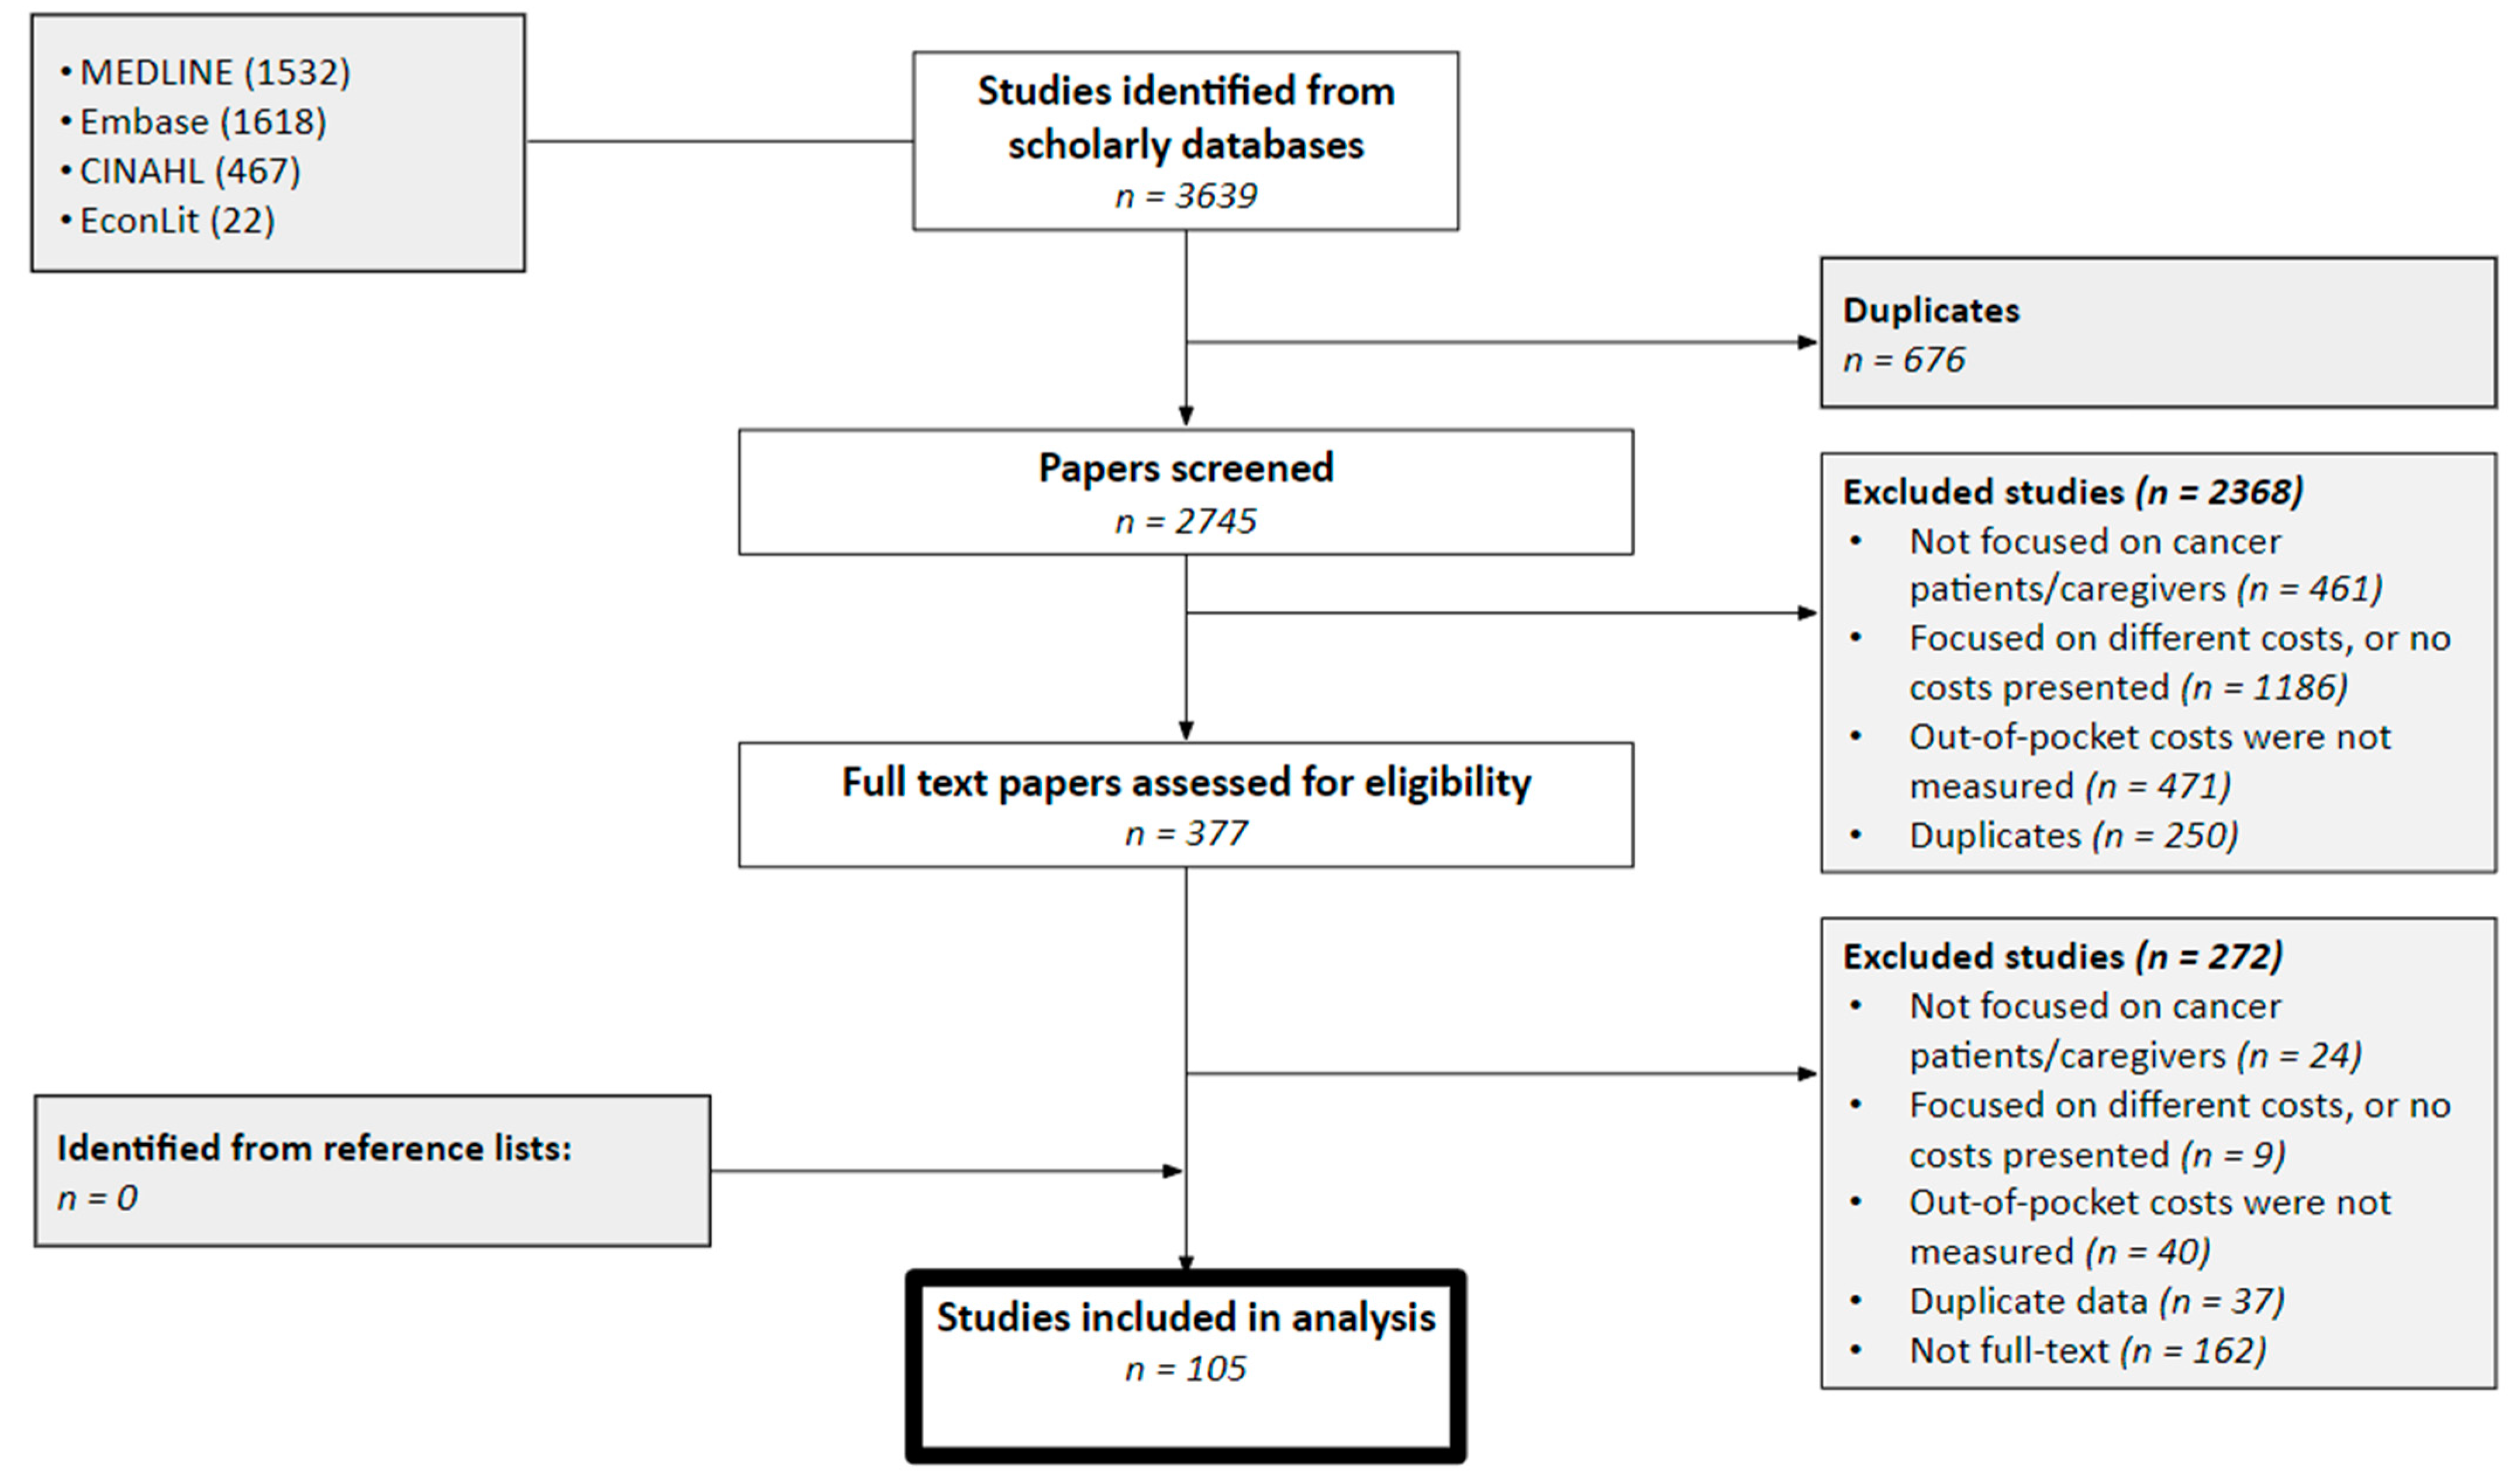
The systematic review identified 3639 records, of which 105 full-text studies were retrieved [8,19,20,21,22,23,24,25,26,27,28,29,30,31,32,33,34,35,36,37,38,39,40,41,42,43,44,45,46,47,48,49,50,51,52,53,54,55,56,57,58,59,60,61,62,63,64,65,66,67,68,69,70,71,72,73,74,75,76,77,78,79,80,81,82,83,84,85,86,87,88,89,90,91,92,93,94,95,96,97,98,99,100,101,102,103,104,105,106,107,108,109,110,111,112,113,114,115,116,117,118,119,120,121,122]. The eligibility criteria and reasons for exclusion are presented in Figure 1. Duplicate records (n = 676) were excluded before the abstract review stage. Half of the reviewed abstracts reported costs that were not relevant (e.g., indirect costs) and 20% did not measure out-of-pocket costs. In total, 377 studies were selected for full-text review, of which 42% were not full-text articles (i.e., conference abstracts). No additional records were identified after searching the reference lists of the included articles. A high inter-observer agreement was measured for the title and abstract review and the full-text review (kappa = 0.71).
The study characteristics are summarized in Table 1. The year of publication ranged from 1979 to 2019. The total combined sample size of the identified studies was 774,135 cancer patients and/or caregivers and ranged from 11 to 200,000. The studies with the largest sample size usually identified patients through administrative data sources, such as linked cancer registries, medical claims data, and medical expenditure surveys. Costs were collected retrospectively in most studies (n = 73) using observational and cross-sectional study designs. On the other hand, prospective studies followed cohorts of cancer patients through time (n = 32). The mean age of pediatric cancer patients ranged from 5.6 to 9 years old, and from 37 to 80 years old among adults. Half of the studies were conducted in the U.S. (n = 55, 52%), followed by Australia (n = 12, 11%), Western Europe (France, Germany, Ireland, UK, and Italy) (n = 11, 10%), Canada (n = 9, 8%), and India (n = 6, 5%). A few were conducted in South East Asia (Laos, Vietnam, Malaysia, Philippines, Thailand, Cambodia and Myanmar) (n = 4, 4%), China (n = 3, 3%), Japan (n = 3, 3%) and in Latin America (Mexico) (n = 1, 1%). Half of the studies (n = 54) included patients with full or partial healthcare insurance (public healthcare systems with universal coverage, private, or a combination) and excluded uninsured patients. All patients from studies conducted in countries with universal healthcare coverage were publicly insured.
Most studies included patients receiving active treatment (any stage) (n = 50, 47%), followed by those on patients who were recently diagnosed (n = 25, 24%). A few studies focused on end-of-life and/or palliative care (n = 9, 8%), and survivorship (n = 9, 8%). Out-of-pocket costs were measured using different tools; some studies, usually those following cohorts of cancer patients, employed cost diaries and logbooks that patients used to register the out-of-pocket and non-reimbursed expenses related to their cancer care [20,23,59,68,75,78]. On the other hand, most observational studies were conducted using health administrative data, expenditure surveys, and medical expenditure claims from insurance companies and healthcare records.
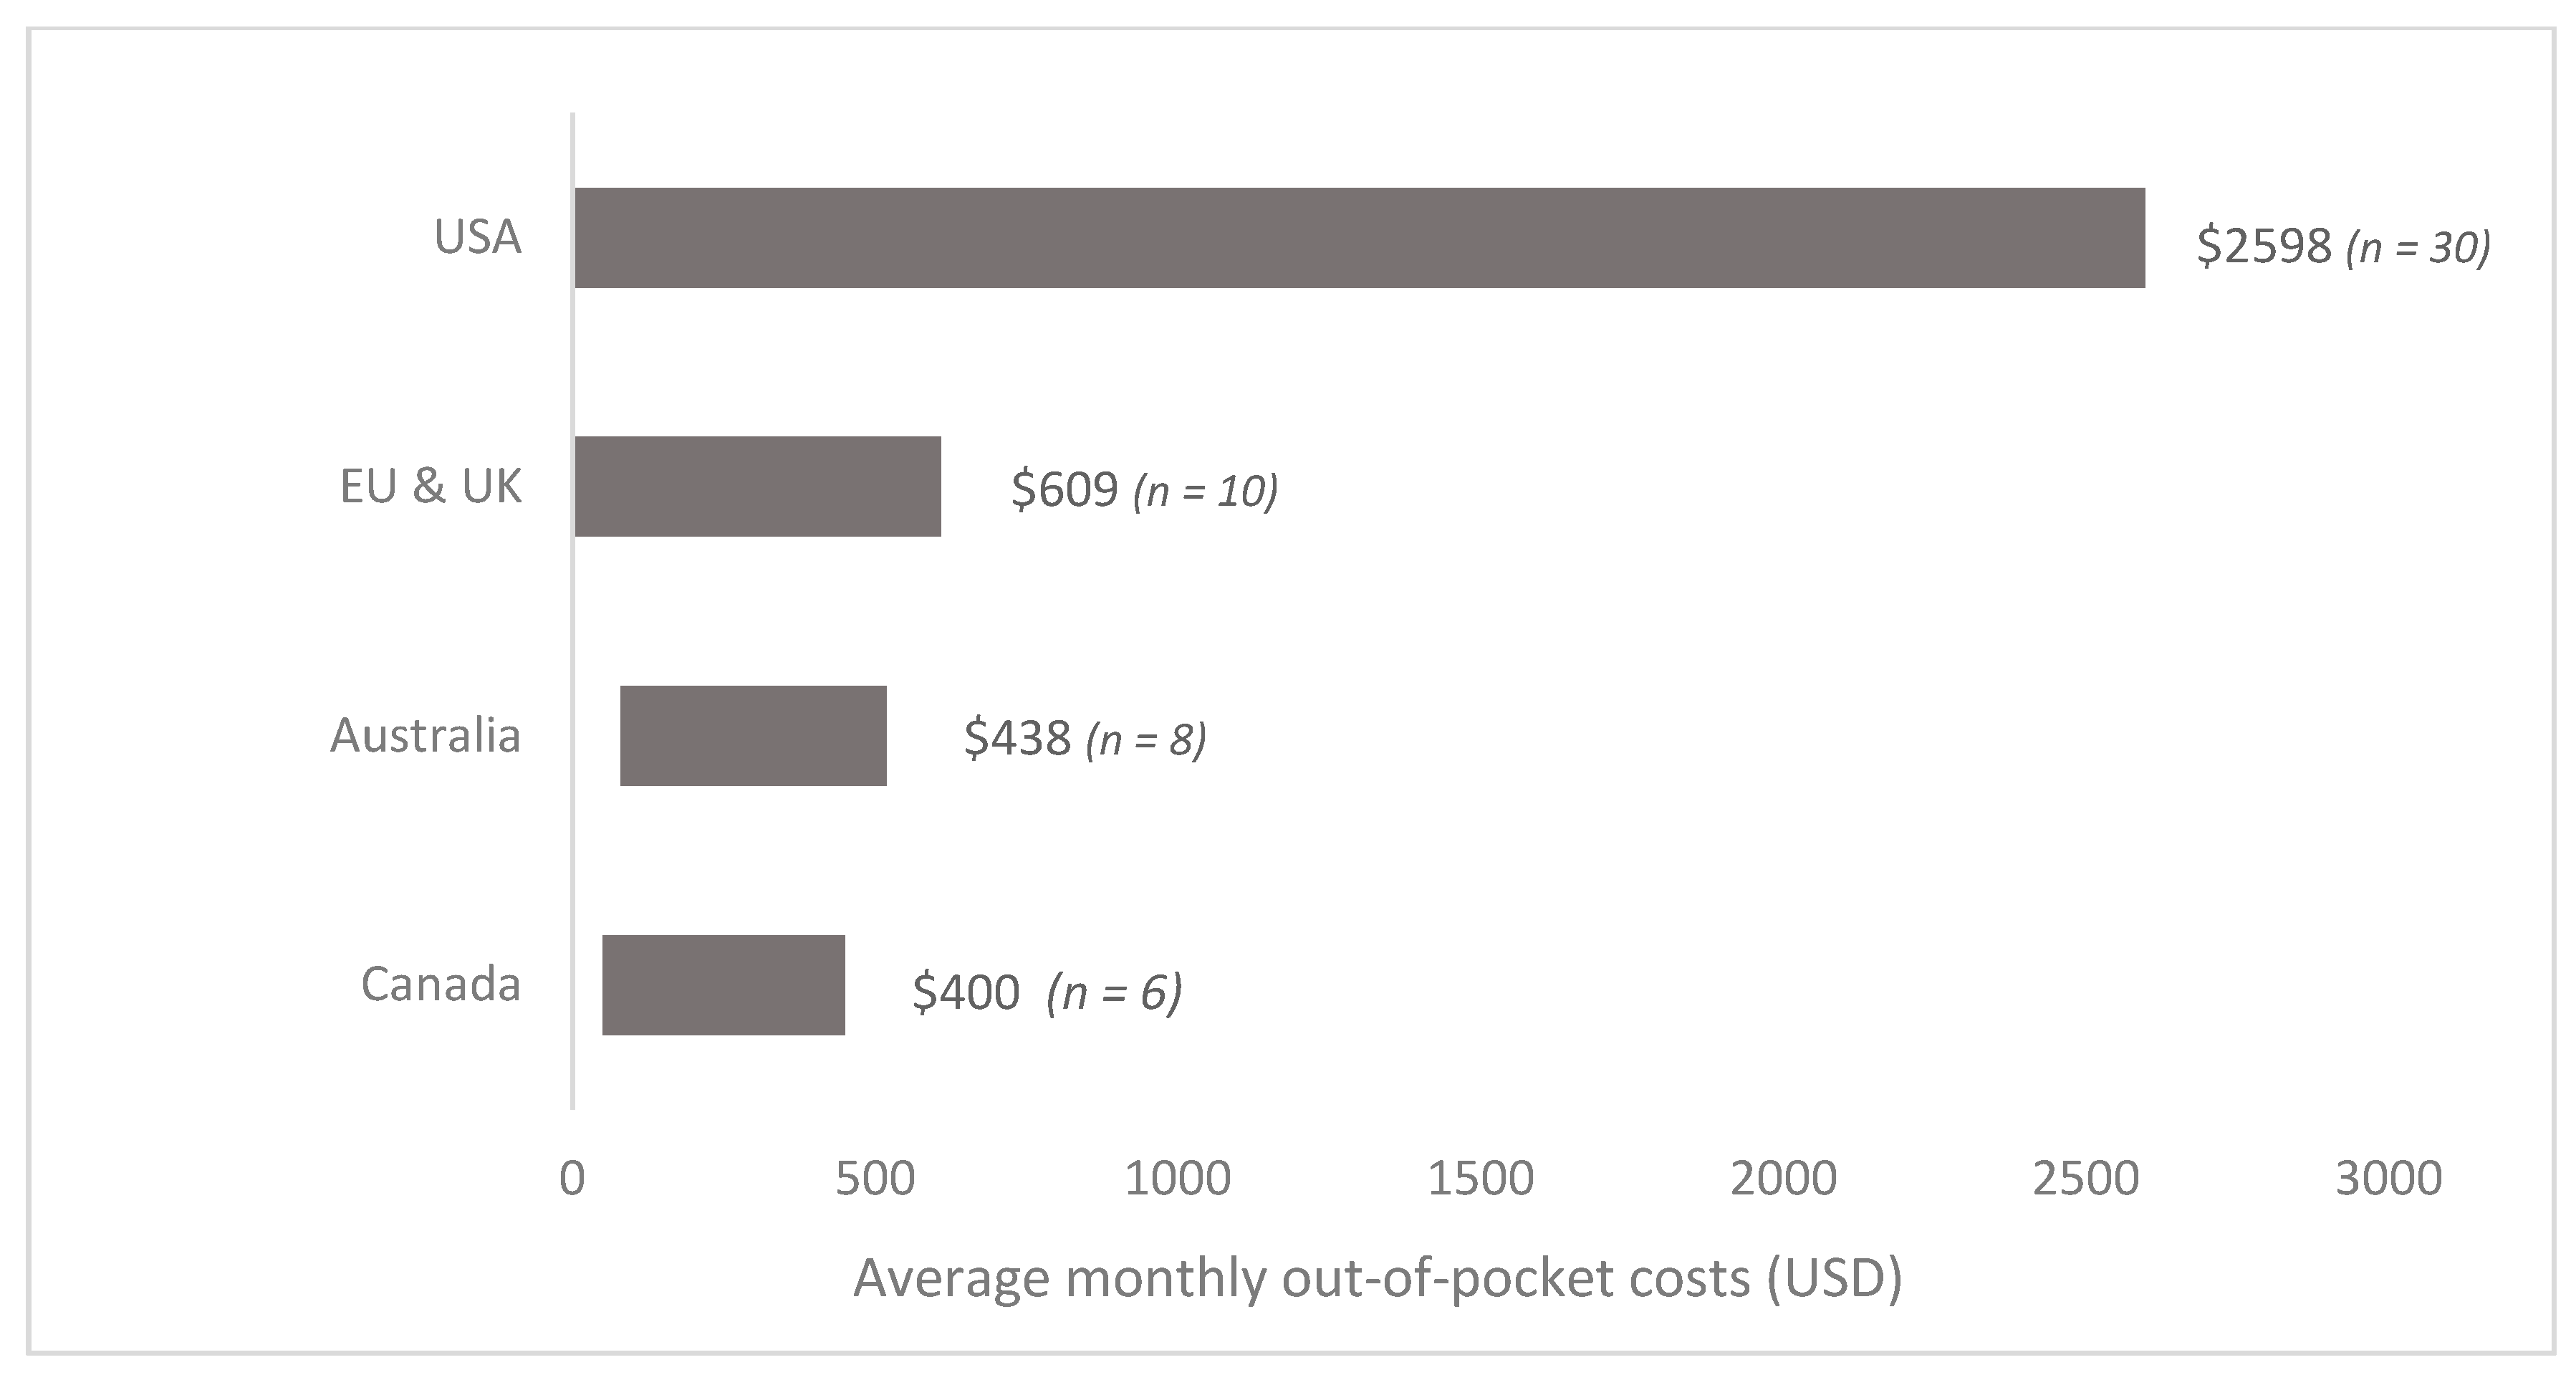
Table 2 and Supplementary 2 summarize the individual out-of-pocket estimates across the 105 identified studies. Sixty-four estimates were reported and converted to mean out-of-pocket monthly costs per patient (2018 USD) for comparison through stratified analyses. Figure 2 summarizes the range of out-of-pocket costs estimated across countries for all cancer populations. Estimates for all cancers were lumped by country as there were not enough studies to present the findings by cancer site. The out-of-pocket cost for all adult cancer patients in the U.S ranged from USD 180 to USD 2598 per patient per month (around USD 300 per patient per month on average). Estimates for Western Europe (Germany, France, Ireland, Italy, and the UK) ranged between USD 4 and USD 609 per patient per month (average of USD 200 per patent per month). In Canada, costs ranged between USD 15 to USD 400 per patient per month (average of USD 187 per patient per month). Finally, the average out-of-pocket cost in Australia ranged between USD 58 and USD 438 per patient per month (average of USD 70). There was not enough information to estimate a range of costs (measured in 2018 USD) among studies conducted in other HICs (e.g., Japan), or in LMICs (Mexico, India, China, Vietnam, Thailand, etc.). Figure 3 summarizes the mean out-of-pocket cost for different expenditure categories among HICs (U.S., Germany, France, Italy, UK, Ireland, Canada and Australia). Furthermore, given the small number of studies by country, estimates were stratified by type of health-care system; that is, costs were reported separately for the U.S. and countries with universal healthcare coverage (Australia, Canada, and Western Europe) (unfortunately, estimates could not be presented by cancer site within country). In terms of non-reimbursable medical costs, the category that represented the highest out-of-pocket burden for the U.S. was medications, with an average monthly out-of-pocket cost per person of USD 288 (n = 15), compared with USD 40 (n = 13) in Canada, Australia, and Western Europe (combined). This was followed by expenditures in medical consultations (USD 72, n = 13), which was almost twice as high relative to countries with universal healthcare coverage (USD 39, n = 8). Finally, spending related to in-hospital care was similar between the two groups (~USD 60 and USD 70). Results were also estimated for non-medical expenditure categories. The out-of-pocket costs spent on travel/transportation and supportive care provided by caregivers were higher in countries with universal healthcare coverage compared with the U.S. (USD 205 vs. USD 66 and USD 189 vs. USD 152, respectively). Individual cost estimates per category were summarized and are presented in Supplementary 3.
Although most studies estimated costs across different categories, some focused on specific types of out-of-pocket costs. Several studies estimated medication costs only and exclusively followed patients throughout the cancer treatment pathway. These studies estimated the deductibles or co-payments associated with specific cancer medications (e.g., imatinib, bevacizumab) [86,100]. On the other hand, other studies focused on travel costs for outpatient treatment, which included non-medical fees associated with parking, lodging, accommodation, and public transportation [33,42,67,77,106]. Finally, a few studies identified other types of out-of-pocket costs such as medical devices, food, hair accessories, laboratory tests, and clothing [19,89,93,115]. However, insufficient data was provided to estimate a weighted mean for these categories.
The distribution of the identified patient populations across cancer sites was as follows: most studies (n = 33, 31%) evaluated all adult, followed by breast (n = 18, 17%), leukemia (n = 11, 10%), all pediatric (n = 8, 7%), colorectal (n = 6, 5%), lung (n = 5, 5%), head and neck (n = 4, 4%), prostate (n = 4, 4%), ovarian (n = 3, 3%), pancreatic (n = 2, 2%), anal (n = 1, 1%), and brain cancers (n = 1, 1%). Figure 4 and Figure 5 summarize the estimated costs across cancer sites.). Mean weighted costs were estimated and combined for all HICs (U.S., Canada, Australia, Italy, France, Germany, UK, Japan) (Figure 4) and estimated for the U.S. (Figure 5) across cancer sites due to lack of data; moreover, there was not enough data from LMICs. Breast and prostate cancer patients faced similar out-of-pocket costs at around USD 200 per patient per month. On the other hand, the mean costs were slightly higher for hematological and colorectal cancers, estimated at around USD 400 per month per patient. The highest average out-of-pocket cost was estimated among pediatric populations and their caregivers, at an estimated USD 800 per month. This represents a four-fold difference compared with breast and prostate cancers, and a two-fold difference compared with colorectal and hematological cancers.
We reported and estimated the total out-of-pocket costs as a proportion of the annual income in 33 studies (Table 2). Figure 6 summarizes these estimates per study and country income-level and presents a weighted average for HICs (U.S., Canada, Australia) and LMICs (China, Malaysia, India, Haiti, Brunei, Thailand, Indonesia, Philippines, Vietnam, Laos, Cambodia, Myanmar). Cancer patients and caregivers in HICs spent, on average, 16% of their annual income on out-of-pocket expenses related to cancer care, compared with 42% among LMICs. Most studies conducted in LMICs reported a mean estimate above 30%, and although most studies conducted in HICs were distributed in the lower end, 40% reported an annual expenditure of over 20% of the annual income. A study conducted in Canada among breast cancer patients estimated the lowest proportion of income spent as out-of-pocket costs at 2.3% [90]. At the other extreme, a study of pediatric cancer patients in India estimated that caregivers incurred considerable debt and spent over 175% of their annual income as medical and non-medical out-of-pocket costs [59]. However, this study had a small sample size and contributed relatively little to the estimated 42% weighted average income spent as out-of-pocket expenses in LMICs. Additionally, four studies defined explicit thresholds for catastrophic health expenditure [27,68,69,101]. They defined a threshold of annual income spent as out-of-pocket expenditures and estimated the proportion of patients exceeding it. In two studies, CHE was defined as 30% of the annual household income spent as non-reimbursed out-of-pocket costs in two studies conducted in different LMICs of South East Asia among an all cancer population [68,69]. This threshold was also defined at 40% in Haiti among breast cancer patients [101] and 10% in India among patients with pancreatic cancer [27]. The proportion of patients incurring CHE, however defined, ranged between 31% and 67%.
Equity considerations and distributional effects were explicitly evaluated by a third of the included studies (n = 32). Three studies evaluated the out-of-pocket costs among different age groups; young adults and patients over 60 years of age faced comparatively higher out-of-pocket expenses [64,102,119]. On the other hand, two Australian studies and a study conducted in the U.S. estimated higher out-of-pocket costs among ethnic minorities and lower access to cancer care among indigenous populations [28,36,79]. Furthermore, four studies estimated additional out-of-pocket costs among patients living in rural and remote areas mostly due to increased expenses related to travel and transportation [44,51,65,109]. In settings with private insurance schemes, like in the U.S., patients with limited insurance packages paid higher deductibles and co-payments, especially for treatment and medications [27,41,48,60,73,97,98,104]. Finally, lower-income patients and households had a greater burden imposed by out-of-pocket expenses, as measured by the proportion of the household income spent in the form of out-of-pocket costs [31,34,47,68,69,74,86,87,90,92,108,116].
Quality Assessment
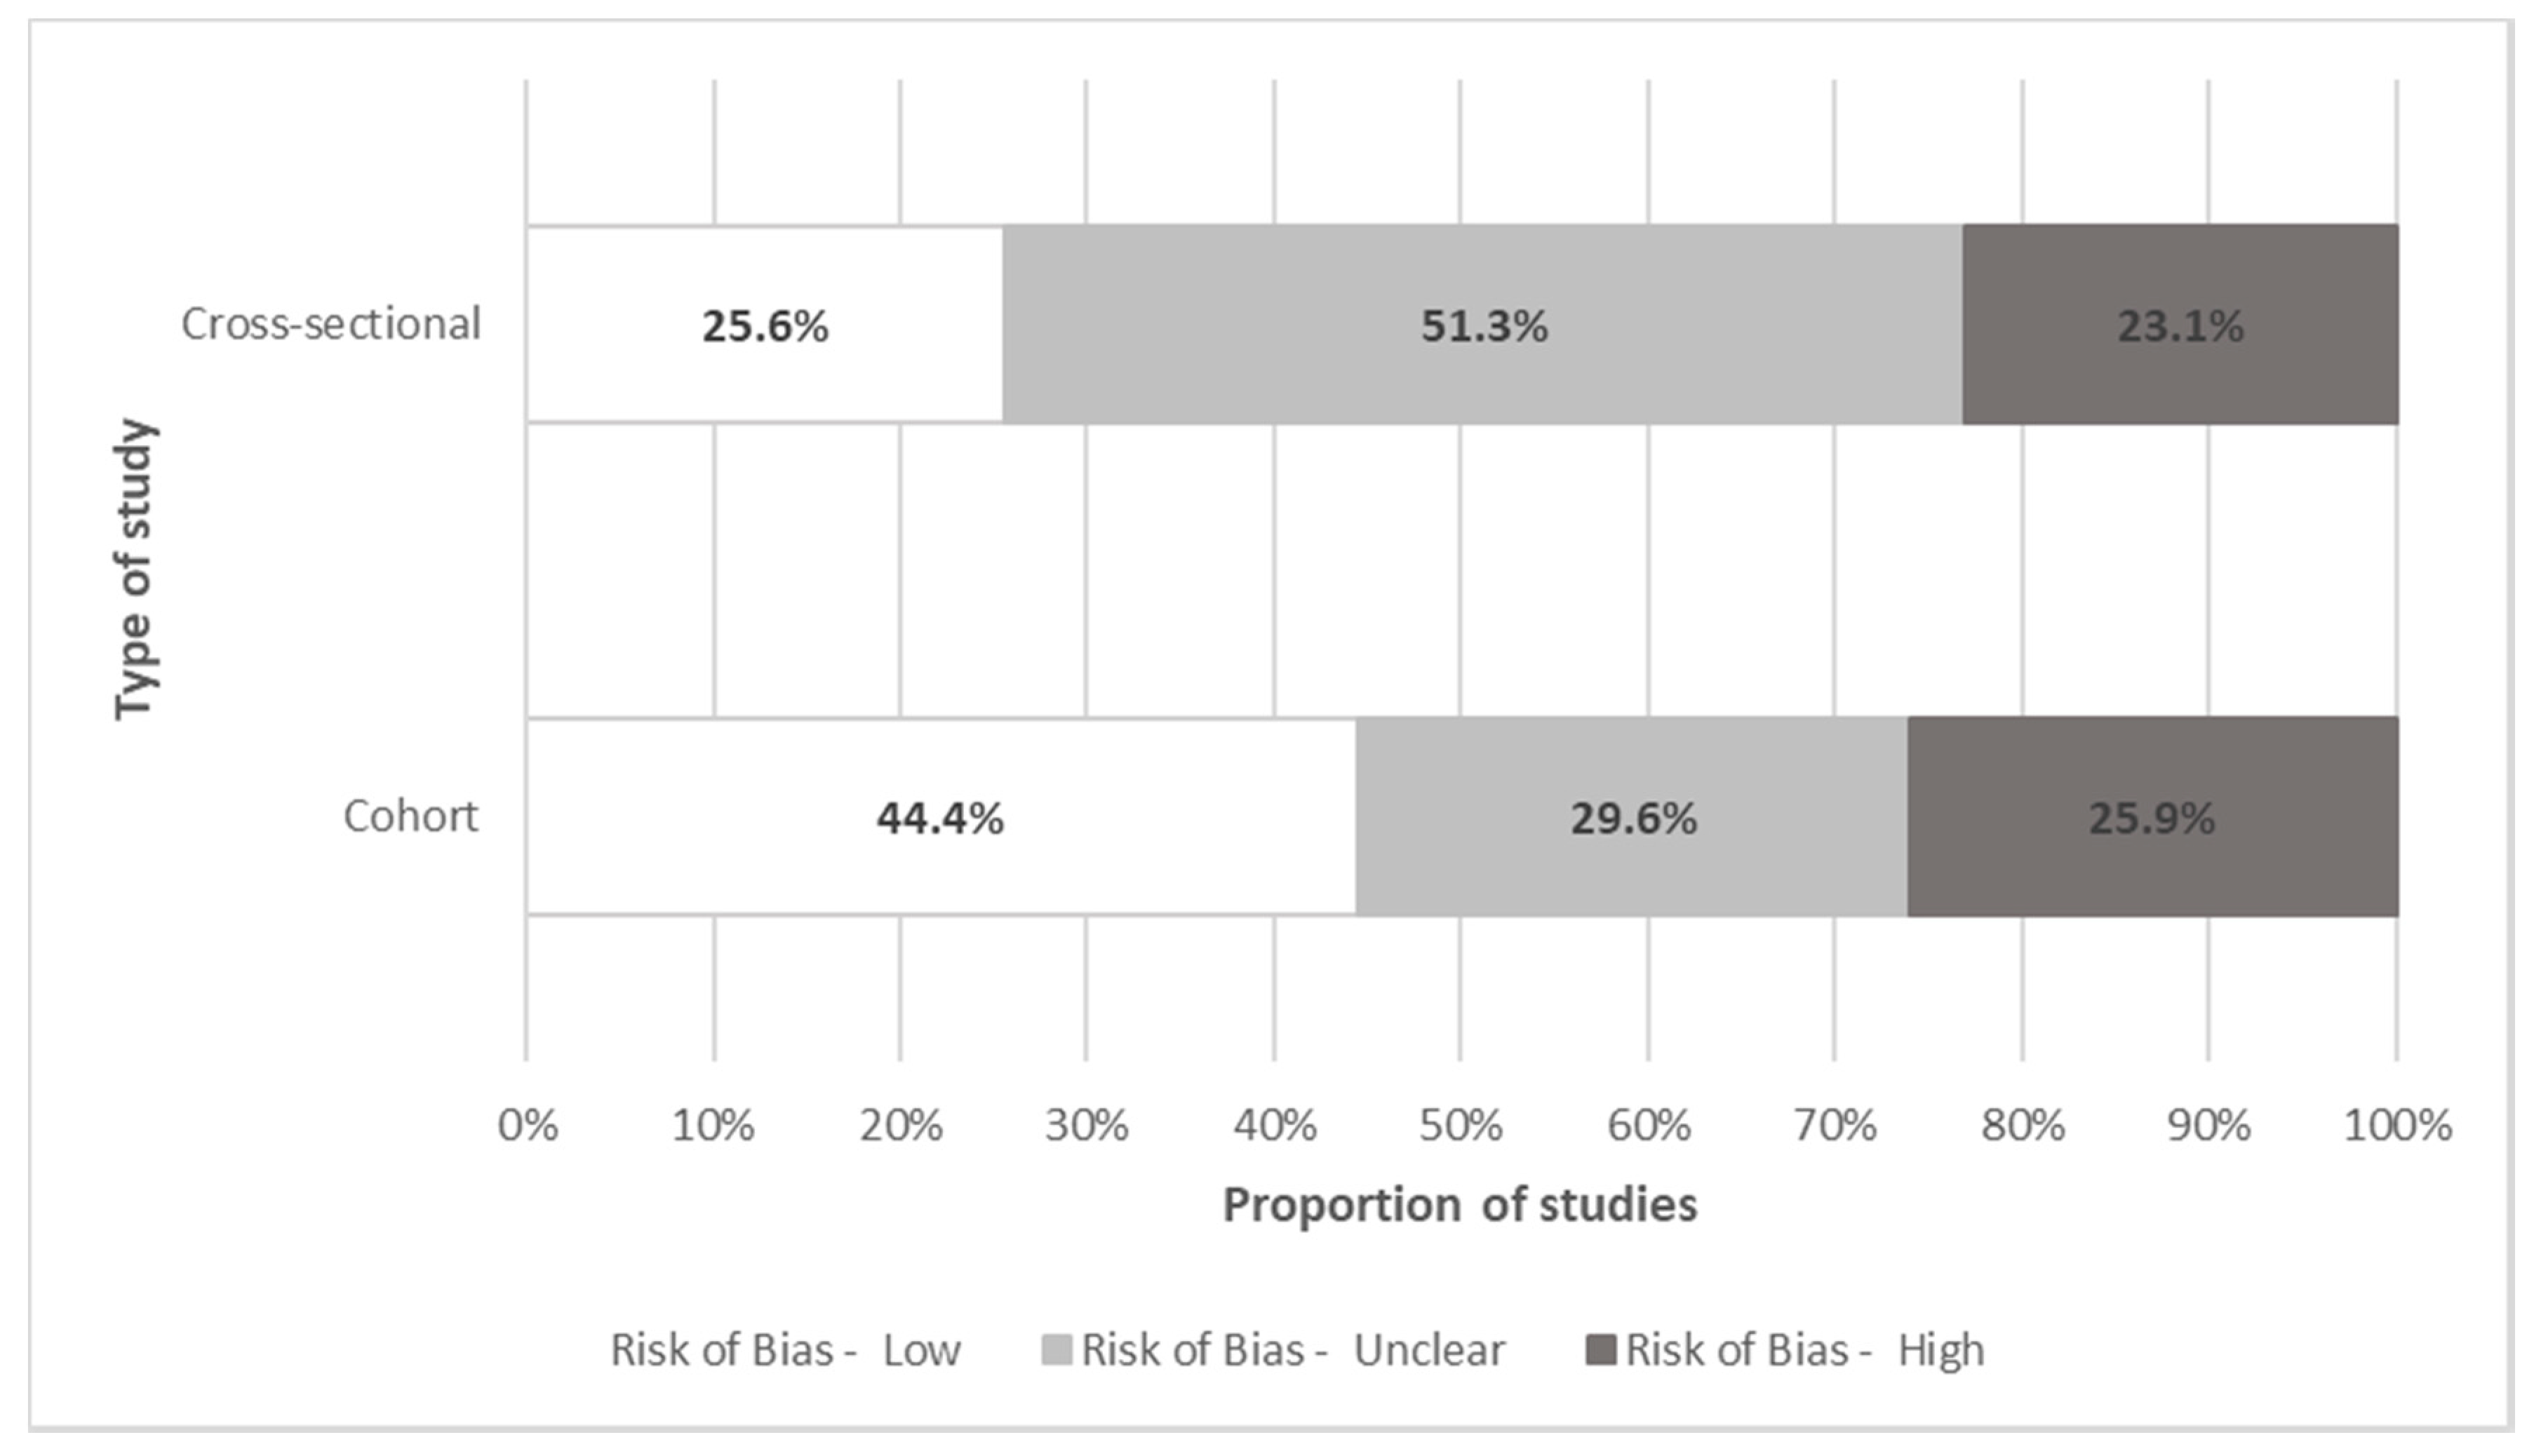
Risk of bias was assessed and summarized separately for cohort and cross-sectional studies (Figure 7). Forty-four percent of prospective cohort studies had a low risk of bias. Studies with unclear and high risk of bias mainly depended on self-reported out-of-pocket costs that patients recorded in their cost diaries but lacked verification (e.g., bills or receipts). Furthermore, cohort studies with unclear and high risk-of-bias usually failed to include a non-exposed cohort or failed to account for important confounders such as the type of insurance and income level across patients and households. On the other hand, 25% of cross-sectional studies had a low risk of bias. Most studies with unclear or high risk of bias failed to explicitly include a representative or random sample, or to account for important risk factors, effect modifiers or confounders.
4. Discussion
To the authors’ knowledge, this is the first systematic review to summarize and synthesize the existing literature on the out-of-pocket burden faced by patients diagnosed with cancer and their caregivers. This review found cancer patients pay substantial out-of-pocket costs per month, most of which is spent on cancer medications, followed by caregiver expenses, and transport and travel expenses. Expenditures were highest among pediatric patients and their caregivers. Furthermore, the out-of-pocket cost burden was comparatively higher in LMIC countries, and among underserved populations, such as ethnic minorities, populations living in rural and remote areas, and low-income patients and caregivers. This trend was seen across various studies conducted in different countries. An important finding was that patients incurred substantial out-of-pocket expenses (especially non-medical costs) in countries with systems that provide universal healthcare coverage, such as Canada, France, the UK, and Australia.
The burden of paying out-of-pocket for medical care is a consequence of the varying degrees of comprehensiveness of public financing of cancer care in each setting. As an example, studies from countries that lack national insurance programs to cover essential medicines for the whole population (e.g., U.S.), usually reported high medication costs. This is further complicated by increasing costs of newer cancer-related medications that are usually covered by private insurance with considerable copayments [123]. However, although rising medication costs and their burden to the health care system remain an issue, this review focused primarily on costs incurred by patients/households. Patients also incurred substantial costs related to clinical consultations and in-hospital care (e.g., surgery) in HICs. In the U.S., these costs were likely an underestimate as the largest studies employed administrative datasets that included patients and caregivers with public and some private insurance. On the other hand, countries with universal healthcare coverage registered similar levels of expenditure for these categories, even though most of these procedures are considered medically necessary and are usually publicly funded.
Paying out-of-pocket for essential cancer-related medicines and medical care results in high and potentially, catastrophic, levels of expenditure for cancer patients and their households. This can lead to cancer care becoming unaffordable in settings where there is sub-optimal health insurance coverage as patients and families are responsible for carrying a large portion of the cost burden of care. This poses a financial barrier to accessing cancer care that can impact on whether patients can adhere to their treatment plans. In other cases, patients opt for sub-standard care (e.g., cheaper and less effective IV therapies instead of expensive oral medications) due to the associated high deductibles and copayments [123]. Copayments have an impact on health service utilization rates as patients are often not well-positioned to distinguish between care that is necessary and care that might otherwise be defined as unnecessary. Reductions in unnecessary care are often overshadowed by reductions in overall health service use as well as changes in provider behaviour that are responsive to the patient-related reductions in utilization due to price; both of which can impact on health outcomes [124,125]. This review reinforces the importance of ensuring that essential cancer treatments are included in all healthcare benefit packages that are being developed to support achieving universal healthcare coverage, including in countries that are further along in the development and implementation of national health insurance programs.
This review also identified substantial expenditures for transport/travel (usually reported together in the studies) and caregiving, which are important for enabling access to and use of cancer treatment. However, support for these types of non-medical out-of-pocket costs tends to be inconsistent and varied [65,76,93,109]; as a result, we found non-medical costs were a key component of the overall out-of-pocket cost burden faced by patients across all studies in this review. Furthermore, non-medical costs may be under-reported, considering that most studies were conducted using employer-based administrative datasets that usually fail to capture this dimension. As such, health financing policies should be supplemented with a strengthening of social support programs to better recognize and address the significant burden associated with non-medical out-of-pocket costs. There may be opportunities to indirectly address the burden associated with some of the non-medical out-of-pocket costs as new models of community-based cancer care are developed and implemented. For example, the integration of virtual care and telemedicine into routine care could help ease the burden associated with travel and transport costs and potentially decrease some of the caregiver time and support required [126]. Similarly, interventions that integrate palliative and end-of-life care in the home [127] also have the potential to reduce caregiver and travel-related costs (e.g., lodging, food, fuel, etc.). In making future decisions about new models of cancer control, decision-makers should consider information on the full spectrum of costs and benefits associated with these programs, including their potential to mitigate the burden posed by out-of-pocket costs.
The economic burden associated with cancer due to out-of-pocket spending has been more recently described as financial toxicity because of the impact that it has on the economic circumstances of households [128]. Previous systematic reviews found that financial toxicity was common among cancer survivors, partly due to the high out-of-pocket costs associated with their cancer care. However, these studies highlighted a lack of information regarding at-risk populations and intervention targets that would allow developing interventions capable of mitigating financial toxicity among cancer patients and their caregivers [129,130]. As such, this review confirms some populations are consistently more at risk of facing financial toxicity associated with cancer. Pediatric patients and their caregivers experienced considerably higher out-of-pocket costs mainly due to relatively longer and more resource-intensive treatment and costly survivorship care [131]. In particular, LMICs in general, and lower-income households (in both LMICs and HICs) were more heavily burdened and experienced financial toxicity more frequently. For example, low-income households with pediatric cancer patients in India paid more than twice their monthly earnings to cover the associated out-of-pocket expenses, thus incurring considerable debt [59]. This trend was also observed among patients who were unemployed and those who lacked or did not have private health insurance [27,41,48,60,73,97,98,104]. Some ethnic minorities and Indigenous communities, who often reside in rural and remote areas, experienced higher levels of out-of-pocket costs in Australia—other communities reported no costs due to a reduced, and almost non-existent access to health care [28,36]. These risk factors are not independent; most vulnerable populations often face multiple barriers to healthcare and an increasingly larger out-of-pocket burden. These are pressure points that healthcare and social care systems should seek to address to minimize the burden for patients and their caregivers, in particular those sub-groups who are most at risk of falling through the cracks [132].
This review makes an important contribution to the literature by estimating the magnitude and distribution of non-reimbursed costs that specific cancer populations face in different contexts; nonetheless, there are a few limitations. Our literature search focused on studies retrieved from only four databases; nonetheless, and based on prior reviews, these are the most relevant databases given the topic [129,133]. We reported and extracted an average cost across all included studies; however, the cancer populations examined and cost definitions were heterogeneous. Furthermore, not enough information was available to pool costs across countries and cancer types, or to estimate total out-of-pocket costs per treatment. Therefore, an overall estimate might not appropriately describe the distribution of out-of-pocket costs in all settings. Consequently, we estimated an average cost across spending categories, cancer sites, and different countries, to better understand how these costs were distributed among different populations and country income levels. Although a distinction between costs borne by cancer patients and their caregivers was of interest, it was not possible to explore this due to lack of individual category estimates. However, the ‘caregiver cost’ category provided an estimate of how much was spent on supportive care, daycare for pediatric patients, and other formal and informal care provided by caregivers. Furthermore, this review likely provides an underestimate of the out-of-pocket cost burden for cancer patients and their caregivers; many studies focused on single cost categories (e.g., medications), instead of evaluating multiple types of non-reimbursable expenditures. The review was also limited by the lack of evidence from LMICs. Most studies did not include enough information to allow estimating a weighted average. Additionally, presenting country-specific out-of-pocket costs stratified by cancer site and expenditure categories would have allowed for a direct comparison of more heterogeneous populations. However, in most cases, the sample size was only large enough to do so for the U.S. Finally, only one-third of the studies provided enough information to estimate the out-of-pocket cost burden. Absolute measures (i.e., total out-of-pocket cost) provide information regarding how much patients and caregivers are spending on cancer care but fail to account for the burden of this expenditure on the household’s resources. On the other hand, a relative measure such as the proportion of income spent on out-of-pocket medical costs allows an understanding of how a household might be burdened by these expenses;, e.g., a higher proportion is usually associated with financial debt and a reduction of spending on food, rent, clothes, and education [68,69,98]. Studies should seek to employ a consistent approach to measure the out-of-pocket burden as an absolute and a relative measure to allow for comparisons across heterogeneous jurisdictions and populations. Moreover, although the existing literature mostly focuses on the indirect and out-of-pocket burden of cancer, further studies should evaluate the relationships between out-of-pocket costs and the psychosocial burden of cancer. Studies have found that patients and caregivers who incur catastrophic health expenditures can experience financial strain and distress, which can contribute to the psychosocial burden [134,135]. Consequently, out-of-pocket costs not only pose a burden in terms of costs and potential nonadherence to treatment but might also affect patients’ quality of life. To fully understand this inter-relationship and the extent to which out-of-pocket costs contribute to the overall burden of cancer, the relationship between its components must be described.
This review supplements the growing body of literature on the economic burden of cancer for patients and their caregivers. It builds on this work by providing estimates of the out-of-pocket costs associated with cancer care and explores whether there is consistency in this burden across cancer populations and settings. The results of this study are an important input for advancing the agenda of addressing financial toxicity [128] as it provides estimates of how much patients pay for their cancer care while highlighting pressure points in the overall financing of cancer treatment across settings. Furthermore, this review confirms that patients are still key funders of cancer treatment in many countries, including in systems with universal healthcare coverage, despite varying abilities to afford these costs. The results also suggest the need for comprehensive out-of-pocket costing data for different cancer sites, and patient and caregiver populations across the cancer care continuum to inform planning and decision making. This review will help support planning and decision-making discussions, which should ensure that the economic burden on patients and families is accounted for when setting priorities to sustain the cancer care system.
Supplementary Materials
The following are available online at https://0-www-mdpi-com.brum.beds.ac.uk/1718-7729/28/2/117/s1, Supplementary 1: Search strategies, Supplementary 2: Total cost conversion and estimation, Supplementary 3: Cost conversion and estimation across categories, Supplementary 4: Preferred reporting items for systematic reviews and meta-analyses (PRISMA) checklist.
Author Contributions
All authors made substantial contributions to the conception, design of the work; data acquisition, analysis synthesis, interpretation of data; and drafting of the manuscript. All authors have read and agreed to the published version of the manuscript.
Funding
This research received no external funding.
Institutional Review Board Statement
Not applicable.
Informed Consent Statement
Not applicable.
Data Availability Statement
Not applicable.
Conflicts of Interest
The authors declare no conflict of interest.
References
- Bray, F.; Jemal, A.; Grey, N.; Ferlay, J.; Forman, D. Global cancer transitions according to the Human Development Index (2008–2030): A population-based study. Lancet Oncol. 2012, 13, 790–801. [Google Scholar] [CrossRef]
- Richard, P.; Walker, R.; Alexandre, P. The burden of out of pocket costs and medical debt faced by households with chronic health conditions in the United States. PLoS ONE 2018, 13, e0199598. [Google Scholar] [CrossRef] [Green Version]
- Landwehr, M.S.; Watson, S.E.; Macpherson, C.F.; Novak, K.A.; Johnson, R.H. The cost of cancer: A retrospective analysis of the financial impact of cancer on young adults. Cancer Med. 2016, 5, 863–870. [Google Scholar] [CrossRef] [Green Version]
- Cancer-Fact Sheets. Available online: https://www.who.int/news-room/fact-sheets/detail/cancer (accessed on 22 August 2019).
- Pisu, M.; Azuero, A.; McNees, P.; Burkhardt, J.; Benz, R.; Meneses, K. The out of pocket cost of breast cancer survivors: A review. J. Cancer Surviv. 2010, 4, 202–209. [Google Scholar] [CrossRef] [PubMed] [Green Version]
- de Oliveira, C.; Weir, S.; Rangrej, J.; Krahn, M.D.; Mittmann, N.; Hoch, J.S.; Chan, K.K.W.; Peacock, S. The economic burden of cancer care in Canada: A population-based cost study. CMAJ Open 2018, 6, E1–E10. [Google Scholar] [CrossRef] [Green Version]
- Luengo-Fernandez, R.; Leal, J.; Gray, A.; Sullivan, R. Economic burden of cancer across the European Union: A population-based cost analysis. Lancet Oncol. 2013, 14, 1165–1174. [Google Scholar] [CrossRef]
- Bekelman, J.E.; Sylwestrzak, G.; Barron, J.; Liu, J.; Epstein, A.J.; Freedman, G.; Malin, J.; Emanuel, E.J. Uptake and costs of hypofractionated vs conventional whole breast irradiation after breast conserving surgery in the United States, 2008–2013. JAMA 2014, 312, 2542–2550. [Google Scholar] [CrossRef]
- Longo, C.J.; Fitch, M.; Deber, R.B.; Williams, A.P. Financial and family burden associated with cancer treatment in Ontario, Canada. Support. Care Cancer 2006, 14, 1077–1085. [Google Scholar] [CrossRef] [PubMed]
- Sullivan, R.; Peppercorn, J.; Sikora, K.; Zalcberg, J.; Meropol, N.J.; Amir, E.; Khayat, D.; Boyle, P.; Autier, P.; Tannock, I.F.; et al. Delivering affordable cancer care in high-income countries. Lancet Oncol. 2011, 12, 933–980. [Google Scholar] [CrossRef]
- Prager, G.W.; Braga, S.; Bystricky, B.; Qvortrup, C.; Criscitiello, C.; Esin, E.; Sonke, G.S.; Martinez, G.A.; Frenel, J.S.; Karamouzis, M.; et al. Global cancer control: Responding to the growing burden, rising costs and inequalities in access. ESMO Open 2018, 3, e000285. [Google Scholar] [CrossRef] [Green Version]
- Moher, D.; Liberati, A.; Tetzlaff, J.; Altman, D.G.; Group, P. Preferred reporting items for systematic reviews and meta-analyses: The PRISMA statement. PLoS Med. 2009, 6, e1000097. [Google Scholar] [CrossRef] [Green Version]
- Viera, A.J.; Garrett, J.M. Understanding interobserver agreement: The kappa statistic. Fam. Med. 2005, 37, 360–363. [Google Scholar] [PubMed]
- Higgins, J.P.T.; Green, S. Obtaining standard deviations from standard errors and confidence intervals for group means. In Cochrane Handbook for Systematic Reviews of Interventions; The Cochrane Collaboration: Chichester, UK, 2011. [Google Scholar]
- Hozo, S.P.; Djulbegovic, B.; Hozo, I. Estimating the mean and variance from the median, range, and the size of a sample. BMC Med. Res. Methodol. 2005, 5, 13. [Google Scholar] [CrossRef] [PubMed] [Green Version]
- World Bank. Global Economic Monitor; DataBank: Geneva, Switzerland, 2019. [Google Scholar]
- World Bank. World Bank Country and Lending Groups-Country Classification; DataBank: Geneva, Switzerland, 2020. [Google Scholar]
- Wells, G.; Shea, B.; O’Connell, D.; Peterson, J.; Welch, V.; Losos, M.; Tugwell, P. The Newcastle-Ottawa Scale (NOS) for Assessing the Quality of Nonrandomised Studies in Meta-Analyses; The Hospital of Ottawa: Ottawa, ON, Canada, 2019. [Google Scholar]
- Ceilleachair, A.O.; Hanly, P.; Skally, M.; O’Leary, E.; O’Neill, C.; Fitzpatrick, P.; Kapur, K.; Staines, A.; Sharp, L. Counting the cost of cancer: Out-of-pocket payments made by colorectal cancer survivors. Support. Care Cancer 2017, 25, 2733–2741. [Google Scholar] [CrossRef] [PubMed]
- Ahuja, S.; Tsimicalis, A.; Lederman, S.; Bagai, P.; Martiniuk, A.; Srinivas, S.; Arora, R.S. A pilot study to determine out-of-pocket expenditures by families of children being treated for cancer at public hospitals in New Delhi, India. Psychooncology 2019, 4, 4. [Google Scholar] [CrossRef]
- Alexander, L.C.; Erqi, L.P.; Yushen, Q.; Albert, C.K.; Daniel, T.C. Impact of Intensity-Modulated Radiotherapy on Health Care Costs of Patients With Anal Squamous Cell Carcinoma. J. Oncol. Pract. 2017, 13, 992–1001. [Google Scholar] [CrossRef]
- Andreas, S.; Chouaid, C.; Danson, S.; Siakpere, O.; Benjamin, L.; Ehness, R.; Dramard-Goasdoue, M.H.; Barth, J.; Hoffmann, H.; Potter, V.; et al. Economic burden of resected (stage IB-IIIA) non-small cell lung cancer in France, Germany and the United Kingdom: A retrospective observational study (LuCaBIS). Lung Cancer 2018, 124, 298–309. [Google Scholar] [CrossRef]
- Azzani, M.; Roslani, A.; Su, T.; Roslani, A.C.; Su, T.T. Financial burden of colorectal cancer treatment among patients and their families in a middle-income country. Support. Care Cancer 2016, 24, 4423–4432. [Google Scholar] [CrossRef]
- Baili, P.; Di Salvo, F.; de Lorenzo, F.; Maietta, F.; Pinto, C.; Rizzotto, V.; Vicentini, M.; Rossi, P.G.; Tumino, R.; Rollo, P.C.; et al. Out-of-pocket costs for cancer survivors between 5 and 10 years from diagnosis: An Italian population-based study. Support. Care Cancer 2016, 24, 2225–2233. [Google Scholar] [CrossRef]
- Bao, Y.; Maciejewski, R.C.; Garrido, M.M.; Shah, M.A.; Maciejewski, P.K.; Prigerson, H.G. Chemotherapy Use, End-of-Life Care, and Costs of Care Among Patients Diagnosed With Stage IV Pancreatic Cancer. J. Pain Symptom. Manag. 2018, 55, 1113–1121. [Google Scholar] [CrossRef] [Green Version]
- Bargallo-Rocha, J.E.; Soto-Perez-de-Celis, E.; Pico-Guzman, F.J.; Quintero-Rodriguez, C.E.; Almog, D.; Santiago-Concha, G.; Flores-Balcazar, C.H.; Corona, J.; Vazquez-Romo, R.; Villarreal-Garza, C.; et al. The impact of the use of intraoperative radiotherapy on costs, travel time and distance for women with breast cancer in the Mexico City Metropolitan Area. J. Surg. Oncol. 2017, 116, 683–689. [Google Scholar] [CrossRef] [PubMed]
- Basavaiah, G.; Rent, P.D.; Rent, E.G.; Sullivan, R.; Towne, M.; Bak, M.; Sirohi, B.; Goel, M.; Shrikhande, S.V. Financial Impact of Complex Cancer Surgery in India: A Study of Pancreatic Cancer. J. Glob. Oncol. 2018, 4, 1–9. [Google Scholar] [CrossRef]
- Bates, N.; Callander, E.; Lindsay, D.; Watt, K. CancerCostMod: A model of the healthcare expenditure, patient resource use, and patient co-payment costs for Australian cancer patients. Health Econ. Rev. 2018, 8, 28. [Google Scholar] [CrossRef]
- Bercow, A.S.; Chen, L.; Chatterjee, S.; Tergas, A.I.; Hou, J.Y.; Burke, W.M.; Ananth, C.V.; Neugut, A.I.; Hershman, D.L.; Wright, J.D. Cost of Care for the Initial Management of Ovarian Cancer. Obstet. Gynecol. 2017, 130, 1269–1275. [Google Scholar] [CrossRef] [PubMed]
- Bernard, D.S.; Farr, S.L.; Fang, Z.; Bernard, D.S.M.; Farr, S.L.; Fang, Z. National estimates of out-of-pocket health care expenditure burdens among nonelderly adults with cancer: 2001 to 2008. J. Clin. Oncol. 2011, 29, 2821–2826. [Google Scholar] [CrossRef]
- Bloom, B.S.; Knorr, R.S.; Evans, A.E. The epidemiology of disease expenses. The costs of caring for children with cancer. JAMA 1985, 253, 2393–2397. [Google Scholar] [CrossRef]
- Boyages, J.; Xu, Y.; Kalfa, S.; Koelmeyer, L.; Parkinson, B.; Mackie, H.; Viveros, H.; Gollan, P.; Taksa, L. Financial cost of lymphedema borne by women with breast cancer. Psychooncology 2017, 26, 849–855. [Google Scholar] [CrossRef] [PubMed]
- Burns, C.L.; Kularatna, S.; Ward, E.C.; Hill, A.J.; Byrnes, J.; Kenny, L.M. Cost analysis of a speech pathology synchronous telepractice service for patients with head and neck cancer. Head. Neck 2017, 39, 2470–2480. [Google Scholar] [CrossRef]
- Buttner, M.; Konig, H.H.; Lobner, M.; Briest, S.; Konnopka, A.; Dietz, A.; Riedel-Heller, S.; Singer, S. Out-of-pocket-payments and the financial burden of 502 cancer patients of working age in Germany: Results from a longitudinal study. Support. Care Cancer 2018, 12, 12. [Google Scholar] [CrossRef]
- Calhoun, E.A.; Chang, C.H.; Welshman, E.E.; Fishman, D.A.; Lurain, J.R.; Bennett, C.L. Evaluating the total costs of chemotherapy-induced toxicity: Results from a pilot study with ovarian cancer patients. Oncologist 2001, 6, 441–445. [Google Scholar] [CrossRef] [Green Version]
- Callander, E.; Bates, N.; Lindsay, D.; Larkins, S.; Topp, S.M.; Cunningham, J.; Sabesan, S.; Garvey, G. Long-term out of pocket expenditure of people with cancer: Comparing health service cost and use for indigenous and non-indigenous people with cancer in Australia. Int. J. Equity Health 2019, 18, 32. [Google Scholar] [CrossRef] [Green Version]
- Chan, S.; Bo, Z.; Lei, L.; Shih, Y.-C.T. Financial Burden for Patients With Chronic Myeloid Leukemia Enrolled in Medicare Part D Taking Targeted Oral Anticancer Medications. J. Oncol. Pract. 2017, 13, e152–e162. [Google Scholar] [CrossRef]
- Chang, S.; Long, S.R.; Kutikova, L.; Bowman, L.; Finley, D.; Crown, W.H.; Bennett, C.L. Estimating the cost of cancer: Results on the basis of claims data analyses for cancer patients diagnosed with seven types of cancer during 1999 to 2000. J. Clin. Oncol. 2004, 22, 3524–3530. [Google Scholar] [CrossRef]
- Chauhan, A.S.; Prinja, S.; Ghoshal, S.; Verma, R.; Oinam, A.S. Cost of treatment for head and neck cancer in India. PLoS ONE 2018, 13, e0191132. [Google Scholar] [CrossRef] [PubMed]
- Chin, A.L.; Bentley, J.P.; Pollom, E.L. The impact of state parity laws on copayments for and adherence to oral endocrine therapy for breast cancer. Cancer 2019, 125, 374–381. [Google Scholar] [CrossRef] [Green Version]
- Chino, F.; Peppercorn, J.M.; Rushing, C.; Nicolla, J.; Kamal, A.H.; Altomare, I.; Samsa, G.; Zafar, S.Y. Going for Broke: A Longitudinal Study of Patient-Reported Financial Sacrifice in Cancer Care. J. Oncol. Pract. 2018, 14, e533–e546. [Google Scholar] [CrossRef]
- Cohn, R.J.; Goodenough, B.; Foreman, T.; Suneson, J. Hidden financial costs in treatment for childhood cancer: An Australian study of lifestyle implications for families absorbing out-of-pocket expenses. J. Pediatr. Hematol. Oncol. 2003, 25, 854–863. [Google Scholar] [CrossRef] [PubMed]
- Colby, M.S.; Esposito, D.; Goldfarb, S.; Ball, D.E.; Herrera, V.; Conwell, L.J.; Garavaglia, S.B.; Meadows, E.S.; Marciniak, M.D. Medication discontinuation and reinitiation among Medicare part D beneficiaries taking costly medications. Am. J. Pharm. Benefits 2011, 3, e102–e110. [Google Scholar]
- Collins, D.C.; Coghlan, M.; Hennessy, B.T.; Grogan, L.; Morris, P.G.; Breathnach, O.S. The impact of outpatient systemic anti-cancer treatment on patient costs and work practices. Ir. J. Med. Sci. 2017, 186, 81–87. [Google Scholar] [CrossRef]
- Darkow, T.; Maclean, J.R.; Joyce, G.F.; Goldman, D.; Lakdawalla, D.N. Coverage and Use of Cancer Therapies in the Treatment of Chronic Myeloid Leukemia. Am. J. Manag. Care 2012, 18, S272–S278. [Google Scholar]
- Davidoff, A.J.; Erten, M.; Shaffer, T.; Shoemaker, J.S.; Zuckerman, I.H.; Pandya, N.; Tai, M.H.; Ke, X.; Stuart, B. Out-of-pocket health care expenditure burden for Medicare beneficiaries with cancer. Cancer 2013, 119, 1257–1265. [Google Scholar] [CrossRef]
- de Oliveira, C.; Bremner, K.E.; Ni, A.; Alibhai, S.M.; Laporte, A.; Krahn, M.D. Patient time and out-of-pocket costs for long-term prostate cancer survivors in Ontario, Canada. J. Cancer Surviv. 2014, 8, 9–20. [Google Scholar] [CrossRef]
- de Souza, J.A.; Kung, S.; O’Connor, J.; Yap, B.J. Determinants of Patient-Centered Financial Stress in Patients With Locally Advanced Head and Neck Cancer. J. Oncol. Pract. 2017, 13, e310–e318. [Google Scholar] [CrossRef] [Green Version]
- Dean, L.T.; Moss, S.L.; Ransome, Y.; Frasso-Jaramillo, L.; Zhang, Y.; Visvanathan, K.; Nicholas, L.H.; Schmitz, K.H. “It still affects our economic situation”: Long-term economic burden of breast cancer and lymphedema. Support. Care Cancer 2019, 27, 1697–1708. [Google Scholar] [CrossRef] [PubMed]
- Doshi, J.A.; Pengxiang, L.; Hairong, H.; Pettit, A.R.; Kumar, R.; Weiss, B.M.; Huntington, S.F. High Cost Sharing and Specialty Drug Initiation Under Medicare Part D: A Case Study in Patients With Newly Diagnosed Chronic Myeloid Leukemia. Am. J. Manag. Care 2016, 22, S78–S86. [Google Scholar] [PubMed]
- Dumont, S.; Jacobs, P.; Turcotte, V.; Turcotte, S.; Johnston, G. Palliative care costs in Canada: A descriptive comparison of studies of urban and rural patients near end of life. Palliat. Med. 2015, 29, 908–917. [Google Scholar] [CrossRef] [PubMed]
- Dusetzina, S.B.; Huskamp, H.A.; Winn, A.N.; Basch, E.; Keating, N.L. Out-of-Pocket and Health Care Spending Changes for Patients Using Orally Administered Anticancer Therapy After Adoption of State Parity Laws. JAMA Oncol. 2018, 4, e173598. [Google Scholar] [CrossRef] [PubMed]
- Dusetzina, S.B.; Keating, N.L. Mind the Gap: Why Closing the Doughnut Hole Is Insufficient for Increasing Medicare Beneficiary Access to Oral Chemotherapy. J. Clin. Oncol. 2016, 34, 375–380. [Google Scholar] [CrossRef] [PubMed] [Green Version]
- Dusetzina, S.B.; Winn, A.N.; Abel, G.A.; Huskamp, H.A.; Keating, N.L. Cost sharing and adherence to tyrosine kinase inhibitors for patients with chronic myeloid leukemia. J. Clin. Oncol. 2014, 32, 306–311. [Google Scholar] [CrossRef] [Green Version]
- Ezeife, D.A.; Morganstein, B.J.; Lau, S.; Law, J.H.; Le, L.W.; Bredle, J.; Cella, D.; Doherty, M.K.; Bradbury, P.; Liu, G.; et al. Financial Burden Among Patients With Lung Cancer in a Publically Funded Health Care System. Clin. Lung Cancer 2018, 22, 22. [Google Scholar] [CrossRef] [PubMed]
- Farias, A.J.; Hansen, R.N.; Zeliadt, S.B.; Ornelas, I.J.; Li, C.I.; Thompson, B. The Association Between Out-of-Pocket Costs and Adherence to Adjuvant Endocrine Therapy Among Newly Diagnosed Breast Cancer Patients. Am. J. Clin. Oncol. 2018, 41, 708–715. [Google Scholar] [CrossRef] [PubMed]
- Finkelstein, E.A.; Tangka, F.K.; Trogdon, J.G.; Sabatino, S.A.; Richardson, L.C. The personal financial burden of cancer for the working-aged population. Am. J. Manag. Care 2009, 15, 801–806. [Google Scholar]
- Geynisman, D.M.; Meeker, C.R.; Doyle, J.L.; Handorf, E.A.; Bilusic, M.; Plimack, E.R.; Wong, Y.N. Provider and patient burdens of obtaining oral anticancer medications. Am. J. Manag. Care 2018, 24, e128–e133. [Google Scholar] [PubMed]
- Ghatak, N.; Trehan, A.; Bansal, D. Financial burden of therapy in families with a child with acute lymphoblastic leukemia: Report from north India. Support. Care Cancer 2016, 24, 103–108. [Google Scholar] [CrossRef] [PubMed]
- Giordano, S.H.; Niu, J.; Chavez-MacGregor, M.; Zhao, H.; Zorzi, D.; Shih, Y.C.T.; Smith, B.D.; Shen, C. Estimating regimen-specific costs of chemotherapy for breast cancer: Observational cohort study. Cancer 2016, 122, 3447–3455. [Google Scholar] [CrossRef] [PubMed] [Green Version]
- Goodwin, J.A.; Coleman, E.A.; Sullivan, E.; Easley, R.; McNatt, P.K.; Chowdhury, N.; Stewart, C.B. Personal Financial Effects of Multiple Myeloma and Its Treatment. Cancer Nurs. 2013, 36, 301–308. [Google Scholar] [CrossRef] [Green Version]
- Gordon, L.; Scuffham, P.; Hayes, S.; Newman, B. Exploring the economic impact of breast cancers during the 18 months following diagnosis. Psychooncology 2007, 16, 1130–1139. [Google Scholar] [CrossRef] [PubMed] [Green Version]
- Gordon, L.G.; Elliott, T.M.; Olsen, C.M.; Pandeya, N.; Whiteman, D.C. Multiplicity of skin cancers in Queensland and their cost burden to government and patients. Aust. N. Z. J. Public Health 2018, 42, 86–91. [Google Scholar] [CrossRef] [Green Version]
- Gordon, L.G.; Elliott, T.M.; Olsen, C.M.; Pandeya, N.; Whiteman, D.C. Patient out-of-pocket medical expenses over 2 years among Queenslanders with and without a major cancer. Aust. J. Prim. Health 2018, 24, 530–536. [Google Scholar] [CrossRef] [PubMed]
- Gordon, L.G.; Ferguson, M.; Chambers, S.K.; Dunn, J. Fuel, beds, meals and meds: Out-of-pocket expenses for patients with cancer in rural Queensland. Cancer Forum. 2009, 33, 202–208. [Google Scholar]
- Gordon, L.G.; Walker, S.M.; Mervin, M.C.; Lowe, A.; Smith, D.P.; Gardiner, R.A.; Chambers, S.K. Financial toxicity: A potential side effect of prostate cancer treatment among Australian men. Eur. J. Cancer Care 2017, 26. [Google Scholar] [CrossRef]
- Grange, F.; Mohr, P.; Harries, M.; Ehness, R.; Benjamin, L.; Siakpere, O.; Barth, J.; Stapelkamp, C.; Pfersch, S.; McLeod, L.D.; et al. Economic burden of advanced melanoma in France, Germany and the UK: A retrospective observational study (Melanoma Burden-of-Illness Study). Melanoma Res. 2017, 27, 607–618. [Google Scholar] [CrossRef]
- Group, A.S.; Jan, S.; Kimman, M.; Peters, S.A.; Woodward, M. Financial catastrophe, treatment discontinuation and death associated with surgically operable cancer in South-East Asia: Results from the ACTION Study. Surgery 2015, 157, 971–982. [Google Scholar] [CrossRef]
- Group, T.A.S. Policy and priorities for national cancer control planning in low- and middle-income countries: Lessons from the Association of Southeast Asian Nations (ASEAN) Costs in Oncology prospective cohort study. Eur. J. Cancer 2017, 74, 26–37. [Google Scholar] [CrossRef]
- Gupta, S.; Abouzaid, S.; Liebert, R.; Parikh, K.; Ung, B.; Rosenberg, A.S. Assessing the Effect of Adherence on Patient-reported Outcomes and Out of Pocket Costs Among Patients With Multiple Myeloma. Clin. Lymphoma Myeloma Leuk 2018, 18, 210–218. [Google Scholar] [CrossRef] [PubMed] [Green Version]
- Guy, G.P., Jr.; Yabroff, K.R.; Ekwueme, D.U.; Virgo, K.S.; Han, X.; Banegas, M.P.; Soni, A.; Zheng, Z.; Chawla, N.; Geiger, A.M. Healthcare Expenditure Burden Among Non-elderly Cancer Survivors, 2008–2012. Am. J. Prev. Med. 2015, 49, S489–S497. [Google Scholar] [CrossRef] [Green Version]
- Hanly, P.; Ceilleachair, A.O.; Skally, M.; O’Leary, E.; Kapur, K.; Fitzpatrick, P.; Staines, A.; Sharp, L. How much does it cost to care for survivors of colorectal cancer? Caregiver’s time, travel and out-of-pocket costs. Support. Care Cancer 2013, 21, 2583–2592. [Google Scholar] [CrossRef]
- Hess, L.M.; Cui, Z.L.; Wu, Y.; Fang, Y.; Gaynor, P.J.; Oton, A.B. Current and projected patient and insurer costs for the care of patients with non-small cell lung cancer in the United States through 2040. J. Med. Econ. 2017, 20, 850–862. [Google Scholar] [CrossRef] [PubMed]
- Housser, E.; Mathews, M.; Le Messurier, J.; Young, S.; Hawboldt, J.; West, R. Responses by breast and prostate cancer patients to out-of-pocket costs in Newfoundland and Labrador. Curr. Oncol. 2013, 20, 158–165. [Google Scholar] [CrossRef] [Green Version]
- Houts, P.S.; Lipton, A.; Harvey, H.A.; Martin, B.; Simmonds, M.A.; Dixon, R.H.; Longo, S.; Andrews, T.; Gordon, R.A.; Meloy, J. Nonmedical costs to patients and their families associated with outpatient chemotherapy. Cancer 1984, 53, 2388–2392. [Google Scholar] [CrossRef]
- Huang, H.Y.; Shi, J.F.; Guo, L.W.; Bai, Y.N.; Liao, X.Z.; Liu, G.X.; Mao, A.Y.; Ren, J.S.; Sun, X.J.; Zhu, X.Y.; et al. Expenditure and financial burden for the diagnosis and treatment of colorectal cancer in China: A hospital-based, multicenter, cross-sectional survey. Cancer Commun. 2017, 36, 41. [Google Scholar] [CrossRef] [Green Version]
- Isshiki, T. Outpatient treatment costs and their potential impact on cancer care. Cancer Med. 2014, 3, 1539–1543. [Google Scholar] [CrossRef] [PubMed]
- Kumthekar, P.U.; Jacobs, D.; Stell, B.V.; Grimm, S.A.; Rademaker, A.; Rice, L.; Schwartz, M.A.; Chandler, J.; Muro, K.; Marymont, M.H.; et al. Financial burden experienced by patients undergoing treatment for malignant gliomas: Updated data. J. Clin. Oncol. Conf. ASCO Annu. Meet. 2011, 29, e19571. [Google Scholar] [CrossRef] [PubMed] [Green Version]
- Jagsi, R.; Pottow, J.A.; Griffith, K.A.; Bradley, C.; Hamilton, A.S.; Graff, J.; Katz, S.J.; Hawley, S.T. Long-term financial burden of breast cancer: Experiences of a diverse cohort of survivors identified through population-based registries. J. Clin. Oncol. 2014, 32, 1269–1276. [Google Scholar] [CrossRef] [PubMed] [Green Version]
- Jagsi, R.; Ward, K.C.; Abrahamse, P.; Wallner, L.P.; Kurian, A.W.; Hamilton, A.S.; Katz, S.J.; Hawley, S.T. Unmet need for clinician engagement about financial toxicity after diagnosis of breast cancer. J. Clin. Oncol. Conf. 2018, 36. [Google Scholar] [CrossRef]
- Jayadevappa, R.; Schwartz, J.S.; Chhatre, S.; Gallo, J.J.; Wein, A.J.; Malkowicz, S.B. The burden of out-of-pocket and indirect costs of prostate cancer. Prostate 2010, 70, 1255–1264. [Google Scholar] [CrossRef]
- Jeah, J.; Wendy Yi, X.; Chelim, C. In-Gap Discounts in Medicare Part D and Specialty Drug Use. Am. J. Manag. Care 2017, 23, 553–559. [Google Scholar]
- John, G.; Hershman, D.; Falci, L.; Shi, Z.; Tsai, W.-Y.; Greenlee, H.; John, G.M.; Hershman, D.L. Complementary and alternative medicine use among US cancer survivors. J. Cancer Surviv. 2016, 10, 850–864. [Google Scholar] [CrossRef] [PubMed]
- Kaisaeng, N.; Harpe, S.E.; Carroll, N.V. Out-of-pocket costs and oral cancer medication discontinuation in the elderly. J. Manag. Care Spec. Pharm. 2014, 20, 669–675. [Google Scholar] [CrossRef]
- Kircher, S.M.; Johansen, M.; Davis, M.M. Impact of Medicare Part D on out-of-pocket drug costs and utilization for patients with cancer. J. Clin. Oncol. 2013, 31, 275. [Google Scholar] [CrossRef]
- Kodama, Y.; Morozumi, R.; Matsumura, T.; Kishi, Y.; Murashige, N.; Tanaka, Y.; Takita, M.; Hatanaka, N.; Kusumi, E.; Kami, M.; et al. Increased financial burden among patients with chronic myelogenous leukaemia receiving imatinib in Japan: A retrospective survey. BMC Cancer 2012, 12, 152. [Google Scholar] [CrossRef] [Green Version]
- Koskinen, J.P.; Farkkila, N.; Sintonen, H.; Saarto, T.; Taari, K.; Roine, R.P. The association of financial difficulties and out-of-pocket payments with health-related quality of life among breast, prostate and colorectal cancer patients. Acta Oncol 2019. [Google Scholar] [CrossRef] [PubMed]
- Langa, K.M.; Fendrick, A.M.; Chernew, M.E.; Kabeto, M.U.; Paisley, K.L.; Hayman, J.A. Out-of-pocket health-care expenditures among older Americans with cancer. Value Health 2004, 7, 186–194. [Google Scholar] [CrossRef] [Green Version]
- Lansky, S.B.; Cairns, N.U.; Clark, G.M.; Lowman, J.; Miller, L.; Trueworthy, R. Childhood cancer: Nonmedical costs of the illness. Cancer 1979, 43, 403–408. [Google Scholar] [CrossRef]
- Lauzier, S.; Levesque, P.; Mondor, M.; Drolet, M.; Coyle, D.; Brisson, J.; Masse, B.; Provencher, L.; Robidoux, A.; Maunsell, E. Out-of-pocket costs in the year after early breast cancer among Canadian women and spouses. J. Natl. Cancer Inst. 2013, 105, 280–292. [Google Scholar] [CrossRef] [Green Version]
- Leopold, C.; Wagner, A.K.; Zhang, F.; Lu, C.Y.; Earle, C.C.; Nekhlyudov, L.; Ross-Degnan, D.; Wharam, J.F. Total and out-of-pocket expenditures among women with metastatic breast cancer in low-deductible versus high-deductible health plans. Breast Cancer Res. Treat. 2018, 171, 449–459. [Google Scholar] [CrossRef]
- Liao, X.Z.; Shi, J.F.; Liu, J.S.; Huang, H.Y.; Guo, L.W.; Zhu, X.Y.; Xiao, H.F.; Wang, L.; Bai, Y.N.; Liu, G.X.; et al. Medical and non-medical expenditure for breast cancer diagnosis and treatment in China: A multicenter cross-sectional study. Asia Pac J. Clin. Oncol. 2018, 14, 167–178. [Google Scholar] [CrossRef] [PubMed]
- Longo, C.J.; Bereza, B.G. A comparative analysis of monthly out-of-pocket costs for patients with breast cancer as compared with other common cancers in Ontario, Canada. Curr. Oncol. 2011, 18, e1–e8. [Google Scholar] [CrossRef] [Green Version]
- Mahal, A.; Karan, A.; Fan, V.Y.; Engelgau, M. The economic burden of cancers on Indian households. PLoS ONE 2013, 8, e71853. [Google Scholar] [CrossRef] [Green Version]
- Markman, M.; Luce, R. Impact of the cost of cancer treatment: An internet-based survey. J. Oncol. Pract. 2010, 6, 69–73. [Google Scholar] [CrossRef] [PubMed] [Green Version]
- Marti, J.; Hall, P.S.; Hamilton, P.; Hulme, C.T.; Jones, H.; Velikova, G.; Ashley, L.; Wright, P. The economic burden of cancer in the UK: A study of survivors treated with curative intent. Psychooncology 2016, 25, 77–83. [Google Scholar] [CrossRef] [Green Version]
- Massa, S.T.; Osazuwa-Peters, N.; Adjei Boakye, E.; Walker, R.J.; Ward, G.M. Comparison of the Financial Burden of Survivors of Head and Neck Cancer With Other Cancer Survivors. JAMA Otolaryngol. Head Neck Surg. 2019, 21, 21. [Google Scholar] [CrossRef] [PubMed]
- Narang, A.K.; Nicholas, L.H. Out-of-Pocket Spending and Financial Burden among Medicare Beneficiaries with Cancer. JAMA Oncol. 2017, 3, 757–765. [Google Scholar] [CrossRef]
- Newton, J.C.; Johnson, C.E.; Hohnen, H.; Bulsara, M.; Ives, A.; McKiernan, S.; Platt, V.; McConigley, R.; Slavova-Azmanova, N.S.; Saunders, C. Out-of-pocket expenses experienced by rural Western Australians diagnosed with cancer. Support. Care Cancer 2018, 26, 3543–3552. [Google Scholar] [CrossRef] [PubMed]
- Olszewski, A.J.; Dusetzina, S.B.; Eaton, C.B.; Davidoff, A.J.; Trivedi, A.N. Subsidies for Oral Chemotherapy and Use of Immunomodulatory Drugs Among Medicare Beneficiaries With Myeloma. J. Clin. Oncol. 2017, 35, 3306–3314. [Google Scholar] [CrossRef]
- O’Neill, K.M.; Mandigo, M.; Pyda, J.; Nazaire, Y.; Greenberg, S.L.; Gillies, R.; Damuse, R. Out-of-pocket expenses incurred by patients obtaining free breast cancer care in Haiti. Lancet 2015, 385 (Suppl. 2), S48. [Google Scholar] [CrossRef]
- Pisu, M.; Azuero, A.; Benz, R.; McNees, P.; Meneses, K. Out-of-pocket costs and burden among rural breast cancer survivors. Cancer Med. 2017, 6, 572–581. [Google Scholar] [CrossRef] [PubMed]
- Pisu, M.; Azuero, A.; Meneses, K.; Burkhardt, J.; McNees, P. Out of pocket cost comparison between Caucasian and minority breast cancer survivors in the Breast Cancer Education Intervention (BCEI). Breast Cancer Res. Treat 2011, 127, 521–529. [Google Scholar] [CrossRef] [Green Version]
- Raborn, M.L.; Pelletier, E.M.; Smith, D.B.; Reyes, C.M. Patient Out-of-Pocket Payments for Oral Oncolytics: Results From a 2009 US Claims Data Analysis. J. Oncol. Pract. 2012, 8, 9s–15s. [Google Scholar] [CrossRef] [Green Version]
- Roberts, M.C.; Dusetzina, S.B. Use and Costs for Tumor Gene Expression Profiling Panels in the Management of Breast Cancer From 2006 to 2012: Implications for Genomic Test Adoption Among Private Payers. J. Oncol. Pract. 2015, 11, 273–277. [Google Scholar] [CrossRef]
- Sculpher, M.; Palmer, M.K.; Heyes, A. Costs incurred by patients undergoing advanced colorectal cancer therapy. A comparison of raltitrexed and fluorouracil plus folinic acid. Pharmacoeconomics 2000, 17, 361–370. [Google Scholar] [CrossRef] [PubMed]
- Shih, Y.C.; Smieliauskas, F.; Geynisman, D.M.; Kelly, R.J.; Smith, T.J. Trends in the Cost and Use of Targeted Cancer Therapies for the Privately Insured Nonelderly: 2001 to 2011. J. Clin. Oncol. 2015, 33, 2190–2196. [Google Scholar] [CrossRef] [Green Version]
- Shiroiwa, T.; Fukuda, T.; Tsutani, K. Out-of-pocket payment and cost-effectiveness of XELOX and XELOX plus bevacizumab therapy: From the perspective of metastatic colorectal cancer patients in Japan. Int. J. Clin. Oncol. 2010, 15, 256–262. [Google Scholar] [CrossRef]
- Sneha, L.M.; Sai, J.; Ashwini, S.; Ramaswamy, S.; Rajan, M.; Scott, J.X. Financial Burden Faced by Families due to Out-of-pocket Expenses during the Treatment of their Cancer Children: An Indian Perspective. Indian J. Med. Paediatr. Oncol. 2017, 38, 4–9. [Google Scholar] [CrossRef] [Green Version]
- Stommel, M.; Given, C.W.; Given, B.A. The cost of cancer home care to families. Cancer 1993, 71, 1867–1874. [Google Scholar] [CrossRef]
- Suidan, R.S.; He, W.; Sun, C.C.; Zhao, H.; Rauh-Hain, J.A.; Fleming, N.D.; Lu, K.H.; Giordano, S.H.; Meyer, L.A. Total and out-of-pocket costs of different primary management strategies in ovarian cancer. Am. J. Obstet. Gynecol. 2019, 6, 6. [Google Scholar] [CrossRef]
- Tangka, F.K.; Trogdon, J.G.; Richardson, L.C.; Howard, D.; Sabatino, S.A.; Finkelstein, E.A. Cancer treatment cost in the United States: Has the burden shifted over time? Cancer 2010, 116, 3477–3484. [Google Scholar] [CrossRef]
- Thompson, B.S.; Pandeya, N.; Olsen, C.M.; Dusingize, J.C.; Green, A.C.; Neale, R.E.; Whiteman, D.C. Keratinocyte cancer excisions in Australia: Who performs them and associated costs. Australas. J. Dermatol. 2019, 22, 22. [Google Scholar] [CrossRef]
- Tomic, K.; Long, S.; Li, X.; Fu, A.C.; Yu, T.C.; Barron, R. A retrospective study of patients’ out-of-pocket costs for granulocyte colony-stimulating factors. J. Oncol. Pharm. Pract. 2013, 19, 328–337. [Google Scholar] [CrossRef]
- Tsimicalis, A.; Stevens, B.; Ungar, W.J.; Greenberg, M.; McKeever, P.; Agha, M.; Guerriere, D.; Barr, R.; Naqvi, A.; Moineddin, R. Determining the costs of families’ support networks following a child’s cancer diagnosis. Cancer Nurs. 2013, 36, E8–E19. [Google Scholar] [CrossRef] [PubMed]
- Tsimicalis, A.; Stevens, B.; Ungar, W.J.; McKeever, P.; Greenberg, M.; Agha, M.; Guerriere, D.; Barr, R.; Naqvi, A.; Moineddin, R. A prospective study to determine the costs incurred by families of children newly diagnosed with cancer in Ontario. Psychooncology 2012, 21, 1113–1123. [Google Scholar] [CrossRef]
- Van Houtven, C.H.; Ramsey, S.D.; Hornbrook, M.C.; Atienza, A.A.; van Ryn, M. Economic burden for informal caregivers of lung and colorectal cancer patients. Oncologist 2010, 15, 883–893. [Google Scholar] [CrossRef] [PubMed] [Green Version]
- Wang, X.J.; Wong, M.; Hsu, L.Y.; Chan, A. Costs associated with febrile neutropenia in solid tumor and lymphoma patients-an observational study in Singapore. BMC Health Serv. Res. 2014, 14, 434. [Google Scholar] [CrossRef] [PubMed] [Green Version]
- Wenhui, M.; Shenglan, T.; Ying, Z.; Zening, X.; Wen, C. Financial burden of healthcare for cancer patients with social medical insurance: A multi-centered study in urban China. Int. J. Equity Health 2017, 16, 1–12. [Google Scholar] [CrossRef] [Green Version]
- Wood, R.; Taylor-Stokes, G. Cost burden associated with advanced non-small cell lung cancer in Europe and influence of disease stage. BMC Cancer 2019, 19, 214. [Google Scholar] [CrossRef] [Green Version]
- Ya-Chen Tina, S.; Ying, X.; Lei, L.; Smieliauskas, F.; Shih, Y.-C.T.; Xu, Y.; Liu, L. Rising Prices of Targeted Oral Anticancer Medications and Associated Financial Burden on Medicare Beneficiaries. J. Clin. Oncol. 2017, 35, 2482–2489. [Google Scholar] [CrossRef]
- Yu, M.; Guerriere, D.N.; Coyte, P.C. Societal costs of home and hospital end-of-life care for palliative care patients in Ontario, Canada. Health Soc. Care Community 2015, 23, 605–618. [Google Scholar] [CrossRef]
- Faiman, B. Oral cancer therapy: Policy implications for the uninsured and underinsured populations. J. Adv. Pract. Oncol. 2013, 4, 354–360. [Google Scholar] [CrossRef] [PubMed]
- Shankaran, V.; Ramsey, S. Addressing the Financial Burden of Cancer Treatment: From Copay to Can’t Pay. JAMA Oncol. 2015, 1, 273–274. [Google Scholar] [CrossRef] [PubMed] [Green Version]
- Essue, B.M.; Birch, S. Blunt Policy Instruments Deliver Blunt Policy Outcomes: Why Cost Sharing is Not Effective at Controlling Utilization and Improving Health System Efficiency. Med. Care 2016, 54, 107–109. [Google Scholar] [CrossRef] [PubMed]
- Sirintrapun, S.J.; Lopez, A.M. Telemedicine in Cancer Care. Am. Soc. Clin. Oncol. Educ. Book 2018, 38, 540–545. [Google Scholar] [CrossRef]
- Bentur, N.; Resnizky, S.; Balicer, R.; Eilat-Tsanani, T. Quality of end-of-life care for cancer patients: Does home hospice care matter? Am. J. Manag. Care 2014, 20, 988–992. [Google Scholar]
- Tucker-Seeley, R.D.; Yabroff, K.R. Minimizing the “financial toxicity” associated with cancer care: Advancing the research agenda. J. Natl. Cancer Inst. 2016, 108. [Google Scholar] [CrossRef] [PubMed] [Green Version]
- Altice, C.K.; Banegas, M.P.; Tucker-Seeley, R.D.; Yabroff, K.R. Financial Hardships Experienced by Cancer Survivors: A Systematic Review. J. Natl. Cancer Inst. 2017, 109. [Google Scholar] [CrossRef]
- Gordon, L.G.; Merollini, K.M.D.; Lowe, A.; Chan, R.J. A Systematic Review of Financial Toxicity Among Cancer Survivors: We Can’t Pay the Co-Pay. Patient 2017, 10, 295–309. [Google Scholar] [CrossRef] [PubMed] [Green Version]
- Diller, L. Late Effects of Childhood Cancer; CRC Press: Boca Raton, FL, USA, 2019. [Google Scholar]
- Jan, S.; Essue, B.M.; Leeder, S.R. Falling through the cracks: The hidden economic burden of chronic illness and disability on Australian households. Med. J. Aust. 2012, 196, 29–31. [Google Scholar] [CrossRef]
- Sanyal, C.; Aprikian, A.G.; Chevalier, S.; Cury, F.L.; Dragomir, A. Direct cost for initial management of prostate cancer: A systematic review. Curr. Oncol. 2013, 20, e522–e531. [Google Scholar] [CrossRef] [Green Version]
- Meeker, C.R.; Geynisman, D.M.; Egleston, B.L.; Hall, M.J.; Mechanic, K.Y.; Bilusic, M.; Plimack, E.R.; Martin, L.P.; von Mehren, M.; Lewis, B.; et al. Relationships Among Financial Distress, Emotional Distress, and Overall Distress in Insured Patients With Cancer. J. Oncol. Pract. 2016, 12, e755–e764. [Google Scholar] [CrossRef] [PubMed]
- Yabroff, K.R.; Lund, J.; Kepka, D.; Mariotto, A. Economic burden of cancer in the United States: Estimates, projections, and future research. Cancer Epidemiol. Biomark. Prev. 2011, 20, 2006–2014. [Google Scholar] [CrossRef] [Green Version]
Figure 1.
Preferred Reported Items for Systematic Reviews and Meta-Analyses (PRISMA) diagram. Note: This diagram shows the flow of information through the different sections of the systematic review, including the identified, excluded and included studies after the title/abstract and full-text reviews.

Figure 2.
Range of monthly out-of-pocket costs per patient by country. Countries in the European Union (EU) include Italy, France, Ireland, and Germany. Costs are expressed in 2018 USD. Not enough data were available to include a range of costs (in 2018 USD) for other countries. Average costs per patient per month were also estimated: USD 300 in the U.S., USD 200 in Canada, USD 180 in the E.U. and USD 70 in Australia Not enough data were available to stratify these estimates by cancer site.

Figure 3.
Average monthly out-of-pocket costs per patient by spending categories. Note: The medical expenditure categories were defined as prescription or over-the-counter drugs and medications, home and clinical medical visits, and in-hospital care. The non-medical categories included transport, travel and lodging, and formal and informal caregiver costs (e.g., daycare for pediatric patients). Costs are presented for comparison between the U.S. and countries with universal healthcare coverage. Not enough data was available to estimate costs for low- and middle-income countries. Costs are expressed in 2018 USD. Not enough data were available to stratify these estimates by cancer site.
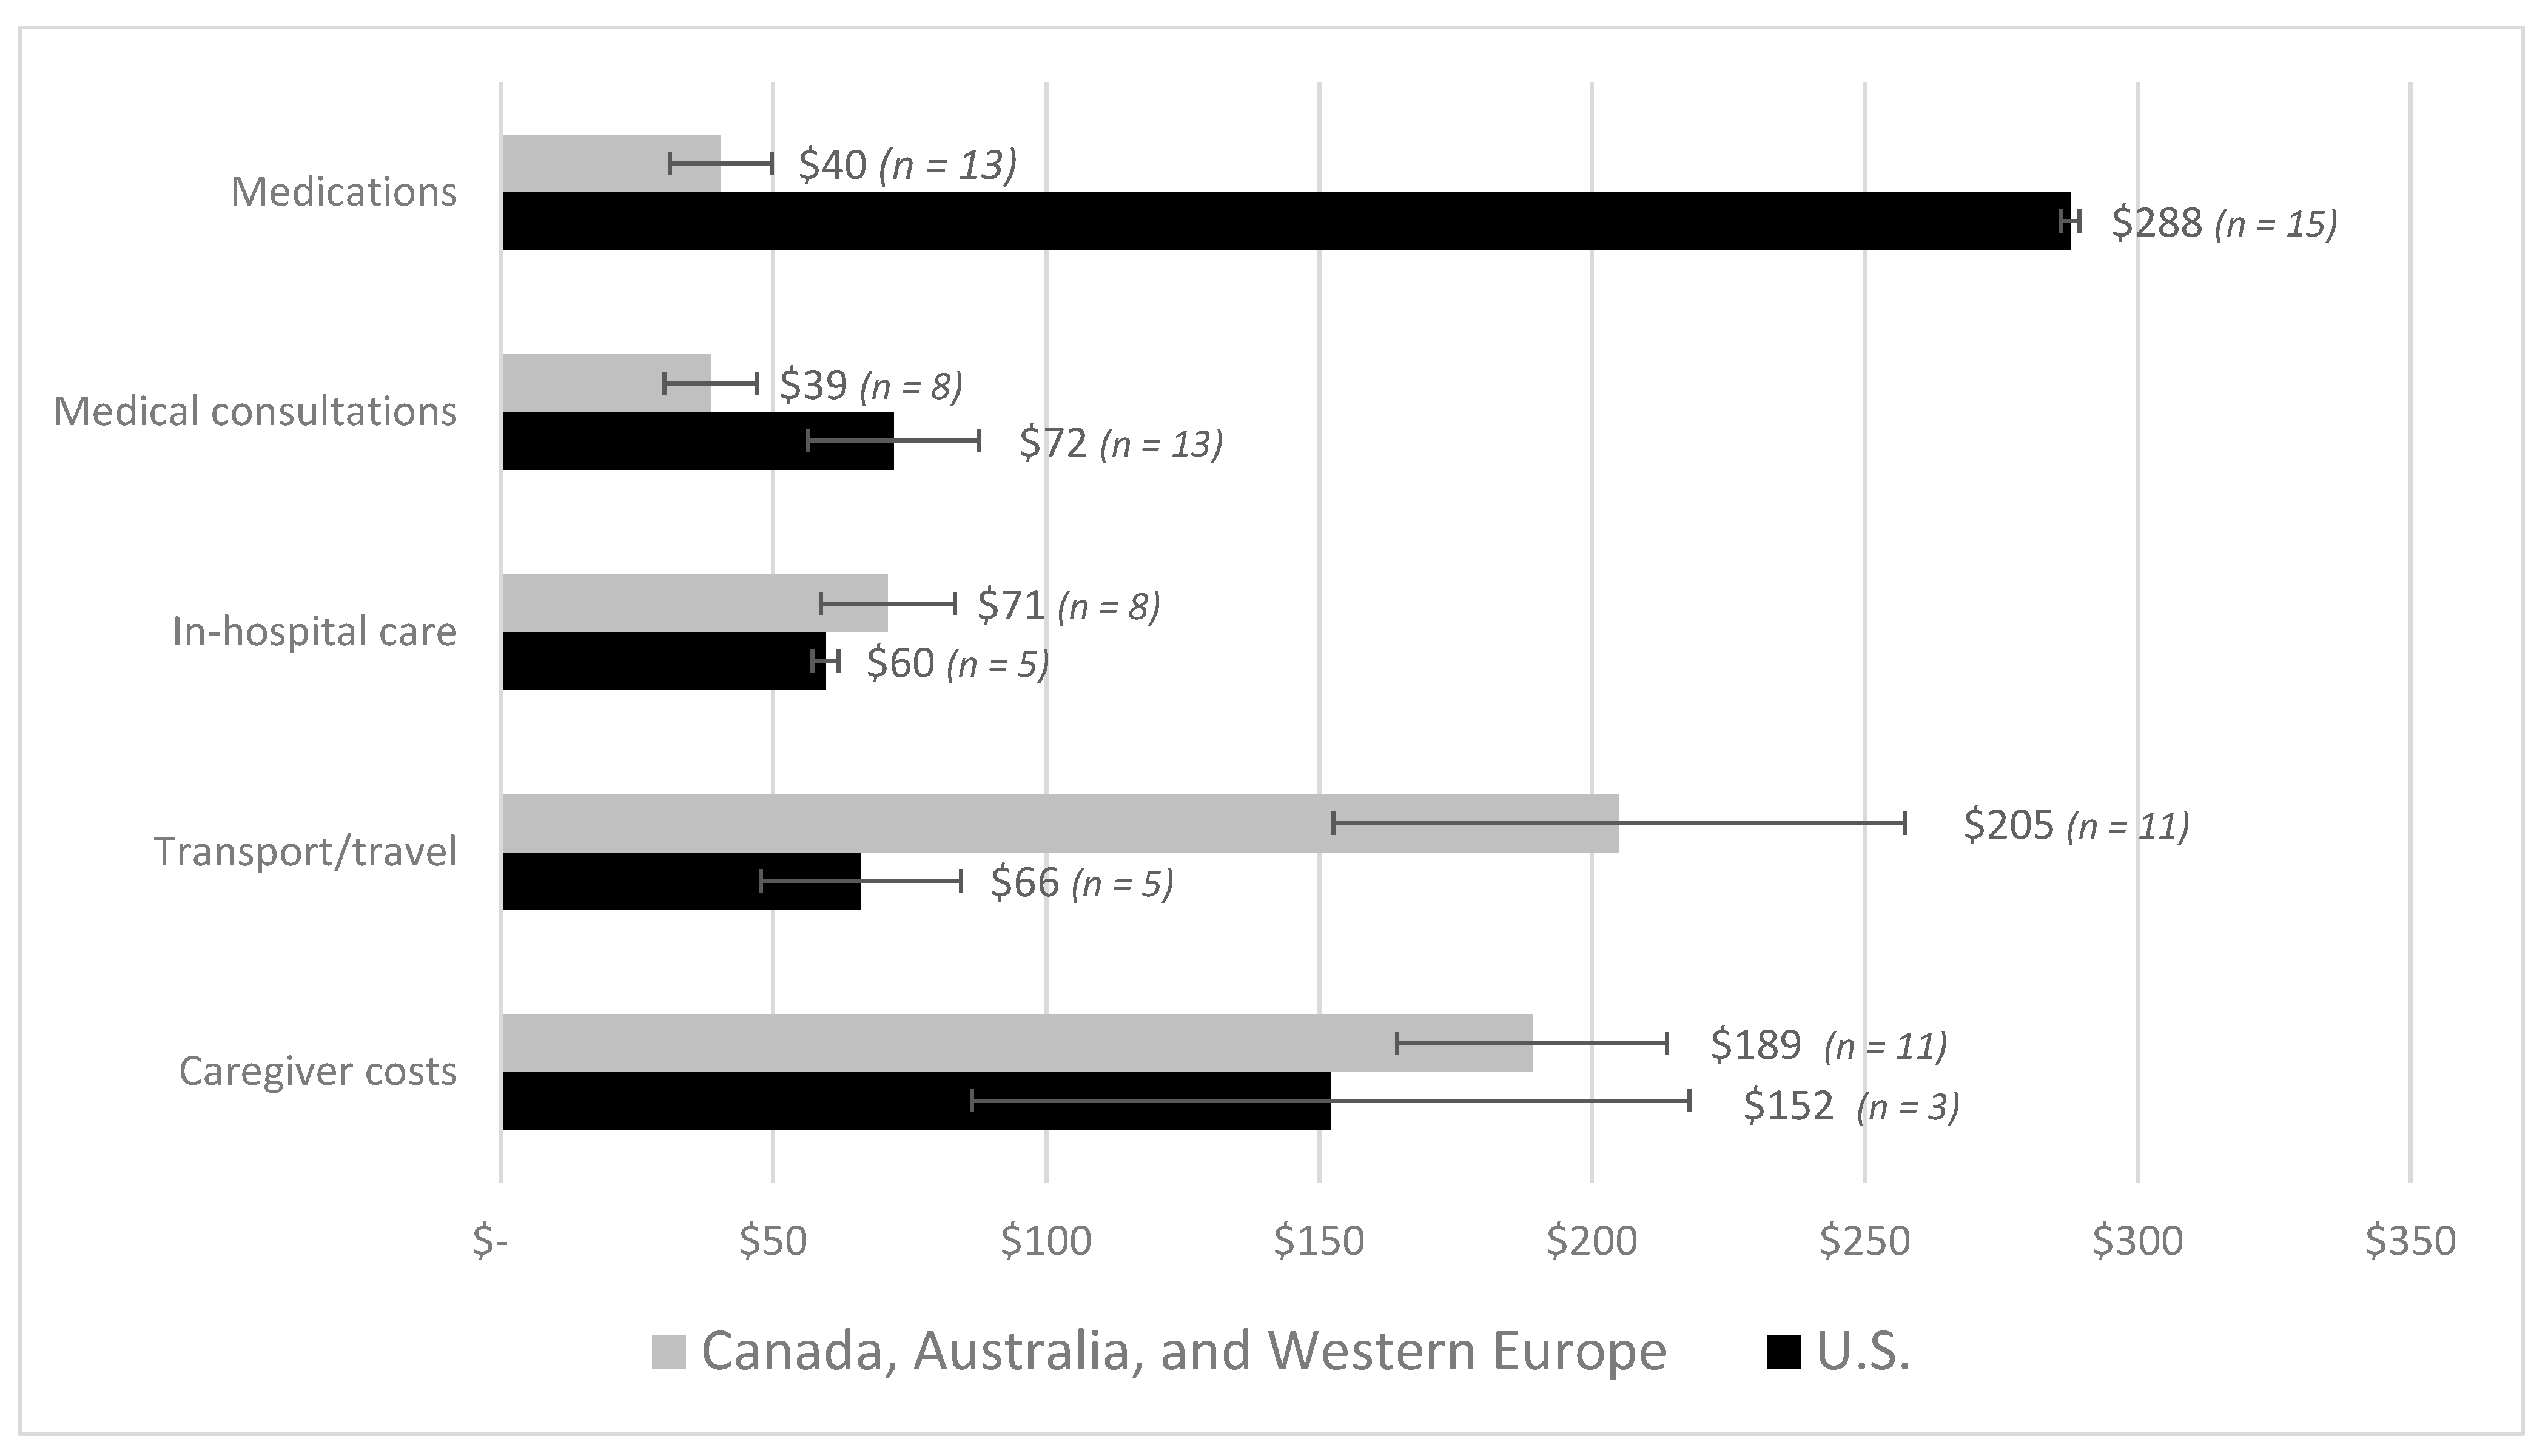
Figure 4.
Average monthly out-of-pocket costs per patient by cancer site with 95% confidence intervals from high-income countries. Note: Studies that included patients with multiple cancer sites are reported under the ‘All cancer’ and ‘pediatric cancer’ categories. Costs are expressed in 2018 USD. Not enough data were available to report average costs per cancer site for low- and middle-income countries, or for individual high-income countries.
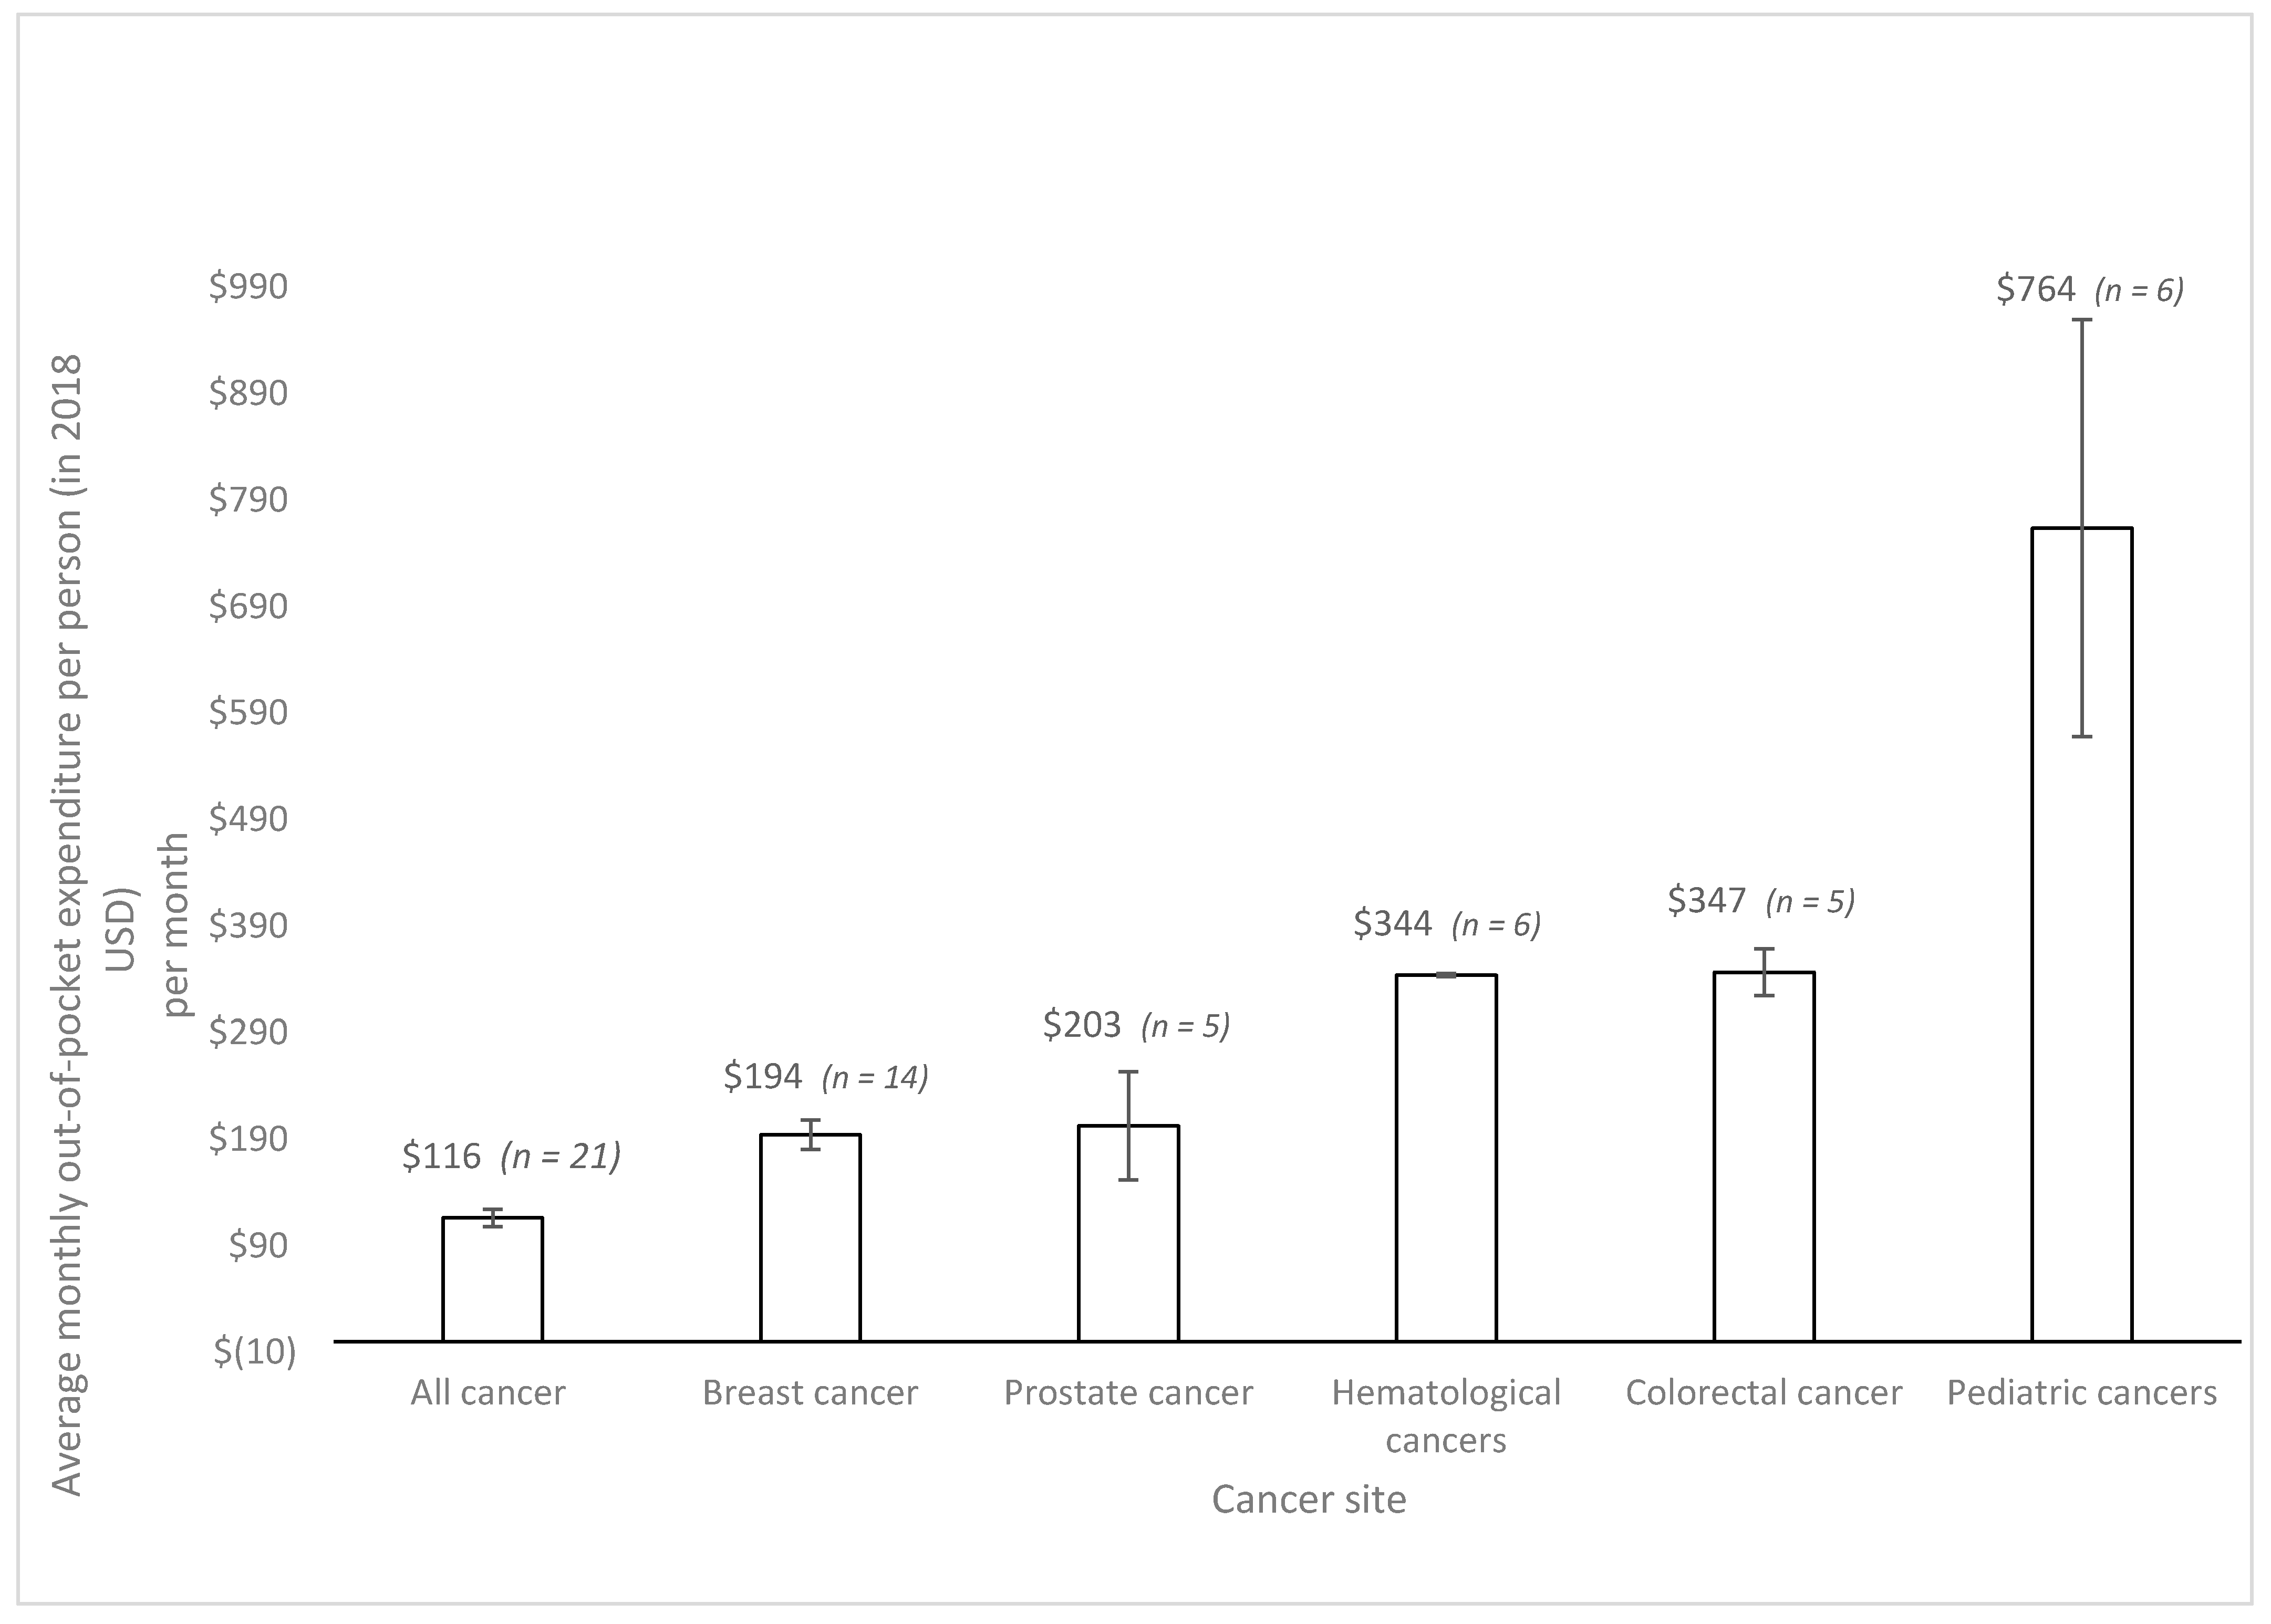
Figure 5.
Average monthly out-of-pocket costs per patient by cancer site in the U.S. Note: Studies that included patients with multiple cancer sites are reported under the ‘All cancer’ category. Costs are expressed in 2018 USD. Not enough data were available to report average costs per cancer site for low- and middle-income countries, or for other high-income countries.
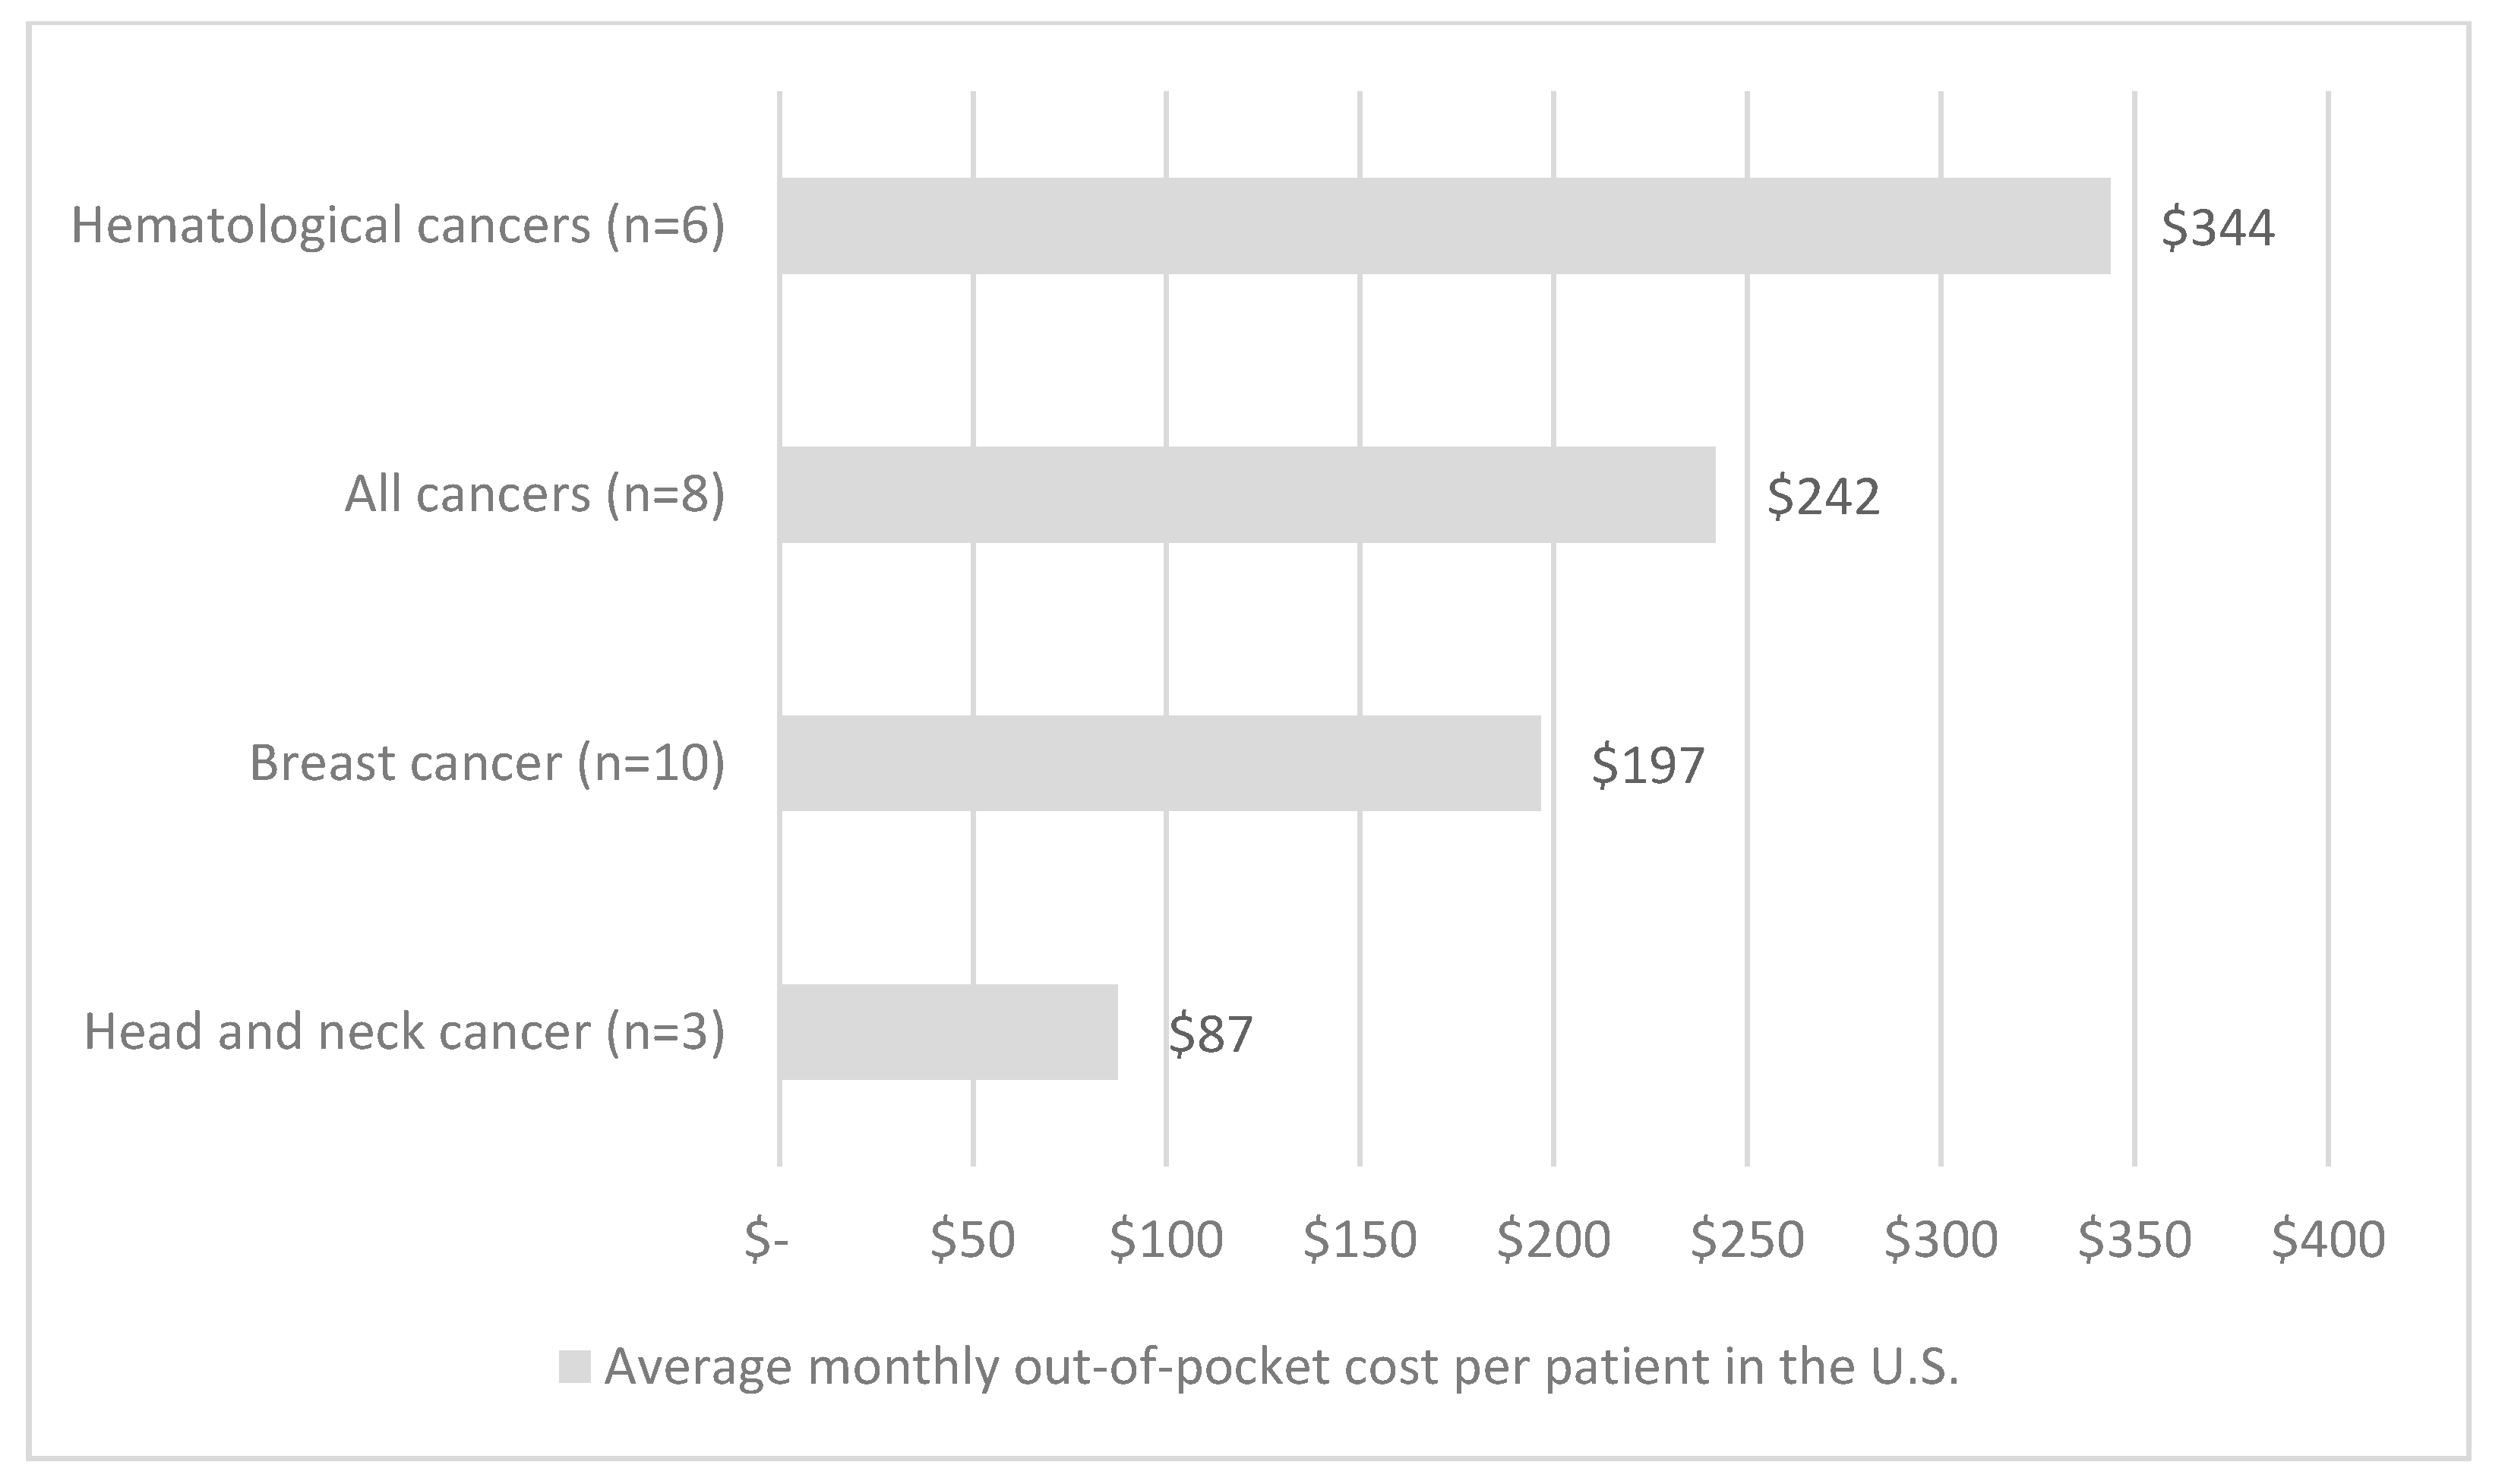
Figure 6.
Average out-of-pocket costs per patient as a percentage of income. Legend: LMIC = low- and middle-income countries; HIC = high-income countries; ASG = Action Study Group; blue bars represent studies from HICs; green bars represent studies from LMICs. Note: This figure shows the costs from individual studies that estimated out-of-pocket expenditures relative to annual income. A weighted average was calculated for high-income countries (in green) and low-and middle- income countries (blue). Studies conducted in high-income countries include the U.S., Canada, and Australia. Studies conducted in low- and middle-income countries include China, Malaysia, India, Haiti, Brunei, Thailand, Indonesia, Philippines, Vietnam, Laos, Cambodia, and Myanmar.
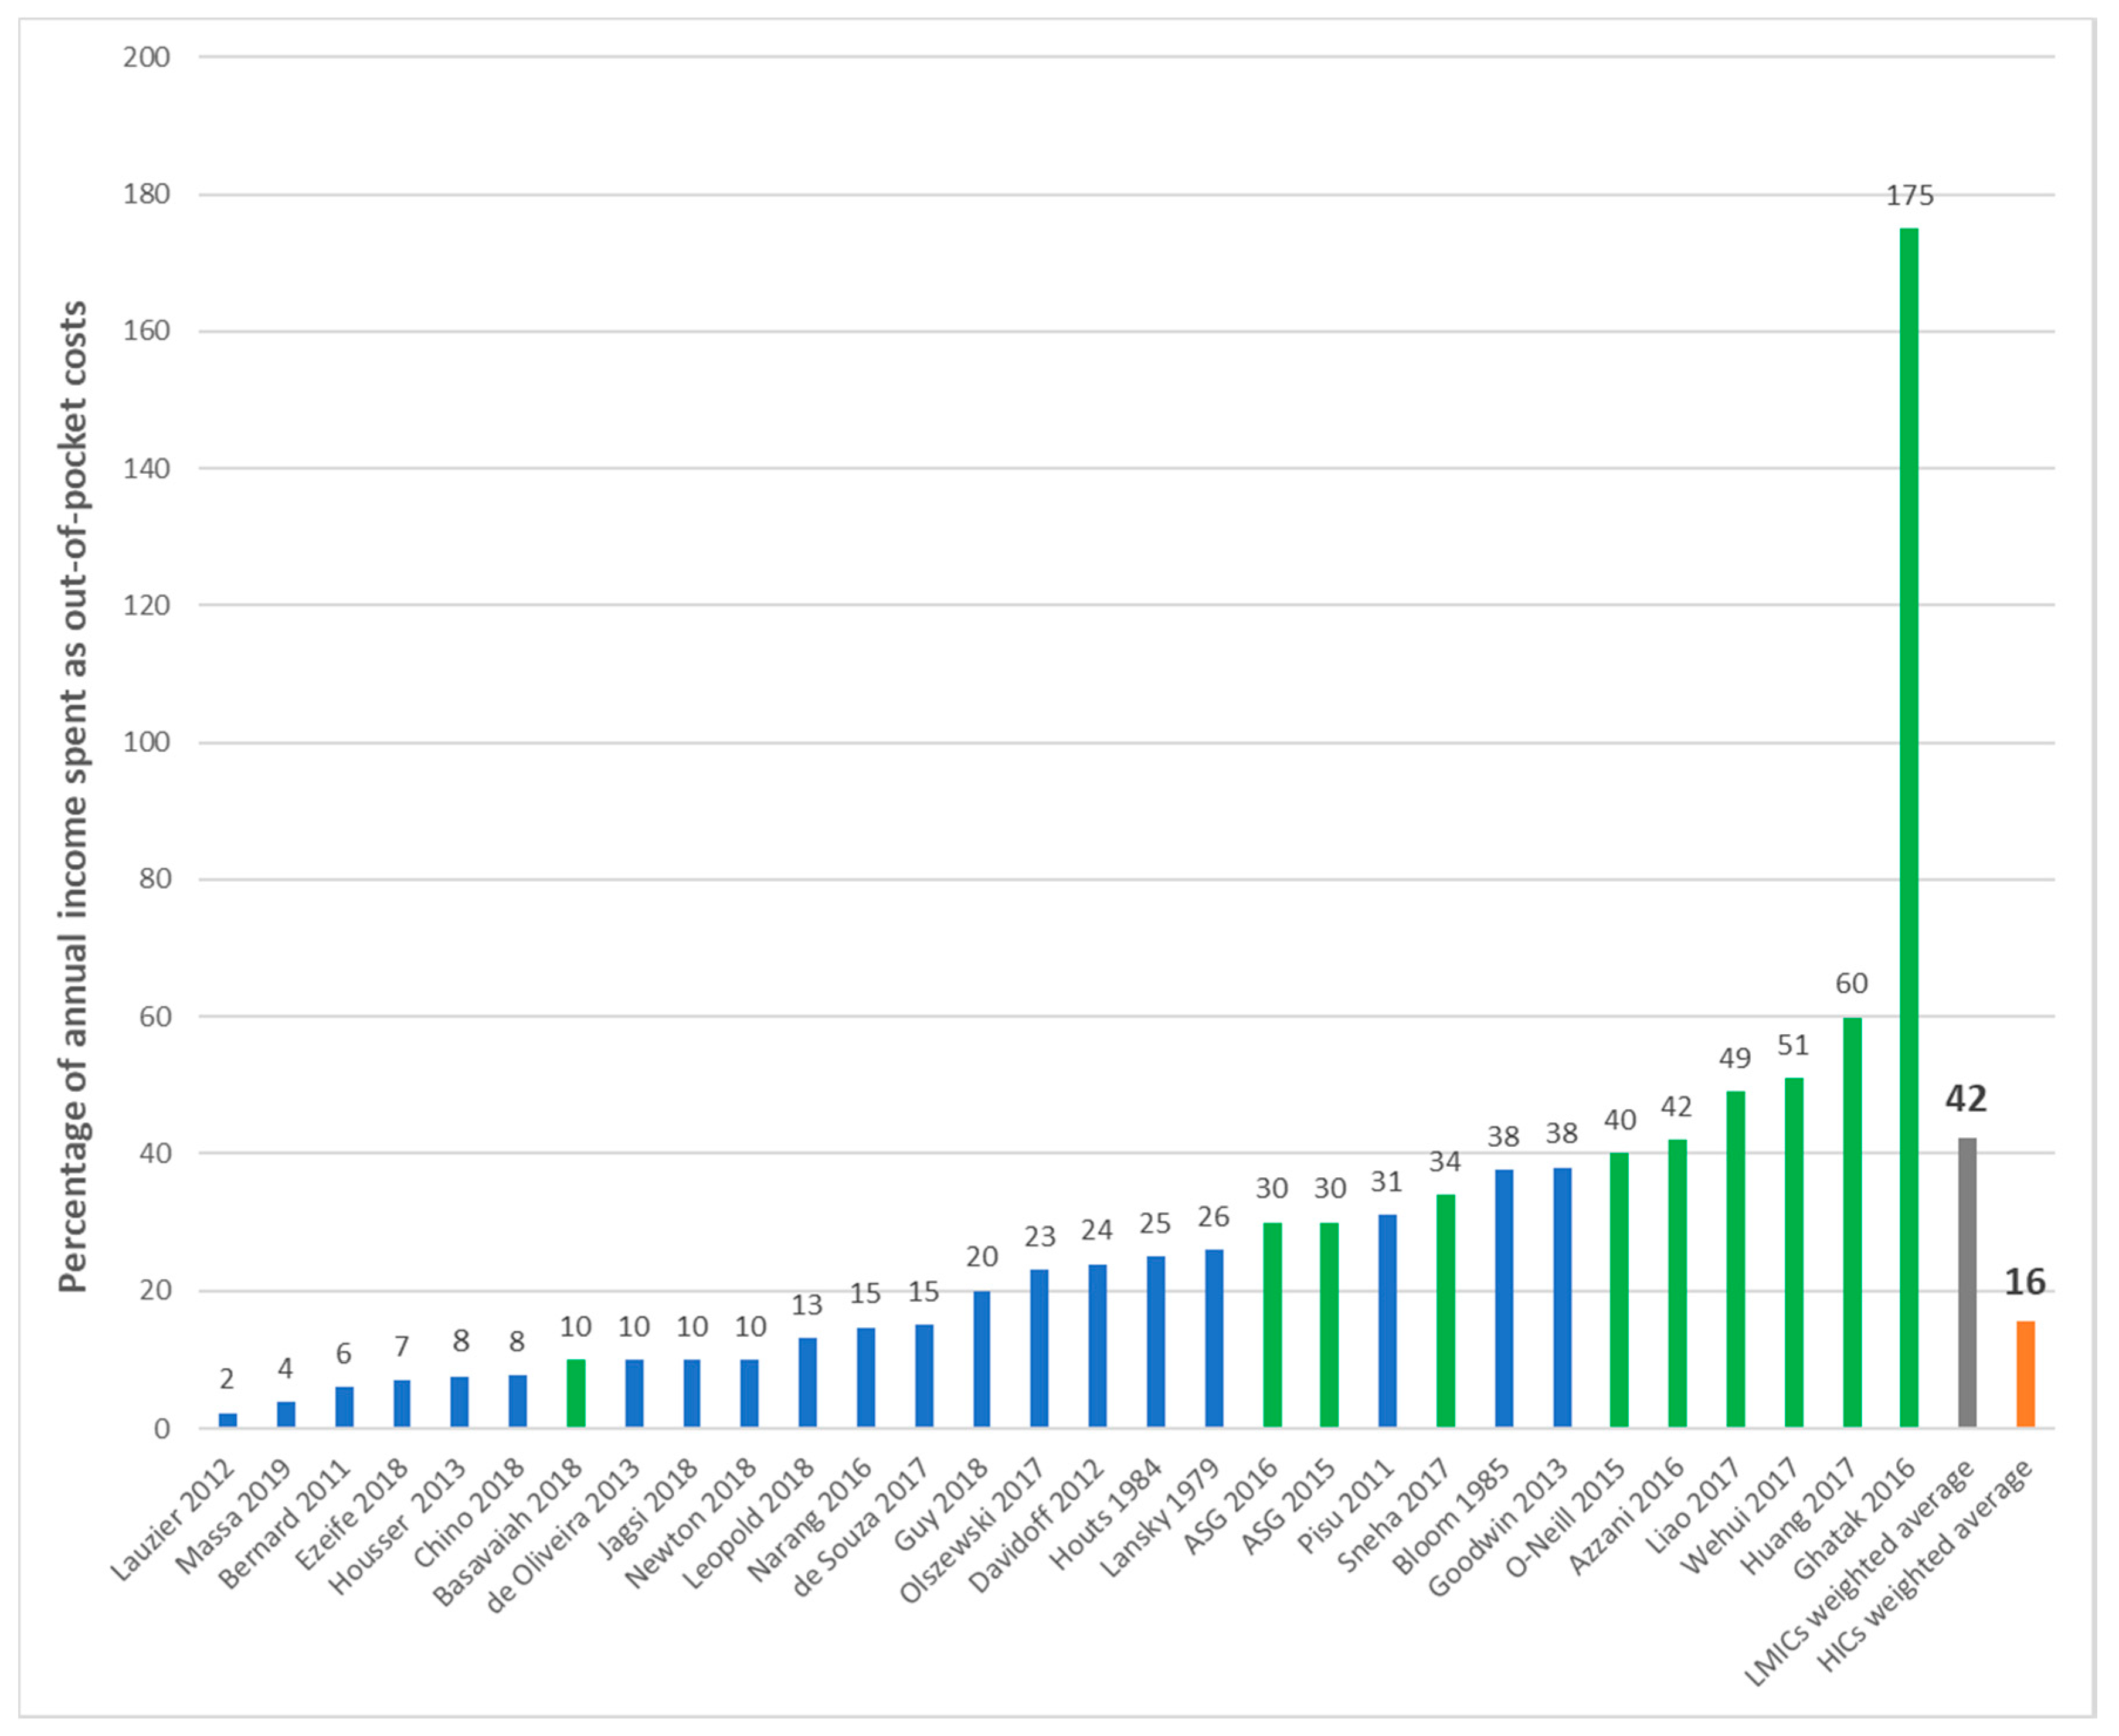
Figure 7.
Quality assessment of individual studies. Note: This figure shows the proportion of studies with low, unclear or high risk of bias, as per the Ottawa-Newcastle Assessment Tool for cohort and cross-sectional studies. The dimensions evaluated for risk of bias were patient selection, comparability, and outcome assessment.

Table 1.
Study characteristics.
| First Author | Year | Country | Cancer Care Continuum | Sample Size | Mean Age (SD) | % over 60 Years | % Female | % Insured | Type of Insurance | Mean | Study Design | Study Population |
|---|---|---|---|---|---|---|---|---|---|---|---|---|
| Income | ||||||||||||
| All cancer (adults) | ||||||||||||
| Bates | 2018 | Australia | Post diagnosis | 25,530 | NR | 57.20% | 44 | NR | NR | NR | Retrospective observational study | All cancer patients in Queensland |
| Callander | 2019 | Australia | Post diagnosis | 429 | 57.4 (15.4) | NR | 49 | 100% | Public | NR | Retrospective observational study | All cancer patients in Queensland |
| Gordon | 2009 | Australia | Diagnosis onwards | 439 | 57 (12) | NR | 61 | 47% | Private | 55% of households earned < AUD 40,000 per year | Cross-sectional | Adults diagnosed or treated for cancer at the Townsville Hospital Cancer Centre |
| Newton | 2018 | Australia | Diagnosis | 400 | 64 (11) | 53% over 65 | 49 | 100% | Any | AUD 919 weekly per household | Cross-sectional | Cancer patients who resided in rural regions of Western Australia |
| Action Study Group | 2015 | Cambodia, Indonesia, Laos, Malaysia, Myanmar, Philippines, Thailand, Vietnam | Treatment (post-surgery) | 4584 | 51 | 13% over 65 | 72 | 44% | Any | NR | Prospective cohort study | All cancer patients with planned surgery |
| Yu | 2015 | Canada | Palliative care | 186 | NR | 61% over 70 | 54.84 | 100% | Public | NR | Cohort | End of life |
| Dumont | 2015 | Canada | Palliative care | 252 | 58 | NR | 73 | 100% | Public | NR | Longitudinal, prospective design with repeated measures | Patients enrolled in a regional palliative care program and their main informal caregivers |
| Longo | 2011 | Canada | Treatment onwards | 282 | 61.6 | NR | 47 | 100% | Public | 11% of households earned < USD 20,000 CAD per year | Cross-sectional design | Urban and rural patients in 5 of the 8 cancer clinics in the province of Ontario |
| Wenhui | 2017 | China | Treatment | 2091 | 63 | NR | NR | 100% | Any | NR | Cohort | NR |
| Koskinen | 2019 | Finland | Diagnosis onwards | 1978 | 66 (26–96 range) | NR | 45 | 100% | Public | NR | Cross-sectional registry and survey study | Patients having either prostate, breast or colorectal cancer |
| Buttner | 2018 | Germany | Treatment onwards | 502 | 46 (8) | 0% | 46.6 | 100% | Any | 33.3% households earned <USD 1000 Euros per year | Prospective cohort study | Working age cancer patients |
| Mahal | 2013 | India | Diagnosis onwards | 821 | NR | NR | NR | 3.41% | Private | NR | Cross-sectional survey | Household with at least one person living with cancer, or hospitalized due to cancer |
| Collins | 2017 | Ireland | Treatment onwards | 151 | Median 58 (range 20–79) | NR | 60 | NR | NR | NR | Retrospective cohort study | Cancer patients, 18 years or older |
| Baili | 2015 | Italy | Survivorship | 296 | NR | 17% over 80 | 59 | NR | NR | NR | Retrospective cohort study | Patients diagnosed between 2003 and 2007 |
| Isshiki | 2014 | Japan | Treatment | 521 | 63 | NR | NR | NR | NR | NR | Observational descriptive study | Cancer patients receiving anti-cancer treatment |
| Action Study Group | 2016 | Singapore, Brunei, Malaysia, Thailand, Indonesia, Philippines, Vietnam, Laos, Cambodia, Myanmar | Diagnosis onwards | 9513 | Median 52 (IQR = 26) | NR | 37 | 43 | Any | 41% of households earn 0–75% of mean national income | Prospective cohort | Newly diagnosed adult cancer patients recruited from 47 public and private hospitals |
| Marti | 2015 | UK | Survivorship | 298 | NR | 56% | 55 | 100% | Public | NR | Prospective cohort study | Patients diagnosed with potentially curable breast, colorectal or prostate cancer |
| Bernard | 2011 | USA | Treatment onwards | 4110 | NR | 43% over 55 | 62 | 94% | Any | USD 62,026 year in 2004 per household | Case–control | Persons 18 to 64 years of age who received treatment for cancer |
| Chino | 2018 | USA | Treatment | 245 | Median 60—Range 27–91 | NR | 55 | 100% | Any | NR | Retrospective cohort study | Patients with solid tumour cancers receiving chemotherapy or hormonal therapy |
| Colby | 2011 | USA | Treatment | 329 | NR | NR | 94.9 | 100% | Public | NR | Retrospective cohort study | Cancer patients who discontinued medication |
| Davidoff | 2012 | USA | Diagnosis onwards | 1868 | NR | 94% over 65 | 49 | 100% | Public | USD 35,356 per year per patient | Retrospective, observational study | Medicare beneficiaries with newly diagnosed cancer |
| Dusetzina | 2017 | USA | Treatment | 63,780 | NR | NR | 57.2 | 100% | Any | NR | Retrospective, observational study | Patients aged 18 through 64 years who had prescription drug coverage |
| Dusetzina | 2016 | USA | Treatment | 3344 | NR | NR | NR | 100% | Any | NR | Retrospective, observational study | Orally administered anticancer medications |
| Finkelstein | 2009 | USA | Treatment onwards | 679 | 50 (10.1) | NR | 69 | 79.80% | Any | USD 49,240 per year per household | Retrospective, observational study | Working age cancer patients (age 25–64) |
| Guy | 2018 | USA | Diagnosis onwards | 4271 | NR | 65% over 50 | 65 | 89.30% | Any | NR | Retrospective observational study | Adults with a cancer diagnosis |
| Houts | 1984 | USA | Treatment | 139 | 57 | NR | 66 | NR | NR | NR | Prospective observational study | Patients receiving outpatient chemotherapy treatments in seven oncology practices |
| John | 2016 | USA | Survivorship | 2977 | 61.9 (0.8) | 44.7% over 65 | 48 | 94% | Any | NR | Cross-sectional | Adults who self-reported ever having received any cancer diagnosis |
| Kircher | 2014 | USA | Treatment | 6607 | 70.1 (0.2) | NR | 48 | 100% | Any | NR | Case–control | Individuals aged over 55 years with cancer coded in the condition file in MEPS |
| Langa | 2004 | USA | Treatment onwards | 988 | 80 (0.3) | 100% | 54 | 100% | Public | NR | Observational descriptive study | Cancer patients over 70 years old |
| Narang | 2016 | USA | Diagnosis onwards | 1409 | Median 73 (IQR 69–79) | NR | 46.4 | 100% | Any | 25% of households earned < USD 22,380 per year | Prospective cohort study | US residents older than 50 years |
| Raborn | 2012 | USA | Treatment | 6094 | 53 (13) | NR | 54.4 | 100% | Any | NR | A retrospective claims-based analysis | Patients over 18 years with at least one claim of an oral oncolytic therapy |
| Shih | 2015 | USA | Treatment | 200,168 | 52 | NR | NR | 100% | Private | NR | Cohort | Patients undergoing chemotherapy, in Lifelink Health Plan Claims Database |
| Shih | 2017 | USA | Treatment | 42,111 | 72.17 (9.93) | 100% over 65 | 50.9 | 100% | Private | NR | Cohort | Medicare beneficiaries, insured |
| Stommel | 1992 | USA | Treatment | 192 | 58.7 (12.2) | NR | 49.5 | NR | NR | USD 34,473 per household per year | Cross-sectional | Study sample had at least one dependent in an activity of daily living and caregiver |
| Tangka | 2010 | USA | NR | 24,654 | NR | NR | NR | 100% | Any | NR | Cohort | Panel survey population |
| Tomic | 2013 | USA | Treatment | 28,979 | 59 (12) | 29% over 65 | 71 | 100% | Any | NR | Cohort | Adult patients who received chemotherapy and granulocyte colony-stimulating factors in the outpatient setting in the United States |
| Kaisaeng | 2014 | USA | Treatment | 3781 | 75 (7) | NR | 97 | 100% | Public | NR | Cross-sectional | Medicare beneficiaries who filled a prescription for imatinib, erlotinib, anastrozole, letrozole, or thalidomide during 2008. |
| Markman | 2010 | USA | NR | 1767 | NR | 42% | 58 | NR | NR | 7% of households earned < USD 20,000 per year | Observational descriptive study | Breast, colon, lung, and prostate cancer who joined the NexCura program |
| Jung | 2018 | USA | Treatment | 148,265 | 76 (7.3) | NR | 51 | 100% | Public | USD 61,317 per year | Natural experimental design | Elderly Medicare beneficiaries with cancer |
| Chang | 2004 | USA | Diagnosis onwards | 58 | 67 (12) | NR | 30 | 100% | Any | NR | Retrospective matched-cohort control | Individuals insured by private or Medicare supplemental health plans |
| All cancer (pediatric) | ||||||||||||
| Cohn | 2003 | Australia | Diagnosis onwards | 100 | 8.9 (range 0.8–18) | 0% | 50 | 100% | Any | NR | Cross-sectional | Children with cancer and their families |
| Tsimicalis | 2013 | Canada | Treatment | 78 | 37.38 (parents) | NR | NR | 100% | Public | Assumed: USD 73,500 per household per year | Cohort, cost of illness | Convenience sample |
| Tsimicalis | 2012 | Canada | Treatment | 99 | 7.85 (5.28) | NR | NR | 100% | Public | Assumed: USD 73,500 per household per year | Cohort, cost of illness | Convenience sample |
| Ahuja | 2019 | India | Diagnosis onwards | 11 | NR | NR | NR | NR | NR | NR | Prospective cohort | Children with cancer and their families |
| Sneha | 2017 | India | Treatment | 70 | 7.8 (2.2) | 0% | 31 | 0% | Private | 15% of households earned< 60,000 Rs. per year | Cross-sectional | Clinical setting |
| Ghatak | 2016 | India | Treatment onwards | 50 | 5.6 (2.9) | 0 | 24 | NR | NR | 239 USD per month per household | Prospective observational study | Families with children with acute lymphoblastic leukemia |
| Bloom | 1985 | USA | Diagnosis onwards | 569 | NR | NR | NR | NR | NR | USD 25,790 annual family income | Retrospective observational study | Children with malignant neoplasms |
| Lansky | 1979 | USA | Treatment | 70 | 7 (4.5) | 0 | 34 | NR | NR | USD 13,500 | Prospective cohort study | Parents of children in treatment for cancer by the pediatric hematology department |
| Breast | ||||||||||||
| Boyages | 2016 | Australia | Treatment | 361 | NR | 56% over 55 | 100 | NR | NR | 20.6% households earned < USD 45,000 (AUD 2016) per year | Cross-sectional | Females with primary stage I, II, or III breast cancer; had completed treatment at least 1 year prior to recruitment; and fluent in English |
| Gordon | 2007 | Australia | Diagnosis onwards | 287 | 57 (9.6) | 62% over 50 | 100 | 70% | Private | 29% of patients earned < USD 26,000 AUD per year | Longitudinal, population-based study | Women with breast cancer 0–18 months post-diagnosis |
| Housser | 2013 | Canada | Treatment onwards | 301 | NR | 47% over 65 | 43 | 64.60% | Private | 14.1% of patients earned less than CAD 20,000 per year | Observational descriptive study | 19 years of age or older, residents of Newfoundland, and diagnosed with breast or prostate cancer |
| Lauzier | 2012 | Canada | Diagnosis-treatment | 1191 | NR | 31.60% | 67 | 100% | Public | 58% of households earned < USD 50,000 per year | Prospective cohort study | Women with breast cancer and their spouses |
| Liao | 2017 | China | Diagnosis-treatment | 2746 | 49.6 | 7% over 65 | 100 | 100% | Any | USD 8722 | Multicentre cross-sectional study | Patients with breast cancer diagnosis at a hospital affiliated with the CanSPUC project |
| O’Neill | 2015 | Haiti | Diagnosis onwards | 61 | 49 (9.8) | NR | 98 | NR | NR | USD 1333 per year per patient | Cross-sectional | Patients from Hopital Universitaire de Mirebalais |
| Bargallo-Rocha | 2017 | Mexico | Treatment | 69 | Median 56 (IQR 11.5) | NR | 100 | NR | NR | USD 548 in Mexico/ month | Cross-sectional | Female patients who underwent breast cancer surgery |
| Bekelman | 2014 | USA | Treatment | 15,643 | NR | 34.2 | 100 | 100% | Private | 13.5% households earned <USD 40,000/year | Retrospective observational study | Women with breast cancer with breast conserving surgery |
| Chin | 2018 | USA | Treatment | 6900 | NR | 21% | 100 | 100% | Public | NR | Retrospective cohort study | Female patients aged 18 to 64 years |
| Dean | 2018 | USA | Survivorship | 129 | 65 (8) | NR | 100 | 98% | Any | 13% patients earned <USD 30,000 per year | Prospective, longitudinal study | Women with stages I–III invasive breast cancer, completion of active breast cancer treatment, > 1 lymph node removed |
| Farias | 2018 | USA | Treatment | 6863 | NR | 17.30% | 100 | 100% | Private | NR | Retrospective, observational study | Women under the age of 64 with at least 1 prescription claim |
| Giordano | 2016 | USA | Diagnosis onwards | 14,643 | Median 54 | 12.2% over 65 | 100 | 100% | Any | NR | Observational Cohort Study | Women aged over 18 years with breast cancer diagnosed between 2008 and 2012 |
| Jagsi | 2014 | USA | Diagnosis onwards | 1502 | NR | 28% over 65 | 100 | NR | NR | USD 50,000 per year | Longitudinal cohort study | Patients age 20 to 79 years diagnosed with stage 0 to III breast cancer |
| Jagsi | 2018 | USA | Diagnosis onwards | 2502 | NR | 57% | 100 | 95% | Any | 37% of households earned < USD 40,000 per year | Cross-sectional survey | Patients with early stage breast cancer |
| Leopold | 2018 | USA | Treatment—end of life | 5364 | NR | 58% over 50 | 100 | 100% | Any | USD 50,054 | Longitudinal time series | Insured women with metastatic breast cancer |
| Pisu | 2016 | USA | Survivorship | 432 | NR | 47.7% over 65 | 100 | 94% | Public | 19.3% lowest income (<20,000 per year) | Prospective cohort study | Stage 0–III breast cancer, within the first three years after completing primary cancer treatment |
| Pisu | 2011 | USA | Survivorship | 261 | NR | 16% over 65 | 100 | NR | NR | 11.5% lowest income (<20,000 per year) | Cross-sectional | Patients diagnosed with stage I–II breast cancer, with a minimum of 1 month after treatment completion |
| Roberts | 2015 | USA | Treatment | 18,575 | 53.6 (7.5) | NR | 100 | 100% | Private | NR | A retrospective claims-based analysis | Women (ages 18–64) with at least two health encounter claims for breast cancer |
| Leukemia | ||||||||||||
| Kodama | 2012 | Japan | Treatment | 577 | Median 61 (15–94 range) | NR | 35 | 100% | Public | USD 36,731 USD per year | Observational descriptive study | Patients with CML who were prescribed imatinib |
| Wang | 2014 | Singapore | Treatment | 367 | NR | 8% over 61 | 62.1 | NR | NR | NR | Cohort | Secondary analysis of a prospective study |
| Darkow | 2012 | USA | Treatment | 995 | 62 | NR | 47 | 100% | Any | NR | Retrospective cohort study | Adult patients (aged >18 years) with an initial diagnosis of CML during 1997 to 2009 |
| Doshi | 2016 | USA | Diagnosis onwards | 1053 | 73 (8) | 96% over 65 | 47 | 100% | Public | NR | A retrospective claims-based analysis | Medicare patients with newly diagnosed CML |
| Dusetzina | 2014 | USA | Treatment | 1541 | 48(11) | NR | 45 | 100% | Any | NR | Retrospective, observational study | Adults (age 18 to 64 years) with CML who initiated imatinib therapy |
| Goodwin | 2013 | USA | Treatment onwards | 1015 | 61 (9.2) | NR | 39 | 97% | Any | NR | Observational descriptive study | Patients who had received intensive treatment for MM at the study site |
| Gupta | 2018 | USA | Treatment | 162 | 56 (13) | NR | 49 | 97% | Any | 42% patients earned less than USD 50,000 USD per year | Cross-sectional | Adult patients with MM taking medication |
| Shen | 2017 | USA | Treatment | 898 | 70 (12) | NR | 47 | 38% | Public | NR | Retrospective cohort study | Patients with Chronic Myeloid Leukemia Taking Targeted Oral Anticancer Medications |
| Olszewski | 2017 | USA | Treatment | 3038 | Median76 (IQR 71–82) | NR | 50 | 100% | Public | USD 29,700 per year | Observational descriptive study | Patients with Part D coverage at diagnosis |
| Colorectal | ||||||||||||
| Huang | 2017 | China | Diagnosis onwards | 2356 | 57.4 | 28.3% over 65 | 43 | 100% | Any | CNY 54,525 per patient per year | Cross-sectional survey | Primary prevalent CRC patients undergoing treatment in hospitals |
| Hanly | 2013 | Ireland | Diagnosis and treatment | 154 | NR | 60% over 55 | 82 | NR | NR | NR | Retrospective observational study | Carers of colorectal cancer patients |
| O Ceilleachair | 2017 | Ireland | Survivorship | 497 | 67 | 46% over 70 | 38 | 52% | Private | NR | Case report | All cases of primary, invasive colorectal cancer in Ireland diagnosed October 2007–September 2009 |
| Shiroiwa | 2010 | Japan | Treatment | 1319 | NR | NR | NR | 100% | Public | NR | RCT, EE | Trial population, XELOX or XELOX plus bevacizumab and second-line therapy with XELOX |
| Azzani | 2016 | Malaysia | Diagnosis onwards | 138 | Median 63 (IQR = 19) | 35.5% over 70 | 49 | 9% | Private | 2000 RM/month | Prospective, longitudinal study | CRC patients seeking treatment at the University of Malaya Medical Centre (UMMC) in the first year following diagnosis |
| Sculpher | 2000 | UK | Treatment | 495 | 61 | NR | 36 | NR | NR | NR | Randomized-controlled trial | Colorectal cancer patients treated with Raltitrexed or Fluorouracil |
| Lung | ||||||||||||
| Ezeife | 2018 | Canada | Treatment—Palliative care | 200 | NR | 50% over 65 | 56 | 45.10% | Private | USD 41,000-USD 80,000 CAD | Cross-sectional | Patients with advanced lung cancer (stage IIIB/IV) |
| Andreas | 2018 | France, Germany and the United Kingdom | Treatment onwards | 831 | NR | 67% | 38 | 100% | Public | NR | Retrospective observational study | Patients ≥18 years of age that had undergone complete resection of stage IB-IIIA NSCLC |
| Wood | 2019 | France, Germany, Italy | Treatment | 1457 | 64.5 (10.1) | NR | 34.1 | NR | NR | NR | Cross-sectional | NR |
| Van Houtven | 2010 | USA | Initial treatment, Continuing, Terminal, overall | 1629 | NR | 42.1% over 65 | 75.8 | 100% | Any | USD 39,554 per year per household | Cross-sectional | Informal caregivers—Patients participating in the Share Thoughts on Care survey |
| Hess | 2017 | USA | Diagnosis onwards | 47,207 | 65 (10.4) | NR | 45 | 100% | Any | NR | Retrospective observational study | 18 years of age or older at the time of initial diagnosis of lung cancer |
| Head and neck | ||||||||||||
| Burns | 2017 | Australia | Survivorship-integrated care | 82 | 65 (7.4) | NR | 26 | NR | NR | NR | Randomized-controlled trial | Patients with head and neck cancer enrolled in speech pathology programs |
| Chauhan | 2018 | India | Treatment | 410 | NR | NR | NR | NR | NR | NR | Retrospective observational study | Head and cancer patients undergoing radiotherapy |
| de Souza | 2017 | USA | Treatment onwards | 73 | 60 (26–79) | NR | 21.9 | 100% | Any | USD 81,597 per year per household | Prospective observational study | Head and neck cancer patients with locally advanced stage |
| Massa | 2019 | USA | Diagnosis onwards | 16,771 | 65 (95CI 63.1–66.8) | NR | 35.5 | 97.40% | Any | USD 24,056 | Case control | Adult patients with cancer |
| Prostate | ||||||||||||
| Gordon | 2015 | Australia | Diagnosis onwards | 289 | 65 (8.4) | 78% | 0 | 71% | Private | 38% households had incomes between USD 37,000 and AUD 80,000 per year | Cross-sectional | Men who self-reported they had previously been diagnosed with prostate cancer |
| de Oliveira | 2013 | Canada | Survivorship | 585 | 73 | 92.50% | 0 | 100% | Public | 40% earned <USD 40,000 per year | Retrospective, observational study | All patients initially diagnosed with PC in 1993–1994, 1997–1998, and 2001–2002 |
| Geynisman | 2018 | USA | Treatment | 116 | 65 (range 27–88) | NR | 15 | 98% | Any | NR | Retrospective, observational study | Advanced renal and prostate cancer patients |
| Jayadevappa | 2010 | USA | Diagnosis—Treatment | 512 | 59 (6.3) | NR | 0 | NR | NR | 19% of patients earned < USD 40,000 per year | Prospective cohort study | 45 years of age, newly diagnosed with PCa within the prior 4 months and yet to initiate\ treatment |
| Skin | ||||||||||||
| Gordon | 2018 | Australia | Treatment onwards | 419 | 55 | NR | 54 | 74% | Private | NR | Retrospective, observational study | Consenting Qskin study participants |
| Gordon | 2018 | Australia | Treatment onwards | 539 | 56 | NR | 64 | NR | NR | NR | Retrospective, observational study | Consenting Qskin study participants |
| Thompson | 2019 | Australia | Treatment | 8613 | NR | NR | NR | 100% | Public | NR | Cohort | Admin data linked to study population |
| Grange | 2017 | France, Germany and the United Kingdom | Survivorship and Palliative care | 558 | NR | 54.50% | 44 | 100% | Public | NR | Retrospective observational study | Patients with advanced melanoma |
| Ovarian | ||||||||||||
| Bercow | 2018 | USA | Diagnosis onwards | 5031 | NR | 41.40% | 100 | 100% | Private | NR | Retrospective cohort study | Ovarian cancer patients enrolled in commercial insurance sponsored by over 100 employers in the United States |
| Calhoun | 2001 | USA | Treatment | 83 | NR | NR | 100 | NR | NR | NR | Prospective cohort study | Ovarian cancer patients who experienced chemotherapy-associated hematologic or neurologic toxicities |
| Suidan | 2019 | USA | Treatment | 12,761 | NR | 44% | 100 | 100% | Private | NR | Cohort | All ovarian cancer patients in MartketScan database undergoing first line treatment |
| Pancreatic | ||||||||||||
| Basavaiah | 2018 | India | Treatment | 98 | 54.5 (10–87 range) | 41.8% over 60 | 33 | 29.60% | Any | NR | Prospective cohort | Patients undergoing pancreatic-duodenectomy |
| Bao | 2018 | USA | End-of-life | 3825 | NR | 100% | 55 | 100% | Public | NR | Retrospective cohort study | Patients 66 years or older when diagnosed with Stage IV pancreatic cancer in 2006–2011 |
| Anal | ||||||||||||
| Chin | 2017 | USA | Treatment | 1025 | NR | NR | 65 | 100% | Public | NR | Retrospective cohort study | Patients with anal cancer treated with Intensity-modulated radiotherapy |
| Brain | ||||||||||||
| Kumthekar | 2014 | USA | Treatment | 43 | Median 57 (range 24–73) | NR | 42 | 95% | Any | USD 75,000 per year | Prospective observational study | Patients within 6 months of diagnosis or tumor recurrence |
AUD = Australian dollar; CML = chronic myeloid leukemia; CNY = Chinese Yuan; NSCLC = Non-small-cell lung carcinoma; IQR = interquartile range; MM = multiple myeloma; NR = not reported; RM = Renminbi; Rs. Rupees; SD = standard deviation; USD = United States Dollar.
Table 2.
Out-of-pocket estimates.
| First Author | Year | Definition of out-of-Pocket Cost | Total out-of-Pocket Cost Estimate (Mean—SD) | Time Frame of out-of-Pocket Estimate | Out-of-Pocket as % of Income | Currency | Currency Year |
|---|---|---|---|---|---|---|---|
| The Action Study Group | 2016 | Financial catastrophe was defined as OOP costs at 12 months exceeding 30% of annual household income | NR | 3- and 12-month follow-ups | 48% of cancer patients reported Financial catastrophe at 12 months | NR | NR |
| The Action Study Group | 2015 | Financial catastrophe (out-of-pocket costs of >30% of annual household income) | NR | 3 months | 31% of participants incurred Financial catastrophe | NR | 2015 |
| Ahuja | 2019 | Direct costs incurred by families of children being treated for cancer | 651 (356) | 14 weeks | NR | USD | 2013 |
| Andreas | 2018 | Cost of childcare, and non-reimbursed transportation costs incurred by the patient or their family/friends. | UK = 7 | 1 month | NR | Euro | 2013 |
| Germany = 6 | |||||||
| France = 0 | |||||||
| Azzani | 2016 | Payments for expenses such as hospital stays, tests, treatment, travel and food. | 8306 | 1 year | 42% of the median annual income in Malaysia. | RM | 2013 |
| Baili | 2015 | Direct expenses which were not entirely covered or only partially covered by the NHS | 160 (372) | 1 month | NR | Euro | 2015 |
| Bao | 2018 | Costs incurred by patients 30 days before death | 1930 (with chemotherapy) | 1 month | NR | USD | 2011 |
| Bargallo-Rocha | 2017 | Patient borne costs on transportation, housing, and salary due to breast cancer | 535 | 1 month | NR | USD | 2017 |
| Basavaiah | 2018 | Catastrophic expenditure was defined as the percentage of households in which OOP health payments exceeded 10% of the total household income | NR | From the first hospital visit to postoperative recovery | A total of 76.5% of the sample incurred catastrophic expenditure | USD | 2015 |
| Bates | 2018 | Patient co-payments for primary healthcare and prescription pharmaceuticals | 1000 (2000) | 1 year | NR | AUD | 2017 |
| Bekelman | 2014 | Summing deductible, co-payment, and coinsurance amounts. | 3421 (95% CI 3158–3706) | 1 year | NR | USD | 2013 |
| Bercow | 2018 | Out-of-pocket (OOP) payment was calculated as the sum of deductibles, copayments, and coinsurance | Median 2988 (IQR 1649–5088) | 1 year | NR | USD | 2013 |
| BerNRrd | 2011 | OOP expenditures on health insurance premiums in addition to OOP expenditures on healthcare services | 4772 | NR | 6% | USD | 2008 |
| Bloom | 1985 | Direct medical and nonmedical expenses borne by the family | 9787 | 1 year | 37.7% of family income | USD | 1981 |
| Boyages | 2016 | The financial cost of lymphedema care borne by women | 977 | 1 year | NR | AUD | 2014 |
| Burns | 2017 | Costs associated with return travel to the regional speech pathology service | 256 | NR | NR | AUD | 2015 |
| Buttner | 2018 | Direct payments for health services or treatments which are not covered by health insurance and need to be paid by the patients themselves | 205 (346) | 3 months | NR | Euro | 2018 |
| Calhoun | 2001 | Direct medical costs borne by patients | 3302 | 3 months | NR | USD | 2001 |
| Callander | 2019 | Patient co-payments for primary healthcare and prescription pharmaceuticals | 1191 (3099) | 1 year | NR | AUD | 2017 |
| Chang | 2004 | Copays and deductibles to caregivers | 302 (634) | 1 month | NR | USD | 2004 |
| Chauhan | 2018 | Only the direct OOP expenditure was assessed | 849 | NR | NR | USD | 2015 |
| Chin | 2018 | Copayments for oral anticancer medication | 19 | 1 month | NR | USD | 2014 |
| Chin | 2017 | The sum of Medicare Part A and Part B reimbursements, third-party payer reimbursements, and patient liability amounts | Median 6967 (5226–9076) | 1 year | NR | USD | 2011 |
| Chino | 2018 | Insurance premiums; medication copays; physician office charges; copays for procedures, tests, and studies; and costs related to travel for treatment | Median 393 (Range—0–26,586) | 1 month | 7.80% | USD | 2018 |
| Cohn | 2003 | Travel, accommodation, and communication costs | 19,604 (32,976) | 40 months | NR | AUD | 2003 |
| Colby | 2011 | Patient spending on ani cancer drugs | 645 | 3 months | NR | USD | 2011 |
| Collins | 2017 | Personal expenditure on regular and non-regular indirect costs during treatment. | 1138 (range 21–7089) | 1 month | NR | EUR | 2017 |
| Darkow | 2012 | Copayment for anti cancer medication | 124 | 1 month | NR | USD | 2012 |
| Davidoff | 2012 | Costs incurred by patients | 4727 (202) | 2 years | 23.90% | USD | 2007 |
| de Oliveira | 2013 | Medical costs associated with health Professional visits, and nonmedical costs such as travel, parking, food, and accommodation | 200 (95% CI USD 109–290) | 1 year | 10% | CAD | 2006 |
| de Souza | 2017 | Insurance premiums; deductibles; direct medical costs | 805 (range 6–10,156) | 1 month | 15.10% | USD | 2017 |
| Dean | 2018 | Co-payments for outpatient physician visits, physical and occupational therapy visits, complementary and integrative therapy visits | 2306 | 1 year | NR | USD | 2015 |
| Doshi | 2016 | Direct medical costs borne by patients | 2600 | 1 month | NR | NR | 2016 |
| Dumont | 2015 | NR | 576 (46) | 6 months | NR | CAD | 2015 |
| Dusetzina | 2017 | Copayment, coinsurance, and deductibles, adjusting to reflect spending on a median monthly dosage | 143 | 1 month | NR | USD | 2012 |
| Dusetzina | 2016 | Copayments for orally administered anticancer medications | 310 | 1 month | NR | USD | 2014 |
| Dusetzina | 2014 | Monthly copayments for imatinib | 108 (301) | 1 month | NR | USD | 2011 |
| Ezeife | 2018 | Expenses for prescription drugs, travel, childcare/babysitting, copayments, and deductibles | Median 1000–5000 | 1 year | From 2–12% (median) | CAD | 2018 |
| Farias | 2018 | Sum of the copayments, deductibles, and coinsurance paid for AET medication | 193 (97) | 1 month | NR | USD | 2018 |
| Finkelstein | 2009 | Copayments, deductibles, and payments for noncovered services | 1730 (2710) | 1 year | NR | USD | 2005 |
| Geynisman | 2018 | Co-pays for oral anti cancer medications | 81.26 | 1 month | NR | USD | 2018 |
| Ghatak | 2016 | Direct medical, living (rent, food, clothes), and transport costs | Median 524 (395–777 IQR) | 1 month | 3.5 times–7 times the monthly income | USD | 2013 |
| Giordano | 2016 | Drug and insurance-related costs borne by patients | 3226 | 18 months | NR | USD | 2013 |
| Goodwin | 2013 | Direct and indirect patient expenditure | NR | 1 year | 38% and 31% annually for patients receiving/not receiving chemotherapy, respectively. | NR | 2013 |
| Gordon | 2007 | Direct costs (garments and aids), health services (e.g., co-payments, pharmaceuticals) and paid home services | 1937 (3210) | 18 months | NR | USD | 2005 |
| Gordon | 2018 | Melanoma treatment costs borne by patients | 625 (575) | 3 years | NR | AUD | 2016 |
| Gordon | 2018 | Medical expenses for Medicare services borne by patients | 3514 (4325) | 2 years | NR | AUD | 2016 |
| Gordon | 2009 | Medical and non-medical costs borne by patients | 4826 (5852) | 16 months | NR | AUD | 2008 |
| Gordon | 2015 | Medical and non-medical costs borne by patients | 9205 (14,567) | 16 months | NR | AUD | 2012 |
| Grange | 2017 | Childcare and non-reimbursed transportation costs | France = 0 | 1 month | NR | EUR | 2013 |
| Germany = 332 (95% CI 271–401) | |||||||
| UK = 533 (477–594) | |||||||
| Gupta | 2018 | Costs for doctor visits, prescriptions, over-the-counter medications, transportation | 709 (1307) | 3 months | NR | USD | 2018 |
| Guy | 2018 | Expenditures toward any healthcare service, such as coinsurance, copayments, and deductibles | 2171 (95% CI 1970–2373) | 1 year | 4.3% had OOP > 20% of household income | USD | 2012 |
| Hanly | 2013 | Parking, meals and accommodation, domestic-related caring activities | 79.2 (151) | 1 week | NR | EUR | 2008 |
| Hess | 2017 | Copayments, deductibles and patient borne costs | 315 (95% CI 106–523) | 1 month | NR | USD | 2014 |
| Housser | 2013 | Costs not covered by insurance or assistance programs | Prostate: 910 (1025) Breast: 864 (1220) | 3 months | 17% had OOPC >7.5% of income (16% prostate, 19% breast) | CAD | 2008 |
| Houts | 1984 | Nonmedical expenses borne by patients | Median 21 (0–204 range) | 1 week | 28% of respondents were spending over 25% of their weekly incomes | USD | 1984 |
| Huang | 2017 | Overall medical and non-medical expenditure | 32,649 | 1 year | 59.9% of their previous-year household income | CNY | 2014 |
| Isshiki | 2014 | Travel/transport costs per outpatient treatment | 79 | 1 month | NR | USD | 2014 |
| Jagsi | 2014 | Medical expenses related to breast cancer, including copayments, hospital bills, and medication costs | Median <2000 | 4 years | NR | USD | 2014 |
| Jagsi | 2018 | Medical and non-medical expenses related to breast cancer (including copayments, hospital bills, and medication costs) | Median <2000 | NR | 17% of patients reported spending ≥10% of household income on out-of-pocket medical expenses | USD | 2018 |
| Jayadevappa | 2010 | Medication and non-medical costs paid by patients | 703 (2500) | 3 months | NR | USD | 2010 |
| Jung | 2018 | Costs of specialty cancer drugs paid by patients | 3860 (1699) | 1 year | NR | USD | 2013 |
| John | 2016 | Alternative medicine costs borne by patients and not covered by insurance | 445 | 1 year | NR | USD | 2012 |
| Kaisaeng | 2014 | Copayments for oral anti cancer drugs | 154 (407) | 1 month | NR | USD | 2008 |
| Kircher | 2014 | Direct payment for all prescription drugs | 724 (42) | NR | NR | USD | 2010 |
| Kodama | 2012 | Copayment for medical expenses | Median 11,548 | 1 year | NR | USD | 2008 |
| Koskinen | 2019 | Out of pocket fees for outpatient visits, inpatient care, home care, and surgical procedures | 280 (603 for palliative care—383 metastatic disease—224 remission—264 rehabilitation—263 treatment) | 6 months | NR | Euro | 2010 |
| Kumthekar | 2014 | Medical and nonmedical expenses that were not reimbursed by insurance | 2451 (2521) | 1 month | NR | USD | 2014 |
| Langa | 2004 | Cost paid by patients on hospital services, outpatient care, home care, and medication | 4656 (3890) | 1 year | NR | USD | 1995 |
| Lansky | 1979 | Non-medical costs paid by the patient’s family | 56 (54) | 1 week | 26% of weekly income | USD | 1979 |
| Lauzier | 2012 | Costs for treatments and follow-up, consultations with other practitioners, home help, clothing, and natural health products | 1365 (1238) | 1 year | Out-of-pocket costs represented an average of 2.3% of annual family income | CAD | 2003 |
| Leopold | 2018 | Patient expenditures including coinsurance, copayment, and deductible amounts | 4247—95% CI (3956–4538) among low deductible health plan | 1 year | 13% of the 2011 real median income household | USD | 2012 |
| 6642—95% CI (6268–7016) among High deductible health plan | |||||||
| Liao | 2017 | Medical expenditure (self-pay and healthcare costs), non-medical expenditure (i.e., transportation, accommodation) | 8449 | Since diagnosis to treatment | 49% (overall OOP expenditure/annual income) | USD | 2014 |
| Longo | 2011 | Patient borne costs | Breast 392 (830) | 1 month | NR | CAD | 2001 |
| Other 149 (265) | |||||||
| Mahal | 2013 | Patient medical and non-medical spending | 5311 (4514–6108 95CI) | 1 year | NR | INR | 2004 |
| Markman | 2010 | Cancer related costs paid by patients | 12% spent between USD 10,000–25,000 | Since diagnosis | NR | USD | 2010 |
| 4% spent between USD 25,000–50,000 | |||||||
| 2% spent between USD 50,000–100,000 | |||||||
| Marti | 2015 | Medical and non-medical costs borne by patients, such as medications, travel, and childcare | Full Sample 39.8 (95% CI 14.5–65.3) | 3 months | NR | USD | 2012 |
| Colorectal 52 (22–126) | |||||||
| Breast 49 (12–86) | |||||||
| Prostate 11 (3–19) | |||||||
| Massa | 2019 | Total non-reimbursed cost of cancer patients | Median 929 (95% CI 775 to 1084) for HNC | 1 year | Median 3.93% of total income spent on OOP (95% CI 3.21 to 4.65) | USD | 2014 |
| 918 (885 to 951) for other cancer | |||||||
| Narang | 2016 | Costs paid by patients on inpatient hospitalization, nursing homes, clinic visits, outpatient surgery | 3737 average | 1 year | Uninsured: 23% | USD | 2012 |
| 2116 Medicaid | Medicaid: 8.5% | ||||||
| 5492 employer-sponsored insurance | Employer-sponsored insurance: 12.6% | ||||||
| 8115 uninsured | NR | ||||||
| Newton | 2018 | Direct medical and nonmedical expenses borne by the patient | 2179 (3077) (95% CI 1873–2518) | 21 weeks | 11% spent over 10% of household income | AUD | 2016 |
| O Ceilleachair | 2017 | OOPCs survivors had incurred as a result of their diagnosis, and which were not recouped from PHI or other sources | 1589 (3827) | 1 year | NR | Euro | 2008 |
| Olszewski | 2017 | Patient’s cost sharing on medication | No low-income subsidy: median 5623 (IQR 3882–9437) | 1 year | 23% of annual income among non-subsidized | USD | 2012 |
| Low-income subsidy: median 6 (IQR 3–10) | |||||||
| O-Neill | 2015 | Medical and nonmedical costs related to the hospital visit coinciding with the interview | 717 (95% CI 619–1171) | 1 year | >67% patients had catastrophic expenses (>40% of household income) | USD | 2014 |
| Pisu | 2016 | Out of pocket costs for medical care | Total at baseline: 232 (82) | 1 month | NR | USD | 2015 |
| Total at 3 months 186 (71) | |||||||
| Pisu | 2011 | Expenses since diagnosis, including monthly insurance premiums | Total: 316.1 (411.5) | 1 month | 31% for lowest income level (<20,000 per year) | USD | 2008 |
| Caucasian: 297 (296) | |||||||
| Minority: 204 (405) | |||||||
| Raborn | 2012 | Deductibles and co-payments for anticancer medication | Generic versions: 171 (652) | Per claim | NR | USD | 2009 |
| No available generic versions: 31 (130) | |||||||
| Roberts | 2015 | Deductibles, copayments, and coinsurance payments | 175 (484) | 1 year | NR | USD | 2012 |
| Sculpher | 2000 | Travel expenses for treatment appointments | Treated with Raltitrexed: 12.25 (41.87) Treated with Fluorouracil: 10.70 (20.16) | Per patient-journey | NR | GBP | 2000 |
| Shen | 2017 | Patient out of pocket expenses on targeted oral anti-cancer medications | Median 401 (IQR 1029) | 1 month | NR | USD | 2014 |
| Shih | 2015 | Patient OOP payments were calculated as allowed minus paid | USD 647 per month in 2011 | 1 month | NR | USD | 2011 |
| Shih | 2017 | Patient pay amount is the amount paid by beneficiaries that is not reimbursed by a third party; therefore, it captures the OOP payments for Medicare beneficiaries who are enrolled in the Part D program. | 850 | 1 month | NR | USD | 2012 |
| Shiroiwa | 2010 | Co-payment | Patients JPY 328,000 (95% CI: 323,000–334,000) | 11 months | NR | JPY | 2009 |
| Patients ≥ 70 years JPY 61,000 (95% CI: 60,000–63,000) | NR | ||||||
| Sneha | 2017 | Medical expenses and nonmedical out-of-pocket expenses incurred by the families in the course of care | NR | Per day | Non-medical expenses—Urban: 22% | INR | 2012 |
| Rural: 46% | |||||||
| Stommel | 1992 | Out-of-pocket payments for services: hospital and physician services, nursing homes, medications, visiting nurses, home health aides, and purchases of special equipment, supplies, and foods and supplements | 660 (624) | 3 months | NR | USD | 1993 |
| Suidan | 2019 | Patient out-of-pocket expenses, in addition to insurance payments made. | Neoadjuvant chemotherapy: USD 2519 | 8 months | NR | USD | 2017 |
| Primary debulking: USD 2977 | NR | ||||||
| Tangka | 2010 | OOP cost (inpatient, outpatient, other noninpatient (costs related to emergency room visits, home healthcare, vision aids, and other medical supplies), Rx) attributable to cancer = difference between expenditures for persons with cancer and persons without cancer, adjusted for sociodemographic and comorbidities | 3996 | 1 year | NR | USD | 2007 |
| Thompson | 2019 | Costs to items associated with the excision, including consultations, skin cancer treatment, Anatomical pathology, skin flaps and Anesthesia;Excluding bulk-billed patients were co-payment would be USD 0 | Private clinical rms: 80 (34, 170) | Treatment episode (up to 3 days post-discharge) | NR | AUD | 2018 |
| Public hospital: 35 (30, 104) | |||||||
| Private hospital: 350 (196, 596) | |||||||
| Tomic | 2013 | Out-of-pocket costs for G-CSF per patient | 100–150: pegfilgrastim 50–80: filgrastim | 3 months | NR | USD | 2010 |
| Tsimicalis | 2013 | Direct costs included health services, prescription medications, over-the-counter medications, complementary medicines, supplies, equipment, family medical fees and medications, as well as travel, food, communication, accommodations, moving or renovations, provider for the child with cancer, domestic labour (e.g., sibling child care), funeral, and other cost categories not yet captured in the literature | 730 (1520) | 3 months | NR | CDN | 2007 |
| Tsimicalis | 2012 | Direct costs as well as travel, food, communication, accommodations, moving or renovations, provider for the child with cancer, domestic labour (e.g., sibling childcare), funeral, and other costs | 5446 (6659) | 3 months | NR | CDN | 2007 |
| Van Houtven | 2010 | Out-of-pocket expenditures for the patient’s medical care as well as nonmedical expenditures | Overall: 1243 | By phase | NR | USD | 2005 |
| Initial: 921 | NR | ||||||
| Continuing: 1545 | NR | ||||||
| Terminal: 1015 | NR | ||||||
| Wang | 2014 | Ward charges, laboratory charges, radiology charges, prescription charges, surgical charges, and other charges | 2230 (95% CI: 1976–2483) | Per episode | NR | USD | 2012 |
| Wenhui | 2017 | NR | 1878 | NR | 51.6 | USD | 2008 |
| 1146 | NR | NR | |||||
| 348 | NR | NR | |||||
| Wood | 2019 | Direct out-of-pocket expenses were defined as wage losses (per week); non-medical expenses associated with general practitioner or hospital visits (in the last 3 months); costs of treatments for conditions linked to NSCLC (in the last week), such as those for pain or symptom relief; and other non-medical costs arising from the diagnosis (per week), including additional childcare costs, assistance at home (cleaner, housekeeper, gardener), and travel costs. | Patient: 823 Caregivers: 1019 | 3 months, reported as annual | NR | EUR | 2018 |
| Yu | 2015 | Out-of-pocket costs: costs paid by the patient/family for travel, supplies, medications, etc. | NR | Entire palliative trajectory | NR | CDN | 2012 |
AUD = Australian dollar; CAD = Canadian dollar; CI = confidence interval; CNY = Chinese yuan; GBP = Great Britain Pound; INR = Indian Rupee; IQR = interquartile range; JPY = Japanese Yen; NR = not reported; OOP = out-of-pocket; RM = Renminbi; SD = standard deviation; USD = United States Dollar.
Publisher’s Note: MDPI stays neutral with regard to jurisdictional claims in published maps and institutional affiliations. |
© 2021 by the authors. Licensee MDPI, Basel, Switzerland. This article is an open access article distributed under the terms and conditions of the Creative Commons Attribution (CC BY) license (http://creativecommons.org/licenses/by/4.0/).
Share and Cite
MDPI and ACS Style
Iragorri, N.; de Oliveira, C.; Fitzgerald, N.; Essue, B. The Out-of-Pocket Cost Burden of Cancer Care—A Systematic Literature Review. Curr. Oncol. 2021, 28, 1216-1248. https://0-doi-org.brum.beds.ac.uk/10.3390/curroncol28020117
AMA Style
Iragorri N, de Oliveira C, Fitzgerald N, Essue B. The Out-of-Pocket Cost Burden of Cancer Care—A Systematic Literature Review. Current Oncology. 2021; 28(2):1216-1248. https://0-doi-org.brum.beds.ac.uk/10.3390/curroncol28020117
Chicago/Turabian StyleIragorri, Nicolas, Claire de Oliveira, Natalie Fitzgerald, and Beverley Essue. 2021. "The Out-of-Pocket Cost Burden of Cancer Care—A Systematic Literature Review" Current Oncology 28, no. 2: 1216-1248. https://0-doi-org.brum.beds.ac.uk/10.3390/curroncol28020117