Article

Synaptotagmin 13 Is Highly Expressed in Estrogen Receptor-Positive Breast Cancer

1
Department of Breast and Endocrine Surgery, Nagoya University Graduate School of Medicine, 65 Tsurumai-cho, Showa-ku, Nagoya 466-8550, Japan
2
Department of Gastroenterological Surgery, Nagoya University Graduate School of Medicine, 65 Tsurumai-cho, Showa-ku, Nagoya 466-8550, Japan
*
Author to whom correspondence should be addressed.
Submission received: 17 September 2021 / Revised: 24 September 2021 / Accepted: 8 October 2021 / Published: 12 October 2021
(This article belongs to the Special Issue Translational Research in Breast Cancer Patients)

Abstract

:
Background: Accumulating evidence indicates tumor-promoting roles of synaptotagmin 13 (SYT13) in several cancers; however, no studies have investigated its expression in breast cancer (BC). This study aimed to clarify the significance of SYT13 in BC. Methods: SYT13 mRNA expression levels were evaluated in BC cell lines. Polymerase chain reaction (PCR) array analysis was conducted to determine the correlation between expression levels of SYT13 and other tumor-associated genes. Then, the association of SYT13 expression levels in the clinical BC specimens with patients’ clinicopathological factors was evaluated. These findings were subsequently validated using The Cancer Genome Atlas (TCGA) database. Results: Among 13 BC cell lines, estrogen receptor (ER)-positive cells showed higher SYT13 mRNA levels than ER-negative cells. PCR array analysis revealed positive correlations between SYT13 and several oncogenes predominantly expressed in ER-positive BC, such as estrogen receptor 1, AKT serine/threonine kinase 1, and cyclin-dependent kinases 4. In 165 patients, ER-positive specimens exhibited higher SYT13 mRNA expression levels than ER-negative specimens. The TCGA database analysis confirmed that patients with ER-positive BC expressed higher SYT13 levels than ER-negative patients. Conclusion: This study suggests that SYT13 is highly expressed in ER-positive BC cells and clinical specimens, and there is a positive association of SYT13 with the ER signaling pathways.

1. Introduction

Breast cancer (BC) is the most prevalent malignant tumor among women [1]. Although the prognosis of early BC has improved due to the establishment of neoadjuvant or adjuvant medication therapy, advanced or metastatic BC is still difficult to cure [2,3]. Pharmacotherapies (e.g., chemotherapy, endocrine therapy, and anti-human epidermal growth factor 2 ((HER2)) drugs) have been selected based on the subtypes of tumors according to the expression statuses of hormone receptors (estrogen receptor ((ER)), progesterone receptor ((PgR)) and HER2 because different tumor-growth pathways are activated in various subtypes of tumors [4]. For example, in ER-positive BC, ER signaling has complicated crosstalk with other oncogenic pathways, including the phosphatidylinositol-3-kinase (PI3K)-protein kinase B (AKT) and cyclin-dependent kinases (CDK)4/6 pathways, and the molecules in these pathways are considered novel therapeutic targets [5]. In fact, CDK4/6 inhibitors (e.g., palbociclib, abemaciclib, and ribociclib) combined with anti-estrogen drugs are clinically efficacious for patients with metastatic ER-positive BC [6,7]. Thus, to further improve the prognosis of patients with BC, it is important to clarify the molecules involved in the signal transduction pathway in each subtype of BC cells.
Synaptotagmins are a group of proteins that play roles in the secretion of neurotransmitters by synaptic vesicles [8]. The tumor-promoting roles of synaptotagmin 13 (SYT13) have been studied in various malignant tumors, including lung adenocarcinoma and colorectal and gastric cancers, and higher SYT13 expression has been shown to be a poor prognostic factor [9,10,11]. For example, in gastric cancer, SYT13 is involved in the progression of peritoneal metastasis and thus is a potential therapeutic target [9]. Although the roles of SYT13 in promoting tumorigenesis, anti-apoptotic effects, and metastases have been reported in several cancers, no studies have investigated the significance of SYT13 in BC. Accordingly, this study aimed to investigate whether SYT13 expression is related to clinicopathological factors, subtypes, and prognoses of patients with BC.

2. Materials and Methods

2.1. Sample Collection

Among thirteen BC and two non-cancerous breast epithelial cell lines, BT-549, HCC1419, HCC1954, and Hs578T cell lines were purchased from the Japanese Collection of Research Bioresources Cell Bank (Osaka, Japan), and BT-474, MCF-7, and MCF-12A were obtained from the laboratory of Professor David Sidransky at Johns Hopkins University (Baltimore, MD, USA), following the material transfer agreement. Other cell lines were obtained from the American Type Culture Collection (Manassas, VA, USA). These cell lines were cultured in a medium consisting of RPMI 1640 (Sigma-Aldrich, St. Louis, MO, USA) and 10% fetal bovine serum in an atmosphere of 5% CO2 at 37 °C [12].
For clinical specimens, BC patients who were operated on at Nagoya University Hospital from March 2002 to November 2009 and had available postoperative surveillance data spanning more than five years were evaluated in this study. The cancerous specimens were resected at approximately 1.5 mm in diameter and frozen immediately at −80 °C. The resected BC specimens were histologically diagnosed and categorized according to the Union for International Cancer Control (UICC) staging system for BC (8th edition). The perioperative pharmacological treatment of each patient was determined by physician discretion based on the general condition and pathological features.

2.2. Quantitative Real-Time Reverse Transcription-Polymerase Chain Reaction (qRT-PCR)

SYT13 mRNA expression levels were evaluated with qRT-PCR. After total RNA was extracted from cell lines and clinical specimens, cDNA was synthesized [13]. Glyceraldehyde-3-phosphate dehydrogenase (GAPDH) mRNA level was evaluated as a house-keeping gene. The primers specific for SYT13 and GAPDH were as follows: SYT13, forward 5-ACCTGGAGAAGGCGAAGC-3 and reverse 5-GTCTGGGAACTTGAGGAGGG-3, which generated a 104-bp product [9]; GAPDH, forward 5- GAAGGTGAAGGTCGGAGTC -3, and reverse 5- GAAGATGGTGATGGGATTTC -3, which generated a 226-bp product [12]. A SYBR Green PCR core reagent kit (Applied Biosystems) was used for qRT-PCR with the following cycling conditions: one cycle at 95 °C for 10 min, followed by 40 cycles at 95 °C for 5 s and 60 °C for 60 s. qRT-PCR of each gene was conducted in triplicate. The relative mRNA expression level of SYT13 was calculated by dividing with the GAPDH level [12].

2.3. Western Blotting Analysis

Western blotting was performed by the Simple Western technique using the WES instrument (ProteinSimple, San Jose, CA, USA), according to the manufacturer’s protocol. Cells were incubated in RIPA lysis buffer, and the lysates were stored at −30 °C. Protein concentration was assessed using a BCA protein assay kit (Thermo Fisher Scientific, Inc., Waltham, MA, USA). Protein samples (5 μg/lane), biotin ladder, primary antibody, secondary antibody, blocking reagent, chemiluminescent substrate, and wash buffer were prepared and dispensed into the assay plate. Then, the assay plate was loaded into the instrument and the protein was separated into individual capillaries. Protein separation and detection were performed automatically on individual capillaries. The duration of incubation of the primary and secondary antibodies was 30 min at room temperature. Detection was performed by chemiluminescence with luminol (cat. no. 043-311; ProteinSimple) and peroxide (cat. no. 043-379; ProteinSimple) attached to the detection module. Anti-SYT13 antibody (1:50; cat. no. OAAB02896; Aviva Systems Biology, San Diego, CA, USA) [14], anti-ERα antibody (1:50; cat. no. 8644; Cell Signaling Technology, Danvers, MA, USA), and anti-β-actin antibody (1:50; cat. no. ab6276; Abcam, Cambridge, UK) were used as primary antibodies. Streptavidin HRP (cat. no. 042-414; ProteinSimple) and anti-mouse or anti-rabbit secondary antibodies (anti-mouse, cat. no. 042-205; and anti-rabbit, cat. no. 042-206; ProteinSimple) were selected according to the corresponding primary antibody.

2.4. PCR Array Analysis

The RT2 Profiler PCR Array Human for Oncogenes & Tumor Suppressor Genes (Qiagen, Hilden, Germany) was used to investigate the correlation between mRNA expression levels of SYT13 and 84 cancer-related genes in 13 BC cell lines. The assay was conducted in accordance with the manufacturer’s protocol. The relative mRNA expression level of each gene was normalized by the GAPDH level.

2.5. Public Datasets of BC Cell Lines and Patients

SYT13 mRNA expression levels in 58 BC cell lines were obtained from Cancer Cell Line Encyclopedia (CCLE) database (https://sites.broadinstitute.org/ccle/). The accessed data was 21 August 2021. Gene expression data and pathological and prognostic characteristics of 681 patients were obtained from The Cancer Genome Atlas (TCGA) database via the cBioPortal for Cancer Genomics (https://www.cbioportal.org/). The accessed date was 26 December 2020.

2.6. Statistical Analysis

To compare the continuous valuables of two groups, the Mann–Whitney test was used. On the other hand, to compare multiple groups, ANOVA with Tukey’s post hoc test was performed. To analyze the correlation between the expression levels of the two genes, Spearman’s rank correlation test was conducted. We used the χ2 test to evaluate the association between SYT13 mRNA expression levels and various clinicopathological factors. Prognoses, such as disease-free survival (DFS) and overall survival (OS) rates, were evaluated with the Kaplan–Meier method, following the log-rank test to compare survival curves. JMP 15 software (SAS Institute, Inc., Cary, NC, USA) was exploited for these statistical analyses. p < 0.05 was defined as statistical significance.

3. Results

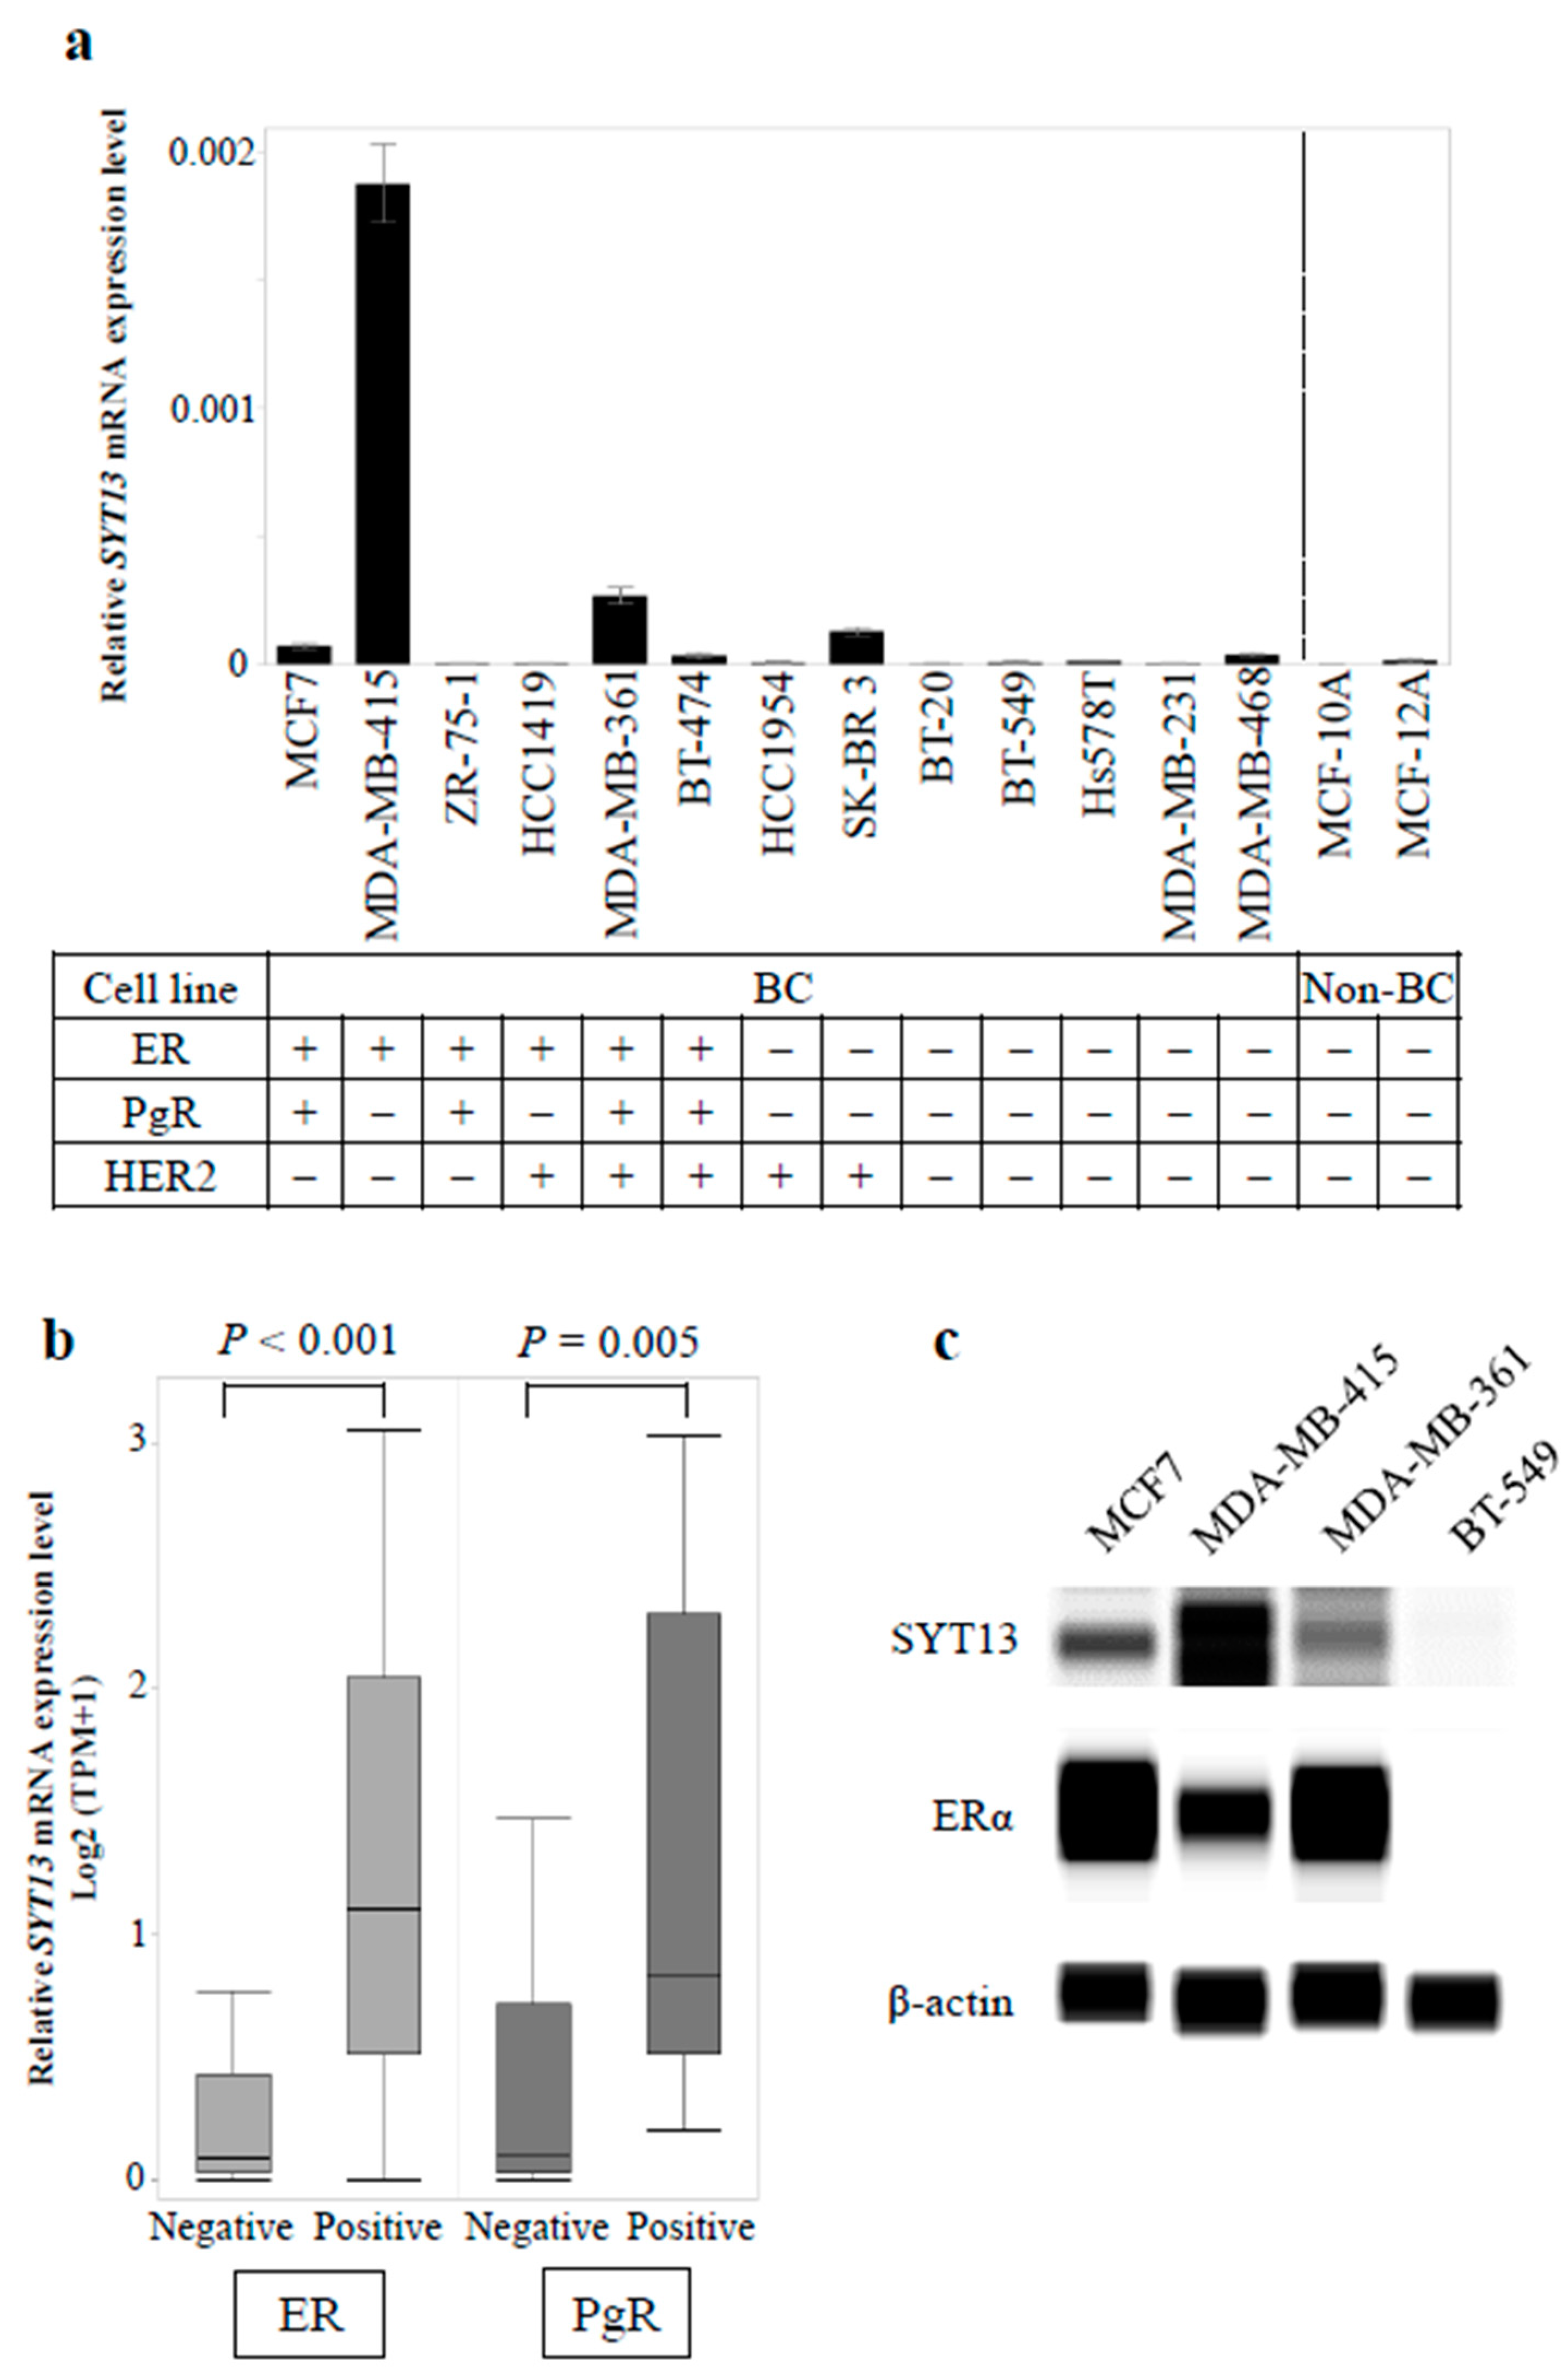
3.1. SYT13 mRNA Expression Levels in Cell Lines

At first, we evaluated SYT13 mRNA expression levels in 13 BC cell lines and two non-cancerous mammary cell lines (Figure 1a). The statuses of the conventional biomarkers (ER, PgR, and HER2) are cited from previous studies [15,16]. BC cell lines showed higher SYT13 mRNA levels than non-cancerous cell lines (p = 0.024). ER-positive cell lines showed higher SYT13 mRNA expression levels than ER-negative (p = 0.012) and non-cancerous cell lines (p = 0.009). There were no significant differences in SYT13 mRNA expression between PgR-positive and PgR-negative cells (p = 0.073) or between HER2-positive and HER2-negative cells (p = 0.260). SYT13 mRNA expression levels in additional BC cell lines were obtained from the CCLE database for validation (Table S1). ER and PgR statuses in each cell line were referred from previous articles [17,18,19]. Interestingly, among 58 BC cells whose SYT13 expression levels were available, ER-positive cells (n = 17) displayed significantly higher SYT13 mRNA levels than ER-negative ones (n = 41, p < 0.001; Figure 1b) and PgR-positive specimens (n = 9) also exhibited higher SYT13 mRNA expression levels than PgR-negative specimens (n = 49, p = 0.005; Figure 1b).
Subsequently, SYT13 protein expression was evaluated in the representative BC cell lines by Western blotting. Among ER-positive cell lines, MDA-MB-415 displayed the highest SYT13 expression and SYT13 expressions in MCF7 and MDA-MB-361 cells were modest, which is consistent with the qRT-PCR results (Figure 1c). Alternatively, BT-549, which represented ER-negative cell line, did not express SYT13 or ERα (Figure 1c).
The correlations between SYT13 and 84 cancer-related gene expression levels in 13 BC cells were evaluated by PCR array analysis, and it was found that the expression levels of several oncogenes, including murine double minute 2 (MDM2), AKT serine/threonine kinase 1 (AKT1), B-cell lymphoma 2 (BCL2), estrogen receptor 1 (ESR1), and CDK4, were positively correlated with those of SYT13 (Table 1 and Table S2). These genes are known as key genes in the ER signaling pathway that contributes to tumor progression, especially in ER-positive BC [20,21,22], suggesting involvement of SYT13 in the ER signaling pathway in BC cells.

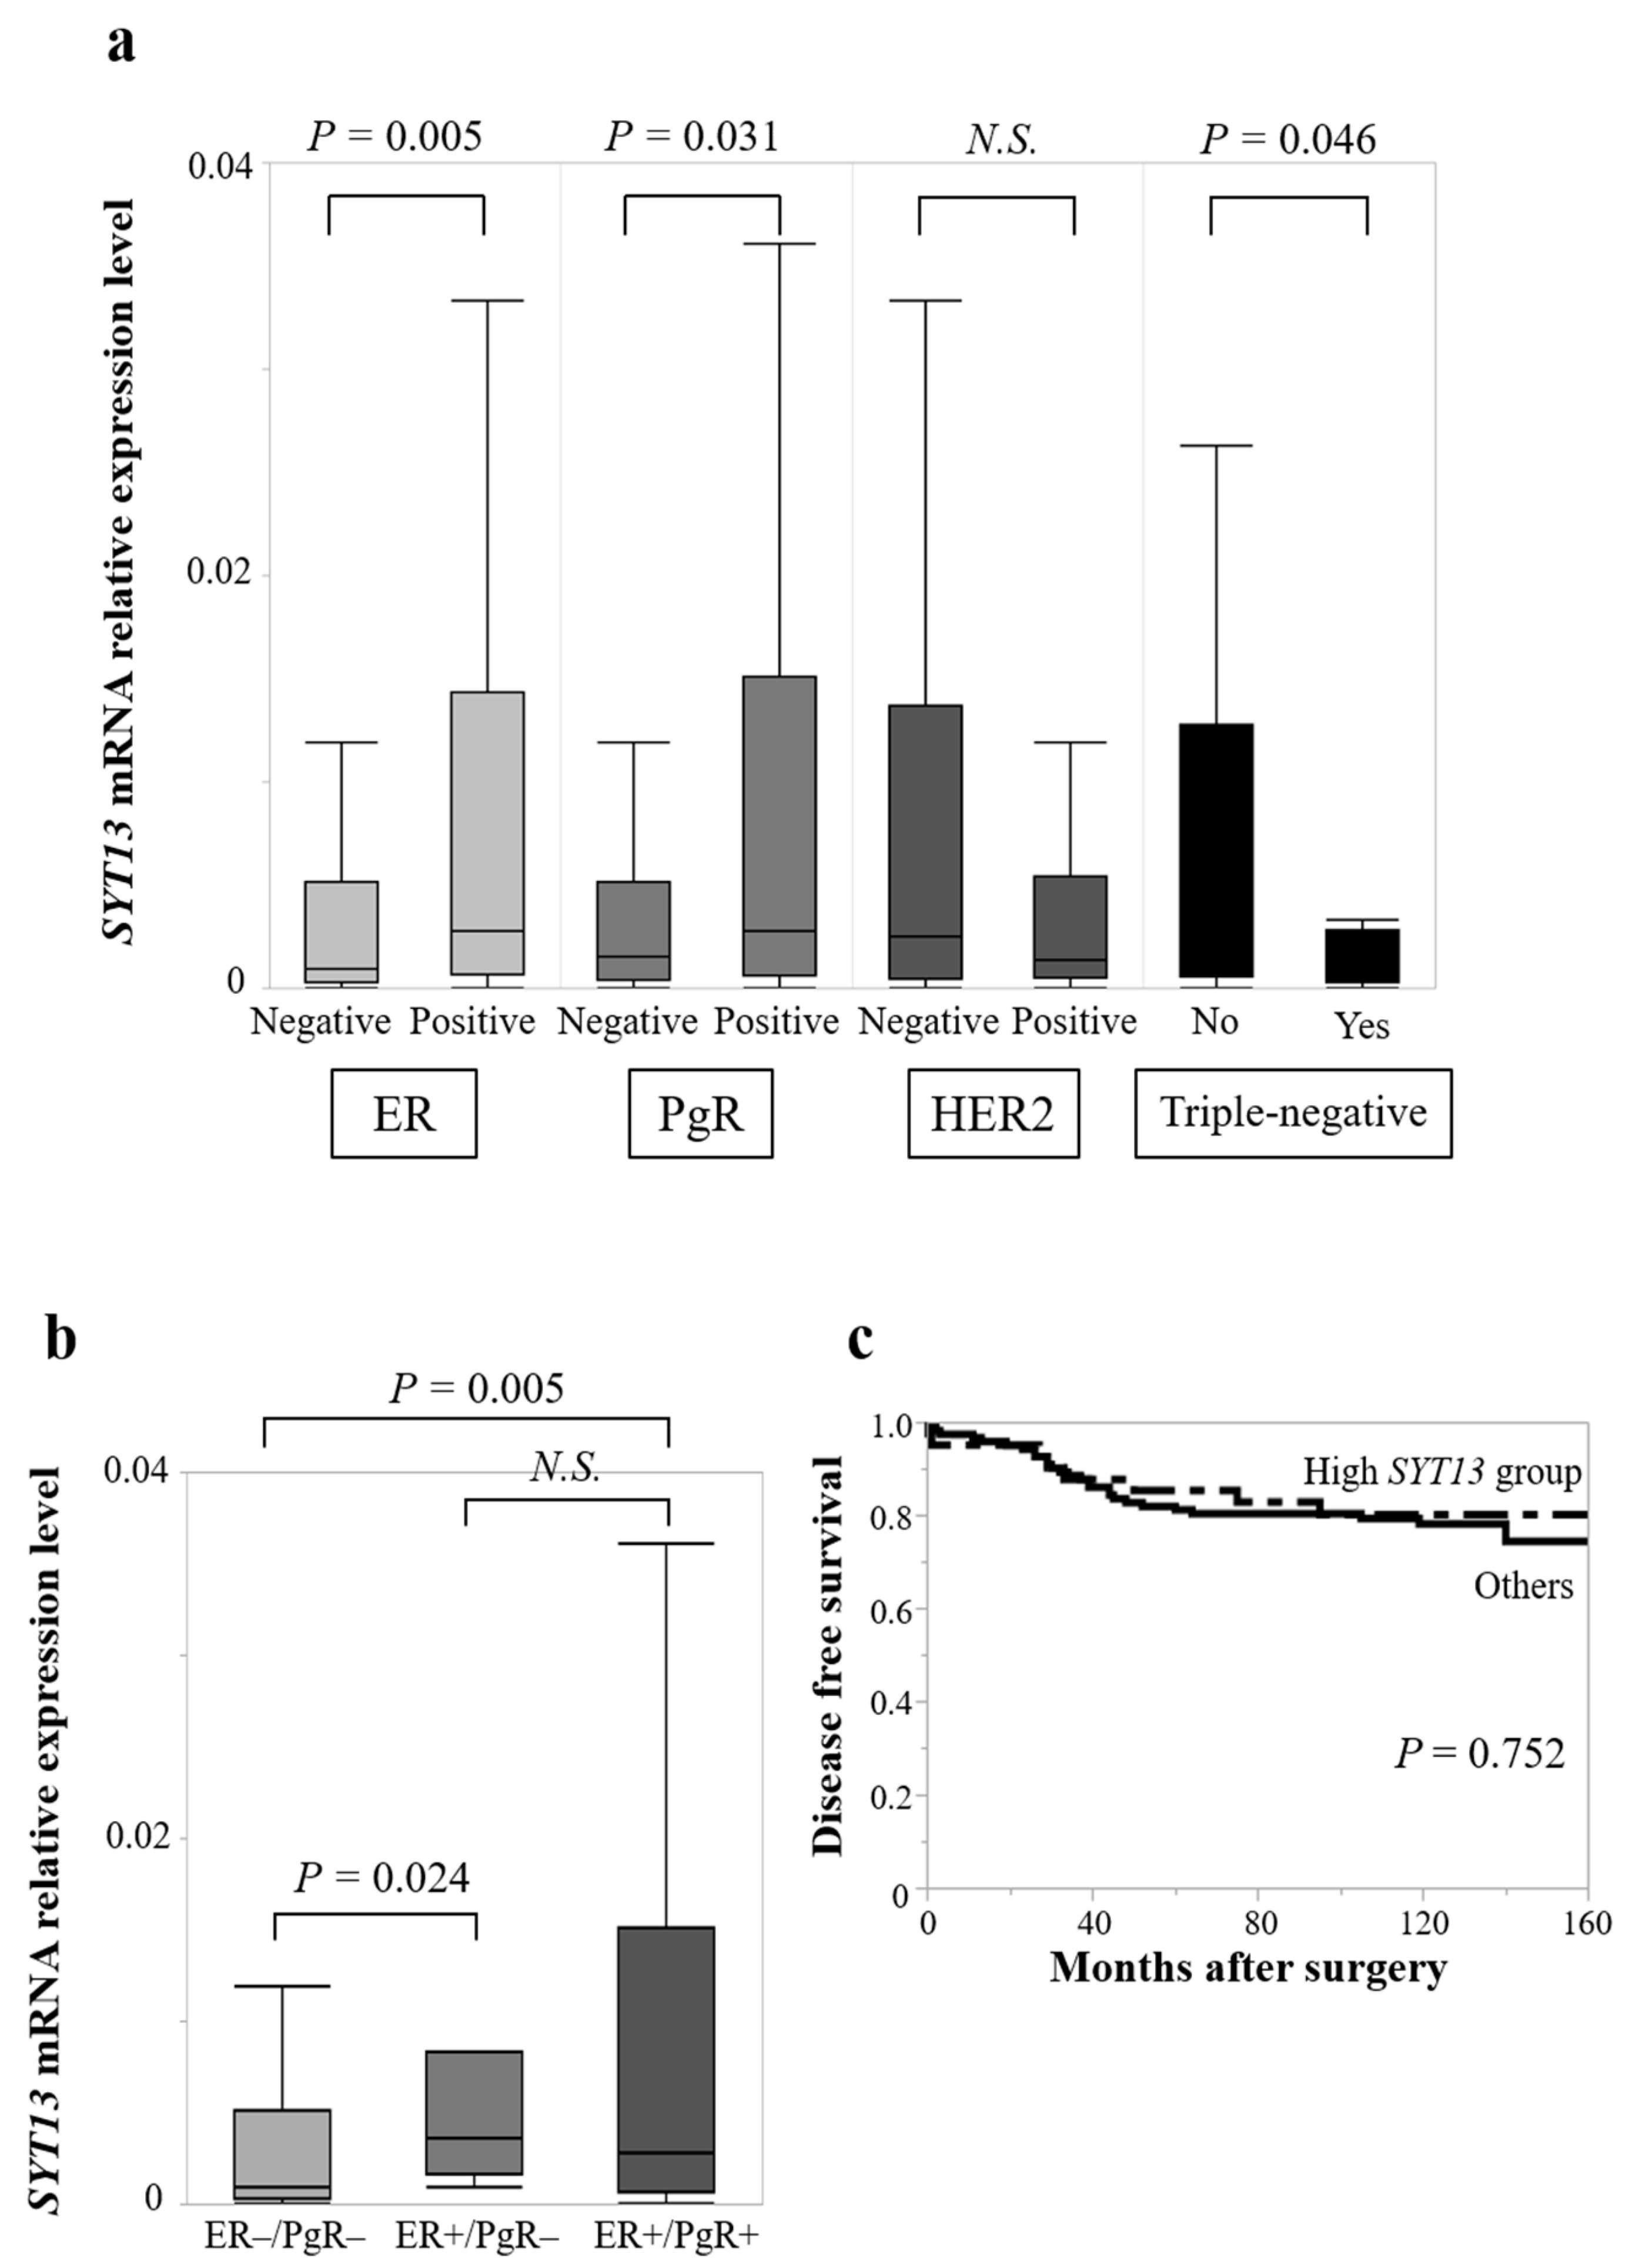
3.2. Association of SYT13 mRNA Expression Levels with Clinicopathological Factors in BC Patients

In total, 165 female patients with BC were evaluated. The median age was 55 years (27–78 years). Patient demographics are shown in Table 2. If any of ER, PgR, and HER2 was positive, patients were grouped as ‘non-triple-negative’. Since eight of the nine patients whose HER2 statuses were unknown showed ER-positivity, these patients were categorized as ‘non-triple-negative’.
There were no significant differences of SYT13 mRNA expression levels between Tis/T1 (n = 77) and T2/T3/T4 (n = 88; p = 0.424), lymph node metastasis-positive (n = 80) and negative (n = 85; p = 0.303), or stage 0/I/II (n = 131) and stage III/IV (n = 34; p = 0.732). Notably, ER-positive specimens (n = 125) expressed significantly higher SYT13 mRNA levels than ER-negative specimens (n = 40, p = 0.005; Figure 2a), and PgR-positive specimens (n = 113) also exhibited higher SYT13 mRNA expression levels than PgR-negative specimens (n = 52, p = 0.031; Figure 2a). Moreover, triple-negative patients (n = 18) expressed lower SYT13 than those with non-triple-negative (n = 146, p = 0.046; Figure 2a). There was no significant difference between HER2-positive (n = 38) and negative (n = 118) specimens (p = 0.193; Figure 2a). In addition, ER-positive/PgR-positive specimens (n = 113) expressed higher SYT13 mRNA levels than ER-negative/PgR-negative specimens (n = 41, p = 0.005; Figure 2b), and ER-positive/PgR-negative specimens (n = 11) also showed higher SYT13 mRNA expression levels than ER-negative/PgR-negative specimens (n = 41, p = 0.024; Figure 2b).
When patients with SYT13 expression levels in the highest quartile were allocated to the “high SYT13 group” (n = 42) and the remaining patients were allocated as “others” (n = 123), the high SYT13 group included more ER-positive, PgR-positive, and HER2-negative patients than the “others” group (Table 3). There were no significant differences in T stage (p = 0.162), lymph node status (p = 0.084), or UICC staging (p = 0.095; Table 3). The prognostic analysis did not show significant differences between the high SYT13 group and the “others” group in DFS rates (5-year DFS rates: high SYT13 group, 85.1%; others, 81.9%; p = 0.752) (Figure 2c) or OS rates (5-year OS rates: high SYT13 group, 90.1%; others, 89.4%; p = 0.220).
Because SYT13 mRNA was preferentially expressed in ER-positive specimens, we evaluated the significance of its expression exclusively in ER-positive patients (n = 125). We found no significant differences in SYT13 mRNA expression between Tis/T1 (n = 62) and T2/T3/T4 (n = 63; p = 0.587), lymph node metastasis-positive (n = 63) and negative (n = 62; p = 0.141), or stage 0/I/II (n = 104) and stage III/IV (n = 21; p = 0.797).
These results from clinical samples showed a positive association between SYT13 expression levels and ER-positive BC; the finding is consistent with the BC cell line data. However, SYT13 expression did not affect the prognoses of either all or ER-positive BC patients.

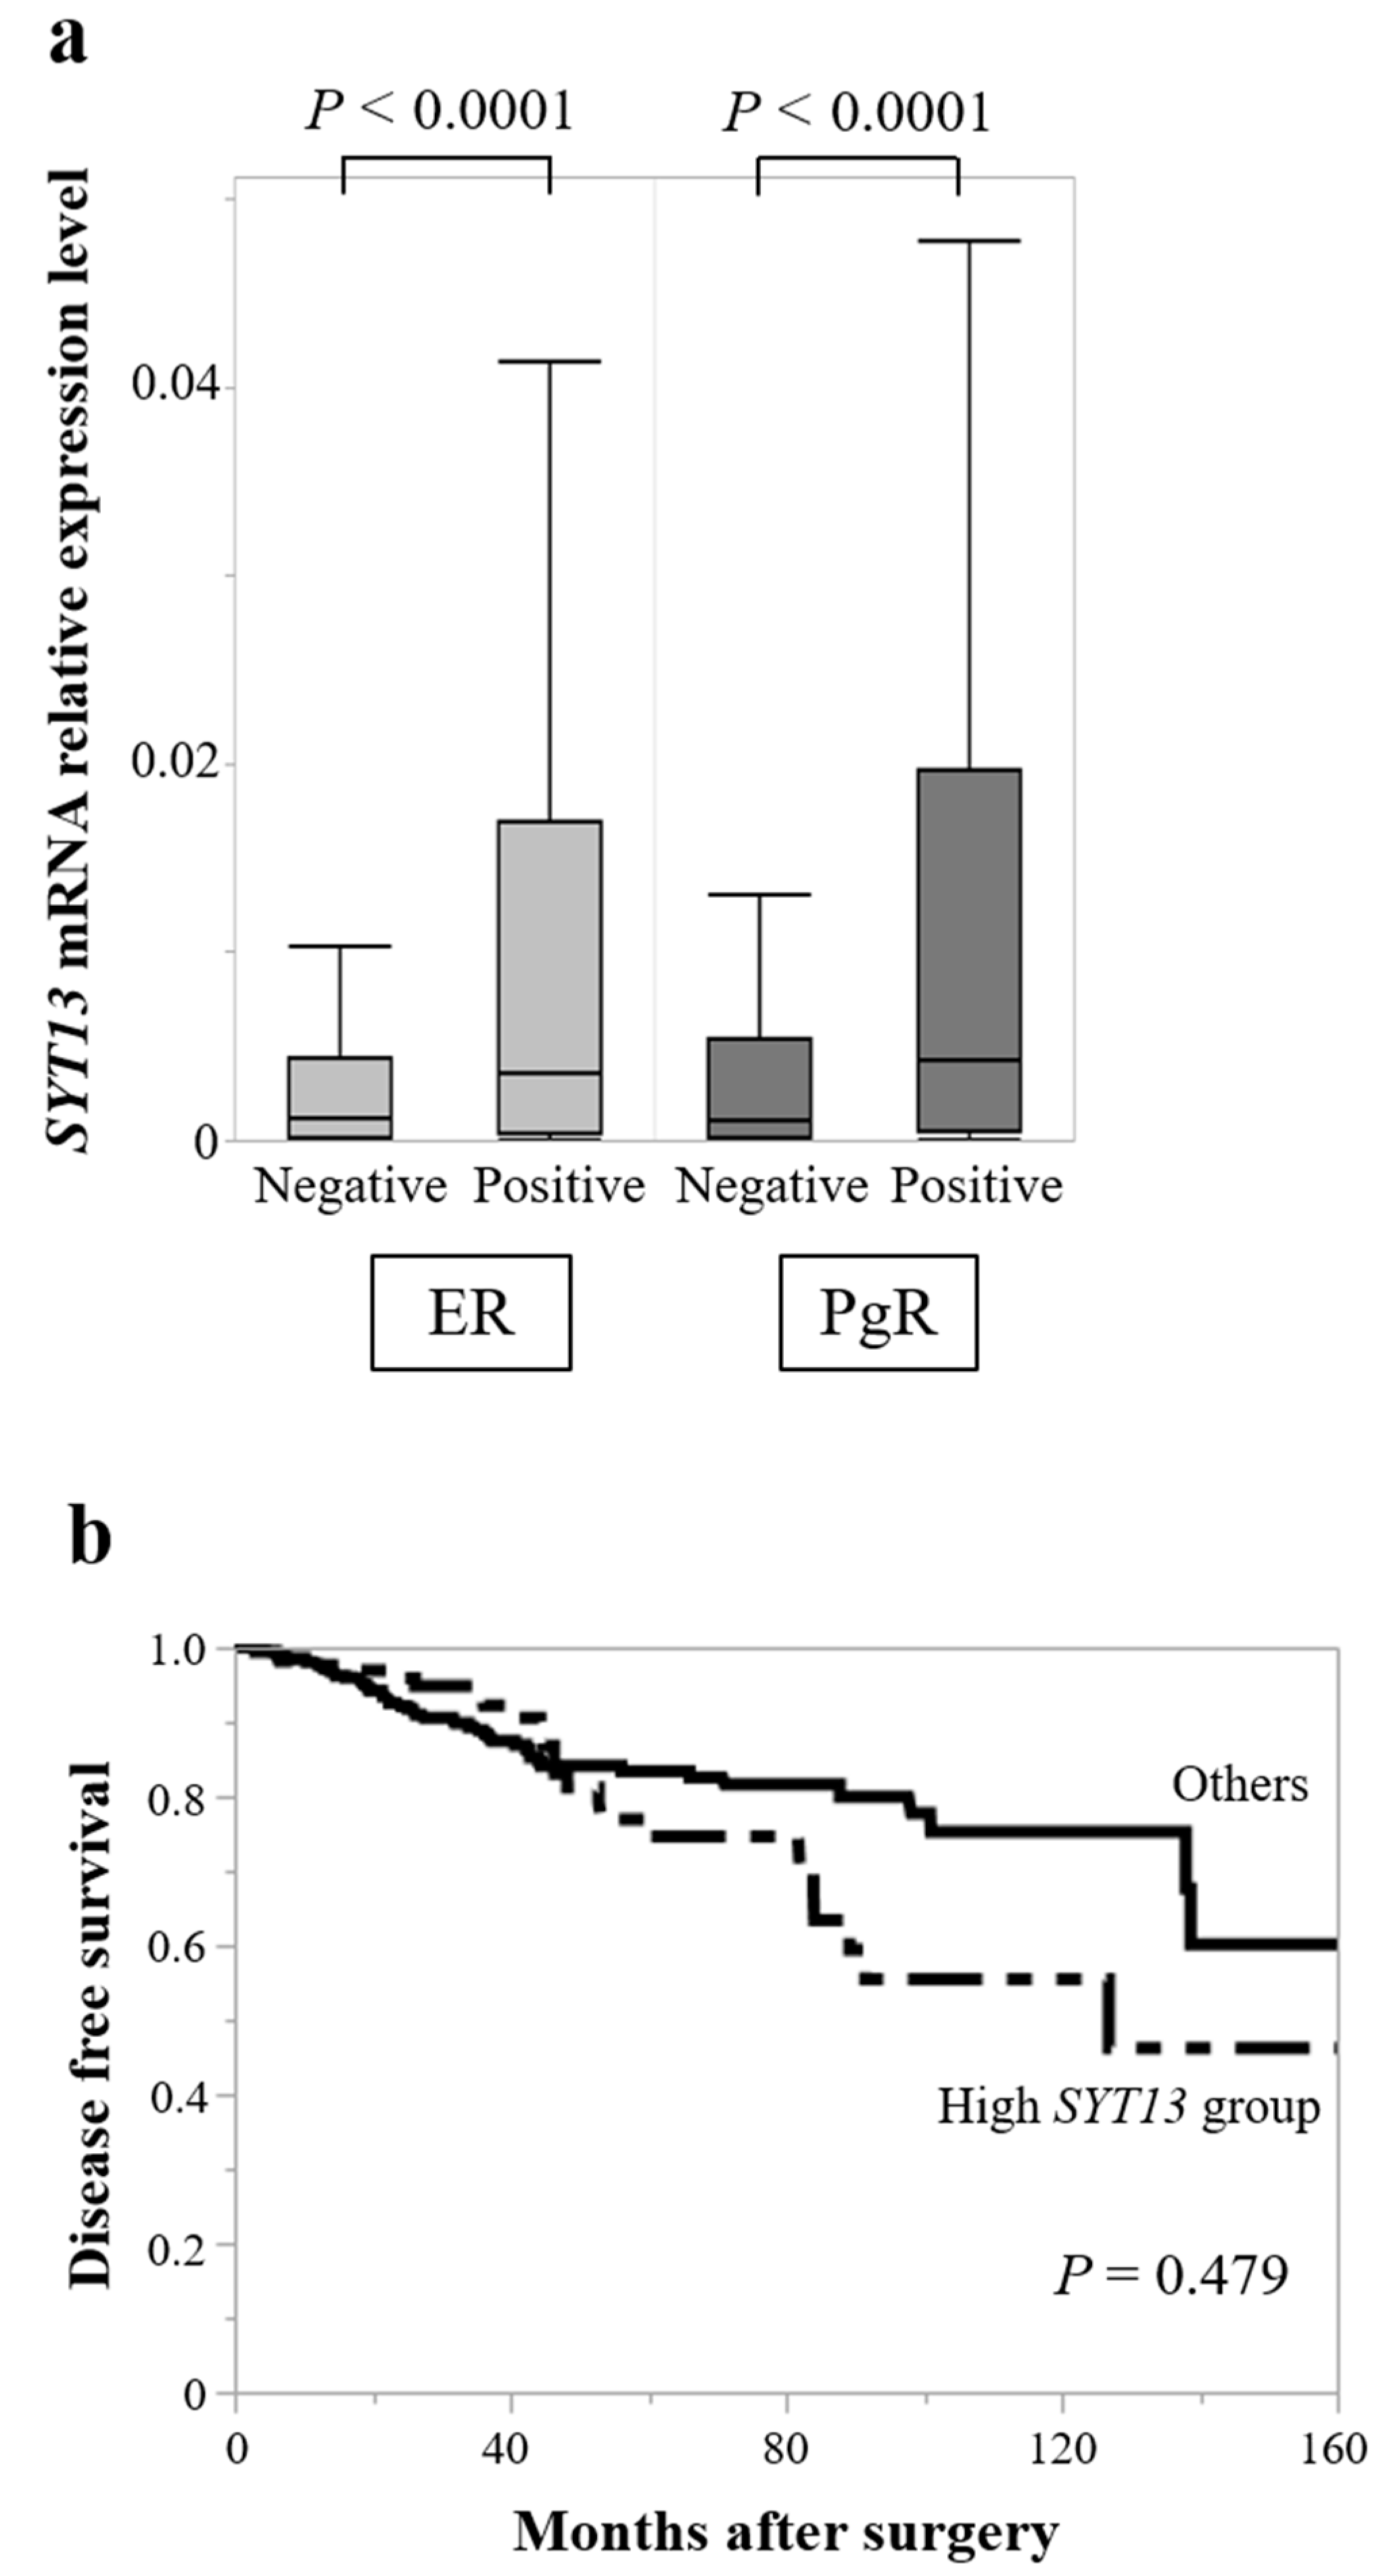
3.3. TCGA Database Analysis

To validate the results obtained from our clinical samples, SYT13 mRNA expression levels in 681 patients with BC were evaluated using the TCGA database. Patient characteristics are summarized in Table 4. SYT13 mRNA expression levels did not differ between T1 (n = 188) and T2/T3/T4 (n = 492; p = 0.694), lymph node metastasis-positive (n = 354) and negative (n = 323; p = 0.593), or stage I/II (n = 514) and stage III/IV (n = 162; p = 0.524). Based on hormone receptor status, ER-positive patients (n = 532) exhibited higher SYT13 expression levels than ER-negative patients (n = 149, p < 0.0001; Figure 3); similarly, PgR-positive patients (n = 456) showed higher SYT13 expression levels than PgR-negative patients (n = 225, p < 0.0001; Figure 3a). To evaluate patients’ prognoses, patients with SYT13 expression levels in the highest quartile were allocated to the “high SYT13 group” (n = 133), and the remaining patients were allocated as “others” (n = 399). There were no significant differences between the high SYT13 group and the “others” group in DFS rates (5-year DFS rates: high SYT13 group, 74.6%; others, 83.4%; p = 0.479 (Figure 3b). These results are consistent with those from our clinical samples.
Furthermore, no significant differences were found between T1 (n = 154) and T2/T3/T4 (n = 378; p = 0.849), lymph node metastasis-positive (n = 237) and negative (n = 292; p = 0.352), or stage I/II (n = 401) and stage III/IV (n = 128; p = 0.621) in SYT13 mRNA expression levels in ER-positive patients (n = 532); the finding is consistent with the results of our clinical samples.

4. Discussion

This study demonstrated that SYT13 was preferentially expressed in hormone receptor-positive BC cell lines and clinical samples based on biochemical analyses and the TCGA database analyses, but there was no significant relationship between its expression and tumor-nodes-metastasis (TNM) staging or prognosis.
SYT13 is a member of synaptotagmins, a group of proteins that play a role in the secretion of neurotransmitters by synaptic vesicles [8]. The tumor-promoting roles of SYT13 have been reported in various malignant tumors, such as lung adenocarcinoma and colorectal and gastric cancers [9,10,11]. In lung adenocarcinoma, SYT13 contributes to cellular proliferation, clonality, and anti-apoptotic effects [11], and in colorectal cancer, silencing SYT13 inhibits tumor growth in mouse models [10]. Our group previously found that intraperitoneal injection of SYT13 siRNA inhibited the peritoneal dissemination of gastric cancer in mouse models, and that SYT13 expression was an independent risk factor for peritoneal recurrence in patients with gastric cancer [9,14]. Despite these previous findings, the significance of SYT13 in BC remains unclear.
Initially, we had anticipated that patients with advanced BC would have higher SYT13 mRNA expression levels, which indicates a poor prognosis, as demonstrated in other cancer types. However, unlike other malignancies, we detected no significant associations in SYT13 expression levels among TNM stages or prognosis in our cohort or the TCGA database. Regarding the significance of SYT13 expression, it is necessary to take into account the biological differences between breast and other cancers that have been reported previously. We subsequently investigated whether SYT13 expression levels were related to conventional biomarkers, such as ER, PgR, and HER2. We found that ER-positive BC cells and clinical specimens had higher SYT13 mRNA expression levels than ER-negative cells and clinical specimens, respectively. In addition, SYT13 protein expression was consistent with mRNA expression levels. The CCLE database, which includes a larger amount of cell lines’ data, validated our results. In our clinical samples, SYT13 mRNA expression levels were also higher in PgR-positive and non-triple-negative patients. In the TCGA database, a larger and more comprehensive cohort dataset, ER-positive and PgR-positive patients had significantly higher SYT13 expression levels. These results consistently suggest that SYT13 expression correlates with the positivity of hormone receptors but does not affect the stage of progression in BC.
In ER-positive BC, ER signaling is mainly activated to promote the transcription of molecules involved in cell proliferation, thereby resulting in tumor progression [5]. Importantly, ER signaling is known to crosstalk with other oncogenic pathways, such as the PI3K-AKT and CDK4/6 pathways [5]. Consistently, our PCR array analysis demonstrated positive correlations between expression levels of SYT13 and ESR1, AKT1, MDM2, BCL2, and CDK4. To date, no reports have described the relationship between SYT13 and these genes. The positive correlation between SYT13 and ESR1, a transcription factor, supports our finding that SYT13 is highly expressed in ER-positive patients. AKT1 is one of the downstream targets of ESR1 and it is also overexpressed in ER-positive BC [21]. In small bowel neuroendocrine tumors, SYT13 has been reported to be involved in metastasis by interacting with the AKT pathway [23]. Both MDM2 and BCL2, downstream of AKT1, are overexpressed in ER-positive BC and have been considered potential therapeutic targets for BC [22]. CDK4, which facilitates phosphorylation of Rb, accelerates the cell cycle [20]. Recently, several studies have shown the importance of the CDK4/6 and PI3K/AKT/mTOR pathways in ER-positive/HER2-negative BC [24]. CDK4/6 inhibitors with hormone therapy are globally used as a first-line treatment for metastatic ER-positive BC [6,7]. It would be interesting to further investigate the association between the efficacies of these inhibitors and SYT13 expression in patients with metastatic ER-positive BC. The correlations between expression levels of SYT13 and these genes suggest that SYT13 exists in ER signaling pathways; the hypothesis is supported by our results of clinical samples. However, SYT13 expression was not associated with tumor staging or prognosis in either all or ER-positive BC patients. These results suggest that although SYT13 exists in the ER-related pathways, it is not directly involved in promoting BC. In other words, SYT13 is considered to play a subordinate role in ER-positive BC.
One limitation should be mentioned in this study. Mechanistic experiments were lacking. Although PCR array analysis revealed the association between SYT13 and other cancer-related genes that are mainly expressed in ER-positive BC, these observational results are not capable of determining the crosstalk between these genes.

5. Conclusions

This study found increased expression of SYT13 in ER-positive BC. The present findings suggest that SYT13 has the potential to bridge oncogenic pathways with the ER signaling pathway in BC, which would contribute to clarifying the full picture of the ER signaling pathway.

Supplementary Materials

The following are available online at https://0-www-mdpi-com.brum.beds.ac.uk/article/10.3390/curroncol28050346/s1, Table S1. SYT13 mRNA expression levels of 58 BC cell lines in the CCLE database. Table S2. Correlations between mRNA expression levels of SYT13 and 84 cancer-related genes.

Author Contributions

Conceptualization: M.S. and M.K.; experiments: T.I. (Takahiro Ichikawa), M.S., T.I. (Takahiro Inaishi), and I.S.; data analysis: T.I. (Takahiro Ichikawa); resources (cell lines): M.H.; data and sample collection: T.I. (Takahiro Ichikawa), M.S., T.I. (Takahiro Inaishi), I.S., Y.T., D.T., N.T., and T.K.; writing the manuscript: T.I. (Takahiro Ichikawa) and M.S.; supervision: Y.K. and T.K. The final manuscript has been approved by all authors. All authors have read and agreed to the published version of the manuscript.

Funding

This research received no external funding.

Institutional Review Board Statement

This study was conducted in accordance with the guidelines of the Declaration of Helsinki and approved by the Institutional Review Board of Nagoya University Graduate School of Medicine (reference number: 2019-0028).

Informed Consent Statement

Participants in this study provided written informed consent for the use of their clinical samples and data.

Data Availability Statement

The data used in this study can be obtained from the corresponding author upon request.

Acknowledgments

We are grateful to David Sidransky, the director of the Otolaryngology Department of Johns Hopkins University School of Medicine (Baltimore, MD, USA), for providing the BT-474, MCF-7, and MCF-12A cell lines.

Conflicts of Interest

The authors declare no conflict of interest.

References

  1. Siegel, R.L.; Miller, K.D.; Jemal, A. Cancer statistics. CA Cancer J. Clin. 2019, 69, 7–34. [Google Scholar] [CrossRef] [PubMed] [Green Version]
  2. Iwata, H. Future treatment strategies for metastatic breast cancer: Curable or incurable? Breast Cancer 2011, 19, 200–205. [Google Scholar] [CrossRef]
  3. Shizuku, M.; Shibata, M.; Shimizu, Y.; Takeuchi, D.; Mizuno, Y. Clinical outcomes of neoadjuvant chemotherapy for patients with breast cancer: Tri-weekly nanoparticle albumin-bound paclitaxel followed by 5-fluorouracil, epirubicin, and cyclophosphamide: A retrospective observational study. Nagoya J. Med. Sci. 2020, 82, 457–467. [Google Scholar] [PubMed]
  4. Silvestri, M.; Cristaudo, A.; Morrone, A.; Messina, C.; Bennardo, L.; Nisticò, S.P.; Mariano, M.; Cameli, N. Emerging skin toxicities in patients with breast cancer treated with new cyclin-dependent kinase 4/6 inhibitors: A systematic review. Drug Saf. 2021, 44, 725–732. [Google Scholar] [CrossRef] [PubMed]
  5. Ma, C.X.; Reinert, T.; Chmielewska, I.; Ellis, M.J. Mechanisms of aromatase inhibitor resistance. Nat. Rev. Cancer 2015, 15, 261–275. [Google Scholar] [CrossRef]
  6. Finn, R.S.; Martin, M.; Rugo, H.S.; Jones, S.; Im, S.-A.; Gelmon, K.; Harbeck, N.; Lipatov, O.N.; Walshe, J.M.; Moulder, S.; et al. Palbociclib and Letrozole in Advanced Breast Cancer. N. Engl. J. Med. 2016, 375, 1925–1936. [Google Scholar] [CrossRef] [PubMed]
  7. Goetz, M.P.; Toi, M.; Campone, M.; Sohn, J.; Paluch-Shimon, S.; Huober, J.; Park, I.H.; Trédan, O.; Chen, S.-C.; Manso, L.; et al. MONARCH 3: Abemaciclib as initial therapy for advanced breast cancer. J. Clin. Oncol. 2017, 35, 3638–3646. [Google Scholar] [CrossRef]
  8. Jahn, J.E.; Best, D.H.; Coleman, W.B. Exogenous expression of synaptotagmin XIII suppresses the neoplastic phenotype of a rat liver tumor cell line through molecular pathways related to mesenchymal to epithelial transition. Exp. Mol. Pathol. 2010, 89, 209–216. [Google Scholar] [CrossRef]
  9. Kanda, M.; Shimizu, D.; Tanaka, H.; Tanaka, C.; Kobayashi, D.; Hayashi, M.; Takami, H.; Niwa, Y.; Yamada, S.; Fujii, T.; et al. Synaptotagmin XIII expression and peritoneal metastasis in gastric cancer. J. Br. Surg. 2018, 105, 1349–1358. [Google Scholar] [CrossRef]
  10. Li, Q.; Zhang, S.; Hu, M.; Xu, M.; Jiang, X. Silencing of synaptotagmin 13 inhibits tumor growth through suppressing proliferation and promoting apoptosis of colorectal cancer cells. Int. J. Mol. Med. 2019, 45, 234–244. [Google Scholar] [CrossRef]
  11. Zhang, L.; Fan, B.; Zheng, Y.; Lou, Y.; Cui, Y.; Wang, K.; Zhang, T.; Tan, X. Identification SYT13 as a novel biomarker in lung adenocarcinoma. J. Cell. Biochem. 2020, 121, 963–973. [Google Scholar] [CrossRef]
  12. Watanabe, M.; Shibata, M.; Inaishi, T.; Ichikawa, T.; Soeda, I.; Miyajima, N.; Takano, Y.; Takeuchi, D.; Tsunoda, N.; Kanda, M.; et al. MZB1 expression indicates poor prognosis in estrogen receptor-positive breast cancer. Oncol. Lett. 2020, 20, 1. [Google Scholar] [CrossRef]
  13. Shibata, M.; Kanda, M.; Shimizu, D.; Tanaka, H.; Umeda, S.; Hayashi, M.; Inaishi, T.; Miyajima, N.; Adachi, Y.; Takano, Y.; et al. Expression of regulatory factor X1 can predict the prognosis of breast cancer. Oncol. Lett. 2017, 13, 4334–4340. [Google Scholar] [CrossRef] [Green Version]
  14. Kanda, M.; Kasahara, Y.; Shimizu, D.; Miwa, T.; Umeda, S.; Sawaki, K.; Nakamura, S.; Kodera, Y.; Obika, S. Amido-Bridged Nucleic Acid-Modified Antisense Oligonucleotides Targeting SYT13 to Treat Peritoneal Metastasis of Gastric Cancer. Mol. Ther. Nucleic Acids 2020, 22, 791–802. [Google Scholar] [CrossRef] [PubMed]
  15. Finn, R.S.; Dering, J.; Conklin, D.; Kalous, O.; Cohen, D.J.; Desai, A.J.; Ginther, C.; Atefi, M.; Chen, I.; Fowst, C.; et al. PD 0332991, a selective cyclin D kinase 4/6 inhibitor, preferentially inhibits proliferation of luminal estrogen receptor-positive human breast cancer cell lines in vitro. Breast Cancer Res. 2009, 11, R77. [Google Scholar] [CrossRef] [Green Version]
  16. Subik, K.; Lee, J.-F.; Baxter, L.; Strzepek, T.; Costello, D.; Crowley, P.; Xing, L.; Hung, M.-C.; Bonfiglio, T.; Hicks, D.G.; et al. The Expression Patterns of ER, PR, HER2, CK5/6, EGFR, Ki-67 and AR by Immunohistochemical analysis in breast cancer cell lines. Breast Cancer Basic Clin. Res. 2010, 4, 35–41. [Google Scholar] [CrossRef]
  17. Dai, X.; Cheng, H.; Bai, Z.; Li, J. Breast Cancer Cell Line Classification and Its Relevance with Breast Tumor Subtyping. J. Cancer 2017, 8, 3131–3141. [Google Scholar] [CrossRef] [PubMed] [Green Version]
  18. Neve, R.M.; Chin, K.; Fridlyand, J.; Yeh, J.; Baehner, F.L.; Fevr, T.; Clark, L.; Bayani, N.; Coppe, J.-P.; Tong, F.; et al. A collection of breast cancer cell lines for the study of functionally distinct cancer subtypes. Cancer Cell 2006, 10, 515–527. [Google Scholar] [CrossRef] [PubMed] [Green Version]
  19. Hongisto, V.; Jernström, S.; Fey, V.; Mpindi, J.P.; Kleivi Sahlberg, K.; Kallioniemi, O.; Perälä, M. High-throughput 3D screening reveals differences in drug sensitivities between culture models of JIMT1 breast cancer cells. PLoS ONE 2013, 8, e77232. [Google Scholar] [CrossRef] [PubMed] [Green Version]
  20. Araki, K.; Miyoshi, Y. Mechanism of resistance to endocrine therapy in breast cancer: The important role of PI3K/Akt/mTOR in estrogen receptor-positive, HER2-negative breast cancer. Breast Cancer 2017, 25, 392–401. [Google Scholar] [CrossRef] [PubMed]
  21. Dustin, D.; Gu, G.; Fuqua, S.A.W. ESR1 mutations in breast cancer. Cancer 2019, 125, 3714–3728. [Google Scholar] [CrossRef] [PubMed]
  22. Rozeboom, B.; Dey, N.; De, P. ER+ metastatic breast cancer: Past, present, and a prescription for an apoptosis-targeted future. Am. J. Cancer Res. 2019, 9, 2821–2831. [Google Scholar]
  23. Keck, K.J.; Breheny, P.; Braun, T.A.; Darbro, B.; Li, G.; Dillon, J.S.; Bellizzi, A.M.; O’Dorisio, T.M.; Howe, J.R. Changes in gene expression in small bowel neuroendocrine tumors associated with progression to metastases. Surgery 2017, 163, 232–239. [Google Scholar] [CrossRef] [PubMed]
  24. Ding, L.; Cao, J.; Lin, W.; Chen, H.; Xiong, X.; Ao, H.; Yu, M.; Lin, J.; Cui, Q. The Roles of Cyclin-Dependent Kinases in Cell-Cycle Progression and Therapeutic Strategies in Human Breast Cancer. Int. J. Mol. Sci. 2020, 21, 1960. [Google Scholar] [CrossRef] [PubMed] [Green Version]
Figure 1. (a) Expression levels of SYT13 in breast cell lines. Bar graphs show the relative SYT13 mRNA levels in 13 BC cell lines and two non-cancerous breast cell lines. ER-positive cell lines showed significantly higher SYT13 mRNA expression levels than ER-negative cells and non-cancerous cells. (b) In the CCLE database, ER-positive and PgR-positive BC cell lines expressed higher SYT13 mRNA levels, compared with ER-negative and PgR-negative ones, respectively. (c) SYT13 protein expression in the representative BC cells. Among ER-positive cell lines, MDA-MB-415 displayed the highest SYT13 expression and SYT13 expressions in MCF7 and MDA-MB-361 cells were modest. BT-549, an ER-negative cell line, hardly expressed SYT13 or ERα. BC cells, BC cell lines; non-BC, non-cancerous cell lines; TPM, transcripts per million.
Curroncol 28 00346 g001
Figure 2. (a) In the clinical samples, ER-positive specimens exhibited higher SYT13 mRNA expression levels than ER-negative specimens. PgR-positive specimens also exhibited higher SYT13 mRNA expression levels than PgR-negative specimens. Triple-negative patients expressed lower SYT13 than those with non-triple-negative. (b) ER-positive/PgR-positive and ER-positive/PgR-negative specimens exhibited higher SYT13 mRNA expression than ER-negative/PgR-negative specimens. (c) There was no significant difference in disease-free survival rate between the high SYT13 group and the “others” group. N.S., not significant.
Curroncol 28 00346 g002
Figure 3. TCGA database analysis. (a) SYT13 mRNA expression levels were higher in ER-positive patients than in ER-negative patients. Similarly, PgR-positive patients showed higher SYT13 expression levels than PgR-negative patients. (b) There were no significant differences between the high SYT13 group and others in disease-free survival rates.
Curroncol 28 00346 g003
Table 1. Correlations between mRNA expression levels of SYT13 and cancer-related genes.
GeneOfficial Full NameCorrelation
Coefficient
p-Value
MDM2MDM2 proto-oncogene0.7970.001
KRASKRAS proto-oncogene, GTPase0.7910.001
KITKIT proto-oncogene, receptor tyrosine kinase0.7250.005
NFKBIANFKB inhibitor alpha0.7250.005
MYBMYB proto-oncogene, transcription factor0.7090.007
AKT1AKT serine/threonine kinase 10.6810.010
WWOXWW domain containing oxidoreductase0.6810.010
XRCC1X-ray repair cross complementing 10.6810.010
BCL2BCL2 apoptosis regulator0.6700.012
TP73tumor protein p730.6650.013
APCAPC regulator of WNT signaling pathway0.6540.015
ESR1estrogen receptor 10.6540.015
BRCA2BRCA2 DNA repair associated0.6480.017
BRCA1BRCA1 DNA repair associated0.6430.018
RARAretinoic acid receptor alpha0.6370.019
MYCNMYCN proto-oncogene, bHLH transcription factor0.6100.027
CDK4cyclin dependent kinase 40.5990.031
NF1neurofibromin 10.5930.033
CDH1cadherin 10.5660.044
Table 2. Clinicopathological characteristics of 165 patients with breast cancer.
Clinicopathological Parameter
Age, median (range)55 (27–78)
≤60 years107 (64.8%)
>60 years58 (35.2%)
Histology
DCIS7 (4.2%)
IDC146 (88.6%)
ILC7 (4.2%)
Others5 (3.0%)
UICC T factor
Tis7 (4.2%)
T170 (42.4%)
T274 (44.9%)
T38 (4.9%)
T46 (3.6%)
Node status
Negative85 (51.5%)
Positive80 (48.5%)
UICC pathological stage
07 (4.2%)
I47 (18.2%)
II78 (57.3%)
III32 (22.9%)
IV1 (0.6%)
ER status
Positive125 (75.8%)
Negative40 (24.2%)
PgR status
Positive113 (68.5%)
Negative52 (31.5%)
HER2 status
Positive38 (23.0%)
Negative118 (71.5%)
Unknown9 (5.5%)
Triple-negative
Yes18 (10.9%)
No146 (88.5%)
Unknown1 (0.6%)
Adjuvant therapy
Endocrine therapy alone57 (34.5%)
Chemotherapy alone30 (18.2%)
Endocrine and chemotherapy62 (37.6%)
None16 (9.7%)
Pathological stages were classified using the UICC staging system for breast cancer (8th edition). DCIS, ductal carcinoma in situ; ER, estrogen receptor; HER2, human epidermal growth factor 2; IDC, invasive ductal carcinoma; ILC, invasive lobular carcinoma; PgR, progesterone receptor; UICC, Union for International Cancer Control.
Table 3. Associations between SYT13 mRNA expression and clinicopathological characteristics of 165 patients with breast cancer.
Clinicopathological ParameterHigh SYT13 Group
(n = 42)
Others
(n = 123)
p-Value *
Age 0.965
≤60 year2879
>60 year1543
Histology 0.985
DCIS25
IDC38108
ILC34
Others05
UICC T factor 0.162
Tis/T12453
T2/T3/T41969
Node status 0.084
Negative2758
Positive1664
UICC pathological stage 0.095
0/I/II3894
III/IV528
ER status 0.018 *
Positive3887
Negative535
PgR status 0.009 *
Positive3677
Negative745
HER2 status 0.020 *
Positive434
Negative3385
Triple-negative 0.337
Yes315
No39107
Adjuvant therapy 0.124
Endocrine therapy alone1740
Chemotherapy alone327
Endocrine and chemotherapy1844
None511
* χ2 test. DCIS, ductal carcinoma in situ; ER, estrogen receptor; HER2, human epidermal growth factor 2; IDC, invasive ductal carcinoma; ILC, invasive lobular carcinoma; PgR, progesterone receptor; SYT13, synaptotagmin 13; Tis, carcinoma in situ; UICC, Union for International Cancer Control.
Table 4. Clinicopathological characteristics of 681 patients in the TCGA database.
Clinicopathological Parameter
Age, median (range)58 (29–90)
≤60 years391 (57.4%)
>60 years290 (42.6%)
Sex
Male9 (1.3%)
Female672 (98.7%)
Histology
IDC494 (72.5%)
ILC113 (16.6%)
Others74 (10.9%)
UICC T factor
T1188 (27.6%)
T2382 (56.1%)
T388 (12.9%)
T422 (3.2%)
Unknown1 (0.2%)
Node status
Negative323 (47.4%)
Positive354 (52.0%)
Unknown4 (0.6%)
UICC pathological stage
I124 (18.2%)
II390 (57.3%)
III156 (22.9%)
IV6 (0.9%)
Unknown5 (0.7%)
ER status
Positive532 (78.1%)
Negative149 (21.9%)
PgR status
Positive456 (67.0%)
Negative225 (33.0%)
Pathological stages were classified using the UICC staging system for breast cancer (8th edition). ER, estrogen receptor; IDC, invasive ductal carcinoma; ILC, invasive lobular carcinoma; PgR, progesterone receptor; TCGA, The Cancer Genome Atlas; UICC, Union for International Cancer Control.
Publisher’s Note: MDPI stays neutral with regard to jurisdictional claims in published maps and institutional affiliations.

