Will the Aviation Industry Have a Bright Future after the COVID-19 Outbreak? Evidence from Chinese Airport Shipping Sector


 ,
,
Abstract
:
1. Introduction
2. Data and Methods
2.1. Data
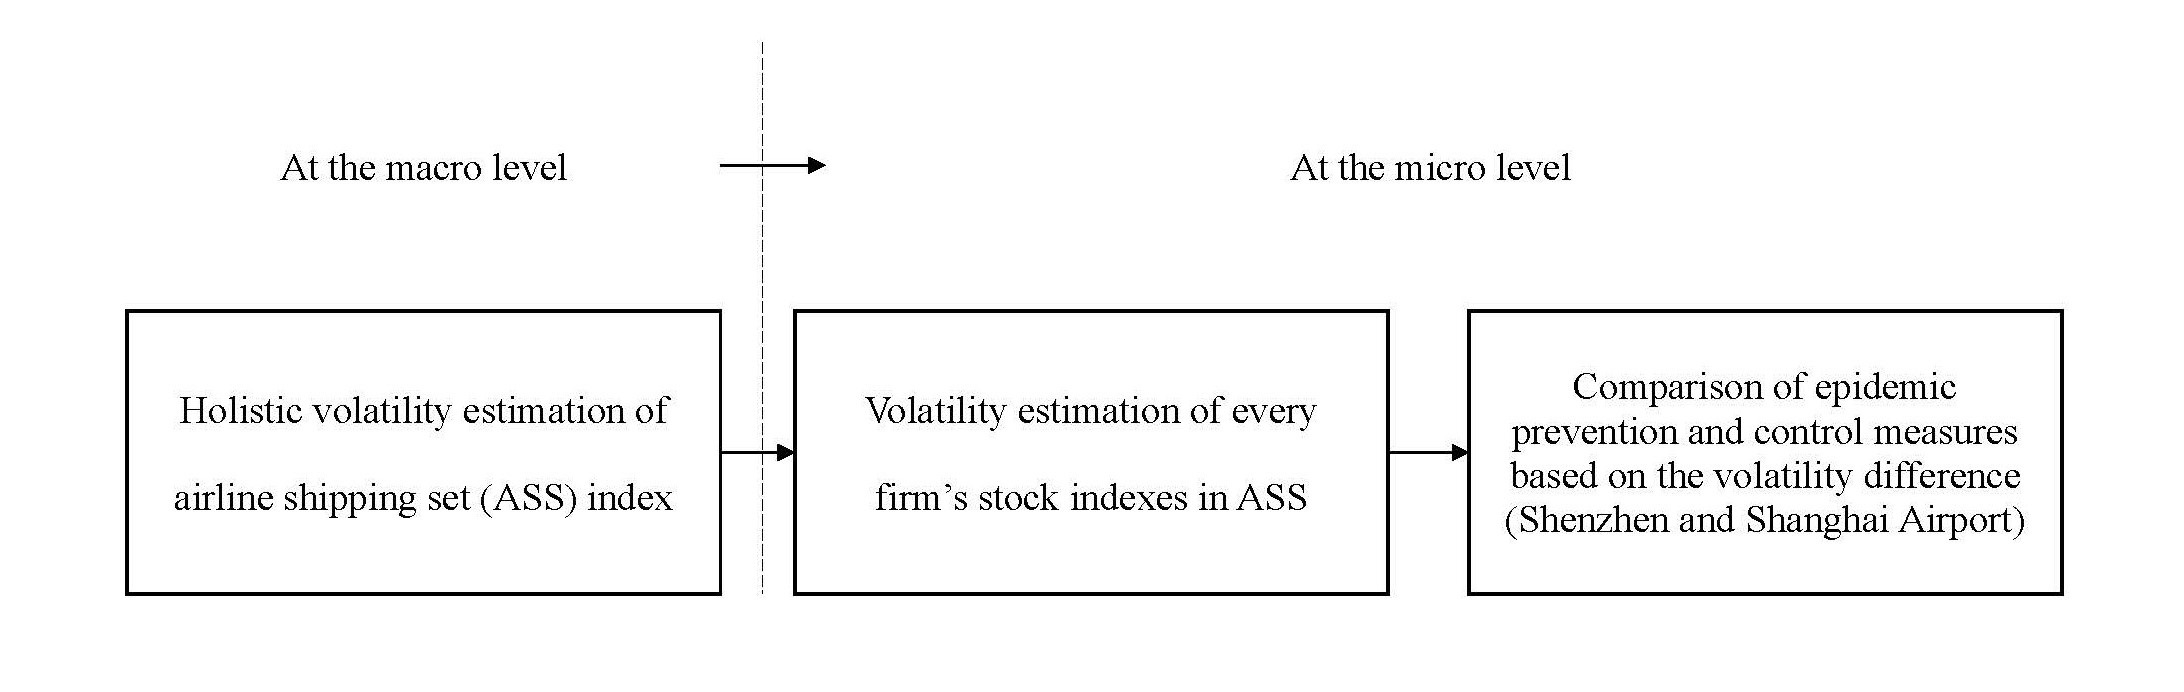
2.2. Methods
2.2.1. ARCH and GARCH Models
2.2.2. Text Mining Method
3. Results
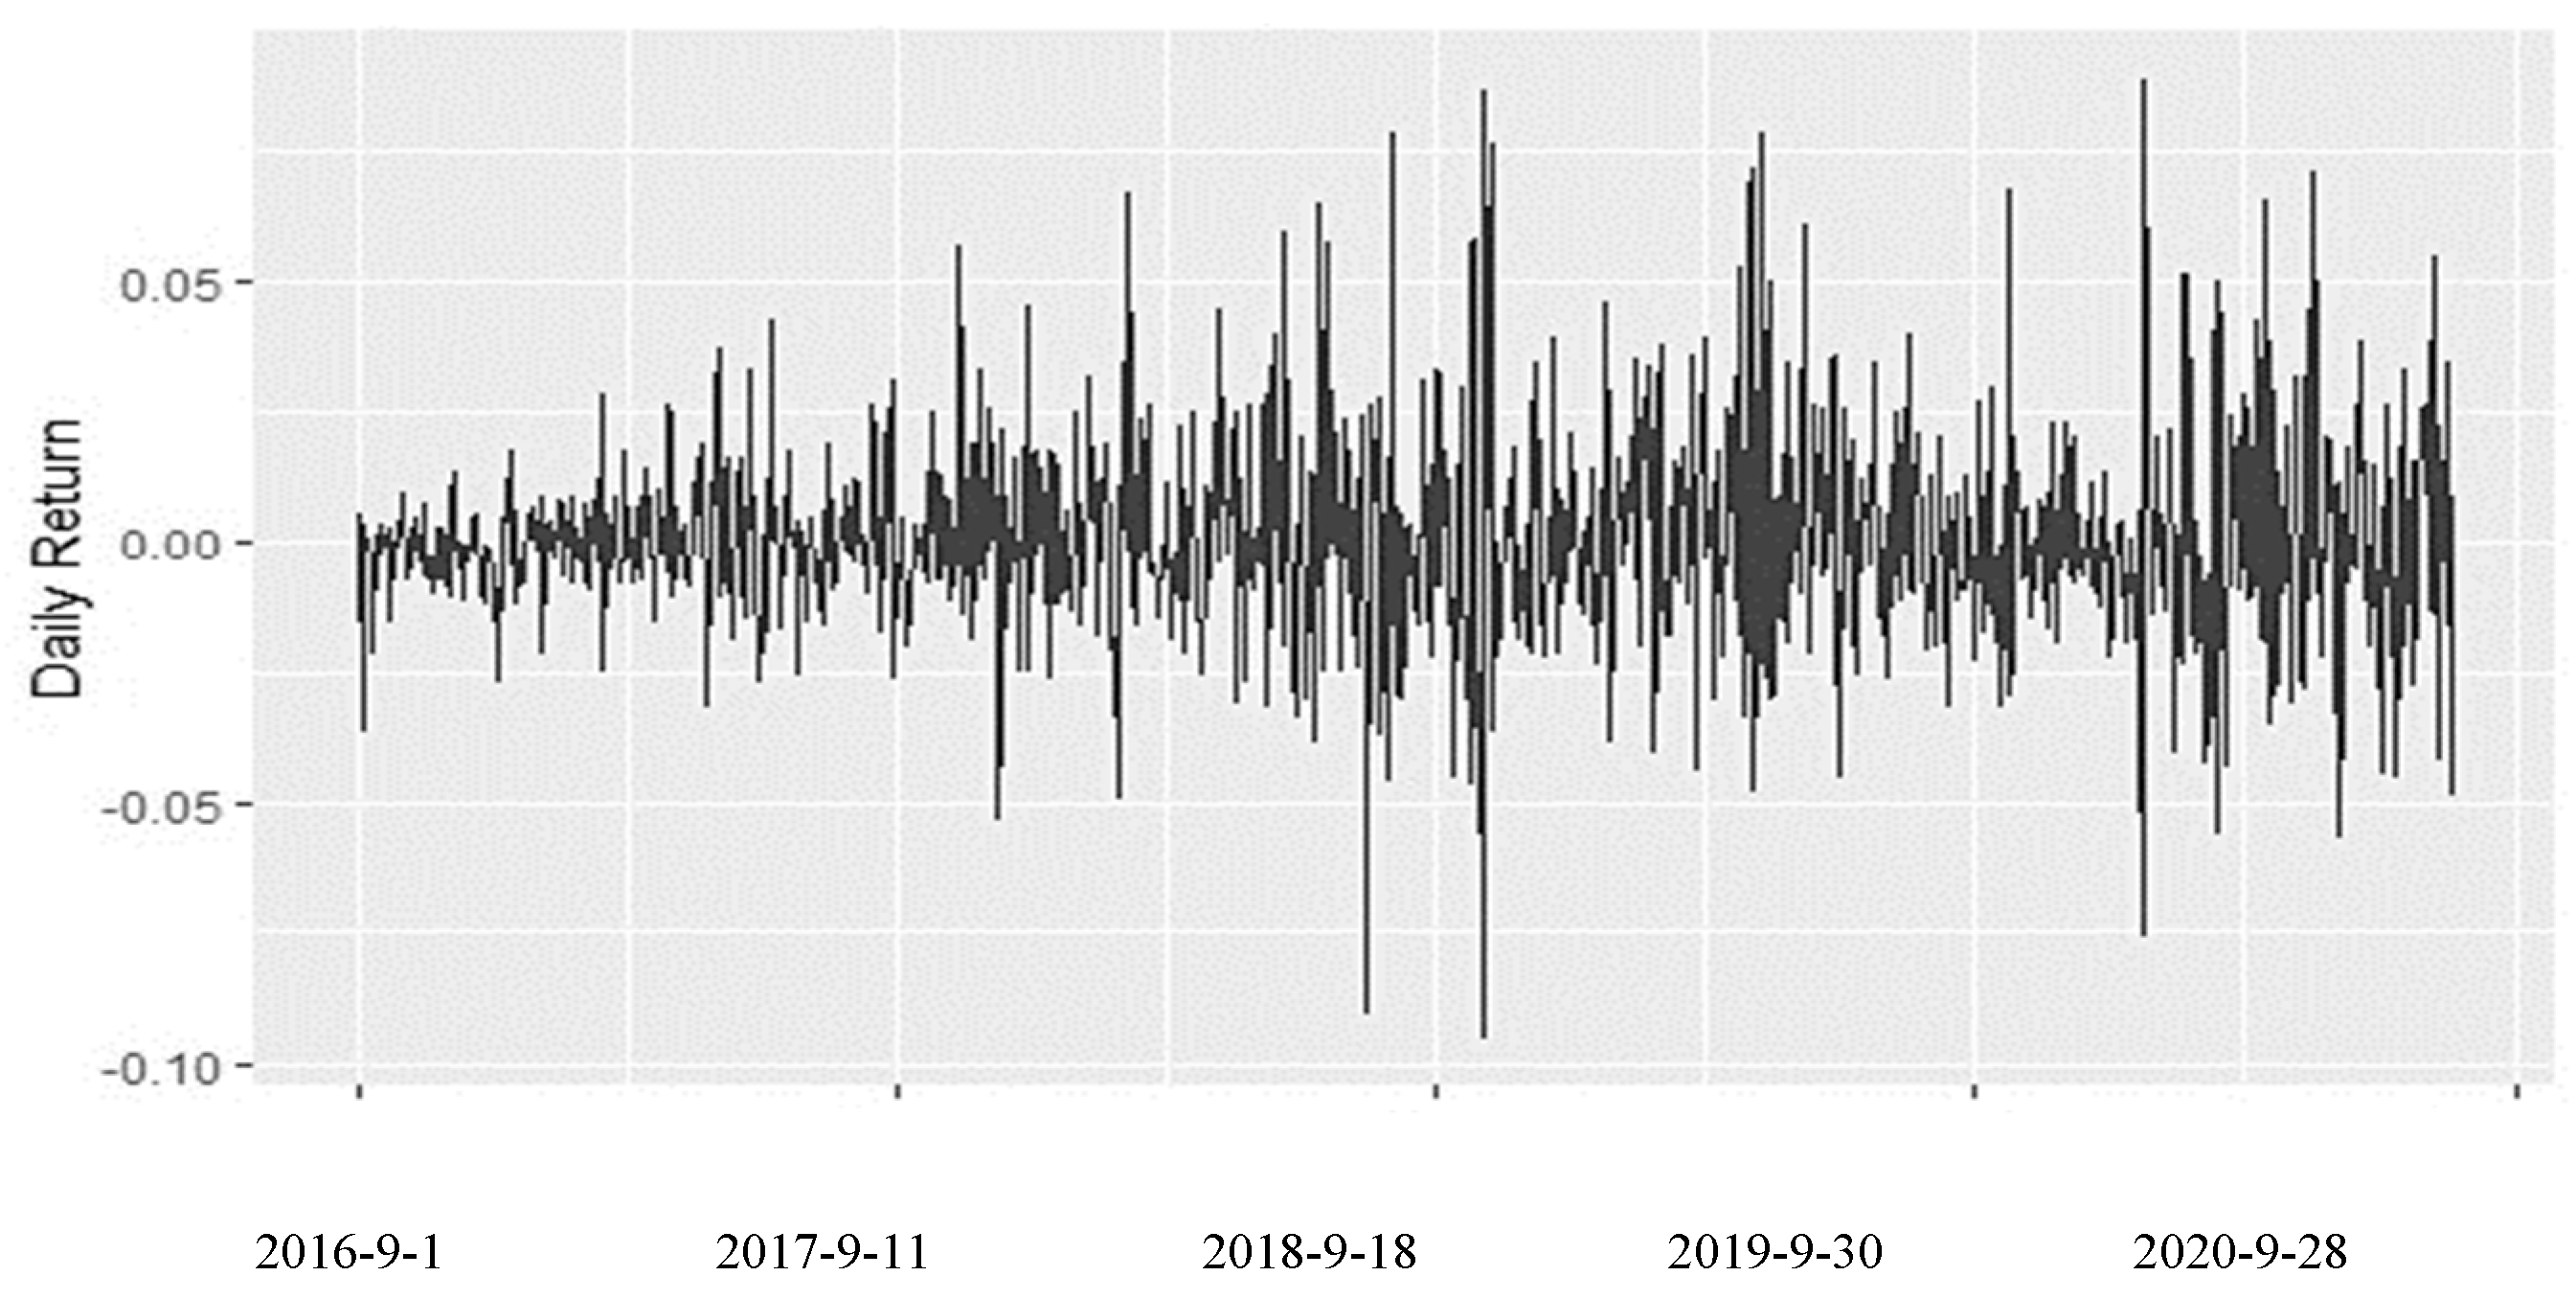
3.1. Empirical Results of the Airport Shipping Set Index
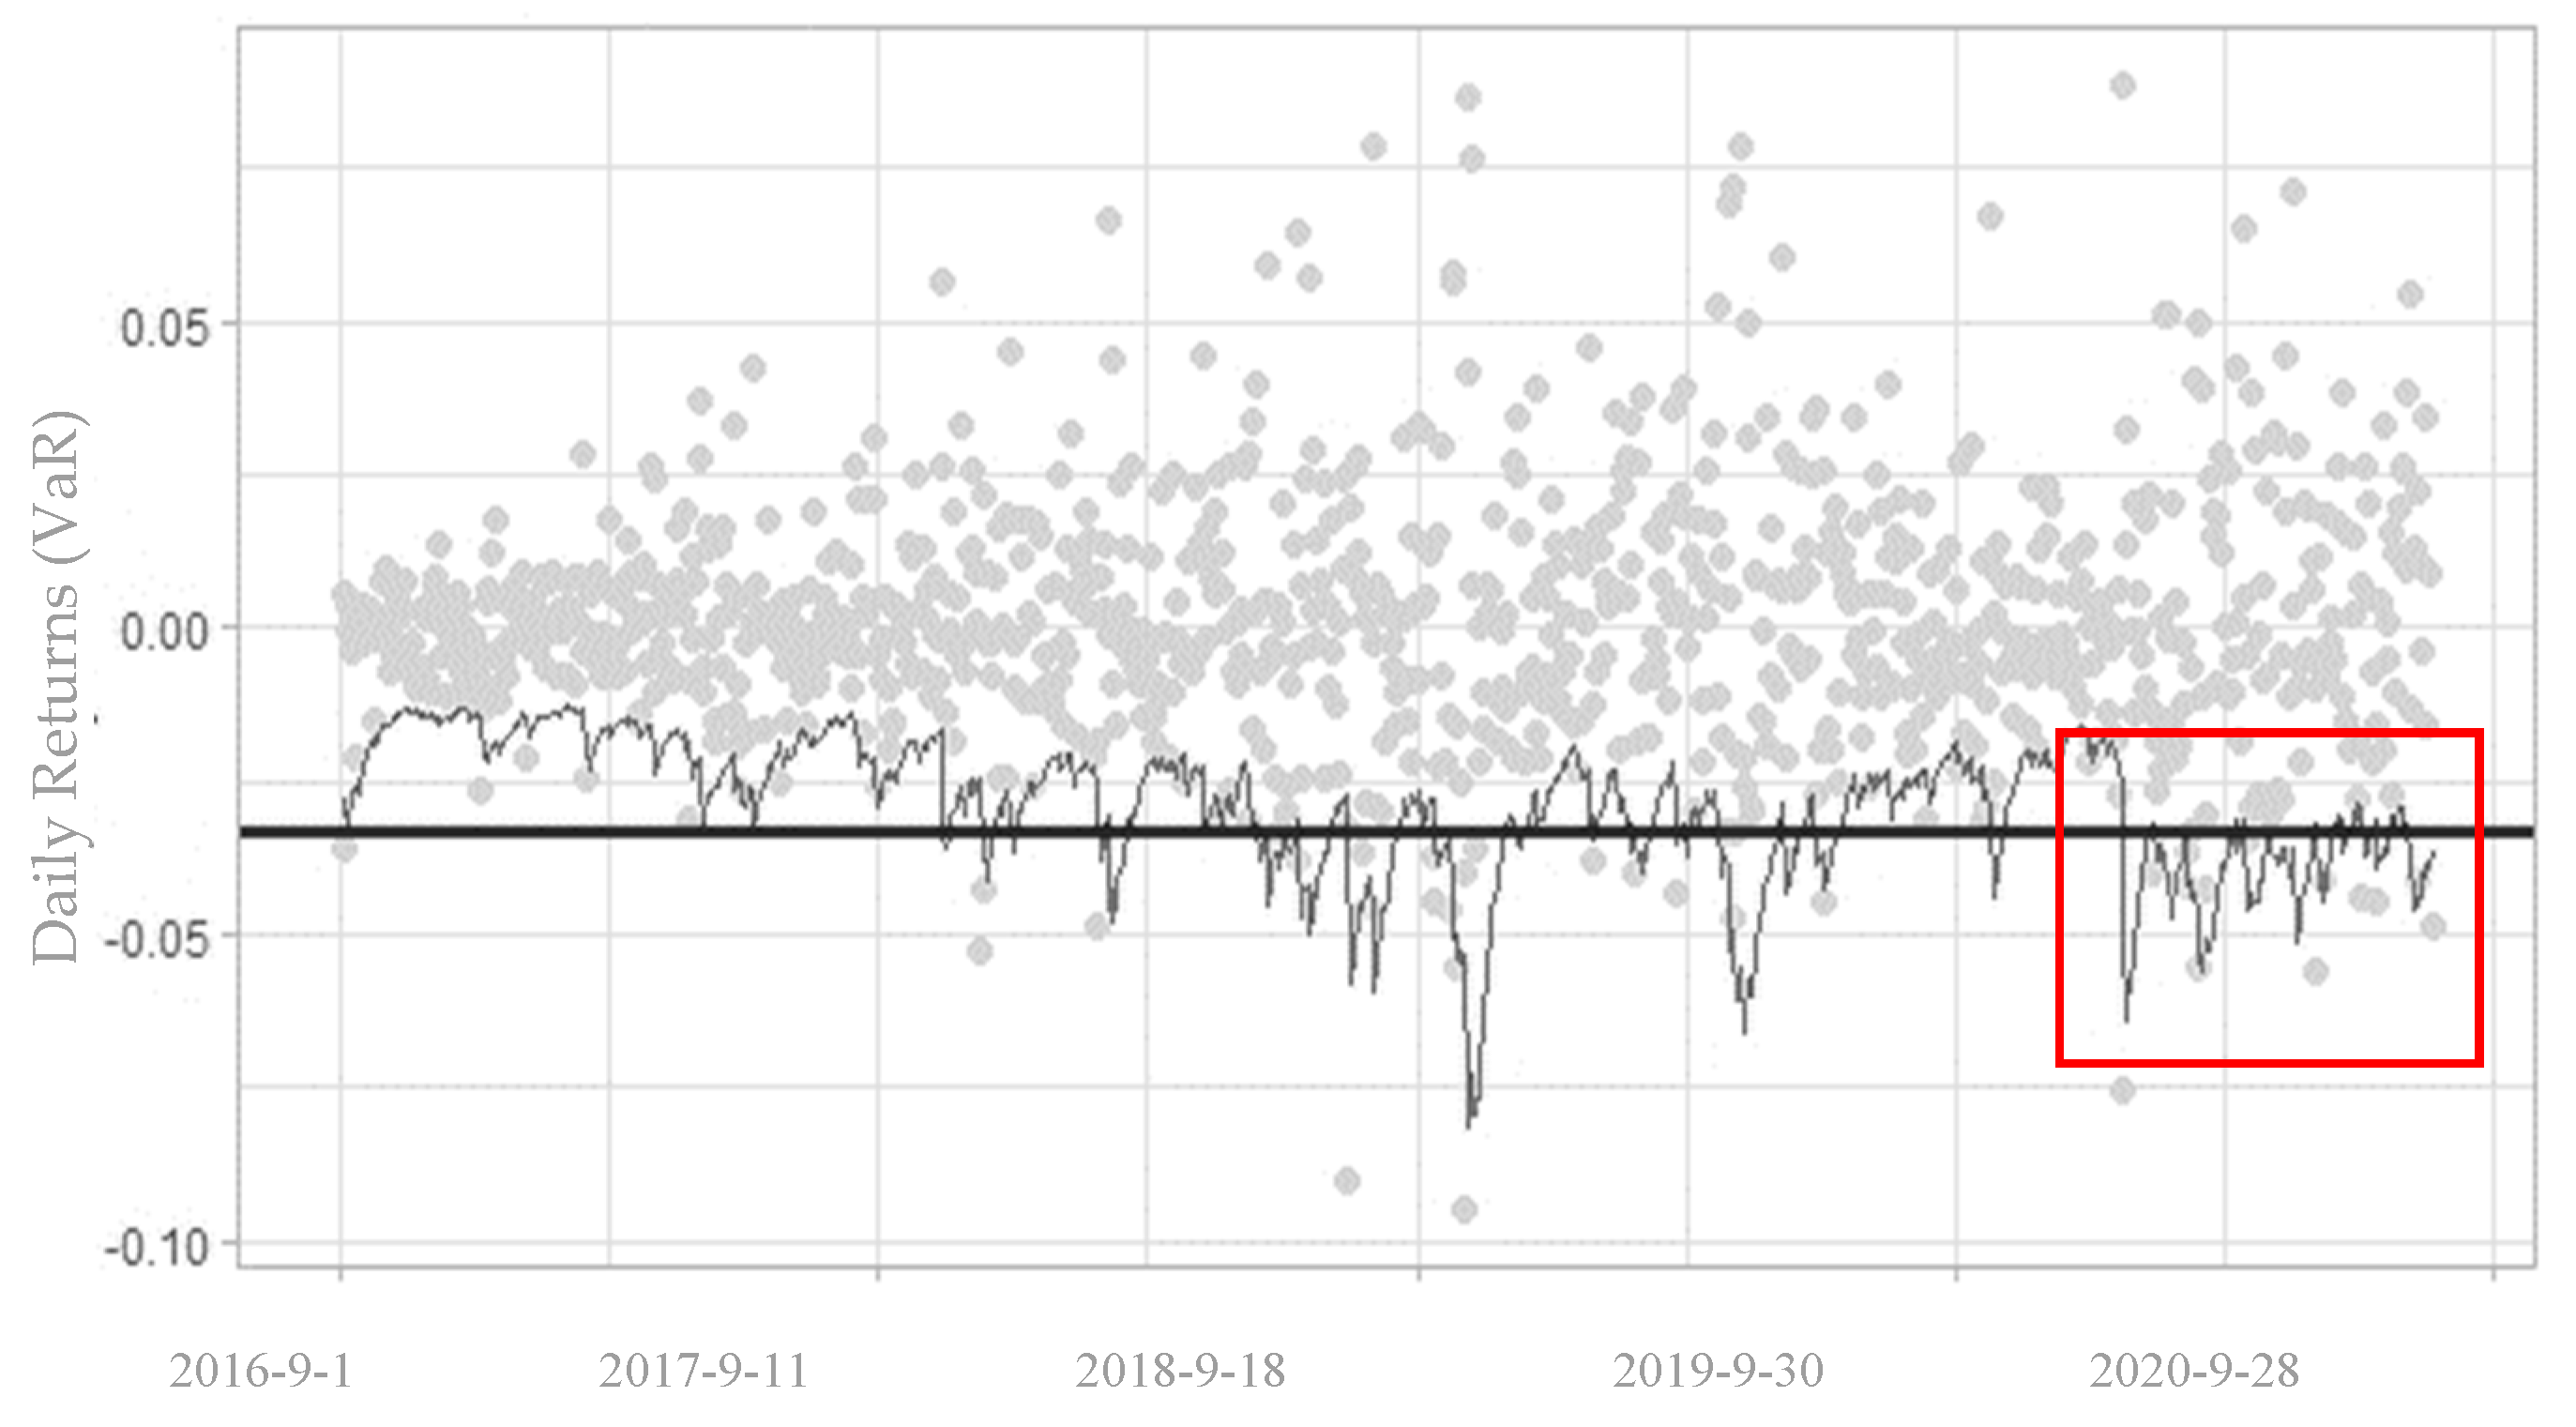
3.1.1. Empirical Results
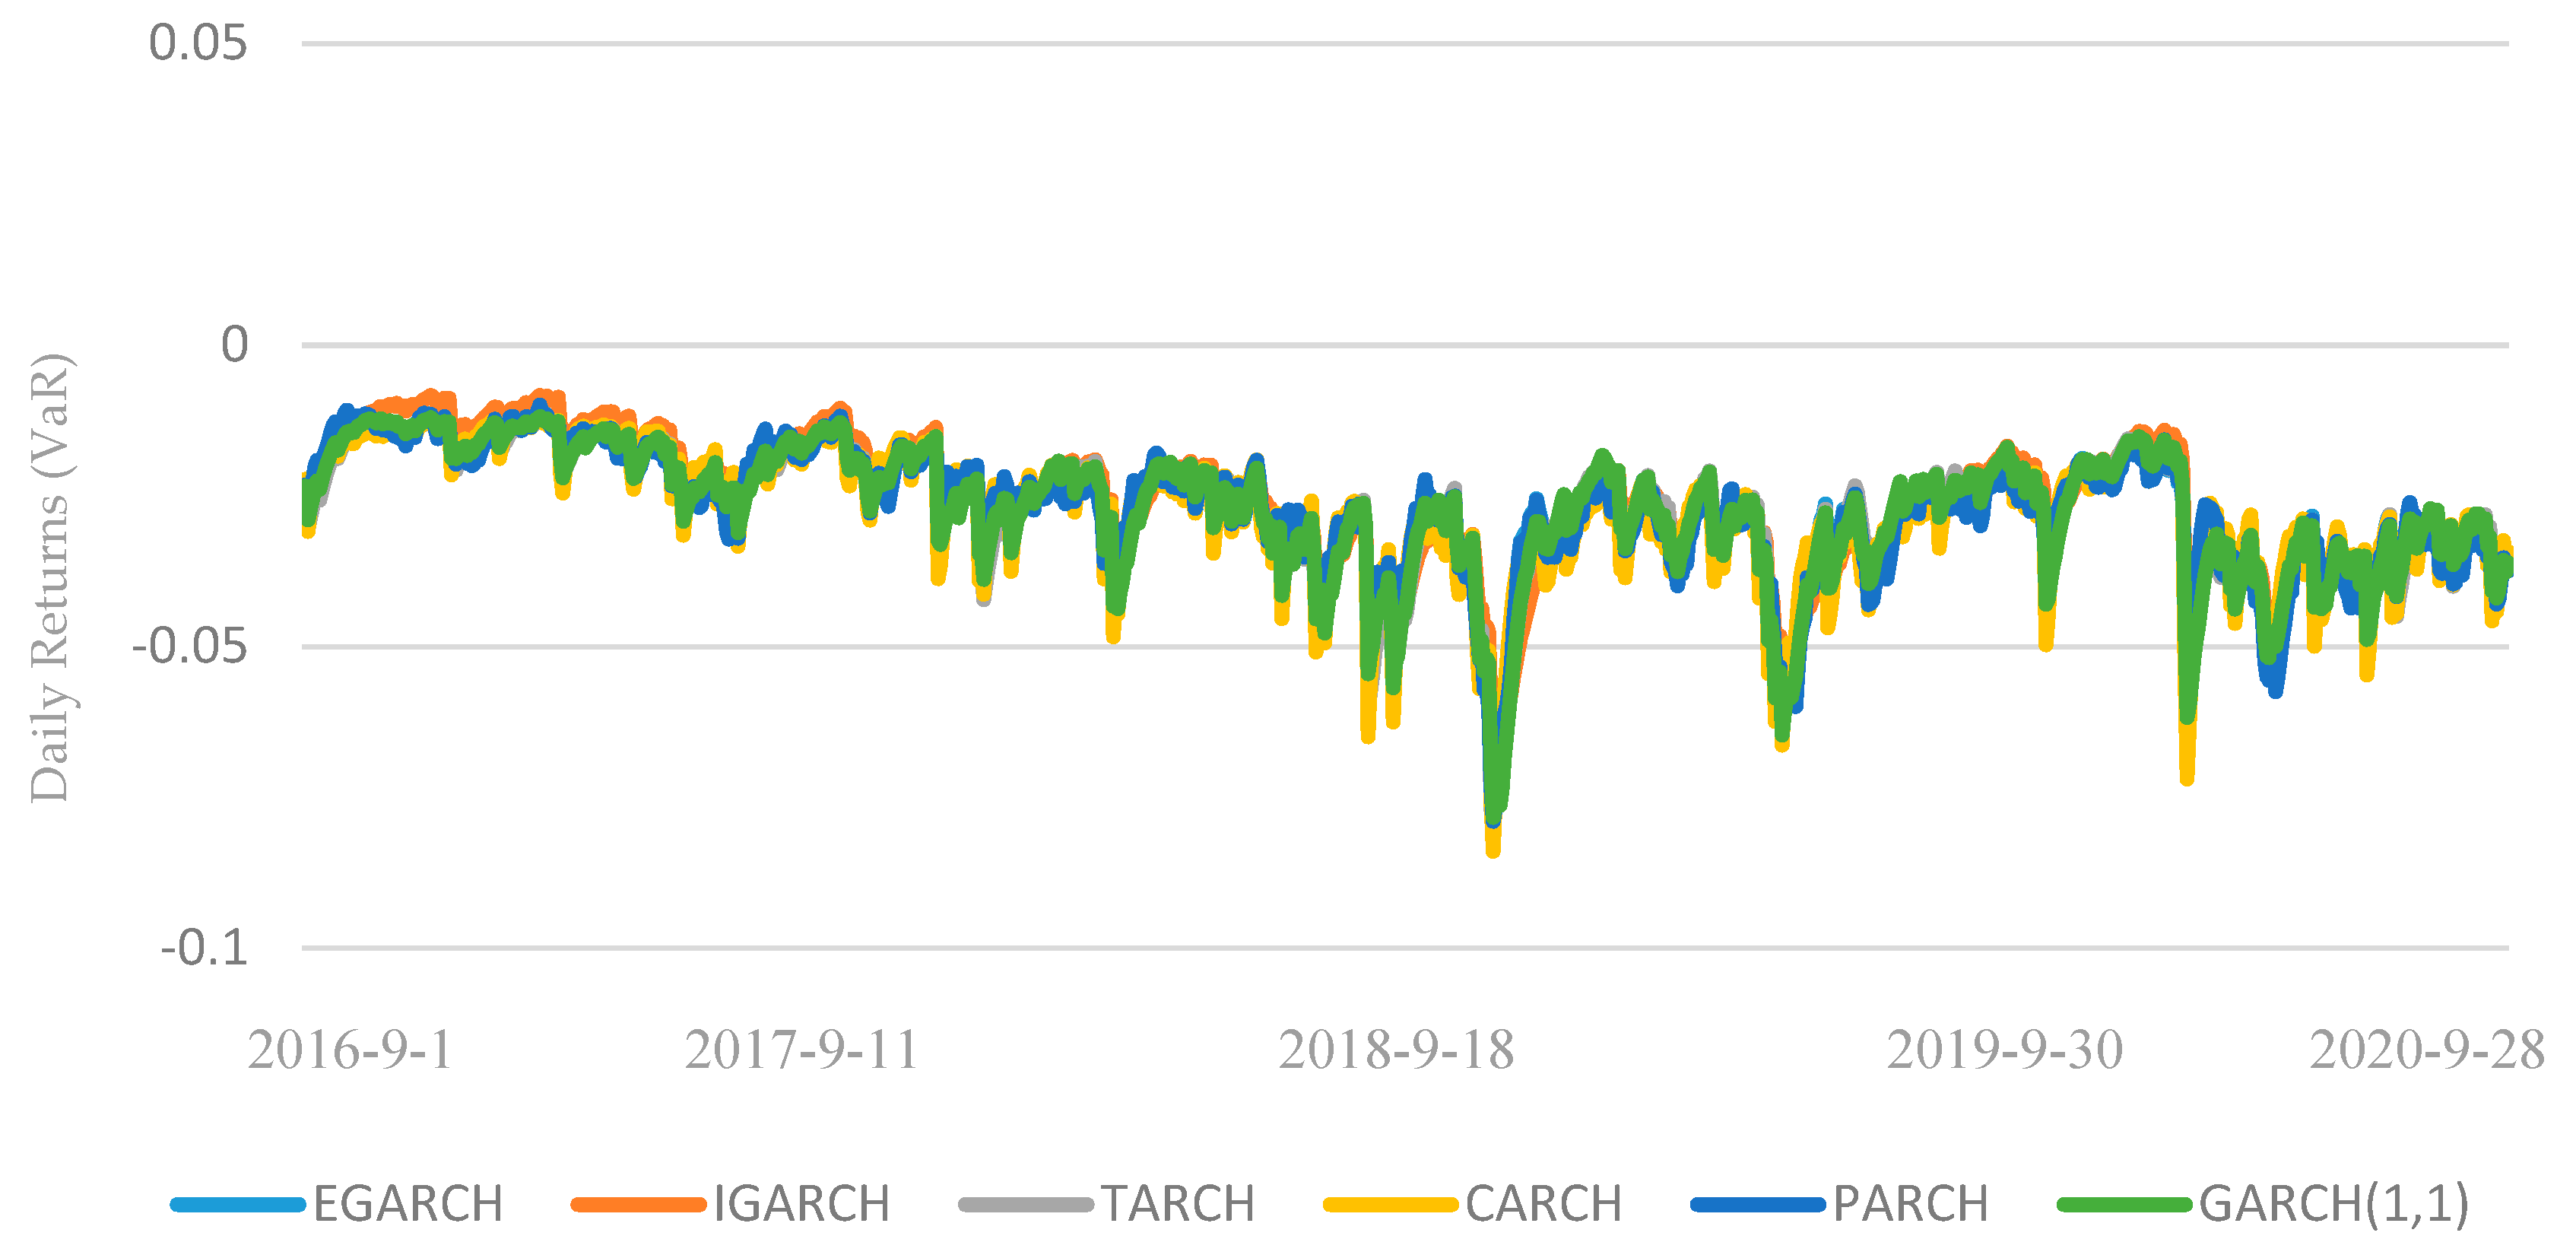
3.1.2. Robustness Checks
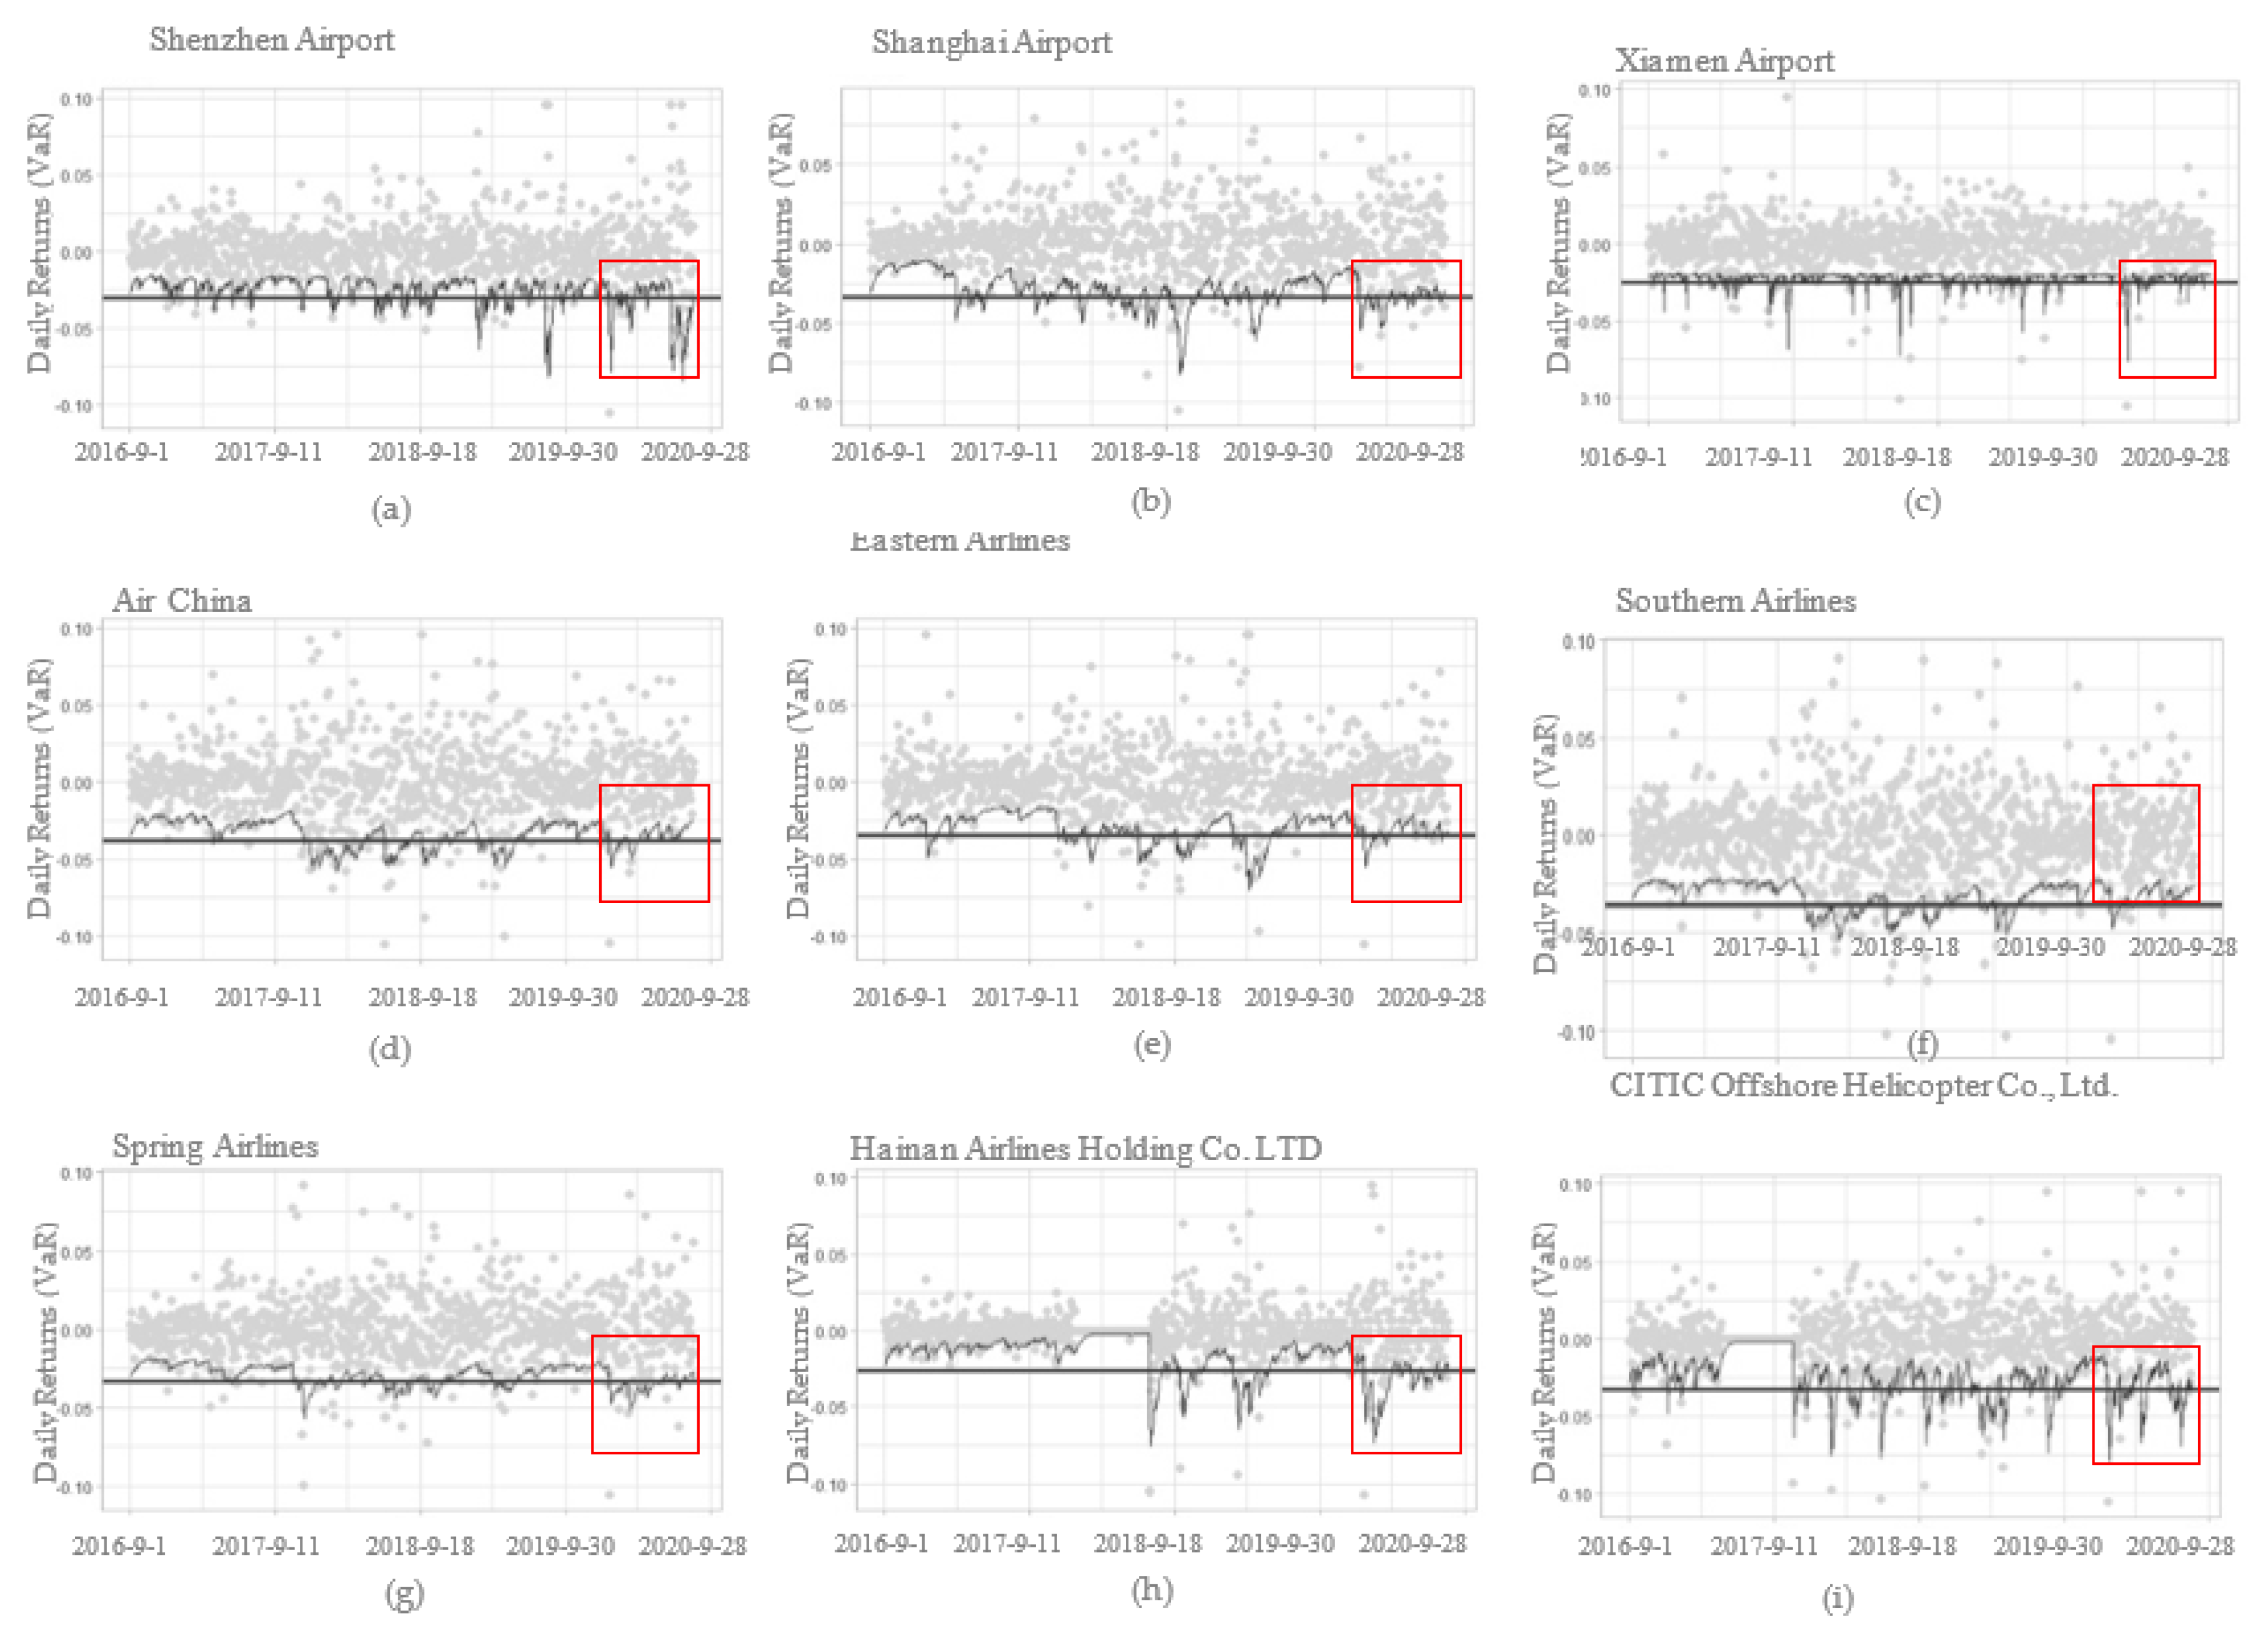
3.2. Empirical Results of Stock Index of Every Company in the ASS
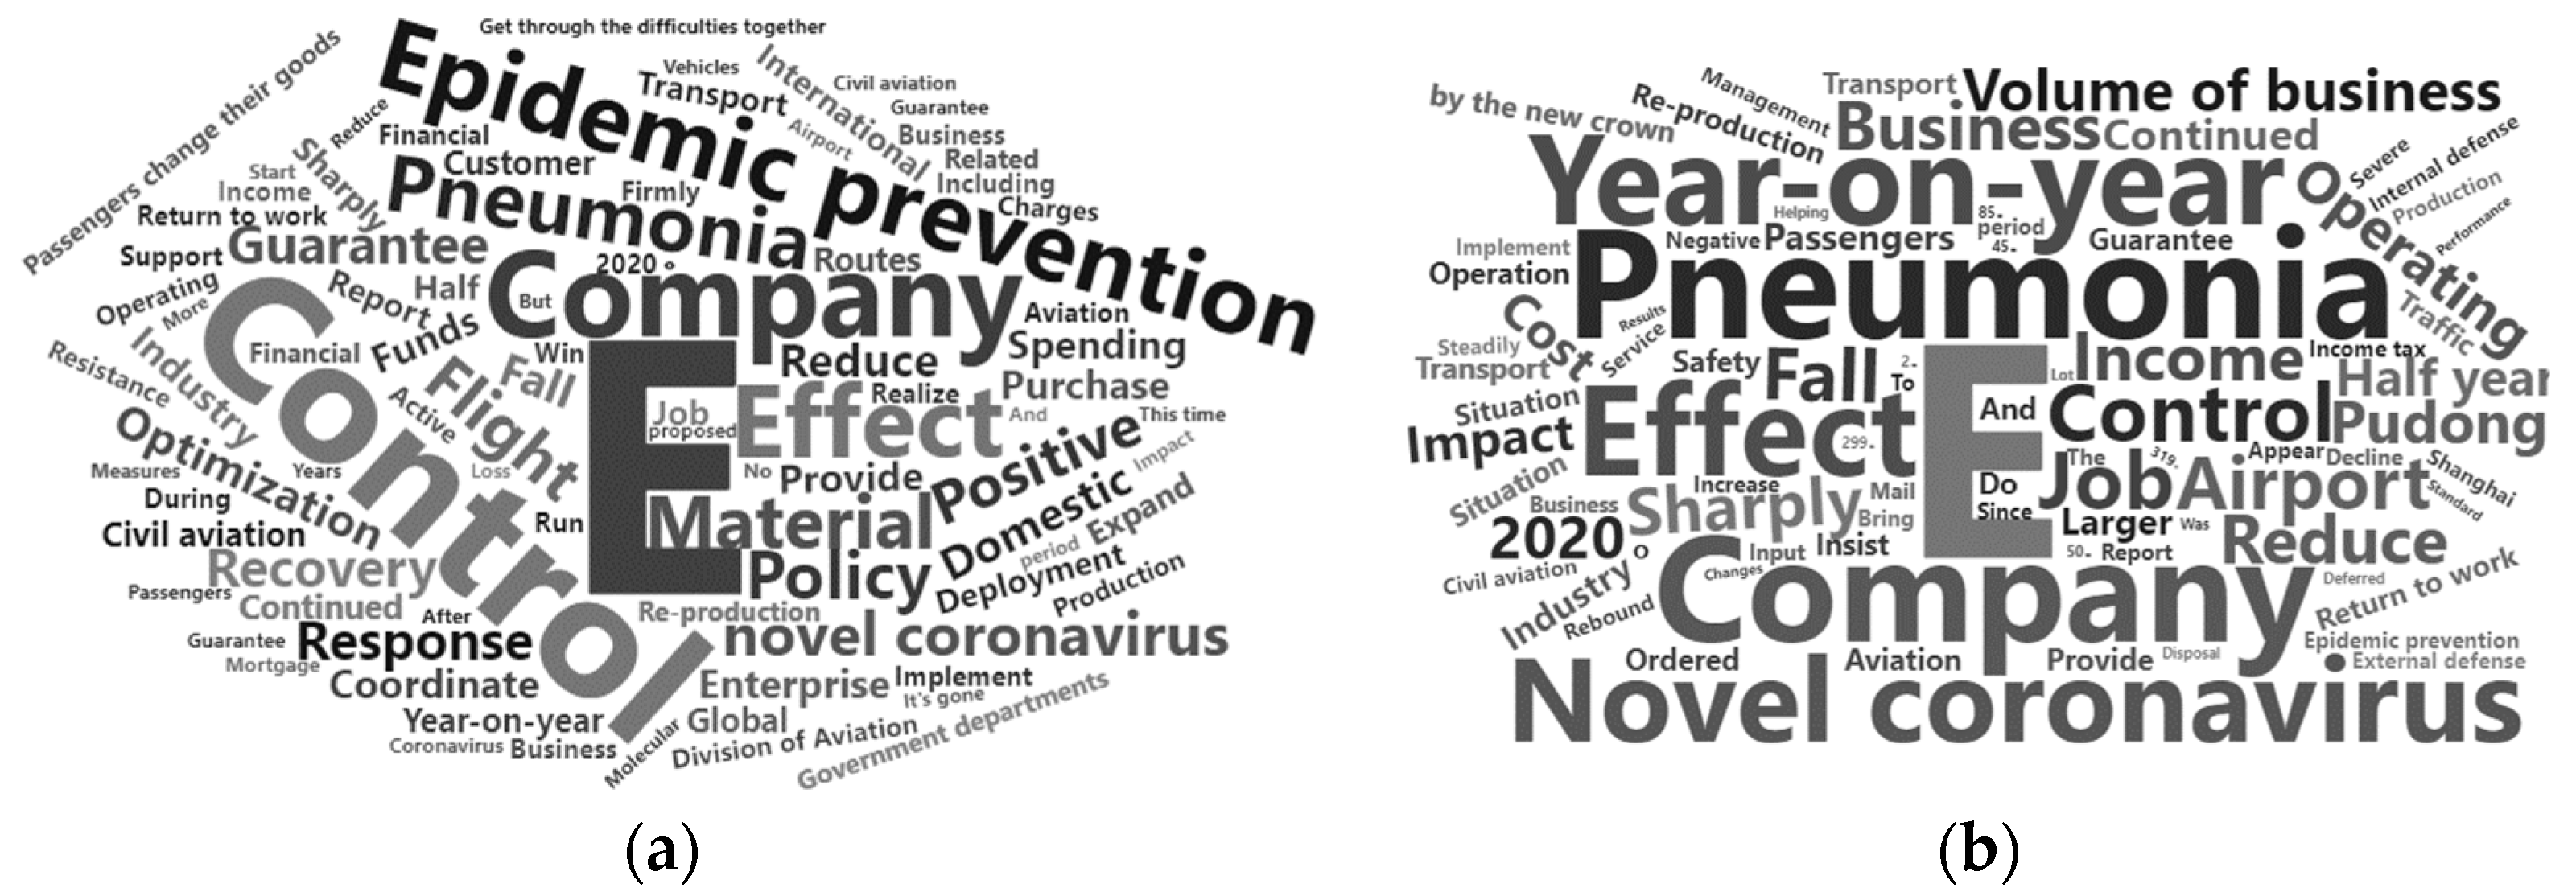
3.3. Word Could of Half Reports Related to Epidemic between Shenzhen Airport and Shanghai Airport
4. Discussion and Implications
4.1. Theoretical Implications
4.2. Practical Implications
4.3. Limitation and Future Research
5. Conclusions
Author Contributions
Funding
Acknowledgments
Conflicts of Interest
References
- Akhtaruzzaman, Md, Sabri Boubaker, Mardy Chiah, and Angel Zhong. 2020a. COVID−19 and Oil Price Risk Exposure. Available online: https://ssrn.com/abstract=3650151 (accessed on 21 May 2020).
- Akhtaruzzaman, Md, Sabri Boubaker, Brian M Lucey, and Ahmet Sensoy. 2020b. Is Gold a Hedge or Safe Haven Asset during COVID–19 Crisis? Available online: https://ssrn.com/abstract=3621358 (accessed on 21 May 2020). [CrossRef]
- Akhtaruzzaman, Md, Sabri Boubaker, and Ahmet Sensoy. 2020c. Financial contagion during COVID–19 crisis. Finance Research Letters, 101604. [Google Scholar] [CrossRef]
- Angelidis, Timotheos, Alexandros Benos, and Stavros Degiannakis. 2004. The use of GARCH models in VaR estimation. Statistical Methodology 1: 105–28. [Google Scholar] [CrossRef] [Green Version]
- Ardia, David, Keven Bluteau, and Maxime Rüede. 2019. Regime changes in Bitcoin GARCH volatility dynamics. Finance Research Letters 29: 266–71. [Google Scholar] [CrossRef]
- Australian Department of Health. 2019. Coronavirus (COVID-19) Health Alert. Available online: https://www.health.gov.au/news/health-alerts/novel-coronavirus-2019-ncov-health-alert (accessed on 21 May 2020).
- Bollerslev, Tim. 1986. Generalized autoregressive conditional heteroskedasticity. Journal of Econometrics 31: 307–27. [Google Scholar] [CrossRef] [Green Version]
- Chen, Yi-Wen, Chu-Bin Lin, and Anthony H Tu. 2019. Regime-Switching Processes and Mean-Reverting Volatility Models in Value-at-Risk Estimation: Evidence from the Taiwan Stock Index. Emerging Markets Finance and Trade 56: 1–18. [Google Scholar] [CrossRef]
- Chin, Ken Lee, Richard Ofori-Asenso, Kaylee A. Jordan, Daryl Jones, and Danny Liew. 2020. Early signs that COVID-19 is being contained in Australia. The Journal of Infection. in press. [Google Scholar] [CrossRef]
- Claussen, Jorg, Christian Essling, and Christian Peukert. 2018. Demand variation, strategic flexibility and market entry: Evidence from the U.S. airline industry. Strategic Management Journal 39: 2877–98. [Google Scholar] [CrossRef]
- Donthu, Naveen, and Anders Gustafsson. 2020. Effects of COVID-19 on Business and Research. Journal of Business Research 117: 284–89. [Google Scholar] [CrossRef]
- Engle, Robert F. 1982. Autoregressive conditional heteroscedasticity with estimates of the variance of United Kingdom inflation. Conometrica: Journal of the Econometric Society 50: 987–1007. [Google Scholar] [CrossRef]
- Fan, Di, Yi Li, Wei Liu, Xiao-Guang Yue, and Georgios Boustras. 2020. Weaving public health and safety nets to respond the COVID-19 pandemic. Safety Science 134: 105058. [Google Scholar] [CrossRef]
- Goodell, John W. 2020. COVID-19 and finance: Agendas for future research. Finance Research Letters, 101512. [Google Scholar] [CrossRef]
- Gössling, Stefan, Daniel Scott, and C. Michael Hall. 2020. Pandemics, tourism and global change: A rapid assessment of COVID-19. Journal of Sustainable Tourism 29: 1–20. [Google Scholar] [CrossRef]
- Han, Yan, Xue-Feng Shao, Xin Cui, Xiao-Guang Yue, Kelvin Joseph Bwalya, and Otilia Manta. 2019. Assessing Investor Belief: An Analysis of Trading for Sustainable Growth of Stock Markets. Sustainability 11: 5600. [Google Scholar] [CrossRef] [Green Version]
- He, Hongwei, and Lloyd Harris. 2020. The impact of Covid-19 pandemic on corporate social responsibility and marketing philosophy. Journal of Business Research 116: 176–82. [Google Scholar] [CrossRef] [PubMed]
- He, Wu, Shenghua Zha, and Ling Li. 2013. Social media competitive analysis and text mining: A case study in the pizza industry. International Journal of Information Management 33: 464–72. [Google Scholar] [CrossRef]
- Heimerl, Florian, Steffen Lohmann, Simon Lange, and Thomas Ertl. 2014. Word cloud explorer: Text analytics based on word clouds. Paper presented at 2014 47th Hawaii International Conference on System Sciences, Waikoloa, HI, USA, January 6–9. [Google Scholar]
- Huang, Chaolin, Yeming Wang, Xingwang Li, Lili Ren, Jianping Zhao, Yi Hu, Li Zhang, Guohui Fan, Jiuyang Xu, Xiaoying Gu, and et al. 2020. Clinical features of patients infected with 2019 novel coronavirus in Wuhan, China. The Lancet 395: 497–506. [Google Scholar] [CrossRef] [Green Version]
- Katsiampa, Paraskevi. 2017. Volatility estimation for Bitcoin: A comparison of GARCH models. Economics Letters 158: 3–6. [Google Scholar] [CrossRef] [Green Version]
- Liu, Wei, Xuefeng Shao, Marco De Sisto, and Wen Helena Li. 2020a. A New Approach for Addressing Endogeneity Issues in the Relationship Between Corporate Social Responsibility and Corporate Financial Performance. Finance Research Letters, 101623. [Google Scholar] [CrossRef]
- Liu, Wei, Xiao-Guang Yue, and Paul B Tchounwou. 2020b. Response to the COVID-19 Epidemic: The Chinese Experience and Implications for Other Countries. International Journal of Environmental Research and Public Health 17: 2304. [Google Scholar] [CrossRef] [Green Version]
- Loh, Elaine. 2006. The impact of SARS on the performance and risk profile of airline stocks. International Journal of Transport Economics 33: 401–22. [Google Scholar]
- Meyer, David, Kurt Hornik, and Ingo Feinerer. 2008. Text mining infrastructure in R. Journal of Statistical Software 25: 1–54. [Google Scholar] [CrossRef] [Green Version]
- Pearce, Brian. 2020. IATA Economic Reports: COVID-19 Updated Impact Assessment of the Novel Coronavirus. Available online: https://www.iata.org/en/iata-repository/publications/economic-reports/coronavirus-updated-impact-assessment/ (accessed on 21 May 2020).
- Qiu, Yun, Xi Chen, and Wei Shi. 2020. Impacts of social and economic factors on the transmission of coronavirus disease 2019 (COVID-19) in China. Journal of Population Economics 33: 1127–72. [Google Scholar] [CrossRef]
- Shaked, Israel, and Brad Orelowitz. 2020. The airline industry and COVID-19: Saving for a rainy day. American Bankruptcy Institute Journal 39: 36–37, 57–58. [Google Scholar]
- Sharif, Arshian, Chaker Aloui, and Larisa Yarovaya. 2020. COVID-19 pandemic, oil prices, stock market, geopolitical risk and policy uncertainty nexus in the US economy: Fresh evidence from the wavelet-based approach. International Review of Financial Analysis 70: 101496. [Google Scholar] [CrossRef]
- Slater, Adam. 2020. The economic cost of coronavirus lockdowns. Oxford Economics 44: 17–19. [Google Scholar]
- Wang, Chaolong, Li Liu, Xingjie Hao, Huan Guo, Qi Wang, Jiao Huang, Na He, Hongjie Yu, Xihong Lin, An Pan, and et al. 2020. Evolving epidemiology and impact of non-pharmaceutical interventions on the outbreak of coronavirus disease 2019 in Wuhan, China. JAMA 323: 1915–23. [Google Scholar]
- Worldometer. 2020. COVID-19 Coronavirus Pandemic. Available online: https://www.worldometers.info/coronavirus/ (accessed on 21 May 2020).
- Yue, Xiao-Guang, Xue-Feng Shao, Rita Yi Man Li, M James C Crabbe, Lili Mi, Siyan Hu, Julien S Baker, and Gang Liang. 2020a. Risk management analysis for novel Coronavirus in Wuhan, China. Journal of Risk and Financial Management 13: 22. [Google Scholar] [CrossRef] [Green Version]
- Yue, Xiao-Guang, Xue-Feng Shao, Rita Yi Man Li, M James C Crabbe, Lili Mi, Siyan Hu, Julien S Baker, Liting Liu, and Kechen Dong. 2020b. Risk Prediction and Assessment: Duration, Infections, and Death Toll of the COVID-19 and Its Impact on China’s Economy. Journal of Risk Financial Management 13: 66. [Google Scholar] [CrossRef] [Green Version]


| Statistical Indicators | Value | Statistical Indicators | Value |
|---|---|---|---|
| Mean | 0.0009 | Kurtosis | 2.6742 |
| Median | −0.0004 | Maximum | 0.0887 |
| Std | 0.0203 | Minimum | −0.0950 |
| Skewness | 0.3766 | Jarque-Bera | 314.9 *** |
| Tests | ||||
|---|---|---|---|---|
| Augmented Dickey-Fuller (ADF) test | Dickey-Fuller | −9.98 ** | ||
| Box-Ljung test (residuals) | Chi-squared | 8.57 *** | df | 10 |
| ARCH LM test | Chi-squared | 96.44 *** | df | 5 |
| GARCH (1,1) | GARCH (1,2) | GARCH (2,1) | GARCH (2,2) | |
|---|---|---|---|---|
| Akaike Information Criterion (AIC) | −5.162853 | −5.162353 | −5.160264 | −5.160293 |
| Bayesian Information Criterion (BIC) | −5.142757 | −5.137233 | −5.135144 | −5.130149 |
| Hannan-Quinn Criterion (HQ) | −5.155205 | −5.152792 | −5.150703 | −5.14882 |
| Box-Ljung test (r^2, lag = 10) | 9.3356 | 8.1959 | 9.2639 | 8.1959 |
| (0.5006) | (0.6097) | (0.5073) | (0.6097) | |
| Box-Ljung test (r^2, lag = 15) | 12.206 | 11.014 | 12.061 | 11.014 |
| (0.6634) | (0.7516) | (0.6744) | (0.7516) | |
| Box-Ljung test (r^2, lag = 20) | 19.025 | 18.738 | 18.981 | 18.738 |
| (0.5202) | (0.5389) | (0.5230) | (0.5389) | |
| ARCH LM test (r, lag = 10) | 9.195 | 8.0594 | 9.1165 | 8.0594 |
| (0.5137) | (0.623) | (0.5211) | (0.6230) | |
| ARCH LM test (r, lag = 15) | 11.943 | 10.712 | 11.833 | 10.712 |
| (0.6833) | (0.7728) | (0.6916) | (0.7728) | |
| ARCH LM test (r, lag = 20) | 18.822 | 18.103 | 18.807 | 18.103 |
| (0.5334) | (0.5806) | (0.5344) | (0.5806) |
| Coefficient | Estimate | Std. Error | t Value |
|---|---|---|---|
| ω | 0.00 | 0.00 | 2.44 ** |
| α | 0.136 | 0.03 | 5.12 *** |
| β | 0.859 | 0.03 | 33.09 *** |
Publisher’s Note: MDPI stays neutral with regard to jurisdictional claims in published maps and institutional affiliations. |
© 2020 by the authors. Licensee MDPI, Basel, Switzerland. This article is an open access article distributed under the terms and conditions of the Creative Commons Attribution (CC BY) license (http://creativecommons.org/licenses/by/4.0/).
Share and Cite
Liu, J.; Qiao, P.; Ding, J.; Hankinson, L.; Harriman, E.H.; Schiller, E.M.; Ramanauskaite, I.; Zhang, H. Will the Aviation Industry Have a Bright Future after the COVID-19 Outbreak? Evidence from Chinese Airport Shipping Sector. J. Risk Financial Manag. 2020, 13, 276. https://0-doi-org.brum.beds.ac.uk/10.3390/jrfm13110276
Liu J, Qiao P, Ding J, Hankinson L, Harriman EH, Schiller EM, Ramanauskaite I, Zhang H. Will the Aviation Industry Have a Bright Future after the COVID-19 Outbreak? Evidence from Chinese Airport Shipping Sector. Journal of Risk and Financial Management. 2020; 13(11):276. https://0-doi-org.brum.beds.ac.uk/10.3390/jrfm13110276
Chicago/Turabian StyleLiu, Jingxuan, Ping Qiao, Jian Ding, Luke Hankinson, Elodie H. Harriman, Edward M. Schiller, Ieva Ramanauskaite, and Haowei Zhang. 2020. "Will the Aviation Industry Have a Bright Future after the COVID-19 Outbreak? Evidence from Chinese Airport Shipping Sector" Journal of Risk and Financial Management 13, no. 11: 276. https://0-doi-org.brum.beds.ac.uk/10.3390/jrfm13110276