
Inflation and Hyperinflation Countries in 2018–2020: Risks of Different Assets and Foreign Trade

1
Kouvola Unit, LUT University, Tykkitie 1, 45100 Kouvola, Finland
2
Estonian Maritime Academy, Tallinn University of Technology (Taltech), Kopli 101, 11712 Tallinn, Estonia
J. Risk Financial Manag. 2021, 14(12), 618; https://0-doi-org.brum.beds.ac.uk/10.3390/jrfm14120618
Submission received: 18 November 2021
/
Revised: 9 December 2021
/
Accepted: 15 December 2021
/
Published: 20 December 2021
(This article belongs to the Special Issue International Trade Theory and Policy)
Abstract
:Since the global financial crisis (2008–2009), central banks and governments in developed countries have relied upon loose monetary and financial policy. In the coronavirus pandemic era, these policies were taken even more to the extreme. In 2021, countries around the world started to experience product availability issues, and inflation in some cases was extremely high. There has been debate about the possibility of persistent high inflation. However, risks to assets and foreign trade in this new situation are unknown as all important hyperinflation cases are from decades to century-old. It is important to know what kind of implications high inflation has on modern economies. Therefore, in this study, 10 countries with the highest inflation were selected to be examined in the period of 2018–2020. In these countries, currencies lost a considerable amount of their value against US dollar in 2018–2020. Stock market indexes in many cases provided very high returns in local currency terms; however, against the US dollar, the index yield changed for the substantially negative. Apartment prices in general declined as well. In foreign trade, imports generally declined, while exports were mixed or even increased. However, it should be noted that all of these observations are influenced by the pandemic era and special circumstances of a particular country.
1. Introduction
During the second year of the coronavirus-induced global lockdowns, where the availability and movement of goods and resources have been somewhat limited, it became well-known in the first half of 2021 that some items had experienced rapid price hikes. For example, sawn wood (lumber) increased in the futures exchange from the range of USD 200–400 to as high as USD 1700 (peak in early May 2021; Investing.com 2021). Similarly, and rather simultaneously, a change in sea container freight rates was recorded to have the same price movements (SCFI 2021). Thereafter, sudden price increases were experienced in 2021, also within agricultural commodities (such as soybeans, oat, wheat, corn, etc.), metals (copper, silver, rhodium, iron, etc.), basic energy raw materials (coal, gas, and oils) as well as electricity. Together with these, it is rather interesting to find out that such extremely stable consumer price index items, such as used cars and trucks in the USA, increased in price by approx. 40% (U.S. Bureau of Labor Statistics 2021) from the first half of 2020 to the summer of 2021. Based on one definition, an increase in prices by 40% or more per annum could already be considered as high inflation (Frankel 2010). The entire price index data of used cars and trucks in the USA have not recorded any such rapid price change within a short period since the data became available in 1953 (U.S. Bureau of Labor Statistics 2021). The only possible point of comparison is the period of 1974–1977, but here, the price hike took three years to take effect. As is known from official statistics, inflation in the USA was above 5% for months in 2021 (in October 2021, it went above 6%), and using the old methodology of the 1980s, it is now approaching 15% (Shadowstats 2021). It is no wonder that in general media discussions throughout the world, it has been asked whether inflation will persist at this high level (not being transitory), and if it could reach even higher records in the forthcoming years (Schneider 2021). Nevertheless, some inflation is an important part of economic growth and supports sentiment (e.g., Batrancea 2021; Mallik and Chowdhury 2001), but of course this has its limitations. Developed economies have also recently indicated that a tradeoff between inflation and employment does not exist in its earlier form anymore, and therefore having high inflation does not necessarily correspond to a high or good employment situation (Mayer and Schnabl 2021). There are already some recent examples from countries other than developed ones, such as India, where both inflation and unemployment are growing together (Victor et al. 2021). The benefits of inflation seem to be waning.
Based on an old definition of inflation, the main cause of price increase is the change in the central bank’s monetary policy as well as the overall availability and the use of total spending money (Samuelson 1951; Bryan 1997; Hartwell 2019). Based on the old definition, simply increasing the availability of money will eventually result in increased prices—the higher amount of currency in circulation is now keeping pace with the amount of goods and services. As production and logistics were constrained in 2021, in many cases, a higher amount of money was met by a lower number of products. Hence, it is rather logical that prices increased as they have in 2021. Inflation has been on the side of physical products in 2021, however, as salaries are most probably going to increase due to these changes in product price, services are then likely to face price hikes with some delay. Even if the global pandemic could be tackled in the forthcoming year or two, inflation can persist at a high level for years. For example, in the aftermath of World War II (WW II), hyperinflation was experienced (Siyakiya 2015) in Greece (peak in 1944), Hungary (peak in 1946), and China (peak in 1949). Similarly, in the aftermath of World War I, Germany (peak in 1923) experienced its well-known hyperinflation period (Reghezza et al. 2020). Hyperinflation refers to a change in prices, which is by definition an increase of 50% or more per month, or 1000% or more per annum (Frankel 2010). Typically, getting out of some crisis is a very critical time for price increases, and the highest levels are often experienced then (or in addition, during war or revolution as stated by Samuelson 1951, p. 303). It is simply not a trivial task to bring production and logistics back to normal from times of crisis such as war. In addition, governments usually stimulate and tolerate high budget deficits in these times. The situation is rather similar now, at the end of 2021, with the global pandemic. For example, car manufacturers have huge problems to start normal production due to price and availability issues of used components (especially semi-conductors; see Krolikowski and Naggert 2021), and with the new waves of new virus variants, the situation could persist for a long time (Sheffi 2021).
High inflation or hyperinflation periods have not been that common or frequent after WW II (until 1984; Saboin-García 2018), and they have been concerning only some rather isolated countries; these have not been a threat for the entire global economy. For example, based on Siyakiya (2015), hyperinflation was experienced in Yugoslavia in the 1990s (peak in 1994; 313 mill.% monthly inflation), and Zimbabwe had a similar experience in the 2000s (peak in 2008; 79600 mill.% monthly inflation). In recent years, Venezuela has been going through hyperinflation (peak so far in 2019; 0.345 mill.% annual inflation; Trading Economics 2021). In all these three extreme and modern-day cases, there has been foreign trade sanctions set for a country (Petrović et al. 1999; Siyakiya 2015; Zakrison and Muntaner 2019). Therefore, it could be concluded that these hyperinflation periods are not only due to monetary policy; typically, there are numerous other symptoms, and international politics is also known to malfunction and contribute to price fluctuations as well. These promote the decline of production volumes in a country experiencing hyperinflation before the actual inflationary event reaches its hardest and its highest peak (in both Yugoslavia and Zimbabwe, production volume declined prior to hyperinflation, mostly due to set sanctions; Petrović et al. 1999; Siyakiya 2015). In Venezuela, international sanctions were set in 2014 (Zakrison and Muntaner 2019), and thereafter industrial production has been in decline (Trading Economics 2021). Hyperinflation followed this process in 2019. As trade and production suffer in hyperinflation, it is also known that entrepreneurship and the establishment of new companies are also hurt during times of inflation (Goschin et al. 2021). This could be one reason why foreign trade is so severely hurt in the later part of the inflationary process.
It has been known for a long time that during periods of inflation, savers (bank accounts/bank notes) are greatest losers in the process, and the best performance is provided by owning hard assets (such as real estate, land, forest, precious metals, etc.). It is of course tempting to own hard assets with depreciating currency loans if the owner is able to meet annuity (or interest) payments. However, nearly all of the earlier examples from periods of inflation and hyperinflation are from individual countries, and these cases are rather isolated. For example, during the Yugoslavian hyperinflation, people of this country had access to Central European job markets (such as the German one), and these other stable economies with strong currencies came to be favored in domestic trade (Petrović et al. 1999). The same applies to Zimbabwe being the neighbor of the more stable South Africa (Siyakiya 2015), while people in Venezuela have been seeking better living conditions and safety in Columbia and Brazil (Doocy et al. 2019). However, in the situation of the current pandemic and within its aftermath, inflation could be everywhere and in all countries simultaneously; thus, the usual alternative of turning to neighbors or nearby countries for a better life would be lower. In addition, in the modern age, communications, technologies, and new investment alternatives (e.g., cryptocurrencies and non-fungible tokens) are much more available than before. Therefore, this research work tries to examine inflations and hyperinflations that have occurred in ten selected countries in recent years. The selection was made with the prerequisite that these countries need to have information available and have some known public stock exchange. The point of interest in this research is to examine what happened to these countries during the 2018–2020 time period in terms of inflation, currency valuation, stock market performance, real estate prices, and foreign trade. The evaluations were mostly performed within global reserve currency terms (US dollar). The period ends in the first year of pandemic in order for some information to be gained from the time of the pandemic. The idea of this research is to provide a fresh contemporary update on inflation and hyperinflation. However, it is of course inevitable that the accuracy of this examination is a little bit lower as with studies that have some distance to the studied inflation period and could use, e.g., decades-long data (Saboin-García 2018). The research problem of this study could be expressed through the following question: What is the implication of high inflation (even hyper) on asset values and foreign trade within modern economies? As data sources for the examination of this stated problem, numerous second-hand data sources such as Trading Economics (2021); Investing.com (2021); Numbeo Service (2021); UN Comtrade Database (2021) were used.
This research is structured as follows: In Section 2, a literature review of inflation and hyperinflation is introduced. Thereafter, in Section 3, the research method, selected countries, and data gathering are presented. Analyses of ten selected countries concerning their currencies, stock market, real estate, and foreign trade are completed in Section 4. After these, Section 5 discusses valuation changes and the challenges faced by the world reserve currency, which is often used in economic evaluations, and what could be learned from Switzerland. The research is concluded in Section 6, where new avenues for research are also proposed.
2. Literature Review: Inflation and Hyperinflation
Since the end of the Bretton Woods currency system (effective in 1944–1971), the world has lived in the environment of numerous fiat currencies, which are just backed by the words of governments and their central banks. In the Bretton Woods system, the US dollar was priced in gold, and numerous other world currencies were tied to the USD with fixed rates. Countries having excessive USD holdings were then able to convert them to gold if they desired to do so. However, in the early 1970s, the economy of the USA went into the first major recessionary period after WW II, and in August 1971, Nixon broke the USD and gold relationship (he also introduced wage and price controls as well as import tariffs, e.g., Rickards 2012). Due to this and the raging stagflation, the USD became rather weak against other major currencies during the following decade (until 1981 and with the introduction of high interest rates). Interestingly, even Samuelson (1976, pp. 882–84) was forecasting the possibility that Soviet Union would reach (or even surpass) the USA in economic terms in the long run (during the period of 2000–2020). It is now well-known how poor this forecast was, but it illustrates well that in the new era of fiat currencies, the trust of the people in their country and its economy as well as its currency are central elements in sustained economic growth. Public trust is also a major factor in tackling the pressures of general inflation. In fact, in the Soviet bloc, public trust in its main currency and economy (due to price and exchange controls as well as continuous product shortages) was eroded decades earlier than when the actual break-up of the bloc took place (Dabrowski 2016). It is interesting to note that during the Bretton Woods era, there were no known hyperinflations in the world (Saboin-García 2018). However, under the new global fiat currency standard, the world has experienced a number of them; as Saboin-García (2018) argues, there are 19 countries that have experienced cycles of hyperinflation (and they do not include the most recent ones).
As Samuelson (1951, p. 303) highlights, people’s typical reaction to inflation (increasing prices) is basically converting bank notes as fast as possible to consumption and physical asset purchases, a behavior which only pushes inflation to higher levels. However, by the time this rapid cash conversion point is reached among the general public, prices would have already been increasing notably for a period of time (losing trust is not an overnight process), as money supply is typically too large during this period (money creation being too fast and used, e.g., to meet public spending; Pittaluga et al. 2021), and due to this, the external value of currency decreases (and imports become increasingly more costly, leading to additional price hikes). In the well-documented German hyperinflation, money creation by the central bank was used with a rather similar purpose as what was the case in the most recent example of Venezuela; in both of these countries, the coverage of public spending with money creation was followed by years of massive inflation (Pfleiderer 1979; Pittaluga et al. 2021). Hungary experienced two hyperinflations in the 1920s and 1940s, and both were caused by governmental overspending and the central bank supporting these with bond purchases (Hartwell 2019). Similar to these, the high inflation in Romania in the 1990s and its depreciating currency against the USD had been argued to be based on the increase in domestic money supply (Karfakis 2003). Saboin-García (2018) illustrates with empirical data that the hyperinflation cycle is on the average 16–17 years long, and that it contains as its first phase very high inflation (annual average of 125%) for 8–9 years, followed by a hyperinflation phase with a duration of 3–4 years.
In a time of inflation and hyperinflation, hard assets as well as foreign assets have been argued to become desired and valuable. The research work of Reghezza et al. (2020) shows that even in the time of German hyperinflation, the desire for foreign assets (capital outflows) was one driver of domestic market inflation. Rickards (2012) mentions that in Germany, this foreign asset flight was to Swiss francs and gold, while the favored domestically produced items were pianos. Similarly, in Zimbabwe, manufacturing companies simply counted on cash as inventory as well as held assets in neighboring countries (Siyakiya 2015). In the Yugoslavian hyperinflation, it was common to trust German marks as a stable currency (Petrović et al. 1999); similar trust for German marks and the USD were also present in Bulgaria during the 1990s hyperinflation (Charles and Marie 2017). Actually, it has been argued that trust in foreign currencies is one major reason (González 2009; Charles and Marie 2017) why domestic inflation changes into rapidly developing and aggressive hyperinflation. Domestic currency depreciates in value, which then causes further increase in import prices and results in higher domestic inflation. It is not only private citizens who are chasing foreign currencies, but companies in foreign trade also try to eliminate depreciating currencies from their assets in the desire to replace them with stronger currencies (González 2009). In the current coronavirus inflationary era, individuals and even publicly listed companies (such as MicroStrategy and Tesla; Stankiewicz 2021; Levine 2021) have also diversified cash holdings to cryptocurrencies. This is an entirely new practice as compared to those opted for earlier.
Typically, the only way out of this vicious inflation cycle is to introduce currency that is trusted (or one whose value is trusted in global markets). In Germany, this was a two-phased process—first, the failed reichsmark was replaced by the rentenmark (backed by mortgages and the ability to tax property), but soon, new reichsmarks appeared, which were backed by gold (Pfleiderer 1979; Rickards 2012, p. 59). In 1925, Hungary ended its first hyperinflation with gold-backed currency as well (Hartwell 2019). Similarly, Zimbabwe introduced their US dollar-based currency in 2009, which provided price stability (Nyawo and Rankin 2020). In Bulgaria, hyperinflation ended in the 1990s with the use of extremely high interest rates and eventually, the value of the national currency was significantly depreciated (Charles and Marie 2017); the same approach was applied in Romania (Karfakis 2003). It is either a country implements an extremely trusted currency or allows the currency to depreciate against foreign currencies so much that its value becomes trusted. Of course, the entire economy needs to be sounder as well and requires that governments be consistent and transparent with political decisions. For example, in Bulgaria, the national currency lost its value against the USD in the 1990s by more than 95% (University of Pennsylvania 2021). After this great valuation collapse, the Bulgarian currency became rather stable; in USD terms, its value in 2020–2021 is similar to how it was in the late 1990s (valuation was sustainable mostly due to the currency board system used; Hristov and Zaimov 2003; Charles and Marie 2017). The Romanian currency shares a similar development; however, its devaluation somewhat continued in the last two decades. Saboin-García (2018) shows that the average duration of the disinflation phase in countries is 3–4 years, but in some countries, it took less than one year (as in Bulgaria and Zimbabwe). Trusted currencies and policies hold the key in this process. However, there are examples where hyperinflation could also end up in other manner: In Hungary, the world’s highest ever experienced hyperinflation ended in 1946 (Siyakiya 2015) with the complete nationalization of all assets and the destruction of the middle class (Hartwell 2019).
3. Data Gathering and Countries Involved
As this research aims to shed light on inflation in the recent years, and in modern day economies as well as economies during the pandemic era, the most recent inflation statistics were visited (Trading Economics 2021). Table 1 shows a selection of the ten countries with the highest inflation rates, which were taken from the list of the highest monthly (year-over-year) inflation list. However, not all high-inflation countries are on the list. For example, some African countries (Sudan, Ethiopia, Angola, etc.), and countries in the Middle East (Syria and Iran) were excluded. This is due to the fact that there are issues with the acquisition of trustworthy information or any information at all (due to international sanctions and/or wars). As our interest is in asset prices and foreign trade, this information access becomes rather problematic in some high-inflation countries. Some of these countries completely lack the existence of a stock market as well.
Based on the definition of hyperinflation, only one country in Table 1 fulfills the criterion, and that is Venezuela. Inflation measured in September 2021 was 1946% p.a.; however, it was lower than it was in spring, when it was 3012%. The following country on the inflation list is Lebanon, where it could be considered that the official inflation rate is of the very high inflation class (100% p.a. or above; see Frankel 2010). The Lebanese situation is similar to that of Venezuela in that its inflation was highest in the spring of 2021. The third and fourth countries on the list are Argentina and Zimbabwe, which have been experiencing the effects of high inflation. Their inflation was also the highest for the period of one year, based on the latest observation of September 2021. The rest of the countries in Table 1 have higher than usual inflation (moderate inflation), and its effects are sure to be present in asset prices as well as foreign trade. Apart from Nigeria and Pakistan, inflation in these countries is at the highest level in a year’s time as of September 2021.
Accessing data for the following analysis consists of utilizing multiple information providers. For example, stock market data are analyzed with the index performance of each country in Table 1. These index data were obtained either from Investing.com (2021) or Trading Economics (2021) or both. As in the following, it is used in all measured performance against the USD, the currency data were taken, e.g., from Trading Economics (2021) or from central bank websites. Real estate indexes were seldom available from these countries, and as a proxy for real estate valuation and performance, Numbeo Service (2021) data were used. This is of course not entirely accurate, but it gives some indication of the state of the markets, and also about their direction, which developed over the years when these data were under examination. Foreign trade data were accessed from the UN Comtrade Database (2021) service, which is provided by the United Nations. In some countries, data were not available at all or not from recent years (as the search was performed with the use of the national statistics through Comtrade). Therefore, in many situations, the search was performed for all countries of the world (such as Venezuela, Lebanon, Argentina, Zimbabwe, Nigeria, and Kazakhstan) and how much trade had been reported with these particular high-inflation countries (and these were summed together with the use of Pivot tables). This is of course not completely accurate information, but it gives possibly the best data in the current circumstances and provides an opportunity for trend analyses.
Apart from the four countries with the highest inflation rate in Table 1, inflation rates in the remaining six countries could serve as a rather good proxy for other and more developed economies in the forthcoming years. Inflation in many developed countries is now above 5%, which is not that far away from an inflation rate of around 10%. That is also a motivation of this research work: to provide a fresh and contemporary view of the effects of inflation in countries with the highest inflation rates in the world, and possibly draw some future perspectives for developed countries concerning asset values and foreign trade.
4. Results
As was concluded earlier from the literature review, one main source of high inflation is the sudden depreciation of domestic currency. This is especially the situation in hyperinflation environments. As Table 2 illustrates, apart from Lebanon, all top inflation countries lost a considerable amount of their currency value. In the situation of Venezuela, it could be said that the currency lost nearly all of its purchasing power against the USD. Zimbabwe is returning to its earlier situation of hyperinflation as currency is no longer tied to the USD, and it has depreciated by 98.8% in this observation period. In Argentina (−77.9% against the USD) and Turkey (−49% against the USD), the situation is similar, but not this extreme. In all of these countries, development continued in 2021—domestic currencies are just increasingly losing more value. According to official statistics, only Lebanon demonstrates a difference as Table 2 shows that the Lebanese pound was able to sustain its value. However, this is only the official number. Based on German media reports, currency was being traded in August of 2021 in reality, with value of 3900, 15,000 or 23,000 Lebanese pounds to the USD (Meyer 2021). In the summer of 2020, Sly (2020) reported that the exchange rate was 7000 pounds to the USD. These values would actually be in line with other high or hyperinflation countries in Table 2 (with the given values, this currency would have lost 60–90% of its purchasing power within USD terms during the period of 2018–2020). The Lebanese case is not that rare in sudden inflation breakouts (based on official statistics, inflation started to increase significantly in Lebanon in 2020)—official currency valuation could be much higher than what it is in everyday life, and this could go on for months and even years. Countries in an inflation cycle often impose first capital flow restrictions, restrict public access to their bank accounts, and try to sustain high currency valuation as long as possible (foreign exchange is beneficial, e.g., for the tourism and service sector, if foreigners are an important user group, as well as for the country itself through if its inhabitants are getting substantial money transfers to banks from abroad as aid from friends and relatives, and/or if the country is dependent on imports). However, it is typically only a matter of time when street market prices would reflect the official currency values.
For other inflation countries in Table 2, currency depreciation has been much lower, but in many cases still significant, such as in Brazil (−36.2%) and Pakistan (−30.8%). These two are followed by Nigeria and Kazakhstan, both of which lost around 20% from their currency value. However, these lower valuation losses should be put in perspective as all of these countries have experienced significant depreciation for a longer period of time. For example, in Table 2, only Ukraine shows a marginal 0.6% loss of valuation against the USD, but in the aftermath of the 2014 Crimean crisis, its currency lost 80% of its value (in roughly one year’s time).
Concerning currency changes, it should be remembered that even if valuations between currencies are relative, it could be so that the domestic currency would just continuously weaken. For example, the Argentinean peso was basically having a parity value with the USD in the 1990s—in Table 2, it is 84.14 at the end of 2020, and in early November 2021, it was 100 pesos to one USD. Similar developments took place in many other countries in Table 1, such as in Turkey, Ukraine, and Brazil. This is a difficult environment to manage the macro-economy and inflation, and in all of these countries, high inflation persisted for a long period of time (irregularly having spikes in inflation for decades).
In local currency terms, the stock market indexes of these ten countries were doing well in 2018–2020 (Table 3). The only major negative return was that of Lebanon (−42.6%), while Nigeria showed a small decline (−6.1%). However, measuring change against the local currency is a different thing from making the comparison in USD terms. The best example is that of Venezuela where in local currency terms, the stock index soared in three years’ time to more than 100,000%. However, as local currency basically lost all of its value against the USD, investment to index resulted in a 99.05% loss in USD terms. In this situation, the kind of hedge stock markets can provide as compared to holding cash is rather marginal. While hyperinflation is steep enough and contains international sanctions, the stock market is no place to hide either. Zimbabwe repeats a similar situation where in local currency terms, the stock market increased rather dramatically; however, in USD terms, this resulted in a loss of 78.08%. Nevertheless, there are exceptions to these. For example, the Ukrainian stock index produced even nice gains in USD terms (as currency was stable in this observation period). In the indexes of Brazil and Kazakhstan, break-even results in USD terms were also nearly produced. In general, it could be concluded from Table 3 that stock markets provide, on the average (in USD terms), a somewhat better shield as compared to local currency holdings. However, this difference is not that great, and in some cases, losses could be substantial.
It is very difficult to name a winner from among stock index companies in times of inflation or hyperinflation. It could be stated that banks are rather risky, and in some situations, significant parts of invested capital would have been lost (or lost entirely). It has been rather challenging to own Lebanese or Venezuelan banks, if one were to think about investment yields. In other countries, banks might have sustained or even produced some yield in local currency terms; however, it is rare that they would be the best performing among all index companies. Only in Kazakhstan, a bank called Halyk Bank has been such—the best performer with a somewhat above average performance, as stated in Table 3 (the Kazakh stock index has a very limited number of companies). Interestingly, in Lebanon and Venezuela, the best performing index companies were those involved in real estate development. This only highlights the role of real and physical assets in a time of very high inflation or hyperinflation.
It is also difficult to state whether manufacturing companies have been good investment. In some cases, they have been extremely poor, and in some, really successful. In any case, it could be stated that companies which are affiliated with foreign currencies, and especially those in sales, have been strong. It is of course ideal in the inflationary context to have a huge exposure of input factors within local currencies while having most of the sales abroad. For example, very successful shareholder returns among the ten countries studied can be found in such companies as Mirgor (Argentina, manufacturing), Gubre Fabrikalari (Turkey, manufacturing), and Systems Ltd. (Pakistan, software). All of these yielded from hundreds to thousand-percent returns in the observation period of 2018–2020. They have also continued to do well in 2021.
Another popular alternative to cash holdings is to invest in real estate—in its simplest form, it is people buying homes to live in, which will possibly provide lower costs and an asset hedge for their pension days. It is difficult to find real estate indexes (official) from all of these selected ten countries. Therefore, the internet crowd-enabled Numbeo Service (2021) was used. It is of course a somewhat questionable source of information, but its prices come from crowds of these countries, and the averages are calculated from each year of data. However, the average value (absolute) is probably not the full truth, but the service could be used to analyze real estate prices in general, and then their trends in 2018–2020. For this research work, the prices of apartments in city centers were selected as they are typically the most desired, of the highest value, and should attract finance from different parties (not only from local inhabitants, but from banks and foreign investors, too). It could be assumed that a priori, these city center apartments sustain their prices best.
Real estate price development from the years 2018 and 2020 is shown in Table 4. Essentially, these results are at the same time surprising and interesting. In the only official hyperinflation country of this study, Venezuela, real estate prices seem to be really low, and they have not increased in USD terms in these years at all. Venezuelan real estate prices are at the same level as Pakistan, and these two have the lowest prices from the eight examined countries (Zimbabwe and Nigeria do not have data available). The low prices of Venezuela are likewise confirmed by other internet sources (Pérez and Tonelli 2018; Janet 2021). Decades-long economic hardships, which has forced people to just decide to sell property and leave for other countries, together with the massive construction program of the government in the implementation of left-wing policies, have resulted in this situation. Numbeo Service (2021) data supports this argumentation as apartment prices in the city centers were at 3000 USD or more per m2 in 2011–2012; a long-term drop is also supported in the blog of Pérez and Tonelli (2018). Thus, real estate has provided a certain amount of protection, but it is still a very limited shield against hyperinflation and economic hardship. However, it should be remembered that the standard of living and salaries are so low in Venezuela nowadays that even these prices are really high for the normal workforce inhabitants. As compared to holding cash or investing in the stock market, real estate is clearly the best performing of these three poor alternatives.
Officially, Lebanon is now experiencing very high inflation, and this inflation has a rather short history as it started in early 2020. Hence, this inflation is very recent, and it could be so that it has not affected all asset values that much. This could be the only explanation for the fact that real estate prices in city centers are still so high (in 2020, they were actually at the level of developed countries). In addition, real estate lost very little of its USD value in these two years. Xinhua (2021) explains that the banking crisis and banking restrictions are forcing people in Lebanon to search for safer investments, and real estate is considered as such (it has also performed well in 2021). However, the same Xinhua (2021) article mentions that if cash money (USD) is used in apartment purchases instead of bank transfers and bank deposits, prices are discounted to a rather large extent. Similar to Lebanon, real estate prices in Argentina are still rather high and have been sustained well. Argentinian inflation could be considered high inflation.
For the other five countries in Table 4, the real estate valuation developed in a rather mixed manner. In Turkey and Brazil, prices declined considerably, while in the Ukraine, they somewhat increased. It should be emphasized that, e.g., in Turkey, real estate prices continued to increase in the local currencies, but against the USD, they declined due to the depreciation effect of the currency (the situation is similar in Brazil). The housing sector of Turkey was already under stress in the pre-coronavirus world (Ayan and Eken 2021). If all eight countries are examined together, and the average or median values from the change in 2018–2020 is taken from these, it could be concluded that on the average, values have somewhat declined (but not significantly).
The development of foreign trade in these ten selected countries is rather similar for imports (Table 5). Apart from Nigeria, Ukraine, Brazil, and Kazakhstan, and within the year of 2019, imports declined in all countries, whether it was in 2019 or 2020. The most drastic declines could be noted in 2019 and 2020 within Venezuela, Lebanon, and Argentina—these are also countries with the highest inflation, and the depreciation of the currency is also rather significant (of course, the official rate of Lebanon remains unchanged, but this issue was discussed earlier). As purchasing power declines in domestic markets due to depreciating currency, it is understandable that import volume declines. In the situation of Venezuela, it is not only depreciating currency, but export sanctions that are making it troublesome to have any foreign currency for import activity; food imports have also declined from 2013 to 2018 by 78% (Zakrison and Muntaner 2019). This finding is in line with trade statistics out of Venezuela and for the years 2010 and 2011, and as compared to the 2020 findings of this study. Overall, exports have declined by more than 90% and imports by 80–90% (depending on the year, although 2011 was really good in terms of trade for Venezuela).
In terms of export sanctions for Venezuela, lower oil, agricultural product, and raw material prices could be argued as being a joint reason for the export decline in Table 6. Venezuelan exports further collapsed by 86.4% after two years. Zimbabwe, Turkey, and Kazakhstan also showed a significant decline in exports in this time period. However, it should be noted that the average and median values are biased due to the abnormal change in Venezuela. If Venezuela were excluded from the ten countries, then both the average and median export activities would increase in these countries in 2019. This is natural as depreciating currency provides good opportunities for export-based manufacturing and trade. Turkey, Ukraine, and Pakistan act as good examples here —in all of these countries, there was growth in trade from 2018 to 2019, and in 2020, decline was rather modest (as the entire world declined in 2020 from the 2018 level by 18.5%). In addition, in 2019, both Lebanon and Argentina did well in exports. In 2020, their performance declined similarly to the entire world.
By examining Table 5 and Table 6, it becomes apparent that not all these countries are in continuous trade deficits, but on the contrary, they show surpluses. For example, in two to three years out of the three-year period (2018–2020), Venezuela, Argentina, Nigeria, Brazil, and Kazakhstan actually have trade surpluses. Trade deficits are challenging in Lebanon, Turkey, Ukraine, and Pakistan—in all of these countries and in all the years, there are deficits in trade, and it is in billions or tens of billions. For example, in Turkey, the trade deficit was USD 54 billion in 2018, and USD 49.9 billion in 2020. For trade deficit countries, it is difficult to change the direction of the economy and the supply of domestic currency as this requires the change of industrial and trade structure as well.
To discuss these findings, it should be stressed that mild inflation is considered as a good feature in economic literature, and in general, it fuels economic growth and sentiment (e.g., Batrancea 2021; Mallik and Chowdhury 2001). In the end, growth is the center and key to the capitalistic system, which needs it to justify investments, jobs, technological improvements, and wealth. However, as inflation goes up to a high or a very high level, not to mention hyperinflation, it becomes troublesome and harmful for the economy, the savers, and citizens (e.g., Saboin-García 2018; Petrović et al. 1999; Siyakiya 2015; Zakrison and Muntaner 2019). The completed analysis of assets and foreign trade above has illustrated that very high inflation as well as the recently experienced hyperinflation of Venezuela destroyed all asset classes nearly equally (of this study). Real estate is probably the best performer from among all the different assets; however, even in this study, losses have been substantial in the longer observation period. It could be debated whether Venezuelan inflation effects on foreign trade are indeed so negative, but in the examination period, trade collapsed rather significantly (which had already started even before the observation period, and would do so quite substantially within a decade). Of course, hyperinflation is not the only one to blame as economic sanctions as well as the coronavirus era have affected overall development, too.
Lebanon and Argentina are following the Venezuelan situation, but in some respects, they still do have asset values left, such as in real estate. In addition, their exports have been rather good as compared to the rest of the analyzed countries. These three similar countries could also include Zimbabwe and Turkey, and the reason originates mostly in the valuation of the currency. The top five highest inflation countries all lost a considerable amount of value from their currencies in the observation period, and it is all demonstrated in the analysis of other assets and foreign trade.
5. Is Reserve Currency Appropriate Benchmark?
All earlier analyses were completed by comparing performance in US dollars. This is due to the fact that the USD is still the world’s reserve currency, and is the most used currency in trade and investments all over the world. However, the USD has been experiencing a difficult valuation period since the Bretton Woods system was cancelled and the gold standard ended. For example, during and after the global financial crisis in 2008–2009, the USD has had many years of low valuation, and it was within the area of USD 1.4–1.6 against the euro. This was a rather large-scale change in the fiat currency world as larger currencies are always relative in valuation to each other (and they are expected to correct valuations over time). In the early 2000s, the USD/EUR had a typical value of 0.9–1. This corresponds approx. to a 40% depreciation of the USD in less than a decade. Of course, the ongoing euro crisis, which started in 2010, resulted in similar debt and governmental budget deficit situations in Europe (similar to that of the USA), and the value of the euro has declined in recent years, close to the range of USD/EUR 1.1–1.2. Therefore, it should be remembered that even the reserve currency is having its problems, and measuring changes against it is nowadays biased. In many cases, asset values have declined even more as the actual purchasing power of the USD is also declining. The world reserve currency is no longer stable.
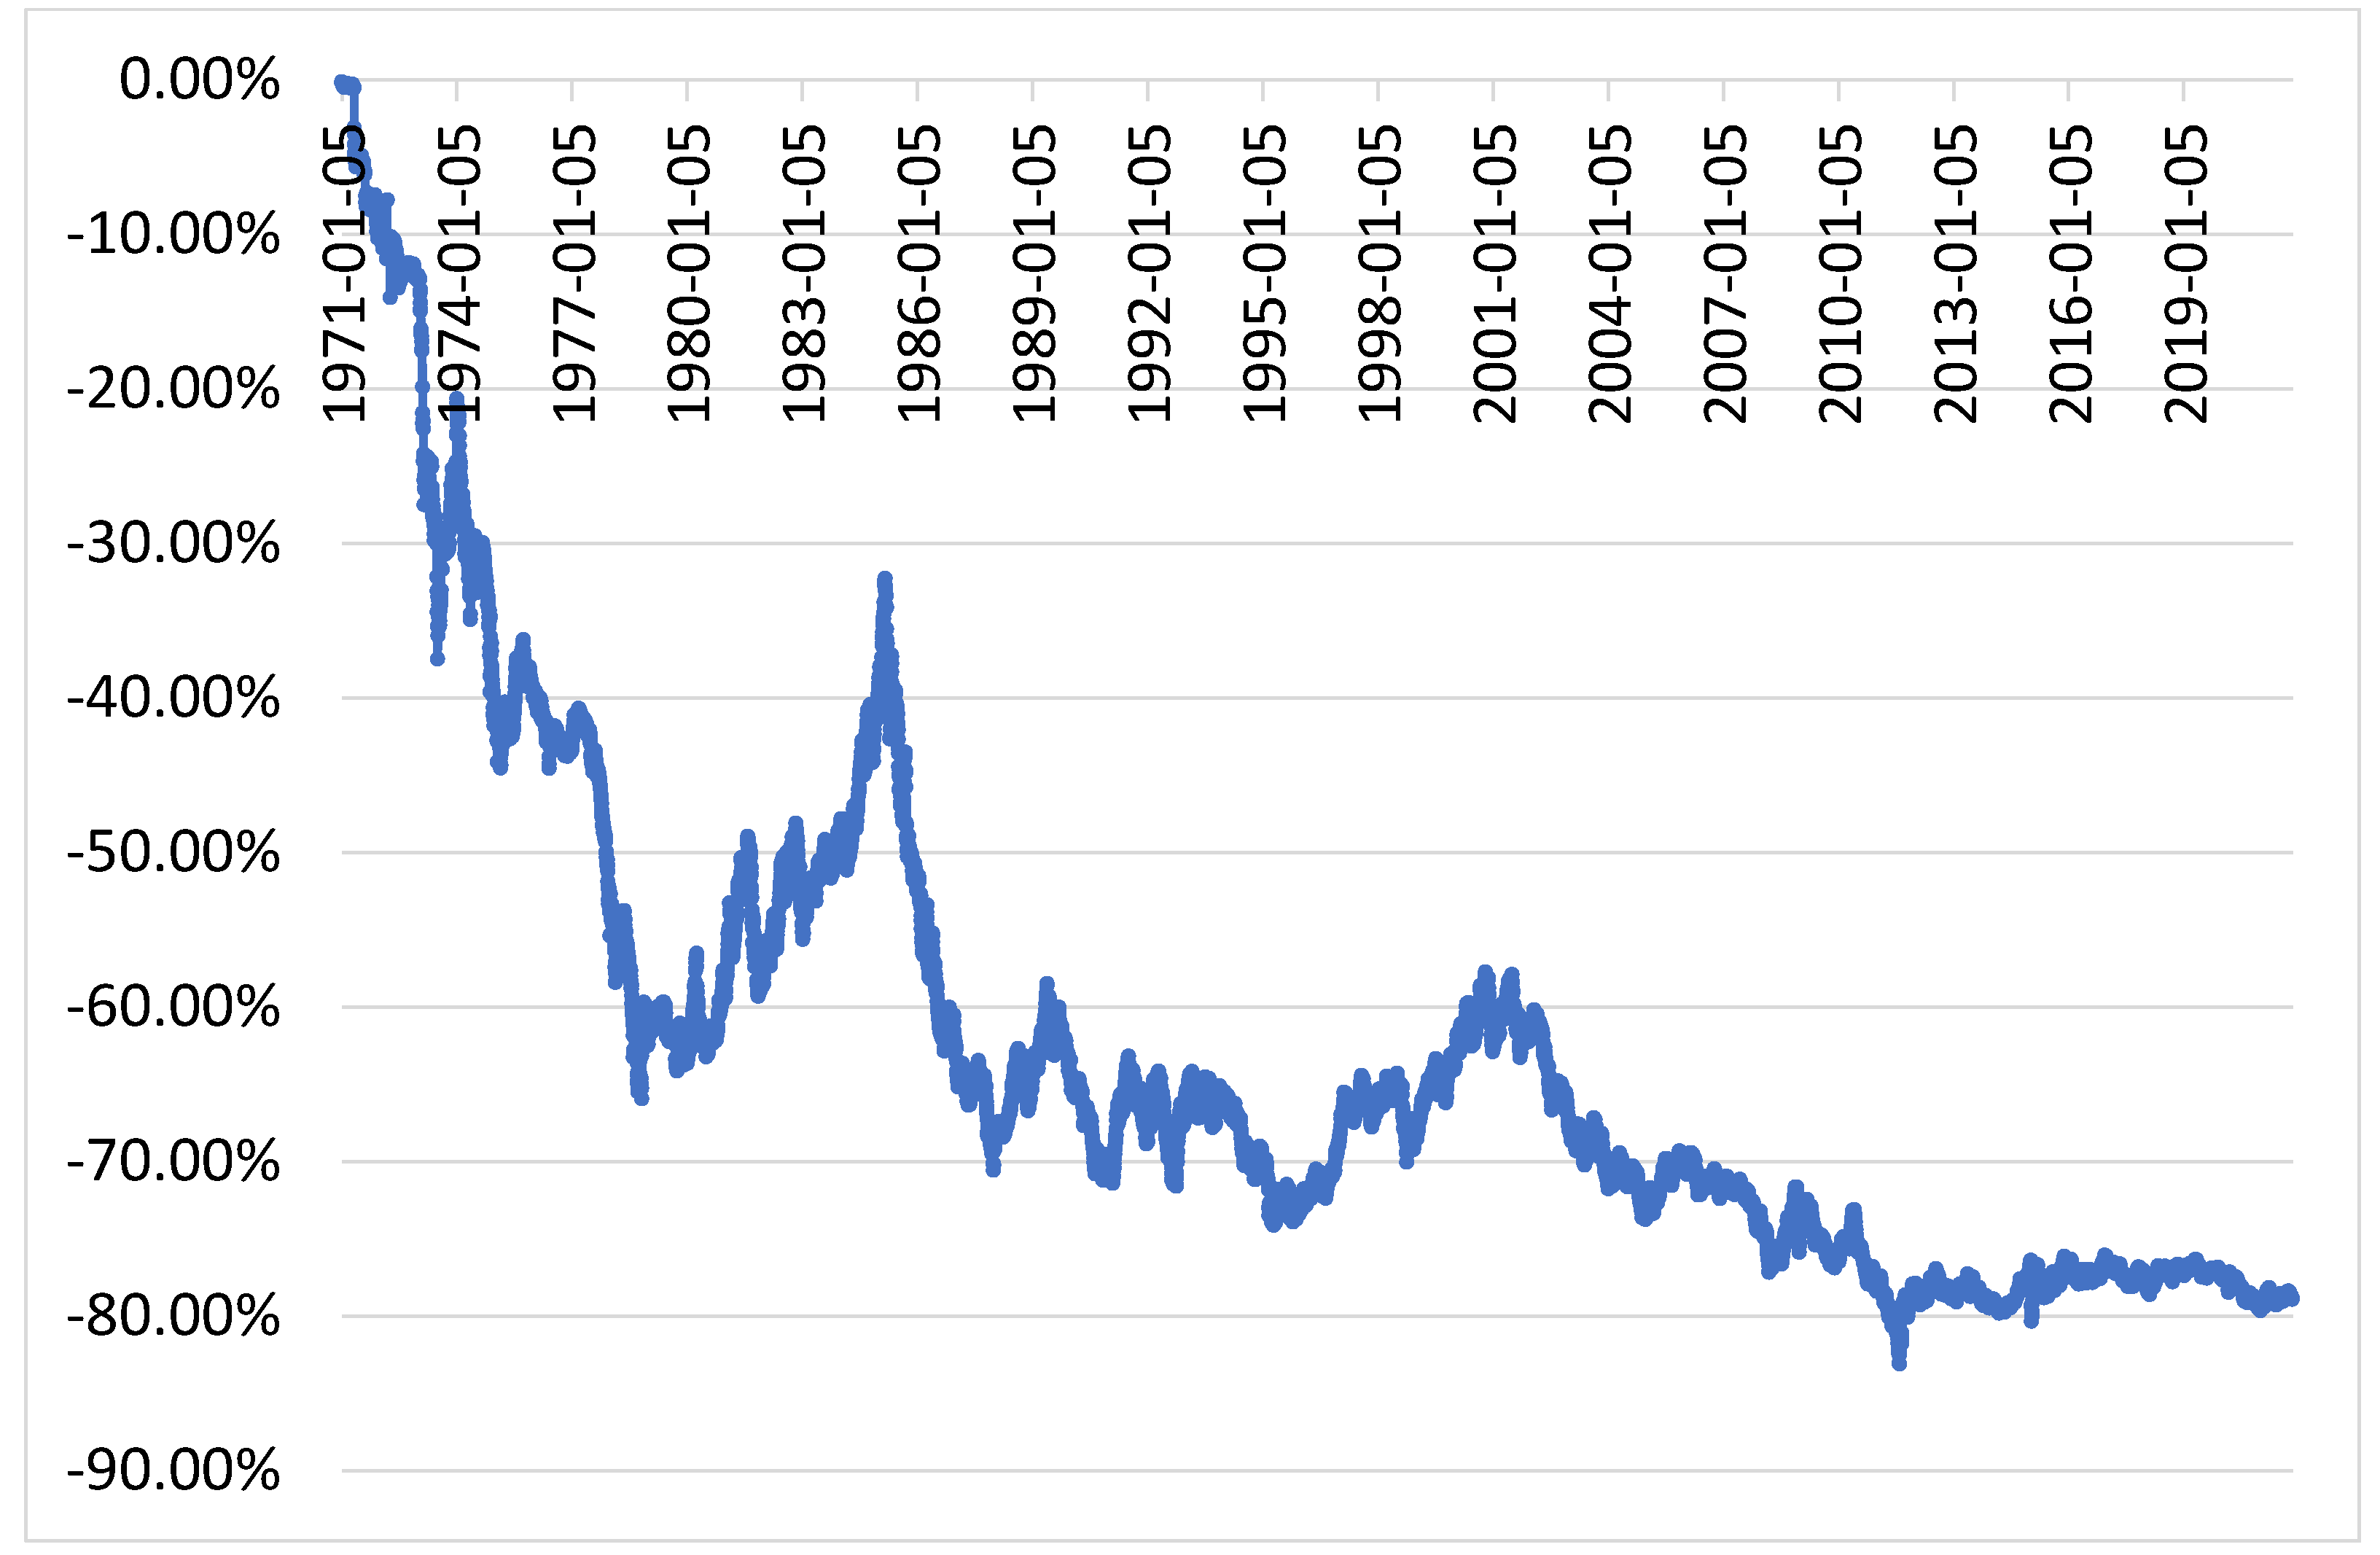
One good benchmark for the USD is a very strong and stable currency—the Swiss franc. At the end of the Bretton Woods system, one USD was valued as approx. four Swiss francs. However, thereafter, valuation changed rapidly in favor of francs—at the end of 1979, it reached the level of one USD to 1.6 francs. The dollar decreased in value during this decade by roughly 60%. Interest rates were significantly changed in the early 1980s within the USA, and this of course caused recovery in the value of the dollar. However, appreciation was rather short-lived, as Figure 1 illustrates—the old, continuously deteriorating currency valuation against the franc took effect in the 1990s, and after the IT bubble burst in 2001. Currently, the USD is depreciated against the Swiss franc by roughly 80%, and this took place over five decades. It is just a reminder that fiat currencies are continuously losing their value, and the earlier analyzed three-year currency valuation losses of selected inflation countries have taken place in the case of the USD, too, but in a longer timeframe. The yardstick of the USD is arising from the Bretton Woods era, but practical habits change rather slowly to correspond new realities, and it is also difficult to find a better alternative.
Of course, it is worth asking what makes Switzerland so particular that its fiat currency is continuously getting stronger. For the past two decades, this country has been able to manage its governmental finances rather well—the amount of debt has not particularly increased (as it has done so in most of the countries worldwide). Its governmental debt share from the GDP is one of the lowest in the world. Interestingly, Switzerland has been able to maintain its export performance: trade as well as currency accounts are at a surplus. In 2021, the Swiss annual inflation rates were rising, but by October it was 1.2%. This small country holds many well-known international corporations and brands. There must be lessons that it could teach other countries that are running huge governmental budget deficits, increasing governmental debts, increasing central bank finance for expenses, and in the process, depreciating currencies (as well as causing high inflation). It is typically argued that exports cannot perform with a strong local currency. In many cases, this is true. However, Switzerland, and earlier Germany (when they had their own domestic currency), showed that even under a strong currency, you may still have competitive export-based manufacturing present. Innovation, quality, internationalization, and business models play increasingly important roles in the success of corporations.
What is particular in the situation of Switzerland is the ownership of its central bank, which is a publicly listed company. Central bank (Swiss National Bank or Schweizerische Nationalbank) ownership is divided in such a manner that 76.63% is owned by the Swiss public sector, where private shareholders have a 23.37% share (SNB 2021). In general, the central bank is highly profitable (it is actually one of the highest margin businesses in the world), and it also regularly provides dividends to its shareholders. During the last decade, the central bank’s listed shares have grown in value by approx. 400%. For years, it has been a challenge for the central bank not to let the Swiss franc appreciate too fast and too much. Some years ago, it decided to expand its balance sheet considerably, and the bank acquired significant holdings not only out of foreign currencies and gold, but also from equities. The latter concerns especially US-based technology companies (such as Apple, Microsoft, Alphabet, Amazon, Facebook, Tesla, etc.). The current challenge with these investments is that they are also providing very good yields, which further support the financial results of the central bank, and which eventually strengthen the franc against other currencies (Revill and Howcroft 2021). Due to the pressure of the currency becoming too strong, the central bank started using negative interest rates in 2015 (−0.75%), and they have remained in the same negative level ever since.
A comparison of the USD could also be made to other not-so-common “monies” such as gold and Bitcoin. In the Bretton Woods era, the USD was gold-backed, and one ounce of gold was USD 35. At the end of 2020, the price of gold was somewhat below USD 1900. In five decades, the USD lost 98% of its value against gold. If Bitcoin is taken as a point of comparison, the USD has lost nearly all of its value, whether the Bitcoin price of late 2020 or 2021 is used. Loss in roughly a decade’s time here is similar, what the Venezuelan currency lost against the USD in the earlier analysis within three years. These are of course not fair comparisons as neither one of these alternatives (gold or Bitcoin) is a legal tender. However, things could be changing. In September 2021, El Salvador became the first country to recognize Bitcoin as a legal tender (Hernandez 2021). At the time when this was announced, Bitcoin was showing some weakness in its valuation, and there were numerous doubts about this change; however, the situation has changed thereafter as appreciation has accelerated crypto prices again.
6. Conclusions
Among all the high and very high inflation countries of this study, domestic currencies lost a considerable amount of their value. Value destruction was present in all, even if this is not yet official in the Lebanese situation—based on media reports, it has already happened. As illustrated in here, currencies lost approx. 80–90% of their value in three years (actually, Venezuela and Zimbabwe were both rather close to 100%). These same countries also recorded rather substantial losses in the stock markets if performance is evaluated in USD. In local currency terms, indexes might appear to be gaining a lot of value. Real estate also lost value in high and very high inflation; however, it very much depended on the country. In some countries, values were already so low that the question was whether they may decrease even further (as in Venezuela). It is notable that in Lebanon and Argentina, real estate values were still rather high, even in the midst of inflation. In fact, for the countries experiencing the lowest inflation in this study, real estate values were, to a large extent, declining. This might be the effect when a country is changing from being a moderate inflation country to a high inflation country—the currency and the construction sector are first to experience its effects. It is worth noting that real estate value, in local currencies, might still be showing an increase (even a notable one), but if it is evaluated in USD, then the situation changes. The real estate market is rather similar to stock indexes. However, all of the findings concerning the real estate market should be treated with caution as they are based on the observations of Numbeo Service (2021). Similarly, stock market development should be treated only as a good proxy as in many countries, the number of companies in the indexes is low, there is a lack of business branches, and the levels of internationalization and diversity are insufficient.
Foreign trade of the evaluated countries followed the earlier argumentation of economic literature. In many cases, imports were declining or even collapsing. One significant reason must have been the depreciating purchasing power of the domestic currency; however, in 2020, the coronavirus lockdowns were also accountable for the declines. The exports of the ten evaluated countries were giving mixed signals. In some countries, inflation was probably the reason for the improved export competitiveness; however, in others, economic sanctions and lower prices of raw materials in the observation period must have played a role. Of course, the year 2020 was difficult for all countries in the world concerning exports, which makes the interpretation of inflation effects more difficult.
As a further research, it would be interesting to examine in detail how people and countries throughout the world tackle the current inflation cycle. This is the first time in the era of globalization that inflation is affecting everyone and all product groups. As countries remain loose on financial and fiscal policies, and as deficits are swallowed, it would be interesting to search and list different alternatives of safe assets (which are trusted instead of domestic currency). In earlier hyperinflations and the cases of the ten examined countries, one logical asset alternative for survival has been the use of other more stable country currencies. It could be so that at this time, there are very few options of safe currencies globally; the Swiss franc is possibly one of the last remaining ones. Due to this, people and even organizations (e.g., MicroStrategy and Tesla; Stankiewicz 2021; Levine 2021) are betting on the bright future of cryptocurrencies. Others are rushing for precious metals, collectibles, land, and real estate. In earlier hyperinflations, such as that of Germany, pianos were in high demand. Could the current semiconductor shortage and the increasing prices of electronics make mobile phones, tablets, and laptops as such? Or could used cars be one lucrative asset group?
Together with further research concerning asset development in the inflationary era, it would be vital to examine foreign trade development. It is a rather possible situation that energy, electricity, and transportation costs remain at very high levels. As these are important parts of many industrial product costs, it then becomes inevitable that slight advantages in these within certain regions could lead to very favorable competitive positions and profitability. This could all change the current structure of world trade and flows.
Funding
This research received no external funding.
Institutional Review Board Statement
Not applicable.
Informed Consent Statement
Not applicable.
Data Availability Statement
Research datasets are available from author by email request.
Conflicts of Interest
The author declares no conflict of interest.
References
- Ayan, Ebubekir, and Süleyman Eken. 2021. Detection of price bubbles in Istanbul housing market using LSTM autoencoders: A district-based approach. Soft Computing 25: 7957–73. [Google Scholar] [CrossRef]
- Batrancea, Larissa. 2021. Empirical evidence regarding the impact of economic growth and inflation on economic sentiment and household consumption. Journal of Risk and Financial Management 14: 336. [Google Scholar] [CrossRef]
- Board of Governors of the Federal Reserve System. 2021. Swiss Francs to U.S. Dollar Spot Exchange Rate [DEXSZUS]. Federal Reserve Bank of St. Louis. Available online: https://fred.stlouisfed.org/series/DEXSZUS (accessed on 10 November 2021).
- Bryan, Michael F. 1997. On the Origin and Evolution of the Word Inflation. Cleveland: Economic Commentary. [Google Scholar]
- Charles, Sébastien, and Jonathan Marie. 2017. Bulgaria’s hyperinflation in 1997: Transition, banking fragility and foreign exchange. Post-Communist Economies 29: 313–35. [Google Scholar] [CrossRef]
- Dabrowski, Marek. 2016. Currency crises in post-Soviet economies—A never ending story? Russian Journal of Economics 2: 302–26. [Google Scholar] [CrossRef] [Green Version]
- Doocy, Shannon, Kathleen R. Page, Fernando de la Hoz, Paul Spiegel, and Chris Beyrer. 2019. Venezuelan migration and the border health crisis in Colombia and Brazil. Journal on Migration and Human Security 7: 79–91. [Google Scholar] [CrossRef] [Green Version]
- Frankel, Jeffrey. 2010. Monetary policy in emerging markets. In Handbook of Monetary Economics. Edited by Benjamin M. Friedman and Michael Woodford. Amsterdam: Elsevier, vol. 3, pp. 1439–520. [Google Scholar]
- González, José Villacís. 2009. Hyperinflation: A theory on the ignorance concerning money and interest. International Business and Economics Research Journal 8: 77–84. [Google Scholar] [CrossRef] [Green Version]
- Goschin, Zizi, Mihai Antonia, and Horia Tigau. 2021. Entrepreneurship Recovery in Romania after the Great Recession. A Dynamic Spatial Panel Approach. Sustainability 13: 10702. [Google Scholar] [CrossRef]
- Hartwell, Christopher A. 2019. Short waves in Hungary. 1923 and 1946: Persistence, chaos, and (lack of) control. Journal of Economic Behavior and Organization 163: 532–50. [Google Scholar] [CrossRef]
- Hernandez, Joe. 2021. El Salvador Just Became the First Country to Accept Bitcoin as Legal Tender. NPR. September 7. Available online: https://www.npr.org/2021/09/07/1034838909/bitcoin-el-salvador-legal-tender-official-currency-cryptocurrency (accessed on 15 November 2021).
- Hristov, Kalin, and Martin Zaimov. 2003. Shadowing the Euro: Bulgariaís Monetary Policy Five Years on. BIS Papers No 17, Regional Currency Areas and the Use of Foreign Currencies. Basel: Bank for International Settlements, pp. 61–78. [Google Scholar]
- Investing.com. 2021. Lumber Futures. Available online: https://www.investing.com/commodities/lumber (accessed on 2 November 2021).
- Janet. 2021. What Happens in the Real Estate Market in Venezuela? Today in 24 August 2021 (Caracas). Available online: https://today.in-24.com/News/385747.html (accessed on 25 October 2021).
- Karfakis, Costas. 2003. Exchange rate determination during hyperinflation: The case of the Romanian lei. Applied Financial Economics 13: 473–76. [Google Scholar] [CrossRef]
- Krolikowski, Pavel M., and Kristoph N. Naggert. 2021. Semiconductor shortages and vehicle production and prices. Economic Commentary. [Google Scholar] [CrossRef]
- Levine, Matt. 2021. Tesla Sold Some Bitcoins. Bloomberg, Opinion. April 28. Available online: https://www.bloomberg.com/opinion/articles/2021-04-28/elon-musk-made-tesla-some-money-on-bitcoin (accessed on 16 November 2021).
- Mallik, Girijasankar, and Anis Chowdhury. 2001. Ínflation and economic growth: Evidence from four South Asian countries. Asia-Pacific Development Journal 8: 123–35. [Google Scholar]
- Mayer, Thomas, and Gunther Schnabl. 2021. COVID-19 and the euthanasia of interest rates: A critical assessment of central bank policy in our times. Journal of Policy Modeling 43: 1241–58. [Google Scholar] [CrossRef]
- Meyer, Luisa. 2021. Lebanon: Dollars Shield Some from Hyperinflation Crisis. DW. August 13. Available online: https://p.dw.com/p/3ytqp (accessed on 18 October 2021).
- Numbeo Service. 2021. Historical Data about Cost of Living by Year. Available online: https://www.numbeo.com/cost-of-living/historical-data. (accessed on 21 October 2021).
- Nyawo, Mike, and Neil Rankin. 2020. Price adjustment after hyperinflation in Zimbabwe. African Development Review 32: 240–56. [Google Scholar] [CrossRef]
- Pérez, Roberto, and Fernando Tonelli. 2018. Once the Safest Bet against Hyperinflation, Real Estate Loses Value. Caracas Chronicles. May 3. Available online: https://www.caracaschronicles.com/2018/05/03/once-the-safest-bet-against-hyperinflation-real-estate-loses-value/ (accessed on 10 November 2021).
- Petrović, Pavle, Željko Bogetić, and Zorica Vujošević. 1999. The Yugoslav hyperinflation of 1992–94: Causes, dynamics, and money supply process. Journal of Comparative Economics 27: 335–53. [Google Scholar] [CrossRef] [Green Version]
- Pfleiderer, Otto. 1979. Two types of inflation, two types of currency reform: The German currency miracles of 1923 and 1948. Zeitschrift für die gesamte Staatswissenschaft/Journal of Institutional and Theoretical Economics 3: 352–64. [Google Scholar]
- Pittaluga, Giovanni B., Elena Seghezza, and Pierluigi Morelli. 2021. The political economy of hyperinflation in Venezuela. Public Choice 186: 337–50. [Google Scholar] [CrossRef]
- Reghezza, Alessio, Elena Seghezza, and John Thornton. 2020. Expectations in an open economy hyperinflation: Evidence from Germany 1921–23. Economic Letters 192: 109176. [Google Scholar] [CrossRef]
- Revill, John, and Elizabeth Howcroft. 2021. Analysis: Swiss Central Bank Stands by as Equities Boom Drives the Franc. Reuters. September 20. Available online: https://www.reuters.com/business/finance/swiss-central-bank-stands-by-equities-boom-drives-franc-2021-09-20/ (accessed on 11 November 2021).
- Rickards, James. 2012. Currency Wars—The Making of the Next Global Crisis. New York: Penguin Group. [Google Scholar]
- Saboin-García, José Luis. 2018. The Modern Hyperinflation Cycle: Some New Empirical Regularities. In IMF Working Paper. WP/18/266. Washington, DC: International Monetary Fund. [Google Scholar]
- Samuelson, Paul A. 1951. Economics: An Introductory Analysis, 2nd ed. New York: McGraw-Hill. [Google Scholar]
- Samuelson, Paul A. 1976. Economic, 10th ed. Tokyo: McGraw-Hill Kogakusha. [Google Scholar]
- SCFI. 2021. Shanghai Containerized Freight Index. Available online: https://en.sse.net.cn/indices/scfinew.jsp (accessed on 2 November 2021).
- Schneider, Howard. 2021. Inflation, Wage Data, challenge Fed ‘Transitory’ Narrative. Reuters. November 1. Available online: https://www.reuters.com/business/inflation-wage-data-challenge-fed-transitory-narrative-2021-11-01/ (accessed on 2 November 2021).
- Shadowstats. 2021. Shadow Government Statistics: Alternate Inflation Charts. Available online: http://www.shadowstats.com/alternate_data/inflation-charts (accessed on 11 November 2021).
- Sheffi, Yossi. 2021. What everyone gets wrong about the never-ending COVID-19 supply chain crisis. MIT Sloan Management Review 63: 1–5. [Google Scholar]
- Siyakiya, Puruweti. 2015. The impact of Zimbabwe’s price hyperinflation on reported levels of national manufacturing sector activity. Journal of Management and Research 2: 11–21. [Google Scholar] [CrossRef] [Green Version]
- Sly, Liz. 2020. Lebanon’s Currency Takes a New Dive, and There Is No End in Sight. The Washing Post. June 26. Available online: https://www.washingtonpost.com/world/middle_east/lebanon-currency-economy-crisis/2020/06/26/9e2c62ea-b712-11ea-9a1d-d3db1cbe07ce_story.html (accessed on 8 November 2021).
- SNB. 2021. Share Capital 2020. Swiss National Bank. December 31. Available online: https://www.snb.ch/en/mmr/reference/shares_structure/source/shares_structure.en.pdf (accessed on 12 November 2021).
- Stankiewicz, Kevin. 2021. MicroStrategy Now Owns Over 100,000 Bitcoins Worth More than $3 Billion after Latest Purchase. CNBC. June 21. Available online: https://www.cnbc.com/2021/06/21/microstrategy-owns-over-3-billion-worth-of-bitcoin-after-new-purchase.html (accessed on 16 November 2021).
- Trading Economics. 2021. Trading Economics Information Service, World Economic Data Heatmap. Available online: https://tradingeconomics.com/matrix (accessed on 21 October 2021).
- UN Comtrade Database. 2021. United Nations, New York. Available online: https://comtrade.un.org/ (accessed on 21 October 2021).
- University of Pennsylvania. 2021. Exchange Rate to U.S. Dollar for Bulgaria. Federal Reserve Bank of St. Louis. Available online: https://fred.stlouisfed.org/series/FXRATEBGA618NUPN (accessed on 4 November 2021).
- U.S. Bureau of Labor Statistics. 2021. Consumer Price Index for All Urban Consumers: Used Cars and Trucks in U.S. City Average [CUSR0000SETA02]. Federal Reserve Bank of St. Louis (FRED). Available online: https://fred.stlouisfed.org/series/CUSR0000SETA02 (accessed on 2 November 2021).
- Victor, Vijay, Joshy Karakunnel, Swetha Loganathan, and Daniel Meyer. 2021. From a Recession to the COVID-19 Pandemic: Inflation–Unemployment Comparison between the UK and India. Economies 9: 73. [Google Scholar] [CrossRef]
- Xinhua. 2021. Lebanon’s Real Estate Prices Unlikely to Drop in Near Future after 30-pct Rise: Experts. Xinhuanet. September 1. Available online: http://www.xinhuanet.com/english/2021-01/09/c_139654614.htm (accessed on 5 October 2021).
- Zakrison, Tanya L., and Carles Muntaner. 2019. US sanctions in Venezuela: Help, hindrance, or violation of human rights? The Lancet 393: 2586–87. [Google Scholar] [CrossRef] [Green Version]
Figure 1.
Value development of the USD in Swiss Francs from 1971 (4 January) to 2021 (5 November). Source (data): Board of Governors of the Federal Reserve System (2021).
Figure 1.
Value development of the USD in Swiss Francs from 1971 (4 January) to 2021 (5 November). Source (data): Board of Governors of the Federal Reserve System (2021).


Table 1.
The ten selected countries with their highest annual inflation rate as of September 2021. Source: Trading Economics (2021).
Table 1.
The ten selected countries with their highest annual inflation rate as of September 2021. Source: Trading Economics (2021).
| Country | Inflation Rate (p.a.) | Highest (1 Year) | Time |
|---|---|---|---|
| Venezuela | 1946.00% | 3012.20% | 21 March |
| Lebanon | 137.75% | 157.90% | 21 March |
| Argentina | 52.50% | 52.50% | 21 September |
| Zimbabwe | 51.55% | 51.55% | 21 September |
| Turkey | 19.58% | 19.58% | 21 September |
| Nigeria | 16.63% | 18.17% | 21 September |
| Ukraine | 11.00% | 11.00% | 21 September |
| Brazil | 10.25% | 10.25% | 21 September |
| Pakistan | 8.98% | 11.10% | 21 April |
| Kazakhstan | 8.90% | 8.90% | 21 September |
| Average | 226.31% | 335.32% | |
| Median | 18.11% | 18.88% |
Table 2.
The ten selected countries and the official valuation of currency against the USD in 2018 (January) and 2020 (December).
Table 2.
The ten selected countries and the official valuation of currency against the USD in 2018 (January) and 2020 (December).
| Currency (for One USD) | |||
|---|---|---|---|
| Country | 2018 | 2020 | Against USD |
| Venezuela | 9.99 | 1,104,430.59 | −99.99910% |
| Lebanon | 1507.50 | 1507.50 | 0.00% |
| Argentina | 18.59 | 84.14 | −77.9% |
| Zimbabwe | 1.00 | 80.56 | −98.8% |
| Turkey | 3.77 | 7.38 | −49.0% |
| Nigeria | 306.35 | 380.70 | −19.5% |
| Ukraine | 28.14 | 28.30 | −0.6% |
| Brazil | 3.31 | 5.19 | −36.2% |
| Pakistan | 110.50 | 159.75 | −30.8% |
| Kazakhstan | 332.81 | 421.44 | −21.0% |
| Average | −43.38% | ||
| Median | −33.53% |
Table 3.
The ten selected countries and their stock market index development from 2018 (January) to 2020 (December).
Table 3.
The ten selected countries and their stock market index development from 2018 (January) to 2020 (December).
| Country | Ticker | 2018 | 2020 | Change (%) | In USD |
|---|---|---|---|---|---|
| Venezuela | IBC | 1265.26 | 1,332,059.88 | 105,179.5% | −99.05% |
| Lebanon | BLSI | 1145.61 | 657.89 | −42.6% | −42.57% |
| Argentina | MERV | 31,084.42 | 51,226.49 | 64.8% | −63.58% |
| Zimbabwe | ALSZI | 149.27 | 2636.34 | 1666.2% | −78.08% |
| Turkey | XU100 | 1175.24 | 1476.72 | 25.7% | −35.86% |
| Nigeria | NGSE30 | 1747.01 | 1640.11 | −6.1% | −24.45% |
| Ukraine | PFTSI | 315.74 | 499.75 | 58.3% | 57.38% |
| Brazil | BVSP | 77,891 | 119,017 | 52.8% | −2.55% |
| Pakistan | KSE100 | 40,711.04 | 43,755.38 | 7.5% | −25.66% |
| Kazakhstan | KASE | 2164.47 | 2675.58 | 23.6% | −2.38% |
| Average | 10,702.96% | −31.68% | |||
| Median | 39.23% | −30.76% |
Table 4.
The ten selected countries and their apartment prices in city centers during 2018 and 2020 (measure: USD per m2). Source: Numbeo Service (2021).
Table 4.
The ten selected countries and their apartment prices in city centers during 2018 and 2020 (measure: USD per m2). Source: Numbeo Service (2021).
| Country | 2018 | 2020 | Change (%) |
|---|---|---|---|
| Venezuela | 812.15 | 789.58 | −2.78% |
| Lebanon | 4281.21 | 3918.55 | −8.47% |
| Argentina | 2646.06 | 2634.49 | −0.44% |
| Zimbabwe | N/A | N/A | N/A |
| Turkey | 1585.84 | 922.36 | −41.84% |
| Nigeria | N/A | N/A | N/A |
| Ukraine | 1090.70 | 1109.44 | 1.72% |
| Brazil | 2404.09 | 1467.62 | −38.95% |
| Pakistan | 1020.40 | 742.92 | −27.19% |
| Kazakhstan | 1150.46 | 984.39 | −14.44% |
| Average | −16.55% | ||
| Median | −11.45% |
Table 5.
The ten selected countries and their imports during the period of 2018–2020 (measure: USD). Source: UN Comtrade Database (2021).
Table 5.
The ten selected countries and their imports during the period of 2018–2020 (measure: USD). Source: UN Comtrade Database (2021).
| Country | 2018 | 2019 | 2020 | 2019 vs. 2018 | 2020 vs. 2018 |
|---|---|---|---|---|---|
| Venezuela | USD 11,322,558,631 | USD 5,765,558,597 | USD 5,869,744,439 | −49.08% | −48.16% |
| Lebanon | USD 19,981,450,565 | USD 16,655,114,183 | USD 9,455,645,379 | −16.65% | −52.68% |
| Argentina | USD 59,087,093,847 | USD 45,039,684,599 | USD 38,633,594,864 | −23.77% | −34.62% |
| Zimbabwe | USD 3,938,231,928 | USD 3,253,447,737 | USD 3,602,052,942 | −17.39% | −8.54% |
| Turkey | USD 231,152,482,645 | USD 210,345,202,552 | USD 219,514,372,881 | −9.00% | −5.03% |
| Nigeria | USD 41,253,052,175 | USD 46,476,338,016 | USD 40,716,744,383 | 12.66% | −1.30% |
| Ukraine | USD 57,187,093,429 | USD 60,799,689,210 | USD 53,674,668,694 | 6.32% | −6.14% |
| Brazil | USD 192,840,115,910 | USD 193,162,004,038 | USD 166,336,211,575 | 0.17% | −13.74% |
| Pakistan | USD 60,162,862,445 | USD 50,063,059,560 | USD 45,775,135,124 | −16.79% | −23.91% |
| Kazakhstan | USD 38,415,470,414 | USD 43,690,457,799 | USD 26,265,617,362 | 13.73% | −31.63% |
| Average | −9.98% | −22.58% | |||
| Median | −12.82% | −18.83% |
Table 6.
The ten selected countries and their exports during the period of 2018–2020 (measure: USD). Source: UN Comtrade Database (2021).
Table 6.
The ten selected countries and their exports during the period of 2018–2020 (measure: USD). Source: UN Comtrade Database (2021).
| Country | 2018 | 2019 | 2020 | 2019 vs. 2018 | 2020 vs. 2018 |
|---|---|---|---|---|---|
| Venezuela | USD 34,940,915,216 | USD 16,465,327,388 | USD 4,752,806,959 | −52.88% | −86.40% |
| Lebanon | USD 3,280,513,013 | USD 4,171,356,470 | USD 2,679,197,844 | 27.16% | −18.33% |
| Argentina | USD 61,078,137,591 | USD 66,716,240,652 | USD 50,107,306,013 | 9.23% | −17.96% |
| Zimbabwe | USD 3,366,438,197 | USD 3,109,677,056 | USD 2,072,657,197 | −7.63% | −38.43% |
| Turkey | USD 177,168,756,288 | USD 180,832,721,702 | USD 169,657,939,777 | 2.07% | −4.24% |
| Nigeria | USD 62,064,206,028 | USD 56,278,363,664 | USD 36,124,918,372 | −9.32% | −41.79% |
| Ukraine | USD 47,334,679,853 | USD 50,054,402,431 | USD 49,230,799,582 | 5.75% | 4.01% |
| Brazil | USD 231,889,523,399 | USD 221,126,807,647 | USD 209,180,241,655 | −4.64% | −9.79% |
| Pakistan | USD 23,630,892,979 | USD 23,748,680,252 | USD 22,237,163,374 | 0.50% | −5.90% |
| Kazakhstan | USD 50,871,654,874 | USD 48,529,248,987 | USD 34,171,978,919 | −4.60% | −32.83% |
| Average | −3.44% | −25.17% | |||
| Median | −2.05% | −18.15% |
Publisher’s Note: MDPI stays neutral with regard to jurisdictional claims in published maps and institutional affiliations. |
© 2021 by the author. Licensee MDPI, Basel, Switzerland. This article is an open access article distributed under the terms and conditions of the Creative Commons Attribution (CC BY) license (https://creativecommons.org/licenses/by/4.0/).
Share and Cite
MDPI and ACS Style
Hilmola, O.-P. Inflation and Hyperinflation Countries in 2018–2020: Risks of Different Assets and Foreign Trade. J. Risk Financial Manag. 2021, 14, 618. https://0-doi-org.brum.beds.ac.uk/10.3390/jrfm14120618
AMA Style
Hilmola O-P. Inflation and Hyperinflation Countries in 2018–2020: Risks of Different Assets and Foreign Trade. Journal of Risk and Financial Management. 2021; 14(12):618. https://0-doi-org.brum.beds.ac.uk/10.3390/jrfm14120618
Chicago/Turabian StyleHilmola, Olli-Pekka. 2021. "Inflation and Hyperinflation Countries in 2018–2020: Risks of Different Assets and Foreign Trade" Journal of Risk and Financial Management 14, no. 12: 618. https://0-doi-org.brum.beds.ac.uk/10.3390/jrfm14120618