1. Introduction
Foreign direct investment (FDI) inflows play an increasingly strong role in economic development and progress of countries, and are considered to be one of the major drivers of globalization. In general, FDI is a crucial component of development of host countries, and results in capital, external financing, infrastructure, technology, skills and market access, etc. Most policy makers and economists believe that FDI can positively affect their countries. In recent years, most emerging and developing countries have implemented various economic reforms to restructure their economies in order to attract more FDI. In general, changing global economic situations, policy changes, and political environment have a crucial impact on foreign direct investment. FDI decisions depend on a variety of characteristics of the host country, such as market size and potential, exchange rate, trade openness, political stability or risk, labor costs, trade costs, investment costs, trade deficit, human capital, tax, inflation, budget deficit, etc.
Many empirical studies have indicated that various aspects—such as trade openness and foreign direct investment—might influence a country’s economic development. There are many definitions concerning trade openness in the literature. Trade openness is defined as the sum of imports and exports normalized by the gross domestic product. This is the most common and convenient measurement, and has been used in a variety of international studies (
Adow and Tahmad 2018;
Zaman et al. 2018;
Ho et al. 2013;
Nguyen and Nguyen 2007).
Trade openness is useful for observing the export–import balance of the country, and is considered to be a key determinant of FDI inflows. Globalization and liberalized trade policies affect the level of output and economic activity and attract foreign investors. Therefore, it is important to identify to what degree the trade policies are liberalized. Many countries have tried to attract more foreign direct investment by making their economy more open and implementing a variety of progressive policies. The impact of trade openness on FDI inflow is expected to be mixed. Theoretically, trade openness affects foreign direct investment positively or negatively, depending on the host country’s trade policies (
Liargovas and Skandalis 2012;
Ponce 2006). First, the majority of empirical studies have found a positive relationship between trade openness and FDI inflows, as demonstrated by the results in studies conducted by
Makoni (
2018),
Sahoo (
2006),
Janick and Wunnava (
2004), and
Zaman et al. (
2018). According to these studies, the positive relationship between trade openness and foreign direct investment indicates that a country with fewer restrictions on imports and exports has a higher chance of attracting foreign direct investment. Secondly, some studies have found a negative relationship between trade openness and FDI inflow (
Adow and Tahmad 2018;
Cantah et al. 2018;
Khan and Hye 2014). Thirdly,
Ho et al. (
2013) and
Wickramarachchi (
2019) found that trade openness had no significant impact on FDI inflows in BRICS (Brasil, Russia, India, China, and South Africa) countries.
In line with the theory and earlier empirical papers, we seek to examine the causal relationship between trade openness and foreign direct investment inflows in Romania during the period from 1997 to 2019.
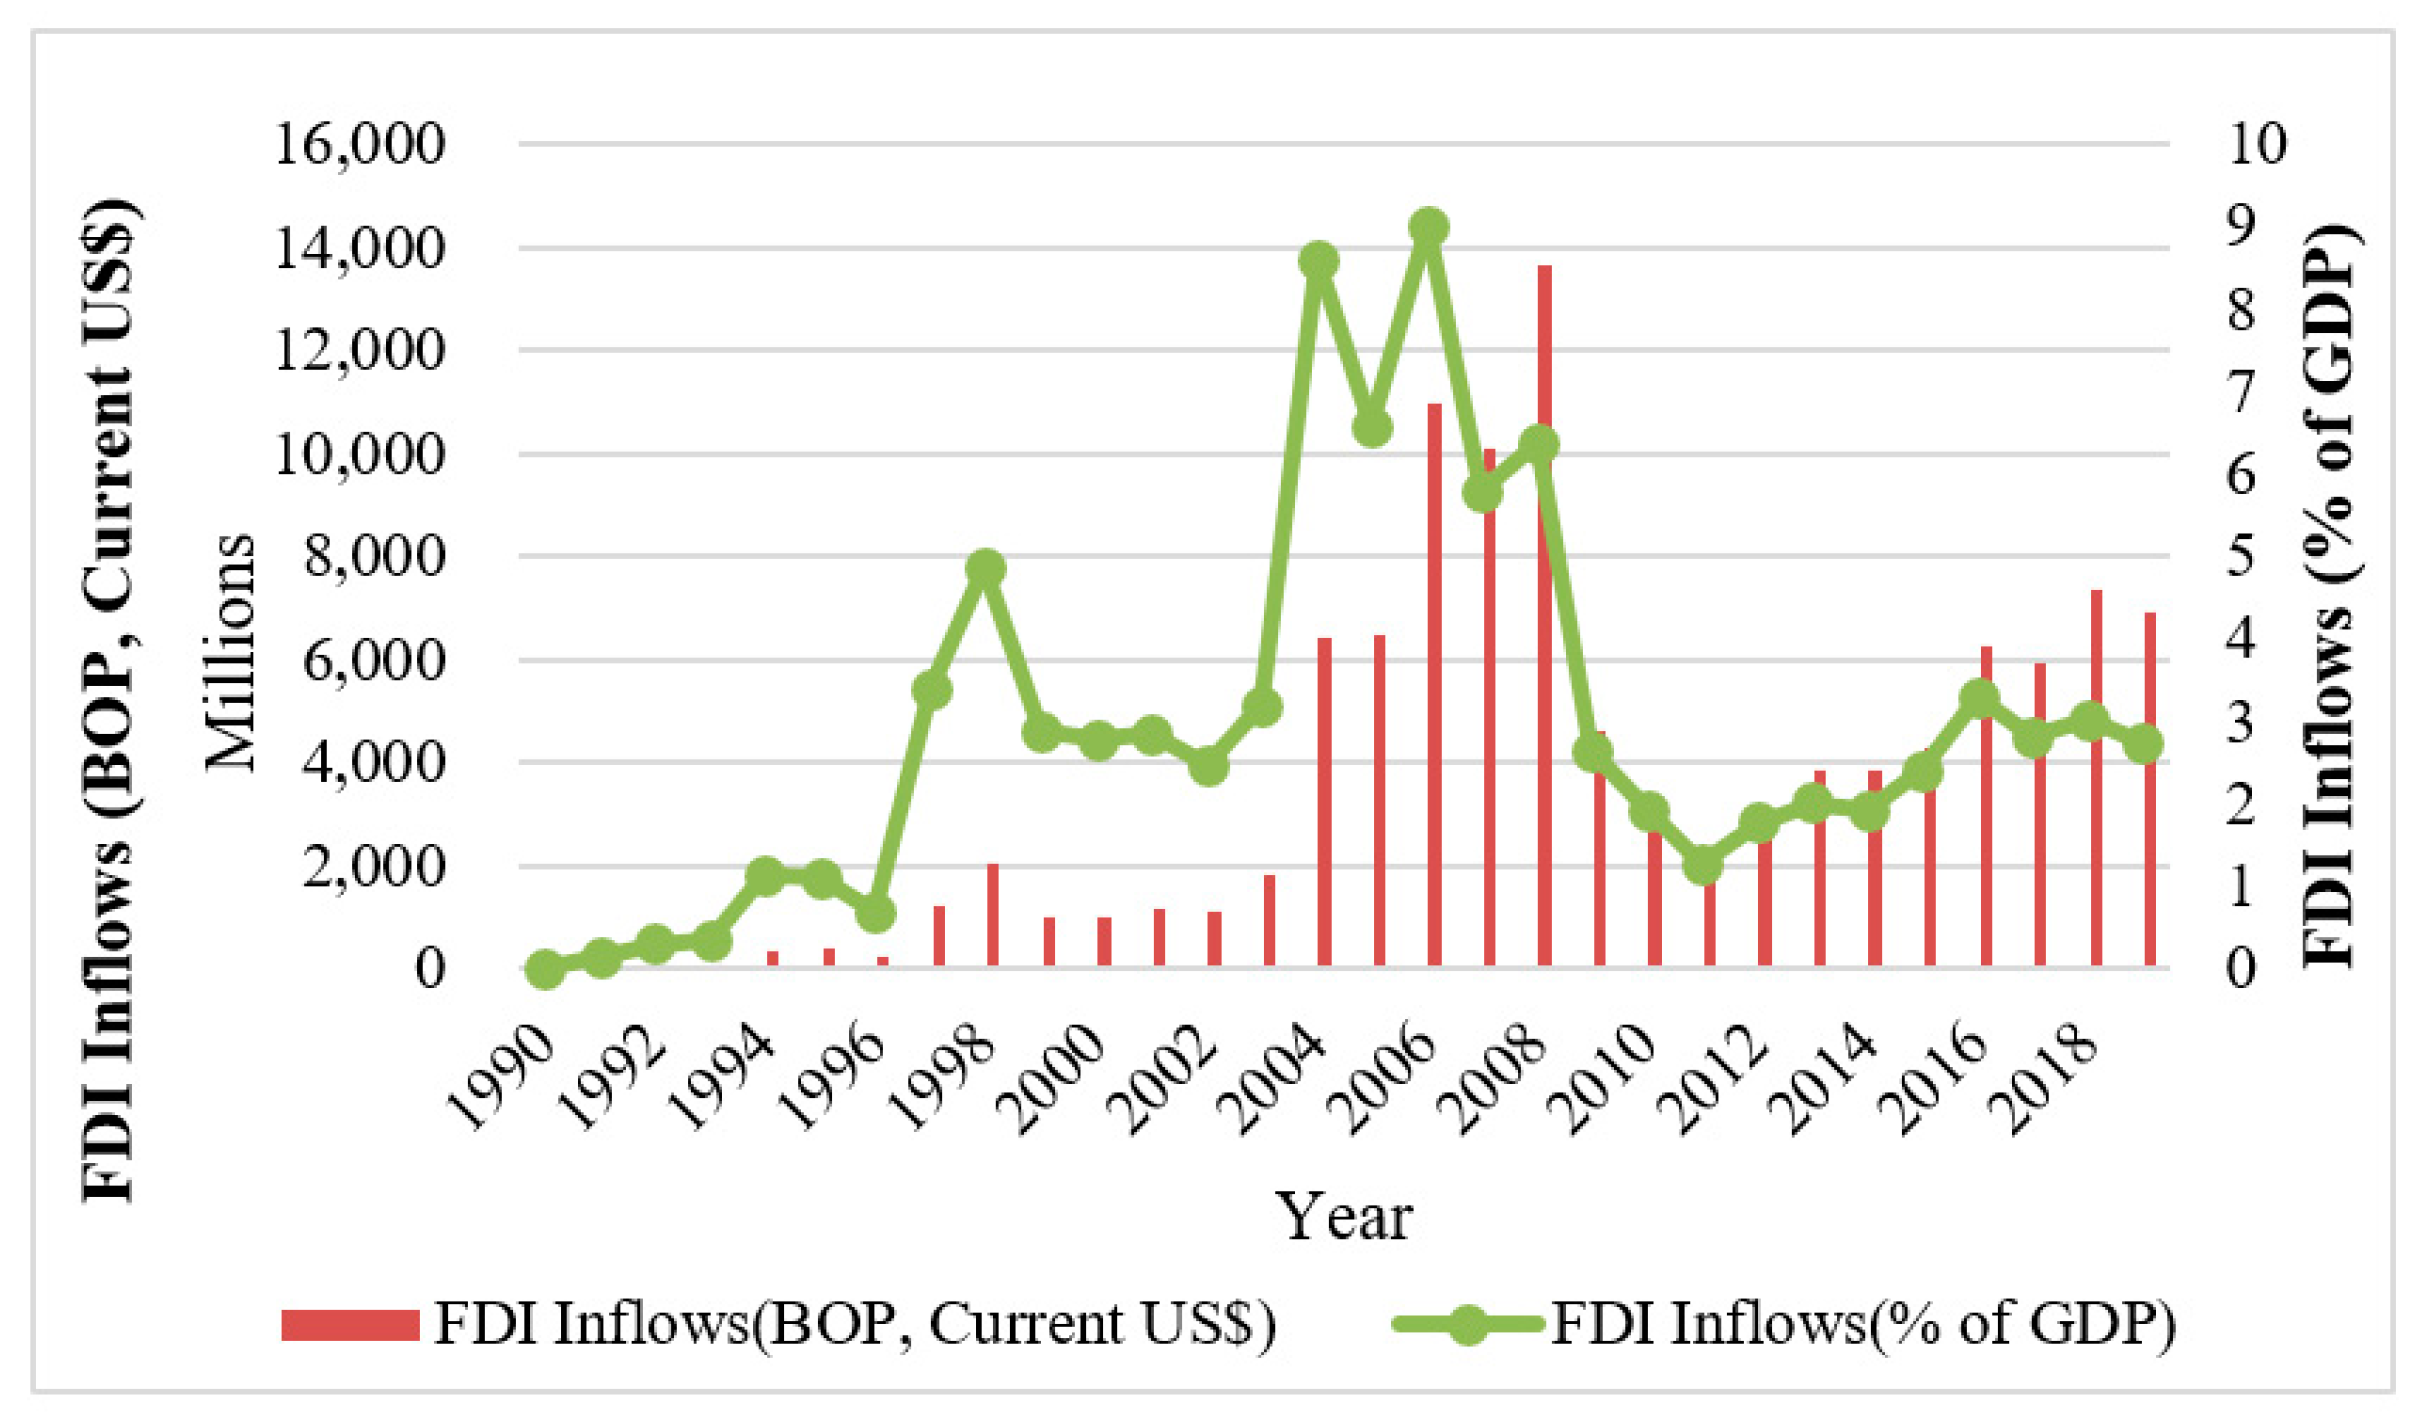
At the beginning of this period, between 1990 and 1995, the foreign direct investment inflows in Romania increased, but, compared to 1994 and 1995, they still remained low from 1990 to 1993. In 1990, FDI inflows were US
$0.01 million, increasing, in five years’ time, to 419 million in 1995. In 1996, there was a slight decline in FDI inflows. After 1996, foreign investments inflow grew, recording higher values of over 1000 million dollars per year (for instance, they reached US
$ 2031 million dollars in 1998). This trend of FDI growth continued during the period 2002–2008 (as shown in
Figure 1), reaching a maximum value in 2006, and corresponding to an amount of 13,667 million dollars in 2008, when the global crisis started. The changing global economic situation had a crucial impact on foreign direct investment, as the global crisis influenced the decision-making process of investors (
Chirilă-Donciu 2013). After the global financial crisis in 2008, FDI inflows began to decrease until 2011. There was an increase in FDI inflows, reaching an amount of 3047 million dollars in 2012. However, in comparison with 2008, the level remained low. The latest value of FDI net inflows (BOP, current US
$) in Romania was
$6911 million as of 2019.
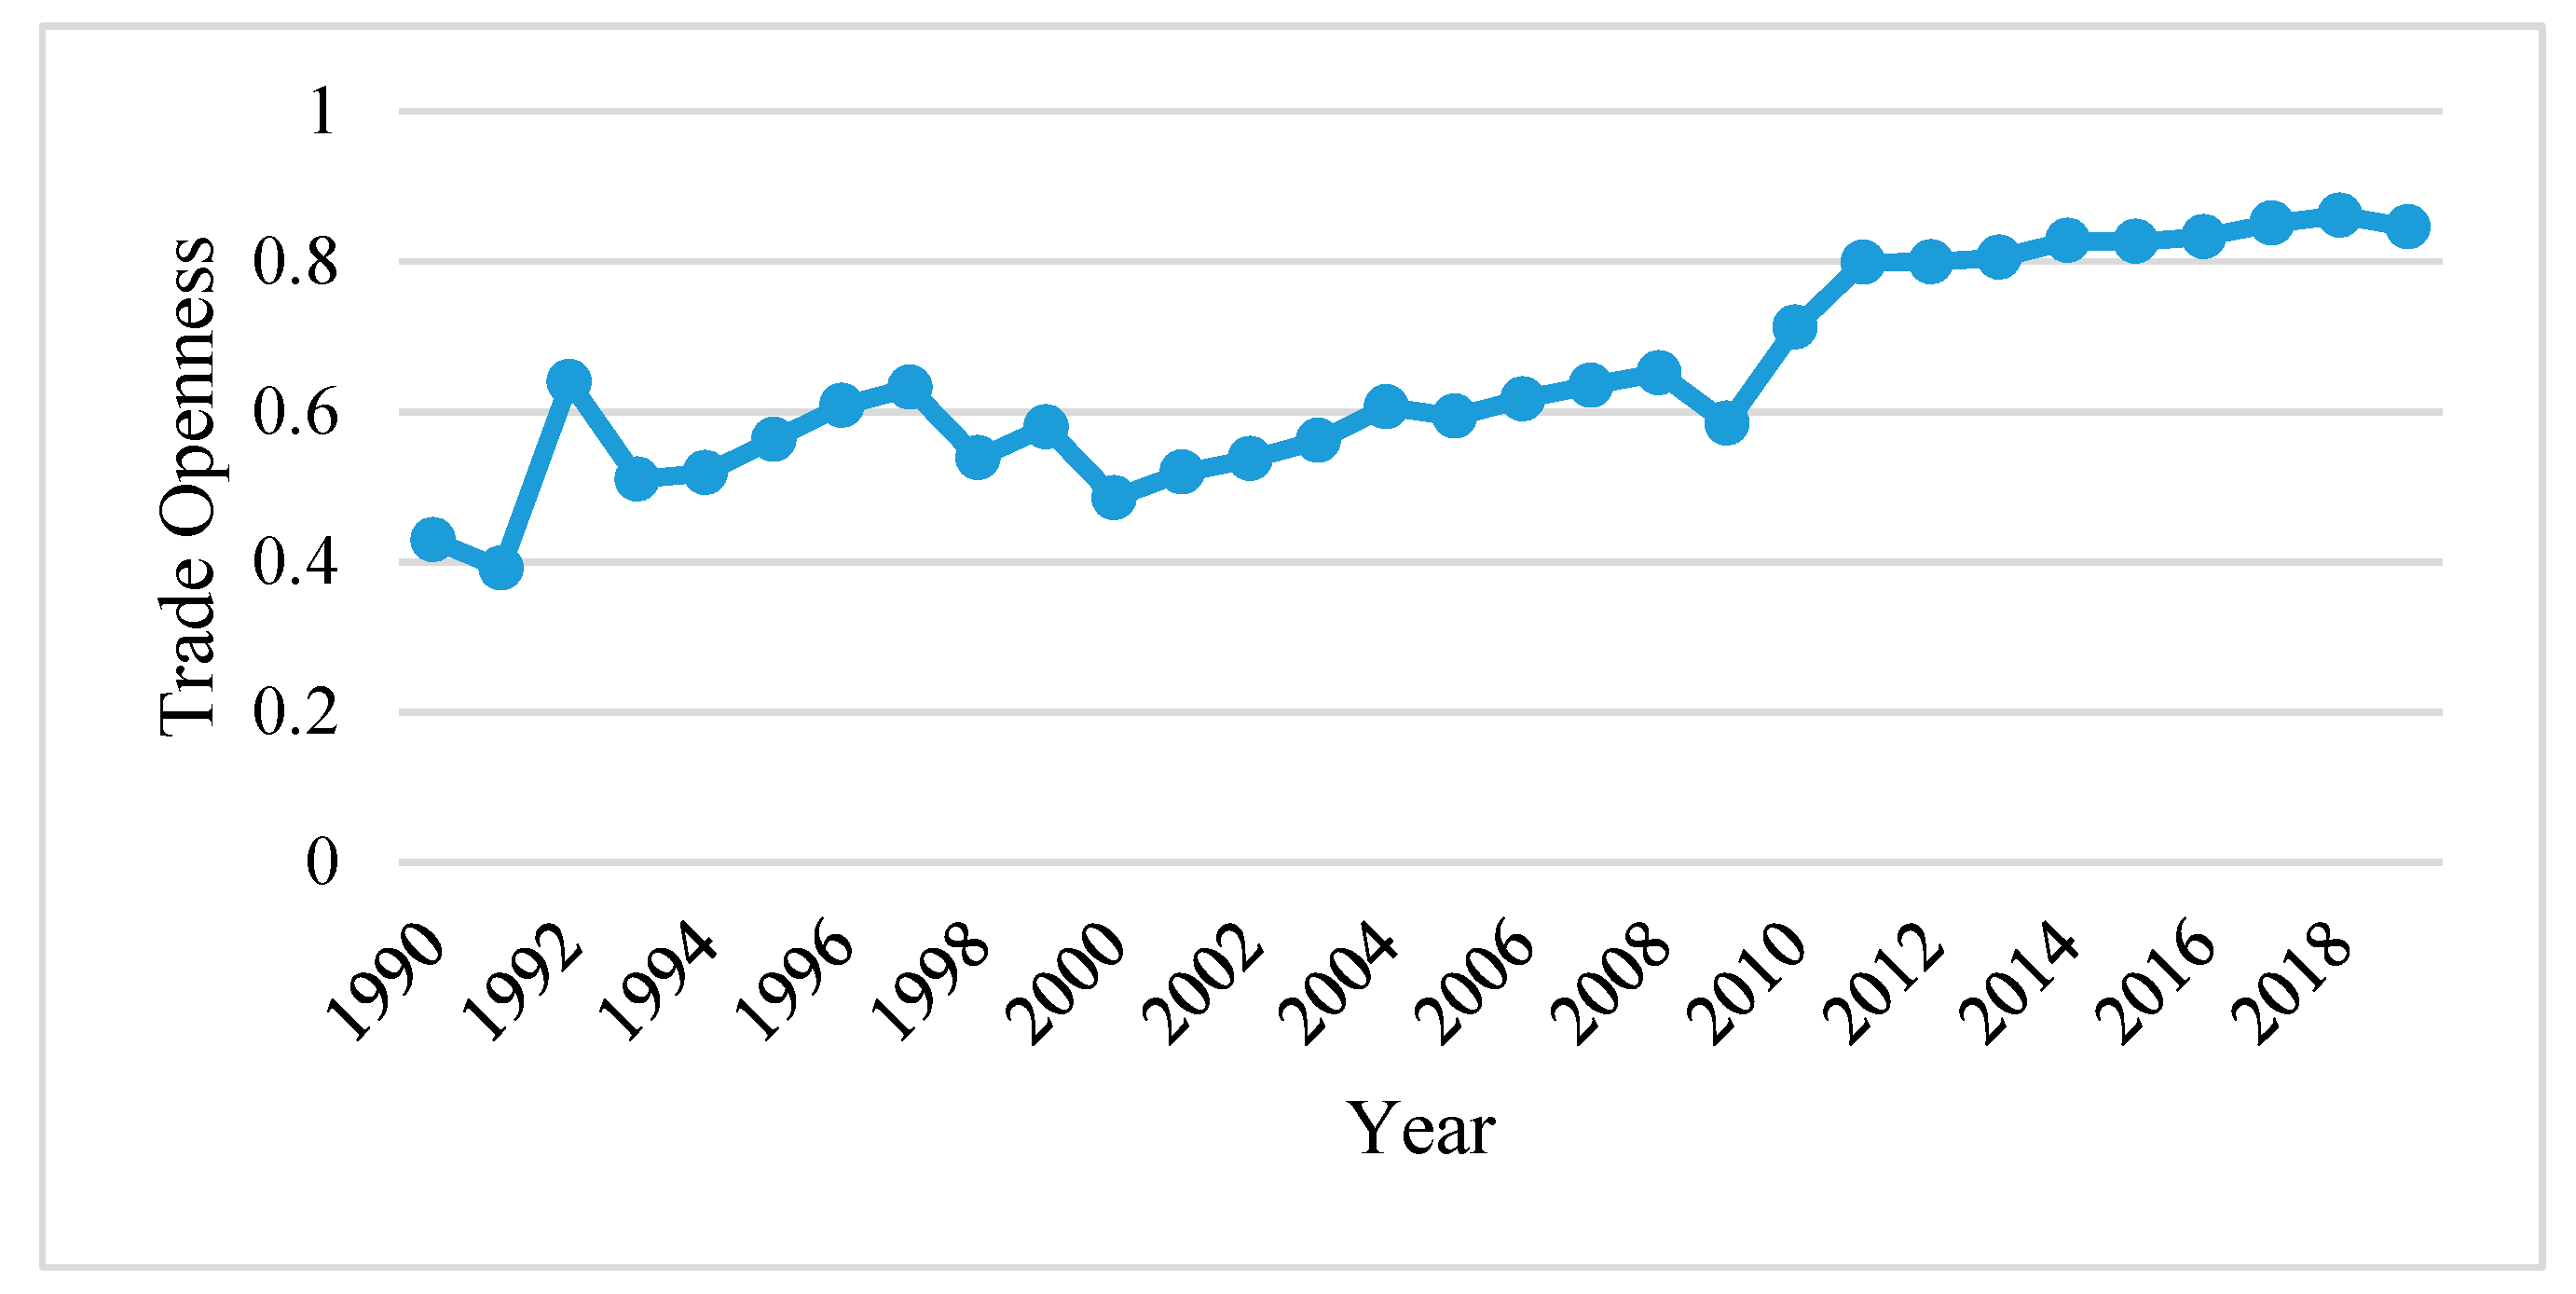
When consider FDI inflow as a percentage of GDP, and for that indicator, we provide data for Romania from 1990 to 2019. The minimum value during that period was 0.137 percent in 1991, and a maximum of 6.377 percent in 2008. The latest value from 2019 is 2.764 percent (see
Figure 2).
According to the trade openness data, the maximum trade openness value was 0.86 in 2018, and the minimum trade openness value is 0.39 in 1991. The latest value from 2019 is 0.84. However, trade openness had a dynamic trend during the period.
Based on the empirical and theoretical evidence, this paper investigates the causal relationship between trade openness and foreign direct investment inflows in the short-run and long-run using the data over the period of 1997–2019, and makes some policy suggestions as to how the government could improve this investment area of the economy. Throughout this study, Gross Domestic Product (GDP), Real Effective Exchange Rate (EXR), Inflation (INF), and Education (EDU) act as the control variables, for investigating the relationships between trade openness (TOP) and FDI inflow in Romania.
The paper is organized as follows: In the first part, a review of the literature field gives empirical evidence of earlier studies on the determinants of foreign direct investment. Next, the research materials and methodology are presented, respectively: The functional form of the theoretical model, data, and econometric methodology.
2. Literature Review
For instance, a series of studies regarding the influence of trade openness on FDI in a group of selected Asian countries—India, Iran, and Pakistan—over the time of 1982 to 2012 were conducted (
Zaman et al. 2018;
Patsupathi and Sakthi 2019). The fixed effect and Pooled OLS techniques employed of panel data were used for measuring individual country effect, group effect, and time effect. The results indicated that exchange rate and inflation were used as a proxy for macroeconomic stability and GDP per capita variables had a statistically significant impact on FDI inflow. The authors have found that high trade openness causes the increase in FDI inflows on both levels—global and national. As a conclusion, trade openness would be a better option for sustained foreign direct investment inflows in long-run.
Alshamsi et al. (
2015) examined the impact of inflation rate and GDP per capita on inward foreign direct investment inflows in United Emirates over the time of 1980 to 2013. They used the ARDL (Auto Regressive Distributed Lag) model, and they found that GDP per capita had a positive and statistically significant impact on FDI inflows, while inflation rate did not have the expected sign and it was not statistically significant both in long-run and short-run. They suggested that more variables in future researches—such as infrastructure, political stability, country risk, and country openness—will provide a better model to examine the impact of inflation rate and GDP per capita on FDI inflows (
Mohamed and Sidiropoulos 2010).
Ho et al. (
2013) have examined the relationship between trade openness, market size, and other fundamentals on FDI in fast emerging six countries including Brazil, China, India, Russia, South Africa, and Malaysia from 1977 to 2010. The study is based on two econometrics models as macroeconomics factors on FDI inflow and country specific factors on FDI inflow. Market size (GDP), trade openness, financial development, exchange rate, interest rate, government consumption, and inflation rate were considered macroeconomic factors with impact on FDI inflows, while the considered country factors were: Economic freedom, wages, human capital, and infrastructure quality. The results for both models indicated that market size (GDP), interest rate, literacy rate, economic freedom, and infrastructure quality had impacts on FDI in the majority of BRICS countries and Malaysia. GDP had positive and statistically significant impacts on FDI in Russia, China, and Malaysia (
Fazekas 2016). Trade openness had only a statistically significant impact on FDI in Malaysia, and no impact on other emerging countries (
Karimi and Yusop 2009;
Sazali et al. 2018).
Asiamah et al. (
2018) employed a Johansen’s approach to co-integration test and vector autoregressive model to study the determinants of FDI inflow in Ghana for the period of 1990–2015. The regression model reported FDI stock as the dependent variable, and independent variables were: Inflation rate, interest rate, real effective exchange rate and real gross domestic product rate, electricity production, and telephone usage. The results indicated that inflation rate, exchange rate, and interest rate had statistically significant negative effects on FDI in Ghana, while gross domestic product, electricity production, and TU had a positive effect on FDI both in the long-run and short-run. Furthermore, the Granger causality test results indicated that there was a bi-directional causality between electricity production, telephone usage, and FDI. However, inflation rate, interest rate, exchange rate, GDP, and FDI has unidirectional causality.
To examine the determinants of foreign direct investment inflow in Sri Lanka,
Wijeweera and Mounter (
2008) used the vector autoregressive methods (VAR) since its economic reform (1977). The regression model was built using six variables, namely foreign direct investment inflows (FDI) such as dependent variable and market size and performance (RGDP), an openness indicator (TRADE), a labor cost indicator (WAGE), the exchange rate (EXR), and the interest rate (IR) as independent variables. The study found that real GDP used as a market size had a positive and statistically significant impact on FDI inflows in long-run. Wage rate had a strong negative impact on FDI inflows and influenced in a positive way the relationships between host country interest rates and FDI inflows. Trade openness also shows positive and statistically significant impact on inward FDI long-run. Finally, the study suggested giving more consideration on GDP, exchange rates, interest rates, and the level of external trade to attract FDI inflows in Sri Lanka, in line with
Ravinthirakumaran et al. (
2015).
Uduak et al. (
2014) examined the determinants of foreign direct investment in Brazil, Russia, India, China, and South Africa (BRICS) and Mexico, Indonesia, Nigeria, and Turkey (MINT) using pooled time-series cross sectional analysis and random effect model over the period 2001–2011. The analysis considered FDI net inflow as the dependent variable and the considered independent variables were gross domestic product, the share of natural resources in GDP, infrastructure, inflation, trade openness, and institutional-related indicators. The results showed that market size, infrastructure availability, and trade openness had significant roles in attracting FDI to BRICS and MINT, while the roles of availability of natural resources and institutional quality had an insignificant impact on FDI in long-run.
A study by
Demirhan and Masca (
2008) examined the determinants of foreign direct investment (FDI) inflows in 38 developing countries over the period of 2000–2004 using panel data analysis. In the model, the dependent variable was FDI net inflows, as a percentage of GDP, and the independent variables were: Growth rate of per capita GDP, inflation rate, telephone main lines per 1000 people measured in logs, labor cost per worker in manufacturing industry measured in logs, degree of openness, risk, and corporate top tax rate. The results indicated that growth rate of per capita, telephone main lines, and degree of openness had a positive and statistically significant relationship with FDI net inflows. Inflation rate and tax rate presented negative and statistically significant relationships with FDI net inflows. However, labor cost has a positive sign and risk has a negative sign, in line with previous studies. Both variables do not influence FDI net inflows, implying that labor cost and risk variable have not been important factors in attracting FDI.
To identify the key determinants of FDI inflows in Sri Lanka during the period from 1970 to 2014,
Wickramarachchi (
2019) conducted research based on a supply–demand framework using ARDL method. FDI to private investment acted as the dependent variable, and independent variables were the ratio of FDI flows to developing countries, real gross domestic product, trade openness, real wage index, and real effective exchange rate. Political stability is included as a dummy variable and regime changes of FDI policy captured in three period as 1977–2000, 2001–2008, and 2009–2014. Results indicated that trade openness and real wage index did not have any significant relationship with FDI inflow in Sri Lanka. Real gross domestic product was an insignificant factor in determining FDI inflow in long-run. This result is in line with
Athukorala (
2003). FDI inflows to Sri Lanka have been export-oriented type instead of market seeking type, proving the results. Real effective exchange rate variable had a negative and statistically significant impact. It indicated that appreciation of the real effective exchange rate reduced the FDI inflow in Sri Lanka. FDI inflow had a positive and significant impact on the political stability. All three dummy variables for regime changes of FDI policy are positive and had significant impacts on FDI inflow, and the results indicated that open economic policies were successful in attracting FDI compared to closed economic period. Finally, the study suggested to remove and reduce the existing barriers, policy uncertainties, and inefficiencies to attract more FDI inflows in Sri Lanka.
A study by
Muzurura (
2016) examined the determinants of FDI inflow in Zimbabwe over the period 1980 to 2011. Foreign direct investment acted as an endogenous variable and the independent variables were external debt, gross fixed capital formation, gross fixed capital expenditure, gross domestic product, trade openness, and inflation rate. The results indicated that gross fixed capital formation and trade openness had a positive and statistically significant relationship with FDI inflow in long-run. Inflation rate was found to be negative and had a significant impact on FDI inflow. Moreover, the empirical results did not confirm lagged GDP, external debt, government expenditure, and lagged exports as major determinants of FDI inflow in short-run, as other studies revealed (
Kandiero and Chitiga 2003;
Kariuki 2015).
Quazi (
2007) examined the determinants of FDI, the relationship between FDI and economic freedom, and analyzed the investment climate from foreign firms’ perspective using panel data from nine countries over 1995–2004. Lagged changes in FDI, market size, economic freedom, human capital, infrastructure, trade openness, and return on investment acted as independent variables in the model. The results indicated that, among the explanatory variables, incremental lagged changes in FDI, economic freedom, infrastructure, return on investment, and trade openness turned out highly significant with the expected signs. However, market size and human capital variables did not have a statistically significant impact on FDI.
For analyzing the effect of trade openness of foreign direct investment in African countries,
Makoni (
2018) selected nine African countries, over the period 2009–2016. The ratio of net FDI inflows to GDP was considered as the dependent variable, and the independent variables were the log of FDI to GDP and trade openness, real exchange rate, macroeconomic stability proxy as real economic growth, natural resources endowment, infrastructure, and capital openness. The study employed various econometric techniques such the pooled OLS, Least Squares Dummy Variable (LSDV), Fixed Effects (FE) model, Random Effects (RE) model, Generalized Method of Moments (GMM) model, and the Generalized Least Squares (GLS). According to the results of the random effects model, foreign direct investment was positively related with trade openness. Real exchange rate variables had a positive and statistically significant impact on FDI inflow while capital openness was positive, but insignificant. The study suggests adopting investment and macroeconomic policies.
Shah and Khan (
2016) assessed the impact of trade liberalization on inward FDIs in six emerging countries, namely Brazil, China, India, Mexico, the Russian Federation, and Turkey, for the time period of 1996 to 2014 using the random effects model. The independent variables—total population, GDP per capita, total trade, primary education, preferential trade agreements, and regional trade agreements—are used as proxies for market size, development level, openness, human capital, and trade liberalization. As results, market size, and human capital have a positive and significant impact on FDI inflows, while trade and regional trade agreements prove to be insignificant, but preferential trade agreement positively impacts on FDI inflow.
Trade openness contributes positively to the inflow of FDI in developing economies in the long-run (
Liargovas and Skandalis 2012). They used a sample of 36 developing economies for the period 1990–2008. It provided a direct test of causality between FDI inflows, trade openness, and other key variables in developing regions of the world. Further, the study indicated that there are some other factors such as political stability, exchange rate stability, and market size with positive influence to the existence of FDI inflows.
To examine the macro determinants of FDI inflow to Japan during the period 1989 to 2002 used the panel data analysis method (
Kimino et al. 2007). FDI inflows from 17 countries to Japan were considered as the dependent variable, and the independent variables were GDP, export performance of source countries, relative bilateral exchange rate, borrowing cost differentials, relative labor cost, and country risk rating. According to the results, the effects of market size, exchange rates, and labor costs factors have a statistically unimportant effect on FDI to Japan. The export performance of the source country was found to have a negative impact on FDI.
Sabir et al. (
2019) have examined the impact of institutional quality on Foreign Direct Investment inflows using panel data for low, lower middle, upper-middle, and high-income countries for the sample period of 1996–2016. The study was based on the system Generalized Method. Inflation, trade openness, mobile phone subscriptions per 100 people, GDP per capita, and value-added share of agriculture as a percentage of GDP independent variables acted as control variables to find the impact of institutional quality on Foreign Direct Investment inflows. The results indicated that institutional quality had a positive impact on foreign direct investment in all groups of countries. Control of corruption, government effectiveness, political stability and regulatory quality, rule of law, and voice and accountability for FDI inflows were higher in developed countries than in developing countries. GDP per capita, agriculture value-added as a percentage of GDP, and inflation variables had negative influence on FDI inflows in developed countries, while GDP per capita, trade openness, agriculture value-added as a percentage of GDP, and infrastructure had a positive and statistically significant impacts on FDI inflows in developing countries. At the same time, other studies (
Appiah-Kubi et al. 2020a) revealed that regarding FDI and the companies created in African countries as a result of this kind of investment, there is a positive connection between the efficiency of corporate administration and the degree of FDI and a negative connection between the level of FDI and securities standard regulation.
Mugableha (
2014) examined the determinants of foreign direct investment inflows in Malaysia using an unconditional error correction approach over the period 1977–2012. Broadest money supply, consumer price index, exchange rates, gross domestic product, and trade were considered as the determinants of FDI inflow in the model, ARDL approach. For the results, exchange rates, gross domestic product, broadest money supply, and trade had a significant impact on FDI inflows in Malaysia, while consumer price index had a negative impact on FDI inflow.
A study of
Musabeh and Zouaoui (
2020) investigated the determinants of FDI inflows and impact of FDI-policies adopted by the host countries in North Africa, namely Algeria, Egypt, Libya, Morocco, and Tunisia over the period 1996–2013. The independent variables have been categorized into different classifications as economic variables, institutional variables, and political variables, with two kinds of investment policies. Investment agreement, investment freedom, market size, trade openness, natural resources, gross fixed capital formation, infrastructure, inflation, exchange rate stability, corruption perception index, regulation, and Political Constraints Index were the independent variables in the model. The results indicated that the trade openness had a positive and statistically significant relationship with FDI inflows growth. However, the natural resources and market size variables had a negative and insignificant relationship with change of FDI inflows in North African countries. Other studies (
Appiah-Kubi et al. 2020b) revealed the fact that foreign investors should consider not only the elements of macroeconomic environment, but also the governance systems.
To examine the influential factors on FDI inflow in the South Asian Association for Regional Cooperation Countries (SAARC) and their impact on economic growth over the period 1980 to 2018, a study considering a series factors with potential influence on FDI flow was conducted (
Gunawardhana and Damayanthi 2019). GDP per capita, inflation, money and quasi money (M2), trade openness, current account balance, telephone lines, and time to export variables were considered as influential factors on FDI inflow. The results indicated that the market size of a country as per GDP per capita growth, current account balance, financial deepening (Money and quasi money (M2)) and trade openness significantly influence FDI flows into the South Asian region. However, the coefficient of INF variable was positive, but insignificant at any significant level. This indicates that inflation cannot significantly explain the variation in FDI inflow throughout the years in the region. Furthermore, infrastructure and other qualitative variables also showed significant influence on FDI flows. They found trade and FDI had a bidirectional Granger causality as the results of the causality for seven countries in the SAARC region.
Hintošová et al. (
2018) examined the determinants of foreign direct investment inflows into Visegrad countries namely, Poland, Hungary, Czech Republic, and Slovak Republic, from 1989 to 2016 using OLS and Fixed effect model. Market size, labor cost, trade openness, economic stability, innovation, and taxation variables were considered as the independent variables of the model. The results indicated that GDP per capita, inflation rate, unemployment rate, and the innovation variables did not have any significant relationship to FDI inflows in the case of the Visegrad countries. The level of gross wages and the share of labor force which achieved at least secondary education variables that had a positive and statistically significant effect on FDI inflows. Those variables were the most significant determinants of FDI inflows. Moreover, the results indicated that corporate income tax rate, trade openness, and expenditures on research and development had negative impact on FDI. This study concluded that the four countries put emphasis on the investment aid in the form of tax reliefs, or the other investment incentives, rather than basic macroeconomic variables in the process of FDI attraction.
Ranjan and Agrawal (
2011) used the panel data analysis to examine the determinants of FDI inflow in BRIC countries namely: Brazil, Russia Federation, India, and China from 1975 to 2009. Market size, economic stability and growth prospects, labor cost, infrastructure facilities, trade openness, total labor force, and gross capital formation acted as the independent variables of the model. The empirical results indicated that market size, trade openness, labor cost, infrastructure facilities, and macroeconomic stability and growth prospects were potential determinants of FDI inflow in BRIC. However, gross capital formation and labor force variables were not statistically significant. It indicated that gross capital formation and labor cost cannot significantly explain the variation in FDI inflow throughout the years.
To investigate the determinants of net FDI inflows to Africa over the period 1976–1996,
Anyanwu and Erhijakpor (
2004) conducted the research under the topic on trends and determinants of foreign direct investment in Africa using a pooled regression approach. The independent variables of the model are: Credit to private sector, export processing zone, political rights and civil liberties, GDP annual growth rate, inflation rate, financial deepening (M2/GDP), tax on income profit, international trade, telephone mainlines per 1000 people, total debt, trade as percentage of GDP, exchange rate volatility, region (Southern Africa, West Africa, Central Africa, North Africa, and East Africa). Region is a binary variable representing the various regions of Africa. The results indicated that credit to private sector, export processing zone, and capital gain tax variables had a negative and statistically significant impact on FDI inflow; GDP annual growth rate and infrastructure represented by the number of telephones per 1000 people variables had a positive and statistically significant impact on FDI inflow. However, none of the other variables, civil and political rights, inflation rate, financial depth, trade tax, debt service ratio, and exchange rate volatility had significant effect on net FDI inflows to Africa. Finally, they suggest developing infrastructure facilities in African countries to attract more foreign investors.
Seyoum et al. (
2014) examined the Granger causality relations between foreign direct investment and trade openness in Sub-Saharan economies using Panel data for 25 sub-Saharan African economies over the period 1977–2009. The results indicated that a bidirectional causality relation was identified between trade openness and foreign direct investment in Sub-Saharan economies. Finally, they suggested that the African countries should expand their productive capacity to produce and export to promote and attract FDI.
The causal relationships between FDI and international trade in India and China (
Sharma and Kaur 2013) applied Granger causality tests. Secondary data were applied from 1976 to 2011 for the study. They found that there was unidirectional causality running from FDI to imports and FDI to exports, and bidirectional causality existed between imports and exports in China. The results were different from the results of India, whereby bidirectional causality existed between FDI and imports; FDI and exports; and exports and imports. India has shown a dynamic relationship.
To examine the impact of economic and non-economic factors on FDI net inflow in Sri Lanka,
Vijesandiran and Vinayagathasan (
2020) conducted a study using ARDL Bounds test procedure over the period of 1996–2017. Treasury bill rate, consumer price index real gross domestic product, exchange rate, corporate tax, labor cost, and trade openness acted as economic factors, and political instability, the existence of violence or terrorism, and control of corruption acted as non-economic factors. According to the long-run equation results that indicated market size proxies as (GDP), depreciation of domestic currency, interest rate, and wage rate have a positive impact on FDI inflow in the long-run, whereas inflation rate, corporate tax, trade openness, political instability, and corruption variables have a negative impact on FDI inflow in the long-run. According to the short-run results, none of the economic and non-economic factors has statistically significant impact on FDI inflow.
3. Materials and Methods
This study used annual time series data for the period 1997 to 2019. Data were collected from the World Development Indicator published by the World Bank 2020. This study adopted the
Zaman et al. (
2018) theoretical framework to find out the relationship between the FDI inflow and trade openness. Furthermore, we developed the model adding an indicator of education in Romania.
The functional form of the theoretical model of this study is drawn as:
where,
FDI = Per capita Foreign Direct Investment Inflows (Current US$)
LGDP = Log of Gross Domestic Product (Current US$)
EXR = Real Effective Exchange rate Index (2010 = 100)
TOP = Trade Openness
INF = Inflation, Consumer Prices (annual %)
EDU = Labor force with advanced education (% of total working-age population with advanced education)
The above functional form can be specified in the following econometric model:
where,
to
are the slope coefficients
is the white noise error term, and the subscript t indicates time.
In order to make the model and variables free from problems associated with time series data, we used Augmented Dickey-Fuller (ADF) and PP unit root test approaches to test stationary of the variables. Moreover, diagnostic tests were conducted to check whether the results are robust. The tests conducted are Breusch-Godfrey Serial Correlation LM Test to detect serial correlation among residuals, Ramsey’s reset test to check whether the model is specified correctly, test of skewness, and Kurtosis test to check whether the residuals are normally distributed to detect heteroscedasticity in the model. The study employs Cumulative sum of recursive residuals (CUSUM) and cumulative sum of square of recursive residuals (CUSUM of squares) to check the stability of the model. E-view 10 software was used to analyze the data.
Auto Regressive Distributed Lag (ARDL) co-integration procedure, developed by
Pesaran et al. (
2001), was employed to empirically examine Equation (2).
An ARDL representation of Equation (2) is formulated as follows:
where, Δ denotes the first difference operator,
is the drift component,
is the usual white noise error term, (β
2→ β
6) correspond to the long-run relationship, the remaining expressions with the summation sign (
) represent the short-run dynamic of the model.
The first step of the estimation bound testing procedure is employed in order to investigate the existence of long-run relationship the bound tests approach developed by
Pesaran et al. (
2001). He has been provided the two sets of critical values in which lower critical bound assumes that all the variables in the ARDL model are I(0), and the upper critical bound assumes I(1). If the calculated F-statistic is greater than the appropriate upper bound critical values, the null hypothesis is rejected, implying co-integration. If such statistic is below the lower bound, the null cannot be rejected, indicating the lack of co-integration. If, however, it lies within the lower and upper bounds, the results are inconclusive. After establishing the evidence of the existence of the co-integration between variables, the lag orders of the variables are chosen by using the appropriate Akaike Information Criteria (AIC).
In the next step of the estimation procedure, we obtain the short run dynamics of parameters and long run adjustment of the model by estimating the error correction version of the ARDL model pertaining to the variables in Equation (4) is as follows:
where, γ is speed of adjustment coefficient, and μ
t is pure random error term. However, in order to estimate the ARDL bound testing technique, first we need to confirm the order of integration of each series, which can be tested by Augmented Dickey-Fuller (ADF) and Phillips-Perron (PP) unit root test approaches. Then the optimum lag length that can be included in the model is selected from the AIC, SC, LR, FPE, and HQIC criterions.
The justification for the important variables used in this study is given below based on reviewing the existing theoretical and empirical studies:
3.1. Foreign Direct Investment (FDI)
For the purpose of this research, the FDI inflows of Romania were used as the dependent variable. In order to examine the impact those regressors selected for this study have on the dependent variable (FDI) individually.
FDI inflows are measured in current U.S. dollars divided by the host country’s total population.
3.2. Market Size
Market size and growth is considered as one of the most important determinants of foreign direct investment. Gross Domestic Product (GDP), GNP, GDP per capita income, GDP growth and size of the population, etc., variables are generally used to measures market size. The most of empirical studies are indicated that a large domestic market tends to attract more FDI, as they pose significant advantages in production and consumption. Investors normally prefer to invest to countries where market size is large compared to countries with low market size. Market size has a positive impact in directing inward FDI to host countries according to
Alshamsi et al. (
2015);
Ho et al. (
2013);
Asiamah et al. (
2018);
Wijeweera and Mounter (
2008); and
Zaman et al. (
2018), while
Wickramarachchi (
2019);
Quazi (
2007);
Muzurura (
2016); and
Musabeh and Zouaoui (
2020) observed an insignificant effect.
3.3. Exchange Rate
Many empirical studies have highlighted the relationship between exchange rate and FDI inflows. Exchange rate can affect various ways on the inward foreign direct investment. Some studies have indicated FDI has a positive relationship with the exchange rate, some with the negative relationship, while others showed an insignificant relationship. Many empirical studies applied different measures for exchange rate including nominal, real, volatility, and trade-weighted index. Exchange rate has a negative influence in directing inward FDI to host countries for the example studies (
Asiamah et al. 2018). Exchange rate has a positive and significant influence on FDI inflow, for example,
Liargovas and Skandalis (
2012),
Makoni (
2018).
Kimino et al. (
2007) found that there is no significant impact of exchange rate on FDI inflow.
3.4. Trade Openness
Many countries have tried to attract more foreign direct investment by making their economy more open and implement a number of progressive policies. The impact of trade openness on FDI inflow is expected to be mixed. The majority of empirical studies have found a positive relationship between trade openness and FDI inflows (
Makoni 2018;
Sahoo 2006;
Zaman et al. 2018), while some studies have found a negative relationship between trade openness and FDI inflow (
Adow and Tahmad 2018;
Cantah et al. 2018;
Khan and Hye 2014). On the other hand,
Ho et al. (
2013) and
Wickramarachchi (
2019) found that there is no significant impact of trade openness on FDI inflows in BRICS countries.
We formulated the trade openness data from the summation of import and export and divided it by gross domestic product.
IMR—Import Good and Services (Current US$), EXP—Export Good and Services (Current US$), GDP—Gross Domestic Product (Current US$).
3.5. Inflation Rate
Inflation rate represents the changes in the general price level. In many empirical studies, inflation rate is used as a proxy for macroeconomic stability. This has been widely acknowledged as one of the key influential factors of the flow of foreign direct investment into the host country. High inflation reduces investment in productive enterprises, thus reducing economic growth. Consumer Price Index and Wholesale Price Index measure inflation rate. The majority of empirical studies found a negative relationship between inflation rate and FDI inflows (
Asiamah et al. 2018;
Mugableha 2014;
Quazi 2007), while other studies (
Anyanwu and Erhijakpor 2004;
Alshamsi et al. 2015;
Hintošová et al. 2018;
Gunawardhana and Damayanthi 2019) found that there is no significant impact of inflation rate on FDI inflow.
3.6. Education
Foreign investors are more concerned with the quality of the labor force. The quality of labor force can help to the cost minimization objectives. They are more likely to invest to locations where there are quality of human capital resources. Labor that is more educated makes the learning and adoption of new technology easy and faster. Therefore, the effect of quality of labor on FDI could be positive. Data on labor force with advanced education (percentage of total working-age population with advanced education) is a proxy for human capital.
4. Discussion
The first steps of the estimation procedure, employs Augmented Dickey-Fuller (ADF) and Phillips-Perron (PP) unit root tests to check the stationary. The results of these tests are presented in
Table 1 below.
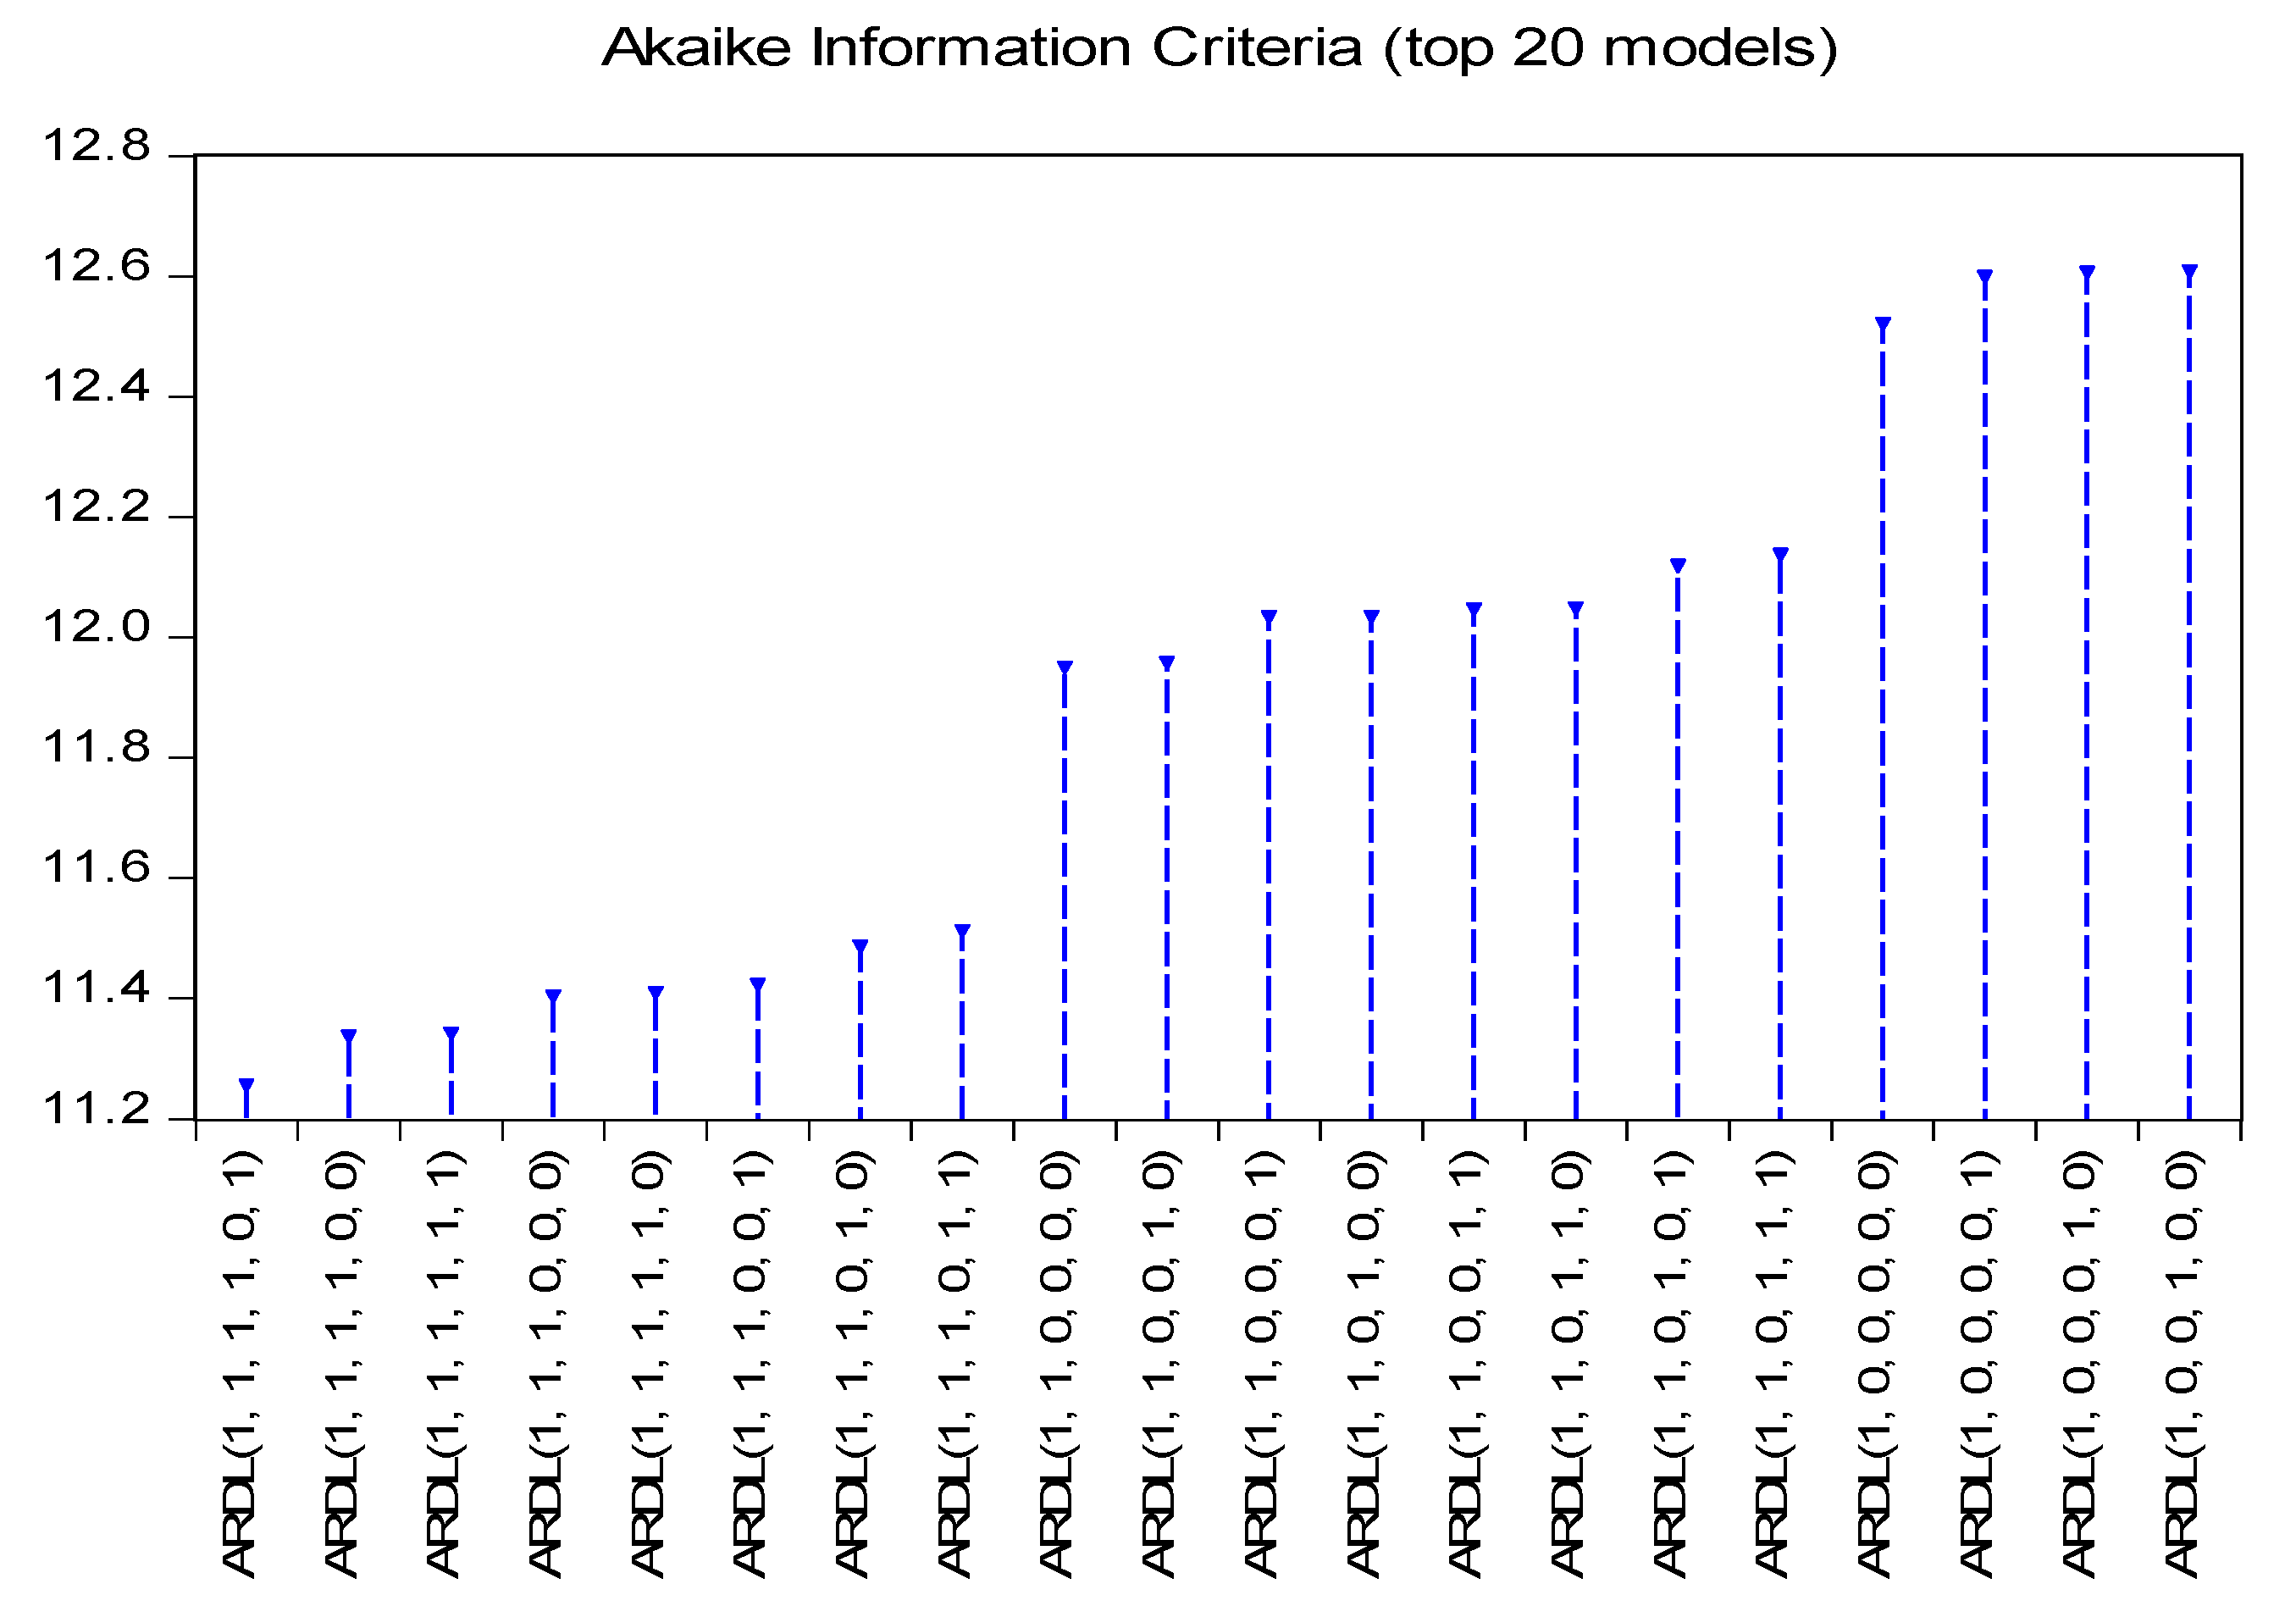
The results indicated that the null hypothesis of series contains a unit root cannot be rejected at levels for all variables except TOP and INF in ADF and PP unit root approaches. Nevertheless, this null hypothesis can be rejected when those variables are transformed into first difference forms. This reveals that GDP and INF are integrated in order zero [I (0)], while all other series are integrated in order one [I(1)]. It means the data are of mixed type of I (0) and I (I) underlying regressors and therefore, the ARDL testing could be proceeded with. Akaike Information Criteria (AIC) advocated using the ARDL (1, 1, 1, 1, 0, 1) model for this analysis (
Figure 3).
The diagnostic tests confirm that the models have the desired econometric properties (see
Table 2 below). According to the Lagrange Multiplier test of serial correlation between the error terms suggests that the residuals are not serially correlated since we failed to reject the null hypothesis of no serial correlation in the residual, as probability value is greater than the 5% level of significance. The Jarque-Bera test has indicated that, the null hypothesis of normally distributed residuals cannot be rejected, as probability value is higher than 5% level of significance, which means error is normally distributed. Breusch-Pagan-Godfrey test of heteroscedasticity detected that the disturbance term in the equation is homoscedastic, as we failed to reject the null hypothesis since the probability value exceed the 5% significance level. Finally, the Ramsey RESET test result confirms that there is no specification error in the estimated model.
The model is free from serial correlation and heteroskedasticity. Moreover, the functional form is correct and stochastic residuals are normally distributed. The estimated model satisfies all indispensable diagnostic tests.
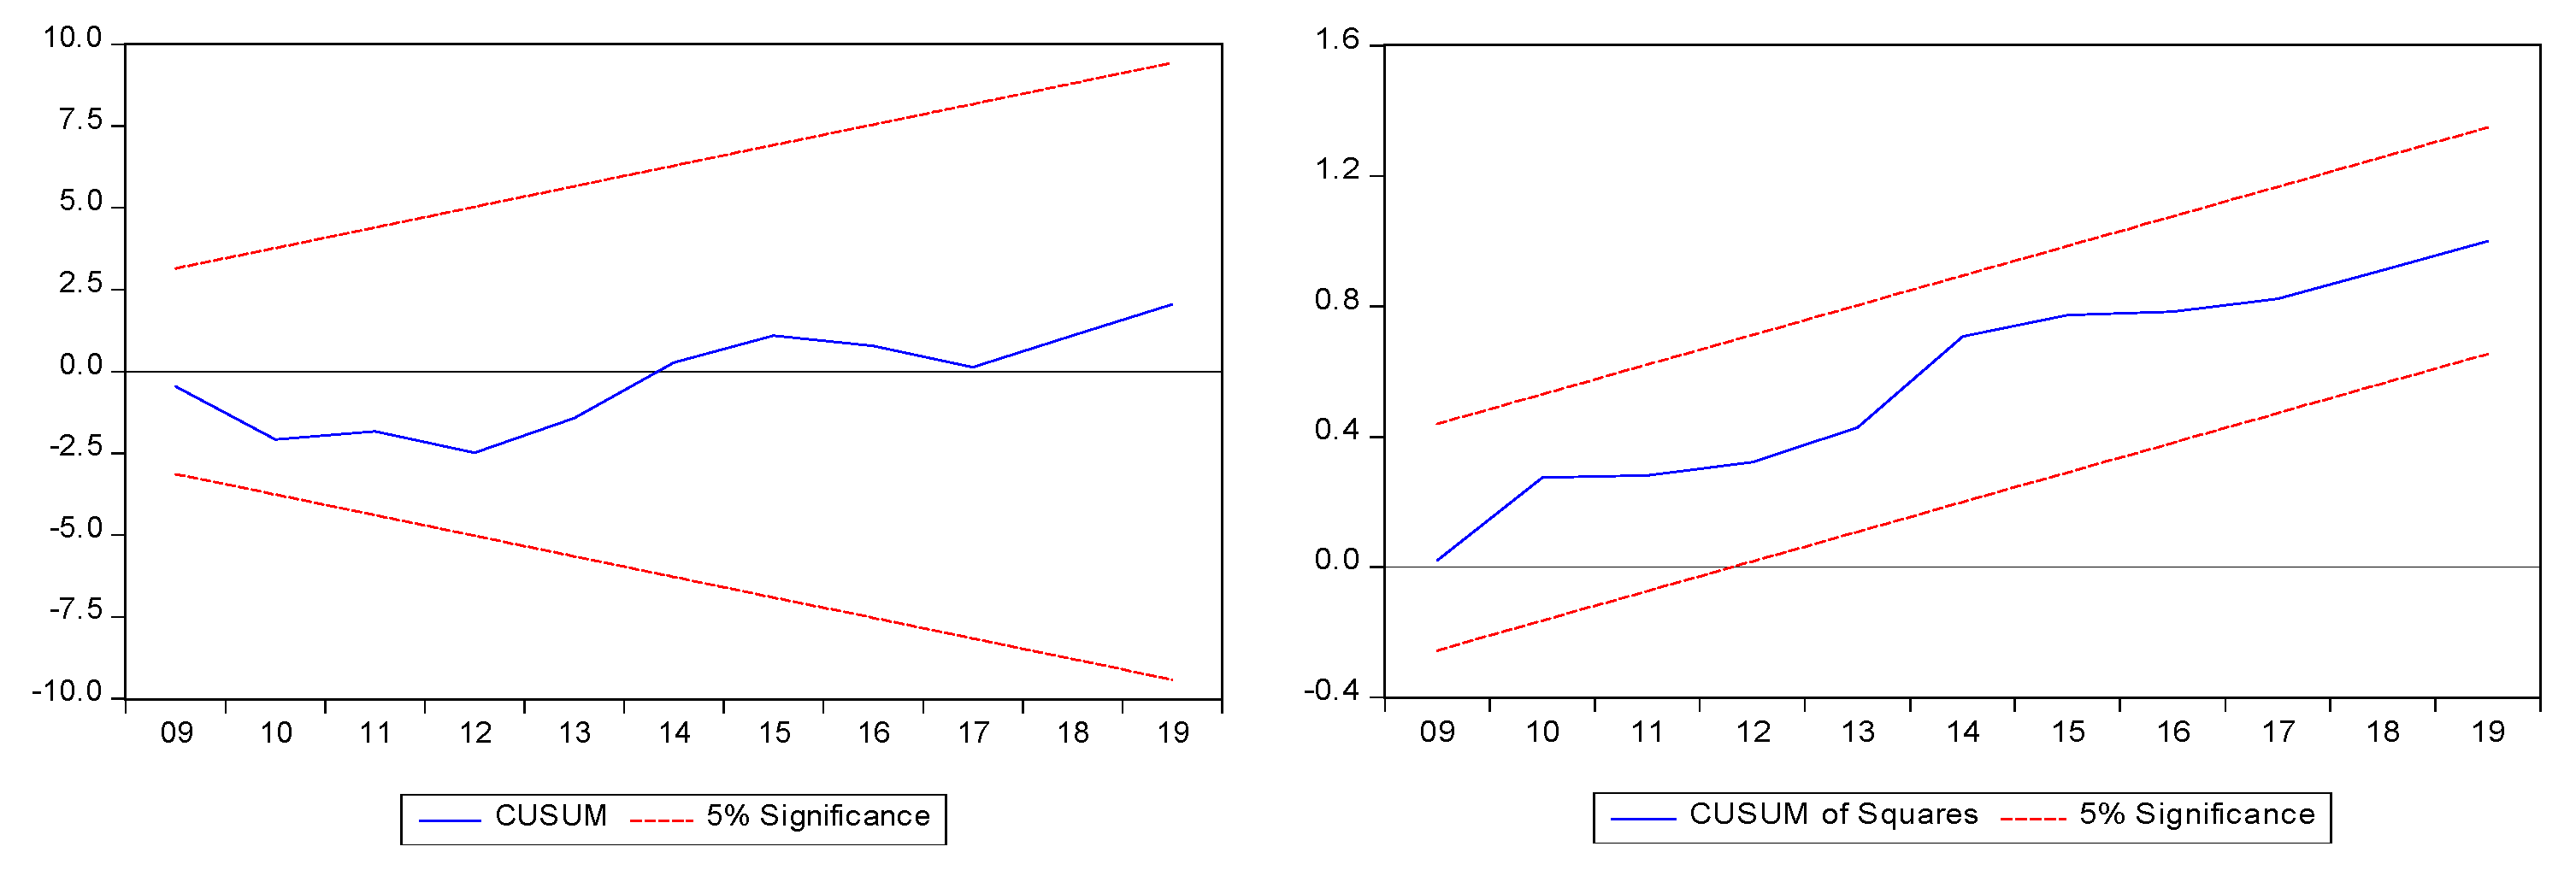
The main characteristic of the model parameters is their sustainability in the long run. Thus, stability of the model parameters are confirmed by “CUSUM” and “CUSUM of squares” tests. Parameters stability is identified during all the analyzed periods. Noting that we built a null hypothesis of a model that is not stable, the results of the test are given below (
Figure 4).
The graphs of CUSUM and CUSUM of squares test confirms that the model is stable since the residual plot lies between the lower and upper critical bounds at the 5% level of significance. That is, the selected model has stable parameters which can be used for long-term forecasts.
In
Table 3, calculated F-statistic = 7.1669 is higher than the upper bound critical value at 5% level of significance (3.38). Since we confirmed the co-integrating relationship between the variables through the Bounds test, we estimated the long-run relationship among the variables via the ARDL model. There is strong evidence to support the existence of a long run association between foreign direct investment inflows and its determinants. Hence, now we estimate the model further in order to confirm whether there exists long run relationship between the variables under this study.
The regression results indicate that the R squared value is 0.9383, and an adjusted R2 is 0.8822. This means that 93.83 percent of total variations in FDI inflows to Romania are explained by changes in GDP growth, Trade Openness, Exchange Rate, and Inflation. The F-statistic with a p value is 16.74 of 0.000 at 1 percent significance level, which reveals that all the independent variables were jointly significant in predicting foreign direct investment inflows to Romania.
According to the results of the long-run, TOP and EDU are the only statistically significant independent variables in the model. LGDP, EXR, and INF variables are statistically insignificant, implying that the variables do not affect the dependent variable, foreign direct investment inflow (FDI) in the long-run in Romania. It indicates that gross domestic product, real effective exchange rate, and inflation cannot significantly explain the variation in FDI inflow throughout the years.
TOP with coefficient of 10.3859 has negative and statistically significant impact on FDI inflow in long-run (
Table 4). This result is in line with these empirical studies (
Adow and Tahmad 2018;
Cantah et al. 2018;
Khan and Hye 2014). Trade openness affects the FDI inflow negatively as opposite to the theory, which suggests that the higher the level of openness, the less likely it is to attract FDI in the long-run. Reasons for founding an unexpected sign between openness and FDI inflow might be that the openness of the economy of Romania might be inefficient in attracting FDI compared to competing countries. Data on labor force with advanced education (percentage of total working-age population with advanced education) is a proxy for human capital. It has a positive and statistically significant impact on FDI inflow in the long-run. It suggests that laborers that are more educated can make learning and the adoption of new technology easy and faster, and can attract more FDI.
In line with the objective of study, trade openness negatively affects FDI inflow in the short-run. The coefficient for openness is statistically significant at the level of 1% in lag 1. This suggests that openness is an important variable in explaining FDI inflow in Romania. However, trade openness affects the FDI inflow negatively as opposite to the theory, which suggest that higher the level of openness less likely to attract FDI in the long-run. Reasons for finding an unexpected sign between openness and FDI inflow might be openness of the economy of Romania might be inefficient in attracting FDI compare to competing countries in the world.
LGDP with a coefficient of 1025.851(
Table 5) has a positive and statistically significant impact on FDI inflow in short-run lag (0). This result is in line with certain empirical studies (
Liargovas and Skandalis 2012;
Ho et al. 2013;
Asiamah et al. 2018;
Wijeweera and Mounter 2008). Many empirical studies confirm that market size is one of the main elements of foreign direct investment inflows. In general, a larger market of the host country attracts more quantum of FDI. However, the impact of LGDP on FDI inflow in lag (1) is negative and statistically significant as opposite to the theory. The study found that there is a statistically significant and positive effect of exchange rate (EXR) variable on FDI inflow in lag 1, as expected by the theory and most of the existing empirical studies (
Makoni 2018;
Liargovas and Skandalis 2012). The result indicates that depreciation in the host country exchange rate will increase the FDI inflow. The effect shows a theoretically wrong signal, as inflation affects the FDI positively in the short-run. However, the inflation variable cannot significantly explain the variation in FDI inflow throughout the years. EDU has a positive and statistically significant impact on FDI inflow in the shot-run both in lag (0) and in lag (1).
ETC (−1) appears with a negative sign, and it is significant at the significant level 1%, implying that the whole system can get back to the long-run equilibrium at the speed of 95.26% one period after the exogenous shock.
The result of the Granger causality test (
Table 6) indicated that Romania has an unidirectional relationship between trade openness and FDI. It also showed that the direction of causality ran from FDI to trade openness.


