
Gold against Asian Stock Markets during the COVID-19 Outbreak


1
Air University School of Management, Air University, Islamabad 44000, Pakistan
2
Adnan Kassar School of Business, Lebanese American University, Beirut P.O. Box 13-5053, Lebanon
3
USEK Business School, Holy Spirit University of Kaslik, Jounieh P.O. Box 446, Lebanon
*
Author to whom correspondence should be addressed.
J. Risk Financial Manag. 2021, 14(4), 186; https://0-doi-org.brum.beds.ac.uk/10.3390/jrfm14040186
Submission received: 17 February 2021
/
Revised: 3 March 2021
/
Accepted: 5 March 2021
/
Published: 20 April 2021
(This article belongs to the Special Issue The Impact of COVID-19 on Economy, Energy, and Environment)
Abstract
:This study examines the safe-haven and hedging roles of gold against thirteen Asian stock markets during the COVID-19 outbreak. During the COVID-19 sub-period, gold is shown to be a strong hedge (diversifier) for the majority (minority) of Asian stock markets; it exhibits the property of a strong safe-haven in China, Indonesia, Singapore, and Vietnam, and a weak safe-haven in Pakistan and Thailand. The optimal weights of all stock-gold portfolios are lower during the COVID-19 sub-period than the pre COVID-19 sub-period, suggesting that portfolio investors should increase their investment in gold during the COVID-19 sub-period. The hedging effectiveness for most Asian stock markets is higher during the COVID-19 sub-period. Further analyses show that the hedge portfolio returns in many cases are mostly driven by gold implied volatility and inflation expectations in both sub-periods. Our findings have useful implications for market participants holding investments in Asian stocks during stressful periods.
JEL Classification:
G11; G151. Introduction
Gold, as an investment asset, attracts considerable attention in the financial community due to its ability for hedge inflation and to produce an appealing risk adjusted return (Gorton and Rouwenhorst 2006). Gold prices are more stable than equities and their returns are generally right-tailed (Ali et al. 2020). Notably, gold is appreciated by investors and portfolio managers because it is (positively) weakly or negatively correlated with stock market indices, which makes it able to offset stock market losses especially during stressful periods. The academic literature is rich in studies dealing with the hedge and safe-haven roles of gold for stock market indices (Baur and McDermott 2010; Gürgün and Ünalmış 2014; Beckmann et al. 2015; Arouri et al. 2015; Chkili 2016; Klein 2017; Klein et al. 2018; Bekiros et al. 2017; Chen and Wang 2019; Ali et al. 2020; Shahzad et al. 2020; Ming et al. 2020). It extensively considers the role of gold during various financial crises and adverse market conditions, and mostly applies methods based on conditional correlations and portfolio analyses (e.g., Basher and Sadorsky 2016). This is particularly the case around crisis episodes such as the Asian crisis of 1997, the global financial crisis (GFC) of 2007–2008, and the European sovereign debt crisis (ESDC) of 2010–2013, during which stock market indices declined and stock market volatility (risk) spiked.
With the abrupt emergence of the COVID-19 outbreak in early 2020, the global economy froze, unemployment rates climbed, and financial markets tumbled (Yousaf and Ali 2020a, 2020b, 2021; Shahzad et al. 2021). Such issues first affected China and other Asian stock markets and then the rest of the stock markets around the globe. For example, during the first quarter of 2020, the stock market index in China and Japan tumbled by around 15% and 25%, respectively, whereas international gold prices moved in the opposite direction, increasing by almost 6%. As the coronavirus fear spread, stock investors panicked and started to divest some of their stock investments. They looked for shelters in the gold market given its longstanding ability to gain value during times of market stress (Baur and McDermott 2010; Beckmann et al. 2015; Shahzad et al. 2020). In fact, during stress periods, stock prices decline as risk-averse investors switch from risky investments such as stock to less risky investments such as gold, which increases the demand for gold and leads to price appreciation. However, the role of gold as a hedge and safe-haven for Asian stock market indices during the catastrophic event of the COVID-19 outbreak remains largely understudied, which makes investors largely uninformed about whether gold can equally offset the downside risk in the Asian stock markets during an event that seems to be different from other economic and financial crises. Furthermore, previous studies indicate that the role of gold in stock markets is market specific and differs between emerging and developed economies (e.g., Beckmann et al. 2015; Yousaf et al. 2020; Ali et al. 2020), which suggests the need to consider a large set of Asian stock markets containing emerging and developed economies.
In this paper, we examine the role of gold as a safe-haven, hedge, and/or diversifier for thirteen Asian stock markets (China, Japan, India, Indonesia, Hong Kong, Pakistan, Taiwan, South Korea, Singapore, Philippines, Thailand, Vietnam, and Malaysia) during the extreme negative market conditions of the COVID-19 sub-period. The sample period is 5 January 2015 to 5 May 2020. We firstly calculate the time varying conditional correlations between gold and each of the stock market indices under study and use them in a quantile-regression to detect gold’s valuable properties against negative movements in stock markets. Then, we compute the optimal weights, optimal hedge ratios, and hedging effectiveness of stock-gold portfolios during the pre COVID-19 sub-period and the COVID-19 sub-period. Finally, we determine the drivers of the returns of the hedged portfolio (Saeed et al. 2020).
We contribute to the related literature on several fronts. Firstly, we examine the role of gold as a hedge and safe haven asset against Asian stock markets during the unprecedented COVID-19 outbreak, adding to previous evidence on the ability of gold to shine during stress periods related to global health crises. Secondly, we did not limit our analysis on hedging effectiveness to a static one (Basher and Sadorsky 2016; Yousaf and Hassan 2019) but conduct a time-varying analysis (Saeed et al. 2020), which allows us to uncover how the hedging effectiveness of gold is shaped by the COVID-19 outbreak. Thirdly, unlike previous studies, we determine the determinants of the hedge portfolio returns before and after the COVID-19 outbreak, by considering several economic and financial variables. This adds to previous studies (e.g., Dutta et al. 2020b) by revealing the importance of gold implied volatility and inflation expectations for the hedge portfolio returns in the stock-gold nexus that involve Asian stock markets.
Our main results are noteworthy. For the COVID-19 sub-period, we find that gold plays a role as a strong hedge (diversifier) for the majority (minority) of the Asian stock markets. Moreover, gold exhibits the property of a strong safe-haven for the equity markets of China, Indonesia, Singapore, and Vietnam, whereas gold acts as a weak safe-haven for the stock markets of Pakistan and Thailand during the COVID-19 sub-period. The results based on the optimal weights of stock-gold portfolios indicate that portfolio investors should increase their investment in gold during the COVID-19 sub-period. Further analysis shows that the hedging effectiveness is higher for the majority of the Asian stock markets during the COVID-19 sub-period than the pre COVID-19 sub-period, suggesting that gold provides a higher hedging effectiveness for Asian stocks during the COVID-19 sub-period. Results from regressions analyses highlight the roles of gold implied volatility and inflation expectations in determining the hedge portfolio returns in many cases during both sub-periods.
Our main findings provide useful and practical insights for investors and portfolio managers holding Asian stocks in regard to optimal asset allocation and risk management during the unprecedented COVID-19 outbreak.
Section 2 reviews the related literature on gold, stock markets, and the COVID-19 outbreak. Section 3 provides the empirical methodology, which involves time-varying conditional correlations, regressions with quantile and non-quantile dummies, and portfolio analyses covering optimal weights, hedge ratios, and hedging effectiveness in a time-varying setting. Section 4 describes the data and provides preliminary analysis. Section 5 reports the main findings. Section 6 concludes.
2. Literature Review
2.1. Gold and Stock Markets
There is a considerable amount of literature on the role of gold as a safe-haven, diversifier, and hedge against Asian stocks during extreme negative market movements and financial crises. Baur and McDermott (2010) investigate the safe-haven and hedging properties of gold for the equity markets of developed and developing economies (including China and India) during the GFC. The findings reveal that gold exhibits a safe-haven property against the Indian equity market, but not the stock market of China during global financial crises. Gürgün and Ünalmış (2014) investigate the hedge and safe-haven property of gold for developed and developing stock markets and find that gold is a weak hedge for the stock markets of Thailand, Peru, Morocco, Jordan, Colombia, Israel, and Jordan. Moreover, gold exhibits a safe-haven quality for foreign investors in Vietnam, Egypt, Jordan, Romania, Jordan, and Thailand during extreme market falls. Arouri et al. (2015) examine the association of international gold prices and Chinese equity markets during the global financial crisis. They find that risk-adjusted returns can be increased by adding gold to the Chinese stock portfolio. Beckmann et al. (2015) explore whether gold is a safe-haven or hedge against 18 equity markets. They report gold to be a strong hedge for Indonesia, Russia, and Turkey, but not a hedge for Germany, China, or the World index. Gold exhibits a safe-haven property for India and the UK. Their overall results indicate that the hedging and safe-haven roles of gold for stock markets are not the same in emerging and developed economies. Raza et al. (2016) estimate the effect of gold prices on stock prices and find a positively significant effect of gold prices on BRICS stock prices. Moreover, gold prices negatively and significantly affect the stock prices of Mexico, Chile, Indonesia, Malaysia, and Thailand. Chkili (2016) finds that gold exhibits a significant safe-haven property for BRICS stock markets in the subprime crisis. Nguyen et al. (2016) look at the safe-haven and hedge characteristics of gold against the stock markets of the UK, the US, Indonesia, Malaysia, Japan, Singapore, Philippines, and Thailand. They report that gold displays a safe-haven property during market crashes for the equity markets of the US, UK, Thailand, Malaysia, and Singapore but not the Japanese, Philippine, or Indonesian markets. Similar to Chkili (2016), Bekiros et al. (2017) focus on BRICS equity markets and find that gold is a diversifier in both bear and normal markets for BRICS stock market indices. Gold did not act as a safe-haven or hedge during the GFC. Low et al. (2016) indicate that gold is a safe haven for the Chinese stock market during the global financial crisis of 2007–2009 GFC and 2011 US credit downgrade. Wen and Cheng (2018) show empirically that gold serves as a safe-haven for emerging markets, including China, Malaysia, India, and Thailand. Aftab et al. (2019) investigate the safe-haven and hedge properties of gold for Asian equities and report that gold is a diversifier for Asian equity markets, except in South Korea, Thailand, and Singapore. In a related strand of literature, Aruga and Kannan (2020) use cointegration methods and conclude that gold becomes more linked with crude oil after the GFC.
Ming et al. (2020) find that gold acted as a safe-haven for the Chinese equity market during extreme negative market movements and two financial crises (the GFC of 2007–2008 and equity market crash of 2015). Shahzad et al. (2020) find that gold exhibits safe-haven and hedge properties for the G7 stock indices (including that of Japan). It is clear from the above discussion that the properties of gold as a safe-haven and hedge for the Asian emerging countries is still controversial, due to the mixed findings. Therefore, it is necessary to explore the hedge and safe-haven properties of gold against Asian stock markets.
2.2. Gold and Financial Markets during the COVID-19 Outbreak
The COVID-19 outbreak has adversely affected firms’ solvency (Mirza et al. 2020), US stock markets (Shahzad et al. 2021), and other financial markets (Bouri et al. 2020). This can be true to the Asian stock markets that are globally and regionally integrated (e.g., Mohti et al. (2019) and are closely linked with China due to the higher bilateral trade volume and foreign direct investment of China in Asian markets. Furthermore, Aslam et al. (2020) find evidence of a long-range dependence in emerging Asian stock markets. The outbreak of COVID-19 has adversely affected the Chinese stock market, and therefore almost all other Asian stock markets. The intensity of the COVID-19 crisis is highlighted by the following statistics. The average daily returns from 1 January 2020 to 5 April 2020 are negative for all Asian markets (see Table A2). The MSCI Asia Apex 50 Index declined by more than 26% from 13 January 2020 to 19 March 2020 (Source: https://www.bloomberg.com/quote/MXAPEXA:IND, accessed on 9 May 2020). The China Manufacturing Purchasing Manager’s Index (PMI) declined by 33% in February 2020 (Source: https://news.un.org/en/story/2020/03/1058601, accessed on 9 May 2020). The COVID-19 outbreak has adversely affected the non-Asian stock, commodity, and energy markets around the globe (Baker et al. 2020).
The stock market capitalization of Asian economies is almost 30% of the world’s total stock market capitalization, as of 2018 (Source: https://data.worldbank.org/indicator/CM.MKT.LCAP.CD?locations=Z4-8S, accessed on 9 May 2020). The Chinese equity market is the world’s second biggest, after the USA, in terms of market capitalization ($6.324 trillion) (Source: World Federation of Exchanges database, accessed on 9 May 2020), as of 2018. The world’s biggest gold users are China, India, and the USA, in that order (Source: https://www.gold.org/about-gold/gold-demand/geographical-diversity, accessed on 9 May 2020), so the top two are Asian. Moreover, China accounts for 44% of global demand and 36% of global production of major minerals and metals (Source: https://www.chinadailyhk.com/articles/179/38/164/1529391299212.html, accessed on 9 May 2020). Overall, these Asian economies have a significant global share of metal and stock markets. Notably, Asia contains both emerging and developed economies that attract substantial international investment due to their growth potential. This is an important element, with previous studies (e.g., Beckmann et al. 2015) arguing that the hedging of gold for stock markets differs in emerging and developed economies. According to the Morgan Stanley MSCI ACWI & Frontier Markets Index 2019 (https://www.msci.com/market-classification, accessed on 12 May 2020), Japan and Singapore are developed markets, while the other eleven markets under study are emerging.
Fewer studies examine the role of gold and other assets, such as cryptocurrencies, as hedges or safe-havens for various asset classes during the COVID-19 outbreak. Dutta et al. (2020a) use conditional correlations models and consider a sample period that includes the COVID-19 outbreak. The authors find that gold is a safe haven asset for the downside risk of crude oil markets. Notably, the literature does not provide any evidence for the properties of gold as a hedge or safe-haven against any Asian stock markets during the COVID-19 outbreak. Importantly, it overlooks the drivers of the hedge portfolio returns (Saeed et al. 2020). We address these literature gaps.
3. Methods
Despite the existence of various techniques to model the dynamic relationship between asset returns (These include multivariate generalized autoregressive conditional heteroskedasticity (GARCH) models and copula functions. Related techniques can include the spillovers effect based on the variance decomposition methods, which can be used to uncover the drivers of connectedness among volatility (Bouri et al. 2021)), we use a combination of techniques that allows us to capture pairwise time-varying correlations and uncover the safe-haven, hedge, and diversification properties of gold against Asian stock indices along with the hedging effectiveness and the drivers of that hedge portfolio returns. The methods applied are as follows. First, we compute the time-varying correlations between pairs of gold and the Asian stock markets using the dynamic conditional correlation (DCC)-GARCH model of Engle (2002). Second, we apply regression analyses by regressing the dynamic conditional correlations on the dummy variables representing the extreme negative quantiles of the stock returns. Accordingly, we uncover the safe-haven, hedge, and diversification properties of gold against Asian stock indices, following Ratner and Chiu (2013) and Bouri et al. (2017). Third, we apply portfolio analyses that consist of calculating optimal weights, hedge ratios, and hedging effectiveness in a time-varying setting.
3.1. Time-Varying Correlations Based on the DCC-GARCH Model
Following Engle (2002), the DCC-GARCH model is used to estimate time-varying correlations. Its conditional mean has the following specifications:
where is a vector of returns on gold and the stock market at time t. represents the conditional-covariance matrix, whereas is a vector of residuals. = diag {} represents the diagonal matrix of conditional standard deviations for the gold and stock return series at time t, estimated using following univariate GARCH model:
where c is a constant and is the conditional variance. a and b are parameters that capture ARCH and GARCH effects, respectively.
= [ denotes the time-varying conditional correlation matrix:
where is the unconditional-correlation matrix of and a symmetric positive definite matrix. The dynamic correlation estimator is then extracted by:
where the correlation matrix of residuals is denoted by . This model fullfils mean-reverting if α + β < 1.
3.2. Diversification, Hedge, and Safe-Haven Properties of Gold Using Regression Analyses
Ratner and Chiu (2013) examined the safe-haven, hedge, and diversification properties of an asset based on DCC-GARCH models and regressions augmented with quantile dummies. Accordingly, we calculate the time-varying correlations ( between the gold and stock markets, then regress on the dummy variables (D) indicating the extreme negative movements in stocks at the 10% (q10), 5%(q5), and 1%(q1) quantiles:
where is the returns on the Asian stocks. Gold is a diversifier for stock if is positively significant (not equal to 1). Gold is a weak hedge against stock if is insignificant, or a strong hedge if is negatively significant. Gold is a weak/strong safe-haven if , , or are negatively insignificant/significant.
The following regression is estimated to examine the safe-haven and hedge properties of gold asset against Asian stocks during the COVID-19 crisis:
where D represents the dummy variable, which is equal to 1 during the crisis and zero otherwise. Gold is a diversifier for stock if is positively significant (not equal to 1). Gold is a weak hedge for stock if is insignificant, or a strong hedge if is negatively significant. Gold is a weak/strong safe-haven if is insignificant/negatively significant.
3.3. Optimal Weights, Hedge Ratios and Hedging Effectiveness
3.3.1. Optimal Weights
The conditional variances and covariances of the DCC-GARCH model are used to estimate the optimal portfolio weights. Then, portfolio weights of an equity-gold portfolio are calculated as:
where “ is the weight of equity in a one-dollar portfolio of equity and gold at time t. is the conditional covariance between equity and gold, whereas and represent the conditional variance of the equities and gold, respectively”. Moreover, 1- is the weight of the metal in a one-dollar portfolio of equity and gold.
3.3.2. Optimal Hedge Ratios
It is essential to estimate the risk-minimizing optimal hedge ratios for the portfolio of gold and equities. The conditional variances and covariances of the DCC-GARCH model can also be used to estimate optimal hedge ratios as:
A long position in equity can be hedged with a short position in gold.
3.3.3. Hedging Effectiveness
Hedging effectiveness is estimated in order to compare the performance of optimal portfolios. A hedging effectiveness of 1 represents the perfect hedge, whereas a hedging effectiveness of 0 indicates no risk reduction. Thus, a higher hedging effectiveness score shows higher risk reduction. Following Pan et al. (2014), Saeed et al. (2020), and Dutta et al. (2020b), this study estimates the hedging effectiveness (HE) as:
where represents the variance of the unhedged portfolio (only stock based) returns, and indicates the variation in the returns for the portfolio of stock-gold, specified as:
where is the weight of equity in a one-dollar portfolio of equity and gold at time t. is the conditional covariance between equity and gold, whereas and represent the conditional variance of the equities and gold, respectively”, and 1- is the weight of the gold in a one-dollar portfolio of equity and gold.
3.3.4. Determinants of the Hedge Portfolio Returns
In line with Saeed et al. (2020), we explore potential determinants of the hedge portfolio returns. Specifically, we estimate the following model:
where () is the hedge portfolio return described in Equation (13) as the difference between the return of the stock index at time t () and the return of gold at time t () multiplied by the time-varying optimal hedge ratio () as previously given in Equation (9):
In Equation (12), is a constant term, is an autoregressive term accounting for possible autocorrelation, ψ is a vector of five explanatory variables, and is the error term. If takes a positive (negative) value, then the hedged portfolio provides gains (losses) for the investor.
The five explanatory variables include: (1) (DVIX) changes in the CBOE US equity market volatility index (VIX), (2) (DGVZ) changes in the CBOE gold implied volatility index, (3) (DEPU) changes in the US Economic Policy Uncertainty (US EPU data are downloaded from https://www.policyuncertainty.com, accessed on 25 July 2020) (EPU), (4) (DInflation) changes in US inflation expectations, and (5) (DGRA) changes in the global risk aversion (GRA) index.
- (1)
- The VIX is the US stock market’s expectation of 30-day volatility. Higher levels of the VIX have larger impacts on the stock index than on gold prices, which leads to a reduction in the hedge portfolio return. Therefore, we expect a negative sign for the DVIX.
- (2)
- The GVZ is the gold market’s expectation of 30-day volatility. Higher levels of the GVZ have larger positive impacts on gold prices than on stock prices, due to the safe haven property of gold. This in turn leads to a reduction in the hedge portfolio return. Therefore, we expect a negative sign for the DGVZ.
- (3)
- Constructed by Baker et al. (2016), the US EPU is widely used in empirical studies that indicate a negative relationship between EPU and stock markets (Brogaard and Detzel 2015). Conversely, a positive relationship exists between EPU and gold prices (Gao and Zhang 2016). Therefore, we expect a negative sign for the DEPU.
- (4)
- We use inflation expectation which is measured by the difference between 10-year Treasuries and 10-year Treasury Inflation-Protected Security (TIPS) yields. Higher levels of inflation can lead to an increase in the interest rates which in turn can reduces stock prices. Conversely, higher inflation rates and thus higher interest rates make gold more appealing to investors which in turn leads to increase in its prices. Therefore, a positive sign is expected for the DInflation.
- (5)
- The GRA index is recently constructed by Bekaert et al. (2019). It is a time-varying daily index that reflects the risk appetite computed from observable financial information at high frequencies. Generally, risk aversion is inversely related with stock prices. However, it is positively related with gold prices given that gold is seen as a hedge and safe have asset (Beckmann et al. 2015; Shahzad et al. 2020). Therefore, a neutral sign is expected for the DGRA.
4. Data and Preliminary Analysis
4.1. Data
This study uses the daily data of stock market indices of thirteen Asian countries, China (Shanghai SE Composite-Index), Japan (NIKKEI 225), India (S&P BSE SENSEX Index), Indonesia (JSE Composite Index), Hong Kong (Hang Seng Index), Pakistan (KSE-100 Index), Taiwan (TSEC weighted index), South Korea (KOSPI Index), Singapore (STI Index), Philippines (PSEi Index), Thailand (SET Index), Vietnam (VN-Index), and Malaysia (FTSE Bursa Malaysia KLCI Index). The data of stock indices are taken from Thomson Reuters DataStream International. The data on VIX, GVZ, 10-year Treasuries, and 10-year Treasury Inflation-Protected Security (TIPS) yields indices are extracted from the Thomson Reuters DataStream International. Data on the EPU index is obtained from the website of https://www.policyuncertainty.com. Whereas data on the GRA index are collected from the website of https://www.nancyxu.net. (Daily data on the GRA index are available at https://www.nancyxu.net/risk-aversion-index, accessed on 25 July 2020) Gold prices are obtained from Bloomberg and represent the London gold spot prices (in US dollars per troy ounce). The full sample period is 5 January 2015 to 5 May 2020. We take two sub-periods, the pre COVID-19 sub-period (5 January 2015 to 31 December 2019) and the COVID-19 sub-period (1 January 2020 to 5 May 2020).
4.2. Preliminary Analysis
Table A1 in the Appendix A presents the summary statistics of the daily returns of Asian stock indices and gold prices during the pre COVID-19 sub-period and the COVID-19 sub-period. The average returns are positive in all Asian stock markets (except Malaysia) during the pre COVID-19 sub-period. However, they all become negative during the COVID-19 period. In contrast, the average returns of gold are positive during both the pre COVID-19 sub-period and the COVID-19 sub-period. The standard deviation of gold and stock market returns are higher during the COVID-19 sub-period then the pre COVID-19 sub-period.
Table A2 in the Appendix A provides summary statistics of stock and gold markets during the full sample period. Equity returns are skewed to the left, whereas gold returns are skewed to the right. The returns of all stock indices and gold prices have a kurtosis value higher than 3, and the Jarque-Bera statistics reject the normality hypothesis. Autocorrelation and ARCH effects are present in the returns of both gold and stock markets. The results of the ADF and PP tests show that all return series are stationary.
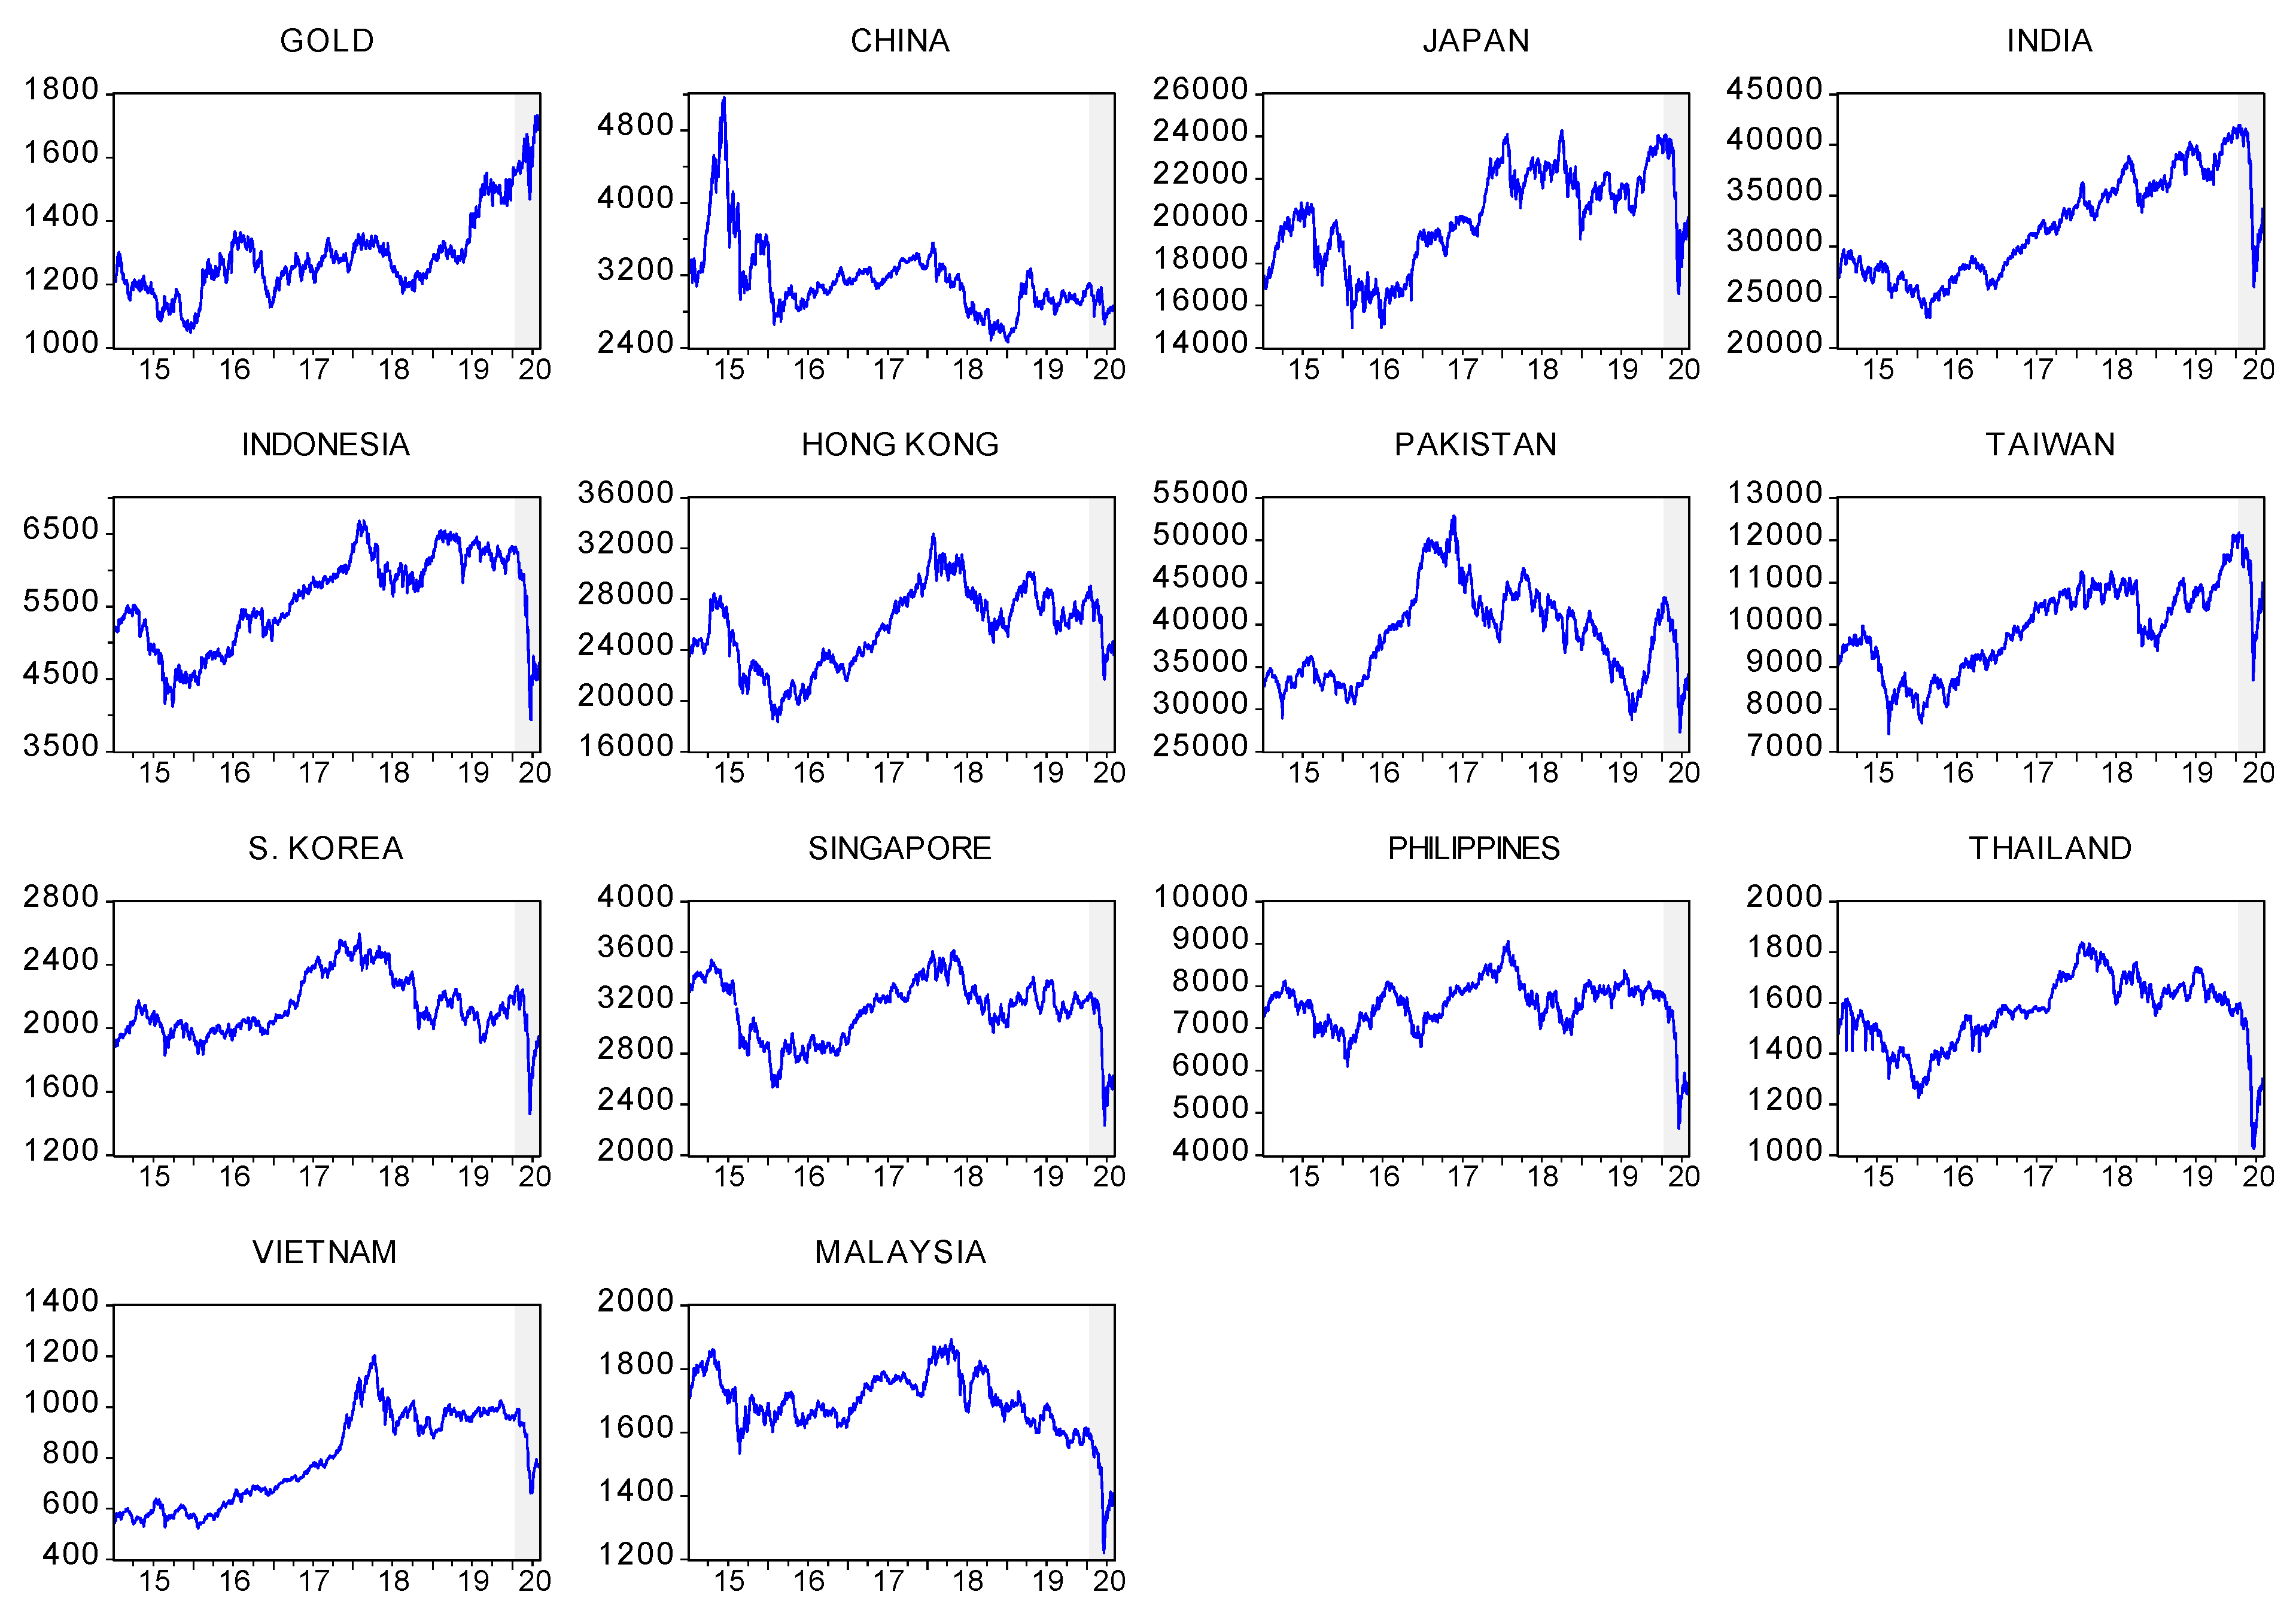
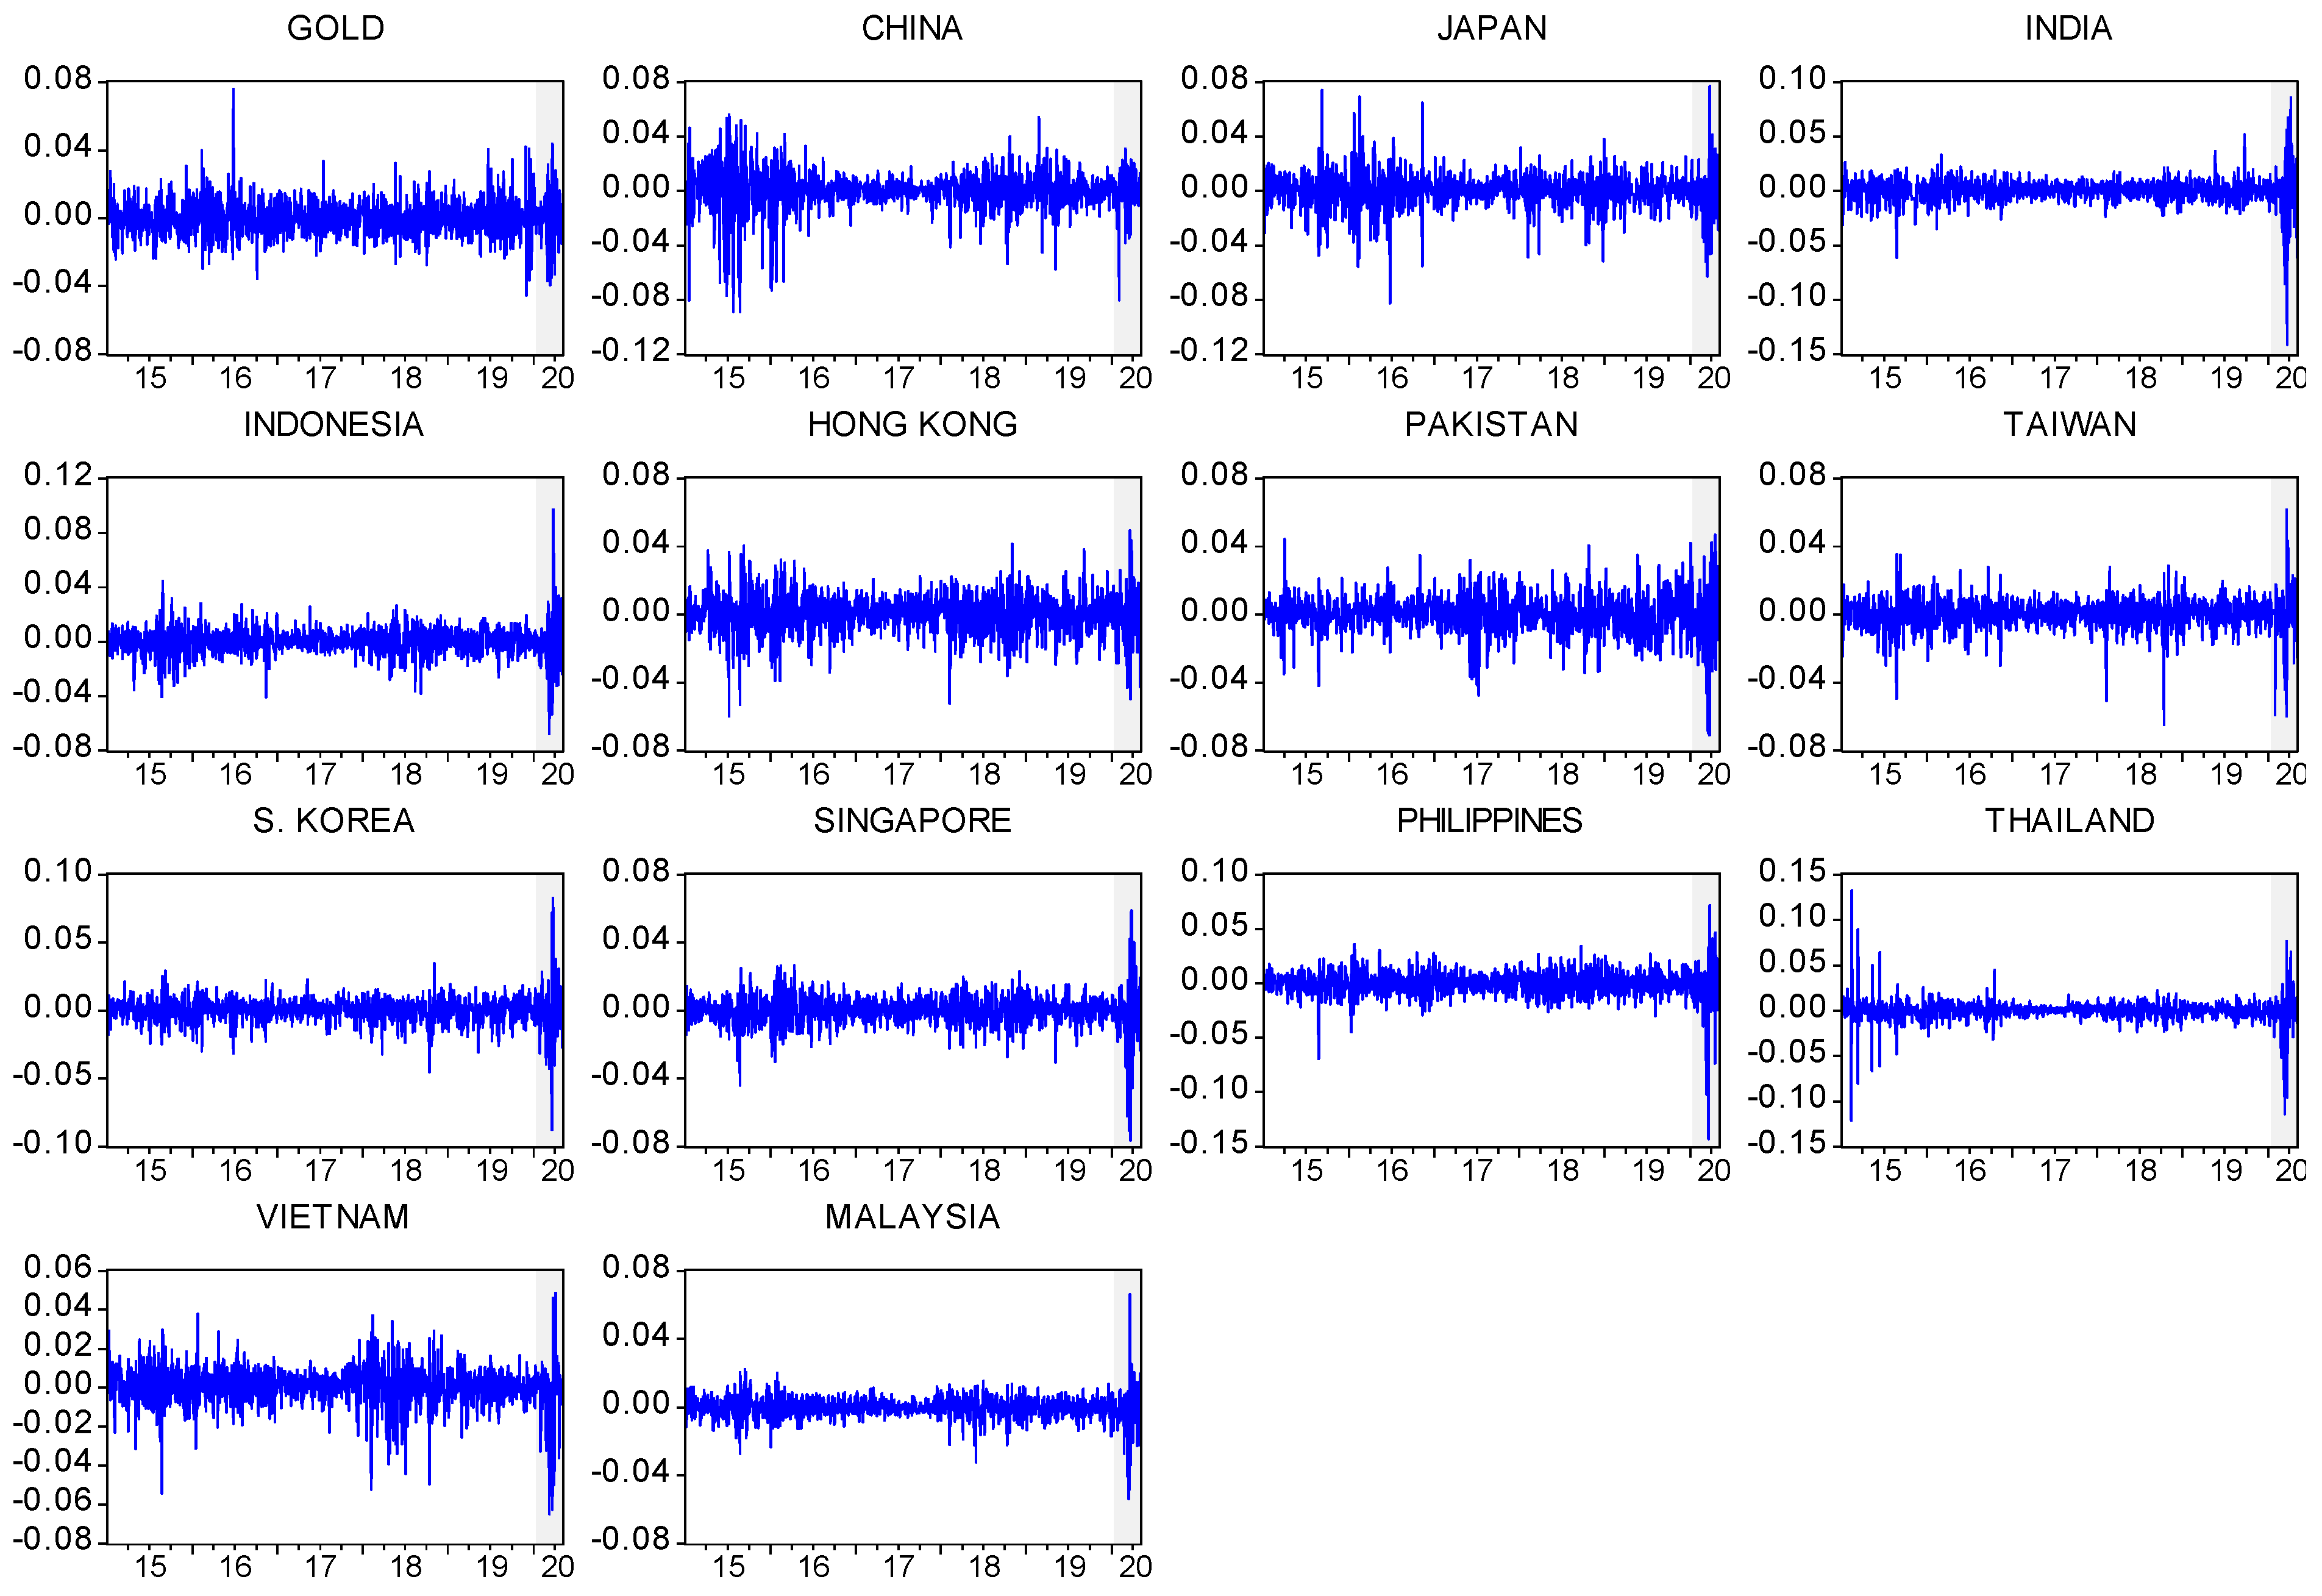
Daily prices of gold and Asian stock market indices are given in Figure A1. The prices of gold, on average, show an increasing trend during the full sample period, including the COVID-19 sub-period. Conversely, a large decline in the stock indices of Asian markets is observed during the COVID-19 outbreak sub-period. Daily returns of gold and Asian stock market indices are shown in Figure A2, and volatility clustering seems to appear in the returns of gold and stock markets in different years, especially during the COVID-19 sub-period.
5. Empirical Findings
5.1. Dynamic Conditional Correlations
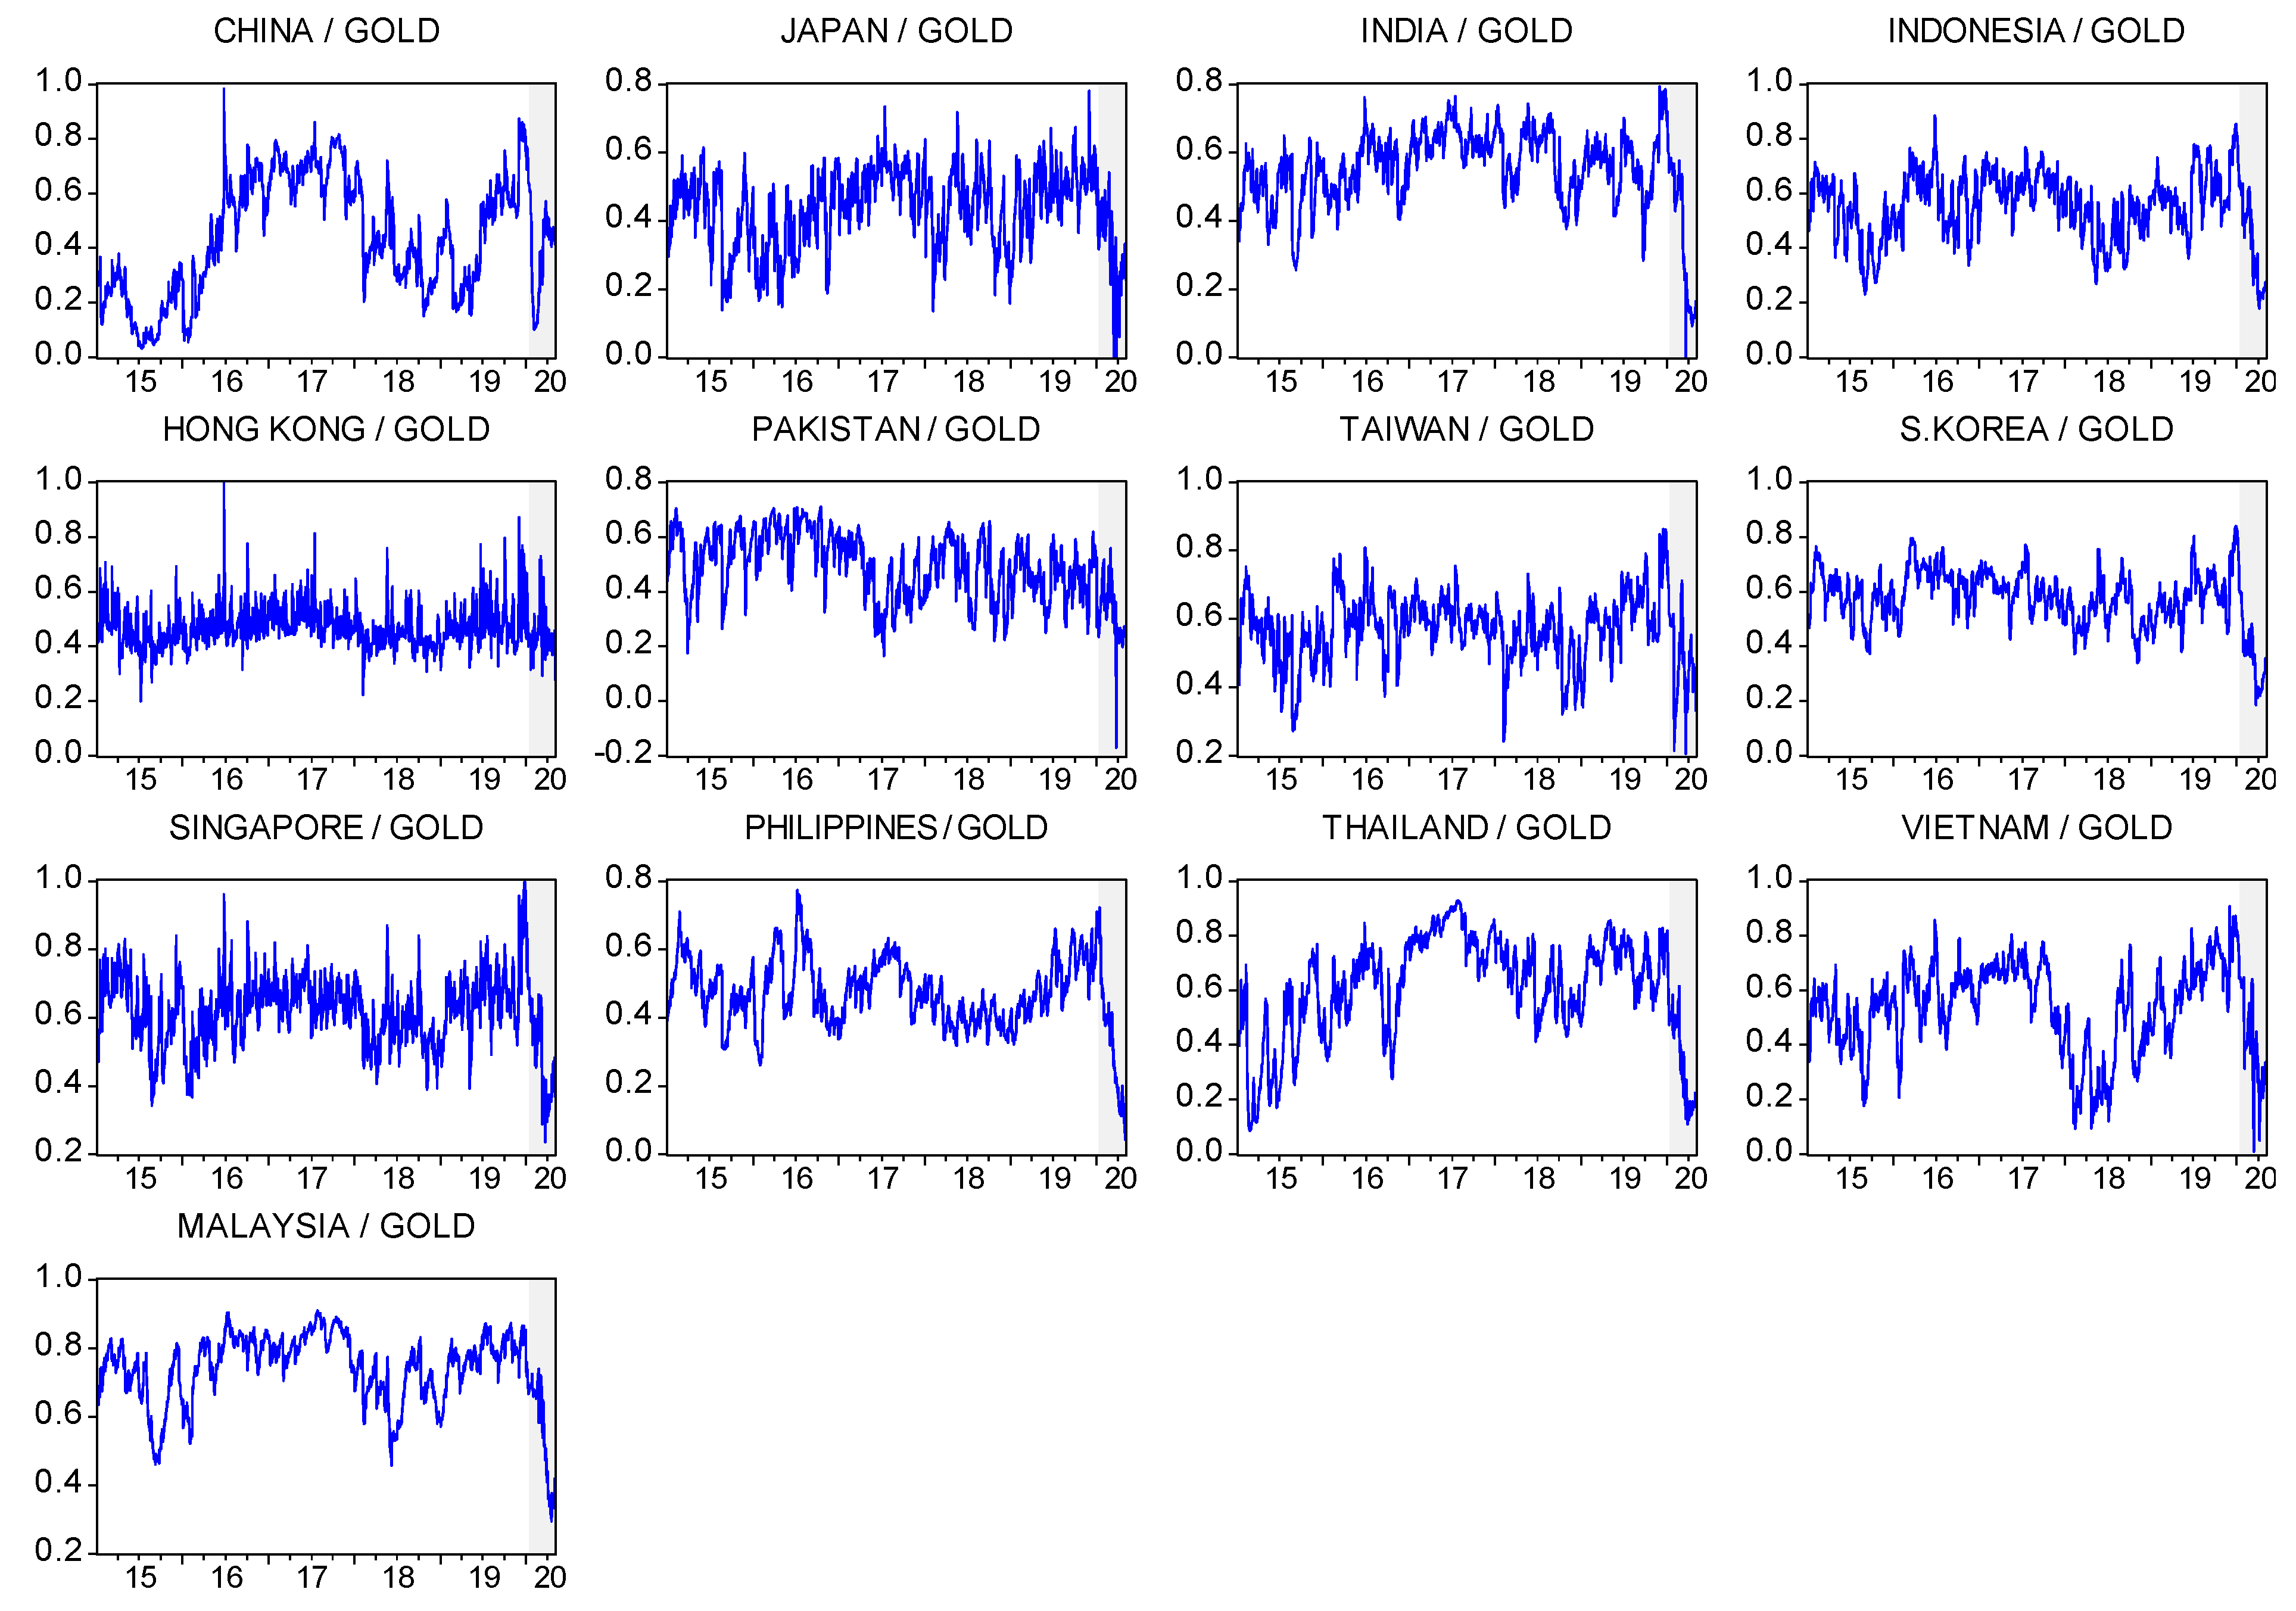
The average dynamic conditional correlations between gold and each of the stock market indices (Table 1) are negative for China, Japan, India, Pakistan, Taiwan, South Korea, and Singapore during the pre COVID-19 sub-period, suggesting that investors can reduce their risk by adding gold to the equity portfolio of the majority of Asian equities during non-crisis periods. During the COVID-19 sub-period, the correlations are negative between gold and the stock markets of China, Japan, India, Indonesia, Hong Kong, Pakistan, Singapore, and Malaysia, suggesting the ability of gold to reduce the risk of Asian equity portfolios during the COVID-19 outbreak. Figure 1 presents the time-variation in the dynamic conditional correlations between gold and each of the stock market indices. Our main results are not very sensitive to the choice of dynamic conditional correlation model, i.e., the asymmetric DCC-GARCH model (Cappiello et al. 2006).
5.2. Results of Diversification, Hedge, and Safe-Haven Analysis
5.2.1. Full Sample Period
We run regression (6) to find out whether gold is a diversifier, hedge, or a safe-haven for Asian stock market indices during extreme negative market movements of the full sample period. Table 2 presents the estimated results, considering extreme stock market movements (quantile columns (10%, 5%, or 1%)) in the Asian equity markets. We first concentrate on the coefficient , through which we detect the hedge and diversification properties of gold during the full sample period. The coefficient is negatively significant for China, Japan, India, Hong Kong, Pakistan, Taiwan, South Korea, and Singapore, suggesting that gold provides a strong hedging property against these Asian equity markets. In contrast, the coefficient is positively significant for the equity markets of Indonesia, Philippines, Thailand, Vietnam, and Malaysia, implying that gold is only a diversifier against these five Asian equity markets.
Second, we discuss the safe-haven properties of gold during the full sample period, which is reflected by the coefficients , , and . If any of these coefficients are negatively significant (insignificant), then the strong (weak) safe-haven property of gold is confirmed. The estimated results show that gold is a strong safe-haven against the equity markets of Indonesia, Singapore, and Thailand. Moreover, gold is a weak safe-haven for the equity markets of China, Japan, India, Hong Kong, Pakistan, Taiwan, South Korea, Thailand, and Vietnam. These results are comparable to previous findings. Arouri et al. (2015) find that gold acted as a safe-haven for Chinese stocks during the global financial crisis. Low et al. (2016) indicate that gold is a safe haven for the Chinese stock market during the global financial crisis of 2007–2009 GFC and 2011 US credit downgrade, whereas Shahzad et al. (2020) show that gold can act as a safe-haven for the Japanese stock market.
5.2.2. The COVID-19 Period
In this section, we first run the regression (7) to find out whether gold is a safe-haven, hedge, and diversifier for the Asian equity markets during the COVID-19 sub-period. The estimated results are presented in Table 3. For the hedge and diversification characteristics of gold, the estimated results reveal that the coefficient is negatively significant for the equity markets of China, Japan, India, Hong Kong, Pakistan, Taiwan, South Korea, and Singapore, suggesting that gold is a strong hedge for the majority of Asian equity markets during the COVID-19 sub-period. In contrast, the coefficient is positively significant for the equity markets of Indonesia, Philippines, Thailand, Vietnam, and Malaysia, implying that gold is only a diversifier against these five Asian equity markets. Accordingly, the overall results indicate that the hedge and diversification roles of gold against Asian equities do not vary between the full sample period and the COVID-19 sub-period.
Second, we focus on the weak/strong safe-haven characteristics of gold during the COVID-19 sub-period. The results show that is negative and significant for China, Indonesia, Singapore, and Vietnam, indicating that gold is a strong safe-haven against price movements in these four Asian stock market indices during the COVID-19 outbreak. This finding implies that investors holding gold during the COVID-19 sub-period receive compensation for losses in the stock markets of China, Indonesia, Singapore, and Vietnam through positive returns in the gold market. Arouri et al. (2015) also find that gold acted as a safe-haven in China during the GFC. Our result indicates that gold serves as a strong safe-haven against Chinese stocks during the COVID-19 outbreak. Against Pakistani and Thai stocks, gold serves as a weak safe-haven, as shown by its insignificant and negative coefficients of . These results suggest that the portfolio performance can be improved by adding gold to equity portfolios in Pakistan, and Thailand during the COVID-19 sub-period.
5.3. Results of Optimal Weights, Hedge Ratios, and Hedging Effectiveness
5.3.1. Results of Optimal Weights
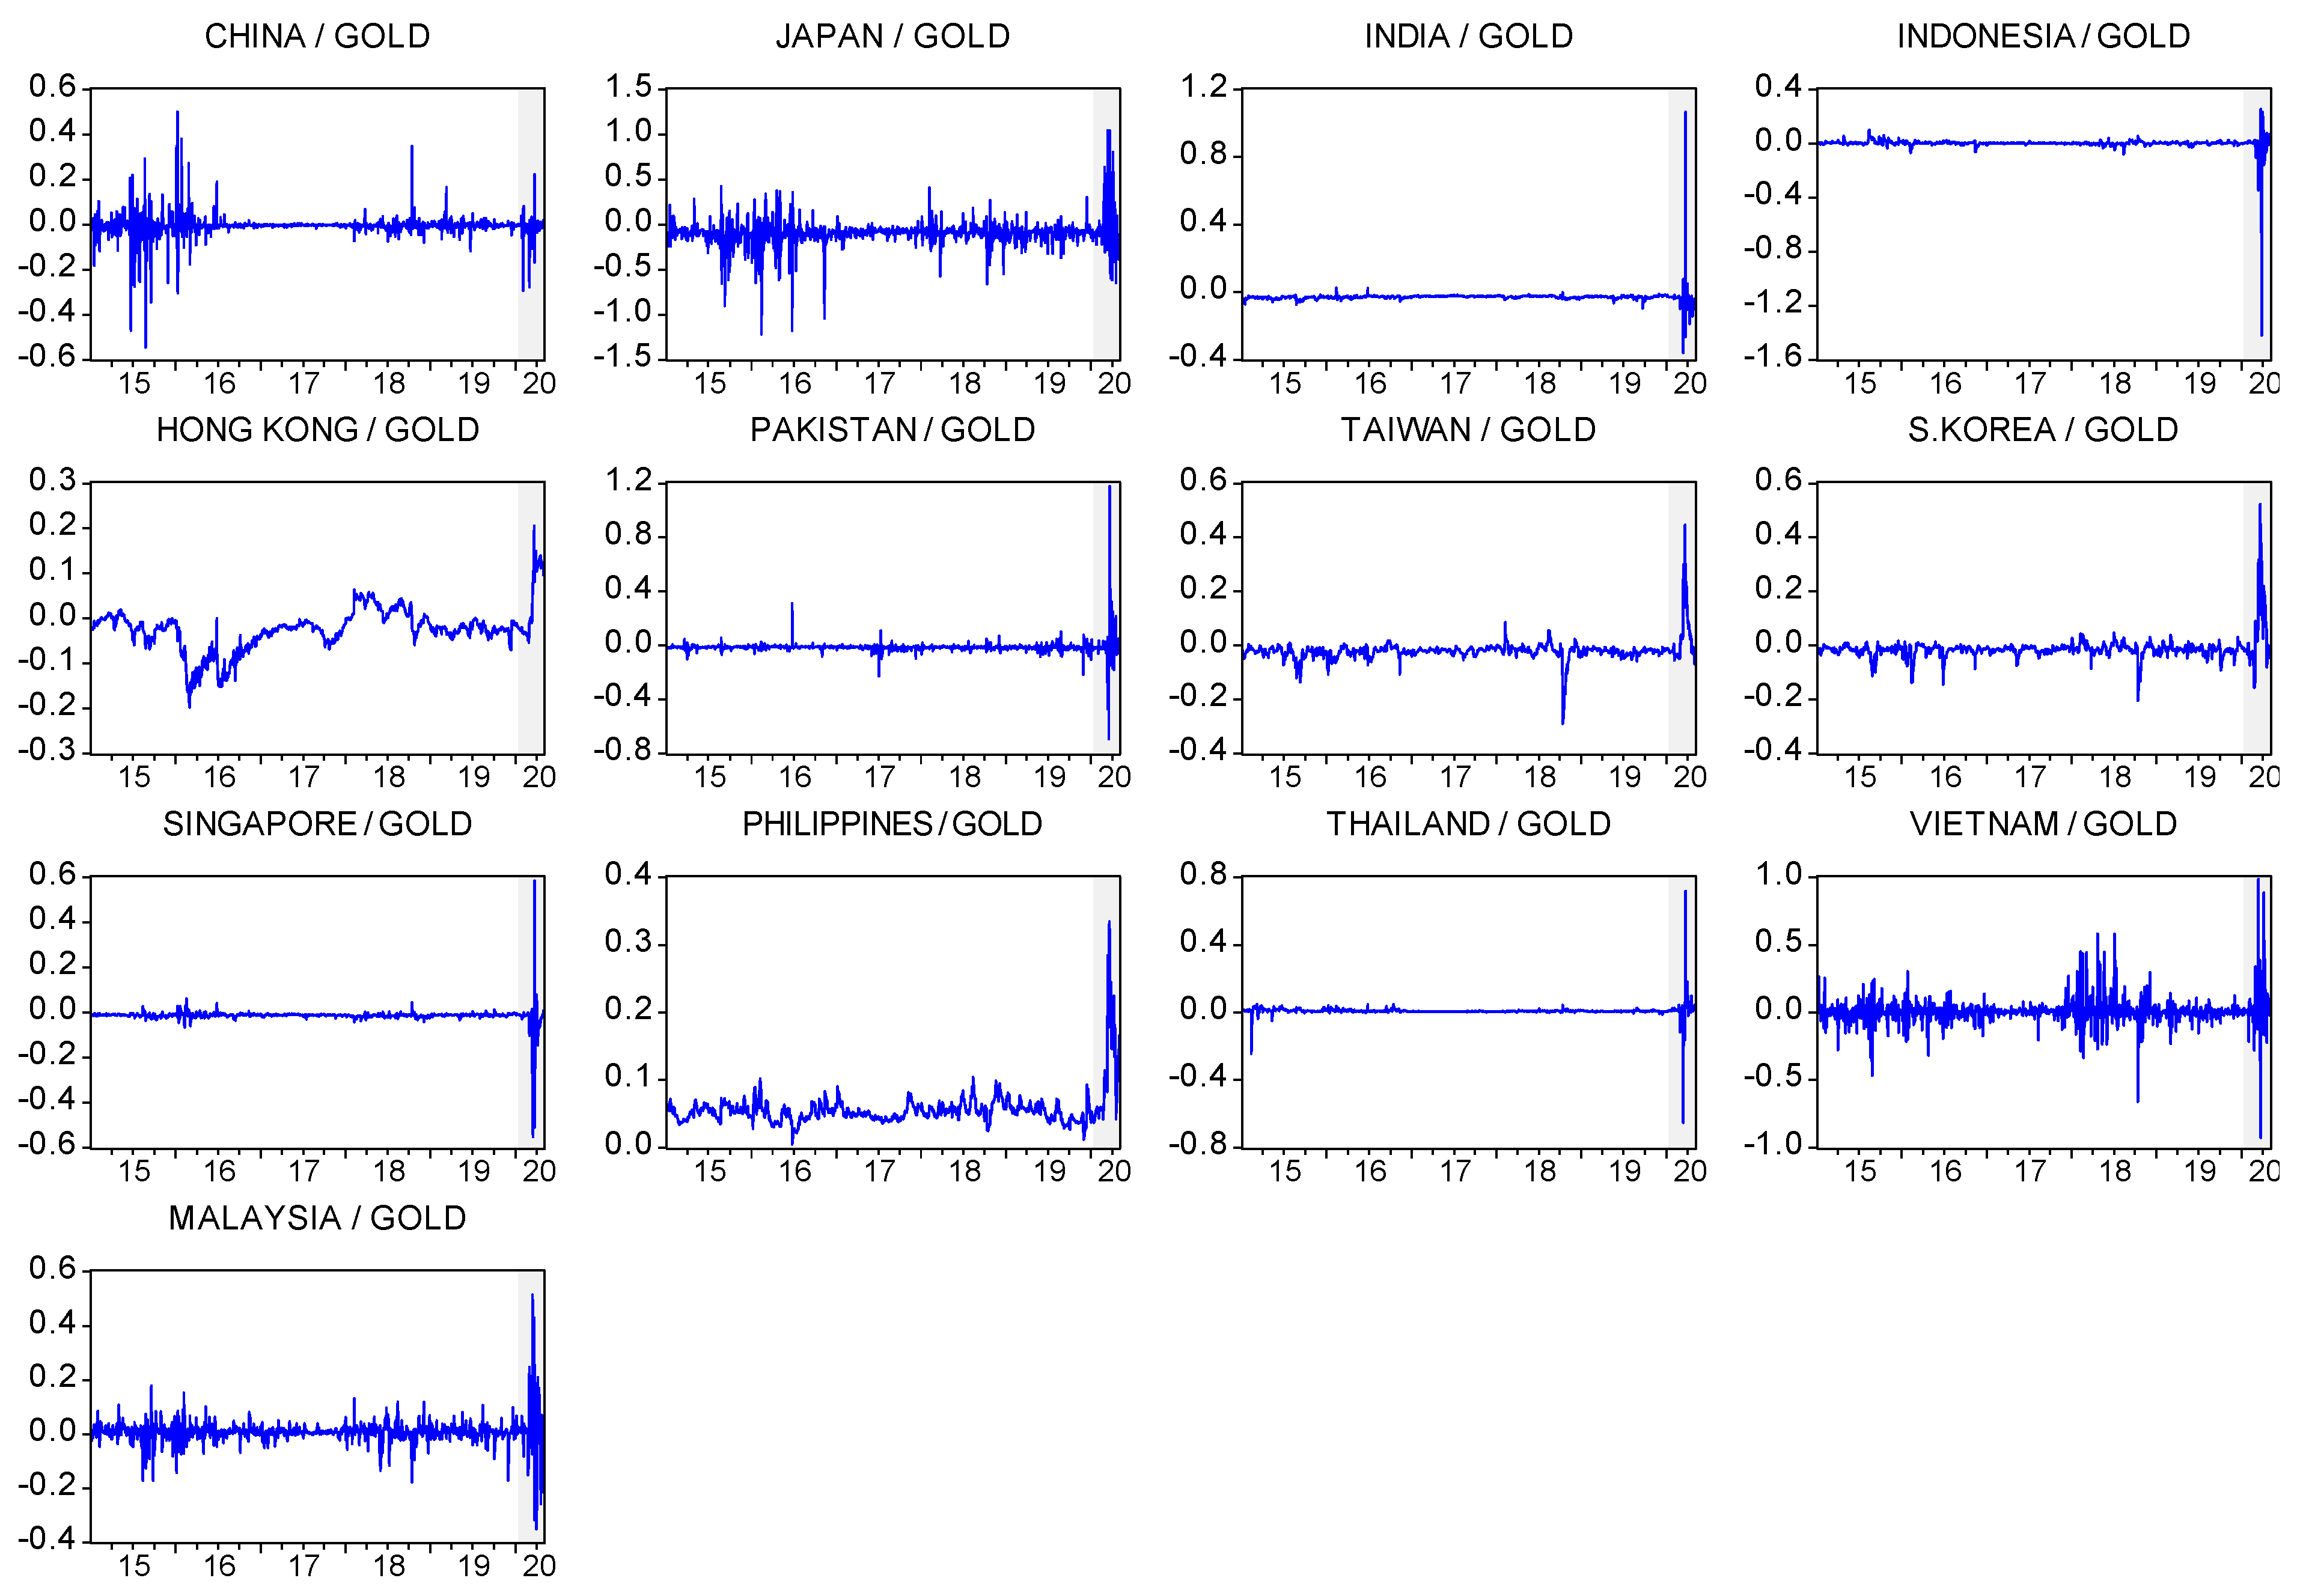
Table 4 presents the average optimal weights, and Figure 2 gives the time varying optimal weights during the pre COVID-19 sub-period and the COVID-19 sub-period. Table 4 shows that the optimal weights in gold amount to at least 40% and 55% for the majority of Asian stock markets during the pre COVID-19 and COVID-19 sub-periods, respectively. Specifically, the optimal weights of all stock-gold portfolios are higher during the pre COVID-19 sub-period than the COVID-19 sub-period, suggesting that portfolio investors should increase their investment in gold during the COVID-19 sub-period to reduce the downside risk of equity investments. The increase in gold investment can be explained by its valuable property as a safe-haven during crisis periods (Ming et al. 2020).
5.3.2. Results of Optimal Hedge Ratios
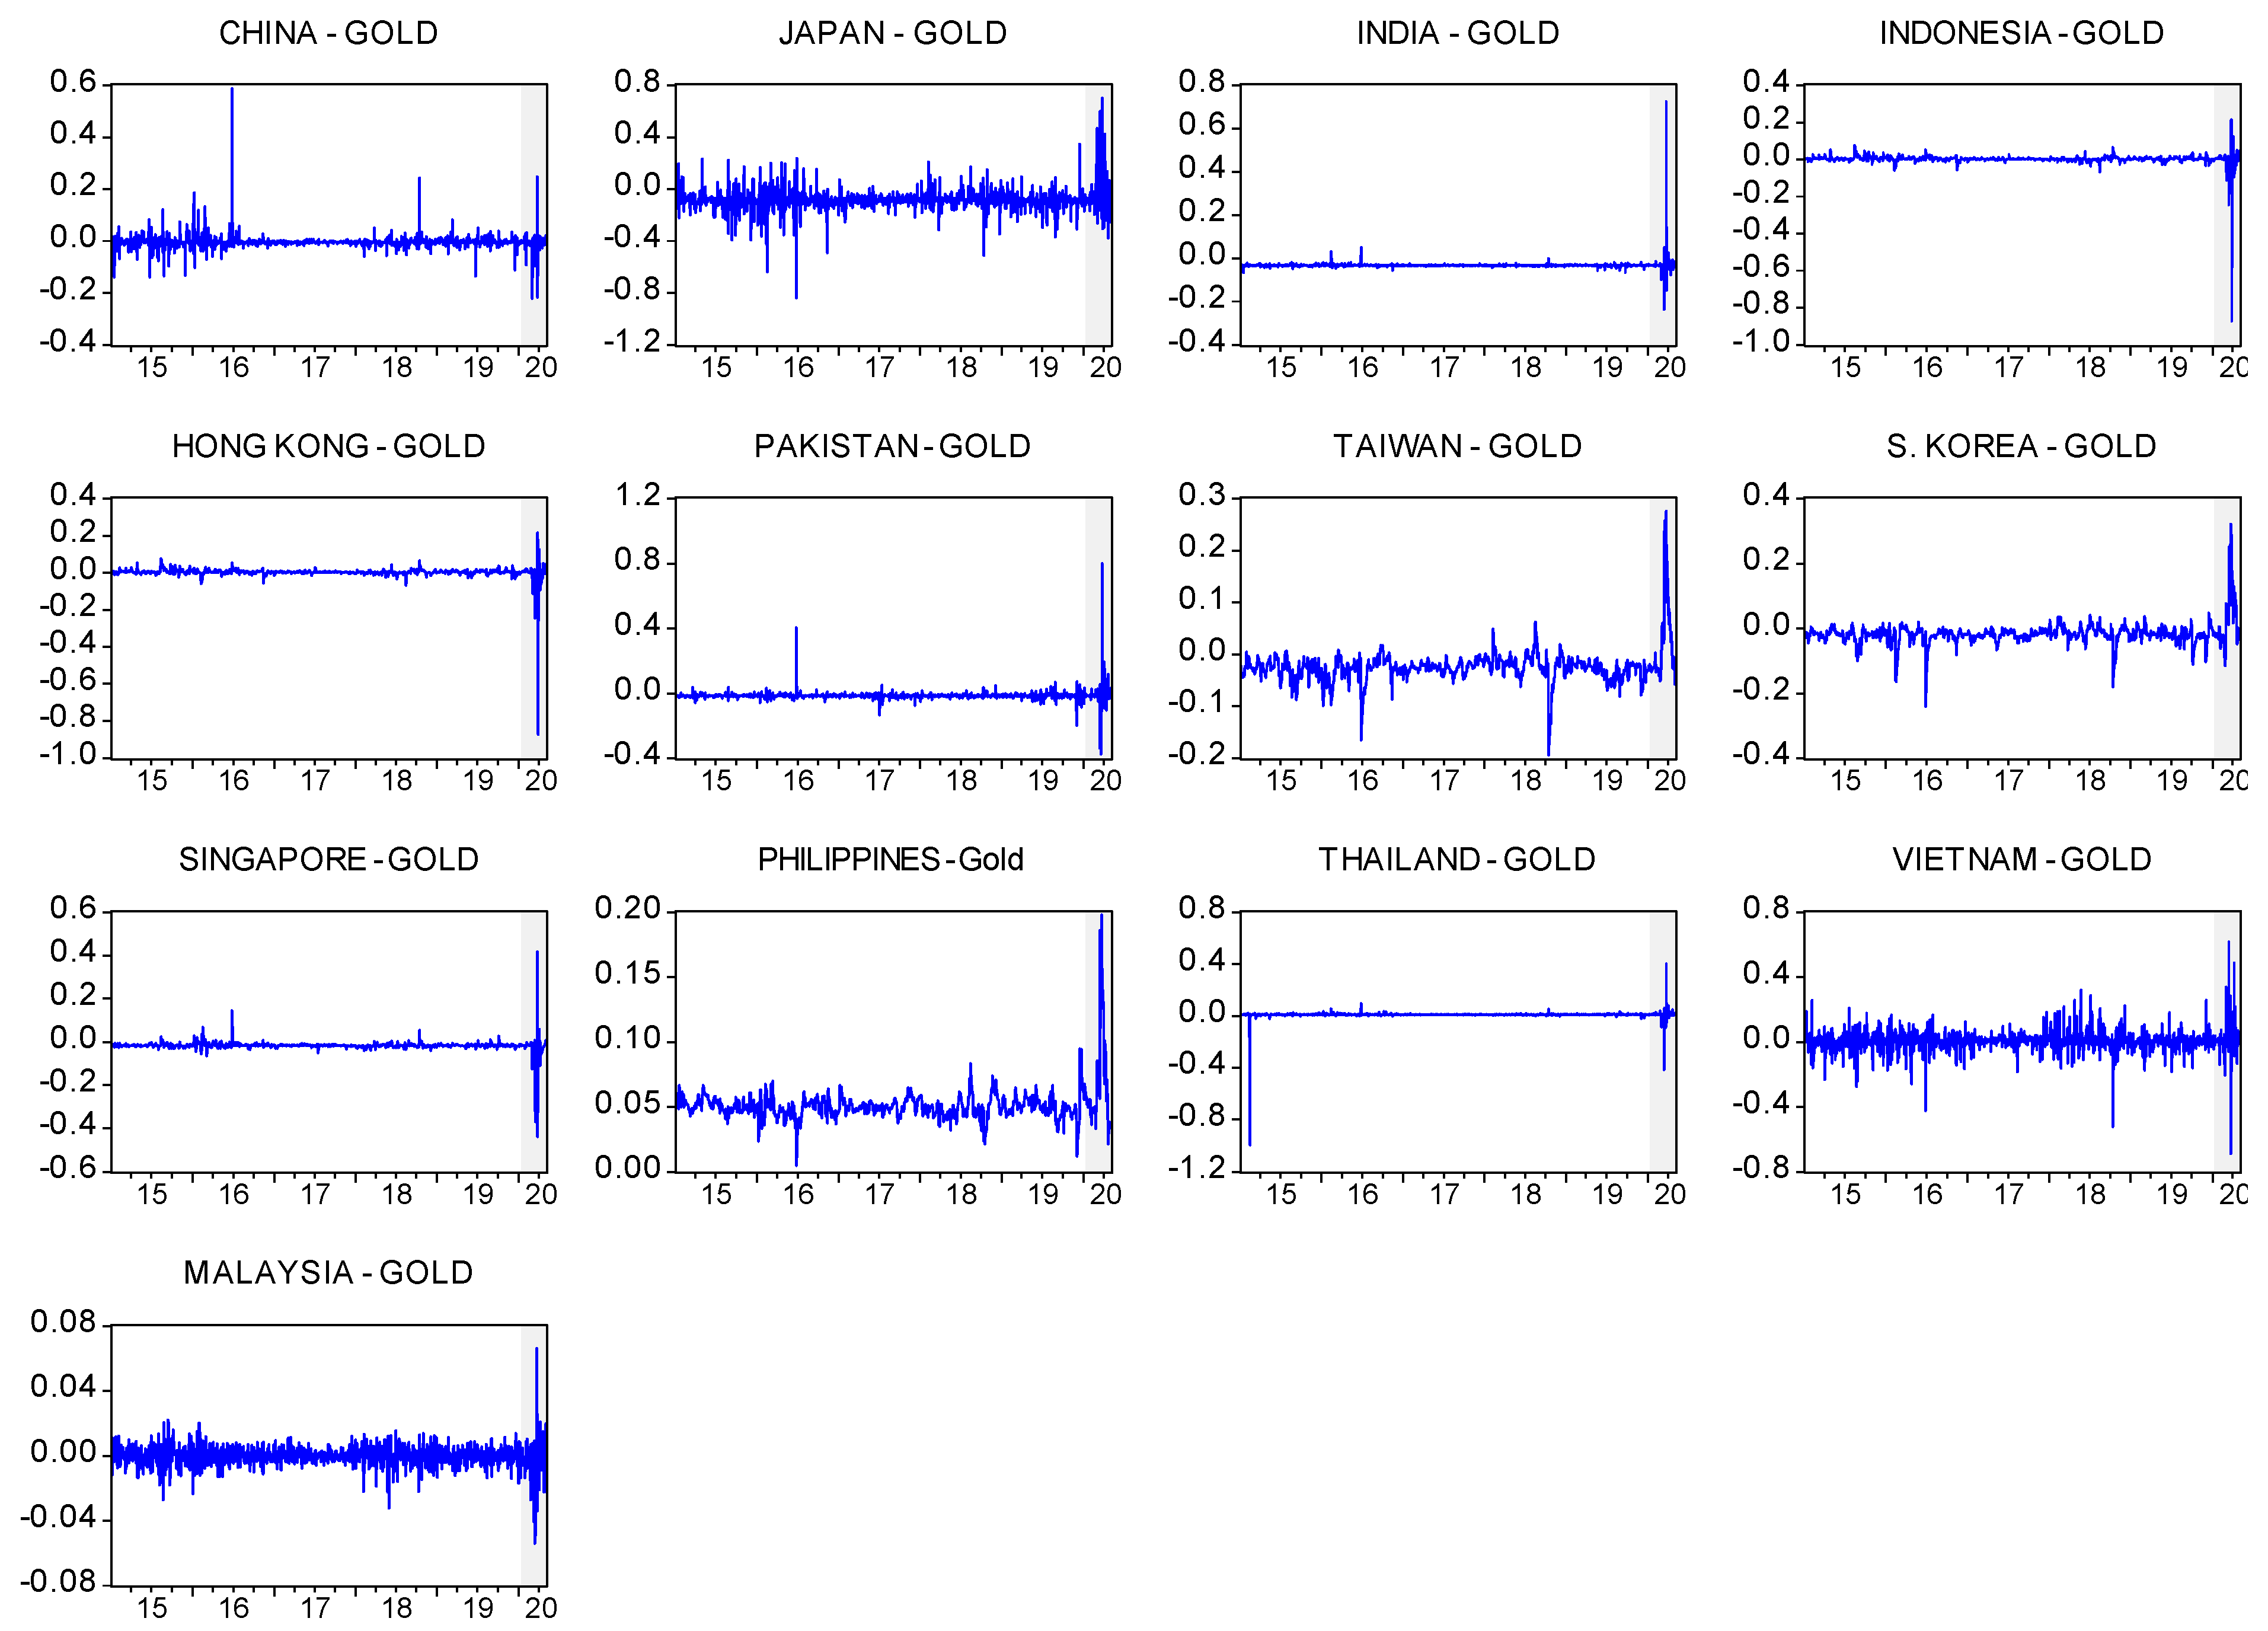
Table 4 also provides a summary of the optimal hedge ratios, and Figure 3 shows the time-varying hedge ratios during the pre COVID-19 and COVID-19 sub-periods. Figure 3 indicates that the hedge ratios are highly volatile during the COVID-19 sub-period compared to the pre COVID-19 sub-period. The summary of hedge ratios (Table 4) shows that the optimal hedge ratio ranges from 0.053 for PHIL/GOLD to −0.102 for JAP/GOLD during the pre COVID-19 sub-period, which implies that a $1 long position in the Philippine equity market can be hedged with a short position of 5.3 cents in the gold market during the pre COVID-19 sub-period. During the COVID-19 sub-period, the optimal hedge ratio varies from 0.110 for PHIL/GOLD to −0.071 for JAP/GOLD, suggesting that a $1 long position in the Philippine equity market can be hedged with a short position of 11 cents in the gold market during the COVID-19 sub-period. Notably, the hedging is more expensive for Philippine stocks during the COVID-19 sub-period than the pre COVID-19 sub-period. For the pairs INDO/GOLD, TAIW/GOLD, and KOR/GOLD, the hedge ratios are positive during the pre COVID-19 sub-period and negative during the COVID-19 sub-period, suggesting that gold is a good hedging asset for Indonesian, Taiwanese, and South Korean stocks during the COVID-19 sub-period. Lastly, the hedge ratios increase for the pairs TAIW/GOLD, PHIL/GOLD, THAI/GOLD, VIET/GOLD, and MYS/GOLD during the COVID-19 sub-period, indicating that the cost of hedging is higher for the Taiwanese, Philippine, Thai, Vietnamese, and Malaysian stocks during the COVID-19 sub-period.
5.3.3. Results of Hedging Effectiveness
Figure 4 shows time-variation in hedging effectiveness. Notably, during the COVID-19 sub-period, the hedging effectiveness of gold for Asian stock markets increases significantly in most cases, reaching levels not seen before the COVID-19 outbreak. This is especially the case for India, Indonesia, Pakistan, Taiwan, Singapore, Philippines, Thailand, Vietnam, and Malaysia. These results are quite similar to the time-variation in the hedging effectiveness of gold for stock indices reported in previous studies (e.g., Shahzad et al. 2020).
Table 5 gives a summary of average hedging effectiveness during the pre COVID-19 and COVID-19 sub-periods. Overall, the results indicate that the risk of Asian stock markets is substantially reduced by constructing a gold-stock portfolio during both sub-periods. In fact, gold offers a higher hedging effectiveness for the Japanese stock market than other Asian stocks during the pre COVID-19 sub-period and the COVID-19 sub-period. Overall, the hedging effectiveness is higher for almost all the Asian stock markets during the COVID-19 sub-period than the pre COVID-19 period, which highlights the stronger ability of gold to hedge Asian stock markets during stressful periods such as the COVID-19 outbreak.
Overall, the main results add to the rising volume of literature dealing with safe-haven assets around the COVID-19 outbreak (Dutta et al. 2020a), by showing, for the first time, not only evidence that gold can reduce the downside risk of some Asian stock markets during the catastrophic COVID-19 pandemic but also that it can act as an effective hedge in several cases. We examine the robustness of our above-mentioned main findings to the choice of the multivariate GARCH model. Using the DCC-DECO model (Engle and Kelly 2012), our main results remain qualitatively the same. The results are not reported here but are available upon request from the authors.
5.4. Determinants of the Hedge Portfolio Returns
Here, we provide the determinants of the hedge portfolio returns during pre COVID-19 sub-period (Table 6) and the COVID-19 sub-period (Table 7). The F-statistics are statistically significant for all cases during both sub-periods. The current hedge portfolio returns are significantly influenced by their lagged hedge portfolio returns in many Asian stock markets, especially during the pre COVID-19 sub-period. The coefficient of DVIX is negative for China, Hong Kong, Korea, and Singapore during the pre COVID-19 period. In contrast, the coefficient of DVIX is insignificant during the COVID-19 sub-period. The coefficient of DGVZ is negative in most of the cases. Specifically, it is negative and significant in Japan, Hong Kong, Taiwan, Korea, and Malaysia during pre COVID-19 sub-period. However, it is negative and significant in China, Japan, India, Hong Kong, Taiwan, Singapore, Korea, Thailand, and Malaysia during the COVID-19 sub-period. The changes in EPU do not influence the hedge portfolio returns in the majority of the cases during the pre COVID-19 sub-period and the COVID-19 sub-period, except in Japan where the effect is negative during the COVID-19 sub-period. The changes in inflation expectation significantly and positively affect the hedge portfolio returns in almost all cases during both sub-periods. DGRA has a negative and significant effect on the hedge portfolio returns in India, Indonesia, Taiwan, Philippines, Thailand, Vietnam, and Malaysia stocks during pre COVID-19 sub-period. Contrarily, the effect of DGRA is negative in Pakistan and Thailand during the COVID-19 sub-period.
Overall, our analyses show that the lagged hedge portfolio returns, DGVZ, DInflation, and DGRA are the main determinants of the hedge portfolio returns in most of the cases during pre COVID-19 sub-period. However, the lagged hedge portfolio returns, DGVZ and Dinflation are the key determinants of the hedge portfolio returns in many cases during the COVID-19 sub-period.
6. Conclusions
Previous studies provide strong evidence for the hedge and safe-haven properties of gold against stock market indices during stress periods. The unprecedented COVID-19 outbreak has adversely affected the health of human beings and led to an economic lockdown and uncertainty in financial markets worldwide. Motivated by recent evidence for the stronger impact of the COVID-19 pandemic on stock markets than previous infectious disease outbreaks (Baker et al. 2020) and the lack of related empirical studies dealing with the gold-stock nexus in Asian stock markets, we extend the existing literature by examining the hedge and safe-haven properties of gold for thirteen Asian stock markets during the COVID-19 outbreak. Specifically, we employ dynamic correlation models augmented with regressions analyses and compute the time-varying optimal weights, hedge ratios, and hedging effectiveness, considering the pre COVID-19 sub-period and the COVID-19 sub-period.
The main results are summarized as follows: Firstly, that for the full sample period (5 January 2015 to 5 May 2020), gold is a diversifier in Indonesia, Philippines, Thailand, Vietnam, and Malaysia and a strong hedge in China, Japan, India, Hong Kong, Pakistan, Taiwan, South Korea, and Singapore. Gold is a strong safe-haven in Indonesia, Singapore, and Thailand, but a weak safe-haven in China, Japan, Hong Kong, India, Pakistan, Taiwan, South Korea, Thailand, and Vietnam. These results regarding weak/strong safe-haven properties suggest that gold protects against losses in the majority of Asian stock markets during extreme negative market movements. Secondly, during the COVID-19 sub-period, the time-varying correlation between gold and the stock markets of China, Japan, India, Indonesia, Hong Kong, Pakistan, Singapore, and Malaysia is mostly negative, suggesting the risk reduction ability of gold even during this catastrophic event. Further analyses show that gold is a diversifier in Indonesia, Philippines, Thailand, Vietnam, and Malaysia and a strong hedge in China, Japan, India, Hong Kong, Pakistan, Taiwan, South Korea, and Singapore. The results show that gold acts as a weak safe-haven in Pakistan and Thailand and a strong safe-haven in China, Indonesia, Singapore, and Vietnam during the COVID-19 sub-period. These results regarding weak/strong safe-haven assets suggest that gold offers protection for investors and portfolio managers against losses in a few of the Asian stock markets during the COVID-19 outbreak. Thirdly, the optimal weights of all stock-gold portfolios are higher during the pre COVID-19 sub-period than the COVID-19 sub-period, suggesting that portfolio investors should increase their investment in gold during the COVID-19 sub-period. The optimal hedge ratios indicate that gold is a suitable hedge in Indonesia, Taiwan, and South Korea during the COVID-19 sub-period. The hedging effectiveness is higher for the majority of Asian stock markets (except China and Hong Kong) during the COVID-19 sub-period than the pre COVID-19 sub-period, which further supports the valuable addition of gold to Asian stocks during this catastrophic event. Fourthly, results from regression analyses show that the hedge portfolio returns in many cases are mostly driven by gold implied volatility and inflation expectations in both sub-periods.
Based on our findings, investors are now more informed about the hedging role of gold against the risk of specific Asian stock markets, not only during normal periods but also during the catastrophic event of the COVID-19 outbreak. The findings are helpful for portfolio diversification and risk management. For example, investors in China, Indonesia, Singapore, Vietnam, Pakistan, and Thailand can consider combining stock and gold investments to maximize returns and reduce the downside stock market risk associated with the COVID-19 outbreak, since gold prices are likely to increase during the outbreak while stock markets lose some of their value. The findings on the determinants of the hedge portfolio returns would help portfolio managers in adjusting their hedging strategies, which would ultimately boost the profitability of hedging, by considering the role of gold implied volatility and inflation expectations.
This paper has some limitations. Firstly, the analysis is limited by the sample of Asian countries, although the sample covers both emerging and developed economies. Future studies could consider a larger sample covering Europe and North America. Secondly, the aggregated level of stock market indices used could mask potential heterogeneity in the hedging ability of gold across stock sector indices. Future studies could extend our analysis by considering the sectoral level of stock indices.
Author Contributions
Conceptualization and methodology, I.Y. and E.B.; formal analysis, I.Y.; data curation, I.Y., N.A.; writing—original draft preparation, I.Y., E.B., S.A.; writing—review and editing, E.B., N.A.; visualization, N.A.; project administration, E.B. All authors have read and agreed to the published version of the manuscript.
Funding
This research received no external funding.
Institutional Review Board Statement
Not applicable.
Informed Consent Statement
Not applicable
Data Availability Statement
The data presented in this study are available on request from the corresponding author.
Conflicts of Interest
The authors declare no conflict of interest.
Appendix A
Figure A1.
Prices of gold and Asian stock market indices.

Figure A2.
Returns of gold and Asian stock market indices.


Table A1.
Summary statistics of daily returns.
| Pre COVID-19 Sub-Period | COVID-19 Sub-Period | |||||||
|---|---|---|---|---|---|---|---|---|
| Mean | Maximum | Minimum | Std. Dev. | Mean | Maximum | Minimum | Std. Dev. | |
| Gold | 0.00016 | 0.0759 | −0.0453 | 0.0098 | 0.00130 | 0.0440 | −0.0396 | 0.0144 |
| China | 0.00003 | 0.0560 | −0.0887 | 0.0148 | −0.00216 | 0.0310 | −0.0804 | 0.0168 |
| Japan | 0.00006 | 0.0743 | −0.0825 | 0.0122 | −0.00316 | 0.0773 | −0.0627 | 0.0225 |
| India | 0.00033 | 0.0519 | −0.0612 | 0.0085 | −0.00375 | 0.0859 | −0.1410 | 0.0317 |
| Indonesia | 0.00010 | 0.0445 | −0.0409 | 0.0089 | −0.00321 | 0.0970 | −0.0681 | 0.0231 |
| Hong Kong | 0.00022 | 0.0413 | −0.0602 | 0.0110 | −0.00150 | 0.0493 | −0.0498 | 0.0182 |
| Pakistan | 0.00023 | 0.0442 | −0.0477 | 0.0103 | −0.00123 | 0.0468 | −0.0710 | 0.0230 |
| Taiwan | 0.00018 | 0.0352 | −0.0652 | 0.0082 | −0.00108 | 0.0617 | −0.0601 | 0.0187 |
| South Korea | 0.00021 | 0.0347 | −0.0454 | 0.0078 | −0.00184 | 0.0825 | −0.0877 | 0.0247 |
| Singapore | 0.00000 | 0.0266 | −0.0439 | 0.0075 | −0.00256 | 0.0589 | −0.0764 | 0.0228 |
| Philippines | 0.00005 | 0.0358 | −0.0694 | 0.0098 | −0.00618 | 0.0717 | −0.1432 | 0.0318 |
| Thailand | 0.00012 | 0.1324 | −0.1209 | 0.0099 | −0.00201 | 0.0765 | −0.1143 | 0.0271 |
| Vietnam | 0.00061 | 0.0378 | −0.0542 | 0.0097 | −0.00196 | 0.0486 | −0.0648 | 0.0184 |
| Malaysia | −0.00003 | 0.0222 | −0.0324 | 0.0058 | −0.00147 | 0.0663 | −0.0540 | 0.0156 |
Table A2.
Additional tests on full sample period.
| Mean | Max | Min | S. Dev. | Skewness | Kurtosis | Jarque-Bera | Q-Stat (6) | ARCH | ADF | PP | |
|---|---|---|---|---|---|---|---|---|---|---|---|
| Gold | 0.00023 | 0.076 | −0.045 | 0.010 | 0.444 | 6.920 | 937.17 *** | 25.025 *** | 28.621 *** | −42.470 *** | −42.832 *** |
| China | −0.00011 | 0.056 | −0.089 | 0.015 | −1.288 | 10.101 | 3310.3 *** | 34.874 *** | 72.189 *** | −34.241 *** | −34.390 *** |
| Japan | −0.00014 | 0.077 | −0.083 | 0.013 | −0.207 | 8.878 | 2014.9 *** | 18.546 *** | 159.90 *** | −35.678 *** | −35.706 *** |
| India | 0.00006 | 0.086 | −0.141 | 0.012 | −1.728 | 28.470 | 38319 *** | 53.685 *** | 69.913 *** | −30.617 *** | −36.582 *** |
| Indonesia | −0.00011 | 0.097 | −0.068 | 0.010 | −0.120 | 12.537 | 5278.4 *** | 27.945 *** | 127.16 *** | −32.464 *** | −32.555 *** |
| Hong Kong | 0.00011 | 0.049 | −0.060 | 0.012 | −0.392 | 5.491 | 396.39 *** | 20.086 *** | 76.200 *** | −36.232 *** | −36.262 *** |
| Pakistan | 0.00014 | 0.047 | −0.071 | 0.012 | −0.564 | 7.368 | 1180.9 *** | 70.800 *** | 76.524 *** | −30.306 *** | −30.494 *** |
| Taiwan | 0.00010 | 0.062 | −0.065 | 0.009 | −0.857 | 11.231 | 4100.1 *** | 22.984 *** | 212.79 *** | −33.815 *** | −36.003 *** |
| South Korea | 0.00008 | 0.083 | −0.088 | 0.010 | −0.378 | 16.054 | 9917.3 *** | 44.356 *** | 964.64 *** | −27.592 *** | −36.129 *** |
| Singapore | −0.00017 | 0.059 | −0.076 | 0.009 | −0.990 | 14.981 | 8553.8 *** | 40.431 *** | 487.75 *** | −23.668 *** | −36.364 *** |
| Philippines | −0.00035 | 0.072 | −0.143 | 0.013 | −2.146 | 24.258 | 27280 *** | 41.612 *** | 92.320 *** | −32.925 *** | −32.915 *** |
| Thailand | −0.00002 | 0.132 | −0.121 | 0.012 | −0.990 | 41.010 | 8402.4 *** | 72.470 *** | 148.59 *** | −44.702 *** | −44.098 *** |
| Vietnam | 0.00045 | 0.049 | −0.065 | 0.010 | −0.869 | 8.426 | 1883.4 *** | 45.085 *** | 28.554 *** | −22.885 *** | −33.773 *** |
| Malaysia | −0.00011 | 0.066 | −0.054 | 0.007 | −0.391 | 16.044 | 9904.3 *** | 25.197 *** | 208.73 *** | −34.230 *** | −34.377 *** |
Notes. Q-stat denotes the Ljung–Box Q-statistics. ARCH test refers to the LM-ARCH test. ADF and PP denote the augmented Dickey Fuller test and Phillip Perron test, respectively. ***, **, and * indicate statistical significance at 1%, 5% and 10% respectively.
References
- Aftab, Muhammad, Syed Zulfiqar Ali Shah, and Izlin Ismail. 2019. Does Gold Act as a Hedge or a Safe Haven against Equity and Currency in Asia? Global Business Review 20: 105–18. [Google Scholar] [CrossRef]
- Ali, Sajid, Elie Bouri, Robert Lukas Czudaj, and Syed Jawad Hussain Shahzad. 2020. Revisiting the valuable roles of commodities for international stock markets. Resources Policy 66: 101603. [Google Scholar] [CrossRef]
- Arouri, Mohamed El Hedi, Amine Lahiani, and Duc Khuong Nguyen. 2015. World gold prices and stock returns in China: Insights for hedging and diversification strategies. Economic Modelling 44: 273–82. [Google Scholar] [CrossRef] [Green Version]
- Aruga, Kentaka, and Sudha Kannan. 2020. Effects of the 2008 financial crisis on the linkages among the oil, gold, and platinum markets. Cogent Economics & Finance 8: 1807684. [Google Scholar]
- Aslam, Faheem, Saima Latif, and Paulo Ferreira. 2020. Investigating Long-Range Dependence of Emerging Asian Stock Markets Using Multifractal Detrended Fluctuation Analysis. Symmetry 12: 1157. [Google Scholar] [CrossRef]
- Baker, Scott R., Nicholas Bloom, and Steven J. Davis. 2016. Measuring economic policy uncertainty. The Quarterly Journal of Economics 131: 1593–636. [Google Scholar] [CrossRef]
- Baker, Scott R., Nicholas Bloom, Steven J. Davis, Kyle J. Kost, Marco C. Sammon, and Tasaneeya Viratyosin. 2020. The Unprecedented Stock Market Impact of COVID-19 (No. w26945). Cambridge: National Bureau of Economic Research. [Google Scholar]
- Basher, Syed Abul, and Perry Sadorsky. 2016. Hedging emerging market stock prices with oil, gold, VIX, and bonds: A comparison between DCC, ADCC and GO-GARCH. Energy Economics 54: 235–47. [Google Scholar] [CrossRef] [Green Version]
- Baur, Dirk G., and Thomas K. McDermott. 2010. Is gold a safe haven? International evidence. Journal of Banking & Finance 34: 1886–98. [Google Scholar]
- Beckmann, Joscha, Theo Berger, and Robert Czudaj. 2015. Does gold act as a hedge or a safe haven for stocks? A smooth transition approach. Economic Modelling 48: 16–24. [Google Scholar] [CrossRef] [Green Version]
- Bekaert, Geert, Eric C. Engstrom, and Nancy R. Xu. 2019. The Time Variation in Risk Appetite and Uncertainty (No. w25673). Cambridge: National Bureau of Economic Research. [Google Scholar]
- Bekiros, Stelios, Sabri Boubaker, Duc Khuong Nguyen, and Gazi Salah Uddin. 2017. Black swan events and safe havens: The role of gold in globally integrated emerging markets. Journal of International Money and Finance 73: 317–34. [Google Scholar] [CrossRef] [Green Version]
- Bouri, Elie, Brian Lucey, Tareq Saeed, and Xuan Vinh Vo. 2021. The realized volatility of commodity futures: Interconnectedness and determinants. International Review of Economics & Finance 73: 139–51. [Google Scholar]
- Bouri, Elie, Oguzhan Cepni, David Gabauer, and Rangan Gupta. 2020. Return connectedness across asset classes around the COVID-19 outbreak. International Review of Financial Analysis 20: 101646. [Google Scholar] [CrossRef]
- Bouri, Elie, Naji Jalkh, Peter Molnár, and David Roubaud. 2017. Bitcoin for energy commodities before and after the December 2013 crash: Diversifier, hedge or safe haven? Applied Economics 49: 5063–73. [Google Scholar] [CrossRef]
- Brogaard, Jonathan, and Andrew Detzel. 2015. The asset-pricing implications of government economic policy uncertainty. Management Science 61: 3–18. [Google Scholar] [CrossRef] [Green Version]
- Cappiello, Lorenzo, Robert F. Engle, and Kevin Sheppard. 2006. Asymmetric dynamics in the correlations of global equity and bond returns. Journal of Financial Econometrics 4: 537–72. [Google Scholar] [CrossRef]
- Chen, Ke, and Meng Wang. 2019. Is gold a hedge and safe haven for stock market? Applied Economics Letters 26: 1080–86. [Google Scholar] [CrossRef]
- Chkili, Walid. 2016. Dynamic correlations and hedging effectiveness between gold and stock markets: Evidence for BRICS countries. Research in International Business and Finance 38: 22–34. [Google Scholar] [CrossRef]
- Dutta, Anupam, Debojyoti Das, R. K. Jana, and Xuan Vinh Vo. 2020a. COVID-19 and oil market crash: Revisiting the safe haven property of gold and Bitcoin. Resources Policy 69: 101816. [Google Scholar] [CrossRef]
- Dutta, Anupam, Elie Bouri, Debojyoti Das, and David Roubaud. 2020b. Assessment and optimization of clean energy equity risks and commodity price volatility indexes: Implications for sustainability. Journal of Cleaner Production 243: 118669. [Google Scholar] [CrossRef]
- Engle, Robert. 2002. Dynamic conditional correlation: A simple class of multivariate generalized autoregressive conditional heteroskedasticity models. Journal of Business & Economic Statistics 20: 339–350. [Google Scholar]
- Engle, Robert, and Bryan Kelly. 2012. Dynamic equicorrelation. Journal of Business & Economic Statistics 30: 212–28. [Google Scholar]
- Gao, Ruzhao, and Bing Zhang. 2016. How does economic policy uncertainty drive gold–stock correlations? Evidence from the UK. Applied Economics 48: 3081–87. [Google Scholar] [CrossRef]
- Gorton, Gary, and K. Geert Rouwenhorst. 2006. Facts and fantasies about commodity futures. Financial Analysts Journal 62: 47–68. [Google Scholar] [CrossRef] [Green Version]
- Gürgün, Gözde, and İbrahim Ünalmış. 2014. Is gold a safe haven against equity market investment in emerging and developing countries? Finance Research Letters 11: 341–48. [Google Scholar] [CrossRef]
- Klein, Tony, Hien Pham Thu, and Thomas Walther. 2018. Bitcoin Is Not the New Gold: A Comparison of Volatility, Correlation, and Portfolio Performance. International Review of Financial Analysis 58: 105–16. [Google Scholar] [CrossRef]
- Klein, Tony. 2017. Dynamic correlation of precious metals and flight-to-quality in developed markets. Finance Research Letters 23: 283–90. [Google Scholar] [CrossRef]
- Low, Rand Kwong Yew, Yiran Yao, and Robert Faff. 2016. Diamonds vs. precious metals: What shines brightest in your investment portfolio? International Review of Financial Analysis 43: 1–14. [Google Scholar] [CrossRef] [Green Version]
- Ming, Lei, Xinran Zhang, Qianqiu Liu, and Shenggang Yang. 2020. A revisit to the hedge and safe haven properties of gold: New evidence from China. Journal of Futures Markets 40: 1442–56. [Google Scholar] [CrossRef]
- Mirza, Nawazish, Birjees Rahat, Bushra Naqvi, and Syed Kumail Abbas Rizvi. 2020. Impact of Covid-19 on corporate solvency and possible policy responses in the EU. The Quarterly Review of Economics and Finance. in press. [Google Scholar] [CrossRef]
- Mohti, Wahbeeah, Andreia Dionísio, Isabel Vieira, and Paulo Ferreira. 2019. Regional and global integration of Asian stock markets. Research in International Business and Finance 50: 357–68. [Google Scholar] [CrossRef] [Green Version]
- Nguyen, Cuong M. Ishaq Bhatti, Magda Komorníková, and Jozef Komorník. 2016. Gold price and stock markets nexus under mixed-copulas. Economic Modelling 58: 283–92. [Google Scholar] [CrossRef]
- Pan, Zhiyuan, Yudong Wang, and Li Yang. 2014. Hedging crude oil using refined product: A regime switching asymmetric DCC approach. Energy economics 46: 472–84. [Google Scholar] [CrossRef]
- Ratner, Mitchell, and Chih-Chieh Jason Chiu. 2013. Hedging stock sector risk with credit default swaps. International Review of Financial Analysis 30: 18–25. [Google Scholar] [CrossRef]
- Raza, Naveed, Syed Jawad Hussain Shahzad, Aviral Kumar Tiwari, and Muhammad Shahbaz. 2016. Asymmetric impact of gold, oil prices and their volatilities on stock prices of emerging markets. Resources Policy 49: 290–301. [Google Scholar] [CrossRef]
- Saeed, Tareq, Elie Bouri, and Xuan Vinh Vo. 2020. Hedging Strategies of Green Assets against Dirty Energy Assets. Energies 13: 3141. [Google Scholar] [CrossRef]
- Shahzad, Syed Jawad Hussain, Elie Bouri, David Roubaud, and Ladislav Kristoufek. 2020. Safe haven, hedge and diversification for G7 stock markets: Gold versus bitcoin. Economic Modelling 87: 212–24. [Google Scholar] [CrossRef]
- Shahzad, Syed Jawad Hussain, Elie Bouri, Ladislav Kristoufek, and Tareq Saeed. 2021. Impact of the COVID-19 outbreak on the US equity sectors: Evidence from quantile return spillovers. Financial Innovation 7: 1–23. [Google Scholar] [CrossRef]
- Wen, Xiaoqian, and Hua Cheng. 2018. Which is the safe haven for emerging stock markets, gold or the US dollar? Emerging Markets Review 35: 69–90. [Google Scholar] [CrossRef]
- Yousaf, Imran, and Shoaib Ali. 2020a. The COVID-19 outbreak and high frequency information transmission between major cryptocurrencies: Evidence from the VAR-DCC-GARCH approach. Borsa Istanbul Review 20: S1–S10. [Google Scholar] [CrossRef]
- Yousaf, Imran, and Shoaib Ali. 2020b. Discovering interlinkages between major cryptocurrencies using high-frequency data: New evidence from COVID-19 pandemic. Financial Innovation 6: 1–18. [Google Scholar] [CrossRef]
- Yousaf, Imran, and Shoaib Ali. 2021. Linkages between stock and cryptocurrency markets during the COVID-19 outbreak: An intraday analysis. The Singapore Economic Review. in press. [Google Scholar] [CrossRef]
- Yousaf, Imran, and Arshad Hassan. 2019. Linkages between crude oil and emerging Asian stock markets: New evidence from the Chinese stock market crash. Finance Research Letters 31: 207–17. [Google Scholar] [CrossRef]
- Yousaf, Imran, Shoaib Ali, and Wing-Keung Wong. 2020. Return and volatility transmissions between metals and Stocks: A study of the emerging Asian markets by using the VAR-AGARCH approach. Asia-Pacific Journal of Operational Research. in press. [Google Scholar] [CrossRef]
Figure 1.
Dynamic conditional correlations (DCC).

Figure 2.
Optimal weights.

Figure 3.
Optimal hedge ratios.

Figure 4.
Time-varying hedging effectiveness.
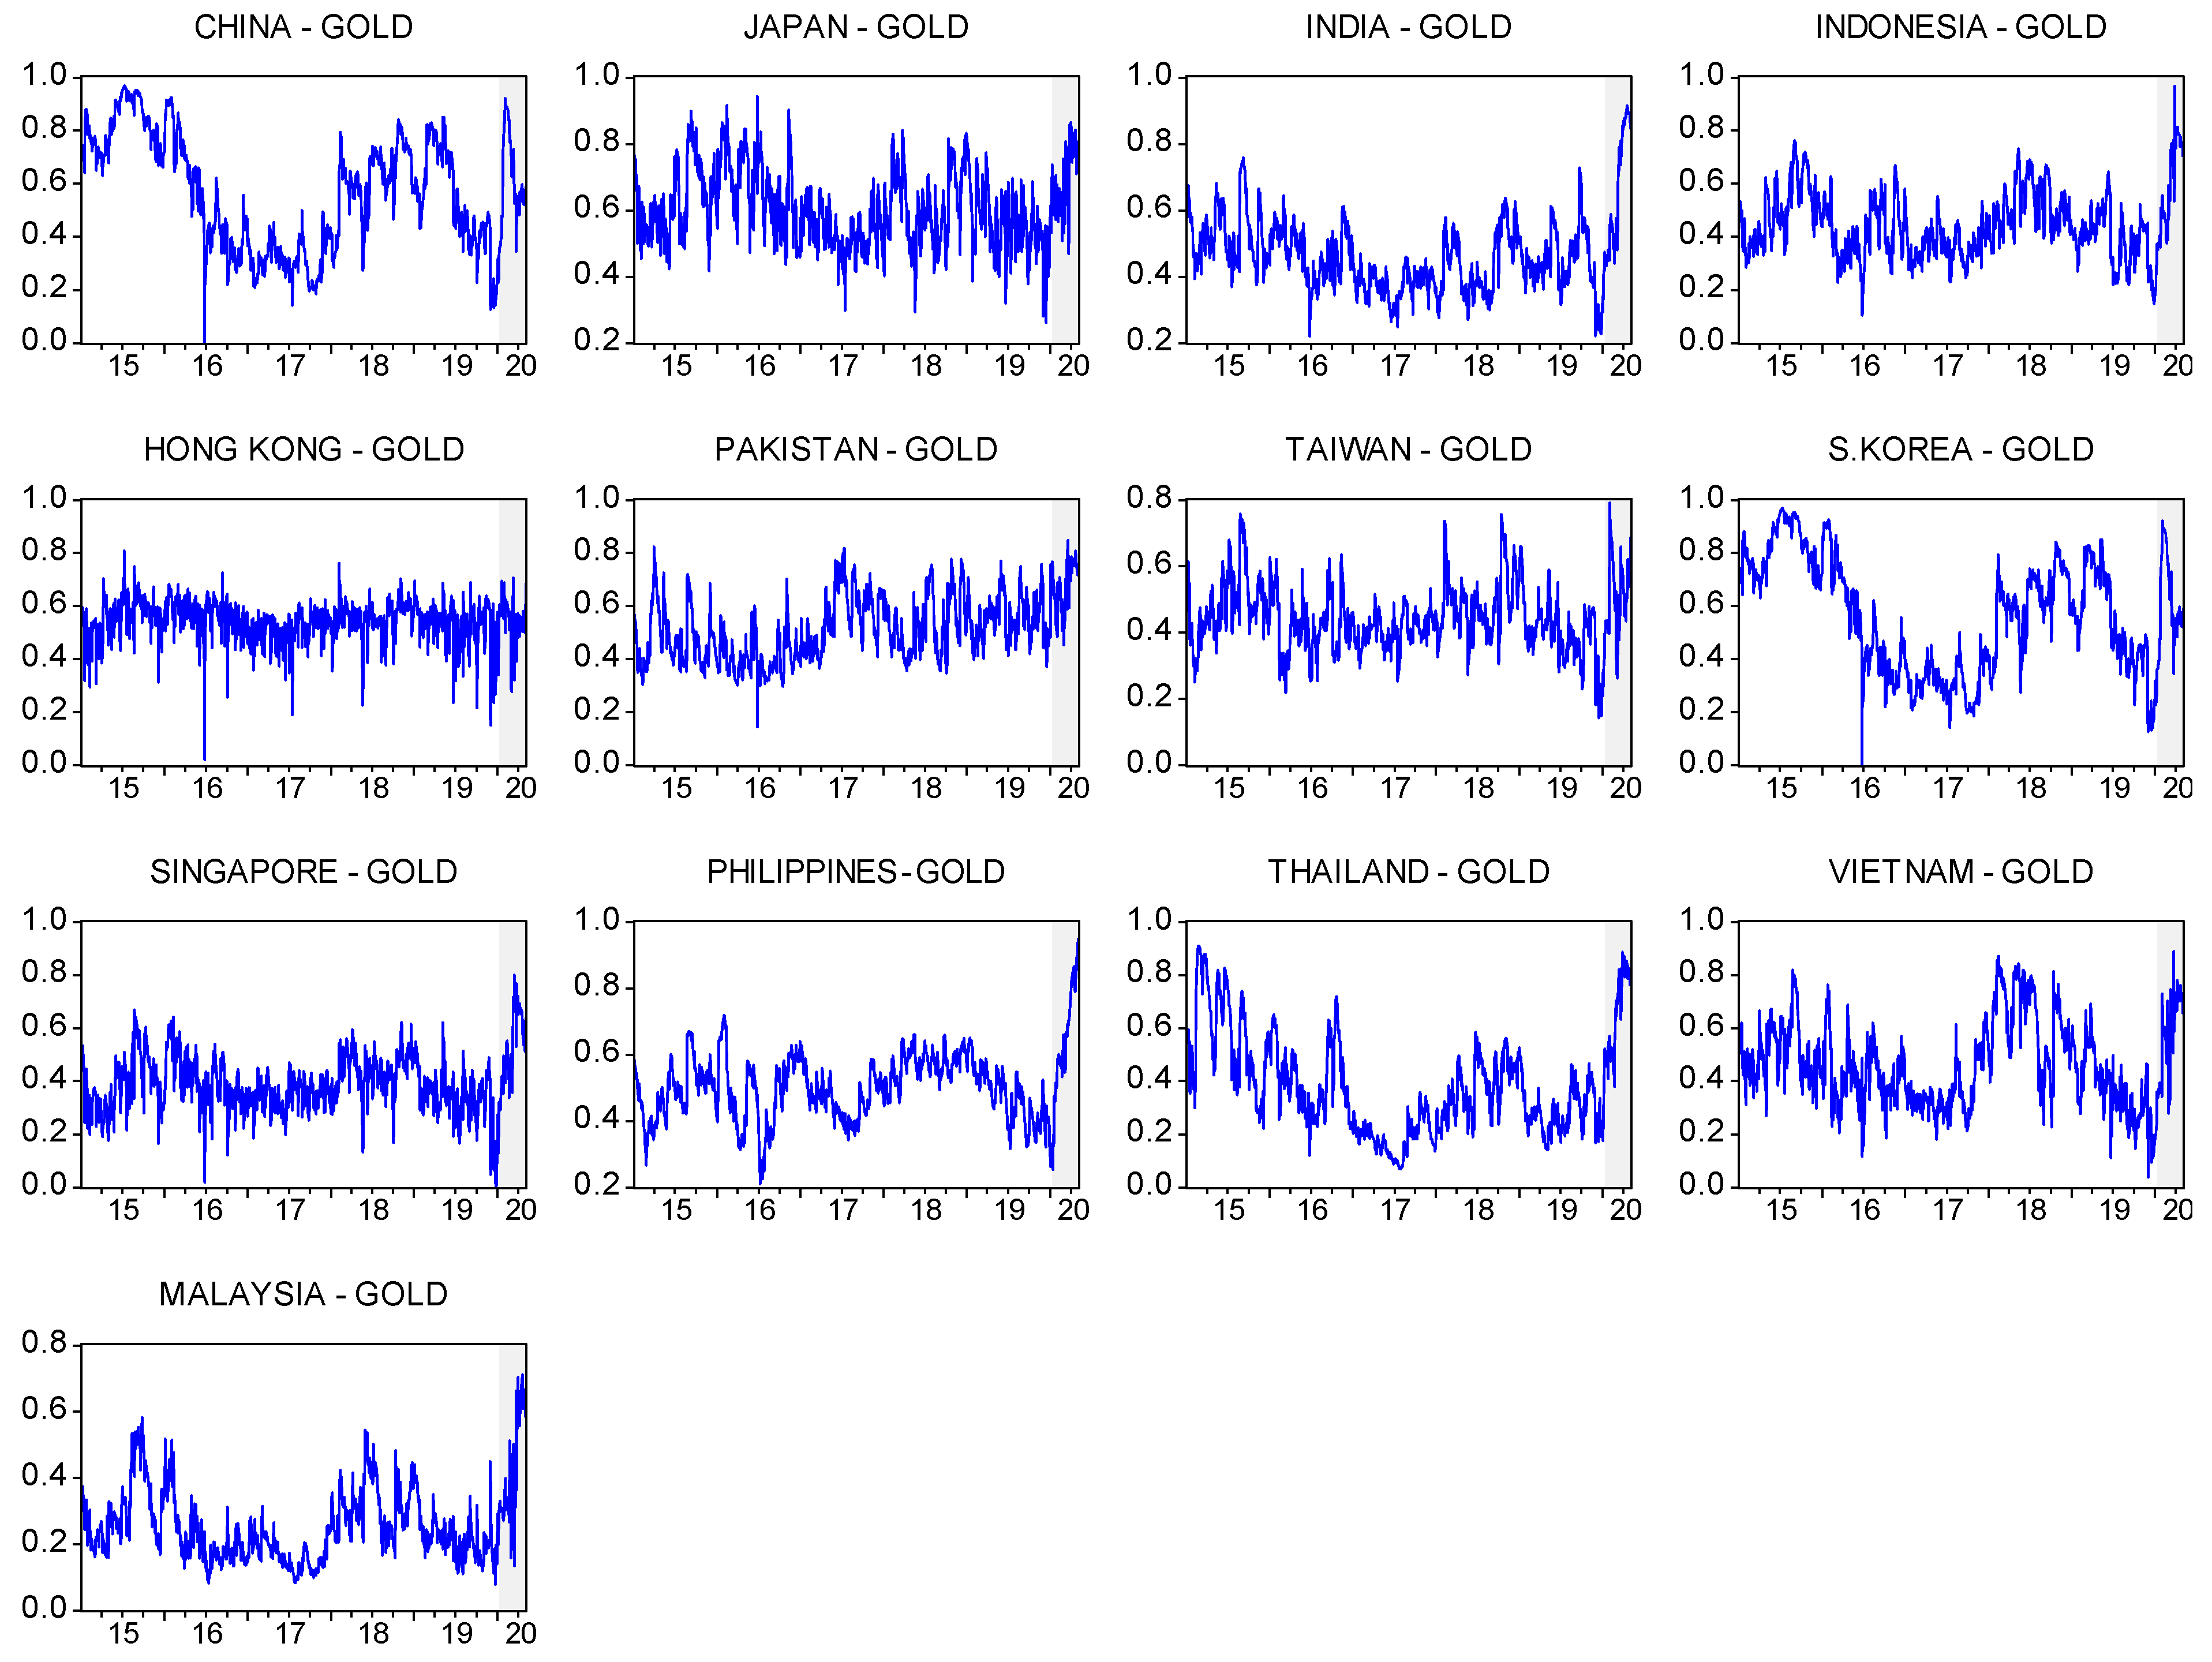
Table 1.
Average dynamic conditional correlations.
| CHN | JAP | IND | INDO | HK | PAK | TAIW | KOR | SING | PHIL | THAI | VIET | MYS | |
|---|---|---|---|---|---|---|---|---|---|---|---|---|---|
| Pre COVID sub-period | −0.003 | −0.086 | −0.033 | 0.003 | 0.003 | −0.015 | −0.027 | −0.020 | −0.016 | 0.050 | 0.010 | 0.005 | 0.000 |
| COVID-19 sub-period | −0.010 | −0.048 | −0.029 | −0.014 | −0.014 | −0.013 | 0.022 | 0.027 | −0.037 | 0.069 | 0.009 | 0.018 | −0.001 |
Notes: CHN—China, JAP—Japan, IND—India, Indo—Indonesia, HK—Hong Kong, PAK—Pakistan, TAIW—Taiwan, KOR—South Korea, SING—Singapore, PHIL—Philippines, THAI—Thailand, VIET—Vietnam, MYS—Malaysia.
Table 2.
Estimation results for the hedge and safe-haven properties of gold against Asian equities in extreme market conditions (quantile columns (10%, 5%, or 1%)).
Table 2.
Estimation results for the hedge and safe-haven properties of gold against Asian equities in extreme market conditions (quantile columns (10%, 5%, or 1%)).
| Hedge () | ||||
|---|---|---|---|---|
| China | −0.003 a | −0.002 | 0.006 | −0.005 |
| Japan | −0.083 a | −0.000 | 0.005 | 0.015 |
| India | −0.032 a | −0.000 | 0.000 | −0.003 |
| Indonesia | 0.002 a | 0.009 b | −0.009 c | −0.046 a |
| Hong Kong | −0.025 a | −0.011 | 0.026 c | 0.040c |
| Pakistan | −0.015 a | −0.002 | −0.000 | −0.052 a |
| Taiwan | −0.024 a | −0.003 | 0.004 | 0.076 a |
| South Korea | −0.018 a | −0.000 | 0.005 | 0.090 a |
| Singapore | −0.016 a | −0.000 | −0.004 | −0.053 a |
| Philippine | 0.050 a | 0.000 | 0.002 | 0.023 a |
| Thailand | 0.011 a | −0.000 | −0.021 a | 0.021 b |
| Vietnam | 0.006 a | −0.008 | −0.004 | 0.028 |
| Malaysia | 0.013 a | 0.001 | 0.013 | 0.049 a |
Notes: a, b, and c denote statistical significance at 1%, 5%, and 10%, respectively.
Table 3.
Estimation results for the hedge and safe-haven properties of gold against Asian equities in the COVID-19 sub-period.
Table 3.
Estimation results for the hedge and safe-haven properties of gold against Asian equities in the COVID-19 sub-period.
| COVID-19 | ||
|---|---|---|
| China | −0.003 a | −0.006 b |
| Japan | −0.085 a | 0.037 a |
| India | −0.032 a | 0.003 |
| Indonesia | 0.003 a | −0.017 a |
| Hong Kong | −0.030 a | 0.093 a |
| Pakistan | −0.015 a | −0.002 |
| Taiwan | −0.026 a | 0.049 a |
| South Korea | −0.019 a | 0.047 a |
| Singapore | −0.016 a | −0.020 a |
| Philippine | 0.049 a | 0.019 a |
| Thailand | 0.010 a | −0.001 |
| Vietnam | 0.005 a | −0.012 c |
| Malaysia | 0.014 a | 0.021 a |
Notes: a, b, and c denote statistical significance at 1%, 5%, and 10%, respectively.
Table 4.
Optimal weights and hedge ratios.
| CHN/ GOLD | JAP/ GOLD | IND/ GOLD | INDO/ GOLD | HK/ GOLD | PAK/ GOLD | TAIW/ GOLD | KOR/ GOLD | SING/ GOLD | PHIL/ GOLD | THAI/ GOLD | VIET/ GOLD | MYS/ GOLD | |
|---|---|---|---|---|---|---|---|---|---|---|---|---|---|
| Panel A. Pre COVID-19 sub-period | |||||||||||||
| 0.440 | 0.441 | 0.563 | 0.562 | 0.468 | 0.500 | 0.575 | 0.590 | 0.624 | 0.480 | 0.627 | 0.541 | 0.750 | |
| −0.005 | −0.102 | −0.029 | 0.003 | −0.029 | −0.016 | −0.024 | −0.017 | −0.013 | 0.053 | 0.009 | 0.006 | 0.007 | |
| Panel B. COVID-19 sub-period | |||||||||||||
| 0.400 | 0.323 | 0.363 | 0.431 | 0.441 | 0.324 | 0.484 | 0.393 | 0.499 | 0.339 | 0.352 | 0.428 | 0.562 | |
| −0.014 | −0.071 | −0.047 | −0.026 | 0.036 | −0.021 | 0.029 | 0.047 | −0.043 | 0.110 | 0.013 | 0.030 | 0.030 | |
Notes: CHN—China, JAP—Japan, IND—India, Indo—Indonesia, HK—Hong Kong, PAK—Pakistan, TAIW—Taiwan, KOR—South Korea, SING—Singapore, PHIL—Philippines, THAI—Thailand, VIET—Vietnam, MYS—Malaysia. is the weight of equity in a one-dollar portfolio of equity and gold. is the risk-minimizing optimal hedge ratio for a portfolio of gold and equities.
Table 5.
Average values of hedging effectiveness.
| CHN | JAP | IND | INDO | HK | PAK | TAIW | KOR | SING | PHIL | THAI | VIET | MYS | |
|---|---|---|---|---|---|---|---|---|---|---|---|---|---|
| Pre COVID sub-period | 0.562 | 0.599 | 0.453 | 0.437 | 0.545 | 0.507 | 0.438 | 0.562 | 0.384 | 0.495 | 0.368 | 0.457 | 0.245 |
| During COVID sub-period | 0.605 | 0.693 | 0.650 | 0.575 | 0.543 | 0.679 | 0.504 | 0.605 | 0.518 | 0.630 | 0.644 | 0.561 | 0.422 |
Notes: CHN—China, JAP—Japan, IND—India, Indo—Indonesia, HK—Hong Kong, PAK—Pakistan, TAIW—Taiwan, KOR—South Korea, SING—Singapore, PHIL—Philippines, THAI—Thailand, VIET—Vietnam, MYS—Malaysia.
Table 6.
Determinants of the hedge portfolio returns in the pre COVID-19 sub-period.
| CHN | JAP | IND | INDO | HK | PAK | TAIW | KOR | SING | PHIL | THAI | VIET | MYS | |
|---|---|---|---|---|---|---|---|---|---|---|---|---|---|
| C | 0.000 | 0.000 | 0.000 | 0.000 | 0.000 | 0.000 | 0.000 | 0.000 | 0.000 | 0.000 | 0.000 | 0.001 ** | 0.000 |
| 0.952 | 0.508 | 0.193 | 0.720 | 0.442 | 0.539 | 0.320 | 0.271 | 0.96 | 0.854 | 0.618 | 0.013 | 0.937 | |
| AR (1) | 0.048 * | −0.055 * | 0.071 *** | 0.106 *** | −0.008 | 0.207 *** | −0.034 | 0.018 | 0.015 | 0.034 | −0.218 *** | 0.047 * | 0.095 *** |
| 0.087 | 0.073 | 0.010 | 0.000 | 0.791 | 0.000 | 0.248 | 0.540 | 0.610 | 0.231 | 0.000 | 0.092 | 0.001 | |
| DVIX | −0.020 ** | −0.008 | −0.007 | 0.001 | −0.022 ** | 0.002 | −0.002 | −0.008 * | −0.009 * | 0.018 *** | −0.006 | 0.012 ** | 0.003 |
| 0.036 | 0.225 | 0.185 | 0.892 | 0.002 | 0.736 | 0.673 | 0.089 | 0.052 | 0.004 | 0.318 | 0.039 | 0.413 | |
| DGVZ | −0.009 | −0.012 * | −0.007 | −0.006 | −0.014 ** | −0.002 | −0.011 ** | −0.012 ** | −0.001 | −0.003 | −0.014 ** | 0.004 | −0.006 ** |
| 0.344 | 0.065 | 0.184 | 0.297 | 0.028 | 0.741 | 0.026 | 0.012 | 0.779 | 0.657 | 0.019 | 0.501 | 0.085 | |
| DEPU | −0.001 | 0.000 | 0.000 | 0.000 | −0.001 | 0.000 | 0.000 | −0.001 * | 0.000 | −0.001 | 0.000 | 0.000 | 0.000 |
| 0.121 | 0.929 | 0.588 | 0.517 | 0.128 | 0.793 | 0.728 | 0.082 | 0.665 | 0.207 | 0.904 | 0.674 | 0.762 | |
| DINFLATION | 0.077 *** | 0.044 ** | 0.078 *** | 0.041 ** | 0.111 *** | 0.044 ** | 0.080 ** | 0.068 ** | 0.063 ** | 0.038 ** | 0.084 ** | 0.041 ** | 0.044 ** |
| 0.009 | 0.040 | 0.000 | 0.017 | 0.000 | 0.030 | 0.000 | 0.000 | 0.000 | 0.048 | 0.000 | 0.016 | 0.000 | |
| DGRA | 0.009 | −0.015 | −0.027 ** | −0.027 ** | 0.010 | −0.012 | −0.027 ** | −0.008 | −0.017 | −0.060 *** | −0.032 ** | −0.069 *** | −0.014 * |
| 0.660 | 0.327 | 0.020 | 0.030 | 0.515 | 0.411 | 0.016 | 0.465 | 0.118 | 0.000 | 0.020 | 0.000 | 0.072 | |
| Adj. R-squared | 0.024 | 0.019 | 0.076 | 0.035 | 0.065 | 0.046 | 0.057 | 0.058 | 0.055 | 0.021 | 0.096 | 0.045 | 0.037 |
| F-statistic | 6.221 *** | 5.113 *** | 18.859 *** | 8.807 *** | 16.109 *** | 11.472 *** | 14.055 *** | 14.259 *** | 13.554 *** | 5.583 *** | 23.882 *** | 11.146 *** | 9.248 *** |
| Prob(F-statistic) | 0.000 | 0.000 | 0.000 | 0.000 | 0.000 | 0.000 | 0.000 | 0.000 | 0.000 | 0.000 | 0.000 | 0.000 | 0.000 |
Notes: Figures in bold are Newey–West standard errors that are corrected for autocorrelation and heteroscedasticity. AR (1) is the first-order autocorrelation; DVIX: changes in the 30-day volatility of the S&P 500 index; DGVZ: changes in the 30-day volatility of gold prices; DEPU: changes in the US Economic Policy Uncertainty; DInflation: changes in US inflation expectations; DGRA: Changes in the global risk aversion (GRA) index. ***, **, and * denote statistical significance at the 1%, 5%, and 10% significance levels, respectively.
Table 7.
Determinants of the hedge portfolio returns during the COVID-19 sub-period.
| CHN | JAP | IND | INDO | HK | PAK | TAIW | KOR | SING | PHIL | THAI | VIET | MYS | |
|---|---|---|---|---|---|---|---|---|---|---|---|---|---|
| C | −0.002 | −0.001 | −0.004 | −0.002 | −0.001 | −0.001 | 0.000 | 0.000 | −0.002 | −0.005 | −0.002 | 0.000 | −0.001 |
| 0.385 | 0.472 | 0.272 | 0.370 | 0.499 | 0.696 | 0.893 | 0.910 | 0.444 | 0.103 | 0.545 | 0.743 | 0.480 | |
| AR (1) | 0.171 | −0.098 | −0.145 | 0.112 | −0.199 ** | 0.145 | 0.018 | −0.043 | −0.033 | 0.121 | −0.176 * | 0.129 | −0.042 |
| 0.121 | 0.335 | 0.194 | 0.276 | 0.046 | 0.191 | 0.848 | 0.647 | 0.733 | 0.224 | 0.075 | 0.210 | 0.661 | |
| DVIX | 0.024 | −0.041 | 0.055 | 0.014 | 0.011 | −0.022 | 0.017 | −0.019 | 0.038 | 0.007 | 0.022 | −0.039 | 0.019 |
| 0.426 | 0.133 | 0.345 | 0.730 | 0.657 | 0.610 | 0.483 | 0.549 | 0.304 | 0.881 | 0.598 | 0.104 | 0.306 | |
| DGVZ | −0.050 ** | −0.040 * | −0.112 ** | −0.054 | −0.073 ** | −0.030 | −0.051 ** | −0.061 ** | −0.098 *** | 0.000 | −0.105 *** | −0.004 | −0.058 *** |
| 0.043 | 0.090 | 0.029 | 0.129 | 0.002 | 0.460 | 0.022 | 0.034 | 0.004 | 0.912 | 0.007 | 0.866 | 0.001 | |
| DEPU | −0.006 | −0.016 *** | −0.004 | 0.005 | −0.006 | −0.014 | −0.005 | −0.008 | −0.009 | −0.002 | 0.000 | −0.003 | −0.004 |
| 0.250 | 0.005 | 0.748 | 0.556 | 0.216 | 0.107 | 0.274 | 0.214 | 0.235 | 0.855 | 0.953 | 0.472 | 0.245 | |
| DINFLATION | 0.058 *** | 0.049 ** | 0.071 | 0.098 *** | 0.068 *** | −0.036 | 0.118 *** | 0.136 *** | 0.144 *** | 0.174 *** | 0.102 *** | 0.050 *** | 0.083 *** |
| 0.010 | 0.021 | 0.116 | 0.002 | 0.001 | 0.285 | 0.000 | 0.000 | 0.000 | 0.000 | 0.004 | 0.009 | 0.000 | |
| DGRA | −0.009 | 0.014 | −0.030 | −0.013 | −0.008 | −0.028 * | 0.001 | 0.011 | −0.004 | −0.010 | −0.033 ** | 0.014 * | 0.002 |
| 0.343 | 0.131 | 0.124 | 0.326 | 0.349 | 0.058 | 0.871 | 0.285 | 0.716 | 0.517 | 0.024 | 0.082 | 0.685 | |
| Adj. R-squared | 0.124 | 0.200 | 0.098 | 0.158 | 0.277 | 0.133 | 0.344 | 0.319 | 0.289 | 0.246 | 0.323 | 0.112 | 0.353 |
| F-statistic | 3.080 *** | 4.674 *** | 2.585 *** | 3.747 *** | 6.611 *** | 3.258 *** | 8.685 *** | 7.870 *** | 6.970 *** | 5.791 *** | 7.983 *** | 2.851 ** | 9.003 *** |
| Prob(F-statistic) | 0.009 | 0.000 | 0.024 | 0.002 | 0.000 | 0.006 | 0.000 | 0.000 | 0.000 | 0.000 | 0.000 | 0.014 | 0.000 |
Notes: Figures in bold are Newey–West standard errors that are corrected for autocorrelation and heteroscedasticity. AR (1) is the first-order autocorrelation; DVIX: changes in the 30-day volatility of the S&P 500 index; DGVZ: changes in the 30-day volatility of gold prices; DEPU: changes in the US Economic Policy Uncertainty; DInflation: changes in US inflation expectations; DGRA: Changes in the global risk aversion (GRA) index. ***, **, and * denote statistical significance at the 1%, 5%, and 10% significance levels, respectively.
Publisher’s Note: MDPI stays neutral with regard to jurisdictional claims in published maps and institutional affiliations. |
© 2021 by the authors. Licensee MDPI, Basel, Switzerland. This article is an open access article distributed under the terms and conditions of the Creative Commons Attribution (CC BY) license (https://creativecommons.org/licenses/by/4.0/).
Share and Cite
MDPI and ACS Style
Yousaf, I.; Bouri, E.; Ali, S.; Azoury, N. Gold against Asian Stock Markets during the COVID-19 Outbreak. J. Risk Financial Manag. 2021, 14, 186. https://0-doi-org.brum.beds.ac.uk/10.3390/jrfm14040186
AMA Style
Yousaf I, Bouri E, Ali S, Azoury N. Gold against Asian Stock Markets during the COVID-19 Outbreak. Journal of Risk and Financial Management. 2021; 14(4):186. https://0-doi-org.brum.beds.ac.uk/10.3390/jrfm14040186
Chicago/Turabian StyleYousaf, Imran, Elie Bouri, Shoaib Ali, and Nehme Azoury. 2021. "Gold against Asian Stock Markets during the COVID-19 Outbreak" Journal of Risk and Financial Management 14, no. 4: 186. https://0-doi-org.brum.beds.ac.uk/10.3390/jrfm14040186