
Firm Credit Scoring: A Series Two-Stage DEA Bootstrapped Approach


School of Applied Mathematics and Physics, National Technical University of Athens, 15780 Athens, Greece
J. Risk Financial Manag. 2021, 14(5), 214; https://0-doi-org.brum.beds.ac.uk/10.3390/jrfm14050214
Submission received: 20 April 2021
/
Revised: 3 May 2021
/
Accepted: 5 May 2021
/
Published: 10 May 2021
(This article belongs to the Special Issue Quantitative Risk)
Abstract
:This paper employs a cross-sectional research design to collect quantitative data for a group of Greek pharmaceutical companies in order to evaluate their credit risk. The data are processed using a variety of quantitative approaches, including series two-stage data envelopment analysis (DEA) combined with bootstrap and hierarchical clustering. The results of the two-stage DEA bootstrapped analysis indicate that the key problem with the firms’ performance is a lack of effectiveness rather than operating efficiency. The lack of a correlation between operating efficiency and effectiveness indicates that the firms’ performance metrics are unrelated. As a result, a bootstrapped DEA-based synthetic indicator is developed to be used with the other performance metrics as inputs to hierarchical clustering to divide sample firms into credit risk clusters. The series two-stage DEA bootstrapped approach used in this study could aid firms in evaluating their performance and increasing their competitive advantages.
1. Introduction
Practitioners, financial, and credit analysts are all interested in firm credit risk assessment models. These models are designed to classify firms as creditworthy or insolvent, allowing them to be identified as likely to default on their debt (Tsolas 2015). The development of a methodological framework for analyzing firm credit risk and its components has become critical in light of the recent economic crisis (Iazzolino et al. 2013).
Firm failure, as a term, refers to a situation in which a firm is not able to pay its creditors, suppliers, etc., or is legally bankrupt (Yeh et al. 2010). The likelihood that a firm would be unable to fulfill its debt obligations to its creditors (i.e., default risk; Çelik 2013) is a major concern in credit risk analysis. Credit risk is similar to bankruptcy risk, which is associated with the sustainability of the firm and leads to the firm’s liquidation and discontinuity of operations (Doumpos and Zopounidis 2007). There are three types of credit risk models (Iazzolino et al. 2013): structural, reduced-form, and hybrid models that use statistical techniques and methods of artificial intelligence and operations research. In the last category belong data envelopment analysis (DEA) (Charnes et al. 1978), neural networks, rough sets, and evolutionary algorithms (Shuai and Li 2005).
Poor management is generally acknowledged among others as the primary cause of a firm’s financial failure (Yeh et al. 2010; Li et al. 2014). The efficiency of a company can be used to assess management quality by comparing outputs to inputs. DEA is a non-parametric approach for comparing a company’s results to that of best-in-class companies. While DEA is commonly used for production-based performance analysis, the current research focuses on firm credit risk evaluation, and DEA is proposed as a technique for assessing corporate credit worthiness.
The current study details the use of a series two-stage DEA bootstrapped approach and hierarchical clustering for credit risk assessment of a group of Greek pharmaceutical firms. Pharmaceuticals are regarded as a sector with significant export potential, improving the Greek economy in this way. The Greek pharmaceutical industry is one of the most competitive in the country’s manufacturing industry, and it is a vital part of the Greek economy (Kounnou and Kyrkilis 2020). In the sectors of basic resources and chemicals (Tsolas 2015), as well as chemicals and metals (Christopoulos et al. 2019), credit risk and financial distress have been examined. Pharmaceutical companies, despite their affiliation with the chemical industry, are treated as organizations with unique economic characteristics and are excluded from the analysis (Christopoulos et al. 2019). As a result, it is self-evident that they should be studied as a separate industry.
The aim of this article is to develop a two-stage modeling framework that uses DEA-bootstrapped operating efficiency and effectiveness performance metrics to evaluate the performance (i.e., operating efficiency and effectiveness) of a sample of fifty-two Greek pharmaceutical firms, which can be considered representative of this industry. The operating efficiency is used to judge management, while the effectiveness assesses the firm performance’s long-term viability (Tsolas 2015). As the firms’ performance metrics are proved to be unrelated, a bootstrapped DEA-based synthetic indicator is developed. The firms are divided into risk clusters using a hierarchical cluster analysis based on bootstrapped-DEA based operating efficiency and effectiveness and their aggregate synthetic indicator.
The remainder of this paper is organized as follows: a review of the literature on DEA applications in credit risk and bankruptcy prediction is presented in Section 2. The conceptual framework, the methods and the data set are described in Section 3. The results are summarized and discussed in Section 4. Section 5 concludes the paper.
2. Literature Review
DEA as a performance evaluation tool is deemed superior to other competing methods such as ratio analysis, multi-criteria evaluation methods, and statistical–econometric methods (Balcerzak et al. 2017). Emrouznejad and Yang (2018) provide a recent thorough review on DEA and its applications. DEA as a top–down comparative efficiency approach is typically used to evaluate firms within the industry (Tsolas 2015), whereas in the financial sector (i.e., banking), there is the ability to evaluate banks within the sector or bank branches within the bank (Musa et al. 2020).
Traditional statistical approaches for predicting credit ratings, such as multiple regression analysis and multiple discriminant analysis, as well as probit and logit models, compete with DEA and rely on assumptions such as linearity, normality, and independence between predictor and input variables (Chi et al. 2011). The standard approach for applying these techniques is to divide the data set into two subsamples, one for model estimation and the other for prediction. The logistic regression (LR) has been shown in a number of studies to provide accurate classification within a sample, but out-of-sample prediction is bad. There is also evidence that the DEA outperforms the LR in predicting financially distressed firms, while the LR outperforms the model in predicting healthy companies (Premachandra et al. 2011).
Artificial intelligence methods such as neural networks may produce satisfactory results, but determining proper model parameters and network topologies requires more modeling skills (Zhang et al. 2016). Furthermore, although financial factors contained in a corporation’s financial statements can represent certain characteristics of a corporation from various perspectives, operating inefficiency is also recognized as a key contributor to a corporation’s operation risk, but it is typically excluded from statistical-based models. As a result, these statistical methods may have limitations. For a recent review of statistical approaches, the reader is referred to Mousavi et al. (2015).
Performance in terms of operating efficiency, which represents the status of a corporation’s management, is regarded as a deciding factor influencing credit rating (Chi et al. 2011). DEA may assess a company’s efficiency for credit rating purposes by integrating multiple inputs and outputs (Chi et al. 2011) as well as identifying sequential phases of its internal structure (Tsolas 2015). Together with DEA, multi-attribute decision-making (MADM) approaches form a class of versatile techniques capable of considering several potentially contradictory financial or non-financial criteria. Determining the weights of attributes is an important part of MADM problems. Using DEA as an analytical tool, the weights can be determined (Dahooie et al. 2021). It should be noted that, unlike other multi-criteria performance evaluation methodologies, DEA benchmarks against the best rather than the average behavior (Mousavi et al. 2015).
DEA has seen numerous methodological advancements as well as a significant number of applications in the credit risk and bankruptcy prediction fields since its inception (Mousavi et al. 2015). DEA has the following specific features that make it an outstanding credit and bankruptcy assessment tool as compared to statistical approaches (Premachandra et al. 2011). First, DEA does not need a priori assumptions about the relationship between inputs and outputs. Second, DEA looks at each firm separately, producing individual output (efficiency) scores that are compared to the industry (i.e., sample of firms). Mis-specification is a common issue in regression analysis, but not with DEA models, which establish a best-practice frontier based on peer comparisons within the industry. Third, unlike statistical methods, DEA does not require a broad sample size.
In the credit risk field, DEA has been used as a credit scoring tool (Troutt et al. 1996; Emel et al. 2003; Iazzolino et al. 2013; Bruni et al. 2014; Tsolas 2015; Dahooie et al. 2021). In the field of bankruptcy prediction, the DEA has been used to classify firms into healthy and unhealthy groups (Paradi et al. 2004; Premachandra et al. 2009, 2011; Shetty et al. 2012), as well as to derive efficiency scores for use in statistical and stochastic modeling and prediction frameworks (Xu and Wang 2009; Yeh et al. 2010; Psillaki et al. 2010; Li et al. 2014, 2017). In the literature of bankruptcy and distress prediction, the latter strand of application of DEA is known as two-stage modelling, in which a DEA model estimates firm efficiency in the first stage, and then uses the estimated metric to create a distress prediction model in the second stage.
Troutt et al. (1996) suggested using DEA to address the problem of credit applicant selection. Emel et al. (2003) used a DEA-based credit scoring approach also including other methods such as factor, regression, and discriminant analysis. According to Iazzolino et al. (2013), DEA efficiency can be used as an early warning index for determining firm credit risk. Bruni et al. (2014) built on Emel et al.’s (2003) work by revisiting the use of the DEA as a scoring tool. Tsolas (2015) employed a series two-stage DEA model integrated with hierarchical clustering to classify a group of Greek basic materials industry firms into credit risk classes. Recently, Dahooie et al. (2021) combined DEA with dynamic multi-attribute decision-making for credit performance evaluation.
Paradi et al. (2004) proposed a layered worst-practice DEA model, in which sequential layers of performance are defined. Premachandra et al. (2009) compared the DEA’s ability to evaluate corporate bankruptcy to that of LR and according to their findings, DEA outperforms LR. Pendharkar (2011) created a classification DEA neural network. Shetty et al. (2012) used DEA to calculate the probability of bankruptcy for sample firms.
Xu and Wang (2009) used the firm’s DEA-based efficiency and some selected financial ratios in prediction methods. Yeh et al. (2010) used DEA efficiency scores to forecast business failure by combining DEA, rough sets, and support vector machines. Psillaki et al. (2010) investigated whether DEA-based inefficiency is an important ex-ante predictor of business failure. Li et al. (2014) combined DEA with LR to predict the distress of Chinese firms. Li et al. (2017) used dynamic DEA (i.e., DEA-based Malmquist index) in distress prediction.
With the exception of Tsolas’s (2015) work, all of the DEA-reviewed studies in the credit risk field adopt the conventional one-stage DEA structure, which ignores the internal activity of firms (i.e., decision-making units (DMUs) in the DEA context). The series two-stage DEA approach is used in the current study. The two-stage DEA modeling (Mousavi et al. 2019) mentioned above is entirely different from the series two-stage approach.
This study makes a two-fold contribution. First, in contrast to previous DEA credit risk assessment studies, this one focuses on a series two-stage DEA bootstrapped approach to derive operating efficiency and effectiveness performance metrics and a synthetic indicator of them. Second, since DEA, as a relative assessment tool, does not completely rank a firm in relation to all other sample firms, bootstrap is used to overcome the uncertainty and provide a complete ranking.
By integrating DEA and bootstrap, the current study improves on Tsolas (2015). The use of bootstrap tackles the existence of efficiency ties that characterize DEA rating estimates derived from traditional radial DEA models, as well as the ambiguity surrounding them. Furthermore, bootstrap is used in combination with DEA to create a synthetic measure of aggregate performance. The aggregate performance scores are also validated by employing the cross-efficiency method (Sexton et al. 1986) that is also used to break the efficiency ties.
3. Methodological Framework—Data Set
3.1. Conceptual Framework
Performance measurement aims to quantify the efficiency and effectiveness of a firm’s operation. The efficiency and effectiveness of a firm’s operations are considered as two performance dimensions, and DEA can be used to derive appropriate metrics to measure them: a firm is (operating) efficient if it achieves high levels of production in terms of sales without using unnecessary financial resources, and is effective to the degree to which it generates earnings and cash (Tsolas 2015). Firms can use their assets with varying levels of managerial expertise, which is reflected in technical efficiency (Farrell 1957). On the one hand, the degree to which managers use financial resources efficiently is a direct concern of firm management. On the other hand, the effectiveness with which management generates earnings and cash is of great interest (Tsolas 2015).
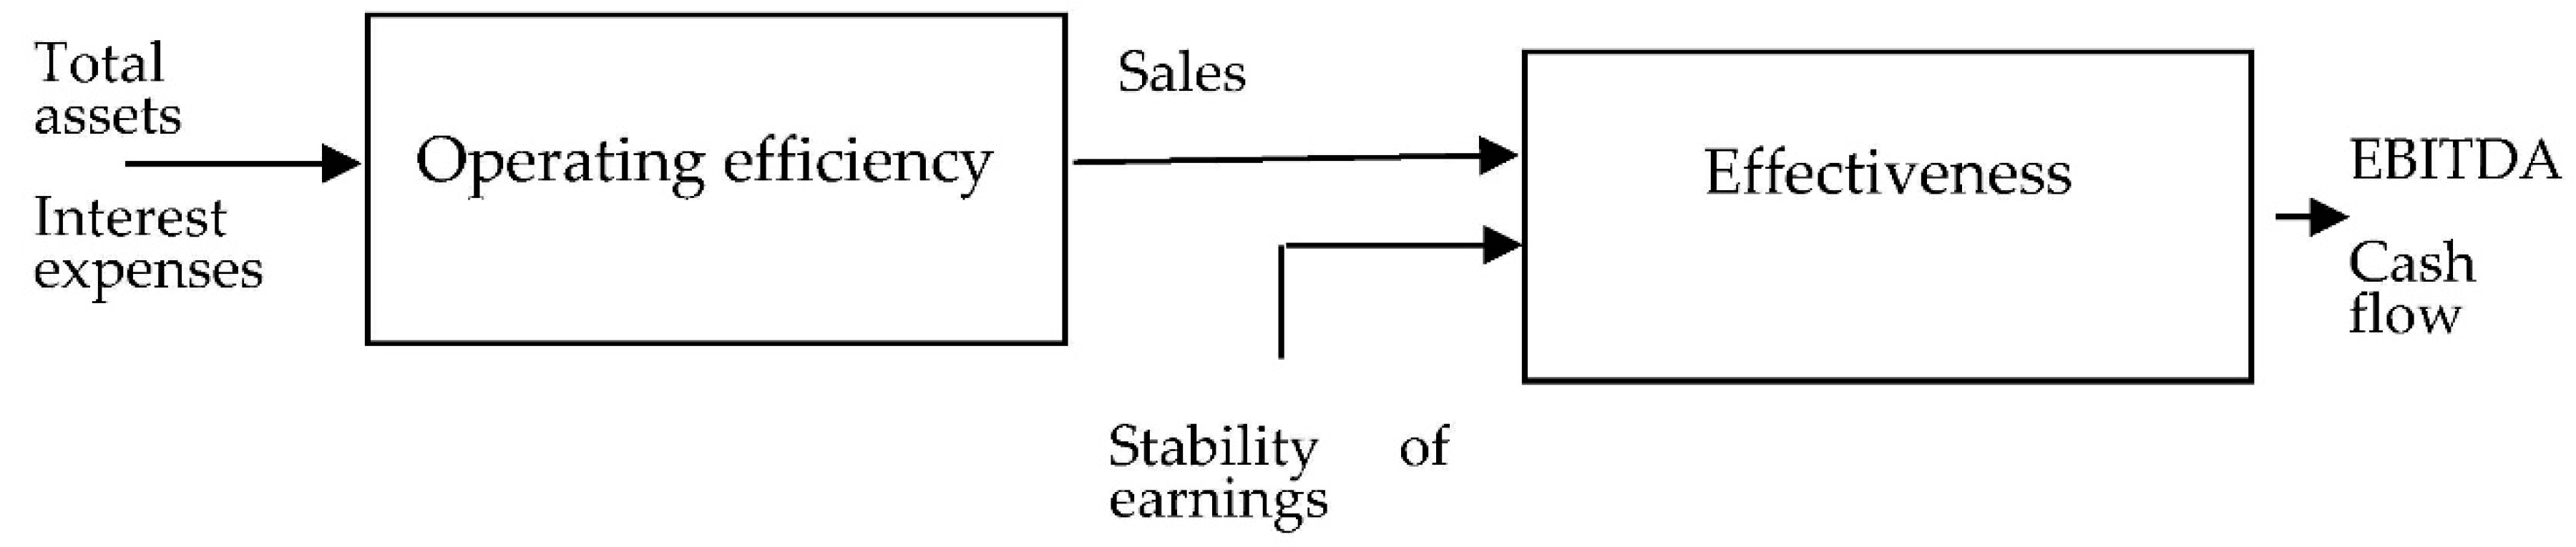
The independent approach (Koronakos 2019) for the DEA assessments is used (i.e., each stage is handled separately), and thus the performance of each stage (operating efficiency, effectiveness) is measured separately. In stage 1, a DEA performance metric for measuring firm performance in terms of operating efficiency is used. That is, a company is considered efficient in achieving its goals if it generates monetary results (total revenue or sales) with the least amount of total assets and interest expenses. The objective of stage 2 is to measure DEA-based effectiveness and success at this level can be interpreted as a company’s earnings and cash flow generation compared to sales and stability of (net) earnings. In stage 2, the sales (i.e., the output of stage 1) together with stability of earnings are treated as inputs where earnings before interest, taxes, depreciation, and amortization (EBITDA) and cash flow are the outputs. This two-stage structure, i.e., operating efficiency (stage 1) and effectiveness (stage 2), is illustrated in Figure 1. The selected variables are discussed in detail in Section 3.3.
While it is assumed that higher operational efficiency leads to higher effectiveness, if the two performance metrics are found to be unrelated, a synthetic measure of performance can be derived employing DEA, which uses objective weights.
3.2. Model Building
3.2.1. DEA Modeling
The DEA model selection, the validity of the model specification, and the model orientation are the key modeling issues to address when using DEA. In terms of model orientation, efficiency is calculated using either input minimization or output maximization. Input-oriented models estimate the maximum possible reduction in inputs for a given level of outputs, while output-oriented models estimate the maximum possible increase in outputs for a given level of inputs.
As the sample used here includes firms of different sizes, the BCC model (Banker et al. 1984) was chosen to account for scale effects. It is worth noting that when choosing a DEA model, the signs of the input and output data should be taken into account, since in the effectiveness evaluation (stage 2), negative output values are possible. The BCC input-oriented model, which is translation invariant with respect to outputs, was chosen for both performance dimensions.
Assuming a sample of n firms, j = 1,…, n using inputs X ∈ ℜm+ to generate outputs Y ∈ ℜrk+, the envelopment form of BCC variable returns to scale input-oriented Model (1) (Cooper et al. 2007) is used to evaluate firm operating efficiency and effectiveness:
where is the ith input (i = 1, 2, …, m) used by the jth firm (j = 1, 2, …, n); is the rth output (r = 1, 2, …, k) produced by the jth firm; denotes the efficiency score of firm “0”; “0” stands for the firm that is being evaluated; and is an intensity variable which indicates the contribution of firm j in the calculation of efficiency of firm “0”.
DEA calculates efficiency by estimating an empirical production function that represents the highest values of outputs that relevant inputs could produce, as determined by observed input and output vectors for the firms under consideration. The aim of Model (1)’s objective function is to find a minimum value for a factor , which indicates the possibility of a proportional decrease in all of firm “0”’s inputs. The model’s constraints reflect the envelopment principle: the input vector for firm “0” is enveloped when the model finds a combination of other input vectors whose values are lower than or equal to all of the elements of the vector of firm “0”. Firm “0” is efficient if the pair of its input and output vectors cannot be enveloped simultaneously by a combination of the rest sample firms. The set of efficient firms chosen for assessing firm “0” form a facet of the piecewise empirical production function. The constraint requires a convex combination of the observed efficient firms as the reference point on the empirical production function for firm “0”. The distance between the point representing the firm’s input and output values and the corresponding reference point on the empirical production function is used to measure the inefficiency of firms located below the frontier (Golany and Roll 1989). The model-solving procedure is repeated for each firm and firms with and are considered efficient and inefficient, respectively.
The efficient firms form the so-called efficient (i.e., best practice) frontier, which reflects an objective criterion of excellence (Mousavi et al. 2015). Any deviation from the frontier is presumed to be due to inefficiency in conventional DEA applications without accounting for the uncertainty surrounding DEA rating estimates. Uncertainty exists in DEA due to sampling variability or frontier estimation, which can lead to biased DEA (point) estimates and thus misleading conclusions. For assessing the sensitivity of measured efficiency scores to sampling variance and evaluating the robustness of DEA point estimates through confidence interval building (Simar and Wilson 1998, 2000a, 2000b), the bootstrap method (Efron 1982; Efron and Tibshirani 1993) was proposed.
For the derivation of operating efficiency, the inputs used are: total assets and interest expenses, while the only output is the sales. In order to derive effectiveness, the inputs are: sales and stability of earnings, while the outputs are: EBITDA and cash flow. Sales is a common variable in the estimation of operating efficiency and effectiveness; it is treated as an output for operating efficiency and as an input for effectiveness estimation.
It is also possible to derive a synthetic credit risk rating by means of a BCC output-oriented model using the produced operating efficiency and effectiveness ratings as outputs and one constant input (Tsolas 2015). This is necessary when the operating efficiency and effectiveness are not correlated. For this purpose, Model (2), with two outputs (i.e., the operating efficiency and effectiveness ratings) and one constant input, can be used:
where is the ith input used by the jth firm; is the rth output produced by the jth firm; is an intensity variable; and where denotes the aggregate performance indicator of firm “0”.
The less the aggregate performance indicator the better the performance is. The reciprocal of , , can be used to align the aggregate performance indicator with the greater the better principle that follows the efficiency score derived from Model (1).
It can be proved (Liu et al. 2011) that the multiplier output-oriented BCC model with two outputs and one input that is equal to unity for all firms (i.e., the dual of Model (2)) turns to Model (3):
where are the output weights estimated by the model; is the rth output produced by the jth firm; and is the aggregate performance indicator of firm “0” calculated as the weighted sum of operating efficiency and effectiveness. The less the aggregate performance indicator, the better the performance is.
The model aims to maximize the weighted sum of operating efficiency and effectiveness and the weights are derived objectively by the model in order to give the maximum score for firm “0”. The model-solving procedure is repeated for each firm.
3.2.2. Clustering Firms
The DEA modeling classifies firms based on their operating efficiency, effectiveness, and aggregate performance (synthetic indicator of operating efficiency and effectiveness). The use of bootstrapped DEA models breaks the expected efficiency ties (i.e., more than one firms appeared efficient with score equal to unity); see also Mousavi et al. (2015). The DEA bias-corrected performance metrics are used as inputs in a hierarchical cluster analysis to categorize firms into different clusters based on their credit risk level. The higher the efficiency, the lower the credit risk level is.
3.3. Data Set
For the purposes of this study, fifty-two pharmaceutical companies are evaluated. The sample firms represent the 28% of the total firms for which financial statement data were available from 2015 to 2017. The limited percentage of selected firms is due to data unavailability on all variables used in the current analysis. The selected firms are considered homogeneous and can therefore be assessed by means of DEA in terms of their performance.
The aim of the current study is to assess not only the operating efficiency of the sample firms, but also their effectiveness. As a result, two sets of inputs and outputs are required, one for each stage (i.e., operating efficiency, effectiveness). To explain the variables used in the analysis (Figure 1) previous DEA studies on credit risk are referred. In stage 1, the total assets and interest expenses are used as inputs whereas sales is the only output (Paradi et al. 2004). In stage 2, the inputs are: sales and stability of earnings (Paradi et al. 2004), calculated as the standard deviation (Betts and Belhoul 1987) of net earnings before taxes, whereas the outputs are (Paradi et al. 2004; Iazzolino et al. 2013): EBITDA and cash flow, which is calculated as net income plus depreciation (Iazzolino et al. 2013). Except for the stability of earnings, which is measured as the standard deviation of net earnings before taxes over the 2015–2017 period, all variables apply to 2017. Table 1 depicts the descriptive statistics for the variables used.
4. Results
Table 2 shows the DEA point and bias-corrected estimates, and the estimated 95 percent confidence bounds. Two thousand bootstrap replications were used to generate the results.
According to the results of the Model (1), 10 (roughly 19%) of the sample firms are relatively efficient; mean operating efficiency: 0.57. The median operating efficiency is around 0.51. Furthermore, by lowering existing input levels by 43% (=1–0.57) while maintaining the same output level, the operating performance can be improved. The bootstrap results increase the model’s discriminating power since the BCC point estimates tend to be biased upwards. As all firms are inefficient, bootstrap estimates show that there is room for improvement in operating efficiency by reducing inputs by about 51% (mean operating efficiency: 0.49). The bias-corrected operating efficiency has a median of approximately 46%. The mean lower and upper bounds of the 95 percent confidence interval for bias-corrected operating efficiency are 0.40 and 0.57, respectively, implying that firms could reduce their inputs by 43% to 60% on average. The findings show that the DEA-bootstrapped model corrects for efficiency score bias, making it more robust than the conventional DEA model in calculating sample firm operating efficiency scores.
The sample firms’ mean operating efficiency is close to that stated by Liu and Lyu (2020) for the Chinese pharmaceutical industry, with a mean variable returns to scale efficiency of 0.54. However, You et al. (2010) found that Korean pharmaceutical firms have a mean technical efficiency of 0.88 and American pharmaceutical firms have a mean technical efficiency of 0.89. Furthermore, when compared to Korean and American pharmaceutical companies, there is a greater disparity in efficiency levels among Greek pharmaceutical companies.
In regard to effectiveness, the Model (1) results indicate that five (about 10 percent) of the sample firms are relatively effective; mean effectiveness: 0.30. The median effectiveness is around 0.19. The effectiveness can be improved by decreasing the current input level by 70% (=1–0.30) while maintaining the same output level. As all firms are ineffective, there is room for improvement by reducing inputs by 79 percent, according to bootstrap estimates (mean operating efficiency: 0.21). The bias-corrected effectiveness has a median of approximately 14%. The lower and upper bounds of the 95 percent confidence interval for bias-corrected effectiveness are 0.17 and 0.29, respectively, meaning that firms could reduce their inputs by 71% to 83% on average.
The correlation analysis revealed no evidence of a positive relationship between firm operating efficiency and effectiveness. Operating efficiency and effectiveness are two separate indicators of performance, according to the findings of this study. The sample firms seem to be more operationally efficient (bias-corrected efficiency: 0.49) than effective (bias-corrected efficiency: 0.21). Furthermore, despite the fact that high operating efficiency is supposed to lead to higher effectiveness, there was no clear trend in the relationship between the two. These conclusions are consistent with Tsolas’ (2015) findings in the sectors of basic resources and chemicals.
Operating effectiveness and efficiency are aggregated using the output-oriented variable returns to scale DEA Model (2) combined with bootstrap. The cross-efficiency method, as defined in Appendix A, is also used to validate the use of the model. The BCC model’s firm assessment is focused on self-evaluation using its optimal weights, while cross-efficiency is based on peer-evaluation using weights obtained by evaluating each of the sample firms.
When compared to the mean efficiency (point and bootstrapped) estimates provided by Model (2), the mean cross-efficiency is significantly lower (Table 3). The ranking of firms does not indicate significant variations in aggregate performance because Spearman’s rank correlation coefficient between the bootstrapped and cross efficiency estimates is 0.95; the vast majority of firms that are worst in aggregate performance remain the same.
The sample firms are clustered into three classes using hierarchical cluster analysis by means of Ward’s (1963) approach to define trends at a more detailed level (Table 4). The bias-corrected DEA metric of each stage and the bias-corrected aggregated performance are used to perform the analysis. The first cluster consists of 19 firms (37 percent of the total sample) that have better aggregate performance scores ranging from 0.64 to 1 (mean performance score: 0.94). These companies can be classified as having a low credit risk. The second cluster consists of 17 firms (33 percent of the total sample) with aggregate performance scores ranging from 0.40 to 0.74 (mean performance score: 0.52), indicating that certain changes are needed to improve their position. The third cluster consists of 16 companies (30% of the total sample) with an average output of 0.19 to 0.50 (mean performance score: 0.32). These firms may be categorized as having a high credit risk.
5. Conclusions
The current research describes a series two-stage DEA bootstrapped modeling approach for evaluating the credit risk of Greek pharmaceutical firms in terms of operating efficiency and effectiveness. Financial statement-based information is used in the series two-stage bootstrapped DEA modeling framework employed in this research, and the derived metrics are: operating efficiency, effectiveness, and their aggregate synthetic indicator.
The key problem with the sampled firms’ performance is a lack of effectiveness rather than operating efficiency. In other words, a firm’s financial space, rather than its operational space, determines its performance. Operating efficiency does not appear to be linked to effectiveness, implying that there is no correlation between the firm’s operational (cost-oriented) and financial (profit-oriented) results. As a result, a bootstrapped DEA-based aggregate performance indicator is built to be used as an input to hierarchical clustering to separate sample firms into credit risk clusters, along with the other performance metrics. The aggregate performance scores are also validated by using the cross-efficiency method. The sample firms are divided into three risk clusters using a hierarchical cluster analysis based on bootstrapped-DEA-based operating efficiency and effectiveness and a synthetic performance indicator.
There are some drawbacks to the current research. The availability of the data required for the analysis is a serious issue, and missing data points in a firm’s inputs or outputs result in its exclusion from the analysis and, as a result, a reduction in the sample size. Furthermore, since DEA can only calculate relative efficiency, it is impossible to equate firm efficiencies to an absolute theoretical efficiency value. Thus, the results and findings are sample-specific. Moreover, since DEA scores are calculated with complete weight versatility, a firm with an extreme weighting scheme can be classified as having the best performance. As a consequence, the study’s findings should be viewed alongside some main financial performance metrics.
The research design presented here supports not only Greek pharmaceutical companies, but also companies from other countries, due to its general nature. Managers and potential investors can find the DEA metrics developed here useful, and they can also be used as supplementary tools in credit rating models. Firm managers may use the derived performance metrics to set their own goals and pursue changes across the two performance dimensions. Furthermore, while the current study relies on static DEA models, future research could rely on dynamic analysis, which would take into account firms’ dynamic data as well as their credit evolution history.
Funding
This research received no external funding.
Institutional Review Board Statement
Not applicable.
Informed Consent Statement
Not applicable.
Data Availability Statement
The data presented in this study are available on request from the author.
Conflicts of Interest
The author declares no conflict of interest.
Appendix A
Let be the optimal solution of Model (3) for firm “d”. Then, is the BCC (self-evaluated) performance score of firm “d”.
The BCC peer-evaluated performance of a given firm j using the profile of weights provided by firm d is obtained as (see also Cooper et al. (2011)):
The BCC cross-performance score () of firm j is defined as the average (see also Cooper et al. (2011)):
For the output-orientation, the less the cross-performance score the better the performance. As cross-efficiency the reciprocal of is used in this study.
References
- Balcerzak, Adam P., Tomas Kliestik, Dalia Streimikiene, and Luboš Smrčka. 2017. Non-parametric approach to measuring the efficiency of banking sectors in European Union countries. Acta Polytechnica Hungarica 14: 51–70. [Google Scholar]
- Banker, Rajiv D., Abraham Charnes, and William W. Cooper. 1984. Some models for estimating technical and scale inefficiencies in Data Envelopment Analysis. Management Science 30: 1078–92. [Google Scholar] [CrossRef] [Green Version]
- Betts, James, and Djamal Belhoul. 1987. The effectiveness of incorporating stability measures in company failure models. Journal of Business Finance & Accounting 14: 323–34. [Google Scholar]
- Bruni, Maria Elena, Patrizia Beraldi, and Gianpaolo Iazzolino. 2014. Lending decisions under uncertainty: A DEA approach. International Journal of Production Research 52: 766–75. [Google Scholar] [CrossRef]
- Çelik, Şaban. 2013. Micro credit risk metrics: A comprehensive review. Intelligent Systems in Accounting, Finance and Management 20: 233–72. [Google Scholar] [CrossRef]
- Charnes, Abraham, William W. Cooper, and Edwardo Rhodes. 1978. Measuring the efficiency of decision making units. European Journal of Operational Research 2: 429–44. [Google Scholar] [CrossRef]
- Chi, Der-Jang, Ching-Chiang Yeh, and Ming-Cheng Lai. 2011. A hybrid approach of DEA, rough set theory and random forests for credit rating. International Journal of Innovative Computing, Information and Control 7: 4885–97. [Google Scholar]
- Christopoulos, Apostolos G., Ioannis G. Dokas, Petros Kalantonis, and Theodora Koukkou. 2019. Investigation of financial distress with a dynamic logit based on the linkage between liquidity and profitability status of listed firms. Journal of the Operational Research Society 70: 1817–29. [Google Scholar] [CrossRef]
- Cooper, William W., Lawrence M. Seiford, and Kaoru Tone. 2007. Data Envelopment Analysis: A Comprehensive Text with Models, Applications, References and DEA-Solver Software. New York: Springer Science+Business Media, Inc. [Google Scholar]
- Cooper, William W., José L. Ruiz, and Inmaculada Sirvent. 2011. Choices and uses of DEA weights. In Handbook on Data Envelopment Analysis, 2nd ed. International Series in Operations Research & Management Science; Edited by William W. Cooper, Lawrence M. Seiford and Joe Zhu. New York: Springer Science+Business Media, Inc., pp. 93–126. [Google Scholar]
- Dahooie, Jalil H., Seyed Hossein Razavi Hajiagha, Shima Farazmehr, Edmundas K. Zavadskas, and Jurgita Antucheviciene. 2021. A novel dynamic credit risk evaluation method using data envelopment analysis with common weights and combination of multi-attribute decision-making. Computers and Operations Research 129: 105223. [Google Scholar] [CrossRef]
- Doumpos, Michael, and Constantin Zopounidis. 2007. Model combination for credit risk assessment: A stacked generalization approach. Annals of Operations Research 151: 289–306. [Google Scholar] [CrossRef]
- Efron, Brandley. 1982. The Jackknife, the Bootstrap, and Other Resampling Plans. Philadelphia: Society for Industrial and Applied Mathematics Philadelphia. [Google Scholar]
- Efron, Brandley, and Robert J. Tibshirani. 1993. An Introduction to the Bootstrap. New York: Chapman & Hall. [Google Scholar]
- Emel, Ahmet B., Muhittin Oral, Arnold Reisman, and Reha Yolalan. 2003. A credit scoring approach for the commercial banking sector. Socio-Economic Planning Sciences 37: 103–23. [Google Scholar] [CrossRef]
- Emrouznejad, Ali, and Guo-liang Yang. 2018. A survey and analysis of the first 40 years of scholarly literature in DEA: 1978–2016. Socio-Economic Planning Sciences 61: 4–8. [Google Scholar] [CrossRef]
- Farrell, Michael J. 1957. The Measurement of Productive Efficiency. Journal of the Royal Statistical Society, Series A (General) 120: 253–81. [Google Scholar] [CrossRef]
- Golany, Boaz, and Yaakov Roll. 1989. An application procedure for DEA. Omega 17: 237–50. [Google Scholar] [CrossRef]
- Iazzolino, Gianpaolo, Maria Elena Bruni, and Patrizia Beraldi. 2013. Using DEA and financial ratings for credit risk evaluation: An empirical analysis. Applied Economics Letters 20: 1310–17. [Google Scholar] [CrossRef]
- Koronakos, Gregory. 2019. A taxonomy and review of the network data envelopment analysis literature. In Machine Learning Paradigms. Learning and Analytics in Intelligent Systems. Edited by George A. Tsihrintzis, Maria Virvou, Evangelos Sakkopoulos and Lakhmi C. Jain. Cham: Springer, vol. 1, pp. 255–311. [Google Scholar]
- Kounnou, Vasiliki, and Dimitrios Kyrkilis. 2020. Competitiveness, profitability and R/D intensity: The case of the domestic pharmaceutical industry in Greece. In Business Performance and Financial Institutions in Europe. Business Models and Value Creation across European Industries. Edited by Alexandra Horobet, Persefoni Polychronidou and Anastasios Karasavvoglou. Cham: Springer Nature Switzerland AG, pp. 47–55. [Google Scholar]
- Li, Zhiyong, Jonathan Crook, and Galina Andreeva. 2014. Chinese companies distress prediction: An application of data envelopment analysis. Journal of the Operational Research Society 65: 466–79. [Google Scholar] [CrossRef] [Green Version]
- Li, Zhiyong, Jonathan Crook, and Galina Andreeva. 2017. Dynamic prediction of financial distress using Malmquist DEA. Expert Systems with Applications 80: 94–106. [Google Scholar] [CrossRef] [Green Version]
- Liu, Zhongmin, and Jia Lyu. 2020. Measuring the innovation efficiency of the Chinese pharmaceutical industry based on a dynamic network DEA model. Applied Economics Letters 27: 35–40. [Google Scholar] [CrossRef]
- Liu, Wenbin, Daqun Zhang, Wei Meng, Xuan Li, and Fang Xu. 2011. A study of DEA models without explicit inputs. Omega 39: 472–80. [Google Scholar] [CrossRef]
- Mousavi, Mohammad M., Jamal Ouenniche, and Bing Xu. 2015. Performance evaluation of bankruptcy prediction models: An orientation-free super-efficiency DEA-based framework. International Review of Financial Analysis 42: 64–75. [Google Scholar] [CrossRef] [Green Version]
- Mousavi, Mohammad M., Jamal Ouenniche, and Kaoru Tone. 2019. A comparative analysis of two-stage distress prediction models. Expert Systems with Applications 119: 322–41. [Google Scholar] [CrossRef] [Green Version]
- Musa, Hussam, Viacheslav Natorin, Zdenka Musova, and Pavol Durana. 2020. Comparison of the efficiency measurement of the conventional and Islamic banks. Oeconomia Copernicana 11: 29–58. [Google Scholar] [CrossRef] [Green Version]
- Paradi, Joseph C., Mette Asmild, and Paul C. Simak. 2004. Using DEA and worst practice DEA in credit risk evaluation. Journal of Productivity Analysis 21: 153–65. [Google Scholar] [CrossRef]
- Pendharkar, Parag C. 2011. A hybrid radial basis function and data envelopment analysis neural network for classification. Computers and Operations Research 38: 256–66. [Google Scholar] [CrossRef]
- Premachandra, Inguruwatt M., Gurmeet S. Bhabra, and Toshiyuki Sueyoshi. 2009. DEA as a tool for bankruptcy assessment: A comparative study with logistic regression technique. European Journal of Operational Research 193: 412–24. [Google Scholar] [CrossRef]
- Premachandra, Inguruwatt M., Yao Chen, and John Watson. 2011. DEA as a tool for predicting corporate failure and success: A case of bankruptcy assessment. Omega 39: 620–26. [Google Scholar] [CrossRef]
- Psillaki, Maria, Ioannis E. Tsolas, and Dimitris Margaritis. 2010. Evaluation of credit risk based on firm performance. European Journal of Operational Research 201: 873–81. [Google Scholar] [CrossRef]
- Sexton, Thomas R., Richard H. Silkman, and Andrew J. Hogan. 1986. Data Envelopment Analysis: Critique and Extensions. In Measuring Efficiency: An Assessment of Data Envelopment Analysis. New Directions for Program Evaluation. Edited by Richard H. Silkman. San Francisco: Jossey-Bass, pp. 73–105. [Google Scholar]
- Shetty, Udaya, T. P. M. Pakkala, and Thathaiah Mallikarjunappa. 2012. A modified directional distance formulation of DEA to assess bankruptcy: An application to IT/ITES companies in India. Expert Systems with Applications 39: 1988–97. [Google Scholar] [CrossRef]
- Shuai, Jia-Jane, and Han-Lin Li. 2005. Using rough set and worst practice DEA in business failure prediction. In Rough Sets, Fuzzy Sets, Data Mining, and Granular Computing. Berlin and Heidelberg: Springer, pp. 503–10. [Google Scholar]
- Simar, Leopold, and Paul W. Wilson. 1998. Sensitivity analysis of efficiency scores: How to bootstrap in nonparametric frontier models. Management Science 44: 49–61. [Google Scholar] [CrossRef] [Green Version]
- Simar, Leopold, and Paul W. Wilson. 2000a. A general methodology for bootstrapping in nonparametric frontier models. Journal of Applied Statistics 27: 779–802. [Google Scholar] [CrossRef]
- Simar, Leopold, and Paul W. Wilson. 2000b. Statistical inference in nonparametric frontier models: The state of the art. Journal of Productivity Analysis 13: 49–78. [Google Scholar] [CrossRef]
- Troutt, Marvin D., Arun Rai, and Aimao Zhang. 1996. The potential use of DEA for credit applicant acceptance systems. Computers and Operations Research 23: 405–8. [Google Scholar] [CrossRef]
- Tsolas, Ioannis E. 2015. Firm credit risk evaluation: A series two-stage DEA modeling framework. Annals of Operations Research 233: 483–500. [Google Scholar] [CrossRef]
- Ward, Joe. H., Jr. 1963. Hierarchical grouping to optimize an objective function. Journal of American Statistical Association 58: 236–44. [Google Scholar] [CrossRef]
- Xu, Xiaoyan, and Yu Wang. 2009. Financial failure prediction using efficiency as a predictor. Expert Systems with Applications 36: 366–73. [Google Scholar] [CrossRef]
- Yeh, Ching-Chiang, Der-Jang Chi, and Der-Jang Hsu. 2010. A hybrid approach of DEA, rough set and support vector machines for business failure prediction. Expert Systems with Application 37: 1535–41. [Google Scholar] [CrossRef]
- You, Taewoo, Xiaoying Chen, and Mark E. Holder. 2010. Efficiency and its determinants in pharmaceutical industries: Ownership, R&D and scale economy. Applied Economics 42: 2217–41. [Google Scholar]
- Zhang, Faming, Pandu R. Tadikamalla, and Jennifer Shang. 2016. Corporate credit-risk evaluation system: Integrating explicit and implicit financial performances. International Journal of Production Economics 177: 77–100. [Google Scholar] [CrossRef]
Figure 1.
Credit risk series two-stage data envelopment analysis (DEA) approach.


Table 1.
Greek pharmaceutical firms: descriptive statistics.
| Descriptive Statistics | Total Assets * | Interest Expenses * | Sales * | Earnings Persistence * | EBITDA * | Cash Flow * |
|---|---|---|---|---|---|---|
| Mean | 44,568.86 | 615.29 | 35,739.91 | 1390.42 | 11,317.38 | 12,100.82 |
| Standard deviation | 67,804.84 | 1004.18 | 55,862.22 | 2310.35 | 7445.45 | 7460.18 |
| Median | 10,855.45 | 33.50 | 5839.36 | 372.43 | 8532.92 | 9506.21 |
| Min | 8.35 | 0.01 | 3.99 | 4.22 | 800.50 | 287.95 |
| Max | 265,894.12 | 4413.65 | 240,677.89 | 12,219.45 | 52,345.35 | 49,697.72 |
* 000 Euros.
Table 2.
Descriptive statistics of firm efficiency measures for operating efficiency and effectiveness.
Table 2.
Descriptive statistics of firm efficiency measures for operating efficiency and effectiveness.
| Sub-Process Efficiency | Operating Efficiency | Effectiveness | ||||||
|---|---|---|---|---|---|---|---|---|
| Point/Bootstrapped Estimates | Point Estimates | Bootstrapped Estimates | Point Estimates | Bootstrapped Estimates | ||||
| DEA Estimates | DEA Point Estimates | DEA Bias-Corrected | DEA-LB | DEA-UB | DEA Point Estimates | DEA Bias-Corrected | DEA-LB | DEA-UB |
| Mean | 0.5662 | 0.4854 | 0.4021 | 0.5652 | 0.2952 | 0.2116 | 0.1670 | 0.2940 |
| Standard deviation | 0.2695 | 0.2050 | 0.1680 | 0.2689 | 0.2963 | 0.1976 | 0.1596 | 0.2949 |
| Median | 0.5055 | 0.4608 | 0.3817 | 0.5045 | 0.1925 | 0.1435 | 0.1116 | 0.1918 |
| Min | 0.1911 | 0.1615 | 0.1280 | 0.1907 | 0.0006 | 0.0005 | 0.0004 | 0.0006 |
| Max | 1.0000 | 0.9306 | 0.7936 | 0.9984 | 1.0000 | 0.7395 | 0.5717 | 0.9958 |
LB: lower bound; UB: upper bound.
Table 3.
Descriptive statistics of firm synthetic performance indicator (DEA point, bias-corrected and cross efficiency estimates).
Table 3.
Descriptive statistics of firm synthetic performance indicator (DEA point, bias-corrected and cross efficiency estimates).
| Descriptive Statistics | Point Estimates * | Bootstrapped Estimates * | Cross Efficiency Estimares ** |
|---|---|---|---|
| Mean | 0.6053 | 0.6085 | 0.5037 |
| Standard deviation | 0.2809 | 0.2820 | 0.2277 |
| Median | 0.5307 | 0.5313 | 0.4469 |
| Min | 0.1911 | 0.1906 | 0.1646 |
| Max | 1.0000 | 0.9985 | 1.0000 |
* Estimated by Model (2); ** estimated by Equation (A2) (Appendix A).
Table 4.
Hierarchical cluster analysis. Descriptive statistics of firm synthetic performance indicator (DEA bias-corrected estimates).
Table 4.
Hierarchical cluster analysis. Descriptive statistics of firm synthetic performance indicator (DEA bias-corrected estimates).
| Descriptive Statistics/Classes | Class I | Class II | Class III |
|---|---|---|---|
| Mean | 0.9364 | 0.5183 | 0.3151 |
| Standard deviation | 0.1180 | 0.0857 | 0.0922 |
| Median | 0.9962 | 0.5144 | 0.3092 |
| Min | 0.6378 | 0.4001 | 0.1906 |
| Max | 0.9985 | 0.7434 | 0.4995 |
Publisher’s Note: MDPI stays neutral with regard to jurisdictional claims in published maps and institutional affiliations. |
© 2021 by the author. Licensee MDPI, Basel, Switzerland. This article is an open access article distributed under the terms and conditions of the Creative Commons Attribution (CC BY) license (https://creativecommons.org/licenses/by/4.0/).
Share and Cite
MDPI and ACS Style
Tsolas, I.E. Firm Credit Scoring: A Series Two-Stage DEA Bootstrapped Approach. J. Risk Financial Manag. 2021, 14, 214. https://0-doi-org.brum.beds.ac.uk/10.3390/jrfm14050214
AMA Style
Tsolas IE. Firm Credit Scoring: A Series Two-Stage DEA Bootstrapped Approach. Journal of Risk and Financial Management. 2021; 14(5):214. https://0-doi-org.brum.beds.ac.uk/10.3390/jrfm14050214
Chicago/Turabian StyleTsolas, Ioannis E. 2021. "Firm Credit Scoring: A Series Two-Stage DEA Bootstrapped Approach" Journal of Risk and Financial Management 14, no. 5: 214. https://0-doi-org.brum.beds.ac.uk/10.3390/jrfm14050214