
Benchmarking—A Way of Finding Risk Factors in Business Performance

Faculty of Management, University of Prešov, Konštantínova 16, 080 01 Prešov, Slovakia
*
Author to whom correspondence should be addressed.
J. Risk Financial Manag. 2021, 14(5), 221; https://0-doi-org.brum.beds.ac.uk/10.3390/jrfm14050221
Submission received: 9 April 2021
/
Revised: 6 May 2021
/
Accepted: 11 May 2021
/
Published: 14 May 2021
(This article belongs to the Special Issue Risk and Financial Consequences)
Abstract
:The purpose of this study was to emphasize that the Data Envelopment Analysis (DEA) method is an important benchmarking tool which provides necessary information for improving business performance. To fulfil the abovementioned goal, we used a sample of 48 Slovak companies involved in the field of heat supply. As their position in the economic and social environment of the country is essential, considerable attention should be paid to improving their performance. In addition to the DEA method, we applied the Best Value Method (BVM). We found that DEA is a highly important benchmarking tool, as it provides benchmarks for units that have problems with performance and helps us to reveal risk performance factors. The DEA method also allows us to determine target values of indicators. The originality of this paper is in its comparison of the results of the BVM and the DEA methods.
1. Introduction
In the current turbulent period, it is necessary for every company to monitor market changes, not only in the areas of marketing and innovation, but also in the field of business performance and the application of financial indicators in its measurement. Businesses are looking for different ways to increase their performance and achieve a competitive advantage over their competitors. Therefore, they use different methods, techniques and indicators. One of the methods than can be applied in this area is benchmarking. Benchmarking finds the best practices for knowledge and know-how by learning from other companies, competitors and industry leaders to gain a competitive advantage in global competition (Tian and Ketsaraporn 2013).
Benchmarking is part of the concept of quality management. It is a method of analyzing and comparing practices and experiences in various areas of business operations (Kaczmarska 2010). This method was first used in the 1980s by the Xerox Corporation to improve its competitive position (Demjanová 2006). According to Veber (2000), benchmarking is based on two principles. The first is the principle of the Chinese general Sun-c (500 BC): “If you know the enemy and know yourself, you need not fear the result of a hundred battles.” The second principle is being the best of the best.
The purpose of benchmarking is to be inspired by the best competitors (best practices). This, however, does not imply imitation. This is also confirmed by one of the definitions of benchmarking by R. C. Camp as “finding best practices in business that lead to excellent results” (Kiseľáková and Šofranková 2014). Benchmarking is currently one of the most widely used management tools, and it is applied in order to increase business performance (Bogetoft 2012). Benchmarking includes the benchmarking of products and services, business processes and performance measures (Maleyeff 2003).
Based on the above, we set the research problem and aim of the paper. The research problem is the following: Which benchmarking method is able to identify performance risk factors? The aim of the paper considers how to improve businesses’ performances by applying selected benchmarking methods.
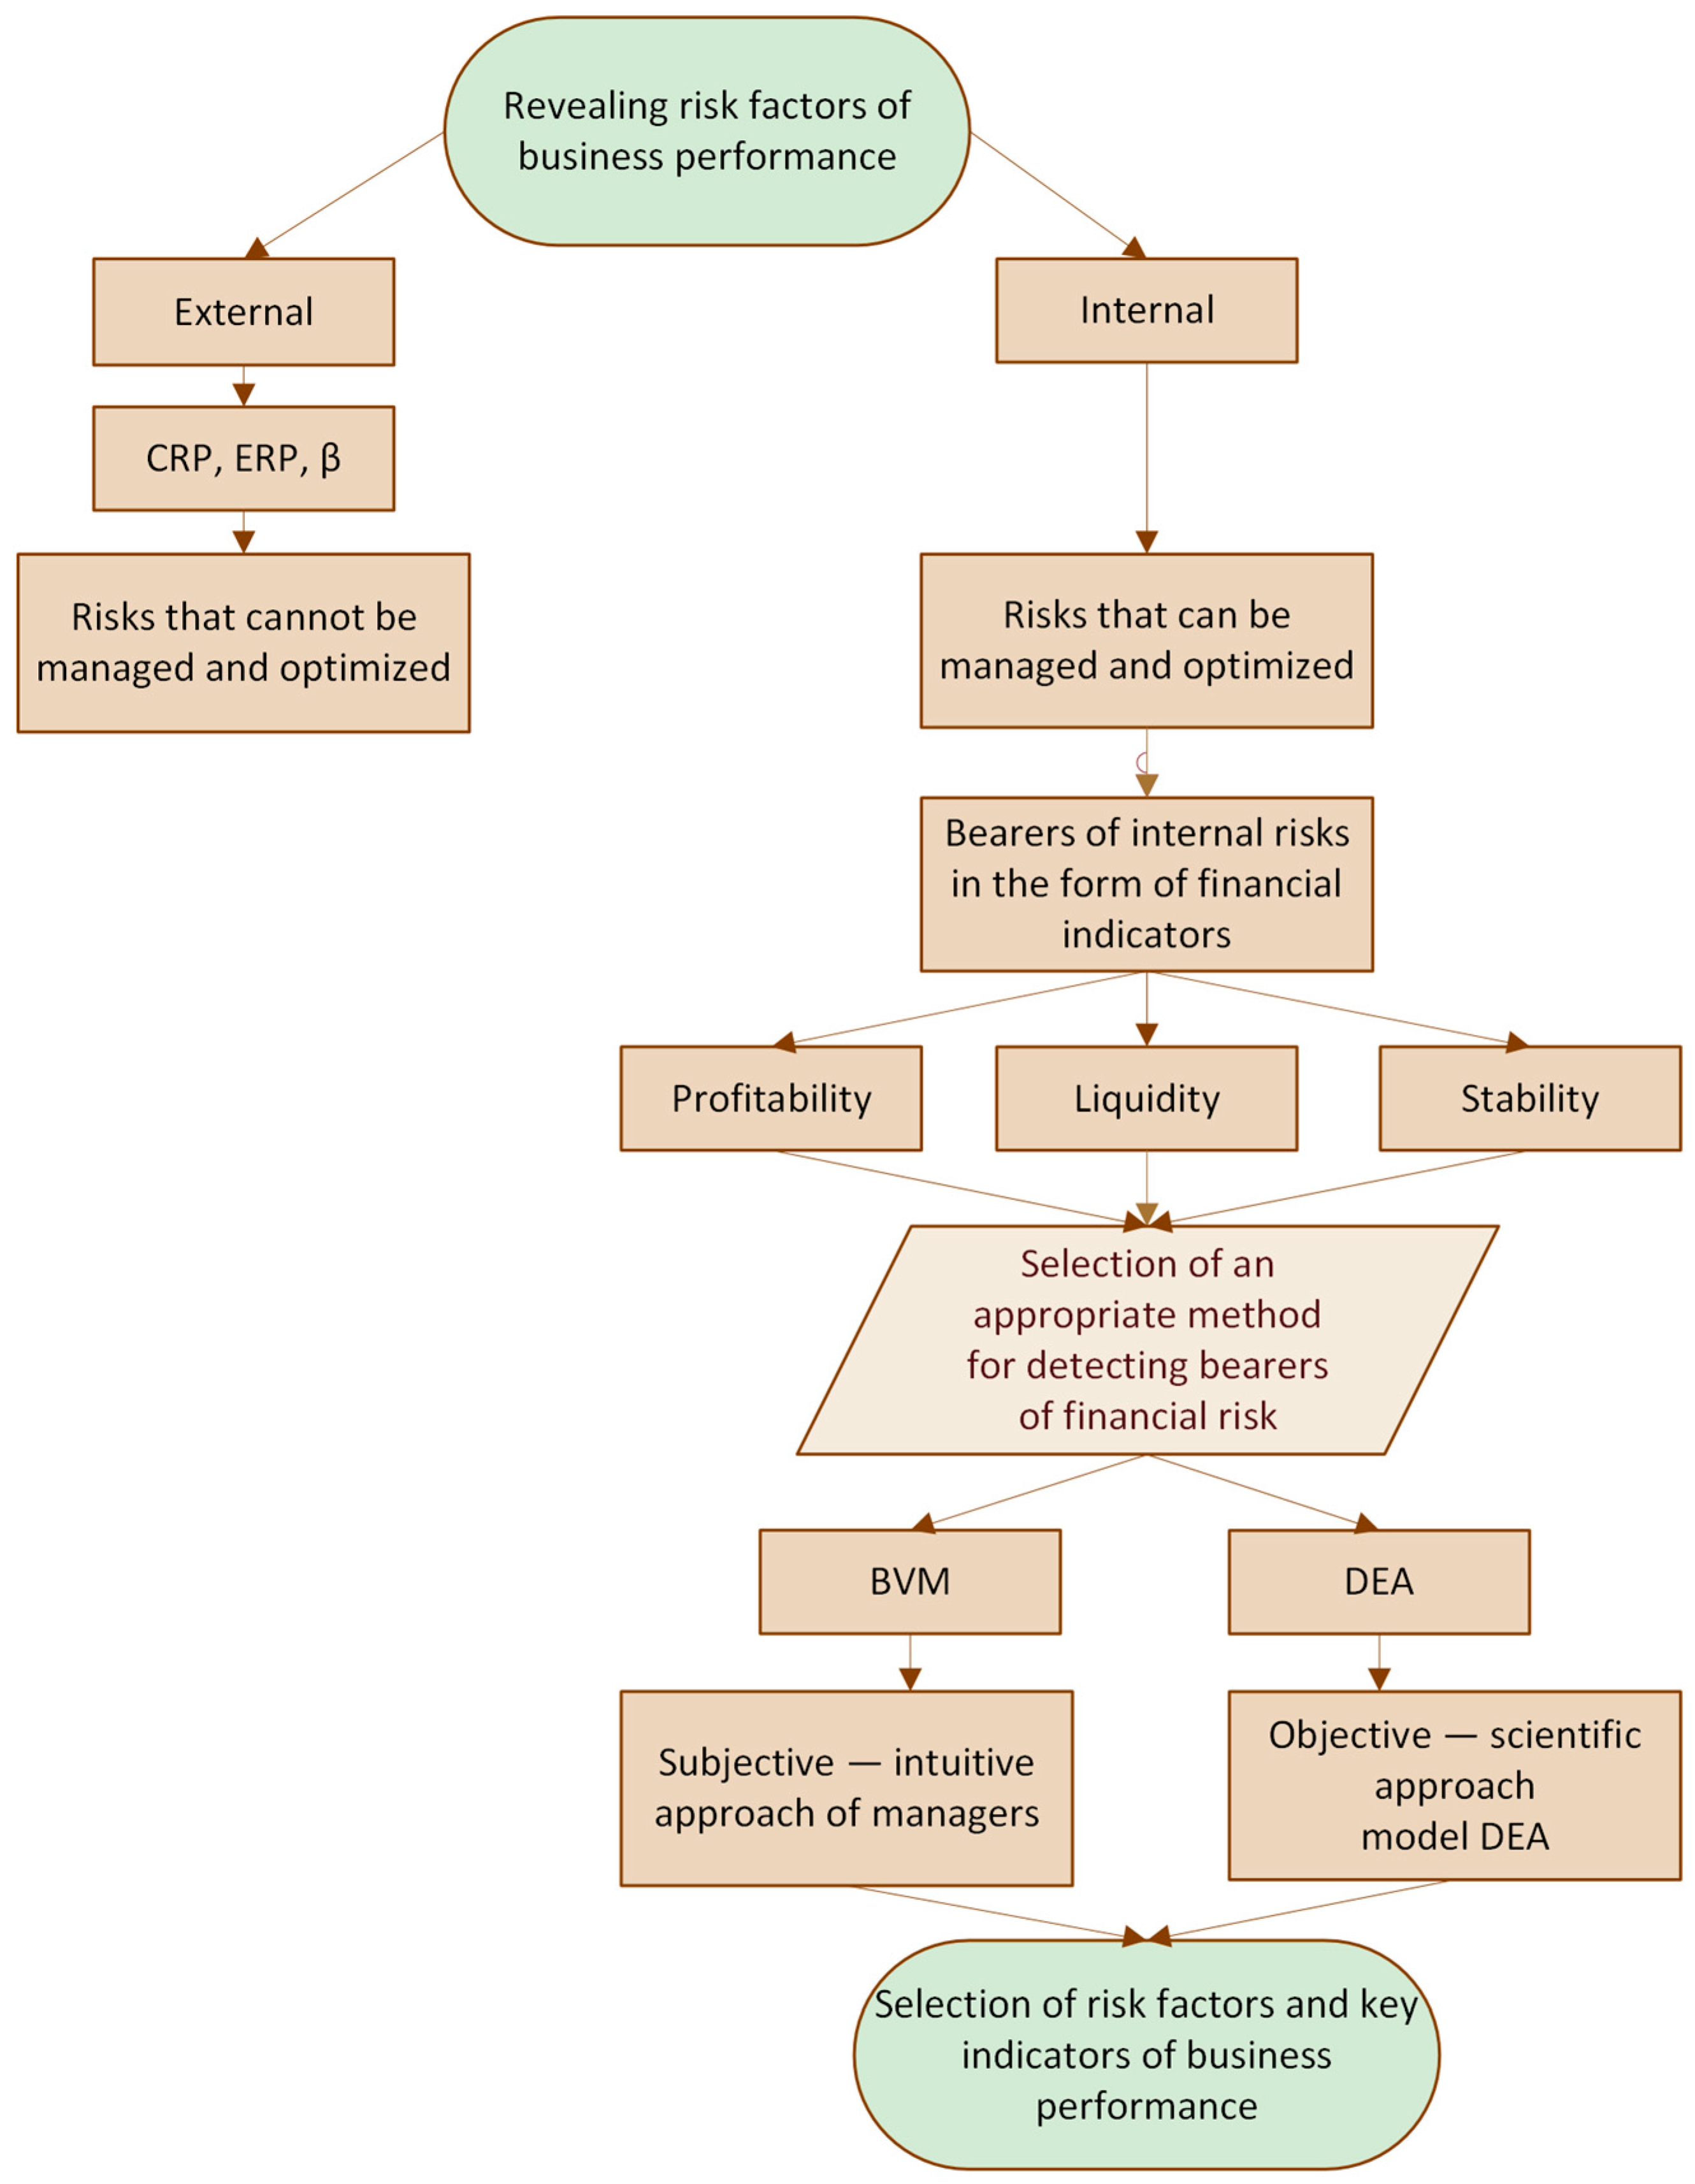
The next part of the text is structured as follows: The first section outlines the theoretical basis of benchmarking, performance benchmarking, performance benchmarking tools and performance risk factors. The second section describes the research sample and the methodology. The research problem and research questions are formulated in this part of the paper. When addressing the research problem, we made use of selected financial indicators, the BVM, the DEA and the Spearman’s rank correlation coefficient. The third section includes results and a discussion of the results achieved. This section lists scores and rankings of companies obtained by the BVM and the DEA. The strength and association between rankings are determined by Spearman’s rank correlation coefficient. A special part of this section is devoted to the calculation of target values—benchmarks for improving businesses’ performances. The final part of the paper is the conclusion, which provides recommendations for improving business performance and the benefits of the DEA in terms of performance improvement. The process of the research is illustrated in Figure 1.
2. Literature Review
Benchmarking studies can be divided according to the type of benchmarking into: process, functional and performance benchmarking studies (Nenadál et al. 2011). A similar classification is given by (Fong et al. 1998 in Anand and Kodali 2008), who divide benchmarking according to its content into process, functional, performance and strategic benchmarking. As part of our research, we focused on solving the issue of performance benchmarking, with the aim of increasing the performance of businesses.
Performance benchmarking is used by an organization to determine its market position compared to the performance characteristics of other organizations. To maintain ethical rules in the commercial environment, it is appropriate to use a third party for this type of benchmarking. It is the most common type and will probably be the starting point for any procedures aiming at the overall operation of an organization (Pogranová et al. 2011).
Performance benchmarking is a combination of two methodologies: benchmarking and performance management. According to Camp (1995, p. 16), the aim of benchmarking performance measures is to set and validate goals for several vital performance measures which guide an organization. Benchmarking is imperative for performance (Krishnamoorthy and D’Lima 2014). Many organizations include benchmarking as a component of their performance management system (Maleyeff 2003).
Benchmarking is also an important tool for identifying key performance indicators (Ho et al. 2000). Well-known key performance indicators are related to financial analysis (Bogetoft 2012). If we, during a performance measurement, find out which key financial indicators are lagging behind our competitors, it is advantageous for us to improve their values while preventing other indicators from creating an imbalance. Conversely, if we find out in which aspects we are significantly better than our competitors, and this indicator does not have a negative impact on other financial objectives, we can present this as a competitive advantage. Benchmarking is not only a measurement tool but a process of identifying gaps in performance, while the elimination of gaps and continuous improvement can bring the company closer to its competitors (Zairi and Leonard 1996).
When comparing businesses’ performances, it is possible to apply different indicators (Štefko et al. 2012). Bogetoft (2012) states ROA, gross margin, debt ratio and price/book (stock capitalization/book values) are important performance indicators. According to Štefko et al. (2021), these measures include selected indicators of liquidity, profitability, capital structure and activity. According to Wood and McConney (2018), important performance indicators include, for example, return on assets (ROA), return on equity (ROE), return on capital employed (ROCE) and net interest margin (NIM). Additionally, according to Bărbută-Misu et al. (2019), the most used performance measures include ROA and ROE, but they mention also liquidity, leverage, productivity, solvency and assets turnover. One of the modern benchmarking models of enterprise performance evaluation is the Creditworthy Model (CWM), which is the most suitable model for the comparison of financial performance between two or more enterprises (Kiseľáková et al. 2018).
The selection of indicators must be based on the definition of performance. Business performance is understood by most authors as the ability of a business to value the investment invested in its business activities in the best way (Johnson and Kevan 2000). Therefore, the most commonly used performance measurement indicators are financial indicators based on the primary objective of business—to maximize profits. We talk about financial indicators (profitability, liquidity, indebtedness, activity and market value), but new indicators are being added, such as EVA (economic value added), MVA (market value added), CVA (cash value added), WACC (weighted average costs of capital), RONA (return on net assets) and the like (Neumaierová and Neumaier 2002; Ittner et al. 2003; Frost 2005; Šulák and Vacík 2005; Petřík 2009; Kislingerová et al. 2011).
Accounting measures of performance have been the traditional mainstay of quantitative approaches to organizational performance measurement. However, over the past two decades, a great deal of attention has been paid to the development and use of non-financial measures (customer loyalty, customer satisfaction, capacity utilization and prevention of heat losses, renewal of production facilities, employee satisfaction, employee qualification, water protection, waste reduction, employee environmental awareness) of performance (Neely 2002; Otley 1999).
When solving the given problem, various methods from the area of performance benchmarking were applied in individual studies. For example, in the gas industry, the following methods were applied: Agrell and Bogetoft (2007) estimated the efficiency of gas distribution in Germany by applying a method of the Ordinary least squares, the Stochastic frontier analysis and the DEA; Rossi (2001) estimated the efficiency of the gas distribution sector in Argentina, and he used the Stochastic frontier and Malmquist index; Farsi et al. (2007) estimated the economic efficiency of the gas distribution sector in Switzerland by applying SFA; Erbetta and Rappuoli (2003) estimated the optimal scale and technical efficiency of the Italian gas distribution industry with the use of the DEA (Goncharuk 2008).
Significant methods that can be applied in the field of evaluation, and improvements in business performance include multidimensional benchmarking analyses based on the measurement of a number of criteria. These methods include, e.g., network charts, AHP maturity index and Z charts (Vochozka et al. 2017). Multidimensional methods also include the BVM method. It is possible to mention the following studies of authors who applied the BVM method in the field of performance benchmarking. Magd and Curry (2003) focused on the application of this method in the public sector. The Best Practice methodology was also applied in an article by Asrofah et al. (2010), in terms of increasing the efficiency of the manufacturing industry. The interconnection of DEA and BVM methods was realized in an article by the authors Yang et al. (2013), who, using the given methods, searched for winners in the field of supply and provided for their needs. A more detailed description of the BVM method is given in the section Data and Methodology.
An effort in the application of benchmarking methods in business performance improvement has been to develop benchmarking models that are able to perform multidimensional measurement (Vochozka et al. 2017). Benchmarking can be seen as a process of determining valid measurements for comparing the performance of comparable units in order to determine their relative positions and thus set the standard for highest quality. In this regard, the DEA method can be considered as a multidimensional benchmarking tool. This quantitative analysis method for evaluating the relative efficiency of a set of comparable, homogenous decision-making units (DMUs) has been often used as a practical benchmarking tool in management (An et al. 2021). The foundations of the DEA method were laid by Farrell (1957). At that time, this researcher thought methods such as measuring labor productivity or capital productivity were restrictive, as they did not cover the possibility of combining multiple input measurements, and were thus insufficient for expressing the overall efficiency of the company. These shortcomings have resulted in a more relevant approach applicable to any company, leading to a broader concept of productivity and a more general concept of efficiency. He was inspired by the work of Vilfred Paret, who, in his welfare theory, considered, in addition to increases and decreases, their importance, and assigned them some weights—this principle is now known as the Pareto criterion. Farrell is considered to be the father of the DEA, as DEA is based on the principles of linear programming. The basic task of DEA models is to compare DMUs within a group of units with the same or similar units. The definition of DMU is relatively flexible. DMU is the entity responsible for converting inputs to outputs, the effectiveness of which needs to be evaluated (Cooper et al. 2007; Cooper et al. 2011; Hatami-Marbini 2019; Ruiz and Sirvent 2019).
Klieštik (2009) explains that input-oriented approaches measure efficiency based on input variables and, in order to improve efficiency, a company should reduce the volume of inputs. Opposite these are output-oriented approaches that recommend increasing outputs to improve efficiency. Another criterion for the breakdown of DEA models is the return on scale. Constant returns to scale (CRS) occur when a 1% increase in input yields a 1% increase in output (CCR models). Variable returns to scale (VRS) occur when output increases by 1% or output changes by less than or more than 1% (BCC models).
The disadvantage of CCR and BCC models, the need to choose whether we are input or output oriented, has been overcome by the SBM model (Slack-Based Measure) by Tone (2001). The model works well for complicated tasks where it is not possible to determine whether a DMU should minimize inputs or maximize outputs; therefore, it is necessary to combine these requirements (Zimková 2015).
Measuring business efficiency using DEA models also has various advantages and disadvantages. The advantages, according to Majorová (2007) and Klieštik (2009), include working with multiple inputs and outputs at the same time, not requiring the normality of data distribution and quick identification of inefficient companies (companies below the efficiency limit), a comparison of such companies with efficient companies or objective measuring.
Another advantage of the DEA method is that it provides a more scientific basis for setting goals, and thus allows inefficient firms to find the easiest way to improve their performance. In 2008, Goncharuk applied three DEA models, as well as other performance benchmarking tools, to increase efficiency and effectiveness in the gas industry. The DEA method was used as a benchmarking method by Ruiz and Sirvent (2019), who applied it to improve business performance. Using the DEA for benchmarking ensures an evaluation in terms of targets that are attainable. Determining benchmarking information through closest efficient targets is one of the relevant topics in the recent DEA literature (Aparicio et al. 2014).
The above was confirmed also by Cooper et al. 2004, in Shewell and Migiro 2016, who state that studies of benchmarking practices using DEA have shown inefficiencies in some of the most profitable firms; therefore, DEA has been found to provide a better vehicle for establishing benchmarks than using profitability as a criterion. The DEA method was also used as a benchmarking method by Deville (2009), who compared branches and regional banks of a large French banking group. He applied DEA in the area of operational performance and, as a comparative variable, used the DEA score.
The benefits of the DEA method are also described in the work of Díaz et al. (2004). According to these authors, the DEA method can be used to assess and compare quantitative efficiencies and the weighting of any performance indicator, permitting managers to obtain a well-defined performance ranking.
The disadvantages of the DEA method include inefficiency deviations, which may be due to statistical distortion and a non-parametric approach that make it difficult to test hypotheses about inefficiency and the structure of the production function. DEA is non-statistical method; therefore, it does not yield estimates that can be easily validated with conventional statistical procedures (Banker 1990; Färe et al. 2001). Other disadvantages of the method concern its sensitivity to outliers (Coelli et al. 1998) and the fact that the method deals with relative efficiency (Farantos 2015). Another disadvantage of the DEA method is the sensitivity of its results to the selection of inputs and outputs, so their relative importance needs to be analyzed prior to the calculation. However, there is no way to test the appropriateness of inputs and outputs. Additionally, the number of DMUs on the frontier tends to increase with the number of inputs and outputs entering the model (Berg 2010; Zbranek 2013).
3. Data and Methodology
The research aimed at improving performance with the use of benchmarking methods was carried out on a sample of 48 Slovak companies in the field of heat supply. Companies in this sector use local district heating systems. Their sources and distribution of heat were built together with the development of urban agglomerations. Systems of these companies enable the efficient use of various energy sources produced in the city, including renewables, waste heat, etc. These systems are integrators of energy infrastructure, which can effectively link production and consumption and allow the storage of energy (in the form of heat) in times of surplus (Janiš 2018). The structure of these systems is provided by the climate and segmentation of the territory, historical development, demographic conditions, regional structure, the nature of residential, commercial and industrial construction, economic activity and the availability of fuel sources for heating (Antimonopoly Office of the Slovak Republic 2013). The analyzed industry is important from an economic as well as a social point of view, and plays an important role in the daily life of society and consumers. In this industry, a larger number of companies go bankrupt every year when compared to other Slovak industries. These companies have an important position in many Slovak districts. They are not subsidiaries of the parent company, but they are independent entities. They do not have interconnected management and each company represents a separate unit. In the area of fixed indicators and legislation, these companies have regulated heat prices. They are used to protect risk groups of the population from existential problems. Low energy prices have a positive effect on inflation, as well as on business development. However, on the other hand, heat management companies, in many cases, cannot adjust their variable and fixed costs to the level of regulated prices. Other important regulated indicators are indicators of environmental policy and environmental protection—emission limits for pollutants in the air, emission limits for pollutants in the water, wastewater limits or limits for waste reduction. The analyzed companies are not able to pay the costs and meet limits; therefore, they go bankrupt. However, they could be beneficial for the state and its people, as they provide alternative options for heat production and heat supply. Since they have an important position in many Slovak districts, in this paper, we focused on the evaluation, comparison and improvement of the performance and competitiveness of these companies. The data from the financial statements for the year 2016 were obtained from the Slovak analytical agency CRIF—Slovak Credit Bureau, s.r.o (CRIF 2016). The comparison of performance and subsequently competitiveness of these companies was realized with the use of two benchmarking methods—the BVM and the DEA.
In our research, we focused on the following 9 financial indicators which have a significant impact on the basic financial objectives of these companies. These indicators are the following: current ratio (CL) (1), average collection period (ACP) (2), creditors payment period (CPP) (3), return on assets (ROA) (4), return on equity (ROE) (5), return on sales (ROS) (6), equity ratio (ER) (7), interest coverage (IC) (8) and cost ratio (CR) (9).
Table 1 lists descriptive statistics for the analyzed businesses. The median of the current ratio indicates that half of the analyzed sample of businesses achieves a value of liquidity higher than 0.93, which can be considered appropriate in relation to the characteristics of the industry. The analyzed businesses have high creditors payment periods, the median of which is 183 days. They also achieve good results in profitability indicators in terms of both median and average. The capital structure of these companies is, on average, 30%: 70% in favor of debt, which may be the reason for the lower stability of these companies. From the point of view of interest coverage, the analyzed businesses are able to pay interest. The median of the cost ratio is 0.66.
As we stated in the Introduction, the research problem is as follows: Which benchmarking method is able not only to evaluate but also to improve business performance? In line with the research problem, we asked these research questions:
- RQ1: What performance do individual companies achieve based on the BVM?
- RQ2: What performance do individual companies achieve based on the results of an input-oriented DEA?
- RQ3: What is the strength and direction of the association between the rankings achieved by the BVM and the DEA?
To analyze differences among businesses in space, we used a multidimensional map of objects, which uses an output of multidimensional scaling (MDS). Several authors (Rhee et al. 2009; Zema et al. 2020) used MDS as benchmarking technique. This map was also applied by Lukáčová et al. (2020) when analyzing and applying indicators in the field of tax harmonization and competitiveness. MDS allows us to test whether and how certain criteria by which one can distinguish among different objects of interest are mirrored in corresponding empirical differences of these objects (Borg and Groenen 1997). To express how well a data are represented by an MDS map, we applied Kruskal’s Stress, which is the most widely used goodness-of-fit statistic. Stress is calculated according to Formula (1) (Kruskal 1964):
where expresses the predicted distance between objects i and j, and dij is the actual distance between objects i and j.
The smaller the value of the Stress, the more the calculated and entered object coordinates fit. According to Kruskal (1964) Stress around 0.20 means insufficient overlap, while 0.10 is sufficient, 0.05 is good, 0.025 is excellent and 0.00 is a perfect fit. When applying MDS, an important task is to determine the total number of required dimensions. The goal is to keep the number of dimensions as small as possible (usually, we choose 2-dimensional; maximum is 3-dimensional space). The number of dimensions is chosen based on the lowest possible value of the Stress criterion.
To deal with the research problem, we applied two methods. Using the BVM method, we selected the companies that achieve the best values within the individual indicators. Subsequently, the sum of the final evaluation of individual indicators was processed to the final ranking of companies. The DEA method worked with an already created model, which processed all input values of indicators and created a ranking of companies in the field of performance, according to the achieved values of indicators.
In order to answer the research question 1 (RQ1), we used the benchmarking tool which we adopted from the product benchmarking methodology (Kovaľová and Nogová 2016; Vrábliková and Loučanová 2017). This method is used to determine innovative intention of a product, and consists of the following steps:
- Selection of subjects for comparison (48 companies operating in the heating industry);
- Selection of evaluation criteria (9 indicators);
- Determining the weight of the criteria by means of a paired comparison under the questionnaire survey (48 respondents—financial managers of surveyed companies). The weight of the criteria is determined as follows:
- ○
- Average significance: Øvi = 100/number of criteria;
- ○
- Significance coefficient: ki = frequency of occurrence (based on pairwise comparison);
- ○
- Average significance coefficient: Øki = ∑ki/number of criteria;
- ○
- Conversion using deviation: D = (ki − Øki) × d;
- ○
- Deviation: d = ∑vi/∑ki;
- ○
- Real significance: w = Øvi + D.
- the last phase is the BVM, which is based on the knowledge of the fair values of the benchmarking criteria and the real significance (w), resulting from the previous benchmarking steps. The tendency of the criterion (t) may increase or decrease depending on whether we want to maximize or minimize the criterion value. In order to identify the global benchmark, we proceed as follows:
- ○
- The actual values of the criteria (x);
- ○
- Transformed criterion values (a): if the criterion’s tendency increases: a = actual value/highest value; if the criterion’s tendency decreases: a = lowest value/actual value;
- ○
- Point values for individual criteria (b): b = a × w;
- ○
- Total score for the company (B): B = ∑b
- ○
- Ranking of businesses according to their score.
The aim of the second step (RQ2) was to measure the performance of companies with the application of the input-oriented DEA CCR model. To solve this problem, we chose a model that was built as a dual task of linear programming, which uses the same data as the multiplicative model but reduces the number of model constraints (Kočišová 2012). Klieštik (2009) also considers it more advantageous and practical to work with a model that is a dual-model to the primary CCR model. In this case, the dual model will have (m + s) constraints and (n + m + s + 1) variables. Let us denote λj, j = 1, 2, …, n, as dual variables belonging to the first set of constraints of the model, θo as scalar dual variable assigned to the next constraint and , k = 1, 2, …, s, and , i = 1, 2, …, m, as dual variables assigned to the lower limits for weights of outputs and inputs (slacks). A dual input-oriented CCR model can be written as follows (2):
Complementary variables are introduced in this model and (3):
Slacks indicate how far the unit (DMUo) is from the efficiency frontier. The variable expresses excessive input consumption and expresses the lack of outputs. The unit that is effective in the CCR model has a value of the objective function θo = 1, and values and (slacks) equal to zero in every optimal solution.
The DEA model also provides information on how the DMU has to change its behavior to become efficient. The DMU, which is a projection of an inefficient unit on the efficiency frontier, is called a peer-unit. The inputs and outputs of this unit are target values of inputs and target values of outputs , which can be calculated in two ways using optimal values of variables , , , and the following Formulas (4) and (5):
The aim of the final step (RQ3) was to measure the strength and direction of association between the results achieved in the case of the BVM and the input-oriented DEA model.
We used Spearman’s rank correlation coefficient to determine the correlation between the rankings of companies. We calculated the Spearman’s correlation coefficient according to relationship (6) (Štiglic 2009), as there were several identical orders in the database of companies:
where , , for each repeated value in the group X, Y is the number of repetitions deducted from the third power of the repetition in question, and the results are summed as , , number of repetitions in the group X (Y), , represents the number of repetition of the value , in the group X (Y).
For larger sets (n > 30), the probability distribution can be approximated by a t-distribution with (n − 2) degrees of freedom. Then, the test statistic for the Spearman coefficient has the form (7):
We use this random variable even if the groups X and Y feature several repeated values. The null hypothesis H0, which states that there is no statistically significant relationship at significance level α = 0.05, is rejected (we accept alternative hypothesis H1), assuming that (for one-sided test); (for two-sided test), ; is the critical value of Student’s t-distribution, with (n − 2) degrees of freedom. We chose the correlation coefficient based on the results of the normality tests and a two-dimensional point diagram with an ellipse of 95% constant probability density. This verification, as well as the calculations of test statistics and Spearman’s coefficient, were performed using software Statistica.
4. Results and Discussion
The starting point for assessing the performance of the analyzed sample of businesses was the calculation of nine financial indicators listed in Data and Methodology.
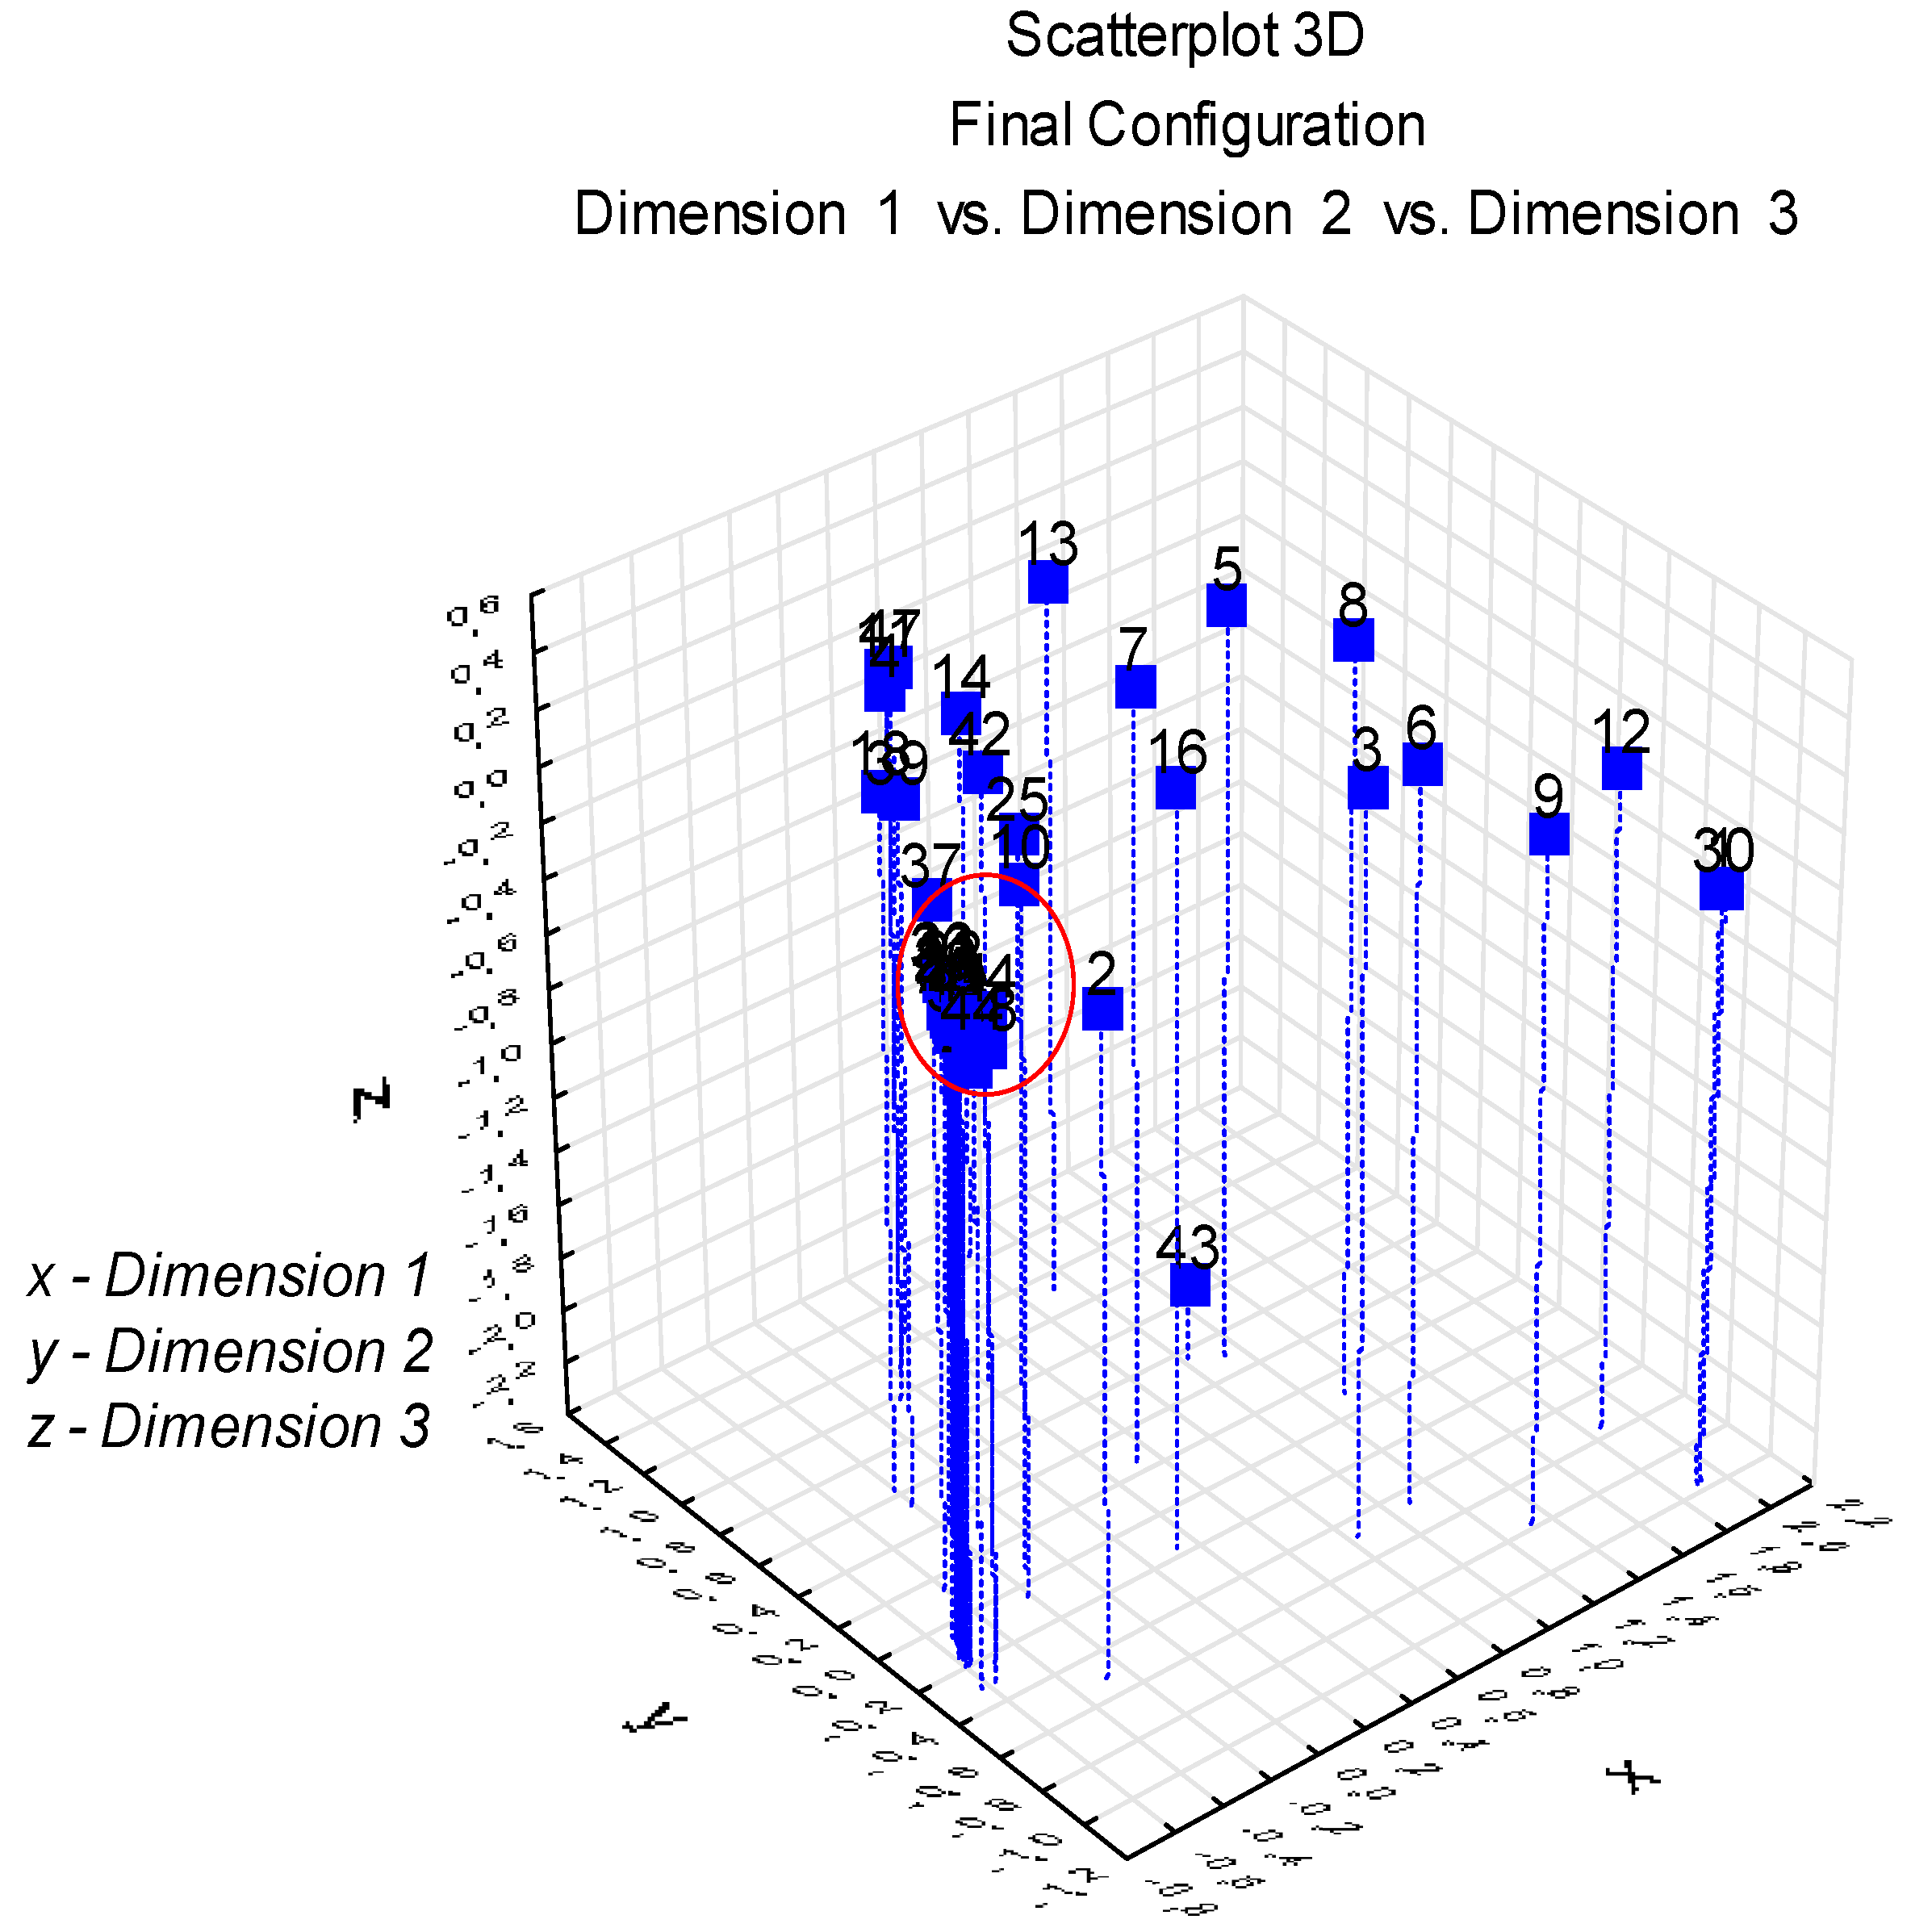
As the next step, we performed an initial analysis of businesses in space with the use of an MDS map (Figure 2). We were looking for an optimal MDS solution for analyzed sample of businesses with the use of software Statistica. We applied three dimensions, since MDS with four and five dimensions provided the same results. The number of dimensions was chosen based on Kruskal’s Stress. Value of Stress for the three-dimensional model achieved 0.003. Therefore, we can state that the fit of objects in the constructed MDS map is perfect. On the left side of Figure 2, we can see a cluster of businesses. The distances between these businesses and the values of their indicators are highly correlated. We can say that the distances represent the values of indicators well in a linear sense. The cluster marked in Figure 2 with a red circle is created by these businesses: 19, 20, 21, 22, 23, 26, 27, 28, 29, 31, 32, 33, 34, 35, 36, 38, 40, 41, 44, 45, 46, 48. They occur in the area of the negative values of dimension one and dimension two, but dimension three ranges from negative to positive values. These businesses have low liquidity, high indebtedness and are undercapitalized. According to the DEA, they achieved an efficiency score of 0.4–0.6. Business 48 is located near businesses 46, 40, 28, 35, 31 and 32; these businesses have a high creditors payment period, low interest coverage, insufficient liquidity and are undercapitalized. Business 43, which has a negative value of dimension three, is highly undercapitalized. Business 30 stands out from the cluster. It has a positive value in dimension one and negative values in dimensions two and three; the only indicator which achieved negative values is ROS. Business 13 has positive values in all dimensions, and all indicators achieve very good results. Business five also has positive values in all dimensions. It achieves a high average collection period and creditors payment period, but they are also balanced. Business two has negative values in dimensions one and two; it achieves a high creditors payment period and is undercapitalized.
Depending on the tendency of the indicator (increasing or decreasing), we applied the BVM, which represents the final stage of benchmarking. We first found local benchmarks (LB 1–9) for each criterion and then the global benchmark (GB), which is DMU1. DMU1 is also a local benchmark, as it reaches the best values in ROA (4) and interest coverage (8). Overall, DMU2 finished in second place, and is a local benchmark in profitability indicators ROE (5) and ROS (6). DMU44 achieved the best values in terms of current liquidity (1) and the creditors payment period (3), and ended up in fourth place overall. The score (B) of all 48 companies is shown in Table 2.
The results of input-oriented DEA (RQ2) shows that 12 companies achieved an efficiency score of “1” (DMU1, DMU2, DMU3, DMU6, DMU13, DMU19, DMU27, DMU30, DMU34, DMU43, DMU44 and DMU47). We can say that these companies use inputs efficiently, since they achieve zero slacks. The least efficient business is DMU36, which achieved a score of “0.23648”. This company achieves very low liquidity, at the level of 0.07, a high creditors payment period of 2941 days, an equity ratio of 12% and is highly undercapitalized. The overall score and ranking of the companies’ performances are shown in Table 3. The DEA model was processed in DEAFrontier (Zhu 2019).
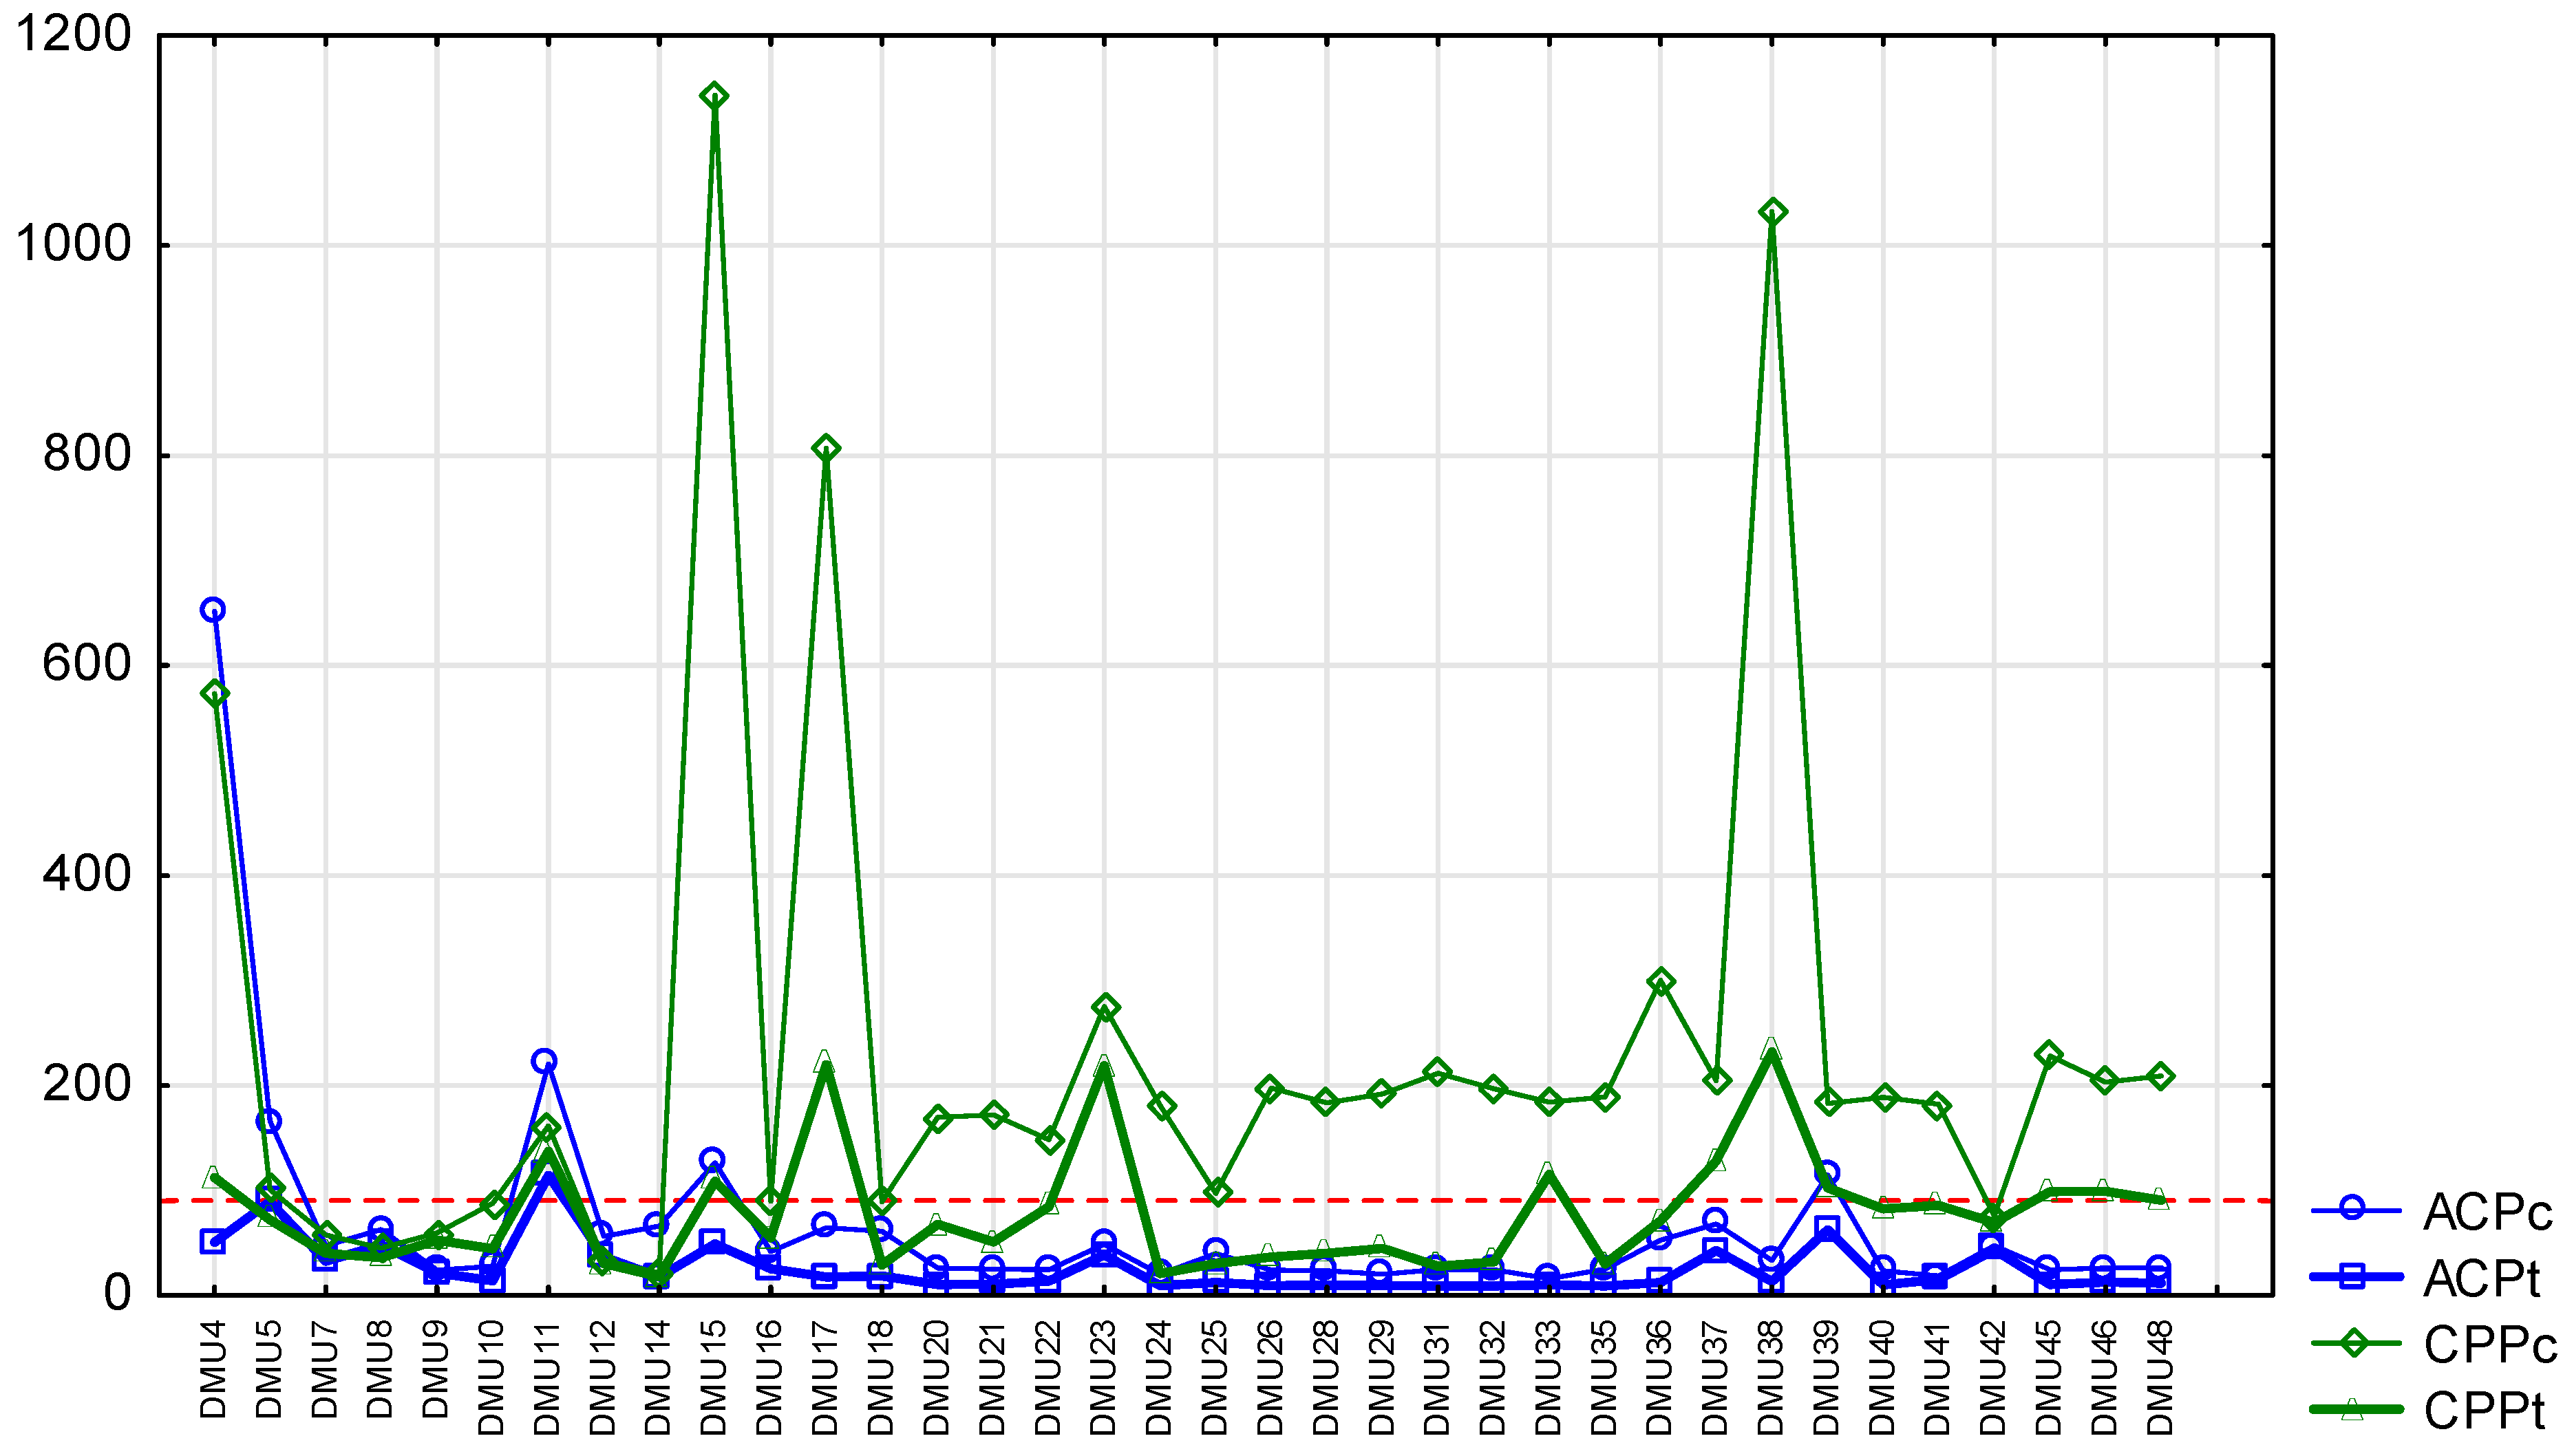
The DEA method allowed us to calculate target values-benchmarks for analyzed businesses, which were not efficient according to the DEA model. Since we used an input-oriented DEA model, we were able to calculate target values for inputs. Figure 3 shows current and target values of indicators ACP and CPP for inefficient businesses. The red line in the figure represents 90 days. Values of ACP and CPP above this line can be evaluated negatively. A majority of the businesses achieved current values of CPP above 90 days, and current values of ACP below 90 days. When calculating goal values, we can see a significant reduction in ACP and CPP. A majority of target values of these indicators are below 90 days.
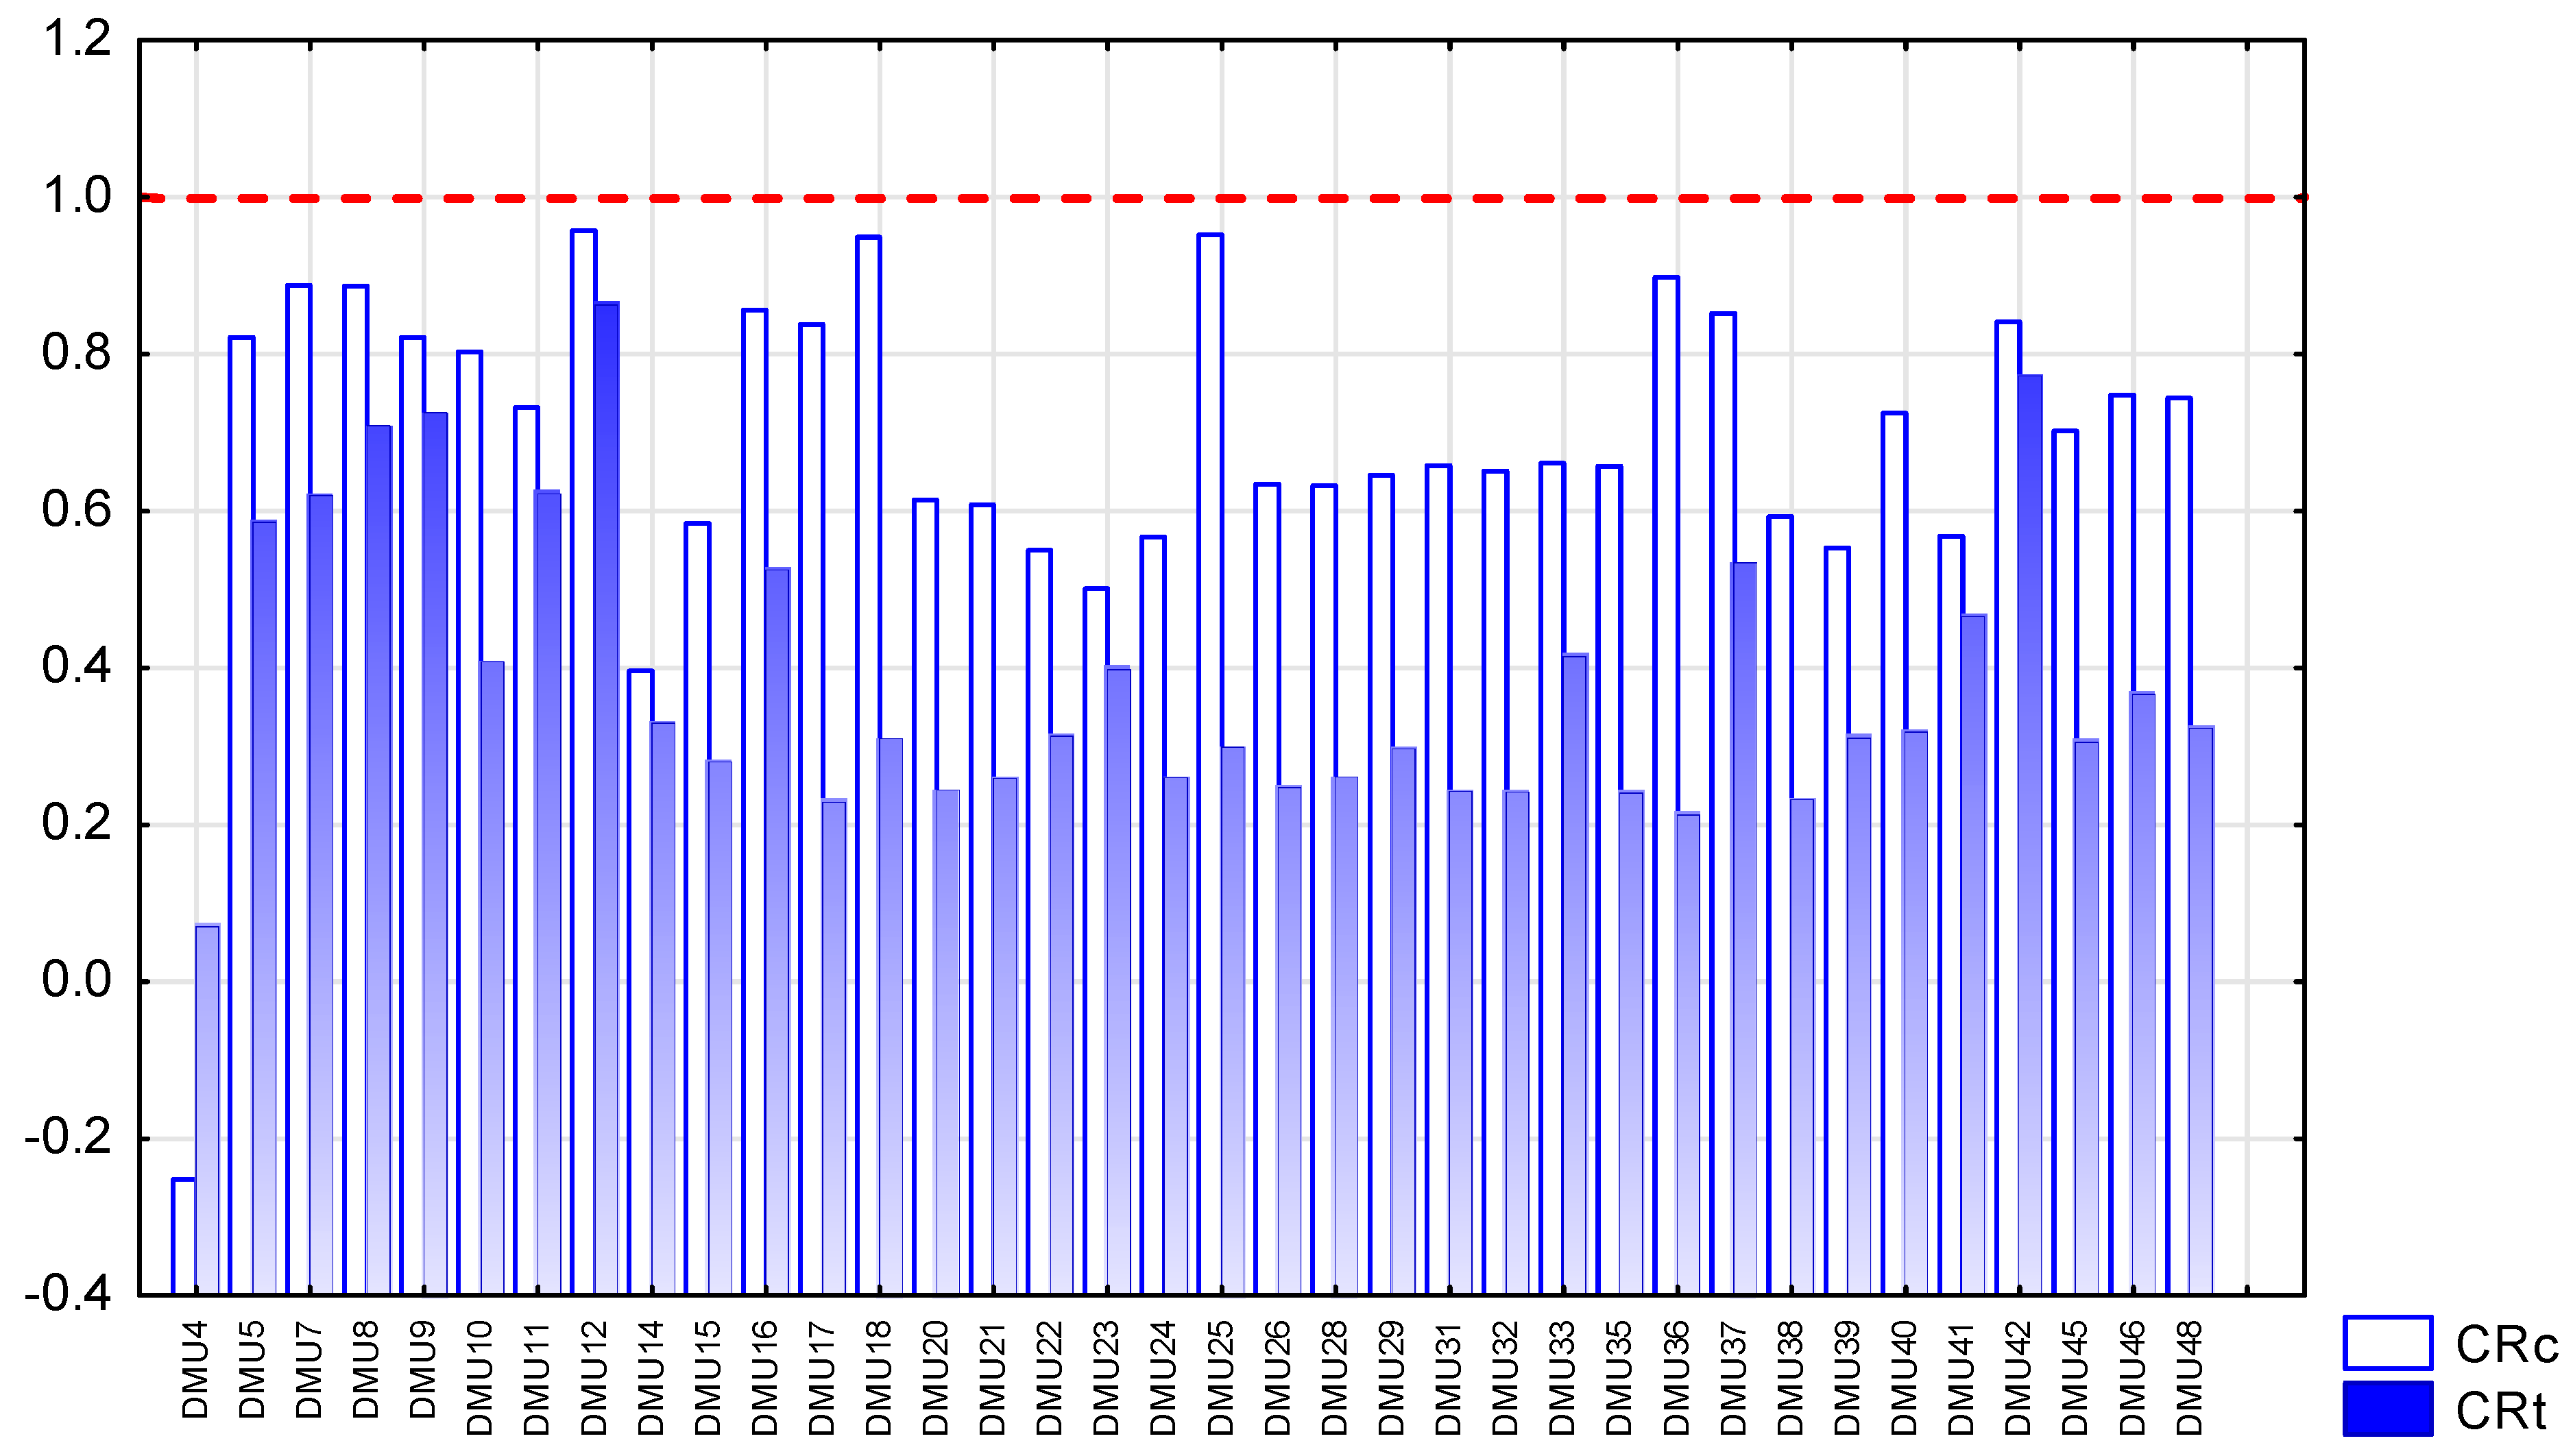
We also calculated the target values of indicator CR for inefficient businesses with the use of the DEA. Figure 4 shows the comparison of current and target values of this indicator. The red line represents the value above which this indicator can be evaluated negatively. Despite the fact that all current values of CR are below the red line, businesses need to reduce them to target values in order to be efficient.
The third task of our research was to determine the strength and association between the abovementioned rankings (RQ3), where the first variable was the order of individual enterprises determined by the BVM and the second variable was the order of companies determined by the DEA.
The Spearman’s coefficient is 0.314965, i.e., 31.50%, which is a medium positive dependence. Table 4 shows the value of test statistic t (n − 2). The quantile of Student’s distribution found in the statistical tables for reliability of 1-α and degrees of freedom (n − 2) is t0.95 (45) = 1.671 (statistical tables). After determining the right-hand critical domain W ≤ 1.671, ∞), we found out that the test variable is located in the critical domain; therefore, we reject the null hypothesis and accept the alternative hypothesis of H1. We conclude that there is statistically significant relationship between rankings achieved by the BVM and the DEA.
The financial ratios used in this paper have an impact on the overall performance of the company. However, when applying benchmarking based on the BVM, weights are determined subjectively, according to a financial managers’ preferences (pairwise comparison). With DEA, the measurement is more objective and accurate; however, it does not have to take into account a managers’ preferences when making financial decisions. In order to determine the performance of a company in business environment, it is appropriate to combine these forms effectively.
5. Conclusions
In order to remain in a stable financial situation, a company must not only monitor the development of key financial indicators over time or in the future, but also analyze the status of the indicators in the industry with regard to its direct competition, and to be inspired by competition when solving financial problems (look for “best practices”).
This research focused on measuring the financial performance of 48 Slovak companies in the field of heat supply. We calculated nine key financial indicators of analyzed companies and identified three research questions: determining the financial performance of the company through BVM, determining the financial performance of the company through DEA and analyzing the strength and direction of the association between the results achieved.
Benchmarking based on the BVM is one of the more subjective methods of measuring performance, as it uses a paired comparison method to determine the weights of indicators. This has to be carried out through a questionnaire survey. The advantage of using benchmarking is the motivation of financial managers to prioritize financial decision making. Financial managers evaluated the indicators as expected. The most important indicators are profitability indicators ROA, ROE and ROS, which were confirmed by several other authors (Wood and McConney 2018; Bărbută-Misu et al. 2019; Bogetoft 2012). These are important financial indicators which determine internal risk factors, such as business risk. The least preferred indicator is interest coverage. DMU1 became the benchmark, DMU2 came second, DMU5 was third, DMU44 was fourth and DMU3 was fifth. Compared to the BVM, the DEA is a benchmarking tool that offers more objective results, while inputs to the DEA model can be indicators expressing the preferences of managers. In our case, the input-oriented DEA CCR model was applied. Within the sample, there were 12 businesses that used their inputs efficiently (including DMU1, DMU2, DMU3 and DMU44).
Based on the Spearman’s rank correlation coefficient, there is a 31.50% dependence among the companies’ rankings. It is a positive dependence, and it is at a given level of significance. The value of the correlation coefficient may be lower due to the different nature of the methods and the fact that the BVM is a more subjective method than the DEA.
The originality of the paper is in its the use of a combination of DEA and BVM methods to improve performance. Both these methods are multidimensional ones. Both are also benchmarking methods, while each comes from a different set of benchmarking techniques which are used to improve performance. The contribution to the literature is that DEA can be considered a benchmarking tool and can be mentioned in the literature as a benchmarking technique for increasing business performance.
Some limitations of the research may be the smaller sample of companies or the subjective and benevolent attitude to managers when completing questionnaires. In our future research, we will improve these shortcomings.
For business practice, we recommend combining these methods, depending on whether the goal is to clarify priorities in terms of preference for financial ratios or to accurately determine financial performance. At the same time, DEA can be an important learning tool for managers to understand the importance of their decisions and their impact on business performance. It can motivate and stimulate them to focus on those indicators that are significant in terms of the financial situation of an enterprise. It can also be a tool to implement the need to identify key business performance indicators and performance risk factors.
Based on the obtained results, we can also generalize some recommendations for comparison, which could be useful for any company:
- -
- To make a comparison with competitors as a multi-criteria comparison and not only on the basis of one criterion (for each indicator, the benchmark was also achieved by another company);
- -
- To convert values of indicators into common unit;
- -
- To involve managers in the selection of appropriate indicators and take into account their view on the significance of the applied indicators;
- -
- To apply at least two evaluation methods when evaluating enterprises and compare their results;
- -
- To monitor and optimize the profitability of the company, which has been confirmed as an important indicator of business performance.
Author Contributions
All authors contributed to all aspects of this work. All authors have read and agreed to the published version of the manuscript.
Funding
This research received no external funding.
Institutional Review Board Statement
Not applicable.
Informed Consent Statement
Not applicable.
Data Availability Statement
Financial statements in the form of balance sheets and profit and loss statements were obtained from the agency CRIF - Slovak Credit Bureau, s.r.o., which deals with the collection and processing of financial statements of Slovak companies according to individual SK NACE. Information were provided by a third party, which is focused on data collection and cooperation with academic institutions and supports them in obtaining the necessary data for their research activities. These financial statements have been prepared by the company by mutual agreement and according to the requirements of the authors.
Acknowledgments
This paper was prepared within the grant scheme VEGA No. 1/0741/20 (The application of variant methods in detecting symptoms of possible bankruptcy of Slovak businesses in order to ensure their sustainable development) and VEGA No. 1/0090/19 (Research into the financial situation and financial literacy of low-income population groups in context of socio-economic problems of Eastern Slovakia).
Conflicts of Interest
The authors declare no conflict of interest.
References
- Agrell, Per Joakim, and Peter Bogetoft. 2007. Development of Benchmarking Models for German Electricity and Gas Distribution. Sundsvall: Sumicsid. [Google Scholar] [CrossRef]
- An, Qingxian, Xiangyang Tao, and Beibei Xiong. 2021. Benchmarking with data envelopment analysis: An agency perspective. Omega 101: 102235. [Google Scholar] [CrossRef]
- Anand, G., and Rambabu Kodali. 2008. Benchmarking the benchmarking models. Benchmarking: An International Journal 15: 257–91. [Google Scholar] [CrossRef]
- Antimonopoly Office of the Slovak Republic. 2013. Functioning and Problems in the Heat Management Sector in the Slovak Republic with a Focus on Local Central Heat Supply Systems from the Perspective of the Antimonopoly Office of the Slovak Republic. Available online: http://www.antimon.gov.sk/data/att/365.pdf (accessed on 21 June 2020).
- Aparicio, Juan, Jose Juan Lopez-Espin, Raul Martinez-Moreno, and Jesús Tadeo Pastor. 2014. Benchmarking in Data Envelopment Analysis: An Approach Based on Genetic Algorithms and Parallel Programming. Advances in Operations Research, 431749. [Google Scholar] [CrossRef] [Green Version]
- Asrofah, Tutie, Suhaiza Zailani, and Yudi Fernando. 2010. Best practices for the effectiveness of benchmarking in the Indonesian manufacturing companies. Benchmarking: An International Journal 17: 115–43. [Google Scholar] [CrossRef] [Green Version]
- Banker, Rajiv D. 1990. Stochastic Data Envelopment Analysis, Working Paper. Minnesota: Carlton School of Management. [Google Scholar]
- Bărbută-Misu, Nicoleta, Mara Madaleno, and Vasile Ilie. 2019. Analysis of risk factors affecting firms’ financial performance—Support for managerial decision-making. Sustainability 11: 4838. [Google Scholar] [CrossRef] [Green Version]
- Berg, Sanford. 2010. Water Utility Benchmarking: Measurement, Methodology, and Performance Incentives. London: IWA Publishing. [Google Scholar]
- Bogetoft, Peter. 2012. Performance Benchmarking: Measuring and Managing Performance. New York: Springer. [Google Scholar] [CrossRef]
- Borg, Ingwer, and Patrick J. F. Groenen. 1997. Modern Multidimensional Scaling. Theory and Application. New York: Springer. [Google Scholar]
- Camp, Robert C. 1995. Business Process Benchmarking. Milwaukee: ASQC Quality Press. [Google Scholar]
- Coelli, Tim, D. S. Prasada Rao, and George G. Batteese. 1998. An Introduction to Efficiency and Productivity Analysis. London: Kluwer Academic Publishers. [Google Scholar]
- Cooper, William, Lawrence M. Seiford, and Joe Zhu. 2004. Handbook on Data Envelopment Analysis. Boston: Kluwer Academic. [Google Scholar]
- Cooper, William W., Lawrence M. Seiford, and Kaoru Tone. 2007. Data Envelopment Analysis: A comprehensive Text with Models, Applications, References and DEA—Solver Software. New York: Springer. [Google Scholar]
- Cooper, William, Lawrence M. Seiford, and Joe Zhu. 2011. Data Envelopment Analysis: History, Models and Interpretations. New York: Springer. [Google Scholar]
- CRIF. 2016. Financial Statements of Businesses. Bratislava: Slovak Credit Bureau. [Google Scholar]
- Demjanová, Lucia. 2006. Benchmarking as a Way to Change and Innovation in Slovakia. Management in Theory and Practice 2: 44–50. Available online: http://casopisy.euke.sk/mtp/clanky/2–2006/demjanova.pdf (accessed on 3 September 2020). (In Slovak).
- Deville, Aude. 2009. Branch Banking Network Assessment Using DEA: A Benchmarking Analysis—A Note. Management Accounting Research 20: 252–61. [Google Scholar] [CrossRef]
- Díaz, Juan Antonio Rodríguez, Emilio Camacho Poyato, and Rafael López Luque. 2004. Applying benchmarking and data envelopment analysis (DEA) techniques to irrigation districts in Spain. Irrigation and Drainage 53: 135–43. [Google Scholar] [CrossRef]
- Erbetta, Fabrizio, and Luca Rappuoli. 2003. Estimating Optimal Scale and Technical Efficiency in the Italian Gas Distribution Industry, HERMES Working Paper, No. 6. Vercelli: University of Eastern Piedmont. [Google Scholar]
- Farantos, Georgios I. 2015. The Data Envelopment Analysis Method and the influence of a phenomenon in organizational Efficiency: A literature review and the Data Envelopment Contrast Analysis new application. Journal of Data Envelopment Analysis and Decision Science 15: 101–17. [Google Scholar] [CrossRef] [Green Version]
- Färe, Rolf, Shawna Grosskopf, James L. Kirkley, and Dale Squires. 2001. Data Envelopment Analysis (DEA): A Framework for Assessing Capacity in Fisheries When Data are Limited. In Microbehavior and Macroresults, Paper presented at the Tenth Biennial Conference of the International Institute of Fisheries Economics and Trade, Corvallis, Oregon, USA, July 10–14. Edited by Ann L. Shriver and Richard S. Johnston. Corvallis: International Institute of Fisheries Economics and Trade. [Google Scholar]
- Farrell, Michael James. 1957. The Measurement of Productive Efficiency. Journal of the Royal Statistical Society, Series A. 120: 253–90. [Google Scholar] [CrossRef]
- Farsi, Mehdi, Massimo Filippini, and Michael Kuenzle. 2007. Cost efficiency in the Swiss gas distribution sector. Energy Economics 29: 64–78. [Google Scholar] [CrossRef] [Green Version]
- Fong, Sik Wah, Eddie W. L. Cheng, and Danny C. K. Ho. 1998. Benchmarking: A general reading for management practitioners. Management Decision 36: 407–18. [Google Scholar] [CrossRef]
- Frost, William. 2005. ABCs of Activity Based Management—Crushing Competition Throught Performance Improvement. Bloomington: iUniverse. [Google Scholar]
- Goncharuk, Anatoliy G. 2008. Performance benchmarking in gas distribution industry. Benchmarking: An International Journal 15: 548–59. [Google Scholar] [CrossRef]
- Hatami-Marbini, Adel. 2019. Benchmarking with network DEA in a fuzzy environment. Rairo—Operations Research 53: 687–703. [Google Scholar] [CrossRef] [Green Version]
- Ho, Daniel C. W., Edwin H. W. Chan, Nicole Y. Wong, and Man-Wai Chan. 2000. Significant metrics for facilities management benchmarking in the Asia Pacific region. Facilities 18: 545–56. [Google Scholar] [CrossRef]
- Ittner, Christopher D., David F. Larcker, and Taylor Randall. 2003. Performance implications of strategic performance measurement in financial services firms. Accounting, Organizations & Society 28: 715–41. [Google Scholar] [CrossRef] [Green Version]
- Janiš, Stanislav. 2018. Slovak heating companies are preparing for the fourth generation of heating. In Slovak Energy Annual 2018. Bratislava: RE-PUBLIC, pp. 76–79. [Google Scholar]
- Johnson, Gerry, and Scholes Kevan. 2000. Ways to a Successful Business. Praha: Computer Press. [Google Scholar]
- Kaczmarska, Bozena. 2010. The Data Envelopment Analysis method in benchmarking of technological incubators. Operations Research and Decisions 20: 79–95. [Google Scholar]
- Kiseľáková, Dana, and Beáta Šofranková. 2014. Modern Financial Management of Business Entities. Prešov: Bookman. [Google Scholar]
- Kiseľáková, Dana, Beáta Šofranková, Veronika Čabinová, and Janka Šoltésová. 2018. Analysis of enterprise performance and competitiveness to streamline managerial decisions. Polish Journal of Management Studies 17: 101–11. [Google Scholar] [CrossRef]
- Kislingerová, Eva, Jindřich Soukup, Petr Boukal, Patrik Sieber, Jan Heřman, Ivan Nový, Josef Krause, Hana Scholleová, Jiří Fotr, Miroslav Špaček, and et al. 2011. New Economy. New Opportunities? Praha: C. H. Beck. [Google Scholar]
- Klieštik, Tomáš. 2009. Quantifying the Efficiency of Transport Companies’ Activities Using Data Envelopment Analysis. E + M Ekonomie a Management 9: 133–45. Available online: http://www.ekonomie-management.cz/download/1331826707_1add/13_kliestik.pdf (accessed on 25 June 2020). (In Slovak).
- Kočišová, Kristína. 2012. Application of DEA models in the analysis of technical efficiency of bank branches. Economic Journal 60: 169–86. Available online: https://www.sav.sk/journals/uploads/0622125302%2012%20Ko%C4%8Di%C5%A1ov%C3%A1%20RS.pdf (accessed on 5 May 2020). (In Slovak).
- Kovaľová, Marcela, and Zuzana Nogová. 2016. Creative approach to the innovations based on the product benchmarking results. In Innovation Management, Entrepreneurship and Corporate Sustainability, Paper presented at the 4th International Conference, Prague, Czechia, May 26–27. Edited by Martin Lukeš, Jan Misař, Jan Mareš, Ondřej Dvouletý, Miroslav Špaček and Ivana Svobodová. Prague: Oeconomica, pp. 338–48. [Google Scholar]
- Krishnamoorthy, Bala, and Christine DLima. 2014. Benchmarking as a measure of competitiveness. International Journal of Process Management and Benchmarking 4: 342–59. [Google Scholar] [CrossRef]
- Kruskal, Joseph B. 1964. Multidimensional scaling by optimizing goodness of fit to a nonmetric hypothesis. Psychometrika 29: 1–27. [Google Scholar] [CrossRef]
- Lukáčová, Marta, Jaroslav Korečko, Sylvia Jenčová, and Mária Jusková. 2020. Analysis of selected indicators of tax competition and tax harmonization in the EU. Entrepreneurship and Sustainability Issues 8: 123–37. [Google Scholar] [CrossRef]
- Magd, Hesham, and Adrienne Curry. 2003. Benchmarking: Achieving best value in public-sector organisations. Benchmarking: An International Journal 10: 261–86. [Google Scholar] [CrossRef]
- Majorová, Matina. 2007. Reference Materials for Course Optimal Programming II—Part DEA—Data Envelopment Analysis. Nitra: Faculty of Economics and Management, Slovak University of Agriculture. (In Slovak) [Google Scholar]
- Maleyeff, John. 2003. Benchmarking performance indices: pitfalls and solutions. Benchmarking: An International Journal 10: 9–28. [Google Scholar] [CrossRef] [Green Version]
- Neely, Andy. 2002. Business Performance Measurement. Theory and Practice. Cambridge: Cambridge University Press—The Edinburgh Building. [Google Scholar]
- Nenadál, Jaroslav, David Vykydal, and Petra Halfarová. 2011. Benchmarking—Myths and Reality. Praha: Managemet Press, ISBN 978-80-7261-224-6. (In Czech) [Google Scholar]
- Neumaierová, Inka, and Ivan Neumaier. 2002. Performance and Market Value of the Company. Prague: Grada Publishing. (In Czech) [Google Scholar]
- Otley, David. 1999. Performance management: A framework for management control systems research. Management Accounting Research 10: 363–82. [Google Scholar] [CrossRef] [Green Version]
- Petřík, Tomáš. 2009. Economic and Financial Management of the Company. Prague: Grada Publishing. (In Czech) [Google Scholar]
- Pogranová, Zuzana, Radovan Savov, Drahoslav Lančarič, and Lucia Lenčéšová. 2011. Benchmarking—A Tool for Improving Business Management. Nitra: Slovak University of Agriculture in Nitra, ISBN 978-80-552-0672-1. (In Slovak) [Google Scholar]
- Rhee, Cheul, Junghoon Moon, G. Lawrence Sanders, and Youngchan Choe. 2009. Benchmarking Technique in E-Business Using the Galileo Method. Paper presented at the 42nd Hawaii International Conference on System Sciences, Waikoloa, HI, USA, January 5–8; pp. 1–10. [Google Scholar] [CrossRef]
- Rossi, Martin A. 2001. Technical change and efficiency measures: The post-privatisation in the gas distribution sector in Argentina. Energy Economics 23: 295–304. [Google Scholar] [CrossRef]
- Ruiz, José L., and Inmaculada Sirvent. 2019. Performance evaluation through DEA benchmarking adjusted to goals. Omega—International Journal of Management Science 87: 150–57. [Google Scholar] [CrossRef] [Green Version]
- Shewell, Patricia, and Stephen Migiro. 2016. Data envelopment analysis in performance measurement: A critical analysis of the literature. Problems and Perspectives in Management 14: 705–13. [Google Scholar] [CrossRef] [Green Version]
- Štefko, Róbert, Beata Slusarczyk, Sebastian Kot, and Cezary Kolmasiak. 2012. Transformation on steel products distribution in Poland and Slovakia. Metalurgija 51: 133–36. [Google Scholar]
- Štefko, Róbert, Petra Vašaničová, Sylvia Jenčová, and Aneta Pachura. 2021. Management and Economic Sustainability of the Slovak Industrial Companies with Medium Energy Intensity. Energies 14: 267. [Google Scholar] [CrossRef]
- Štiglic, Martin. 2009. Nonparametric Statistical Methods and Their Economic Applications. Available online: http://web.ics.upjs.sk/svoc2009/prace/3/Stiglic.pdf (accessed on 10 August 2019). (In Slovak).
- Šulák, Milan, and Emil Vacík. 2005. Measuring the Performance of Companies. Pilsen: University of West Bohemia. (In Czech) [Google Scholar]
- Tian, Zhilong, and Suttapong Ketsaraporn. 2013. Performance benchmarking for building best practice in business competitiveness and case study. International Journal of Networking and Virtual Organisation 12: 40–55. [Google Scholar] [CrossRef]
- Tone, Kaoru. 2001. A slacks-based measure of efficiency in data envelopment analysis. European Journal of Operational Research 130: 498–509. [Google Scholar] [CrossRef] [Green Version]
- Veber, Jaromír. 2000. Management: The Basics, Prosperity, Globalization. Praha: Management Press. (In Czech) [Google Scholar]
- Vochozka, Marek, Jiří Jelínek, Ján Váchal, Jarmila Straková, and Vojtěch Stehel. 2017. The Use of Neural Networks in Comprehensive Evaluation of the Company. Praha: C.H.Beck, ISBN 978-80-7400-642-5. (In Czech) [Google Scholar]
- Vrábliková, Mária, and Erika Loučanová. 2017. Benchmarking Application in Selected Wood Processing Enterprise. Economic Spectrum 12: 1–6. Available online: https://www.sjf.tuke.sk/umpadi/taipvpp/2017/index.files/prispevky/25_Loucanova_Nosalova_Parobek_Dopico_AObaly.pdf (accessed on 20 June 2020). (In Slovak).
- Wood, Anthony, and Shanise McConney. 2018. The impact of risk factors on the financial performance of the commercial banking sector in Barbados. Journal of Governance and Regulation 7: 76–93. [Google Scholar] [CrossRef]
- Yang, Jyh-Bin, Han-Hsiang Wang, Wei-Chih Wang, and Shin-Min Ma. 2016. Using data envelopment analysis to support best-value contractor selection. Journal of Civil Engineering and Management 22: 199–209. [Google Scholar] [CrossRef]
- Zairi, Mohamed, and Paul Leonard. 1996. The link between benchmarking and performance measurement. In Practical Benchmarking: The Complete Guide. Dordrecht: Springer, pp. 81–94. [Google Scholar]
- Zbranek, Peter. 2013. Data Envelopment Analysis as a tool for evaluation of employees’ performance. Acta Oeconomica et Informatica 16: 1–10. [Google Scholar] [CrossRef] [Green Version]
- Zema, Demetrio Antonio, Pasquale Filianoti, Daniela D’Agostino, Antonino Labate, Manuel Esteban Lucas-Borja, Angelo Nicotra, and Santo Marcello Zimbone. 2020. Analyzing the Performances of Water User Associations to Increase the Irrigation Sustainability: An Application of Multivariate Statistics to a Case Study in Italy. Sustainability 12: 6327. [Google Scholar] [CrossRef]
- Zhu, Joe. 2019. DEA Frontier Software. Worcester: Foisie Business School, Worcester Polytechnic Institute. [Google Scholar]
- Zimková, Emília. 2015. Retail Production Process in Commercial Banking and Its Evaluation. Bratislava: Wolters Kluwer. (In Slovak) [Google Scholar]
Figure 1.
Flowchart of the research. Legend: CRP—Country Risk Premium, ERP—Equity Risk Premium, β—systematic risk.
Figure 1.
Flowchart of the research. Legend: CRP—Country Risk Premium, ERP—Equity Risk Premium, β—systematic risk.

Figure 2.
MDS map.

Figure 3.
Comparison of current and target values of ACP and CPP (days). Legend: ACPc—current Average collection period, ACPt—target Average collection period, CPPc—current Creditors payment period, CPPt—target Creditors payment period.
Figure 3.
Comparison of current and target values of ACP and CPP (days). Legend: ACPc—current Average collection period, ACPt—target Average collection period, CPPc—current Creditors payment period, CPPt—target Creditors payment period.

Figure 4.
Comparison of current and target values of CR. Legend: CRc—current Cost ratio, CRt—target Cost ratio.
Figure 4.
Comparison of current and target values of CR. Legend: CRc—current Cost ratio, CRt—target Cost ratio.


Table 1.
Descriptive statistics for the analyzed businesses.
| Variable | Descriptive Statistics | |||||
|---|---|---|---|---|---|---|
| Valid N | Mean | Median | Minimum | Maximum | Std. Dev. | |
| Current ratio | 48 | 2.5220 | 0.9337 | 0.032532 | 55.580 | 8.4011 |
| Average collection period | 48 | 61.6805 | 34.8444 | 5.028613 | 651.676 | 97.9389 |
| Creditors payment period | 48 | 297.3943 | 182.3338 | 2.176053 | 2941.961 | 473.0657 |
| Return on assets | 48 | 0.2332 | 0.1384 | 0.110630 | 2.071 | 0.3052 |
| Return on equity | 48 | 0.7502 | 0.5733 | 0.125611 | 6.227 | 0.9378 |
| Return on sales | 48 | 0.6160 | 0.2982 | 0.018377 | 7.215 | 1.4150 |
| Equity ratio | 48 | 0.3008 | 0.1814 | 0.054834 | 0.733 | 0.2190 |
| Interest coverage | 48 | 111.7940 | 5.1498 | 0.000000 | 2242.891 | 384.1357 |
| Cost ratio | 48 | 0.6862 | 0.6594 | −0.251537 | 0.976 | 0.2139 |
Table 2.
Score and ranking of DMUs in the research sample, according to the BVM.
| DMU | Score (B) | Ranking | DMU | Score (B) | Ranking | DMU | Score (B) | Ranking |
|---|---|---|---|---|---|---|---|---|
| DMU1 | 42.27 | 1 | DMU17 | 7.56 | 23 | DMU33 | 2.95 | 39 |
| DMU2 | 36.12 | 2 | DMU18 | 3.07 | 36 | DMU34 | 4.04 | 30 |
| DMU3 | 15.20 | 5 | DMU19 | 4.72 | 29 | DMU35 | 9.89 | 16 |
| DMU4 | −45.14 | 48 | DMU20 | 9.07 | 18 | DMU36 | 2.92 | 41 |
| DMU5 | 27.30 | 3 | DMU21 | 2.96 | 38 | DMU37 | 2.65 | 45 |
| DMU6 | 13.62 | 7 | DMU22 | 3.37 | 33 | DMU38 | 8.12 | 21 |
| DMU7 | 14.28 | 6 | DMU23 | 2.80 | 42 | DMU39 | 2.33 | 47 |
| DMU8 | 11.45 | 11 | DMU24 | 7.56 | 22 | DMU40 | 5.34 | 28 |
| DMU9 | 11.00 | 14 | DMU25 | 3.14 | 35 | DMU41 | 2.66 | 44 |
| DMU10 | 9.78 | 17 | DMU26 | 3.95 | 31 | DMU42 | 5.37 | 27 |
| DMU11 | 5.93 | 26 | DMU27 | 3.06 | 37 | DMU43 | 10.65 | 15 |
| DMU12 | 11.57 | 10 | DMU28 | 8.60 | 20 | DMU44 | 19.99 | 4 |
| DMU13 | 11.19 | 13 | DMU29 | 3.34 | 34 | DMU45 | 6.36 | 25 |
| DMU14 | 12.67 | 8 | DMU30 | 3.78 | 32 | DMU46 | 2.53 | 46 |
| DMU15 | 6.43 | 24 | DMU31 | 11.39 | 12 | DMU47 | 2.69 | 43 |
| DMU16 | 8.75 | 19 | DMU32 | 2.95 | 40 | DMU48 | 12.60 | 9 |
LB4 = DMU1, LB5 = DMU2, LB6 = DMU2, LB7 = DMU35, LB9 = DMU6, LB1 = DMU44, LB2 = DMU5, LB3 = DMU44, LB8 = DMU1, GB = DMU1.
Table 3.
Score and ranking of DMUs in the research sample, according to the DEA.
| DMU | Score (B) | Ranking | DMU | Score (B) | Ranking | DMU | Score (B) | Ranking |
|---|---|---|---|---|---|---|---|---|
| DMU1 | 1.00000 | 1 | DMU17 | 0.27254 | 47 | DMU33 | 0.62739 | 23 |
| DMU2 | 1.00000 | 1 | DMU18 | 0.32642 | 44 | DMU34 | 1.00000 | 1 |
| DMU3 | 1.00000 | 1 | DMU19 | 1.00000 | 1 | DMU35 | 0.36533 | 43 |
| DMU4 | 0.29331 | 46 | DMU20 | 0.39885 | 38 | DMU36 | 0.23648 | 48 |
| DMU5 | 0.71299 | 21 | DMU21 | 0.42563 | 36 | DMU37 | 0.62626 | 24 |
| DMU6 | 1.00000 | 1 | DMU22 | 0.56887 | 26 | DMU38 | 0.39143 | 39 |
| DMU7 | 0.69771 | 22 | DMU23 | 0.79442 | 20 | DMU39 | 0.56164 | 27 |
| DMU8 | 0.79822 | 19 | DMU24 | 0.45843 | 32 | DMU40 | 0.43853 | 33 |
| DMU9 | 0.88252 | 15 | DMU25 | 0.31385 | 45 | DMU41 | 0.81895 | 18 |
| DMU10 | 0.50705 | 28 | DMU26 | 0.39032 | 40 | DMU42 | 0.91712 | 11 |
| DMU11 | 0.84913 | 16 | DMU27 | 1.00000 | 1 | DMU43 | 1.00000 | 1 |
| DMU12 | 0.90023 | 14 | DMU28 | 0.41295 | 37 | DMU44 | 1.00000 | 1 |
| DMU13 | 1.00000 | 19 | DMU29 | 0.45948 | 31 | DMU45 | 0.43431 | 35 |
| DMU14 | 0.83223 | 17 | DMU30 | 1.00000 | 1 | DMU46 | 0.48972 | 29 |
| DMU15 | 0.47912 | 30 | DMU31 | 0.36818 | 42 | DMU47 | 1.00000 | 1 |
| DMU16 | 0.61270 | 25 | DMU32 | 0.37122 | 41 | DMU48 | 0.43446 | 34 |
Table 4.
Spearman’s Rank Order Correlation.
| Pair of Variables | Valid N | Spearman R | t (n − 2) | p-Value |
|---|---|---|---|---|
| BVM ranking and DEA ranking | 48 | 0.314965 | 2.250750 | 0.029224 |
Spearman’s rank order correlations; marked correlations are significant at p < 0.05000.
Publisher’s Note: MDPI stays neutral with regard to jurisdictional claims in published maps and institutional affiliations. |
© 2021 by the authors. Licensee MDPI, Basel, Switzerland. This article is an open access article distributed under the terms and conditions of the Creative Commons Attribution (CC BY) license (https://creativecommons.org/licenses/by/4.0/).
Share and Cite
MDPI and ACS Style
Horváthová, J.; Mokrišová, M.; Vrábliková, M. Benchmarking—A Way of Finding Risk Factors in Business Performance. J. Risk Financial Manag. 2021, 14, 221. https://0-doi-org.brum.beds.ac.uk/10.3390/jrfm14050221
AMA Style
Horváthová J, Mokrišová M, Vrábliková M. Benchmarking—A Way of Finding Risk Factors in Business Performance. Journal of Risk and Financial Management. 2021; 14(5):221. https://0-doi-org.brum.beds.ac.uk/10.3390/jrfm14050221
Chicago/Turabian StyleHorváthová, Jarmila, Martina Mokrišová, and Mária Vrábliková. 2021. "Benchmarking—A Way of Finding Risk Factors in Business Performance" Journal of Risk and Financial Management 14, no. 5: 221. https://0-doi-org.brum.beds.ac.uk/10.3390/jrfm14050221