Article

Time-Varying Nexus between Investor Sentiment and Cryptocurrency Market: New Insights from a Wavelet Coherence Framework

1
Department of Finance and Economics, College of Business, University of Jeddah, Asfan Road 2749, Jeddah 23890, Saudi Arabia
2
Department of Management Sciences, University of Swabi, Khyber Pakhtunkhwa 23430, Pakistan
*
Author to whom correspondence should be addressed.
J. Risk Financial Manag. 2021, 14(6), 275; https://0-doi-org.brum.beds.ac.uk/10.3390/jrfm14060275
Submission received: 11 April 2021 / Revised: 21 May 2021 / Accepted: 10 June 2021 / Published: 18 June 2021
(This article belongs to the Special Issue Wavelet Applications in Finance)

Abstract

:
This study attempts to investigate the nexus between investor sentiment and cryptocurrencies prices. Our empirical investigation merges bivariate and multivariate wavelet tools to examine the investor sentiment nexus to inter-cryptocurrencies prices. The study outcomes show that the Sentix Investor Confidence index provides significant information in explaining long-term changes in Bitcoin and Litecoin prices. Moreover, the findings generated from the multiple wavelet coherence illustrate the simultaneous contribution of cryptocurrencies and the Sentix Investor Confidence index in explaining the Bitcoin index movement across frequencies and over horizons, especially during bubble burst periods. The study also suggests a time-dependent relationship of Bitcoin prices with alternative cryptocurrencies and the Sentix Investor Confidence index, mostly pronounced during the Bitcoin bubble. We discuss our results using GSV-based investor sentiment. Our findings remain robust and confirm the strong predictive power of investor sentiment in cryptocurrencies price movements over time and across scales.

1. Introduction and Literature Background

Cryptocurrency (CC, hereafter) denotes a form of digital asset that utilizes blockchain technology to allow a secure transaction. It can be considered a fascinating idea which demonstrates tremendous growth within no time. We recognize different cryptocurrencies, each with their own set of regulations. However, some differences among the cryptocurrencies may involve, for example, the selection of the consensus mechanism as well as cryptographic hashing algorithms (Härdle et al. 2020). For instance, Litecoin is considered an alternative to Bitcoin. Additionally, like Bitcoin, Dogecoin was firstly introduced as “a joke currency” and was driven by an online community base. Nevertheless, Ethereum is different from Bitcoin because it has the potential to run a computer program on a network. The emergence of CC not only allows companies to raise money by trading without listing into the stock exchange or merging in venture capitalists, but also broadens the investor’s investment span beyond conventional securities. Primarily Nakamoto (2009) introduced CC in 2009, where soon after it gained attention among investors due to its cost efficiency, government-free policy and peer-to-peer online payment facility, which triggered a sharp upsurge in prices. Initially, both researchers and practitioners considered CC to be virtual currency, whereas later, the empirical literature deemed it to be a speculative asset due to the high turbulence in prices (Corbet et al. 2019). Lansky (2016) considered CC to be a form of digital currencies based on coding principles. According to this author, it is worth indicating that three combined characteristics can be attributed to CC; we recognize anonymity, independency of central authority and protection from double-spending assault. Likewise, Yuneline (2019) qualitatively investigated the nature of CC based on four characteristics of legal, money, Sharia, and economic perspectives. Their study found that from a money perspective, CC shows currency features, unlike the case for legal, Sharia and economic perspectives. Moreover, Yermack (2013) claimed that CC is more like speculative investment rather than virtual currency due to its higher market capitalizations than economic transactions. Supportively, Bouoiyour et al. (2015) examined the dynamic nature of CC prices and found a sharp upsurge in Bitcoin price from USD 130 to USD 1000 and back down to USD 200 at the end of 2013. Moreover, on 16 December 2016, the Bitcoin price was USD 778, which jumped to USD 19,650 in the following 12 months, showing 2394% market growth (Rognone et al. 2020. The coinmarketcap website provides meaningful information about more than 9800 cryptocurrencies. This website gives an overview of the current prices as well as daily transactions of these cryptocurrencies. During the first term of 2021, Bitcoin becomes an extremely volatile cryptocurrency with a road record of “boom and bust” cycles. The Bitcoin price escalated but it has been moving in a descending path (Bitcoin was worth over USD 60,000 in February as well as April 2021, then prices fell to USD 45,000 and it continues to drop dramatically).
Considering the speculative nature of CC, it is categorized as a speculative investment asset and referred to as a financial asset of an “extremely speculative nature”. In the same vein, studies of Corbet et al. (2018) revealed visible date-stamp bubble behavior in certain periods, particularly during 2017, and found that there is a short time fundamental effect which will disseminate very soon.
Moreover, numerous studies underlined the effect of various risk factors on CC returns and price volatility. For instance, Nguyen et al. (2019) attempted to examine the asymmetry effect of monetary policy (tightening and easy) regimes. The findings exhibit that the asymmetry effect is significant for Chinese monetary policy regimes, while it remains insignificant for the U.S. Using the quantile-on-quantile model, Aysan et al. (2019) studied the effect of global geopolitical risk on Bitcoin price volatility and returns. The authors illustrated a positive relationship for returns and volatility at higher quantile. Consistently, Demir et al. (2018) investigated the economic policy uncertainty effect on Bitcoin returns predictability. The results of their study reveal positive and significant effects at both higher and lower quantiles. Moreover, Fang et al. (2019) examined the correlations among different financial assets and global policy uncertainty. Global economic policy uncertainty demonstrates negative correlations with Bitcoin-bond, while the correlation remains positive for both Bitcoin-commodities and Bitcoin-equities. Recently, empirical studies evidenced the substantial influence of investor sentiment on the CC market. For instance, using intra-day data, Chen et al. (2020) examined the effect of fear sentiment on Bitcoin returns and the trading volume. They observed that fear sentiment has a negative effect on Bitcoin returns and a positive effect on the trading volume. Likewise, using 15 min intraday data, Rognone et al. (2020) illustrated a positive relationship between investor sentiment and Bitcoin. Kraajeveld and De Smed (2020) evidenced higher predictability of twitter-based investor sentiment for various crypto coins. Gurdgiev and O’Loughlin (2020) depicted that public sentiment can reveal the direct effect of anchoring and herding biases. Eom et al. (2019) studied the statistical properties of investors sentiment and Bitcoin returns and volatility. The outcomes of their study demonstrated a higher explanatory power for predicting Bitcoin’s volatility. Similarly, Baig et al. (2019) examined investor sentiment and Bitcoin price clustering and reported a strong positive relationship between them. Using the social media sentiment index Karalevicius et al. (2018) analyzed investor sentiment nexuses with the Bitcoin price. They revealed a strong short-term relationship by concluding that investors overreact toward short-term news. Furthermore, using Twitter messages, Li et al. (2019) investigated the investor sentiment effect on CC price fluctuation for which they reported that social sentiment signals as a powerful indicator that can better predict CC price movements. Drobetz et al. (2019) examined the influence of crypto-related sentiment on initial coins offering, and they suggested that negative sentiment predicts negative returns in the short run, whereas Chu et al. (2019) examined the news-based sentiment and events effect on CC market efficiency. The authors revealed that news-based sentiment may not be a significant predictor to predict CC market efficiency.
Investigating the potential change in the behavior of investors over the pre- and post-Bitcoin bubble, Guègan and Renault (2020) showed a positive and statistically significant relationship between investor sentiment and Bitcoin during the Bitcoin bubble, unlike in the post-Bitcoin period (2018 to December 2019). This indicates that the CC market is more exposed to investor sentiment during high-sentiment investment horizons. Supportively, Lopez-Cabarcos et al. (2019) stated that Bitcoin investor sentiment influences the Bitcoin volatility across different periods (speculative and stable periods). Likewise, Bariviera (2017) examined information efficiency in the Bitcoin market, where he found long memory price behavior at both high and low prices. In this perspective, it is interesting to investigate whether investor sentiment can influence the cryptocurrency dynamics over time and across scale bands.
Our paper contributes to the literature by answering the following questions: how does investor sentiment affect CC co-movements, and how do investor sentiment impacts on CC vary over time and across frequencies? The main objectives of this study can be categorized into two significant aspects. In the theoretical view, we attempt to participate in the actual academic debate in the behavioral finance and finance technology (Fintech) inherent to the role of investor sentiment in clearing up the asset pricing, particularly in the CC market dynamic. We also pay attention to the investor sentiment proxies that can directly reflect investor emotions (optimism and/or pessimism, bearish/bullish). These emotions ebb and flow between panic and voracity. In addition, +the exponential increase in CC prices hides behind an important number of retail investors’ speculations. Thus, analyzing the relationship between CC and investor sentiment can provide helpful insights into the global market perception and awareness. As well, from a methodological point of view, we propose new insights into the relationship between investor sentiment and the CC market by using different variants of bivariate and multivariate wavelet methods. By doing that, we provide operational implications for decisions in portfolio management and investment allocation between CC when taking into consideration the investor sentiment effect. Thus, we hypothesized that investor sentiment has coherence with CC prices at multiple time and frequencies. The wavelet approach inspects the behavior of time series jointly, in frequency and time spaces. When we create feedback on the wavelet analysis origin, we see that the root of this tool instigates from a need to localize a signal in the time–frequency domain. As well, the wavelet analysis is brought forth because the Fourier transform falls short when analyzing non-stationary signals. Used by a growing number of researchers, wavelet analysis has demonstrated its ability to explicitly expose and follow the time-scale varying outlines of time series. The wavelet approach stretches to isolate slow and persistent movements. As well, wavelet analysis is proving to be a powerful tool for analyzing market operators’ behavior, especially self-similar behavior, over different time scales. Indeed, some participants have an investment horizon of several minutes or hours to several days (e.g., when considering short-term movements of stock markets) while others may have an investment horizon of several weeks or months (e.g., with medium-term movements of the stock markets) or an investment horizon of several years (e.g., with long-term movements of the stock markets). Generally, for the wavelet approach, we distinguish between two main parts of wavelet transformation, which are the discrete wavelet transform (hereafter, DWT) and the continuous wavelet transform (hereafter, CWT).
The main contributions of the paper are the following. First, in the investor sentiment and CC literature, most of the studies focused on either association or their future explanatory ability of returns, volatility, and efficiency. However, there are few events that affect both sentiment and the CC price co-movement. We deem that our study fills the gap in the related literature. This study is a challenge to bridge the findings linked to investors’ sentiment and the new tendency in research which view CC as new assets for investment. As a direct investment, CC carries on moving at the calling of speculators and retail investors. Second, we investigate the leader–follower relationships between CC prices and investor sentiment simultaneously over time and across multiple frequencies. We opt for two wavelet tools: the bivariate and multivariate wavelet coherence analysis (Ng and Chan 2012). Moreover, the leader–follower relationship will also be examined for the time-varying purpose to know about the long- and short-term relationships. Methodologically, we follow three main steps. First, we refer to the bivariate wavelet method to analyze the co-variation between the CC prices. This tool is specifically able to assess the link between two variables across scales and over the sample period. It allows us to identify the cross-correlation between these variables at different investment horizons. In the second step, we resort to the multivariate wavelet consisting of two approaches: partial and the multiple wavelet coherence (PWC and MWC, respectively) to understand the co-movements of three variables (jointly, CC and investor sentiment proxy) over time scales and frequencies bands. The main idea in the tri-variate wavelet analysis is to provide meaningful insights into the influence of multiple independent variables on a dependent one.
To the best of our knowledge, no prior studies have employed the multivariate wavelet to investigate the interactions between investor sentiment and CC. The use of MWC and PWC permits us, contrary to the bivariate wavelet analysis, to include a third variable as a conditioning factor. The inclusion of the third factor supposes a mutual interaction between the two first variables on the target one. As supported by many recent studies (e.g., Kristoufek 2013; Stavroyiannis et al. 2019) the relationship between CC prices and investor sentiment is not linear. This makes wavelet analysis a relevant approach to study the lead-lag interactions between these variables across various time horizons.
From this study, interesting conclusions emerged. First, in the bivariate case, the co-movement across CC indexes is revealed across frequencies and over time and is especially localized at short and long horizons. The Bitcoin prices show a long-term positive relationship with the Sentix Investor Confidence (hereafter, SIC) index. Our findings supported the significant information effect of the investor sentiment index in explaining changes in Bitcoin prices.
Second, in the multivariate case, when looking to the PWC plots by which we study the co-movement between Bitcoin and the SIC index after cancelling out the effect of the remaining CC indexes, our findings exhibit interesting areas of coherency between these indexes. The crucial finding is that medium term connections with the investor sentiment strengthen during CC prices bubbles.
As well, the MWC used for analyzing the joined effect of the cryptocurrency investor sentiment index and the remaining CC indexes on the Bitcoin index demonstrate, generally, that when combining these variables, they disclose short- and long-term effects on Bitcoin prices, indicating that altcoins and investor sentiment together provide some explanations of the variation in Bitcoin prices, particularly during Bitcoin bubble.
The rest of the paper is structured as follows. Section 2 concisely exposes the data and methodology design. Findings and their implications are conveyed in Section 3. Section 4 presents the robustness check, while Section 5 gives some concluding remarks.

2. Materials and Methods

2.1. The Wavelet Coherence Analysis

According to Torrence and Compo (1998), the wavelet coherence (hereafter, WC) of two signals, which are denoted as x = { x n } and y = { y n } , gives the localized correlation coefficient between these two signals over time and across frequencies. Evidently, the WC can faithfully detect the co-movements between signals over different investment horizons. Accurately, for each time series, the WC is calculated as the scared absolute value of the smoothed cross-wavelet spectra, which is standardized by the multiplication of the smoothed individual WPS of each signal:
R 2 ( u , s ) = | S ( s 1 W x y ( u , s ) ) | 2 S ( s 1 | W x ( u , s ) | 2 ) S ( s 1 | W y ( u , s ) | 2 )
S gives the smoothing parameter. The R 2 ( u , s ) is like the correlation coefficient, which meets the ensuing dissimilarity 0 R 2 ( u , s ) 1 . When the squared wavelet coherence value is close to zero, this indicates that the correlation between the two-time signals is weak. As well, a correlation coefficient value close to the unit shows the existence of a strong correlation. Furthermore, from the WC plots, the leader–follower relationship between two time-series can be detected through the arrow directions. Based on this, the two signals can be in an in-phase (the arrows are directed to the right direction), or anti-phase (the arrows take a left direction) relationship.

2.2. The Multivariate Wavelet

The multivariate wavelet analysis consists of two main approaches: the partial wavelet coherence (hereafter, PWC) and the multiple wavelet coherence (hereafter, MWC). The PWC is analogous to a simple correlation. The principle of this tool consists of identifying the wavelet coherence between two signals y and x 1 after eliminating the power of a third signal x 2 . According to Mihanović et al. (2009), similarly to the partial correlation squared, the PWC squared is expressed as follows:
R P 2 ( y , x 1 , x 2 ) = | R ( y , x 1 ) R ( y , x 2 ) · R   ( y ,   x 1 )   | 2 [ 1 R ( y , x 2 ) ] 2 [ 1 R ( x 2 ,   x 1 ) ] 2
The interconnections between variables are determined according to the level of PWC, which is ranged from 0 to 1. A high level of PWC squared signifies that x 1 has a significant influence on the y signal at the frequency-time band. The MWC is analogous to multiple correlations (Ng and Chan 2012). This correlation allows us to examine the ensuing WC of multiple independent variables on a dependent one. More precisely, the MWC computes the proportion of the wavelet power of the dependent time series y that is explainable by the two independents x 1 and x 2 at a given time- frequency space.
The MWC can be revealed by the succeeding equation:
R M 2 ( y , x 2 , x 1 ) = R 2 ( y , x 1 ) + R 2 ( y , x 2 ) 2 R e [ R ( y , x 1 ) R ( y , x 2 ) R ( x 2 , x 1 ] 1 R 2 ( x 2 , x 1 )

2.3. The Phase and Antiphase Relationship

As well, the phase difference provides ideas about the lateness of the oscillations between two variables as a function of frequency. The interpretation of the phase difference refers to the arrows’ direction. Arrows pointed to the right (left) indicate that variables are in phase (out of phase), or in another word, they reveal a positive (negative) relationship between these variables. If the arrows move to the right and up (down), the first variable x is the driver (follower). By contrast, if the arrows move to the left and up (down), the variable x is lagging (leading).

2.4. Data Description

The present study covers two different sets of monthly sample data from 15 January 2013 to 15 November 2020 (except for Ethereum, which started from 2015). The first set consists of CC prices available on www.coinmarketcap.com, which is a free site carrying over 9800 different CC categories based on exchange markets and market capitalization. The list of CCs is based on market capitalization that is adjusted in real time based on their market capitalization. We retrieved the list and respective data dated on 15 November 2020. The second set of data includes the Sentix Investor Confidence for CC, which is retrieved from DataStream. The sample consists of 84 monthly observations for the Sentix index and CC prices, respectively. Note that the SIC index is based on a monthly online survey. Generally, 1600 financial analysts and institutional investors contribute to this survey by enunciating their own opinion regarding the current and expected economic circumstances over the next months. The SIC index is elaborated by using investors one-month expectations for the cryptocurrency market to reveal the emotions of market participants. These emotions vary between greediness and anxiety. When the sentiment is negative, this usually indicates an interesting rising of prices. Furthermore, the sign of the index provides a good perception about the investors’ emotions, which alter between bullish and bearish. A strongly worsening index (negative extreme) indicates a price recovery, whereas a very high improved index (positive extreme) is a sign of imminent price weakness.
Table 1 reports the elementary statistics of SIC and CC indexes, respectively. The summary statistics englobe mainly the minimum, maximum, mean, and standard deviation and show that Bitcoin reveal the most important risk compared to other cryptocurrencies, whereas Dogecoin exhibits less standard deviation among all CCs. Note that the kurtosis value is habitually compared to the value 3, going to the kurtosis value for a Normal Distribution. Table 1 shows that CC indexes have high probabilities of exceptional positive monthly indexes, as they show high kurtosis. While the Tether index presents the highest kurtosis (13.98), Bitcoin shows the lowest value (4.31). While positive values of kurtosis are a sign of the presence of extreme values, it is, however, unclear where these values are exactly localized (on the left/right or on both side) in the distribution. Furthermore, all CC indexes are positively skewed, indicating that, for these indexes, the extremity on the right side is lengthier than the left side. The same inference is also perceived for CC indexes.

3. Findings and Discussions

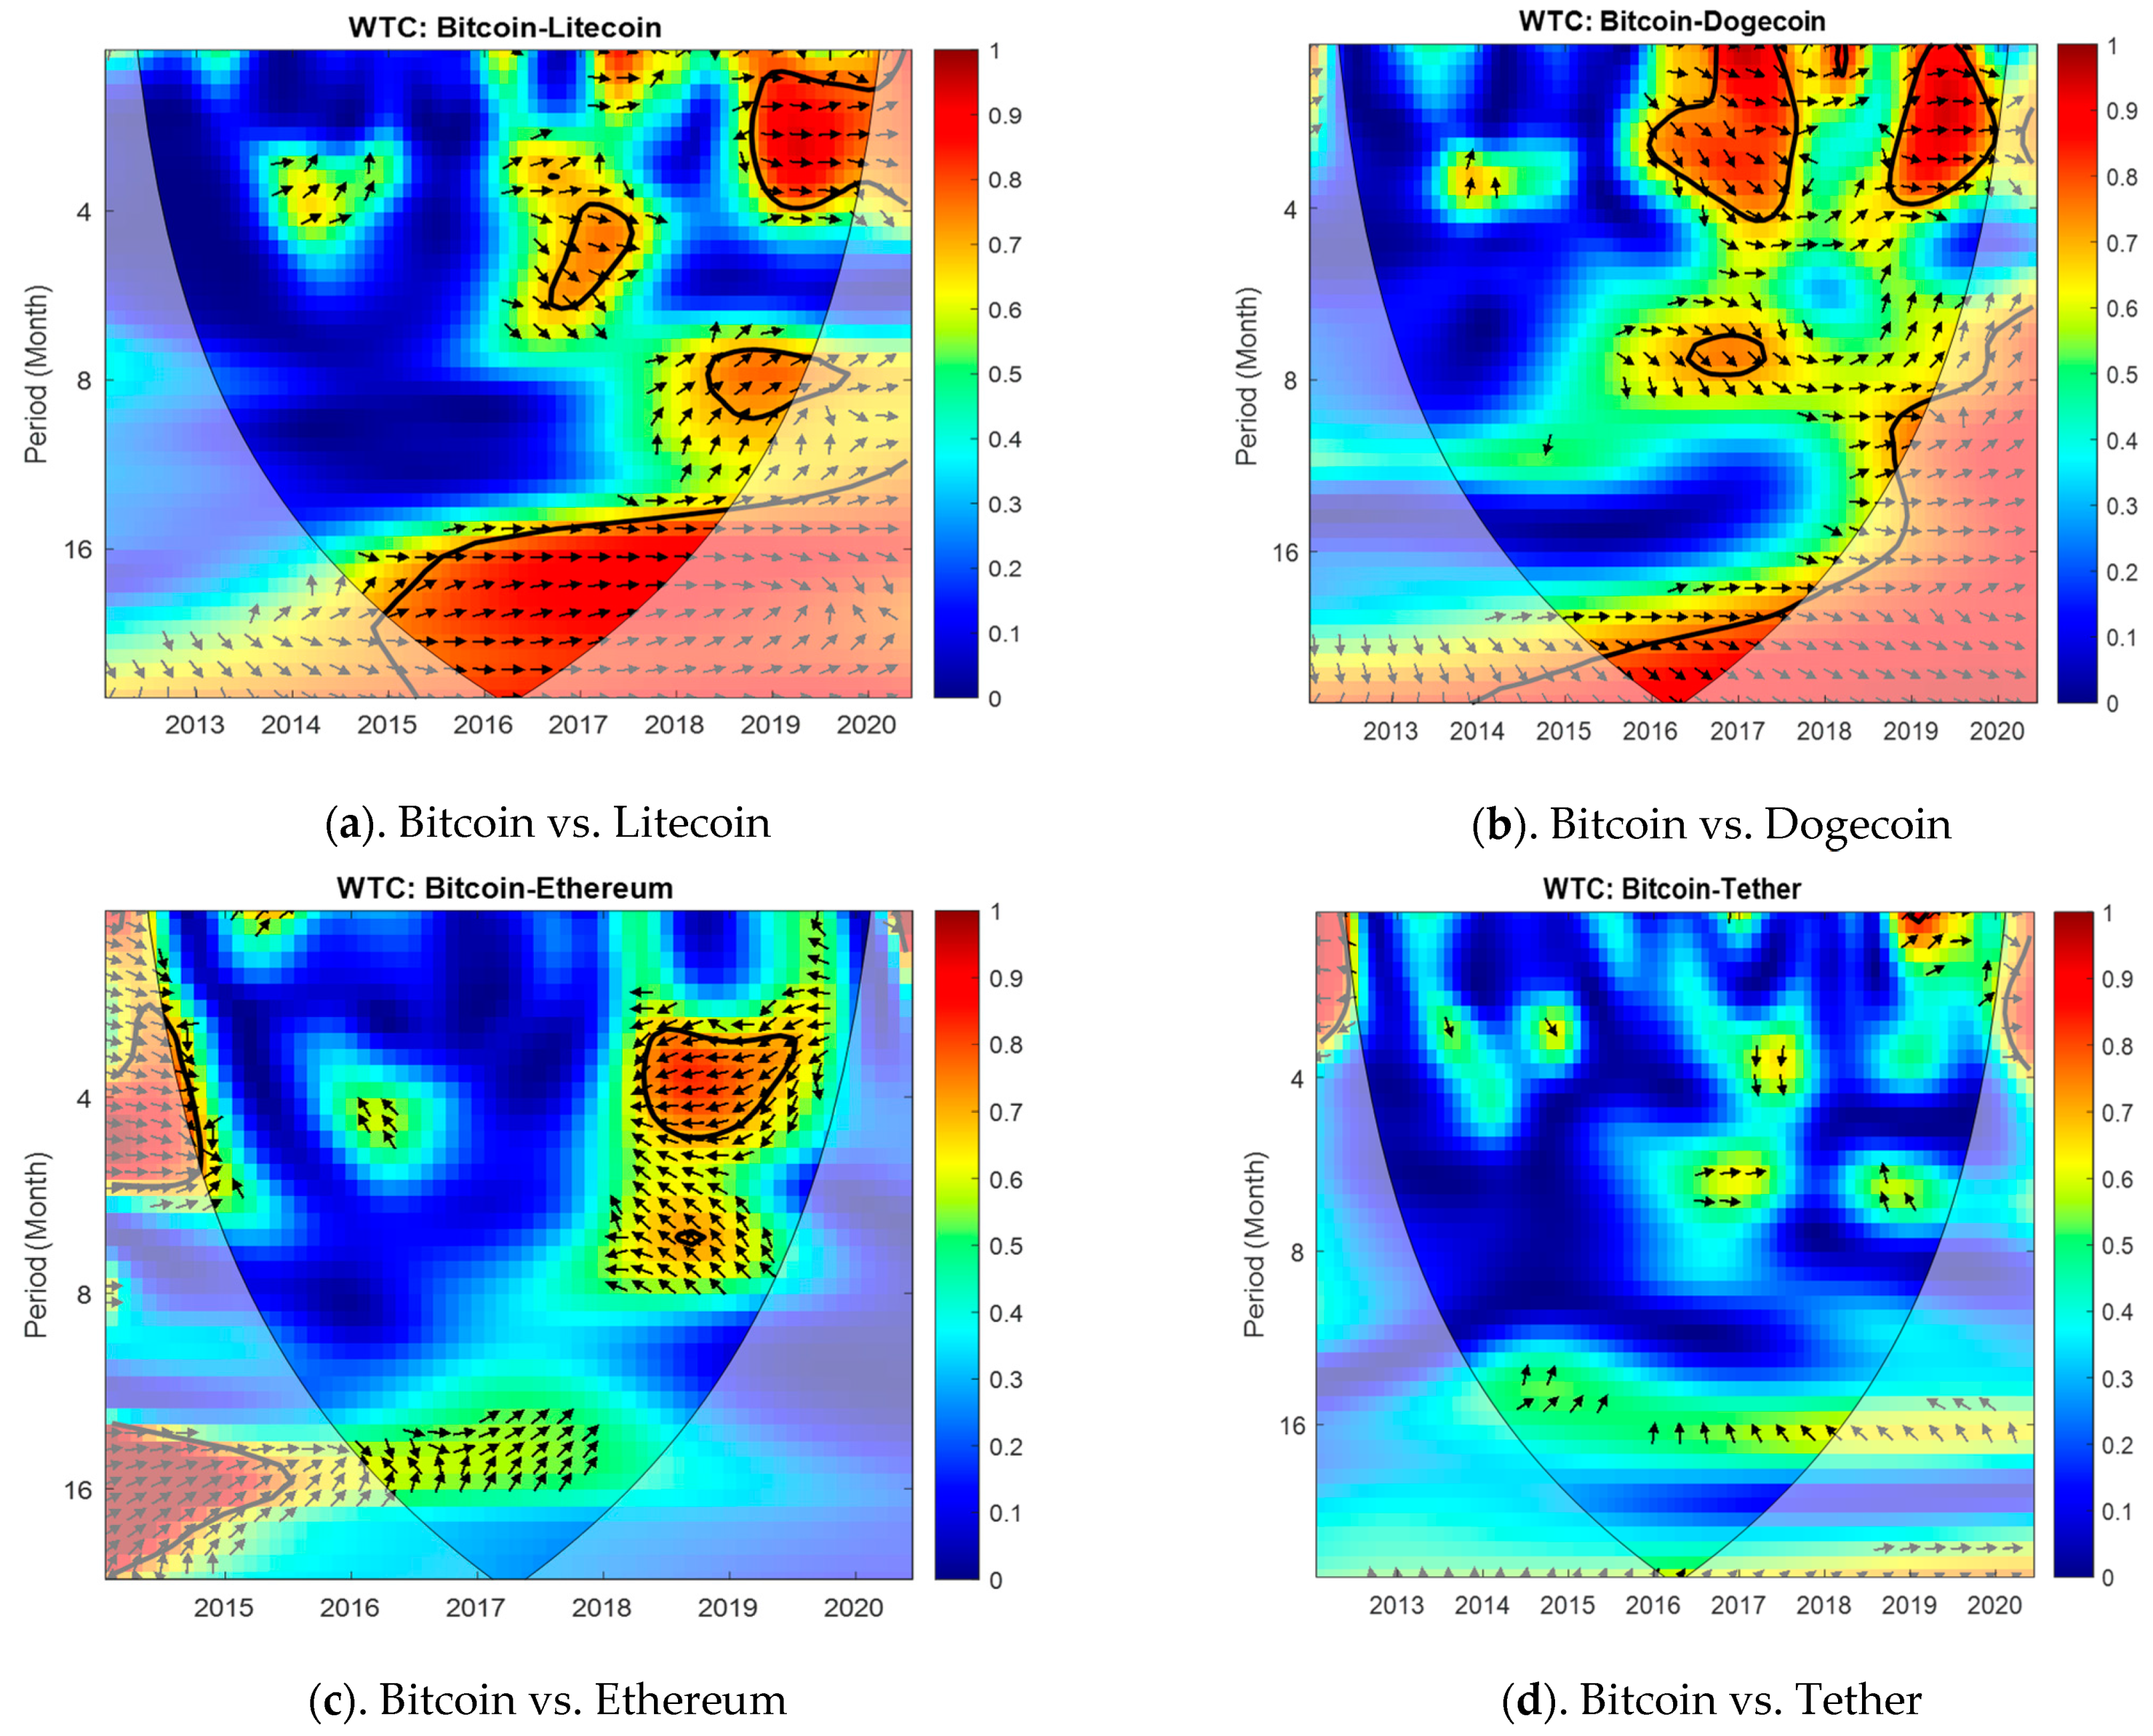
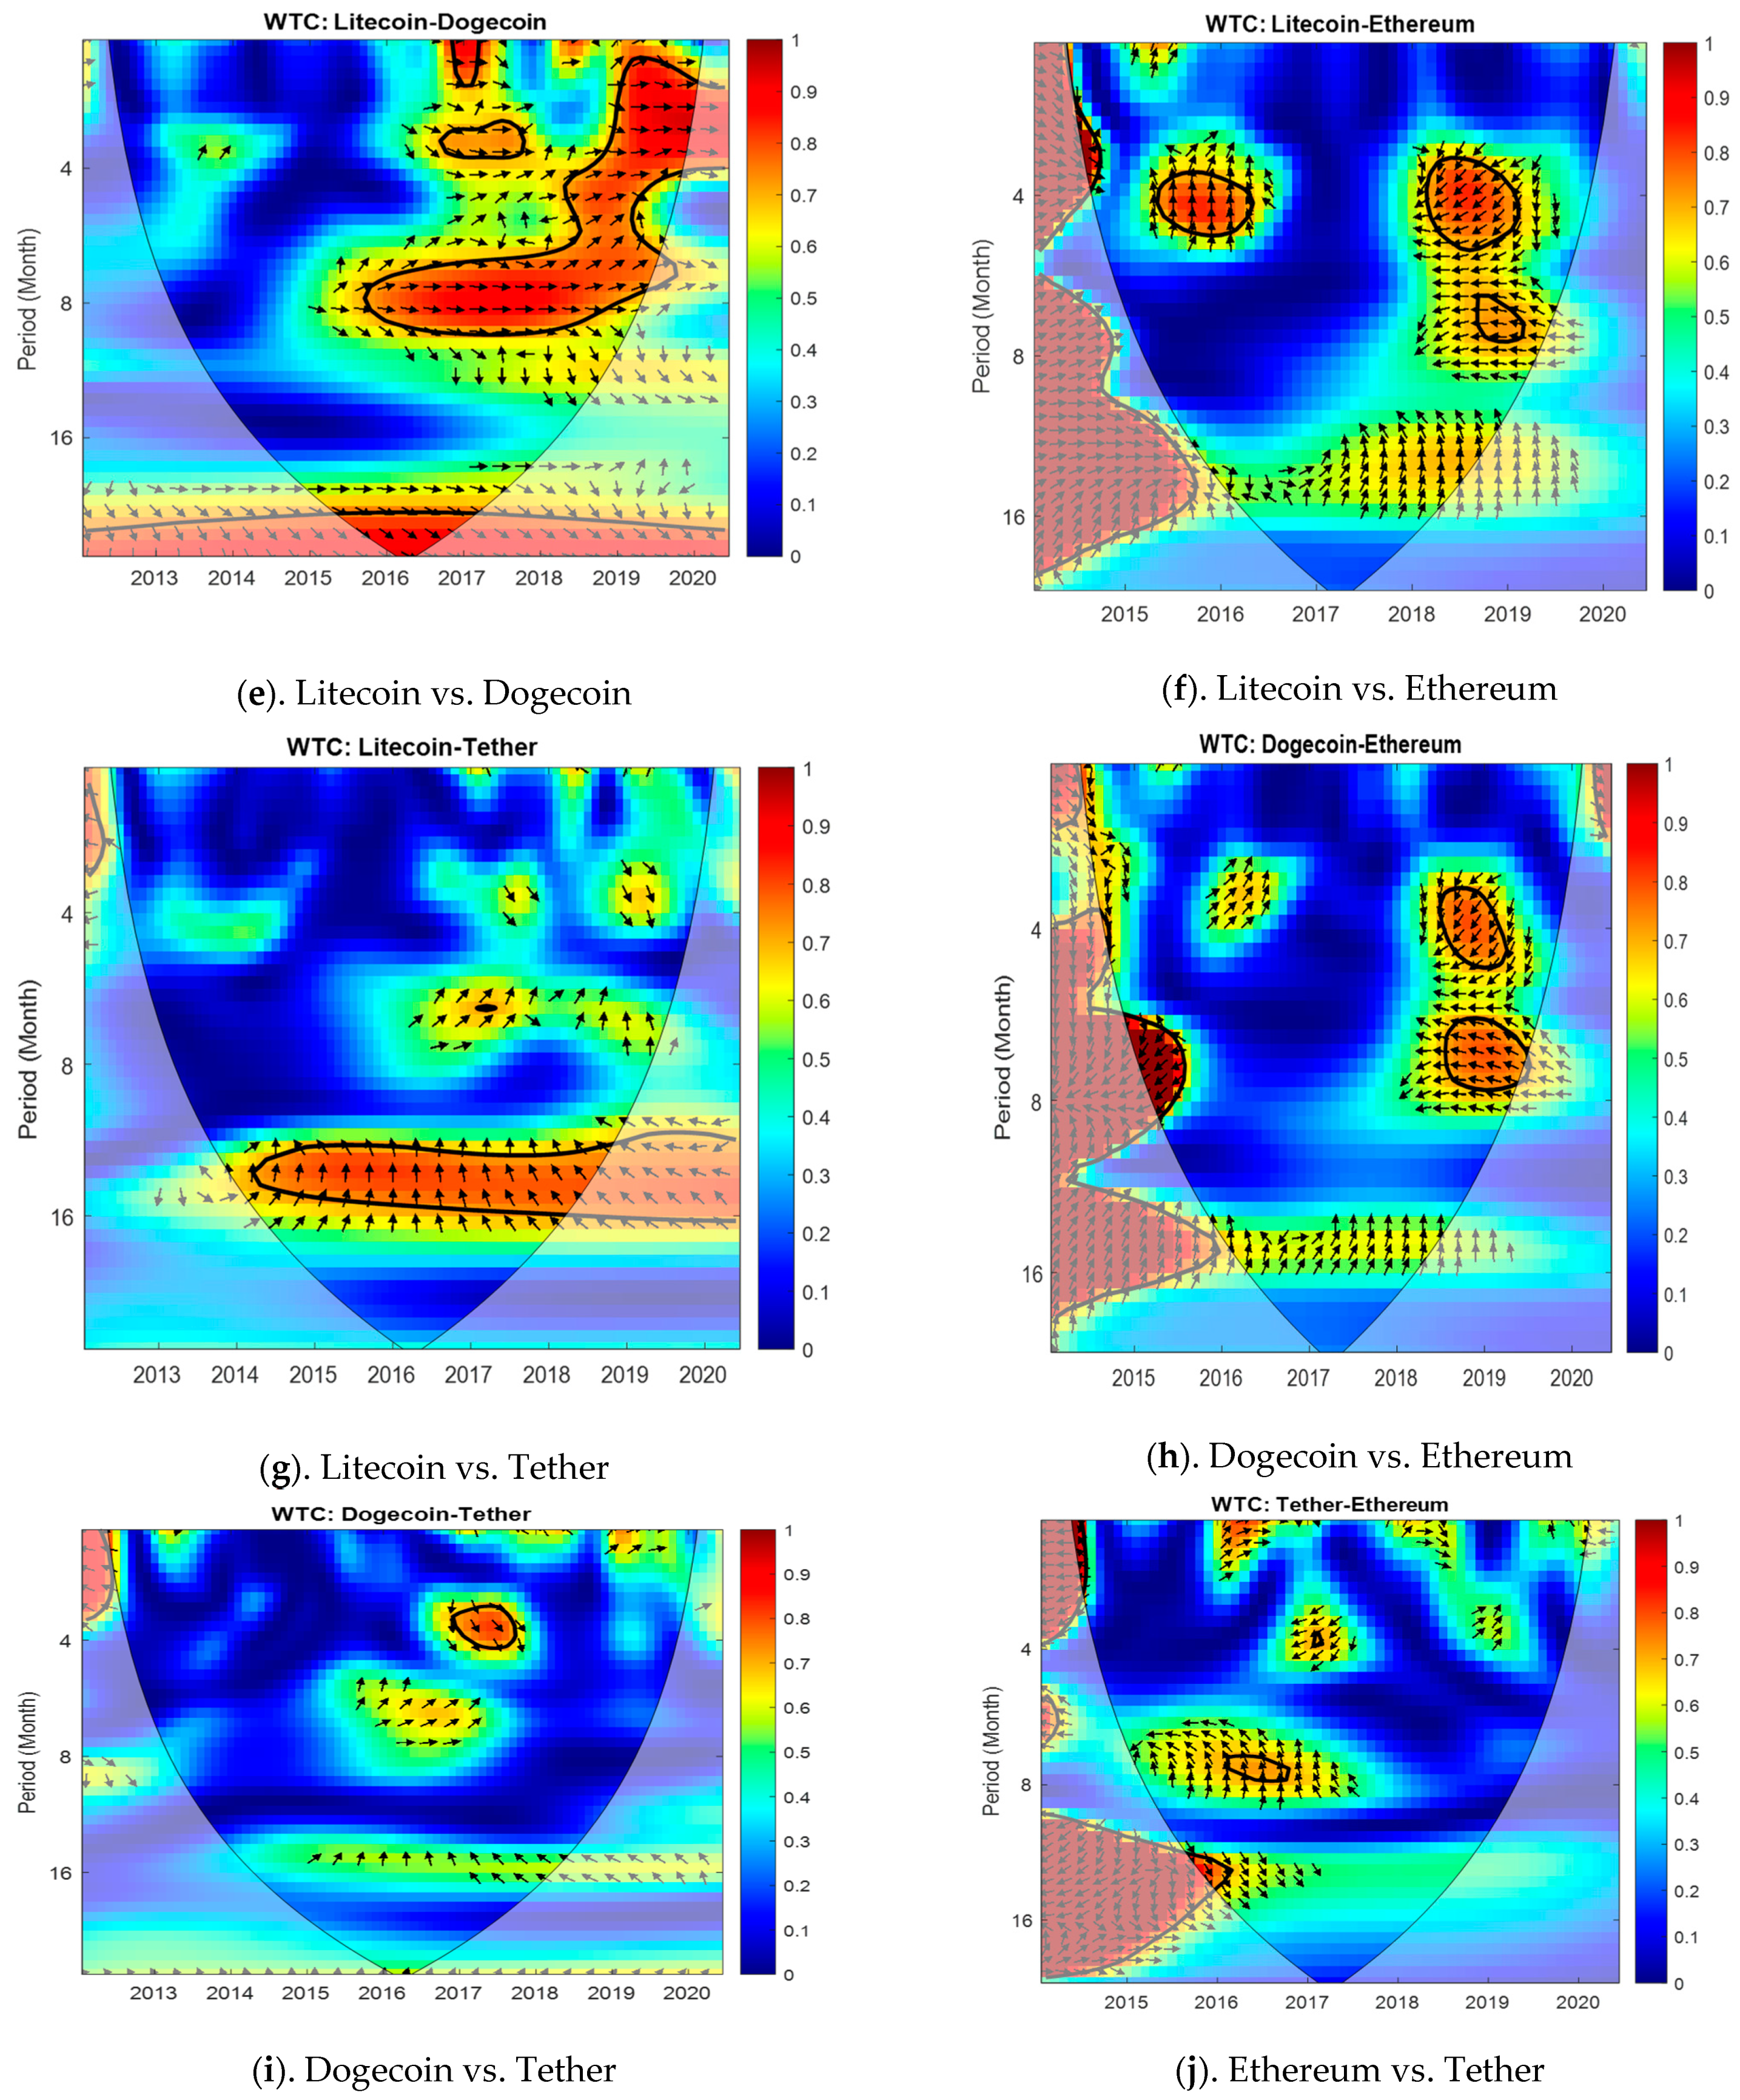
3.1. Wavelet Coherency Analysis of CC Prices

We use the bivariate wavelet coherence analysis to investigate the co-movements between CC prices in the frequency–time domain. The wavelet plots are reported in Figure 1a–j. From this figure, we reveal interesting findings on the connection between the five CC prices over time and across frequency bands. Generally, a visual look at these graphs permits to recognize a significant co-movement between the CC prices at different scales, mainly localized, for most couples, at the end of the sample period. Nevertheless, only a few couples show strong relationships. Essentially, the Bitcoin–Litecoin pairwise (Figure 1a) exhibits a robust and persevered connection at the 8–16 months frequency band over the period 2015–2019, revealing that Bitcoin and Litecoin indexes acquire a substantial relationship in the long-run horizon. This finding is not surprising, given that Litecoin is technically very similar to Bitcoin. From the economic perspective, CCs are investable assets in nature, moving in the same direction. More explicitly, Litecoin is principally Bitcoin with more swift block confirmations. Furthermore, this couple is in a phase relationship where the arrows are overall right and up, meaning that Litecoin is the follower; in other words, Bitcoin affects positively the Litecoin price index variation. However, in the short and middle horizons corresponding to the 2–4 months and 4–8 months scales, no positive correlation between this couple is perceived, especially during the sub-period starting from 2013 to the end of 2018. The finding corroborates that of Philips and Gorse (2018) in which the authors explained the lack of positive correlation between the two currencies by the price movements decoupled, which is attributed to the history between the Securities and Exchange Commission of the United States (SEC) and Bitcoin exchange-traded funds (EFTs) during March 2017 and March 2019. Back in March 2017, a Bitcoin EFT was rejected by SEC, claiming that Bitcoin is still volatile and resilient to surveillance. In March 2019, the investment vehicle was not yet approved by the SCE. This disagreement impacted Litecoin and made it a hedge against subsequent Bitcoin price fluctuations. As well, the adoption of Segregate Witness (SegWit) reduced the likeness between Bitcoin and Litecoin’s technology. Meanwhile, this co-movement spread over the whole sub-period.
In the same vein of ideas, the long-term relationship between CCs is also shown for the Ethereum vs. Tether (Figure 1j), Litecoin vs. Dogecoin (Figure 1e) and Litecoin vs. Ethereum (Figure 1f) couples. It is found that for these CC, high correlations are scattered at low frequency bands. Precisely, it can be obviously perceived that for the abovementioned CC couples, long-term coherency has a periodicity of 8–16 months. Further, closer analysis of the arrows directions shows that the relationship between the CC is bidirectional coupling (they are in an anti-phase relationship). These findings are revealed for Litecoin vs. Dogecoin (Figure 1e) and Litecoin vs. Ethereum (Figure 1f), with the alteration of the processes of driving and following (lead/lag relationship). For instance, for the first couple, the arrows are left and up, indicating that Litecoin is lagging Dogecoin, whereas this virtual currency is leading for the same period 2014–2017.
For the short-run connection between CC, a visual look for the WC map conducts us to reveal two main conclusions. For this horizon, CC shows two different behaviors. While Bitcoin is in an in-phase relationship, respectively, with Dogecoin (Figure 1b), Ethereum (Figure 1c), and Tether (Figure 1d), this index is judged to be the follower for the two last cases where Tether indexes lead Bitcoin at the time scale of 2–4 months, respectively, during the sub-periods 2015–2016 and 2017–2018. In contrast, Bitcoin exhibits a relatively strong relationship by leading Dogecoin (Figure 1b) in the short and medium horizons during 2017–2018. Figure 1g reveals that Litecoin and Tether show a strong relationship in the short scales where Litecoin is leading. The downward arrows shown in Figure 1h and Figure 1i indicate that Dogecoin is the follower (leader), respectively.
Our results sustain those of Ciaian et al. (2018), claiming that the relationship between Bitcoin and its alternatives is stronger in the short run than in the long run. Meanwhile, the wavelet coherency analysis of CC prices show that they have extremely dynamic price co-movements, both at short and long horizons (they can move in tandem or in opposite directions). The relationship between CC would be of interest for investors searching for diversification within CC. Taking into consideration the lead–lag connectedness between Bitcoin and altcoins when making a portfolio management decision can generate the best diversification results in short- and long-term horizons, especially when including Litecoin and Ethereum, which provide better enhancement on a risk-adjusted basis.
As well, the COVID outbreak has cast a shadow over the cryptocurrencies market. The COVID-19 epidemic started at the end of 2019 in Wuhan and was declared a pandemic by the World Health Organization (WHO) on 11 March 2020. It is worth noting that this unexpected outbreak of the novel coronavirus has dramatically amplified the uncertainty that brought massive effects on the real economy as well as in the financial sphere. The impact of the epidemic on the cryptocurrencies market has been widely investigated (among others, Demir et al. 2020; Corbet et al. 2020; Conlon and McGee 2020). These studies revealed that there is a causal relationship between the COVID-19 outbreak and cryptocurrency price fluctuations and stipulated that as the influence of COVID-19 expands, cryptocurrencies play an interesting hedging role against uncertainty and anxiety raised by this recent pandemic.
The WC plots disclose that, during the recent pandemic, Dogecoin and Litecoin exhibited a positive and significant relationship with Bitcoin in the short-term horizon, where Bitcoin led the variability of these cryptocurrencies. Throughout the same period (end of 2019 to middle of 2020), Litecoin drove the Dogecoin movement in the short and medium terms. For all other couples, no remarkable interactions were seen across cryptocurrencies. Our findings corroborate those of Demir et al. (2020). In their paper, using a wavelet coherence analysis, the authors indicated that during the starting period of the spread of COVID-19, a negative relationship between the number of confirmed cases and deaths and Bitcoin was reported; this relationship became positive in the later period. Furthermore, the findings for other cryptocurrencies unveiled that the interactions were weaker compared to Bitcoin.

3.2. The Nexuses between Bitcoin, Altcoins, and Sentix Cryptocurrencies Index

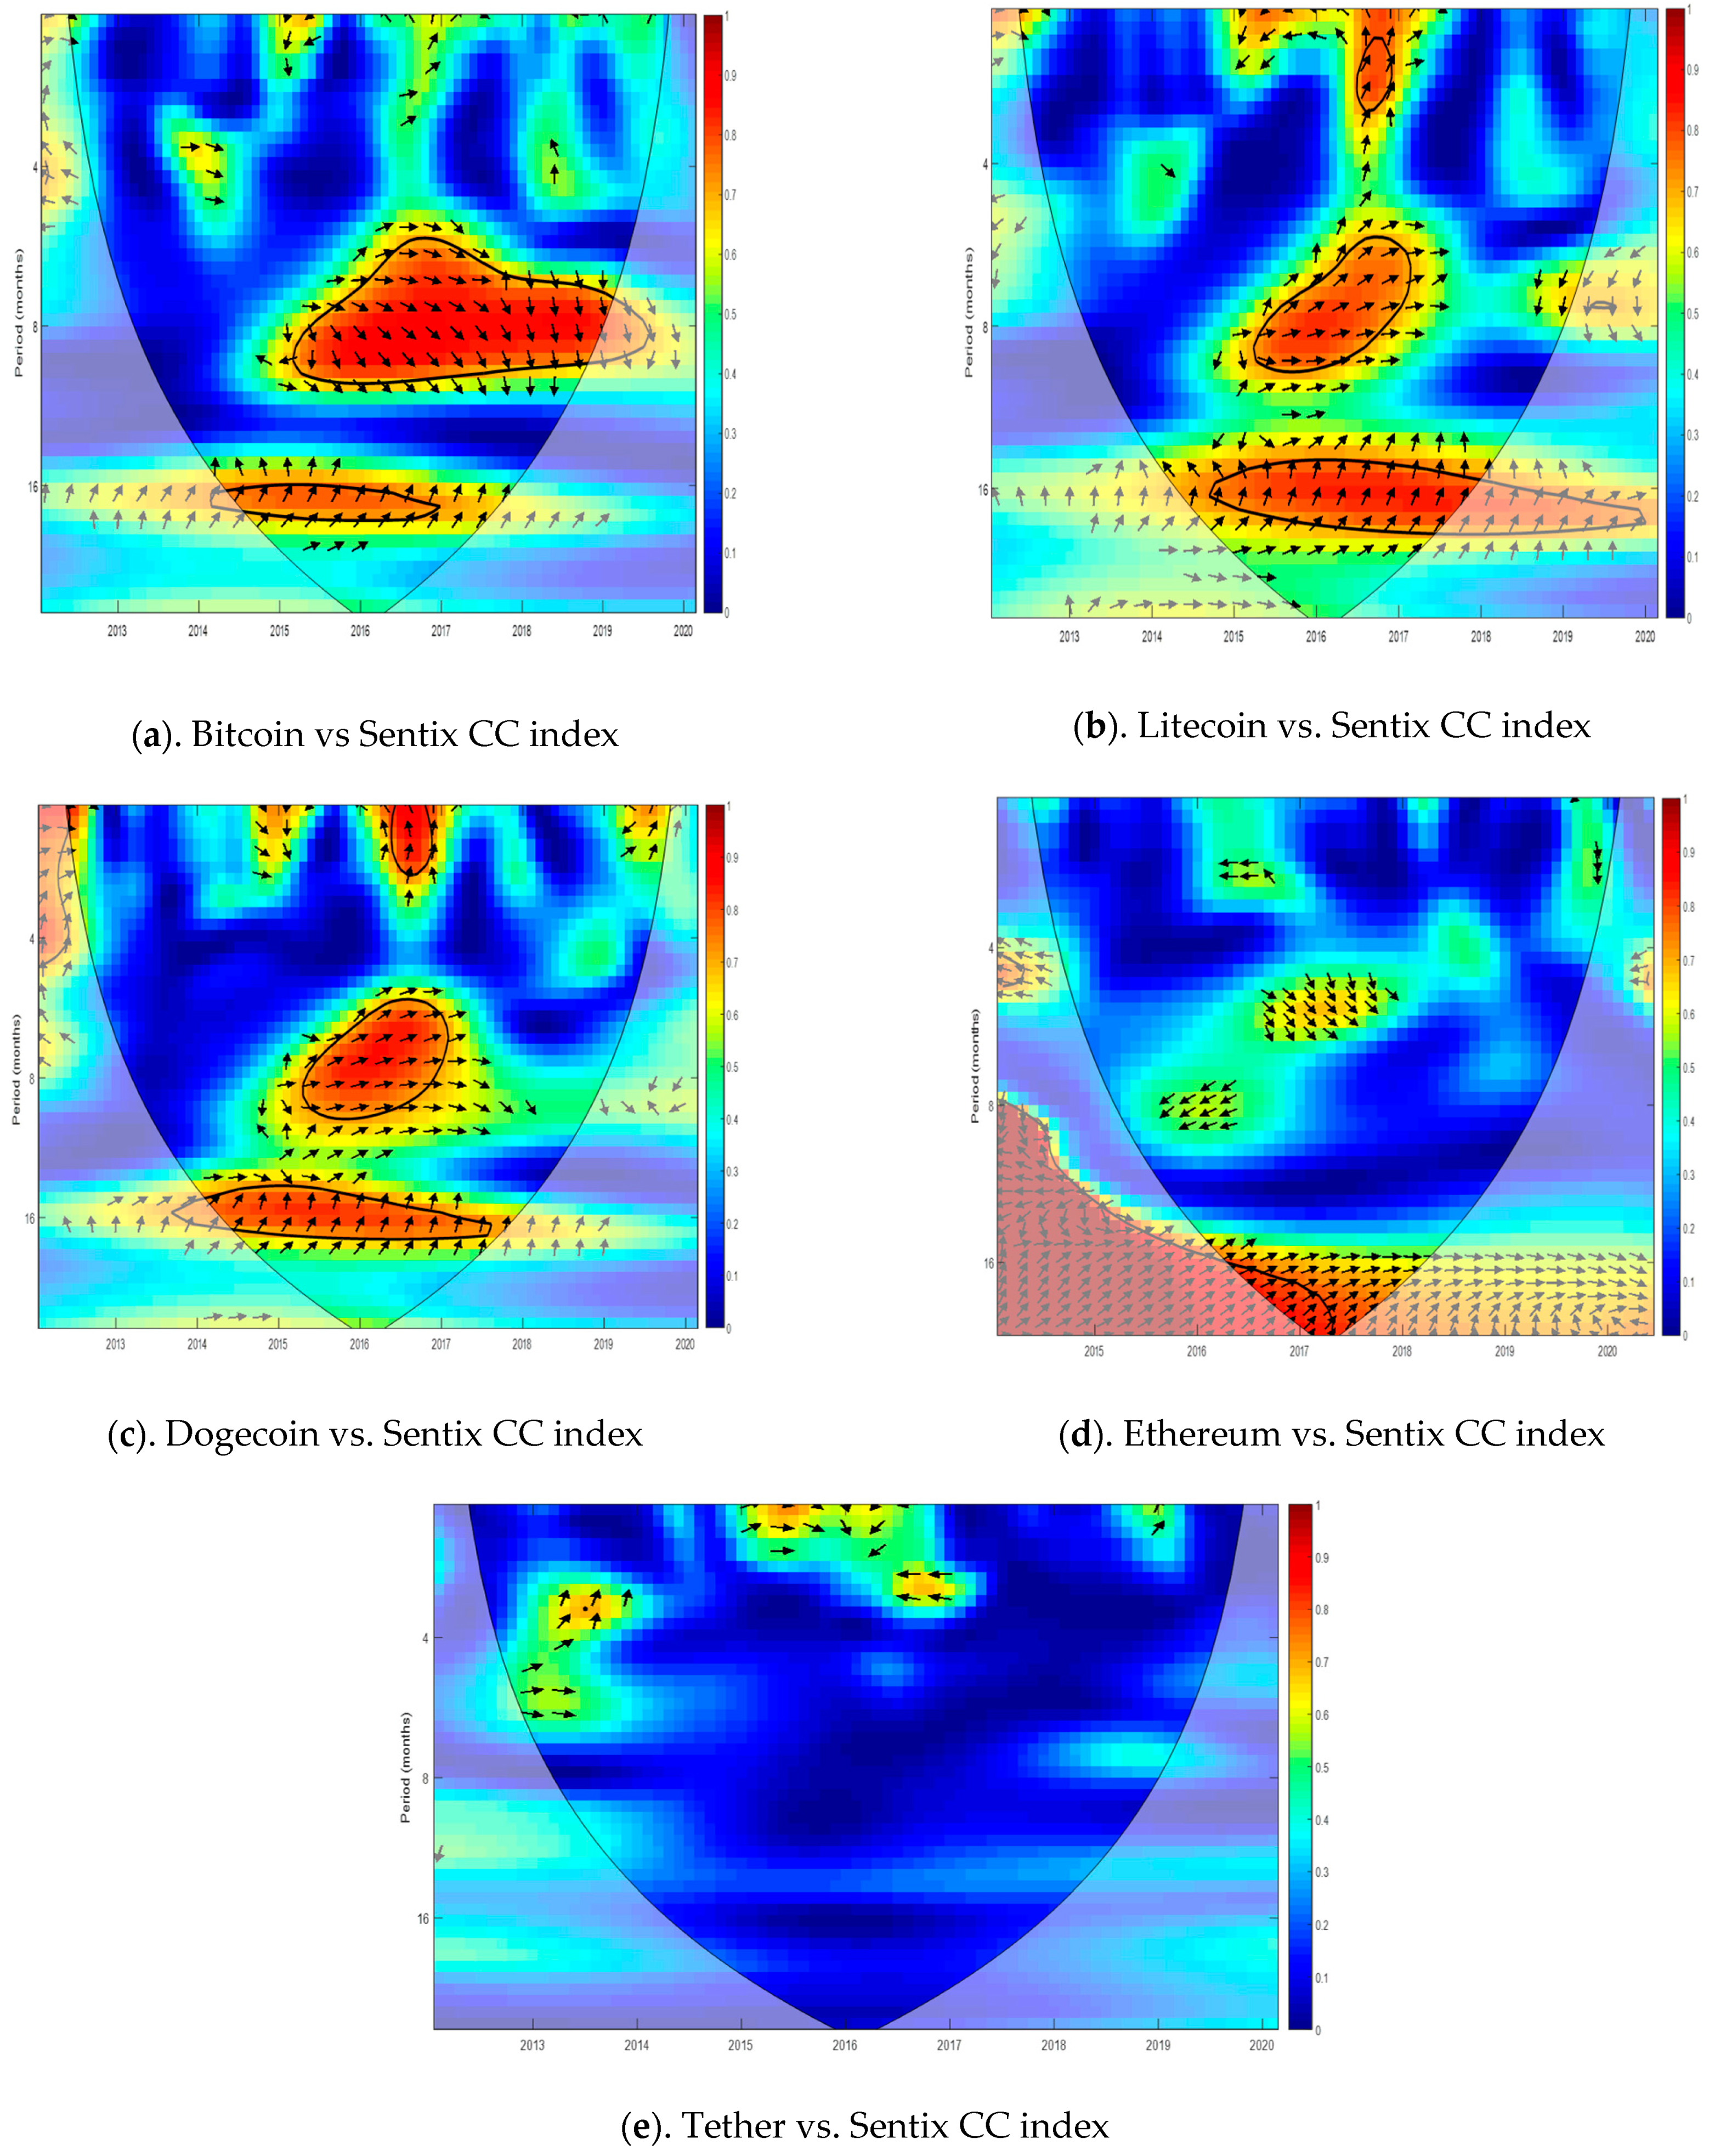
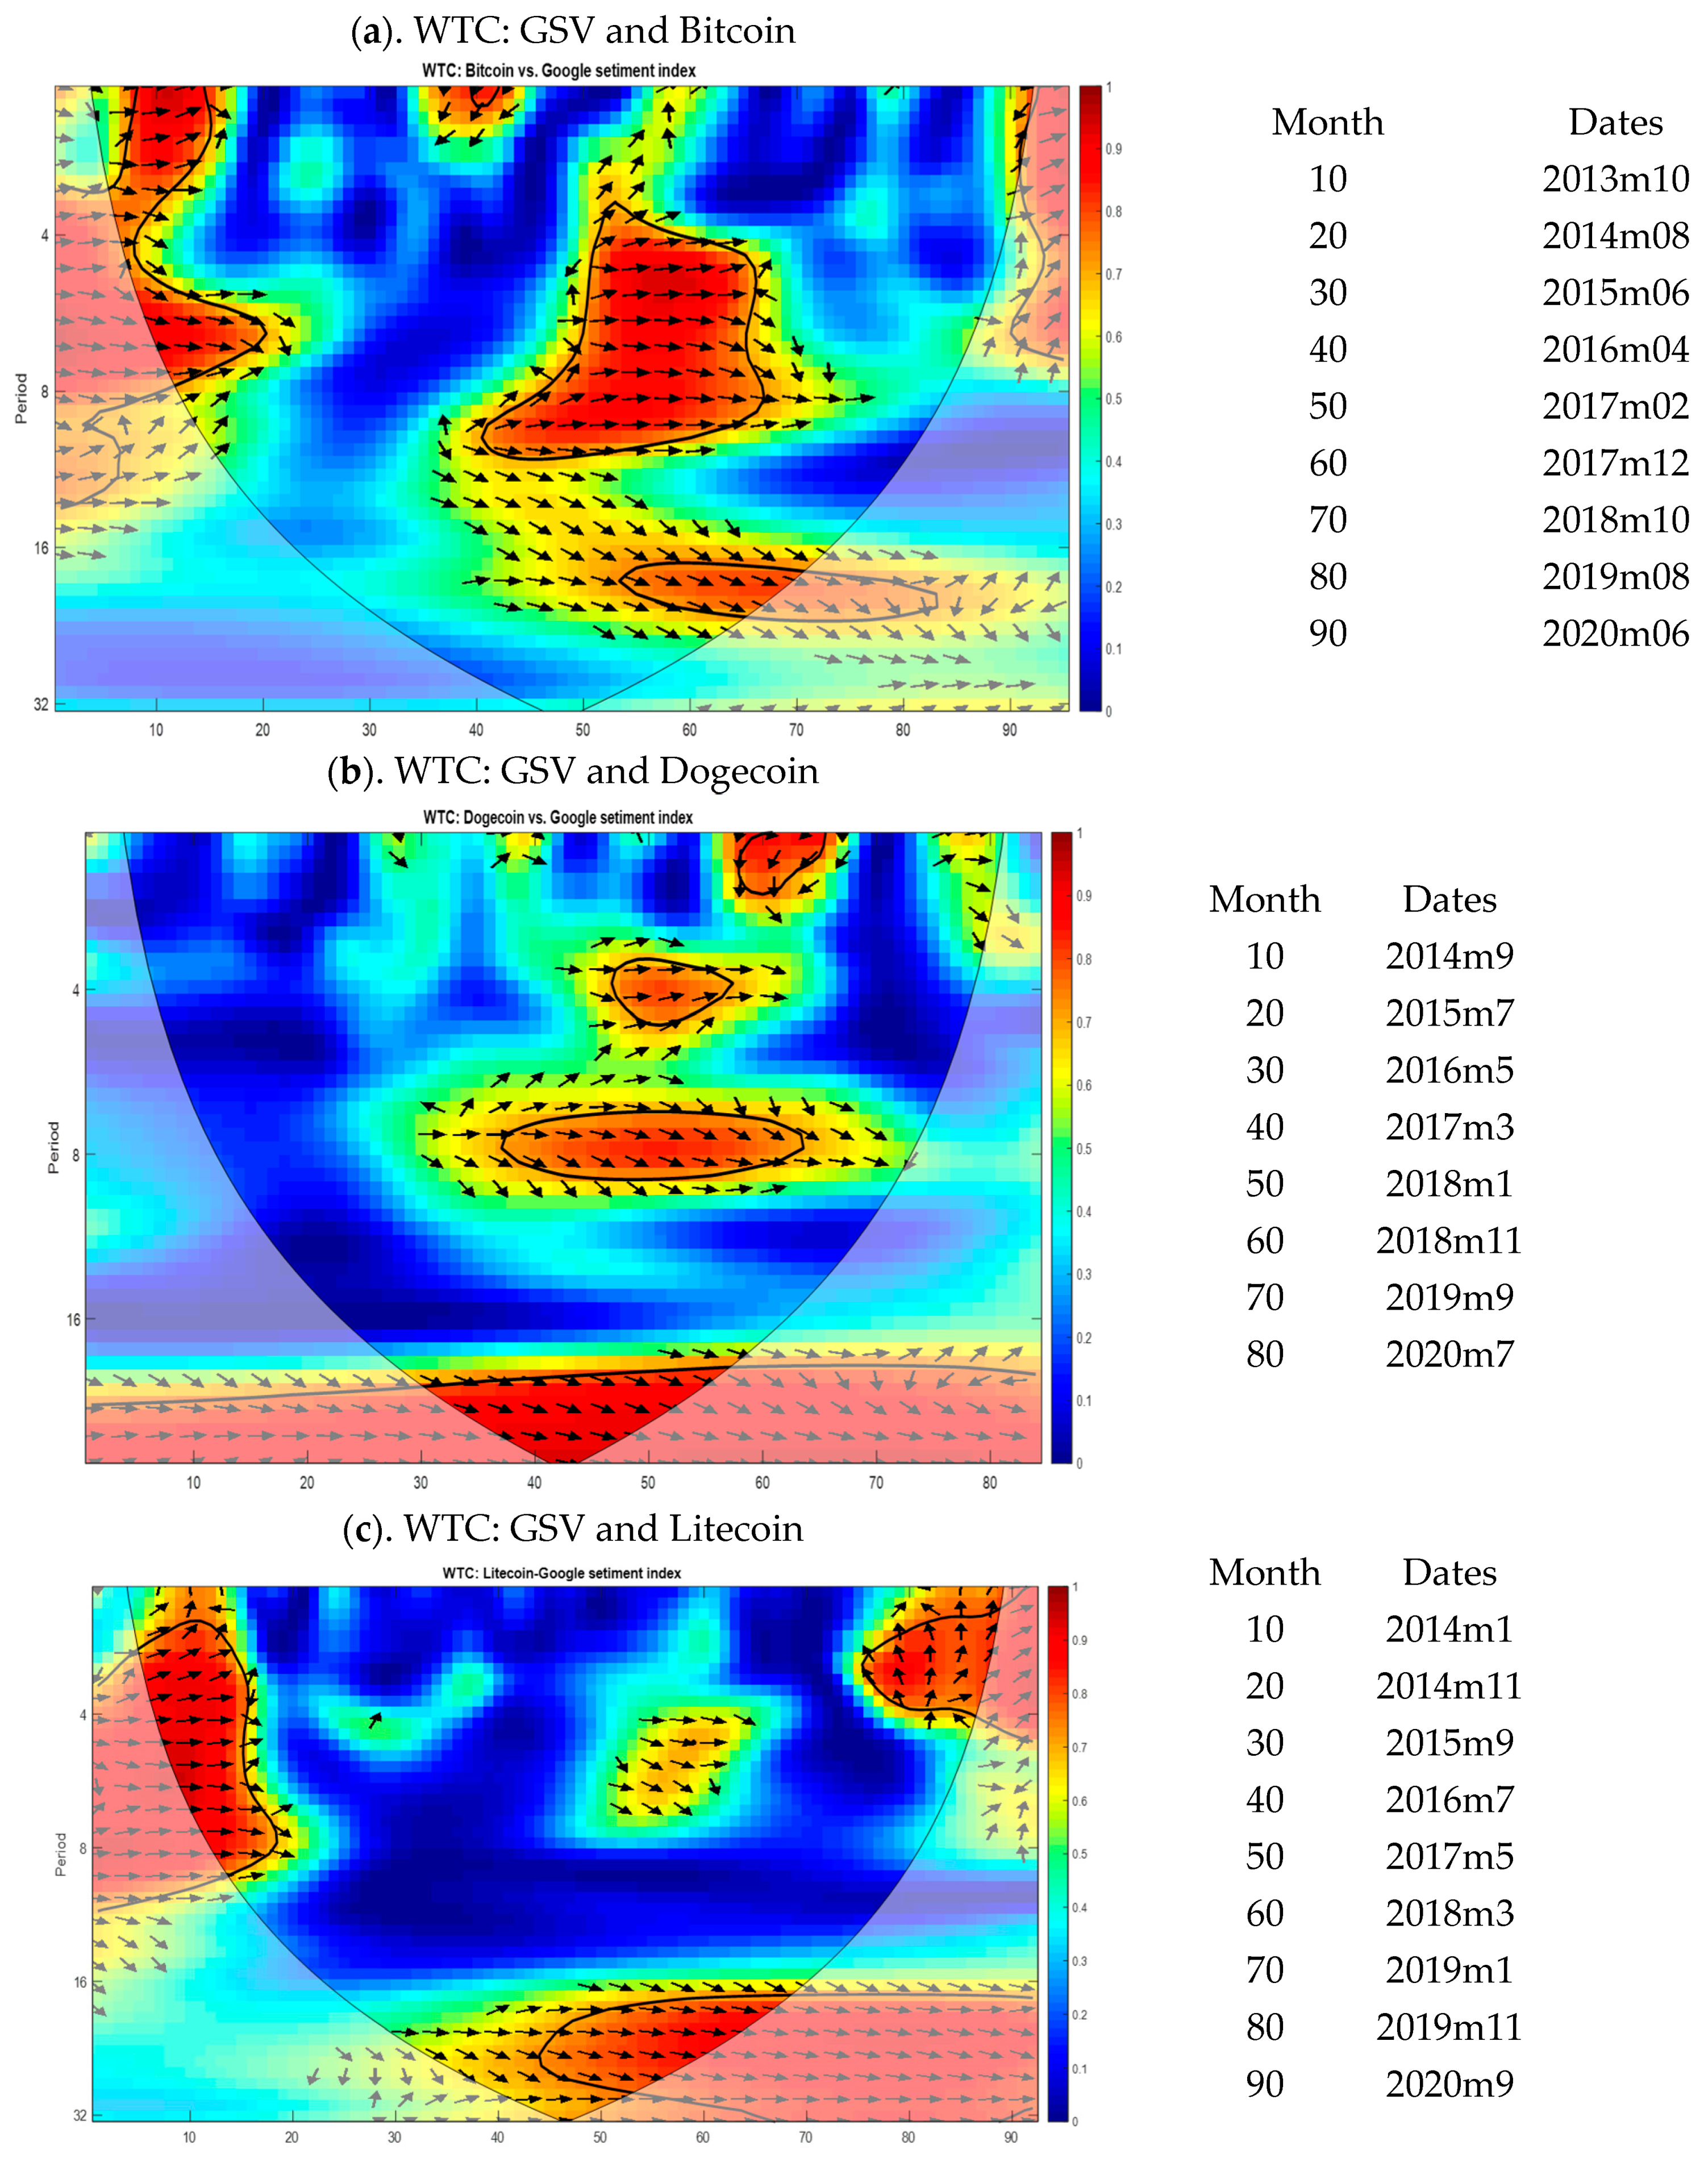
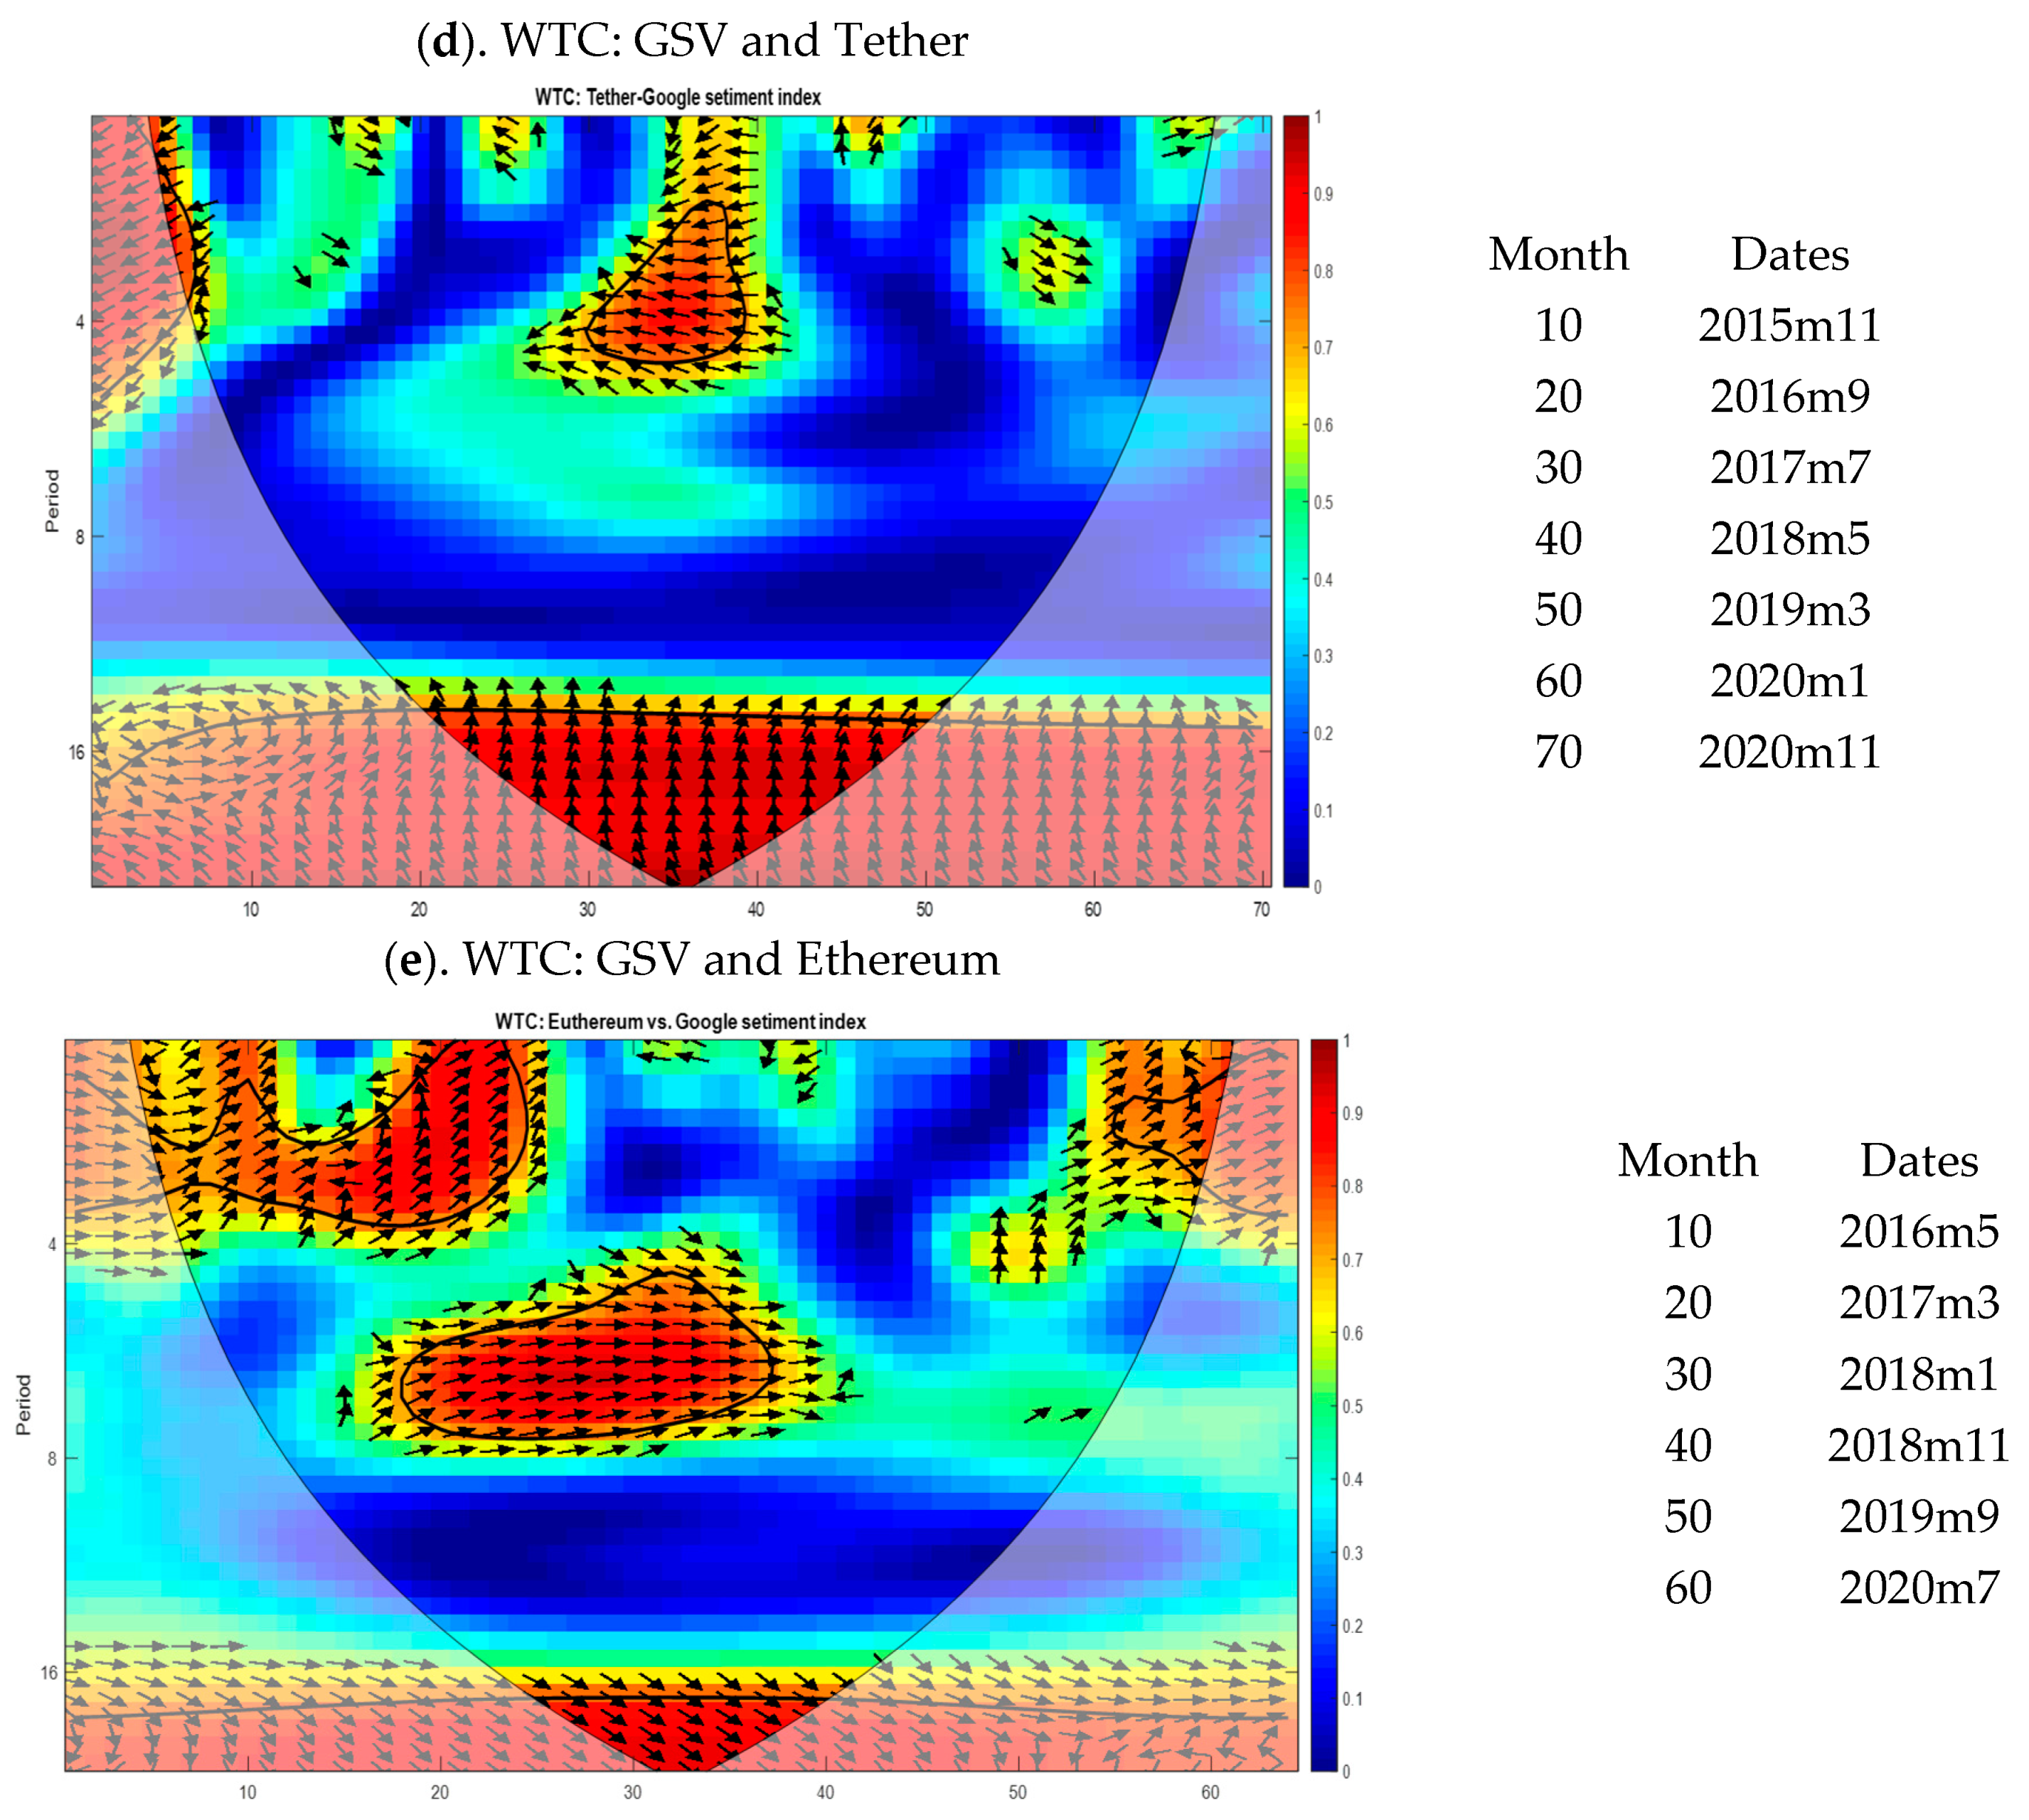
3.2.1. Interaction between CC Prices and Sentix Cryptocurrencies Index

In this part, we will focus on the multivariate relationship between Bitcoin and altcoin prices as well as the Sentix Cryptocurrency Index. Before examining the joint relationship between CC price and the SIC index in the time-scale domain, we will consider the WC between CC and the SIC index. The purpose of this part is to explore the investor sentiment role on the CC movement so as to show whether investors’ reactions and perceptions affect the cryptocurrencies’ behaviors over time and across frequency bands.
The following plot reports the coherency between Bitcoin and the Sentix Cryptocurrency Index (Figure 2a). Strong coherencies between the corresponding variables, where the Sentix index is driven, are mostly localized at the middle and low frequencies, indicating that there is a long-term relationship between Bitcoin and the investor sentiment index. The main feature of Bitcoin is that it is considered an asset rather than a virtual currency (Yuneline 2019). Created in 2009, Bitcoin is the most widely used currency with the highest market capitalization value as well as the number of daily transactions. The growth of Bitcoin has attracted large number of virtual currency users and investors. For that reason, high (resp. low) volatility and growth (resp. decline) of Bitcoin prices is likely to be excessively sensitive and vulnerable to extensive waves of investor sentiment. The arrows pointing right show an in-phase relationship between Bitcoin and the investor sentiment indexes, indicating a positive correlation and causal relationship between the time series. In another word, the Sentix index provides significant information in explaining long-term changes in Bitcoin prices, particularly when the investor sentiment is high. Mainly, our results corroborate the findings of Guègan and Renault (2020), revealing that the impact of investor sentiment is mostly localized around the Bitcoin bubble. Valencia et al. (2019) also confirmed the predictive power of investor sentiment on the movement of CC. However, our findings are inconsistent with Burggraf et al. (2020) who found that the effect of investor sentiment is lower during high sentiment regimes, and vice versa. The expected reason may be that they used financial and economic sentiment keywords, which are more prone to responding to the stock market.
It is worth remembering that during the period 2017–2018, Bitcoin experienced the biggest bubble among all previous bubbles, which exploded spectacularly. Note that in December 2017, Bitcoin stretched the greatest price in the history of any digital asset (USD 20,000). However, when the bubble burst, this speculative asset came crashing down to slumps of USD 3150. Our findings confirm, thus, the power of investor sentiment in changing the Bitcoin movement, as a positive strong coherency is highly pronounced, indicating that the Bitcoin prices are sensitive to the CC sentiment proxy. The high coherency between investor sentiment and Bitcoin during the bubble period can be explained by the increasing number of individual investors in the CC market, rise in speculation, high volatility, as well as the vulnerability of this market. Hence, the increasing number of traders in the CC market decreased investors’ confidence and boosted their bearish sentiment during the Bitcoin bubbles.
The strengthening of coherence between the Sentix Investor Confidence index and CC prices is more prominent in the long term. Mainly, in the long-term horizon, where the long-run investors are interested, the findings report that the investor sentiment proxy is considered a substantial driving factor for Bitcoin (Figure 2a), Litecoin (Figure 2b), Dogecoin (Figure 2c) and Ethereum prices (Figure 2e). The effect of the Sentix Investor Confidence index in the short term may be hidden by the enormous amount of daily news and trading activity. Our findings show also that short-term investors reactions positively impact Litecoin and Dogecoin prices.
It is remarkably shown that there is no interesting impact of the Sentix Investor Confidence index on the changing of CC prices during the COVID-19 outbreak.

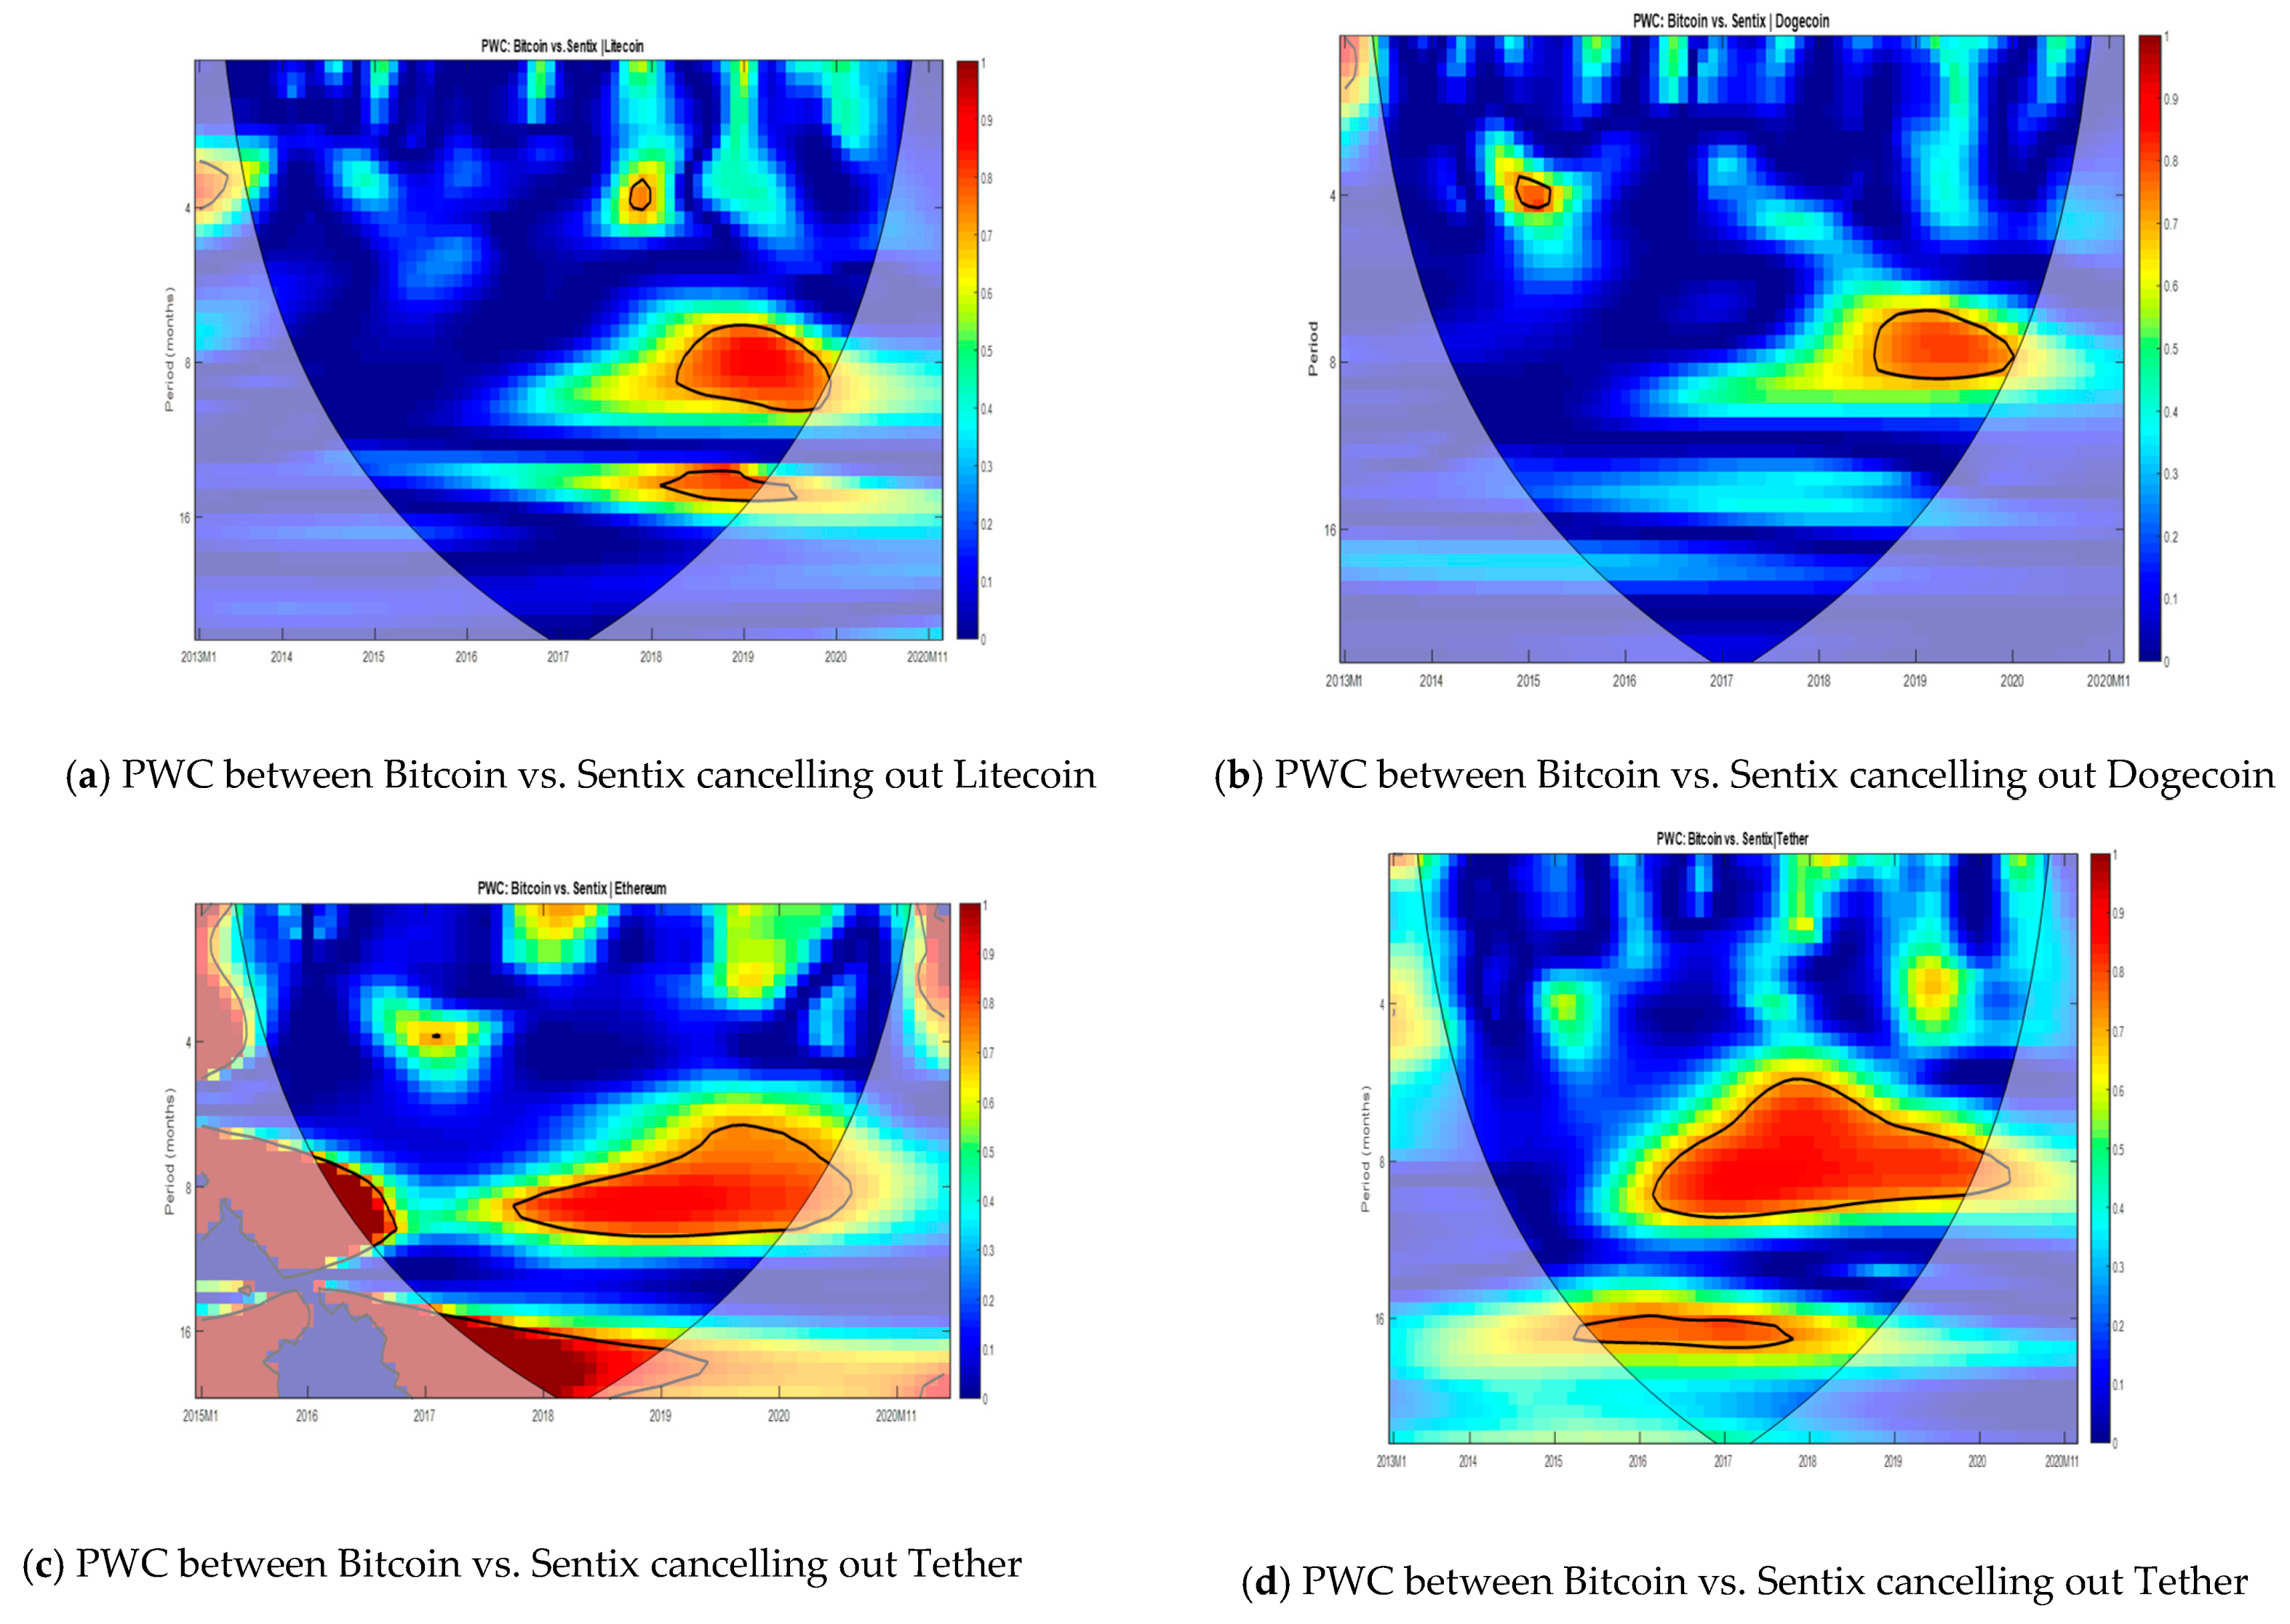
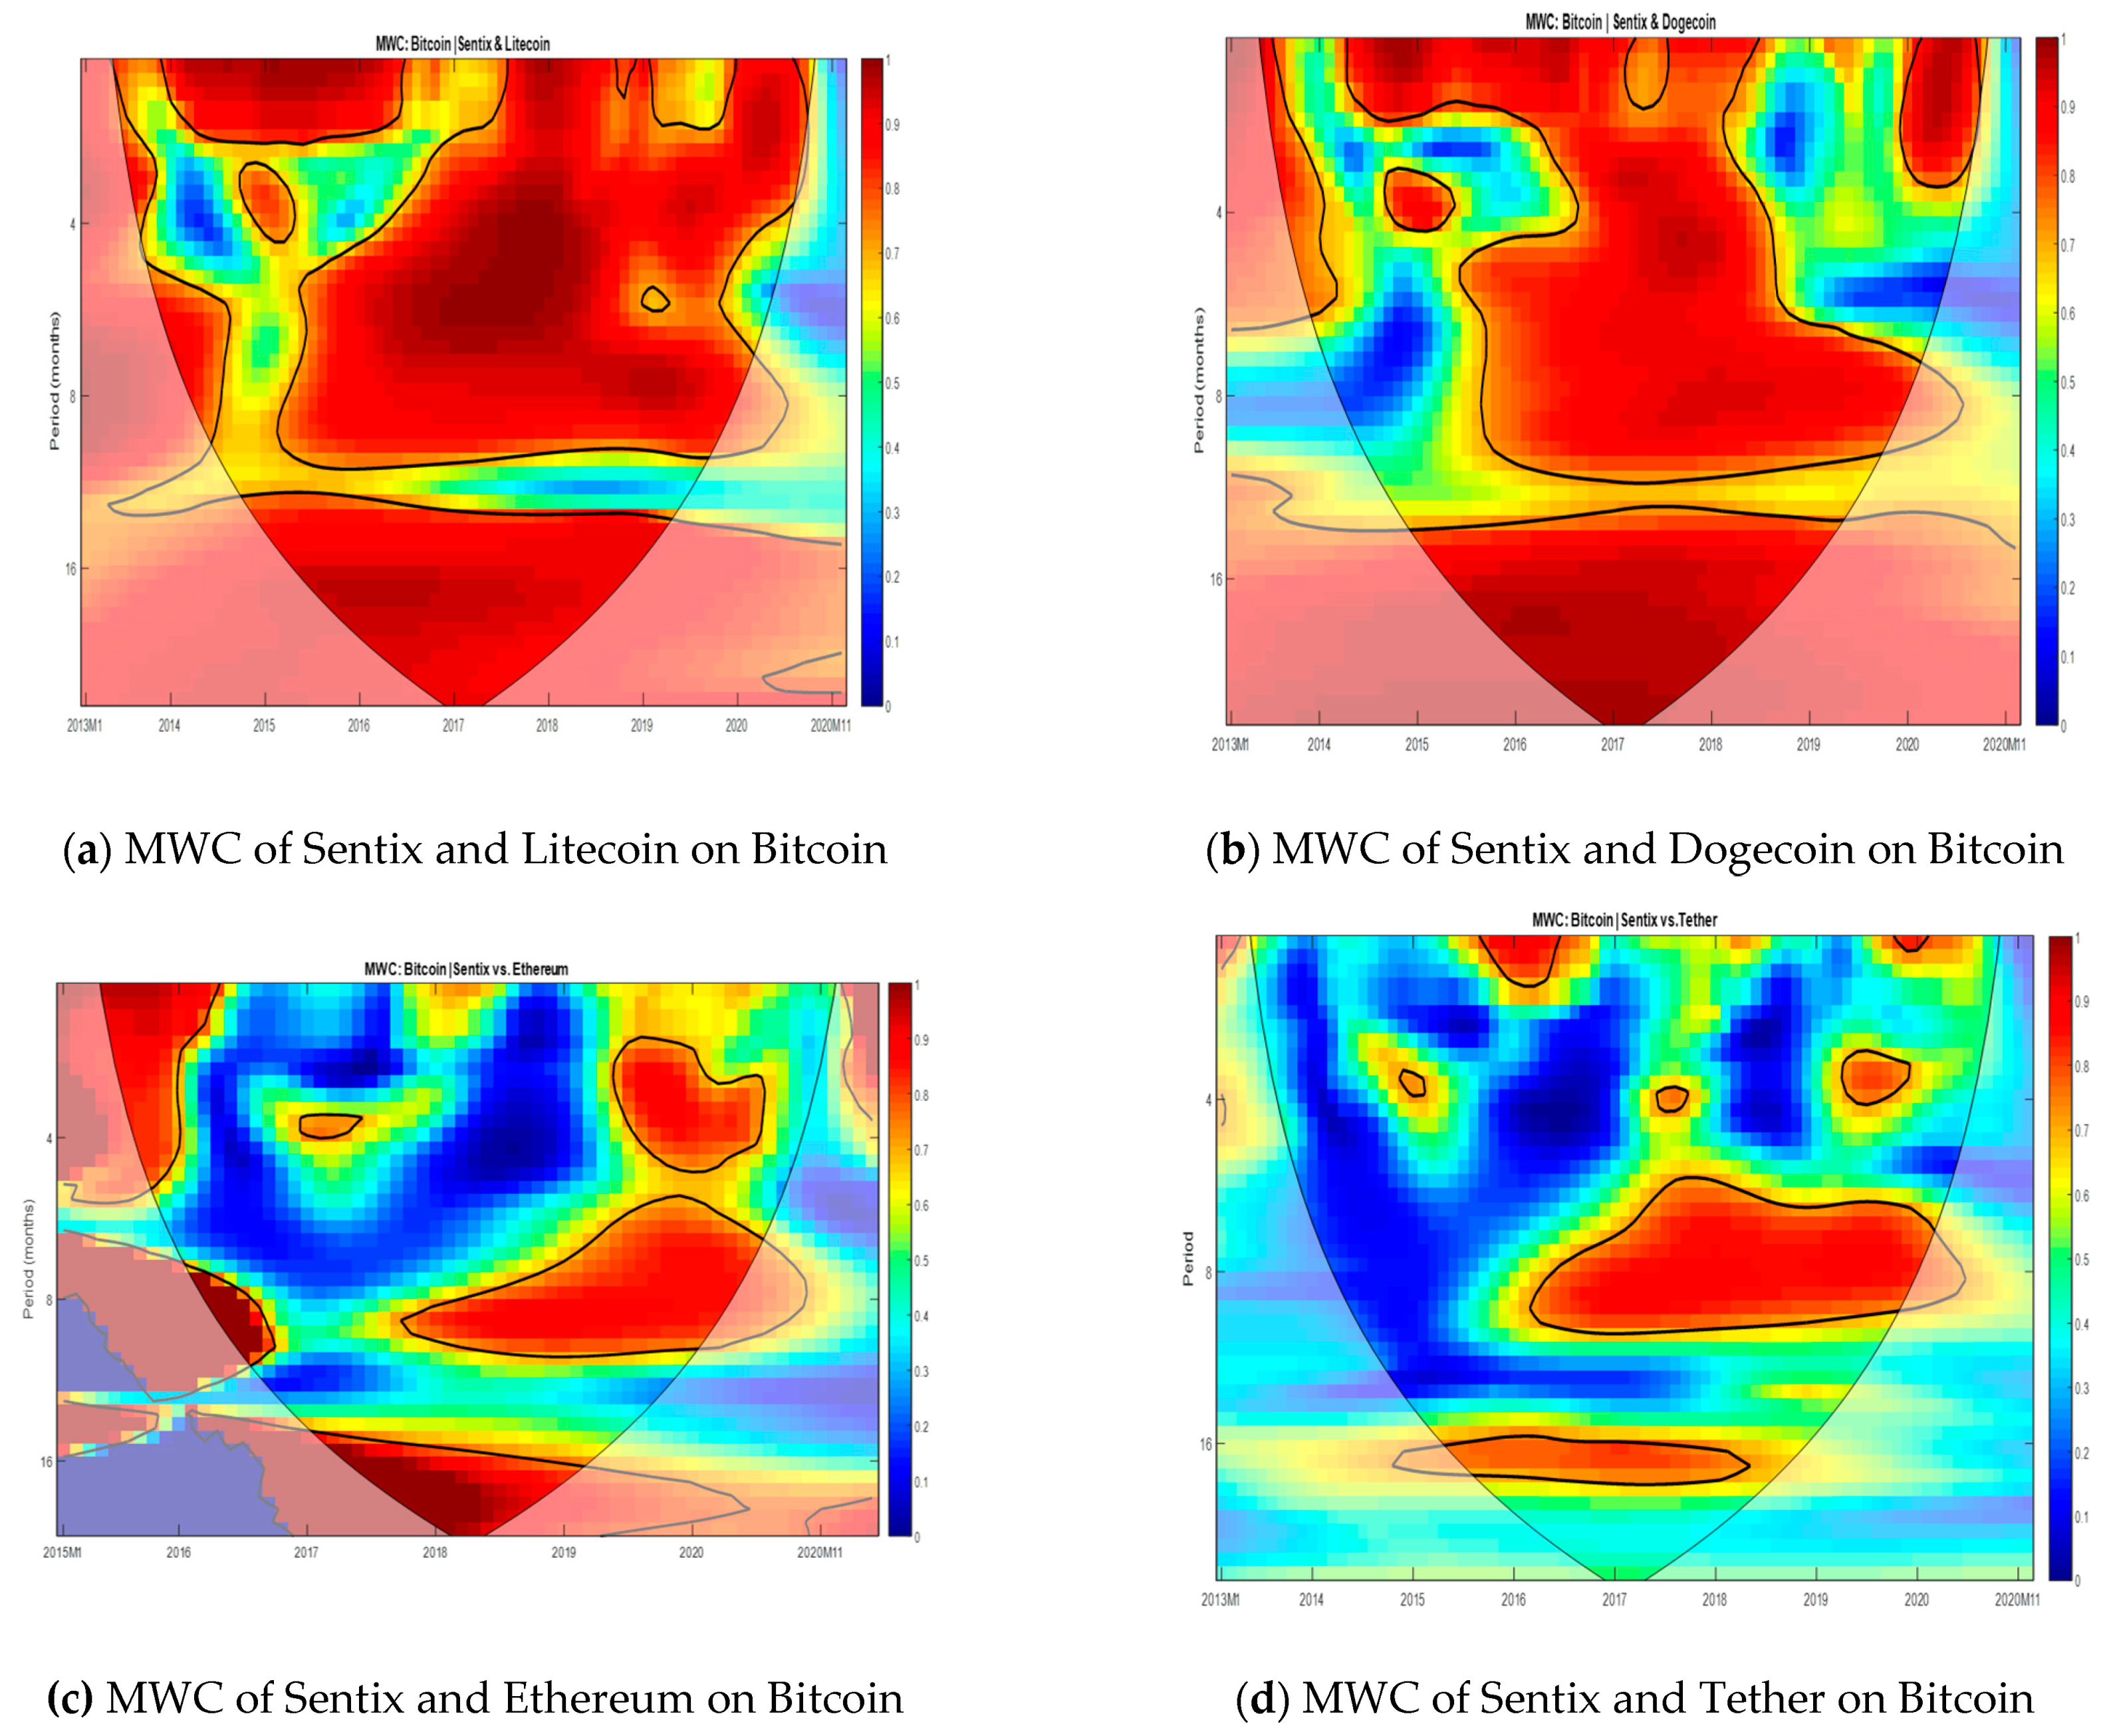
3.2.2. Multivariate Analysis: CC vs. Sentix Cryptocurrency Index

Despite the growing battery of studies using wavelet tools in finance and economic investigations, few works have applied the multiple and partial wavelet coherency tools to design the CC and SIC index connection. In our study, while the PWC identifies the resulting wavelet coherency between two time-series (Bitcoin and Sentix CC index) after cancelling out the effect of the remaining CC indexes, MWC is useful in seeking the resulting wavelet coherence of multiple independent variables (SIC index and CC indexes jointly) on a one-dependent variable (Bitcoin index). The following plots (Figure 3 and Figure 4) report, respectively, the PWC and MWC wavelet coherencies. From these graphs, interesting findings emerge. One can see from Figure 3c that, generally, when cancelling out the effect of Dogecoin, the global co-movement between Bitcoin and the SIC index show relatively strong co-movements in the middle term during the last quarter of 2019. While eliminating the effect of Dogecoin has no significant impact on the Bitcoin relationship with investor sentiment, the combined effect of Dogecoin and the SIC index on Bitcoin prices is remarkably shown over time and across frequencies. A strong correlation ranging from 0.9 to 1 is clearly perceived during the whole period. In the short run, where the short horizon investors operate, the joint effect is shown during the COVID-19 starting period. During this period, investors were sincerely doubtful about the economy and the stock market outlook in the short term.
As previously mentioned, Litecoin is like Bitcoin, and based on this similarity, cancelling out the effect of Litecoin has no impact on the co-movement between Bitcoin and investor sentiment (except for the middle (8–16) frequency band) over the period 2018–2020 (looking to Figure 3c,d plotting the PWC between Bitcoin and the Sentix cryptocurrency index when eliminating the effect of Ethereum and Tether, respectively). Bitcoin remains affected by the investor sentiment index in the middle-term horizon over the period 2018–2020. For all cases, when cancelling out the selected altcoins, no interesting coherency is shown between Bitcoin and investor sentiment in the short run.
In tandem with the last investigation, we plot the MWC between crypto-related sentiment and CC indexes on the Bitcoin index. The following plots (Figure 4a–d) reveal interesting findings. The MWC plots reveal the simultaneous contribution of the remaining CC and the Crypto-Sentix index in explaining the Bitcoin index movement. Figure 4b reports a strong joint effect of Dogecoin and the Sentix index on the Bitcoin movement and reveal, as well, that the impact of the two independent variables is remarkably perceived across all frequencies and over the whole sample period. The contribution of the investor sentiment and Dogecoin jointly on Bitcoin is precisely viewed at high (low scales) and low (high scales) frequencies, where the correlation ranges from 0.8 to 1. Mainly, over the sub-period 2017–2018, corresponding to the Bitcoin bubble, a high combined effect is pronounced (squared correlation is closed to the unity) of the variables on the Bitcoin prices. During the COVID-19 epidemic, Bitcoin was strongly and significantly affected by the Dogecoin and Crypto Sentix. While during this sensitive period of uncertainty and anxiety, Bitcoin and most cryptocurrencies were hit hard and lost roughly half of their value on March 12, the literature does not yet explain the causes of this plunge. Our findings reveal clearly that the impacts of investors’ behavior (bearish) and the change in other altcoins prices during the COVID-19 outbreak, simultaneously, strongly affected the movement of Bitcoin.
The multiple wavelet figure relative to the jointly contribution of Litecoin and Sentix index in explaining Bitcoin change is shown in Figure 4a. The map color of this plot discloses interesting findings. The joined effect of the Sentix index and Litecoin on Bitcoin is unveiled over short- and long-term horizons and cover the whole sample period. Our findings demonstrate that during uncertainty periods (2017–2018, corresponding to Bitcoin bubble) and the COVID-19 outbreak (end of 2019–2020), the Bitcoin price movement was strongly affected by Litecoin price fluctuations and investor behavior. We found that the increasing fear of the new virus epidemic combined with Litecoin price changes strongly impacted Bitcoin prices, which proves that during distress periods Bitcoin behaves more like financial assets rather than traditional safe-haven assets (Chen et al. 2020).
In the same vein of analysis, Figure 4d reports the combined influence of Tether and the SIC index on Bitcoin in the time–frequency domain. This joined impact of the independent variables is especially localized in the medium and long term (resp. 4–8 and 16–32) months of scales, revealing that the investor sentiment combined with Tether prices influence Bitcoin in the long-run where the correlation ranges generally between 0.8 and 0.9, spending particularly the sub-period 2015–2016 and 2017–2019 as well as the new COVID-19 outbreak. This impact is expected to be the first sub-period corresponding to the foundation date of Tether, known originally as Realcoin or “stable coin”. Griffin and Shams (2020) claimed that correlations are shown between the printing of Tether and the fluctuation of Bitcoin’s price. The second sub-period corresponds to the Bitcoin bubble and the post-Bitcoin bubble. According to Griffin and Shams (2020), after 2018, Tether was used to manipulate and inflate Bitcoin. Furthermore, bad economic news around COVID-19 deaths and infected cases over the world impacted the cryptocurrency price patterns as well as the association between them. It is mainly shown that the combined effect of Tether and the SIC index on the Bitcoin price movement is clearly illustrated in the short and medium horizons. As well, the same findings are revealed in Figure 4d when we combine both the effect of the Sentix index and Ethereum on Bitcoin movements in the time–frequency space.
In synopsis, the inspection of the MWC plots allows us to reveal the interesting influence of CC prices and the Sentix index on Bitcoin movement. This impact is perceived across scales (short run and long run) and over the whole sample period. Our findings corroborate those of Ciaian et al. (2018) with some main evidence. First, Bitcoin and altcoins are extremely interdependent. This interdependence is clearly shown when combining the Sentix and CC to visualize the joint effect on Bitcoin. Second, the altcoins are like Bitcoin. The partial wavelet coherence plots exhibit no coherency effect of altcoins on the co-movement between Bitcoin and investor sentiment, especially in the short horizon. However, contrary to Ciaian et al. (2018), all altcoins are not totally affected by Bitcoin and follow its price dynamics. In some periods and across different scale bands, altcoins can drive the Bitcoin price movements. It is also noteworthy that during Bitcoin bubble, the combined effect can be attributed to many factors. The role of information about Bitcoin and departure from the market efficiency hypothesis allow other altcoins to be alternative investment opportunities for potential investors, which can influence the Bitcoin prices movement. As well, bullish (bearish) investors sentiment is driving the Bitcoin price movements in which the negative bearish impact of investor sentiment on Bitcoin seems to be more pronounced than the positive impact of bullish investor sentiment.

4. Robustness Check and Discussion

To validate the main findings of our study, we employed a robustness test to analyze the co-movement between the Google search volume (hereafter GSV) and the study’s sample cryptocurrencies. The intensive use of the Google search engine and other social media to track news and financial events may transmit a real time signal to the investor sentiment. Indeed, it does not mirror only the attitude of market operators and accumulated data related to the volume of search queries, but rather also provides an idea on the households’ future predictions and decisions (see Gao et al. 2020).
Primarily, Da et al. (2011) and Joseph et al. (2011), among others, used company’s names and tickers as a measure of investor sentiment/attention to predict stock returns. In contrast, recently studies tilted their focus to examine the predictability of GSV information transmission in the cryptocurrency market (Aalborg et al. 2019; Baig et al. 2019; Nasir et al. 2019, among others). For instance, Baig et al. (2019) demonstrated the positive impact of investor sentiment (proxied by GSV) on Bitcoin prices. Likewise, Nasir et al. (2019) found GSV to have a significant, short-term positive effect on cryptocurrency returns.
Following the studies of Joseph et al. (2011) and Baig et al. (2019), we employed GSV of respective cryptocurrencies as a measure of investor sentiment to illustrate their time–frequency coherence with cryptocurrency returns. Monthly GSV series of “Bitcoin”, “Litecoin”, “Ethereum”, “Dogecoin” and “Tether” were retrieved using the link (https://www.google.com/trends/ accessed on 25 November 2020). We deemed that our designated investor sentiment measure unfolds three main benefits. First, it is a direct sentiment measure determined by inspecting objective variables implicitly evocative of investor sentiment. Second, GSV is a free, publicly available source, providing household search intensity at multiple frequencies, region-wise, from January 2004 and onward (Khan et al. 2019). Third, GSV represents the investors sentiment, which might help traders to make more informed investment decisions.
Figure 5 displays the wavelet coherence of the GSV-based investor sentiment correlation with cryptocurrencies at multiple times and frequencies. Plot 5a reveals that GSV-based investor sentiment exhibits significant coherence with Bitcoin’s price in the short-term at the end of 2013, start of 2014, and during 2014, 2016 and 2018 in the medium-term (Bitcoin’s bubble period) and a moderate coherence in the long-term. The coherence between Bitcoin’s price and the GSV-based investor sentiment suggests that investor sentiment is more effective for explaining Bitcoin’s price movement during high-sentiment periods. Figure 5b illustrates a strong, significant coherence of GSV-based investor sentiment with Dogecoin’s prices in the long-term, whereas a moderate coherence is perceived in the short and medium-term. It is worth noting that in the long horizons phase, the pattern reveals that GSV-based investor sentiment derives positive significant variations in the prices of Dogecoin. Plot 5c highlights the presence of strong correlation between GSV-based investor sentiment and Litecoin prices at the beginning of the sample period in the short-term, whereas a moderate correlation is revealed in the long-term (50–63 months) and in the short-term (75–90 months), showing that GSV-based investor sentiment drives Litecoin prices over time and across scales.
Likewise, Plot 5d presents strong coherence of GSV-based investor sentiment with Tether in the long term, from 20 to 50 months. For this scale, the GSV-based investor sentiment leads the Tether’s prices change. As well, in the short term, smaller episodes of coherence are perceived, showing that GSV-based investor sentiment exhibited a moderate significant correlation with Tether’s prices from 8 to 10 months and 31 to 39 months of investment horizons. However, GSV-based investor sentiment demonstrated a stronger correlation with Ethereum across all investment horizons, which suggests some convincing fluctuations in Ethereum prices.
Our findings, shown in Figure 5, are consistent with those of Nasir et al. (2019) and Aalborg et al. (2019), which reveal significant nexuses of GSV with cryptocurrency returns. Our findings reveal the expected insights by showing GSV as a stronger predictive investor sentiment in the cryptocurrency market at multiple time-frequencies, particularly during high sentiment horizons.

5. Concluding Remarks

Prior studies made an effort to examine the relationship between investor sentiment and CC returns. However, we attempted in this paper to investigate the time-frequency nexus between CC prices and investor sentiment. Moreover, the study analysis was extended to three variables, using multiple wavelet coherence. We used CCs listed on “Coinmarketcap” site, dated on “15 November 2020”, and the Sentix Investor Confidence index collected from DataStream. When looking to the coherency between cryptocurrencies and the SIC index, strong coherencies were mostly localized at low frequencies, indicating that there is a long-term, positive relationship between CC and the SIC index. Our findings demonstrate also that Sentix drives cryptocurrencies price changes across frequencies and investment horizons, particularly in the long run and during the Bitcoin crisis period. As well, after combining the effect of CC and Sentix, the MWC plots display a jointly strong influence of CC prices and the SIC index on Bitcoin price movements across all frequencies and over the sample period of the study.
Furthermore, for robustness purposes, we employed Google search volume as a proxy of investor sentiment to illustrate the coherency with the CC. The GSV-based investor sentiment exhibited a strong predictive power on the cryptocurrency market across all scales band. The overall findings of the study imply that investor sentiment plays a crucial role on the variation of CC price in the frequency–time space. The financial implications of our study lie in the following two aspects. First, investor sentiment is a timely indicator in the financial markets, whereby an investor can earn higher returns than market returns. The positive in the short run versus the negative in the long run asymmetry correlation between SIC and Bitcoin directs investors to opt for a stylized investment strategy in the CC market. Precisely, the findings support passive investors and day traders who intend to earn higher capital gain by trading against sentiment risk. Second, generally, investors believe Bitcoin movement to be a barometer for other CCs in the market. However, this study confirms the influence of CCs along with the SIC on Bitcoin. It indicates that investors must hedge against CC prices while scheming their financial decision making. In future, for optimal trading strategies, the study can be extended by including stock prices and exchange rates. As in the trader’s view, CC is an alternative to speculative assets and virtual money. The extended study will be able to provide evidence against CC as an alternative strategy to the stock or exchange markets when sentiments are high in the market.

Author Contributions

For this research, all authors contributed to its elaboration. Mainly, conceptualization, B.H. and H.A.A.; methodology, B.H.; software, B.H.; validation, B.H., H.A.A., and M.A.K.; formal analysis, H.A.A.; investigation, B.H.; resources, B.H.; data curation, M.A.K.; writing—original draft preparation, B.H.; writing—review and editing, B.H.; visualization, H.A.A.; supervision, B.H.; project administration, H.A.A.; funding acquisition, H.A.A. All authors have read and agreed to the published version of the manuscript.

Funding

This research was supported by a grant from the Deanship of Scientific Research, at the University of Jeddah through the research proposal No. (UJ-02-002-DR).

Institutional Review Board Statement

Not applicable.

Informed Consent Statement

Not applicable.

Data Availability Statement

Not applicable.

Acknowledgments

The authors of this research would like to present their great appreciation to the Deanship of Scientific Research for their supporting and funding this research. Without this support, we would not have succeeded.

Conflicts of Interest

The authors declare no conflict of interest.

References

  1. Aalborg, Halvor Aarhus, Molnár Peter, and Jon Erik de Vries. 2019. What can explain the price, volatility and trading volume of Bitcoin? Finance Research Letters 29: 255–65. [Google Scholar] [CrossRef]
  2. Aysan, Ahmet Faruk, Ender Demir, Giray Gozgor, and Chi Kenug Marco Lau. 2019. Effects of the geopolitical risks on Bitcoin returns and volatility. Research in International Business Finance 47: 511–18. [Google Scholar] [CrossRef] [Green Version]
  3. Baig, Ahmed, Benjamin M. Blau, and Nasim Sabah. 2019. Price Clustering and Sentiment in Bitcoin. Finance Research Letters 29: 111–16. [Google Scholar] [CrossRef]
  4. Bariviera, Aurelio F. 2017. The inefficiency of Bitcoin revisited: A dynamic approach. Economics Letters 161: 1–4. [Google Scholar] [CrossRef] [Green Version]
  5. Bouoiyour, Jamal, Refk Selmi, Aviral K. Tiwari, and Muhammad Shahbaz. 2015. The nexus between oil price and Russia’s real exchange rate: Better paths via unconditional vs. conditional analysis. Energy Economics 51: 54–66. [Google Scholar] [CrossRef] [Green Version]
  6. Burggraf, Tobias, Toan Luu Duc Huynh, Markus Rudolf, and Mei Wang. 2020. Do FEARS drive Bitcoin? Review of Behavioral Finance. [Google Scholar] [CrossRef]
  7. Chen, Conghui, Lanlan Liu, and Ningru Zhao. 2020. Fear Sentiment, Uncertainty, and Bitcoin Price Dynamics: The Case of COVID-19. Emerging Markets Finance and Trade 56: 2298–309. [Google Scholar] [CrossRef]
  8. Chu, Jeffrey, Yuanyuan Zhang, and Stephen Chan. 2019. The adaptive market hypothesis in the high frequency cryptocurrency market. International Review of Financial Analysis 64: 221–31. [Google Scholar] [CrossRef]
  9. Ciaian, Pavel, Miroslava Rajcaniova, and DArtis Kancs. 2018. Virtual relationships: Short- and long-run evidence from BitCoin and altcoin markets. Journal of International Financial Markets, Institutions and Money 52: 173–95. [Google Scholar] [CrossRef]
  10. Conlon, Tomas, and Richard McGee. 2020. Safe haven or risky hazard? Bitcoin during the COVID-19 bear market. Finance Research Letters 35: 101607. [Google Scholar] [CrossRef]
  11. Corbet, Shaen, Andrew Meegan, Charles Larkin, Brian Lucey, and Larisa Yarovaya. 2018. Exploring the dynamic relationships between cryptocurrencies and other financial assets. Economic Letters 165: 28–34. [Google Scholar] [CrossRef] [Green Version]
  12. Corbet, Shaen, Brian Lucey, Andrew Urquhart, and Larisa Yarovaya. 2019. Cryptocurrencies as a financial asset: A systematic analysis. International Review of Financial Analysis 62: 182–99. [Google Scholar] [CrossRef] [Green Version]
  13. Corbet, Shaen, Charles Larkin, and Brian Lucey. 2020. The Contagion Effects of the COVID-19 Pandemic: Evidence from Gold and Cryptocurrencies. Finance Research Letters 35: 101554. [Google Scholar] [CrossRef]
  14. Da, Zhi, Joseph Engelberg, and Pengjie Gao. 2011. In Search of Attention. The Journal of Finance 66: 1461–99. [Google Scholar] [CrossRef]
  15. Demir, Ender, Giray Gozgor, Chi Keung Marco Lau, and Samuel A. Vigne. 2018. Does economic policy uncertainty predict the Bitcoin returns? An empirical investigation. Finance Research Letters 26: 145–49. [Google Scholar] [CrossRef] [Green Version]
  16. Demir, Ender, Mehmet Huseyin Bilgin, Gokhan Karabulut, and Asli Cansin Doker. 2020. The Relationship between Cryptocurrencies and COVID-19 Pandemic. Available online: https://www.ssrn.com/abstract=3585147 (accessed on 25 April 2020).
  17. Drobetz, Wolfgang, Paul. P. Momtaz, and Henning Schroder. 2019. Investor Sentiment and Initial Coin Offerings. The Journal of Alternative Investments 21: 41–55. [Google Scholar] [CrossRef]
  18. Eom, Cheoljun, Taisei Kaizoji, Sang Hoon Kang, and Lukas Pichl. 2019. Bitcoin and investor sentiment: Statistical characteristics and predictability. Physica A: Statistical Mechanics Its Applications 514: 511–21. [Google Scholar] [CrossRef]
  19. Fang, Libing, Elie Bouri, Rangan Gupta, and David Roubaud. 2019. Does global economic uncertainty matter for the volatility and hedging effectiveness of Bitcoin? International Review of Financial Analysis 61: 29–36. [Google Scholar] [CrossRef]
  20. Gao, Zhenyu, Haohan Ren, and Bohui Zhang. 2020. Googling investor sentiment around the world. Journal of Financial and Quantitative Analysis 55: 549–80. [Google Scholar] [CrossRef] [Green Version]
  21. Griffin, John, and Amin Shams. 2020. Is Bitcoin Really Un-Tethered? The Journal of Finance 75: 1913–64. [Google Scholar] [CrossRef]
  22. Guègan, Dominique, and Thomas Renault. 2020. Does investor sentiment on social media provide robust information for Bitcoin returns predictability? Finance Research Letters 38: 101494. [Google Scholar] [CrossRef]
  23. Gurdgiev, Constantin, and Daniel OLoughlin. 2020. Herding and Anchoring in Cryptocurrency Markets: Investor Reaction to Fear and Uncertainty. Journal of Behavioral and Experimental Finance 25: 100271. [Google Scholar] [CrossRef]
  24. Härdle, Wolfgang Karl, Campbell R. Harvey, and Raphael C. G. Reule. 2020. Understanding cryptocurrencies. Journal of Financial Econometrics 18: 181–208. [Google Scholar] [CrossRef]
  25. Joseph, Kissan, Babajide M. Wintoki, and Zelin Zhang. 2011. Forecasting Abnormal Return and Trading Volume Using Investor Sentiment: Evidence from Online Search. International Journal of Forecasting 27: 1–21. [Google Scholar] [CrossRef]
  26. Karalevicius, Vytautas, Niels Degrande, and J. De Weerdt. 2018. Using sentiment analysis to predict interaday Bitcoin price movements. The Journal of Risk Finance 19: 56–75. [Google Scholar] [CrossRef]
  27. Asif Khan, Muhammad, Rubi Ahmad, Anna Azmi, and Muhammad Akbar. 2019. A new sentiment index for the Islamic stock market. Investment Analysts Journal 48: 146–72. [Google Scholar] [CrossRef]
  28. Kraajeveld, Olivier, and Johannes De Smed. 2020. The predictive power of public Twitter sentiment for forecasting cryptocurrency prices. Journal of International Financial Markets, Institutions and Money 65: 101188. [Google Scholar] [CrossRef]
  29. Kristoufek, Ladislav. 2013. BitCoin meets Google Trends and Wikipedia: Quantifying the relationship between phenomena of the Internet era. Scientific Reports 3: 3415. [Google Scholar] [CrossRef] [Green Version]
  30. Lansky, Jan. 2016. Analysis of Cryptocurrencies Price Development. Acta Informatica Pragensia 5: 118–37. [Google Scholar] [CrossRef]
  31. Li, Tianyu Ray, Anup S. Chamrajnagar, Xander R. Fong, Nickolas R. Rizik, and Feng Fu. 2019. Sentiment-Based Prediction of Alternative Cryptocurrency Price Fluctuations Using Gradient Boosting Tree Model. Frontiers in Physics 7: 98. [Google Scholar] [CrossRef]
  32. Lopez-Cabarcos, M. Angeles, Adam M. Perez-Pico, Juan Pineiro-Chousa, and Alekxandar Sevic. 2019. Bitcoin volatility, stock market and investor sentiment. Are they connected? Finance Research Letters 38: 101399. [Google Scholar] [CrossRef]
  33. Mihanović, Hrvoje, Mirko Orlić, and Zoran Pasarić. 2009. Diurnal thermocline oscillations driven by tidal flow around an island in the Middle Adriatic. Journal of Marine Systems 78. [Google Scholar] [CrossRef]
  34. Nakamoto, Satochi. 2009. Bitcoin: A Peer-to-Peer Electronic Cash System. Available online: https://www.bitcoinpaper.info/bitcoinpaper-html/ (accessed on 10 January 2020).
  35. Nasir, Muhammad Ali, Toan Luu Duc Huynh, Sang Phu Nguyen, and Duy Duong. 2019. Forecasting cryptocurrency returns and volume using search engines. Finance Innovation 5: 2. [Google Scholar] [CrossRef]
  36. Ng, Eric K. W., and Johnny C. L. Chan. 2012. Geophysical applications of partial wavelet coherence and multiple wavelet coherence. Journal of Atmospheric and Oceanic Technology 29: 1845–53. [Google Scholar] [CrossRef]
  37. Nguyen, Thai Vu Hong, Binh Thanh Nguyen, Kien Son Nguyen, and Huy Pham. 2019. Asymmetric Monetary Policy Effects on Cryptocurrency Markets. Research in International Business and Finance 48: 335–39. [Google Scholar] [CrossRef]
  38. Philips, Ross C., and Denise Gorse. 2018. Cryptocurrency price drivers: Wavelet coherence analysis revisited. PLoS ONE 13. [Google Scholar] [CrossRef]
  39. Rognone, Lavinia, Stuart Hyde, and S. Sarah Zhang. 2020. News Sentiment in the Cryptocurrency Market: An Empirical Comparison with Forex. International Review of Financial Analysis 69: 101462. [Google Scholar] [CrossRef]
  40. Stavroyiannis, Stavros, Vassilios Babalos, Stelios Bekiros, Salim Lahmiri, and Gazi Salah Uddin. 2019. The high frequency multifractal properties of Bitcoin. Physica A: Statistical Mechanics Its Applications 520: 62–71. [Google Scholar] [CrossRef]
  41. Torrence, Christopher, and Gilbert P. Compo. 1998. A practical guide to wavelet analysis. Bulletin of the American Meteorological Society 79: 61–78. [Google Scholar] [CrossRef] [Green Version]
  42. Valencia, Franco, Alfonso Gómez-Espinosa, and Benjamin Valdés-Aguirre. 2019. Price Movement Prediction of Cryptocurrencies Using Sentiment Analysis and Machine Learning. Entropy 21: 589. [Google Scholar] [CrossRef] [Green Version]
  43. Yermack, David. 2013. Is Bitcoin a real currency? An economic appraisal. National Bureau of Economic Research 36: 843–50. [Google Scholar]
  44. Yuneline, Mirza Hedismarlina. 2019. Analysis of cryptocurrency’s characteristics in four perspectives. Journal of Asian Business and Economic Studies 26: 206–19. [Google Scholar] [CrossRef] [Green Version]
Figure 1. Wavelet coherencies between Bitcoin and altcoins. The black contour recognizes the regions in which the spectrum is significant at the 5% level against red noise. The cone of influence (COI) is designated by the lighter shade, which delimits high power regions, and it delimits the autocorrelation of the wavelet power at each scale. The horizontal and vertical axes denote time and scale bands, respectively.
Jrfm 14 00275 g001aJrfm 14 00275 g001b
Figure 2. Wavelet coherencies between cryptocurrencies prices and Sentix Cryptocurrency index. The black contour identifies the regions in which the spectrum is significant at the 5% level against red noise. The cone of influence (COI) is specified by the lighter shade, which delimits the high-power regions. The horizontal and vertical axes denote time and scale bands, respectively.
Jrfm 14 00275 g002
Figure 3. The partial wavelet coherencies between Bitcoin and the Sentix Investor Confidence index and cryptocurrencies. The black contour recognizes the regions in which the spectrum is significant at the 5% level against red noise. The cone of influence (COI) is designated by the lighter shade, which delimits the high-power regions. The horizontal and vertical axes denote time and scale bands, respectively. Overall, when looking at the PWC plots, we show that highest coherencies are spread in the middle horizon.
Jrfm 14 00275 g003
Figure 4. The multiple wavelet coherencies between Bitcoin and the Sentix Investor Confidence index and cryptocurrencies. The black contour recognizes the regions in which the spectrum is significant at the 5% level against red noise. The cone of influence (COI) is designated by the lighter shade, which delimits the high-power regions. The horizontal and vertical axes denote time and scale bands, respectively. From these plots, the combined effects of investor sentiment and CC on Bitcoin prices are revealed over different scales.
Jrfm 14 00275 g004
Figure 5. Wavelet coherency between cryptocurrencies and Google search volume over time and across scale bands. The black contour recognizes the regions in which the spectrum is significant at the 5% level against red noise. The cone of influence (COI) is designated by the lighter shade, which delimits high-power regions. The horizontal and vertical axes denote time and scale bands, respectively.
Jrfm 14 00275 g005aJrfm 14 00275 g005b
Table 1. Elementary statistics of CC prices and Sentix Investor Confidence index. The sample covers two different sets of monthly data from 15 January 2013 to 15 November 2020. The CC prices are listed on the “Coinmarketcap” site whereas the Sentix CC is provided by Datastream.
BitcoinDogecoinEthereumLitecoinSENTIX CCTether
Mean2601.6470.001381217.834433.36953−42.882810.173776
Median684.350.000316180.0157.105−46.250.009113
Maximum13,850.40.0089721118.31232.1−21.51.877742
Minimum218.50.0001030.7386441.44−61.50.004111
Std. Dev.3298.4030.001873225.104249.9878511.382850.322237
Skewness1.4809631.9537831.6404992.2055860.4971642.948231
Kurtosis4.3132366.7482126.3996087.7396972.10760513.98628
Jarque–Bera27.993678.181859.52608111.79514.760148414.5779
Probability0.000001 ***0.000 ***0.000 ***0.000 ***0.092544 ***0.000 ***
*** report significance at 10% level.
Publisher’s Note: MDPI stays neutral with regard to jurisdictional claims in published maps and institutional affiliations.

