Article

Investigating the Causal Linkages among Inflation, Interest Rate, and Economic Growth in Pakistan under the Influence of COVID-19 Pandemic: A Wavelet Transformation Approach

1
Department of Economics, University of the Punjab, Quaid-i-Azam Campus, Lahore 54590, Pakistan
2
Department of Economics and Business Administration, University of Education, Lahore 54590, Pakistan
3
UBD Scholl of Business and Economics, University of Brunei Darussalam (UBD), Bandar Seri Begawan BE-1410, Brunei
4
Bredin College of Business and Health Care, Edmonton, AB T5J 0K1, Canada
5
Faculty of Economics and Business Administration, University of Craiova, 200585 Craiova, Romania
6
Faculty of Education Science, Law and Public Administration, C-Tin Brancusi University of Targu Jiu, 210135 Târgu Jiu, Romania
*
Author to whom correspondence should be addressed.
J. Risk Financial Manag. 2021, 14(6), 277; https://0-doi-org.brum.beds.ac.uk/10.3390/jrfm14060277
Submission received: 25 April 2021 / Revised: 11 June 2021 / Accepted: 12 June 2021 / Published: 18 June 2021
(This article belongs to the Special Issue The Impact of COVID-19 on Economy, Energy, and Environment)

Abstract

:
This research is the earliest attempt to understand the impact of inflation and the interest rate on output growth in the context of Pakistan using the wavelet transformation approach. For this study, we used monthly data on inflation, the interest rate, and industrial production from January 1991 to May 2020. The COVID-19 pandemic has affected economies around the world, especially in view of the measures taken by governmental authorities regarding enforced lockdowns and social distancing. Traditional studies empirically explored the relationship between these important macroeconomic variables only for the short run and long run. Firstly, we employed the autoregressive distributed lag (ARDL) cointegration test and two causality tests (Granger causality and Toda–Yamamoto) to check the cointegration properties and causal relationship among these variables, respectively. After confirming the long-run causality from the ARDL bound test, we decomposed the time series of growth, inflation, and the interest rate into different time scales using wavelet analysis which allows us to study the relationship among variables for the very short run, medium run, long run, and very long run. The continuous wavelet transform (CWT), the cross-wavelet transform (XWT), cross-wavelet coherence (WTC), and multi-scale Granger causality tests were used to investigate the co-movement and nature of the causality between inflation and growth and the interest rate and growth. The results of the wavelet and multi-scale Granger causality tests show that the causal relationship between these variables is not the same across all time horizons; rather, it is unidirectional in the short-run and medium-run but bi-directional in the long-run. Therefore, this study suggests that the central bank should try to maintain inflation and the interest rate at a low level in the short run and medium run instead of putting too much pressure on these variables in the long-run.

1. Introduction

The relationship between inflation, the interest rate, and output growth has been one of the most crucial and debated macroeconomic topics between policymakers and economists. Economic growth reflects the capacity of a country to increase the level of output. The inflation rate and interest rate are the two most important macroeconomic variables as the behavior of these two variables has a huge impact on economic growth (Mensah and Okyere 2015). Gülşen and Özmen (2020) argued that domestic interest rates respond to inflation and output gaps especially under inflation targeting (IT) in the short run. Aßhoff et al. (2020) investigated the effects of unconventional monetary policy (UMP) on inflation expectations in the Euro area and concluded that the positive effect of UMP on inflation expectations tends to evaporate in the medium term while revealing a rise in medium-term real GDP growth generated by UMP measures. However, some researchers highlighted that higher inflation expectations have more positive effects on economic activity during periods of fixed nominal interest rates (Coibion et al. 2018).
Is high inflation adverse for economic growth? Do some rates of inflation stimulate economic growth? A large debate exists in the literature on the growth–inflation relationship. Monetarists and structuralists have different views regarding the growth–inflation relationship. Structuralists believe that inflation is a prerequisite to enhance output growth, whereas the monetarist view is that the growth–inflation relationship is always negative (Mallik and Chowdhury 2001; Datta and Mukhopadhyay 2011).
Some studies such as those of Sumon and Miyan (2017) and Dornbusch et al. (1998) supported the view of structuralists and found a positive growth–inflation relationship, whereas the findings of many studies in the literature (Andrés and Hernando 1997; Smyth 1994; Kasidi and Mwakanemela 2013; De Gregorio 1991) are consistent with the monetarists’ point of view. The studies by Hossain et al. (2012), Chimobi (2010), and Chowdhury (2002) failed to find any relationship among these variables. According to Saaed (2007) and Madurapperuma (2016), the stability of price levels plays a key role in stimulating economic growth; thus, the two main targets that monetarists try to achieve are a moderate rate of inflation and sustainable economic growth (Ayyoub et al. 2011). On the other hand, the impact of the interest rate on economic growth is also of great interest in the literature. Briotti (2005) stated that an increase in the rate of interest may cause aggregate demand to reduce. The study by Di Giovanni et al. (2009) also found a negative relationship between real growth and the interest rate.
According to the World Bank, economies are classified in the following four main categories, namely: low, lower-middle, upper-middle, and high income, using gross national income (GNI) per capita data in U.S. dollars (the conversion is established from the local currency using the World Bank Atlas method). According to the World Bank, in the case of the current 2021 fiscal year, low-income economies are defined as those with a GNI per capita, calculated using the World Bank Atlas method, of USD 1035 or less in 2019; lower-middle-income economies are those with a GNI per capita between USD 1036 and USD 4045; upper-middle-income economies are those with a GNI per capita between USD 4046 and USD 12,535; and high-income economies are those with a GNI per capita of USD 12,536 or more (World Bank 2021). For instance, Pakistan is included in the category of lower-middle-income economies, i.e., with a GNI per capita from USD 1036 to USD 4045. In the case of a developing country such as Pakistan, price stability is a key determinant of economic growth, and any fluctuations in inflation have massive repercussions for the growth rate. Pakistan faces severe fluctuations in its inflation rate, for example, since 2017, the inflation rate has more than doubled in the span of two years. On the other hand, the interest rate also influences economic growth as changes in the interest rate affect the level of investment by changing the cost of borrowing (and, resultantly, the growth rate). The purpose of this study is to find the nature of the relationship among economic growth, inflation, and the interest rate using a new approach: a wavelet transformation approach.
The main objective of our study is to investigate the relationship among these important macroeconomic variables at different time and frequency scales using the wavelet transformation approach. Percival and Walden (2000) used wavelet methods for time series analysis which is very important for various fields such as science, engineering, finance, and economics. The wavelet transformation approach enables us to study this dynamic relationship across different frequencies and time horizons, and we can investigate the causal relationship between growth and inflation and growth and the interest rate in the short run, medium run, long run, and very long run (Vacha and Barunik 2012; Aloui and Hkiri 2014). Thus, in this paper, we are going to answer the following questions. Does inflation adversely affect economic growth in the case of Pakistan? Does the interest rate stimulate economic growth in Pakistan? Is the relationship between economic growth and inflation a long-run phenomenon? Does the interest rate affect economic growth only in the short run? Based on the comprehensive study of the debate between structuralists and monetarists, and following the trend of inflation and growth in Pakistan, we expect that the growth–inflation relationship is negative in the case of Pakistan, supporting the monetarists’ view. Naeem et al. (2021) argued that Pakistan is a developing economy where there are no strict environmental policies implemented for the benefit of enhancing economic growth. We are also hopeful to find a long-run relationship between these variables. We believe that the interest rate adversely affects economic growth as evidenced by past research. This relationship may be a short-run or long run phenomenon.
We used monthly data from January 1991 to May 2020 to find the relationship between inflation, the interest rate, and economic growth in the context of Pakistan. After checking the cointegration and causality among these three variables, we decomposed all series by the wavelet transformation approach. We examined the co-movement between growth and inflation and growth and the interest rate by using the cross-wavelet power spectrum and cross-wavelet coherence. We then performed Granger causality tests on the decomposed series and examined the variation in causality due to differences in the time and frequency domains. The results show that the relationships between growth and inflation and growth and the interest rate are not similar across all time scales.

Theoretical Background

There has been a considerable debate on the existence and nature of the inflation and growth relationship in the literature. With the advancement of the macroeconomic literature, the view of economists on this relation is also changing. The classical economists believed that inflation hampers growth by increasing firms’ cost of production. However, Keynes disagreed with this view and stated that the inflation–growth relation is positive in the short run. On the other hand, monetarists believe that this relation is always negative. On the contrary, structuralists maintain that inflation is essential to enhance output growth. Thus, it is evident that economic theories reach a variety of conclusions about the responsiveness of output growth to inflation. Therefore, it is essential to check this relation empirically using different time horizons.
The theoretical debate on the interest rate–growth relation is also extensive. There are a number of theories that discuss the negative relationship between the interest rate and economic growth through investment channels. According to Tobin’s monetary growth model, a higher yield on money leads to reducing the demand for capital in the medium run. The neoclassical theory of investment explains this negative relationship as the higher rate of interest causes an increase in firms’ cost of capital. The high cost of production turns to reduce output. The real business cycle theory reveals that technology shocks cause increases in the interest rate. A higher rate of interest negatively affects the output as a reduction in the labor supply.
We organized this study into six sections. In addition to the first introductory section, Section 2 is about the review of the literature. Section 3 discusses some basic concepts related to the wavelet transformation approach. Section 4 presents the sources of data and empirical results of traditional econometric methods. Section 5 discusses the results of wavelet analysis. In Section 6, we conclude the research.

2. Literature Review

Many studies in the literature such as (Paul et al. 1997; Hwang and Wu 2011; Hussain and Malik 2011; Bittencourt et al. 2015; Dinh 2020) empirically explored the controversial nature of the growth–inflation relation and direction of causality between these variables. However, all of them analyzed the growth–inflation relation using time domain analysis. Barro (1995) analyzed the growth–inflation relationship using data for more than 100 countries over the period 1960–1990 and found a negative relationship, whereas Anidiobu et al. (2018) found that the relationship between growth and inflation is positive but non-significant in the case of Nigeria using data from 1986 to 2015. Shahid (2014) studied the long-run relation between inflation, unemployment, and economic growth in the case of Pakistan. The results of the ARDL estimation depicted a negative and insignificant relationship between inflation and growth.
Garside (2007) highlighted the fact that there was a time when explanations of economic growth and progress could focus only on inputs into the production process. Moreover, Clague (1997) stated more than two decades ago that the existing literature provides extensive evidence of countries benefiting only from insignificant economic growth despite having high rates of physical capital accumulation, with others gaining small or even no growth, even when education has expanded rapidly. Bhattacharya (1995) examined the changes in the world economy brought about by less developed countries transforming into newly industrializing countries, highlighting mechanisms for the relative rise and decline of certain countries in the world economy. Moreover, Deardorff (2001) suggested that economic growth in developing countries is likely to worsen the income distribution in developed countries and lead to a protectionist response that undermines the incentives for developing country growth. However, it is very important not to confuse and misunderstand the concepts of economic development and economic growth, as the two are different processes in a lifecycle of a place, but often conflated. For instance, economic growth has a strong theoretical grounding and is easily quantified as an increase in aggregate output (Feldman et al. 2016). Economists and policymakers have long used the GDP, the GDP per capita, and the growth of the GDP per capita as measures of economic development, but the Human Development Index (HDI) is an alternative that should not be ignored (Grubaugh 2015).
The complex linkage between inflation, the interest rate, and economic growth was also examined by the monetarist school of thought which was founded by Milton Friedman (1961). The monetarist theory considers that an increasing money supply represents the main reason for generating inflation or deflation in an economy, and this issue affects economic growth. Friedman de-emphasized the importance of interest rates and interest rate uncertainty as variables affecting the demand for money while singling out inflation expectations as an essential influence on variations in velocity (Bibow 2002). Taderera et al. (2021) pointed out that while inflation targeting brings sanity within the financial sector, this might retard growth as the desirable inflation level would be beyond the targeted inflation level. Moreover, Kumar et al. (2020) suggested that a profitable banking sector is essential for economic growth, and changes in interest rates have the potential to affect bank profitability.
Taderera et al. (2021) conducted an empirical research study on the Southern African Customs Union (SACU) and concluded that policymakers should allow a high sustainable inflation rate for promoting economic growth, while the interest rate can be used as a monetary policy tool in order to achieve the considered inflation rate that will affect economic growth positively. Harswari et al. (2017) investigated the influence of the interest rate on economic development in Asian countries during the period 2006–2015 and concluded that the interest rate has a negative significant impact on the gross domestic product and inflation while having a negative insignificant impact on foreign direct investments. Gülşen and Özmen (2020) considered that emerging markets are much more sensitive to global financial cycles under managed than floating exchange rate regimes.
Batool et al. (2020) suggested that the COVID-19 pandemic has disrupted the economies all around the world, meaning that the economic fallout from preventive measures such as lockdowns is enormous. Asghar et al. (2020) argued that this is the worst economic downturn since the Great Depression of the 1930s. COVID-19 represents a new type of coronavirus that transfers extremely fast from human to human and started spreading in late December 2019 in Wuhan, China. Moreover, in less than a month, the World Health Organization (WHO) declared COVID-19 a “public health emergency of international concern” (WHO 2020). On 11 March 2020, the WHO declared COVID-19 a global pandemic due to its worldwide spread and its devastating global impact.
The International Monetary Fund (2021) suggested that despite the fact the damages are expected to be lower in the context of the COVID-19 pandemic crisis compared to the global financial crisis of 2008, the cross-country pattern of losses is very likely to not be similar. In other words, low-income countries and emerging markets are more severely affected compared to the collapse and economic recession caused by the global financial crisis when advanced economies suffered significantly more losses. Vitenu-Sackey and Barfi (2021) argued that the COVID-19 pandemic has devastated the global economy while causing certain uncertainties regarding economic and social policies. Moreover, Mou (2020) revealed that the COVID-19 pandemic will change the macroenvironment of the world economy from the aspects of aggregate demand and total supply, labor income, and financial market trade.
Maliszewska et al. (2020) suggested that a global crisis such as the COVID-19 pandemic requires a global response, and that there is a need for global collaboration not just on health but also on trade, finance, and macroeconomic policies. According to the International Monetary Fund (2021), future developments will be significantly influenced by the pattern of the COVID-19 pandemic crisis and will depend on the following aspects of the effectiveness of policy strategies in order to diminish the economic losses, the dynamics of financial conditions and commodity prices, but also the adjustment capacity of the economy. Varona and Gonzales (2021) stated that for developing countries, the impact of the COVID-19 pandemic is double, such as: an external shock and an internal shock that affect aggregate supply and demand. Moreover, the external shock determines a contraction in the prices of raw materials, the demand for exports, employment, income, tourism, international remittances, and external financing.
A few studies investigated the relationship among inflation, the interest rate, and output growth using traditional time domain analysis. Davcev et al. (2018) studied the relationship among these variables for Bulgaria, Romania, and FYROM. They concluded that inflation and the interest rate both have a significant impact on growth, although the nature of the relationship varies across countries. The findings of Ramlan et al. (2017) showed a positive relationship between the interest rate and growth and a negative relationship between inflation and growth in the case of Malaysia. Mensah and Okyere (2015) also empirically investigated the effect of inflation and the interest rate on economic growth in the case of Ghana. Their estimation showed that inflation has a positive but insignificant impact on economic growth, while the interest rate has a significant and negative impact on growth.
According to Nguyen and He (2015), researchers can analyze the co-movement among financial and economic variables at different levels as wavelets decompose the variables into different levels of frequency. Wavelet analysis is a helpful tool for studying time series (Torrence and Compo 1998), and it offers much more insight into empirical economic research (Crowley 2011). This analysis allows researchers to investigate the relationship among variables that previously were unobservable (Ramsey 2002). According to Tiwari et al. (2013), time domain analysis was unable to find a causal relation between oil prices and the exchange rate in the case of India; however, the use of wavelet transformation helped them in uncovering this important causal relation. Jawaid et al. (2019) studied the relationship between tourism activities and price levels using the applications of wavelet analysis in the case of Pakistan. Similarly, Gençay et al. (2001), Rua and Nunes (2009), Gallegati et al. (2011), Nikkinen et al. (2011), Essaied (2013), Swastika et al. (2013), Benhmad (2013), and Yang et al. (2017) empirically analyzed the relationship among economic variables under this methodology.
Similarly, Dar et al. (2014) applied this methodology to study the inflation–industrial growth relation. The results of continuous wavelet transformation showed that at the lower frequencies having time dynamics of eight to sixteen months, the relationship is negative. Bhaduri (2016) revisited the growth–inflation relation for India over different time horizons based on discrete wavelet decomposition analysis using annual data from 1976 to 2007. She found a weak correlation between growth and inflation for the original series. However, after the decomposition of the original series into different components (short-run and long-run components), she observed a strong and negative correlation between these variables in the short-run time scale but no correlation in the long-run time scale.
Raza et al. (2018), using the techniques of wavelet analysis such as MODWT, continuous wavelet power spectrum, wavelet covariance, and wavelet coherence, empirically studied the association between oil prices and the economic activity of the U.S. The results showed that economic activity is enhanced by oil prices for the period 1979m1 to 2013m7.
This detailed review of the literature shows that the nature of the inflation–growth relation is controversial and there is a need for further exploration. It is also evident that most of the literature focuses on time domain analysis to empirically explore the relationship between inflation, the interest rate, and economic growth. However, the wavelet approach allows us to explore the relationship among variables for both the time and frequency domains. This research is the earliest attempt to understand the impact of inflation and the interest rate on output growth in the context of Pakistan using the wavelet technique. This paper fills the gap in the literature by using monthly data to analyze the growth–inflation and growth–interest rate associations using wavelet analysis to explore the relationship in various time periods.

3. Research Methodology

The econometrics techniques that have been previously used to answer these questions focused on time domain analysis. According to Uddin et al. (2017), time domain analysis may return incomplete and ambiguous information on the causality between economic variables. Thus, this study focused on time domain analysis and on frequency domain analysis using the wavelet transformation approach that has been left out for the dynamical relationship among these variables. According to Rua (2012), wavelet analysis is a useful tool in economics to study how variables are interrelated at different frequencies and how the relationship among variables changes over time. The wavelet transformation approach allows us to investigate a non-stationary time series as it decomposes the time series into different time and frequency scales. By using this technique, we can explore the causal relationship between growth and inflation and growth and the interest rate for many time horizons such as the short run, medium run, long run, and very long run instead of just studying the relationship between variables only in the short run and long run.

3.1. What Is Wavelet Transformation?

Traditionally, when a variable is plotted against time to study the time-varying components, it is called a time domain analysis of that variable. Time domain analysis is the most popular tool in the economic literature, and many econometric techniques have been developed for this purpose. However, for many economic variables, time domain analysis does not always portray the true picture of the relationship as it may be hidden in the frequency contents of variables. Wavelet analysis helps in studying the variable in more depth as it can decompose the time series (Gençay et al. 2003; Yang et al. 2018; Cai et al. 2020).
Frequency is the rate at which something occurs over a particular time period, and it is usually measured in seconds, cycles, or hertz. If a variable changes rapidly, we can say that this variable has a high frequency.
Now, the question “how can we find the frequency content of the variable?” arises. The answer is Fourier transformation or wavelet transformation. In the nineteenth century, Fourier transformation solved many issues related to the field of engineering and physics. However, in the twentieth century, mathematicians, engineers, and physicists realized the drawback of Fourier transformation and developed a new transformation called wavelet transformation. Aguiar-Conraria et al. (2008) claimed that wavelet analysis is a more appropriate tool than Fourier transformation to empirically study the economic relations among variables.
By definition, wavelets are the small waves that begin at a finite point in time and die out at a later finite point in time. Wavelets are localized both in time and space (Schleicher 2002; Singh 2013). Wavelets are generated from a simple function ψ(t) known as the mother wavelet, by dilations and translations. A wavelet ψ j, k (t) is obtained from the mother wavelet ψ(t) by shrinking by a factor of 2j and translation by 2j k to obtain
ψ j, k (t) = 2j/2 ψ (2j t – k)
By using the following dilation equation, we can evaluate a wavelet function such as the following:
( t ) = 2 k l k t k
where ( t ) is called the father wavelet or scaling function that satisfies   ( t ) d t = 1 . We can generate the mother wavelet ψ (t) using the father wavelet.
Wavelet analysis has its base in multi-scale decomposition or multi-scale analysis. It was developed by Meyer (1986) and later by Daubechies (1992). Mallat explained multiresolution analysis and the pyramid algorithm, where the value of a variable “x” at time instant k, Xk, can be written as follows:
X k S j , k + d j , k + d j 1 , k + + d 1 , k
where d j , k are the detail components and wavelet crystals, j = 1, 2,3, …j, S j , k is a trend component also called the wavelet smooth, and j represents the number of scales (frequency bands). In other words, a variable Xk is exuded by a high-pass filter and a low-pass filter at each step. We obtain the information across different frequencies in each step until we reach an approximated variable that contains only the trend. This approach allows us to investigate the time series in both the time and frequency domains simultaneously. In this paper, we employ the maximum overlap discrete wavelet transform (MODWT) for time–frequency decomposition.

3.2. Wavelet Power Spectrum

The continuous wavelet transform (CWT) analyzes how the frequency components of a variable change over time. The continuous wavelet power spectrum for the variables shows what frequencies there are in the variable. It is used to check the power or volatility in the variable across different frequencies and timescales.

3.3. The Cross-Wavelet Power Spectrum

The cross-wavelet power spectrum calculates the covariance between two time series in the time–frequency space. It is used to understand the lead–lag relationship between two variables. Given the wavelet transforms Wa and Wb of “a” and “b”, the cross-wavelet transform (XWT) is defined as Wab = WaWb.

3.4. Wavelet Coherence (WTC)

Wavelet-based coherence allows us to measure the time-varying correlation between the time series. The wavelet coherency shows the strength of the relationship between variables across frequencies and overtime. Aguiar-Conraria et al. (2008) provided a relevant definition of Wavelet Coherency such as “the ratio of the cross-spectrum to the product of the spectrum of each series, and can be thought of as the local, both in time and frequency, correlation between two time-series”. Aguiar-Conraria and Soares (2011) have applied wavelet analysis in order to decompose the time–frequency effects of oil price changes on the macroeconomy. Shahbaz et al. (2013) suggested that wavelet coherency can be perceived as correlation coefficient in the time-frequency space. Aguiar-Conraria et al. (2008) described wavelet coherency as the ratio of the cross-spectrum to the product of the spectrum of each series. It is defined as
R n 2 ( s ) = | S ( s 1 W n a b ( s ) | S ( s 1 | W n a ( s ) | ) · S ( s 1 | W n b ( s ) |

4. Data Description and Stylized Facts

We used monthly data from January 1991 to May 2020 on the interest rate, industrial production index (IPI), and consumer price index (CPI). We took data from two sources, International Financial Statistics (IFS) and the State Bank of Pakistan (SBP). The monthly data on GDP were not available for Pakistan, and thus we used the industrial production index (IPI) as a proxy for output. We calculated the growth rates of output and price levels simply by taking the first difference in the natural logarithm transformation of IPI and CPI. We also calculated the change in the interest rate month over month (MOM) by taking the first difference in the interest rate. Table 1 shows the summary statistics of all the variables.
Monthly data of inflation and growth series show that the standard deviation of growth is more than the standard deviation of inflation, which means economic growth is more volatile than the inflation rate. Similarly, the change in the interest rate is more volatile than that of growth and inflation as its standard deviation is greater than the standard deviations of the other two variables. Before decomposing the original series of inflation, the interest rate, and growth using the wavelet transformation, we checked the variables for stationarity using the Dickey and Fuller (1979) and Perron and Ng (1996) tests. Concerning LN(IPI) and LN(CPI), both series are non-stationary as we cannot reject the null hypothesis of a unit root, whereas the results of both unit root tests reject the null hypothesis of a unit root for output growth, inflation, and the interest rate at a 1% level of significance. Hence, the interest rate, inflation, and economic growth are stationary. The results are shown in Table 2.
Our next task is to examine the cointegration and causality between the interest rate, CPI, and IPI. Based on the stationarity of the variables, we employed the bound test approach to cointegration by Pesaran et al. (2001). Granger causality (1969) and Toda and Yamamoto (1995) tests were applied to investigate the causal relationship among these variables. The results of the cointegration test are presented in Table 3.
The bound test shows that cointegration exists among variables as the calculated F-value is higher than both the lower and upper bounds. The results of the ARDL estimation show that inflation is positively and highly significantly effecting the growth rate of Pakistan. This positive coefficient is consistent with the structuralist point of view that the inflation–growth relation is positive, as evidenced by previous studies such as that of Dornbusch et al. (1998). On the other hand, the interest rate negatively affects growth in the long run. These results are similar to the existing literature, for example, Mensah and Okyere (2015). The ECM coefficient has a negative and significant value of −0.20, indicating that 20% of the errors are corrected in each time period. The results of two causality tests, pairwise Granger causality and Toda–Yamamoto, are presented in Table 4. The results of both causality tests validate the bi-directional causal relationship between the interest rate and economic growth and inflation and economic growth.

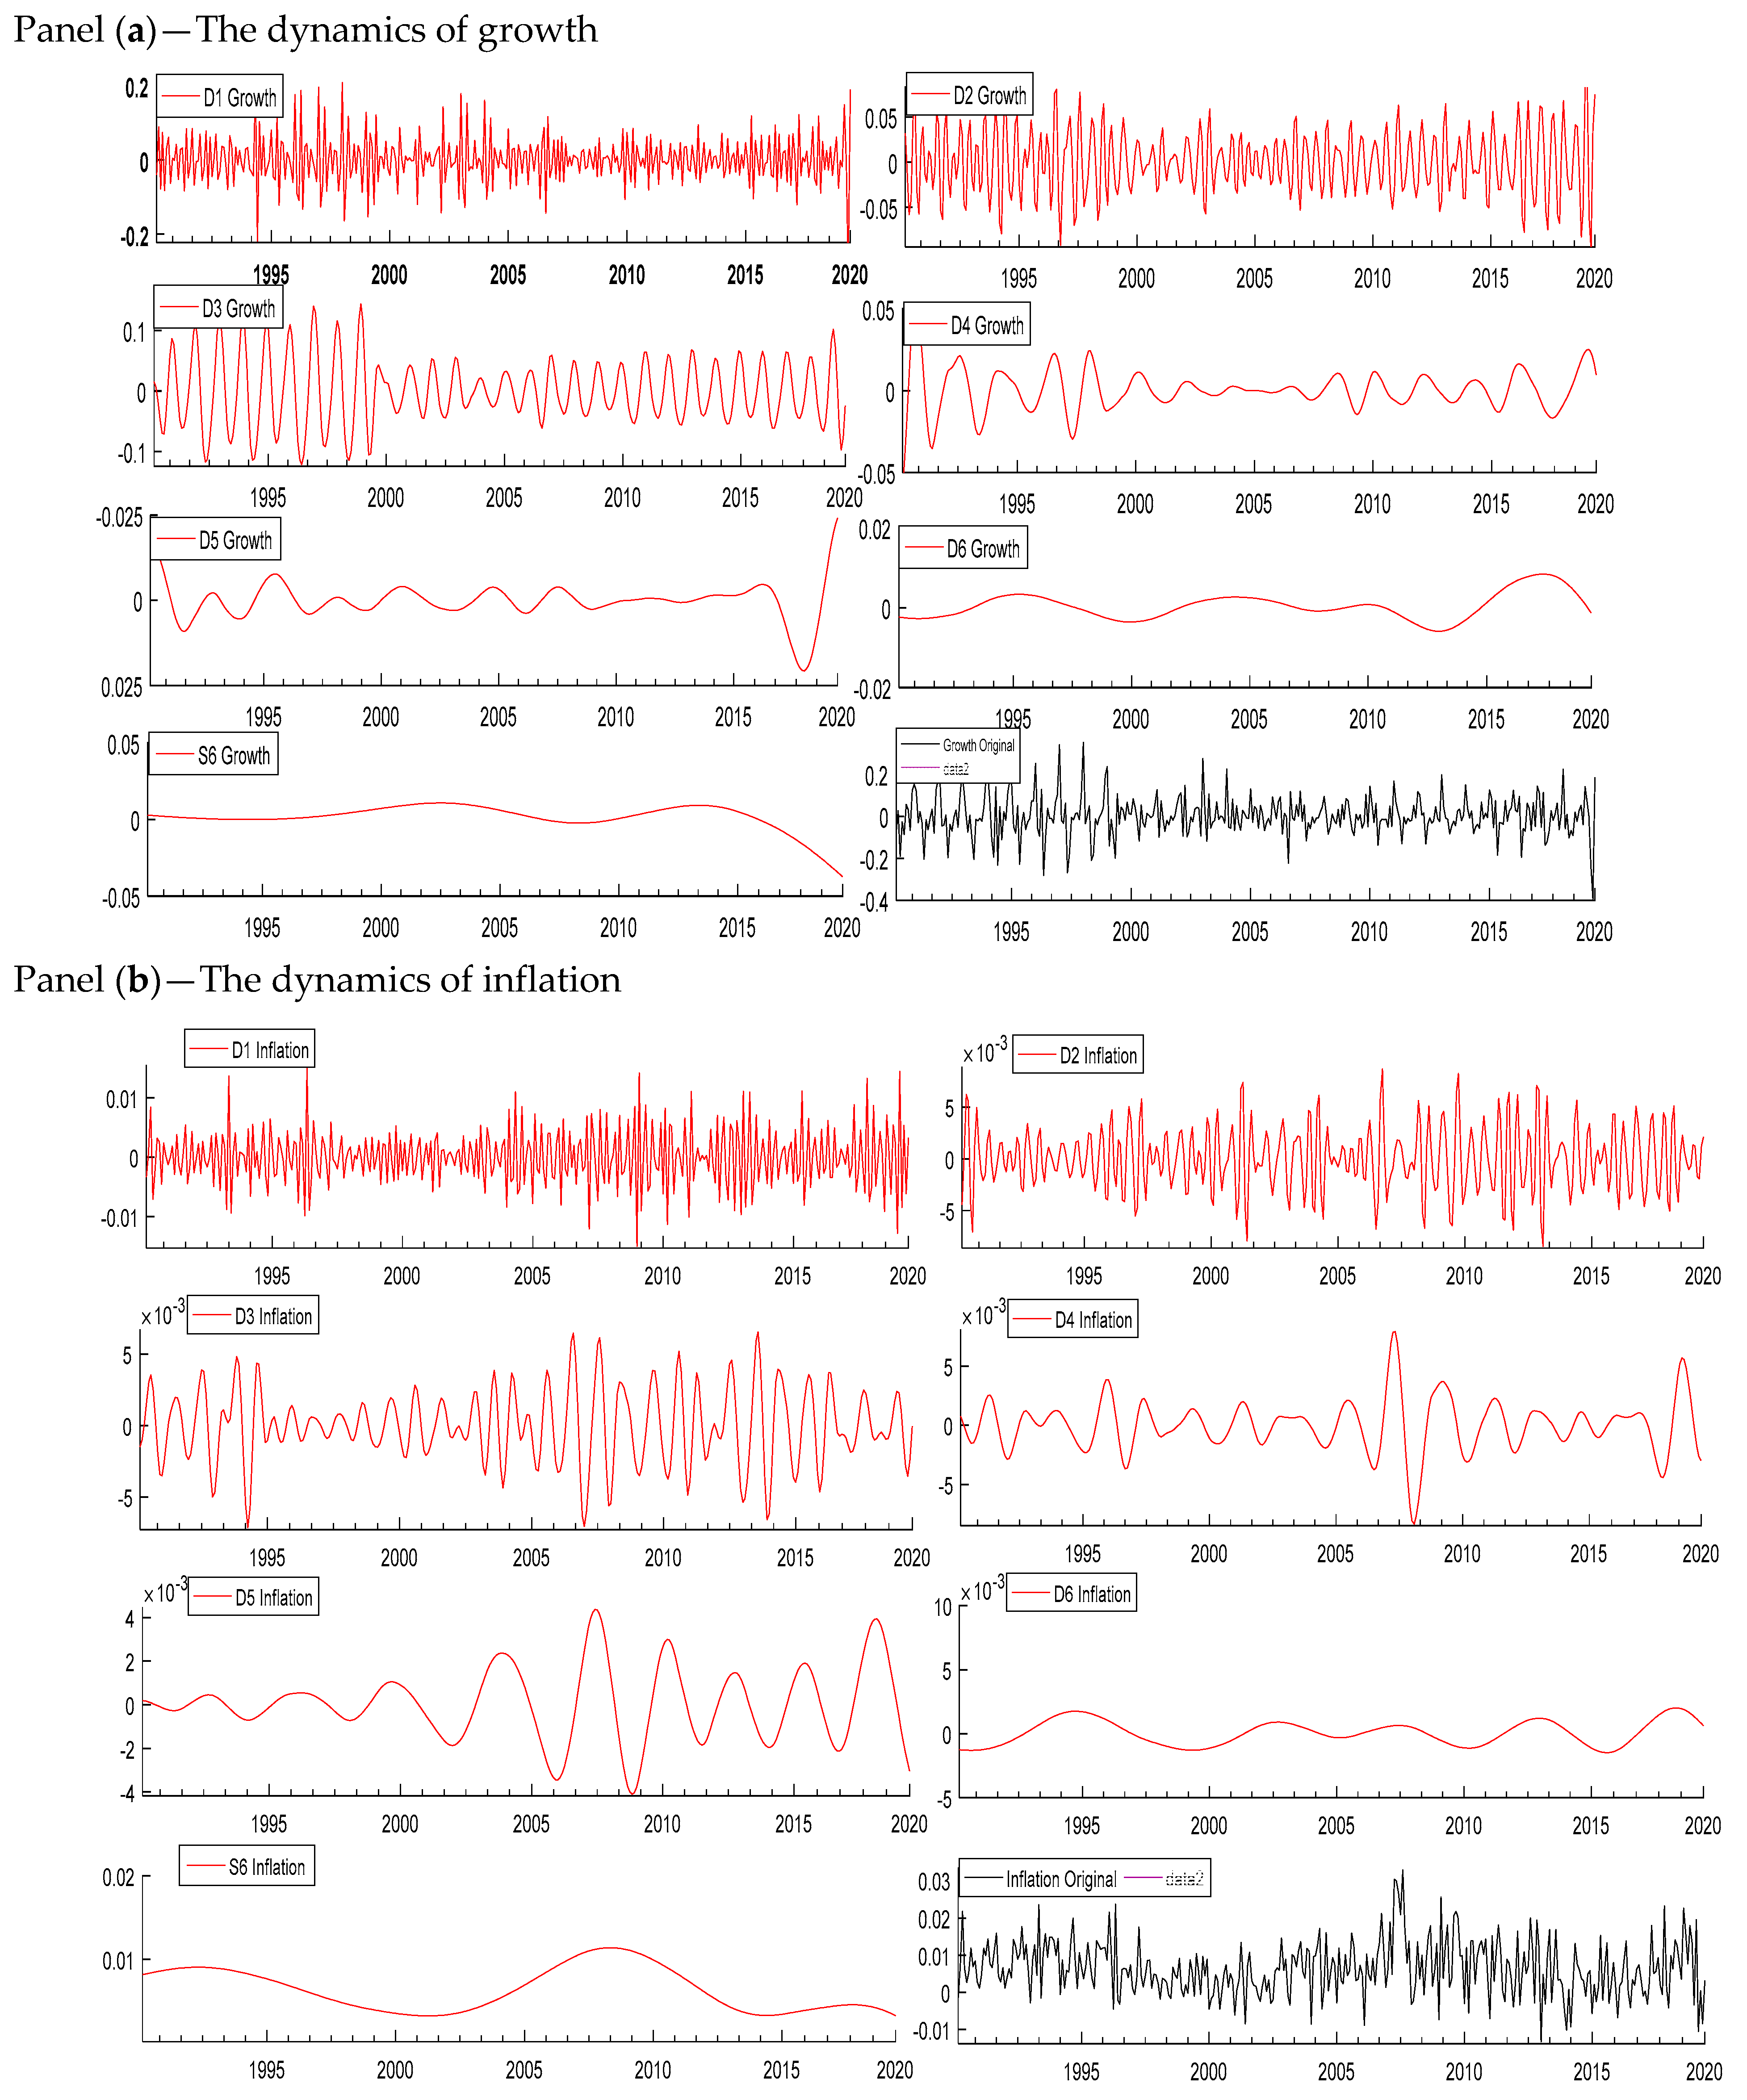
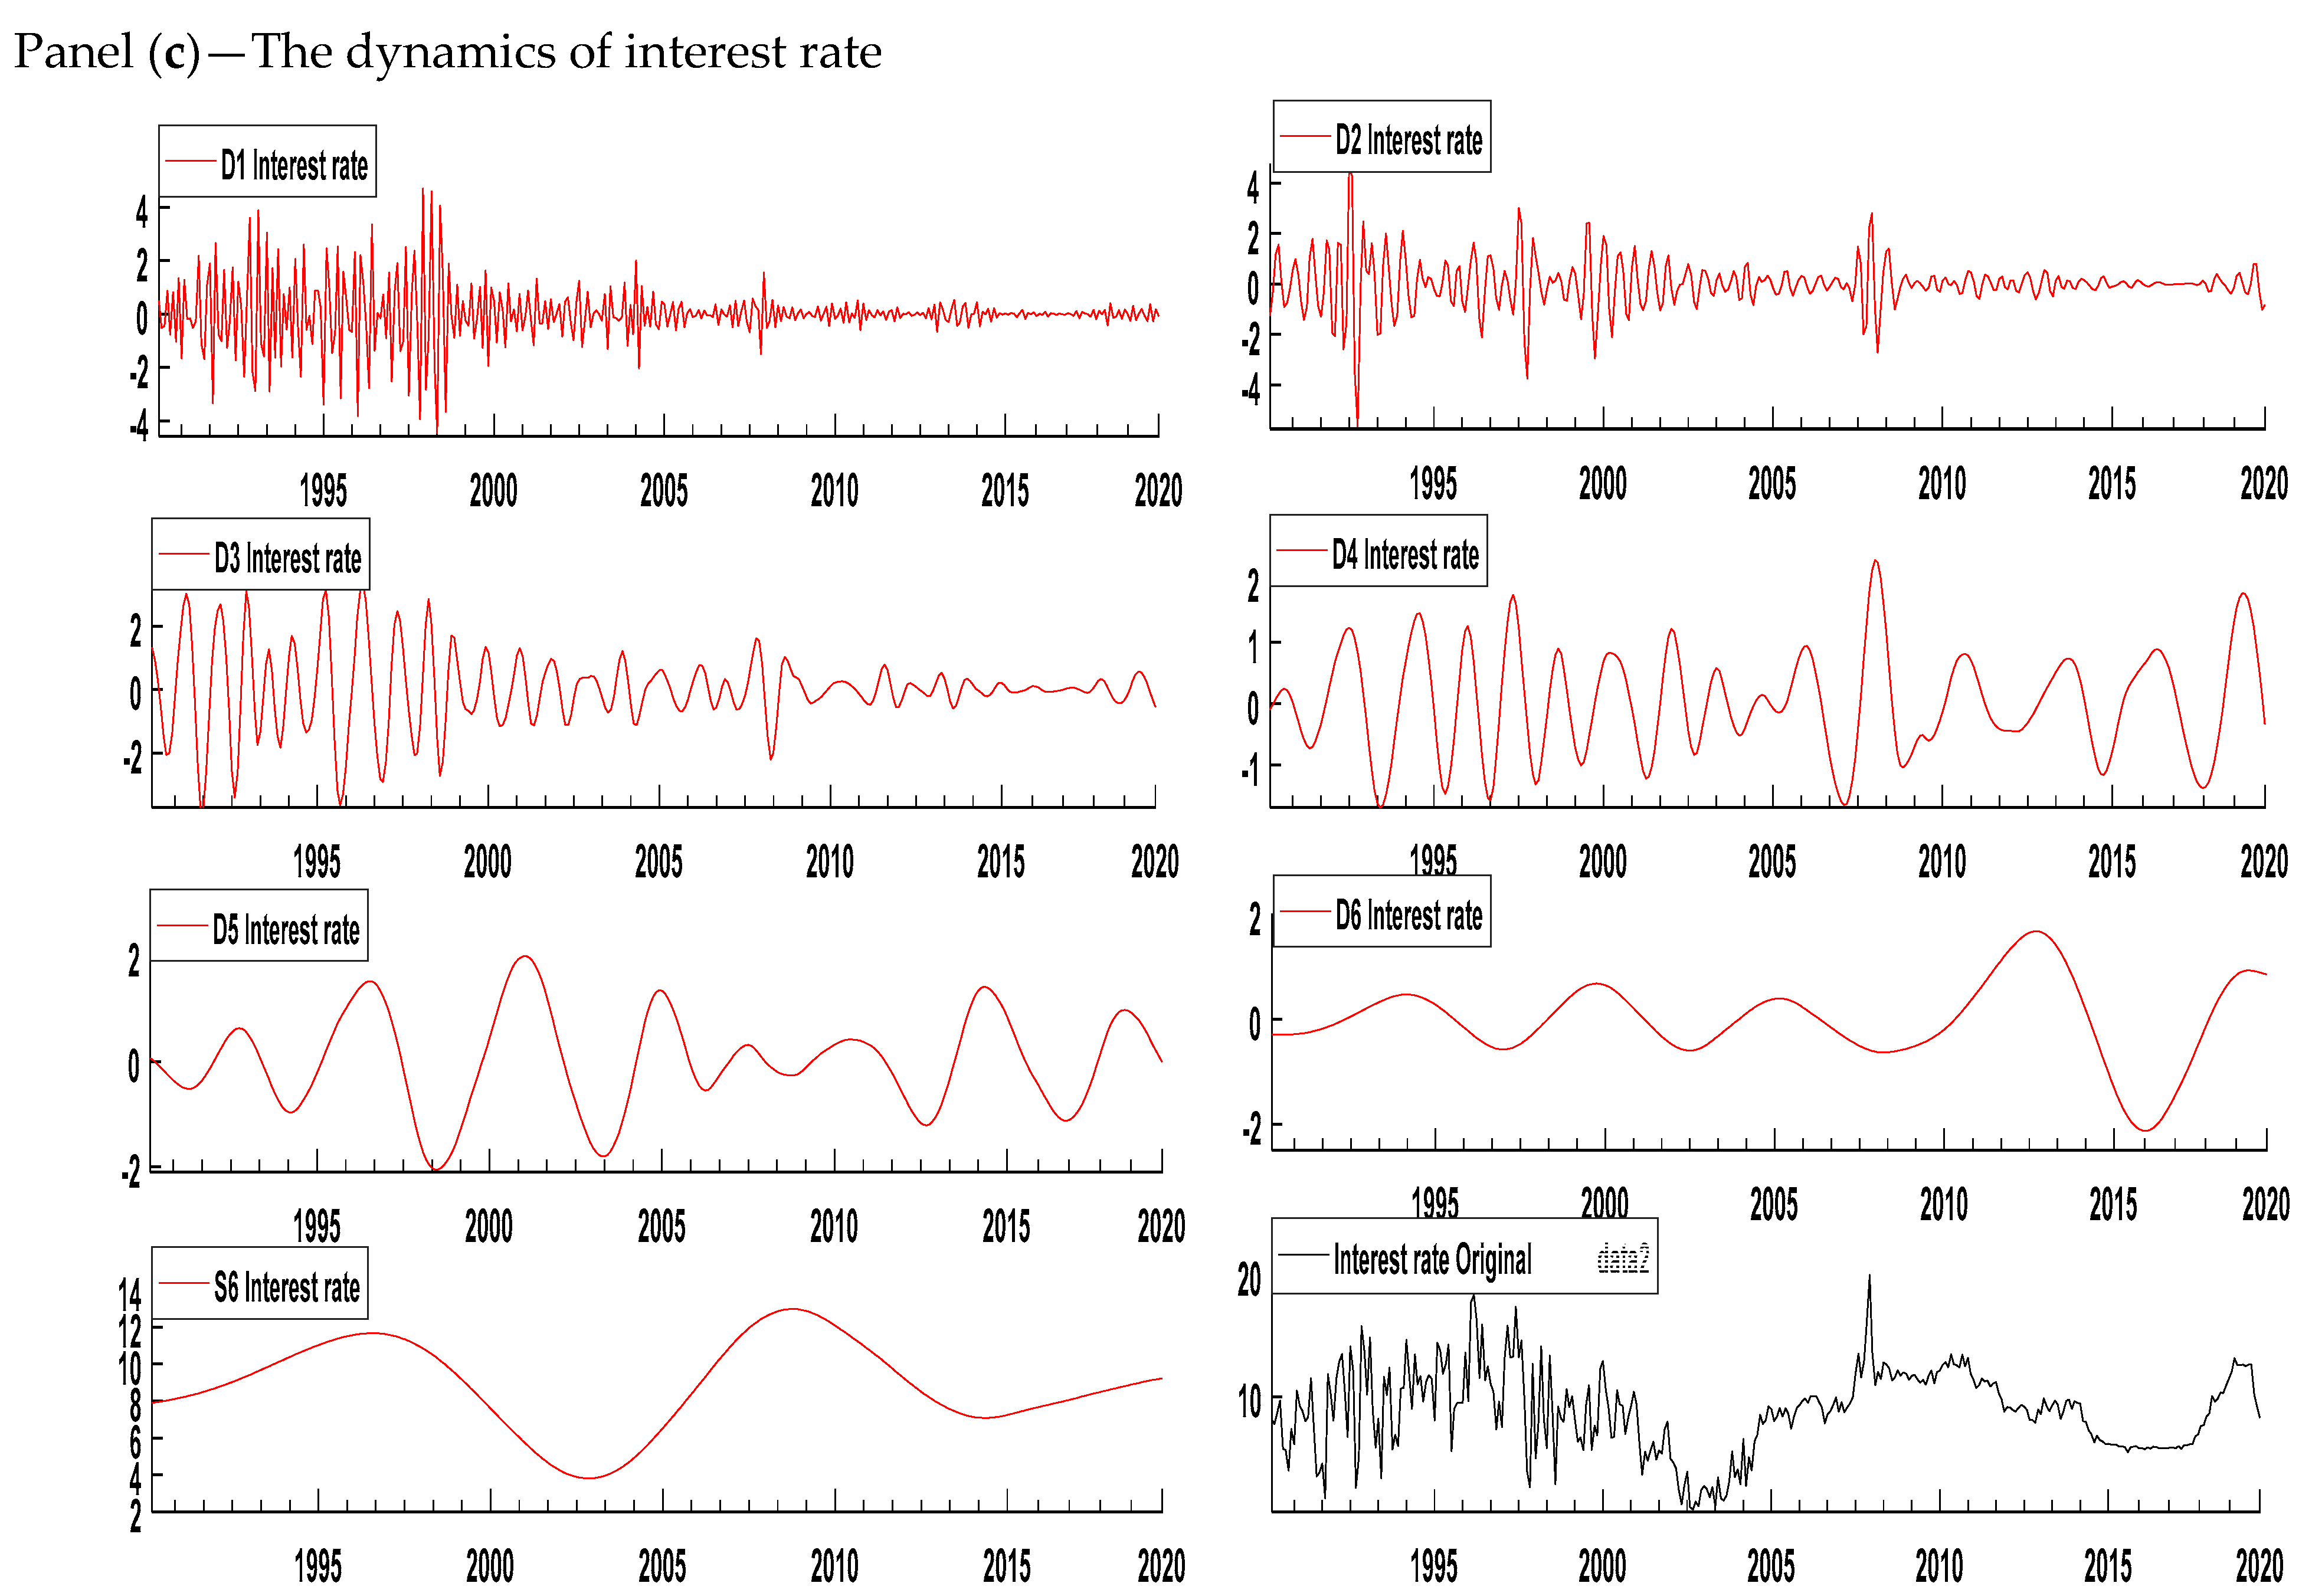
5. Wavelet Estimations and Discussion

The wavelet approach efficiently analyzes the time-varying characteristics of time series data. It is an ideal tool that deals with the issue of non-stationarity in the time series by decomposing the time series into different time and frequency scales (Gallegati et al. 2011; Jawaid et al. 2019). The traditional econometric models such as cointegration and ARDL that are used for time domain analysis have some restrictions in investigating the relationship among non-stationary variables. Thus, we used the wavelet approach to overcome issues associated with usual time domain analysis.
After establishing the cointegration and causality among the variables, we decomposed the variables based on multiresolution analysis (MRA). The decomposed components show the variation in the variable at a particular time scale. We applied the CWT to observe the volatility behavior of variables. We have been unable to identify the common regions in the time–frequency range where growth–inflation and growth–interest rate relations show high volatility using the continuous wavelet power spectrum. The cross-wavelet transform is able to show such regions; therefore, we used the cross-wavelet transform to investigate the dynamic correlation between variables. To identify the lead–lag relationship between economic growth and inflation and economic growth and the interest rate, we applied wavelet coherence. Cross-wavelet coherence has the advantage of showing the areas in the time–frequency range where two variables co-vary, but it is not necessary to have high volatility. Finally, we draw inferences about the causal relationship between growth and inflation and growth and the interest rate using the Granger causality test as the results based on our previous analysis may be misleading.
The wavelet-based decomposition shows the variation in the variable across different time horizons; therefore, we decomposed the series of inflation, the interest rate, and growth at seven different scales (D1, D2, D3, D4, D5, D6, and S6). Figure 1 displays the decomposition of all the variables. D1, D2, D3, D4, D5, and D6 are the six detail components and S6 is a component that represents the trend in the original series. The results show that the frequencies are high in the shorter period in all three variables. Table 5 shows the different scale levels corresponding to different frequencies. The time periods 2–4 and 4–8 months represent the short run, 8–16 and 16–32 months represent the medium run, 32–64 and 64–128 months represent the long run, and above 128 months represents the very long run. We decomposed the series of inflation, the interest rate, and growth using the Daubechies wavelet with a length of 8.

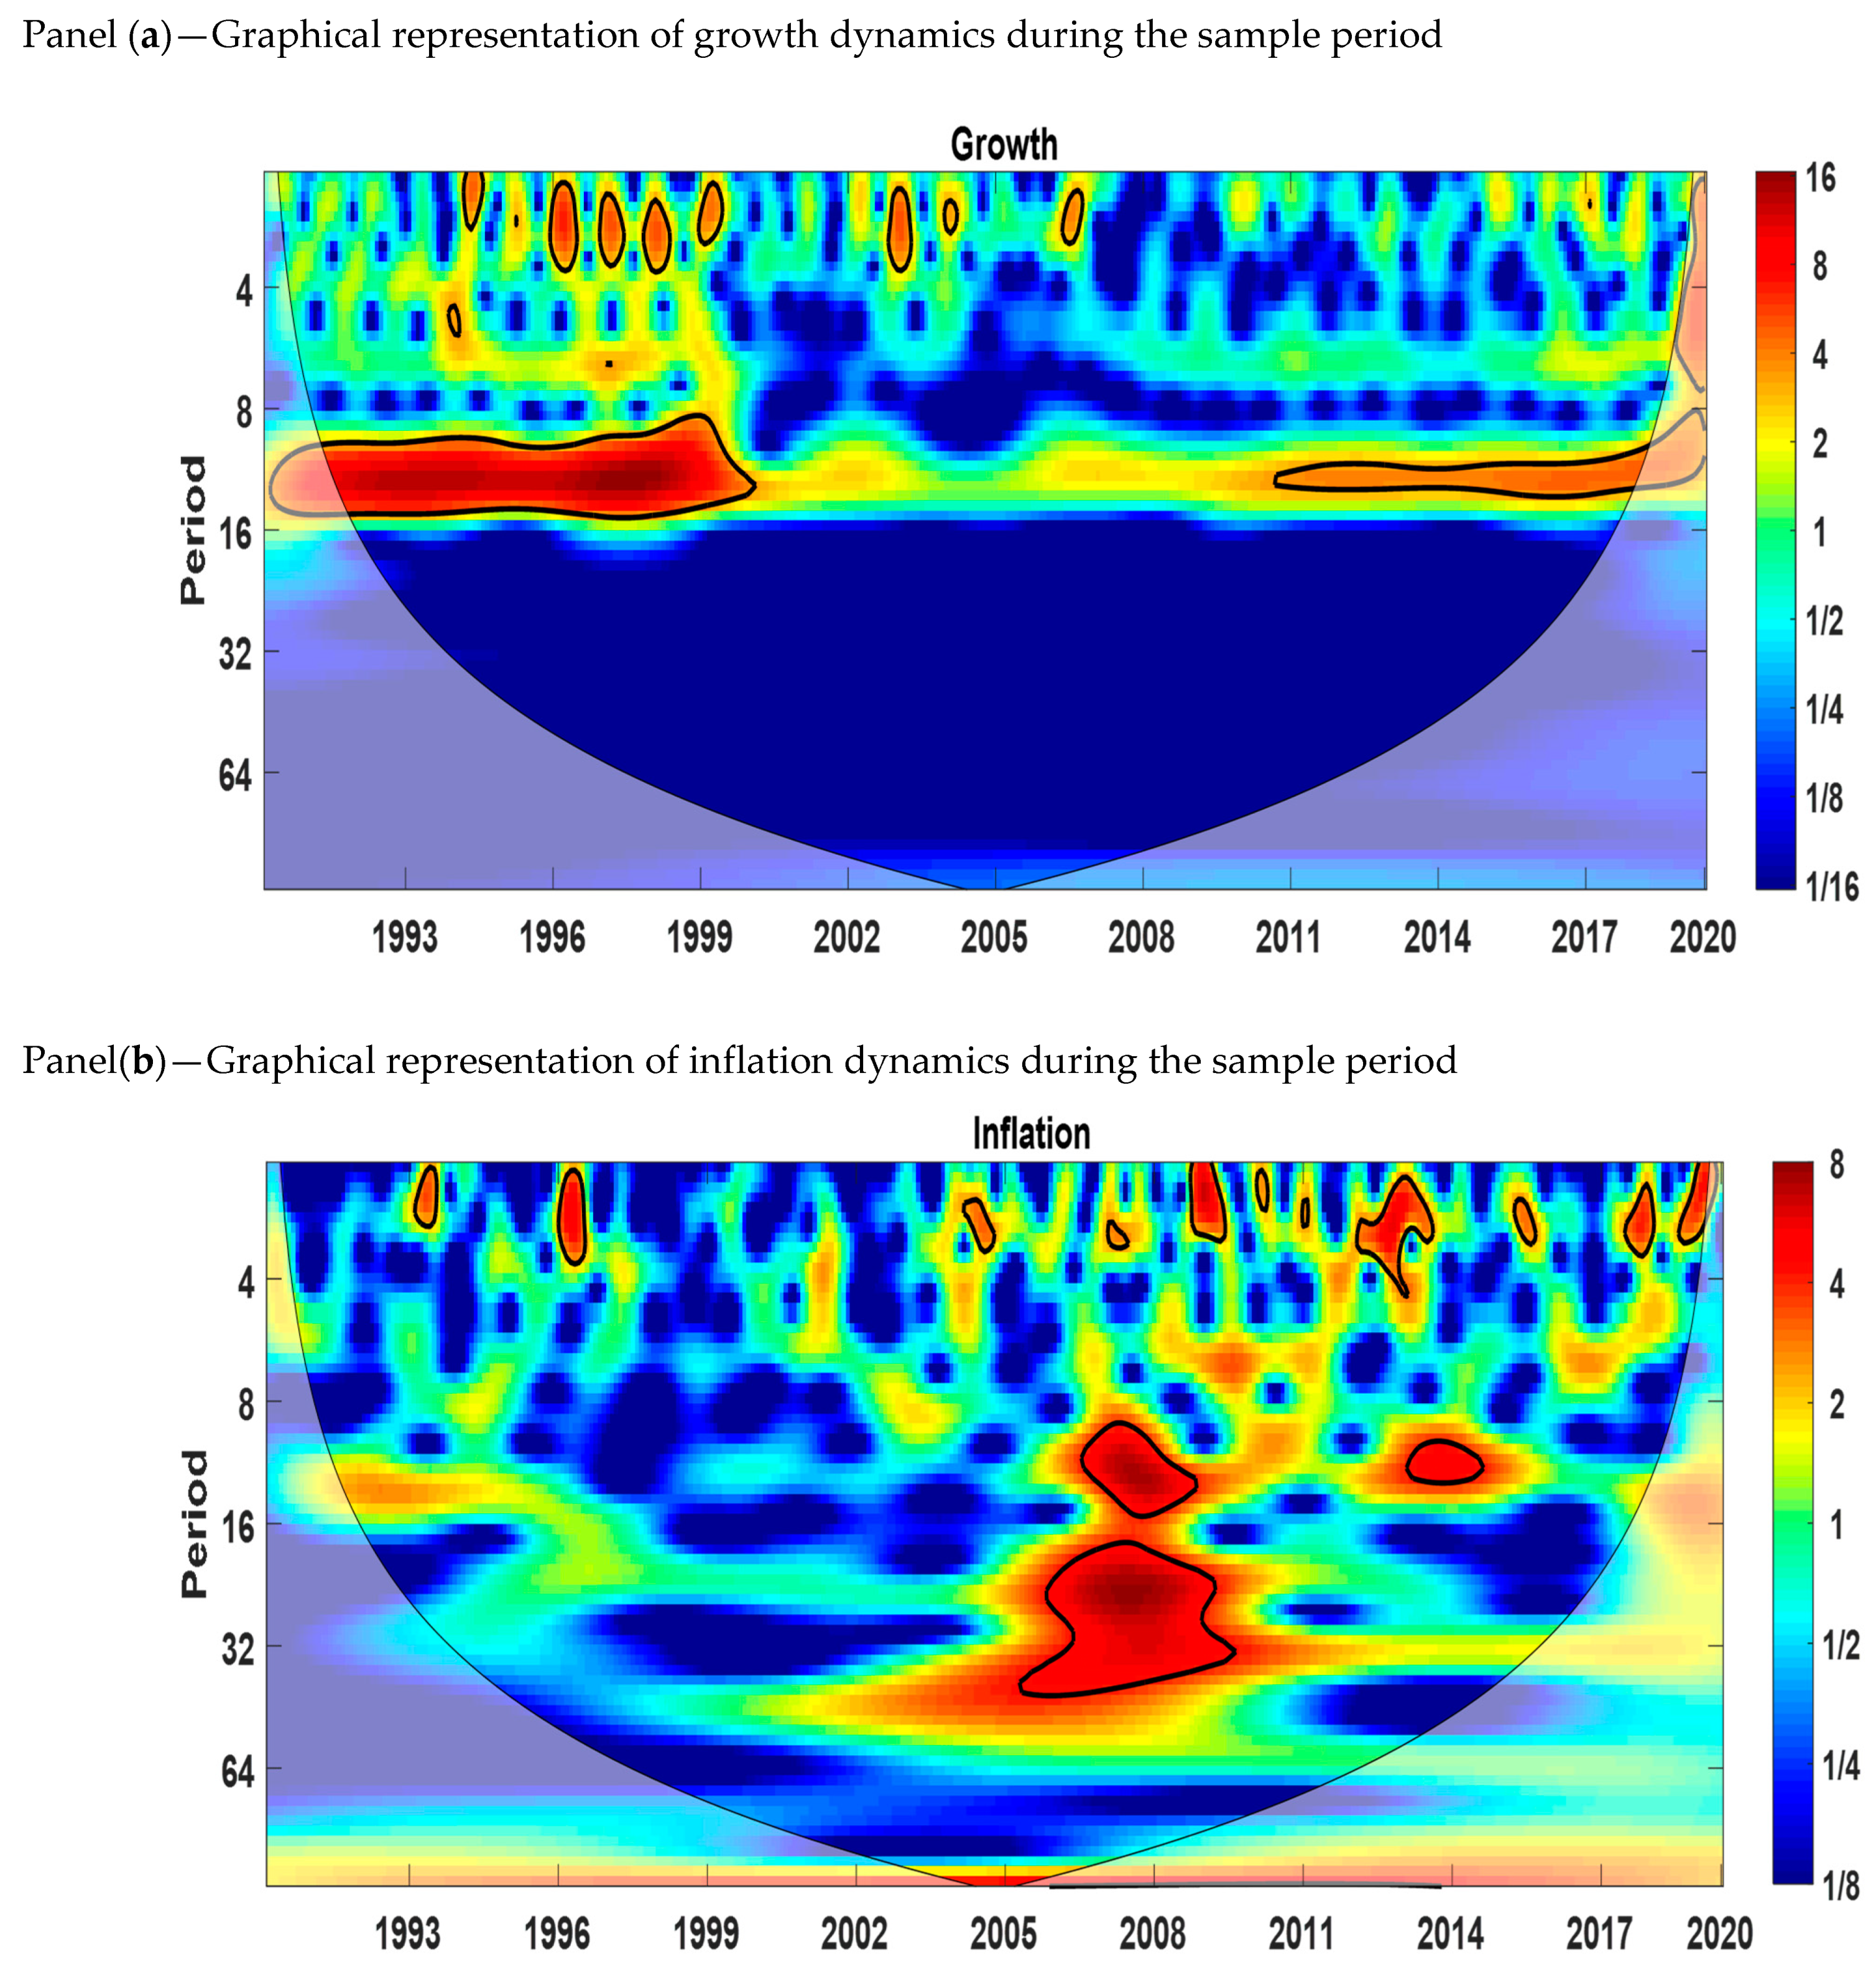
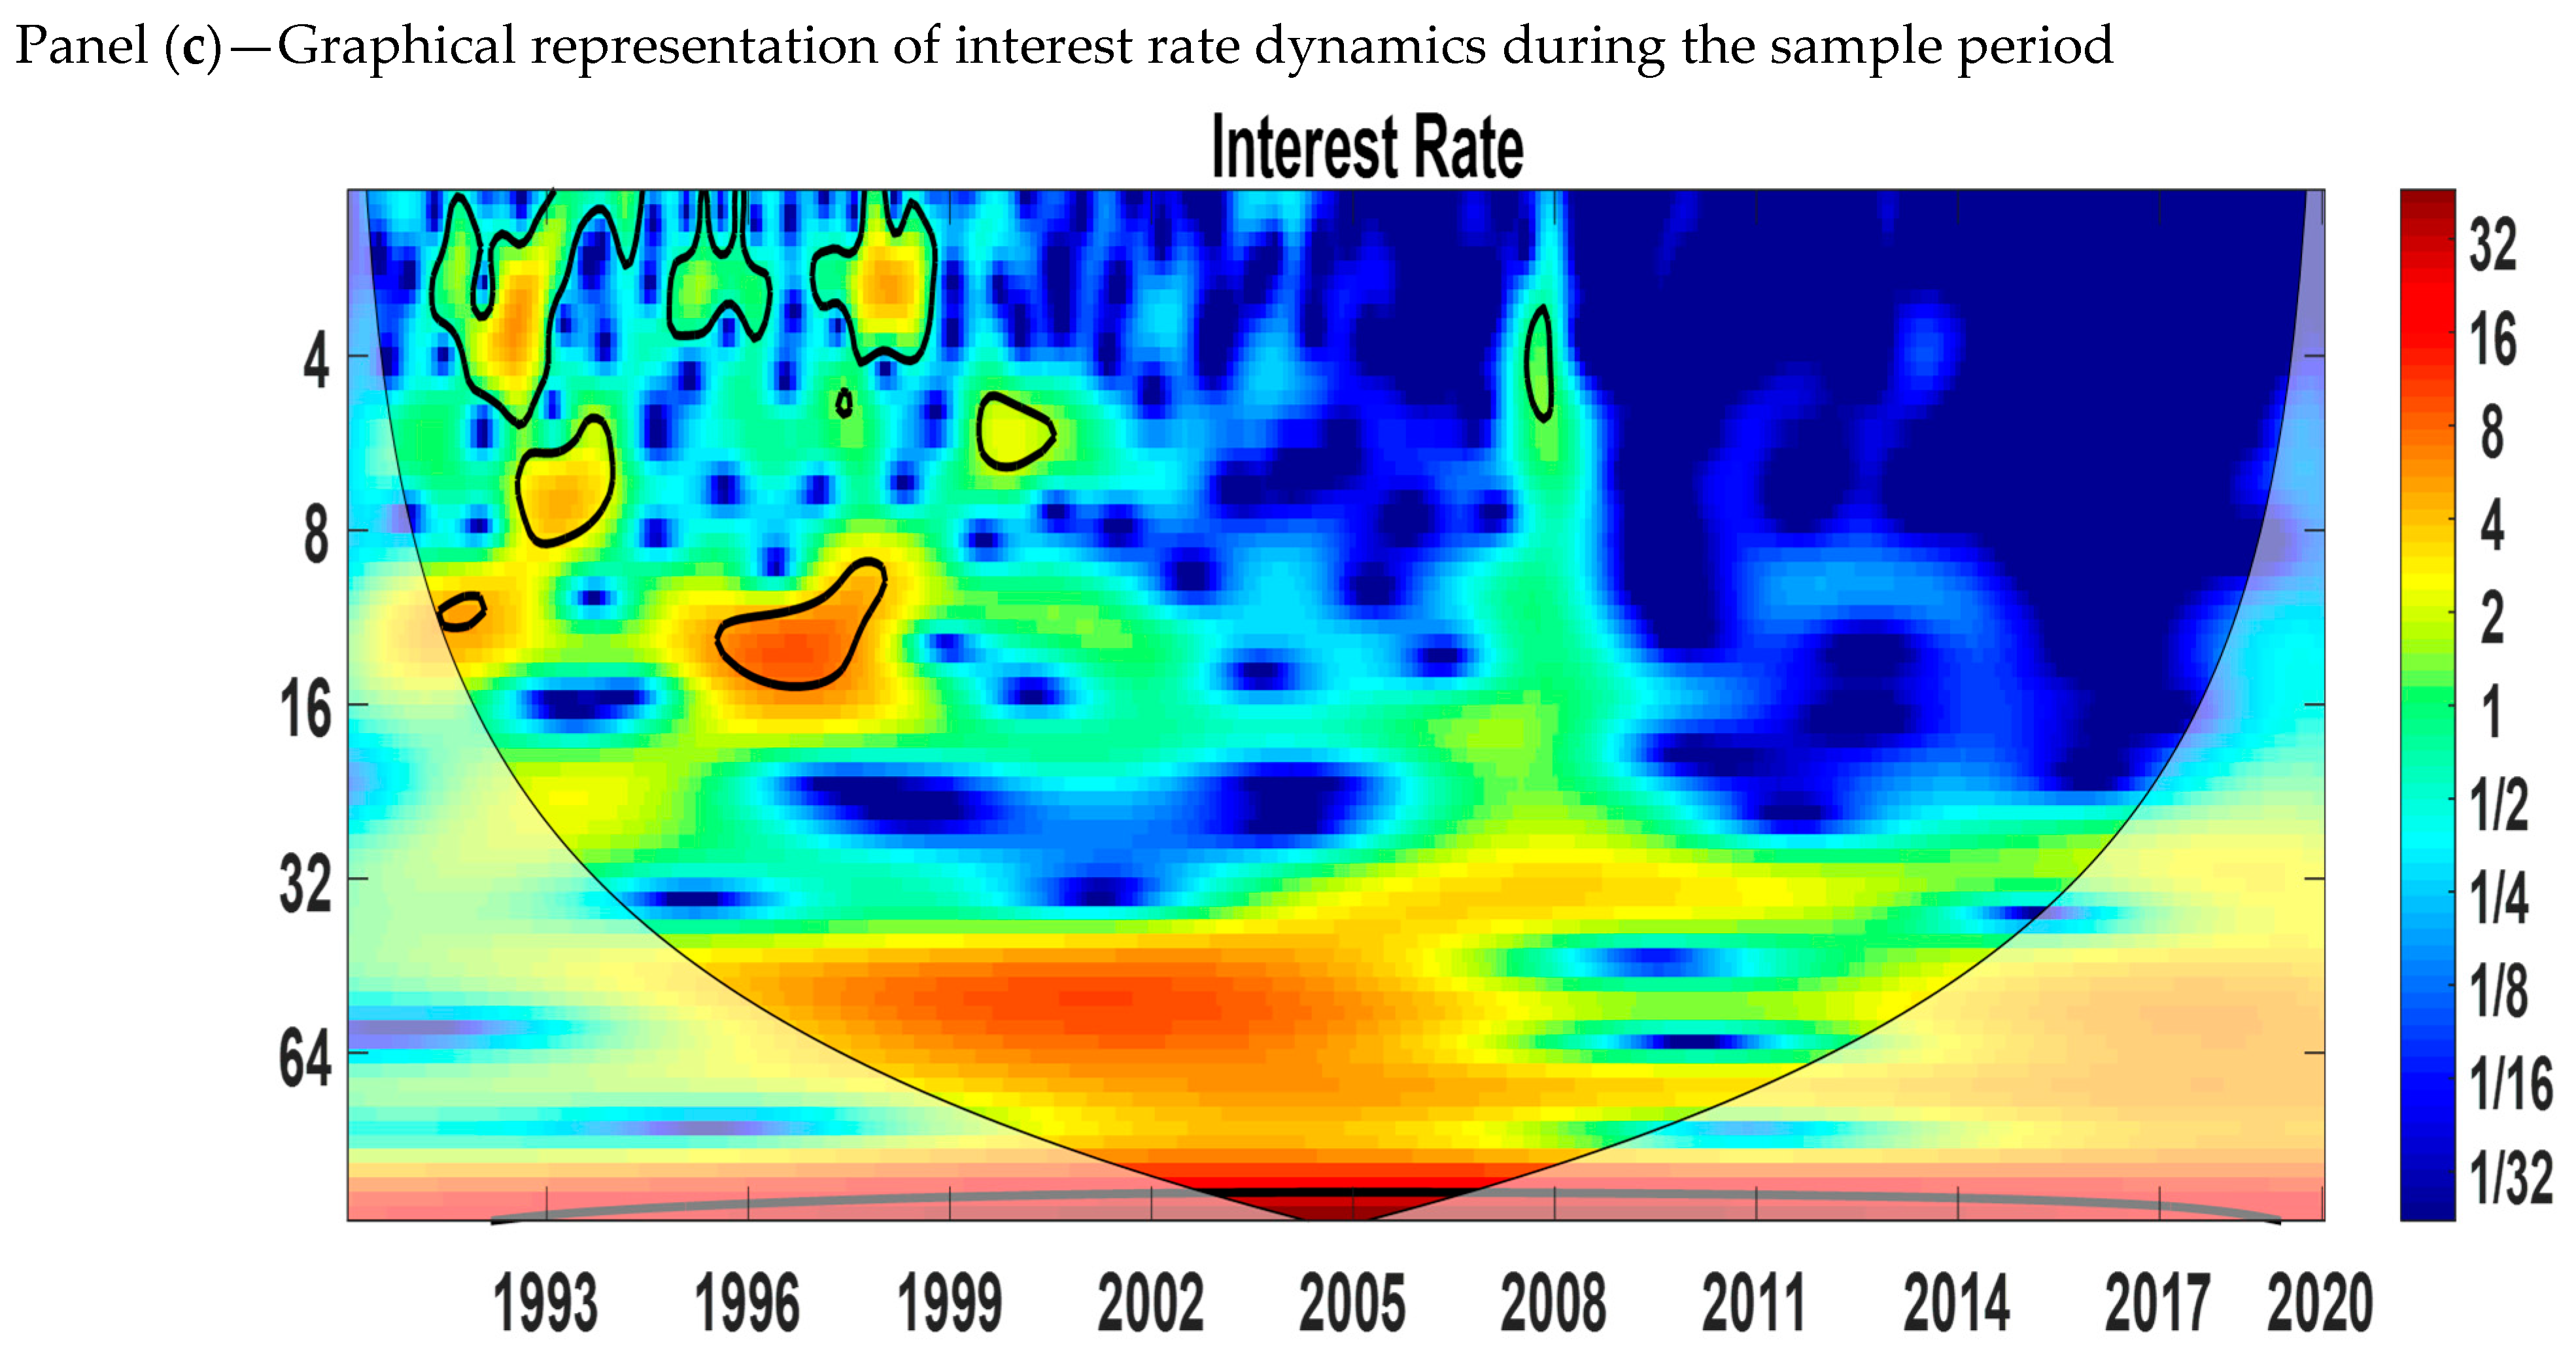
5.1. Continuous Wavelet Power Spectrum (CWT)

The continuous wavelet power spectrum shows the variables in the time–frequency space. The wavelet power spectra of economic growth, the interest rate, and inflation are shown in Figure 2. The blue color indicates low volatility, and the red color indicates high volatility. The thick black color refers to the 5% level of significance calculated from the Monte Carlo simulation. The X-axis represents the time period studied, and the Y-axis measures the scales or frequencies in months. We can see from Figure 2 that there is an indication of volatility at the 0–4 months scale in all three variables. From panel (a), we observe that growth has high volatility for the medium scale (8–16 months) from 1991 to 2000 and 2010 to 2020. Panel (b) shows that inflation is more volatile at the medium scale (8–16 and 16–32 months) from 2006 to 2009 and 2013 to 2014. At the long-run scale (32–64 months), there is proof of volatility from 2006 to 2009 and 2013 to 2014. Panel (c) shows that the interest rate has high volatility for the medium scale (8–16 months) from 1996 to 1999.
At the short (0–4 months) and medium (8–16 months) scales, the similarity of high-volatility regions between growth and inflation and growth and the interest rate does not provide us with information about the cyclical effects. Thus, to understand the lead–lag relationship between inflation and economic growth and the interest rate and economic growth, we applied the cross-wavelet power spectrum.

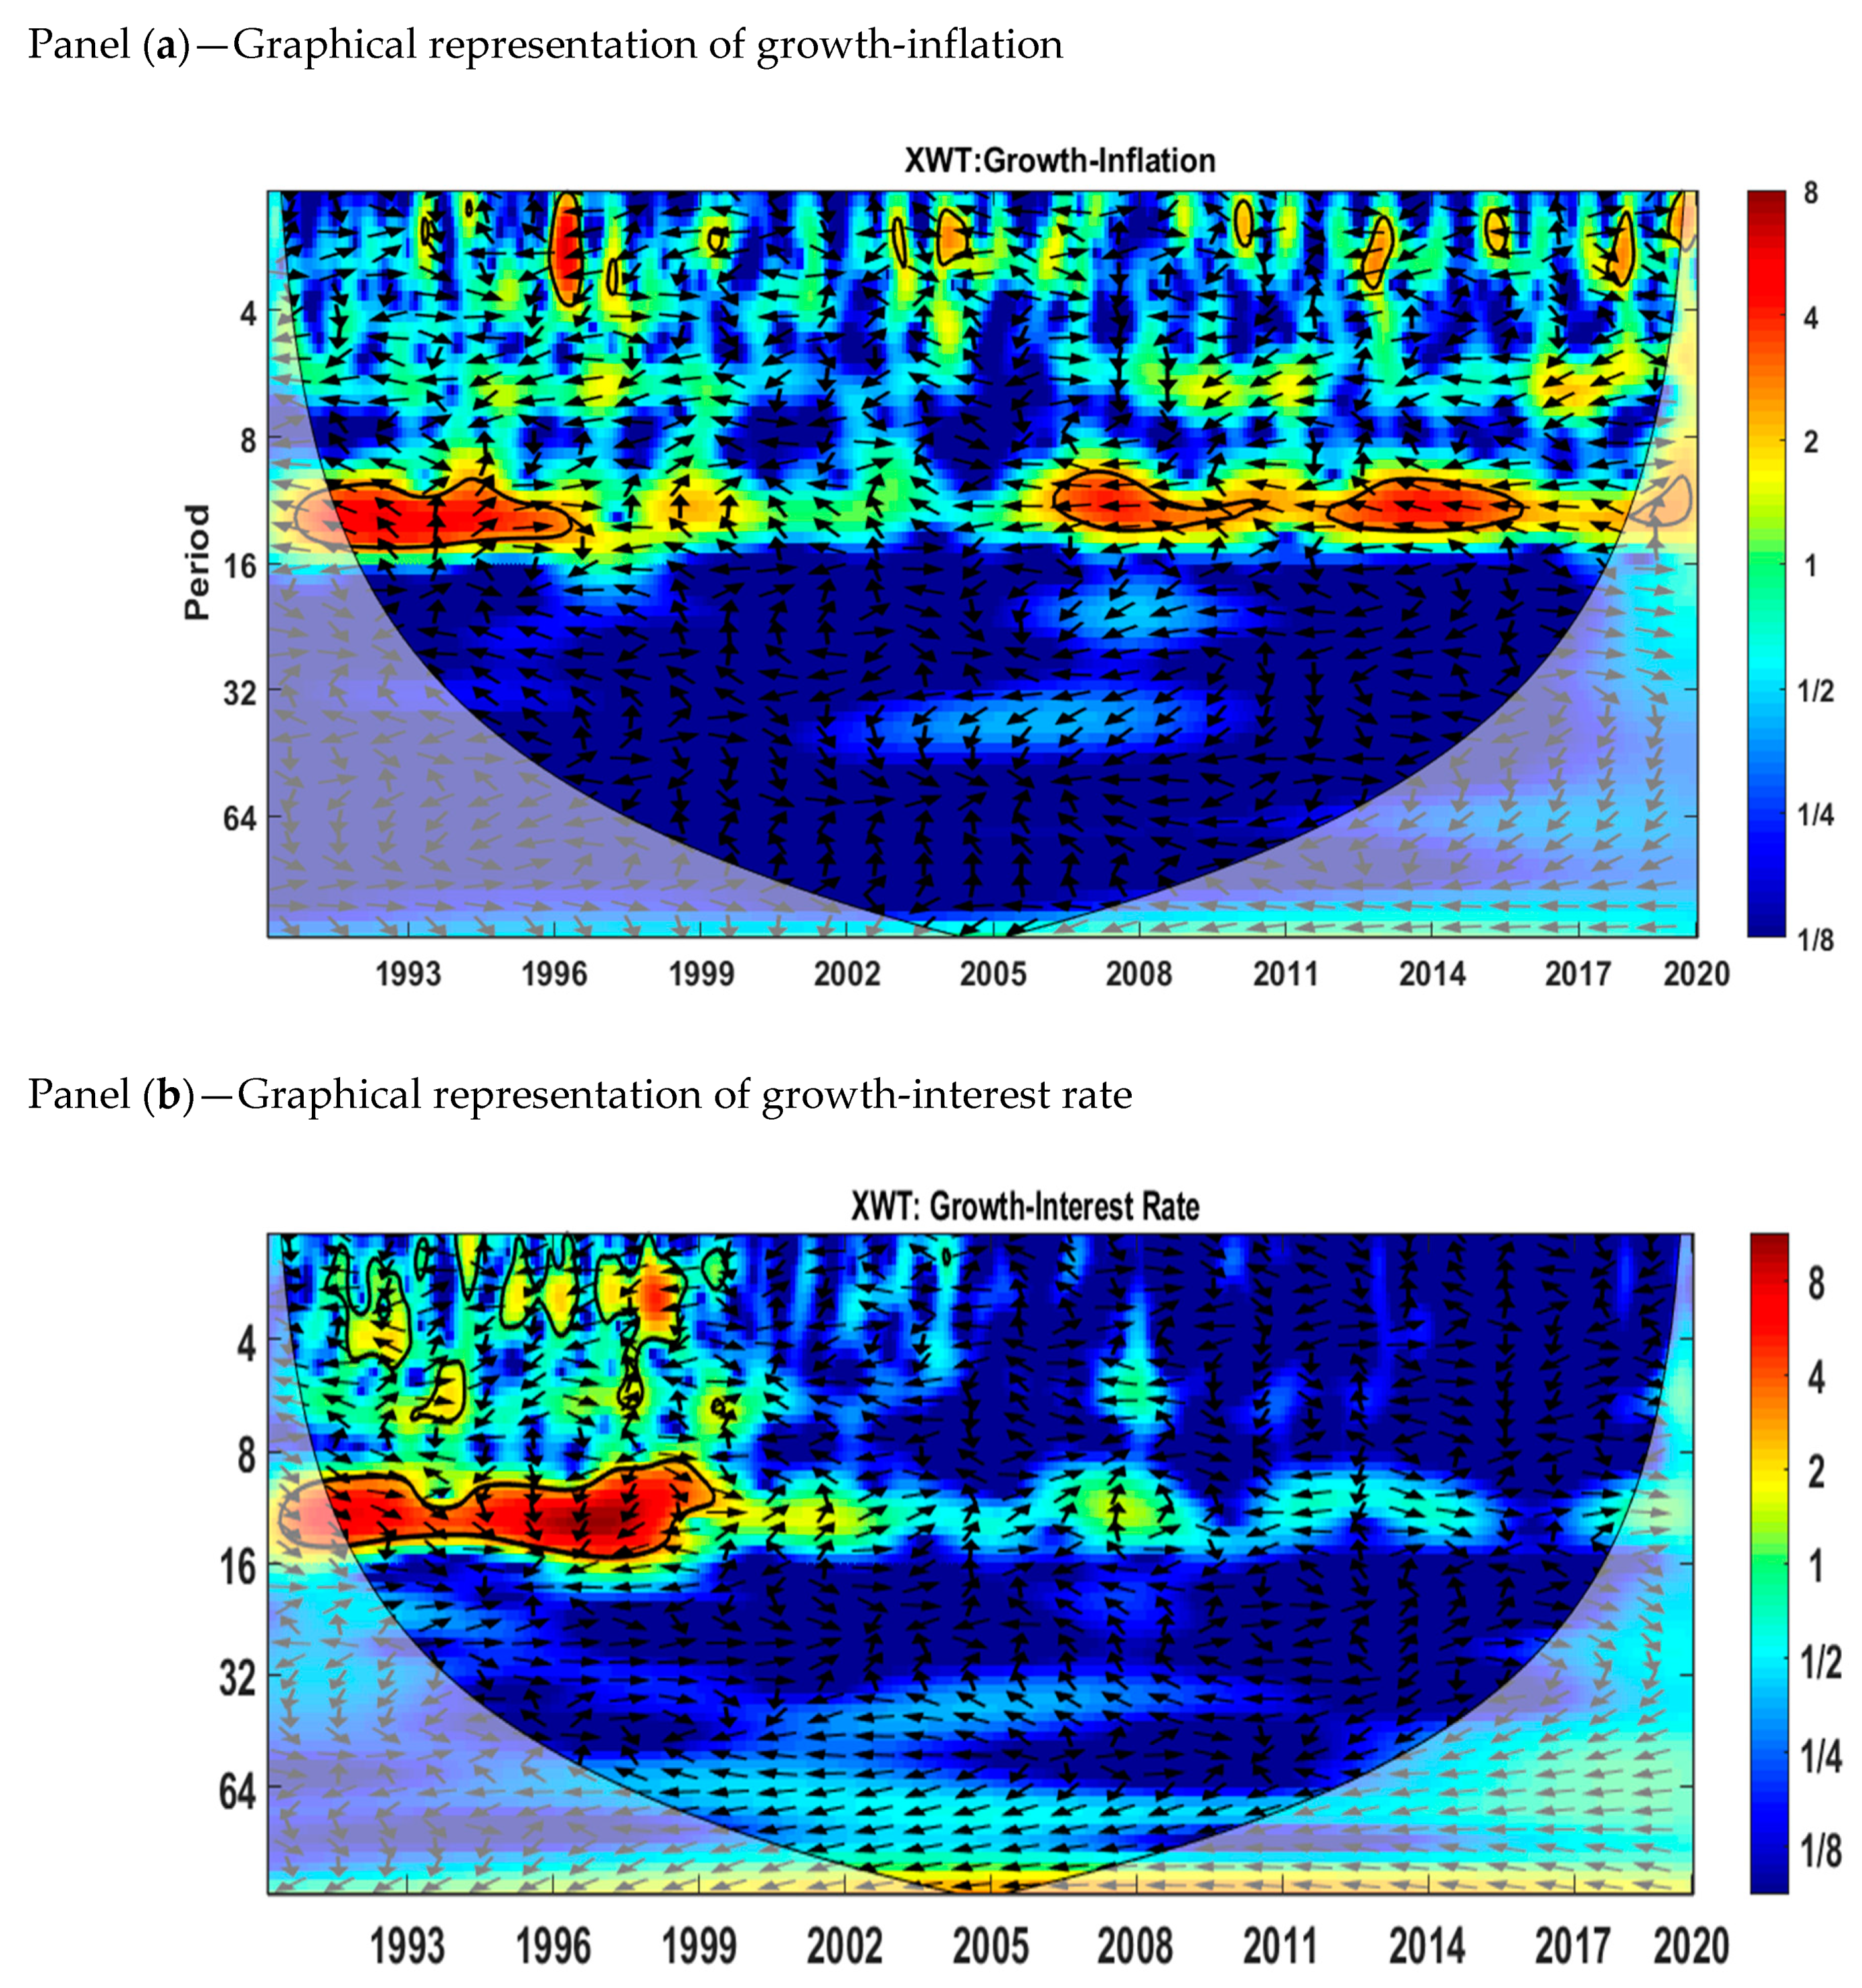
5.2. Cross-Wavelet Transform (XWT)

The cross-wavelet transform (XWT) indicates the areas in the time–frequency range where the two series correlate with each other. We analyzed the growth–inflation and growth–interest rate relationships using the cross-wavelet power spectrum. Figure 3 shows the estimations for the cross-wavelet transform for growth–inflation and growth–interest rate in Pakistan for the time period from January 1991 to May 2020. The area within the thick black color shows the 5% significance level calculated from Monte Carlo simulations. The red color shows the regions of high co-movement between variables, while the blue color represents no co-movement. The phase difference between variables is represented by arrows. The direction of arrows tells us whether the two variables are in phase or out of phase. When the variables are in phase, it shows that both variables are positively related to each other, and when the variables are out of phase, it means that the two variables are negatively related to each other. Arrows pointing to the right mean that two variables (inflation–growth or interest rate–growth) are in phase, and arrows pointing to the left mean that two variables (inflation–growth or interest rate–growth) are out of phase.
We observe from Figure 3 panel (a) that the growth–inflation relationship is different at different frequency bands. We can see that the growth–inflation relation is significant at frequencies representing the time scale of 8 to 16 months. Figure 3 shows that in the short run (2–4 months) and medium run (8–16 months), inflation and growth are mostly in anti-phase (out of phase), corresponding to the time periods from 1991 to 1993, 2012 to 2013, 2015 to 2016, 1991 to 1996, 2006 to 2011, 2012 to 2014, and 2019 to 2020. From 1994 to 1996, the two variables are in phase for the medium run (8–16 months).
We can see from panel (b) that the relationship between the interest rate and growth is significant at frequencies representing the time scales 0 to 4 and 8 to 16 months. For the 0 to 4 months time scale, the two variables are out of phase from 1998 to 1999. We can also observe from panel (b) that, most of the time, the interest rate and growth are in phase from 1991 to 1999 for the medium rum (8 to 16 months).

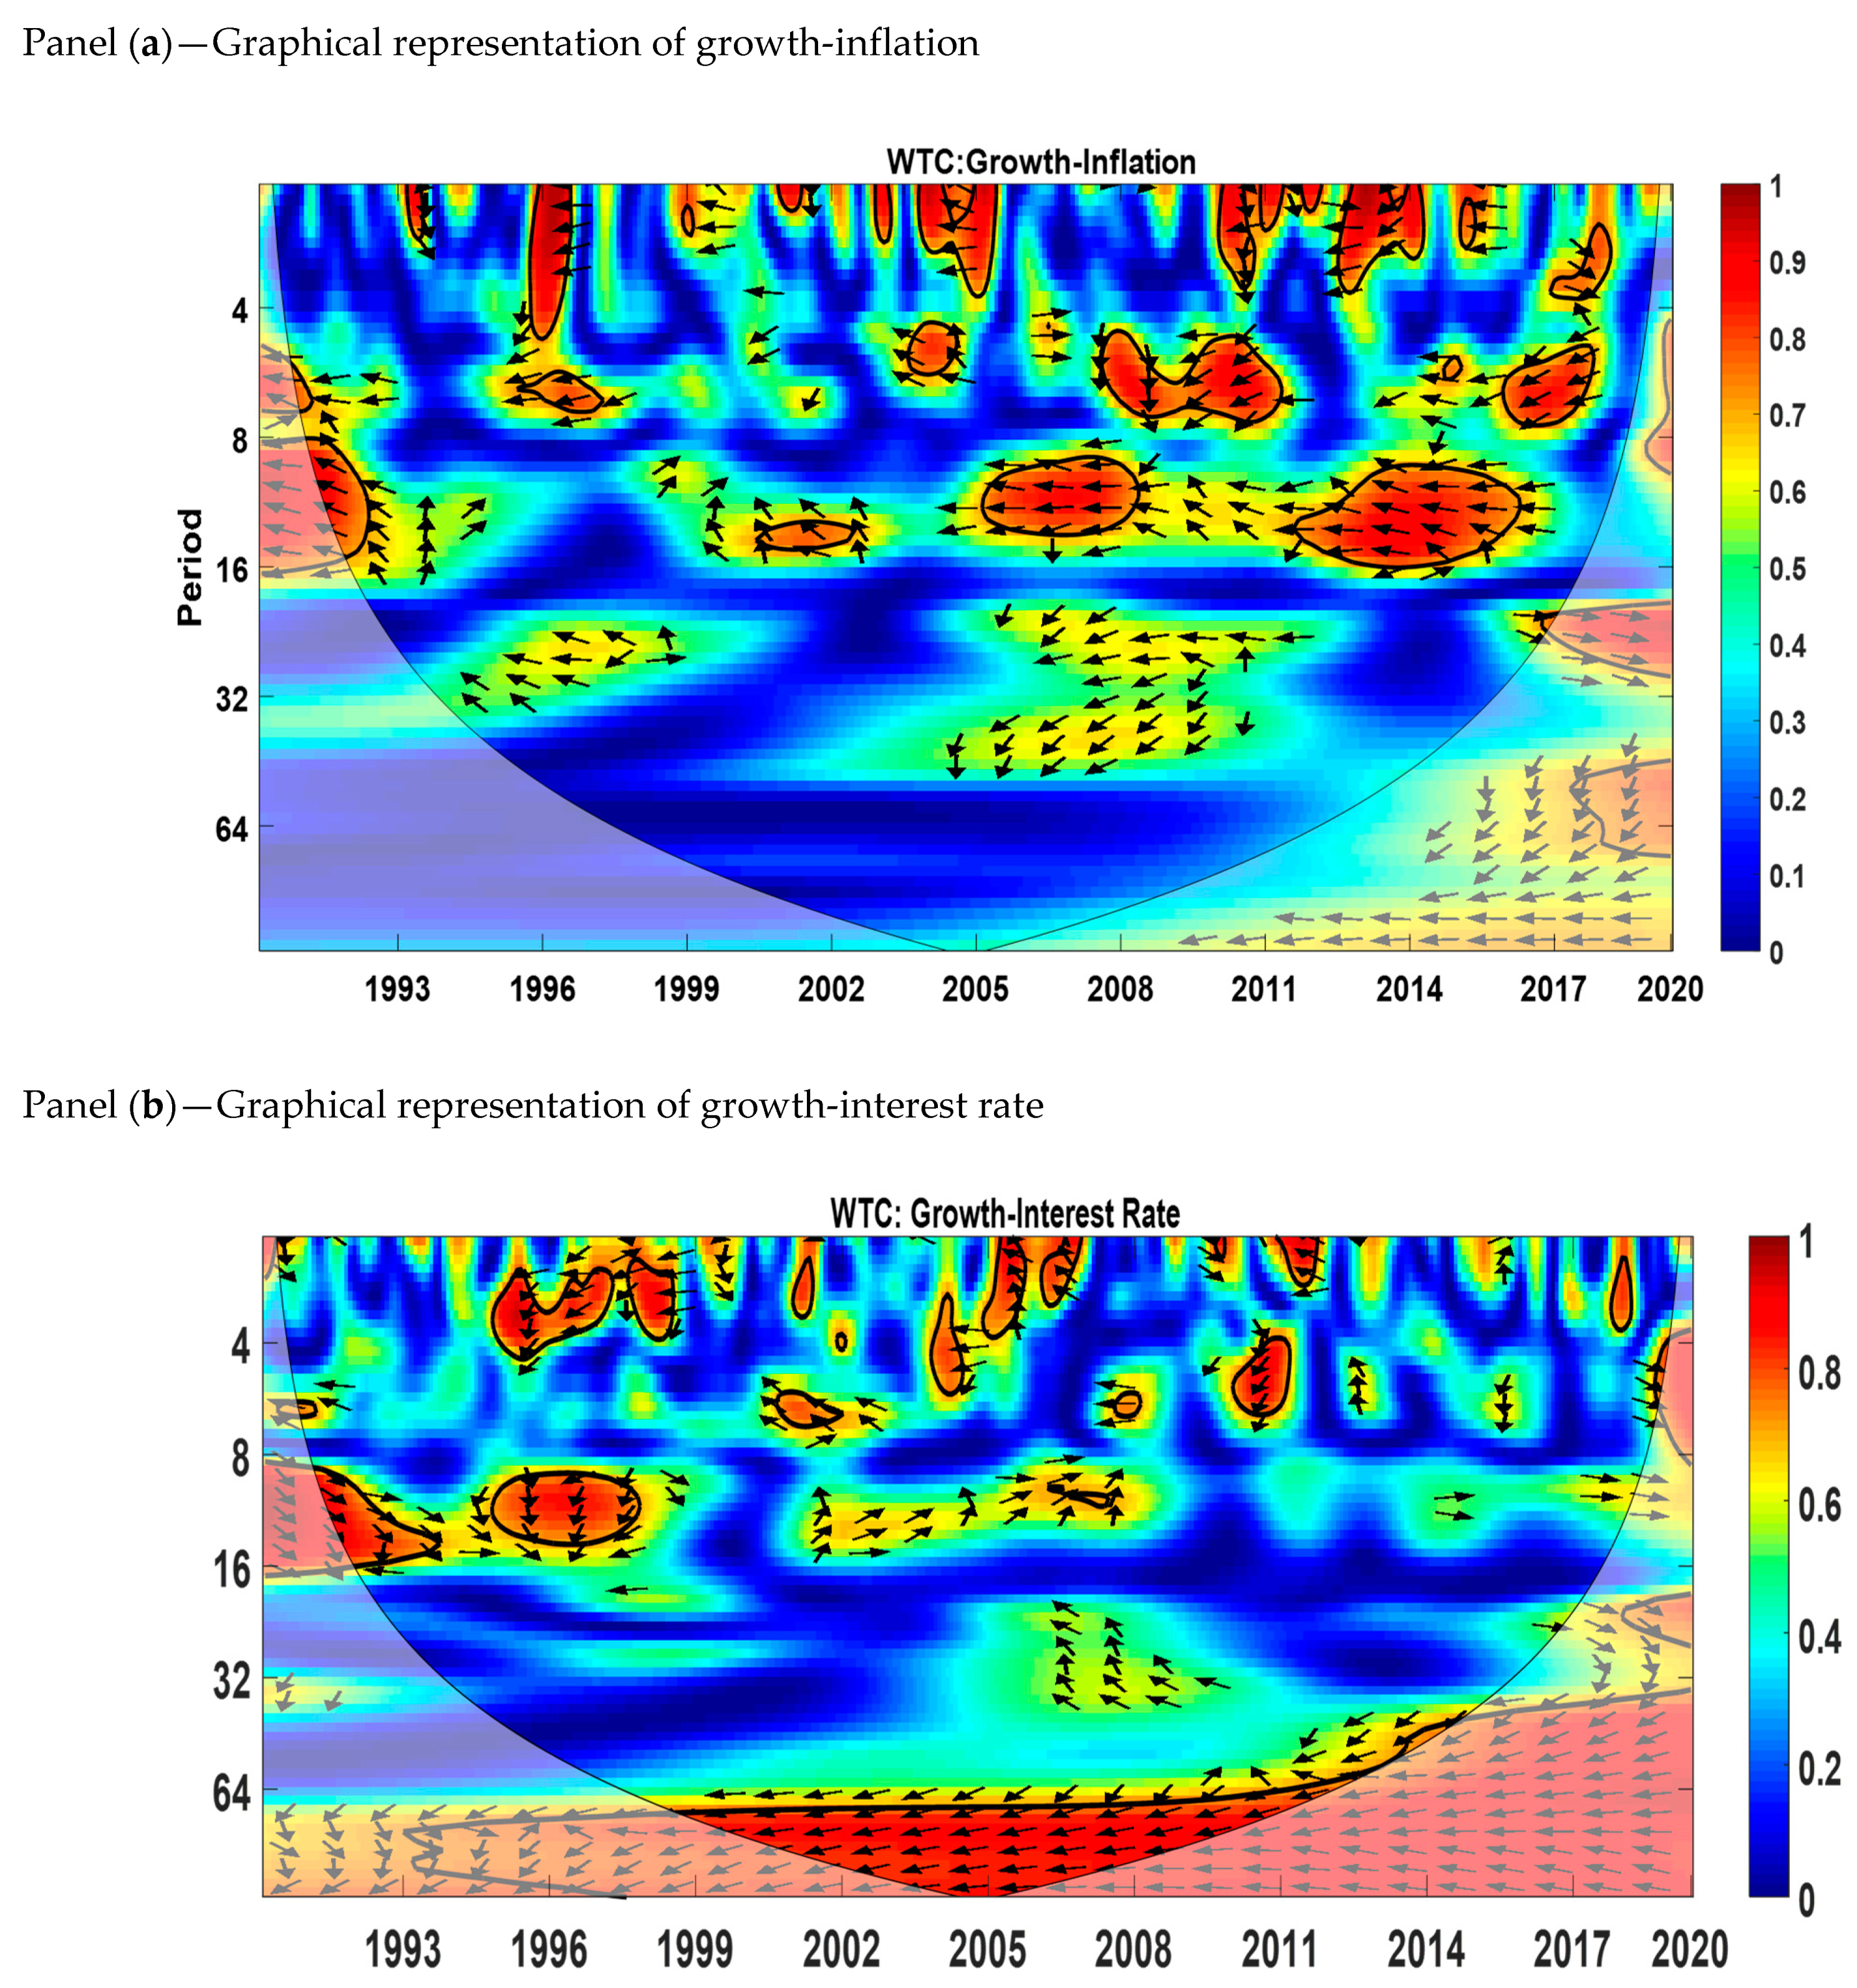
5.3. Cross-Wavelet Coherence (WTC)

Cross-wavelet coherence shows the areas in the time–frequency range where the two variables co-vary but the presence of high volatility is not necessary. We used this tool to determine both the frequency bands and time intervals in which variables are correlated with each other. The area within thick black color shows the 5% significance level calculated from Monte Carlo simulations. The red color shows the regions of high co-movement between variables, while the blue color represents no co-movement. The phase difference between variables is represented by arrows. The direction of arrows tells us whether variables are in phase or out of phase. When the variables are in phase, it shows that both variables are positively related to each other, and when the variables are out of phase, it means that the two variables are negatively related to each other. Arrows pointing to the right mean that two variables (inflation–growth or interest rate–growth) are in phase, and arrows pointing to the left mean that two variables (inflation–growth or interest rate–growth) are out of phase.
The cross-wavelet coherency is shown in Figure 4. Panel (a) shows that there is a significant growth–inflation relation in the medium run corresponding to the time dynamics of 8–16 months and 16–32 months. Almost all the significant regions show anti-phase behavior except for the 2017 to 2020 period region at the medium scale (16–32 months).
The cross-wavelet coherency for the interest rate and growth is represented by panel (b). Most of the significant regions show that the interest rate and economic growth are out of phase except in the medium run (8 to 16 months) for the time period 1991–1994. The relationship between the interest rate and growth is significant in the medium run (8 to 16 months) and long run (64 to 128 months). The significant regions in the short run are 1995 to 1997, 1998 to 1999, 2001 to 2002, 2004 to 2006, 2010 to 2011, and 2019 to 2020. Growth and the interest rate are out of phase for the long-run scale from 1993 to 2020.

5.4. Multi-Scale Granger Causality Tests

We cannot draw inferences about the causal relationship between inflation and economic growth and the interest rate and economic growth based on the previous analysis as it may provide us with misleading information. For example, cross-wavelet correlation analysis simply identifies the areas in the time–frequency range where two variables are correlated. Hence, it may not be a suitable tool to identify the lead–lag relationship. The Granger causality test is the most popular method to identify the correlation between variables because it not only estimates the correlation between variables but also identifies the direction of causality. Therefore, we examined the relationship between inflation and growth and the interest rate and growth at different timescales using the Granger causality test in the context of Pakistan. Combining the Granger causality test and wavelet analysis allows us to observe how the causality between variables varies with different frequency bands.
The results of the Granger causality test are shown in Table 6 and Table 7. The findings of the multi-scale pairwise causality analysis show that causality between inflation and growth varies over different time horizons. We selected the optimal lag length through AIC and the Quinn information criterion (HQIC). These criteria are mostly used to choose the optimal lag length of the model. We selected lag 4 through these criteria. The results in Table 6 show that growth causes inflation at all the scales except at D2 and D4 at a 5% level of significance. In the short run (D2) and medium run (D4), it does not cause inflation. There are conflicting results for shorter scales D1 and D2. At D1, growth causes inflation, but at D2, it does not cause inflation. We see the same results for the D3 and D4 scales. Inflation causes economic growth for all the scales except at D4. Furthermore, we conclude from our findings that in the long-run and very long-run, there is a bi-directional causal relationship between inflation and growth. At the time scale D4, we find no causal relationship between growth and inflation, and at the time scale D2, we find a unidirectional relationship between these variables, and the causality runs from inflation to output growth.
From Table 7, we can see that the results of the causal relationship between output growth and the interest rate are conflicting for the short-run (D1 and D2) and medium-run (D3 and D4), as in the case of growth and inflation. At the scales D1 and D3, there is a bi-directional relationship between economic growth and the interest rate, while we find no relationship between these two variables for the short-run (D2), and in the medium run (D4), we find a one-way causal relationship between growth and the interest rate. Growth causes the interest rate at all the scales except at D2 and D4, and the interest rate causes economic growth at all scales except at D2. In other words, in the long-run (D5 and D6) and the very long-run (S6), there is a bi-directional relation between the interest rate and growth.

6. Conclusions and Policy Implications

This paper has attempted to contribute to the existing literature on the inflation, interest rate, and economic growth nexus for Pakistan using a new technique, the wavelet transformation approach. Previous studies explored the relationship between inflation, the interest rate, and output growth using conventional time domain analysis, although, according to Bruno and Easterly (1998), the true relationship between variables may hold across different frequencies. We used monthly data on output growth, the interest rate, and inflation from January 1991 to May 2020. First, we found that a short-run and long-run relation exists between these variables by applying the ARDL cointegration test. We then divided the original series of three variables into different time scales using wavelet analysis.
We also studied the nature of causality and co-movement between inflation and growth and the interest rate and growth using the wavelet transformation approach and multi-scale Granger causality tests. The results of these tests indicate that the inflation–growth and interest rate–growth relationships are not straightforward unidirectional or bi-directional across all time scales as the previous studies suggested. The causal relationship between variables varies across different frequencies and time horizons. Our study finds, in the very short-run (2–4 months) and long-run (32–64, 64–132 months), that there is a bi-directional relationship between variables (inflation–growth and interest rate–growth). Hence, the causal relationships are different across different frequency bands.
The fluctuations in inflation and the interest rate influenced Pakistan’s economy, and the main target of policymakers is to stabilize the prices in the economy. This paper has major implications for policymakers as the results of the cross-wavelet transform and cross-wavelet coherence allow practitioners to understand the nature of the lead–lag relationship between growth and inflation and growth and the interest rate. Further, the investigation of causal relationships among variables across different time and frequency horizons is advantageous in formulating policies to change the interest rate and inflation in the economy.
We observed that, most of the time, inflation–growth and interest rate–growth are out of phase, indicating the negative relationship between variables. We conclude that keeping the inflation rate at a low level is very essential for growth in Pakistan. In particular, in these tough economic times due to the COVID-19 pandemic, the government should try to maintain inflation at low level. The central bank of Pakistan should also follow the expansionary monetary policy in order to decrease the cost of borrowing and boost growth. Based on the results of this study, we suggest that maintaining a low interest rate and inflation rate in the short run will help countries in reopening the economy and mitigating the effects of COVID-19. However, in the long-run, monetary authorities do not need to put too much pressure on controlling both variables at a very low level because, in the long run, there is a bi-directional relationship between inflation and growth and the interest rate and growth.

Limitation and Future Research

This study did not offer the threshold level of inflation and the interest rate as our main focus was to understand the nature of the relationship that exists between growth and inflation and growth and the interest rate across different time and frequency scales. Future research can use this analysis and define the threshold levels of inflation and the interest rate.
For this research study, we used monthly data from January 1991 to May 2020; therefore, in future studies, we will extend the selected time interval in order to cover a longer period since the onset of the COVID-19 pandemic. We will also consider including a cluster of several emerging countries from both Europe and Asia as a comparative study for a sample period which will cover both the global financial crisis and the COVID-19 pandemic. This study is limited to Pakistan, and therefore an extension is necessary to obtain even more rigorous conclusions.

Author Contributions

All authors contributed equally to this research work. All authors discussed the results and contributed to the final manuscript. All authors have read and agreed to the published version of the manuscript.

Funding

This research received no external funding.

Institutional Review Board Statement

Not applicable.

Informed Consent Statement

Not applicable.

Data Availability Statement

Not Applicable.

Conflicts of Interest

The authors declare no conflict of interest.

References

  1. Aguiar-Conraria, Luís, and Maria Joana Soares. 2011. Oil and the Macroeconomy: Using Wavelets to Analyze Old Issues. Empirical Economics 40: 645–55. [Google Scholar] [CrossRef]
  2. Aguiar-Conraria, Luís, Nuno Azevedo, and Maria Joana Soares. 2008. Using Wavelets to Decompose the Time-Frequency Effects of Monetary Policy. Physica A: Statistical Mechanics and Its Applications 387: 2863–78. [Google Scholar] [CrossRef] [Green Version]
  3. Aloui, Chaker, and Besma Hkiri. 2014. Co-Movements of GCC Emerging Stock Markets: New Evidence from Wavelet Coherence Analysis. Economic Modelling 36: 421–31. [Google Scholar] [CrossRef]
  4. Andrés, Javier, and Ignacio Hernando. 1997. Does Inflation Harm Economic Growth? Evidence for the OECD. Working Paper 6062. Cambridge: National Bureau of Economic Research. [Google Scholar]
  5. Anidiobu, Gabriel, Paschal I. P. Okolie, and D. C. Oleka. 2018. Analysis of Inflation and Its Effect on Economic Growth in Nigeria. IOSR Journal of Economics and Finance 9: 28–36. [Google Scholar] [CrossRef]
  6. Asghar, Nabila, Maryam Batool, Fatima Farooq, and Hafeez ur Rehman. 2020. Covid-19 Pandemic and Pakistan Economy: A Preliminary Survey. Review of Economics and Development Studies 6: 447–59. [Google Scholar] [CrossRef]
  7. Aßhoff, Sina, Belke Ansgar, and Osowski Thomas. 2020. Unconventional Monetary Policy and Inflation Expectations in the Euro Area, Ruhr Economic Papers 837, RWI-Leibniz-Institutfür Wirtschaftsforschung, Ruhr-University Bochum, TU Dortmund University, University of Duisburg-Essen. Available online: https://ideas.repec.org/p/zbw/rwirep/837.html (accessed on 15 April 2021).
  8. Ayyoub, Muhammad, Imran Sharif Chaudhry, and Fatima Farooq. 2011. Does Inflation Affect Economic Growth? The case of Pakistan. Pakistan Journal of Social Sciences (PJSS) 31. [Google Scholar]
  9. Barro, Robert J. 1995. Inflation and Economic Growth. NBER Working Paper. Cambridge: National Bureau of Economic Research, p. 5326. [Google Scholar]
  10. Batool, Maryam, Huma Ghulam, Muhammad Azmat Hayat, Muhammad Zahid Naeem, Abdullah Ejaz, Zulfiqar Ali Imran, Cristi Spulbar, Ramona Birau, and Tiberiu Horațiu Gorun. 2020. How COVID-19 Has Shaken the Sharing Economy? An Analysis Using Google Trends Data. Economic Research-Ekonomska Istrazivanja, 1–13. [Google Scholar] [CrossRef]
  11. Benhmad, François. 2013. Dynamic Cyclical Comovements between Oil Prices and US GDP: A Wavelet Perspective. Energy Policy 57: 141–51. [Google Scholar] [CrossRef]
  12. Bhaduri, Saumitra. 2016. Revisiting the Growth-Inflation Nexus: A Wavelet Analysis. Economic Notes 45: 79–89. [Google Scholar] [CrossRef] [Green Version]
  13. Bhattacharya, Prabir C. 1995. The economics of development: A review article. Journal of Economic Studies 22: 59–74. [Google Scholar] [CrossRef]
  14. Bibow, Jörg. 2002. What Has Happened to Monetarism? An Investigation into the Keynesian roots of Milton Friedman’s Monetary Thought and its Apparent Monetarist Legacies. Working Paper, No. 347. Annandale-on Hudson: Levy Economics Institute of Bard College. [Google Scholar]
  15. Bittencourt, Manoel, Reneé Van Eyden, and Monaheng Seleteng. 2015. Inflation and Economic Growth: Evidence from the Southern African Development Community. South African Journal of Economics 83: 411–24. [Google Scholar] [CrossRef] [Green Version]
  16. Briotti, Gabriella. 2005. Economic reactions to public finance consolidation: A survey of the literature. ECB Occasional Paper 38. [Google Scholar]
  17. Bruno, Michael, and William Easterly. 1998. Inflation Crises and Long-Run Growth. Journal of Monetary Economics 41: 3–26. [Google Scholar] [CrossRef] [Green Version]
  18. Cai, Xiaojing, Zheng Fang, Youngho Chang, Shuairu Tian, and Shigeyuki Hamori. 2020. Co-Movements in Commodity Markets and Implications in Diversification Benefits. Empirical Economics 58: 393–425. [Google Scholar] [CrossRef]
  19. Chimobi, Omoke Philip. 2010. Inflation and economic growth in Nigeria. Journal of Sustainable Development 3: 159. [Google Scholar]
  20. Chowdhury, Anis. 2002. Does Inflation Affect Economic Growth? The Relevance of the Debate for Indonesia. Journal of the Asia Pacific Economy 7: 20–34. [Google Scholar] [CrossRef]
  21. Clague, Christopher K. 1997. Institutions and Economic Development, Growth and Governance in Less-Developed and Post-Socialist Countries. Baltimore: The Johns Hopkins University Press. [Google Scholar]
  22. Coibion, Olivier, Yuriy Gorodnichenko, and Tiziano Ropele. 2018. Inflation Expectations and Firm Decisions: New Causal Evidence. Working Paper 25412. Cambridge: National Bureau of Economic Research, Available online: http://www.nber.org/papers/w25412 (accessed on 15 April 2021).
  23. Crowley, Patrick M. M. 2011. An Intuitive Guide to Wavelets for Economists. SSRN Electronic Journal, 1–68. [Google Scholar] [CrossRef] [Green Version]
  24. Dar, Arif Billah, Niyati Bhanja, and Aviral Kumar Tiwari. 2014. Inflation-Industrial Growth Nexus in India—A Revisit through Continuous Wavelet Transform. Central Bank Review 14: 1–11. [Google Scholar]
  25. Datta, Kanchan, and Chandan Kumar Mukhopadhyay. 2011. Relationship between Inflation and Economic Growth in Malaysia. An Econometric Review 4: 415–19. [Google Scholar]
  26. Daubechies, Ingrid. 1992. Ten Lectures on Wavelets. Computers in Physics 6, no. 6: 697. Pennsylvania: Society for Industrial and Applied Mathematics. [Google Scholar] [CrossRef] [Green Version]
  27. Davcev, Ljupco, Nikolas Hourvouliades, and Jasmin Komic. 2018. Impact of interest rate and inflation on GDP in Bulgaria, Romania and FYROM. Journal of Balkan and Near Eastern Studies 20: 131–47. [Google Scholar] [CrossRef] [Green Version]
  28. De Gregorio, Jose. 1991. The Effects of Inflationon Economic Growth: Lessons from Latin America. IMF Working Papers 91: 1. [Google Scholar] [CrossRef]
  29. Deardorff, Alan V. 2001. Developing country growth and developed country response. The Journal of International Trade and Economic Development 10: 373–92. [Google Scholar] [CrossRef]
  30. Di Giovanni, Julian, Justin McCrary, and Till von Wachter. 2009. Following Germany’s Lead: Using International Monetary Linkages to Estimate the Effect of Monetary Policy on the Economy. Review of Economics and Statistics 91: 315–31. [Google Scholar] [CrossRef] [Green Version]
  31. Dickey, David A., and Wayne A. Fuller. 1979. Distribution of the estimators for autoregressive time series with a unit root. Journal of the American Statistical Association 74: 427–31. [Google Scholar]
  32. Dinh, Doan Van. 2020. Impulse Response of Inflation to Economic Growth Dynamics: VAR Model Analysis. Journal of Asian Finance, Economics and Business 7: 219–28. [Google Scholar] [CrossRef]
  33. Dornbusch, Rudi, Carlo Favero, and Francesco Giavazzi. 1998. Immediate challenges for the European central bank. Economic Policy 13: 16–64. [Google Scholar] [CrossRef] [Green Version]
  34. Essaied, Hamrita Mohamed. 2013. Export-Led Growth in Tunisia: A Wavelet Filtering Based Analysis. Business and Economic Horizons 9: 12–27. [Google Scholar] [CrossRef] [Green Version]
  35. Feldman, Maryann, Theodora Hadjimichael, Lauren Lanahan, and Tom Kemeny. 2016. The logic of economic development: A definition and model for investment. Environment and Planning C: Government and Policy 34: 5–21. [Google Scholar] [CrossRef]
  36. Friedman, Milton. 1961. The lag in effect of monetary policy. Journal of Political Economy 69: 447–66. [Google Scholar] [CrossRef]
  37. Gallegati, Marco, Mauro Gallegati, James Bernard Ramsey, and Willi Semmler. 2011. The US Wage Phillips Curve across Frequencies and over Time. Oxford Bulletin of Economics and Statistics 73: 489–508. [Google Scholar] [CrossRef]
  38. Garside, W. R. 2007. Introduction: Economic Growth and Development—An Institutional Perspective. In Institutions and Market Economies. London: Algrave Macmillan. [Google Scholar] [CrossRef]
  39. Gençay, Ramazan, Faruk Selçuk, and Brandon Whitcher. 2001. Scaling Properties of Foreign Exchange Volatility. Physica A: Statistical Mechanics and Its Applications 289: 249–66. [Google Scholar] [CrossRef]
  40. Gençay, Ramazan, Faruk Selçuk, and Brandon Whitcher. 2003. Systematic Risk and Timescales. Quantitative Finance 3: 108–16. [Google Scholar] [CrossRef]
  41. Grubaugh, Stephen G. 2015. Economic growth and growth in human development, Applied Econometrics and International Development. Euro-American Association of Economic Development 15: 5–16. [Google Scholar]
  42. Gülşen, Eda, and Erdal Özmen. 2020. Monetary policy trilemma, inflation targeting and global financial crisis. International Journal of Finance and Economics 25: 286–96. [Google Scholar] [CrossRef]
  43. Harswari, Muhammad Hariz, Afiq Bin Nor, and Sahibzada Muhammad Hamza. 2017. The impact of interest rate on economic development: A study on Asian countries. International Journal of Accounting and Business Management 5: 180–88. [Google Scholar]
  44. Hossain, Md Elias, Bikash Chandra Ghosh, and Md Khairul Islam. 2012. Inflation and economic growth in Bangladesh. Researchers World 3: 85. [Google Scholar]
  45. Hussain, Shahzad, and Shahnawaz Malik. 2011. Inflation and Economic Growth: Evidence from Pakistan. International Journal of Economics and Finance 3: 262–76. [Google Scholar] [CrossRef]
  46. Hwang, Jen-Te, and Ming-Jia Wu. 2011. Inflation and economic growth in China: An empirical analysis. China and World Economy 19: 67–84. [Google Scholar] [CrossRef]
  47. International Monetary Fund. 2021. World Economic Outlook, Managing Divergent Recoveries, World Economic Studies, Division Research Department. p. 192. Available online: https://www.imf.org/en/Publications/WEO/Issues/2021/03/23/world-economic-outlook-april-2021 (accessed on 15 April 2021).
  48. Jawaid, Syed Tehseen, Imrana Saif, and Amana Maroof. 2019. International Tourism and Consumer Prices in Pakistan: A Wavelet-Based Analysis. Asia Pacific Journal of Tourism Research 24: 763–77. [Google Scholar] [CrossRef]
  49. Kasidi, Faraji, and Kenani Mwakanemela. 2013. Impact of inflation on economic growth: A case study of Tanzania. Asian Journal of Empirical Research 3: 363–80. [Google Scholar]
  50. Kumar, Vijay, Acharya Sanjeev Ho, and Ly T. H. 2020. Does Monetary Policy Influence the Profitability of Banks in New Zealand? International Journal of Financial Studies 8: 35. [Google Scholar] [CrossRef]
  51. Madurapperuma, Wasanthi. 2016. Impact of inflation on economic growth in Sri Lanka. Journal of World Economic Research 5: 1–7. [Google Scholar] [CrossRef] [Green Version]
  52. Maliszewska, Maryla, Aaditya Mattoo, and Dominique van der Mensbrugghe. 2020. The Potential Impact of COVID-19 on GDP and Trade: A Preliminary Assessment. East Asia and the Pacific Region Office of the Chief Economist & Macroeconomics, Trade and Investment Global Practice. World Bank, Policy Research Working Paper. Available online: https://openknowledge.worldbank.org/bitstream/handle/10986/33605/The-Potential-Impact-of-COVID-19-on-GDP-and-Trade-A-Preliminary-Assessment.pdf (accessed on 15 April 2021).
  53. Mallik, Girijasankar, and Anis Chowdhury. 2001. Inflation and Economic Growth: Evidence from Four South Asian Countries. Asia-Pacific Development Journal 8: 123–35. [Google Scholar]
  54. Mensah, Alice Constance, and Ebenezer Okyere. 2015. Real economic growth rate in Ghana: The impact of interest rate, inflation rate and GDP. Global Journal of Research in Business and Management 4: 206–12. [Google Scholar]
  55. Meyer, Yves. 1986. Wavelets and spline functions. Seminar Partial Differential Equations (Polytechnique) 6: 1–18. [Google Scholar]
  56. Mou, Jinjin. 2020. Research on the Impact of COVID19 on Global Economy. AEECE 2020 IOP Conf. Series: Earth and Environmental Science 546: 032043. [Google Scholar] [CrossRef]
  57. Naeem, Muhammad Zahid, Sumera Arshad, Ramona Birau, Cristi Spulbar, Abdullah Ejaz, Muhammad Azmat Hayat, and Jenica Popescu. 2021. Investigating the impact of CO2 emission and economic factors on infants health: A case study for Pakistan. Industria Textila 72: 39–49. [Google Scholar] [CrossRef]
  58. Nguyen, Tung, and Tian-Xiao He. 2015. Wavelet Analysis and Applications in Economics and Finance. Journal of Statistics and Mathematical Science 1: 22–37. [Google Scholar]
  59. Nikkinen, Jussi, Seppo Pynnönen, Mikko Ranta, and Sami Vähämaa. 2011. Cross-Dynamics of Exchange Rate Expectations: A Wavelet Analysis. International Journal of Finance and Economics 16: 205–17. [Google Scholar] [CrossRef]
  60. Paul, Satya, Colm Kearney, and Kabir Chowdhury. 1997. Inflation and economic growth: A multi-country empirical analysis. Applied Economics 29: 1387–401. [Google Scholar] [CrossRef]
  61. Percival, Donald B., and Andrew T. Walden. 2000. Wavelet Methods for Time Series Analysis. London: Cambridge University Press, ISBN 9780511841040. [Google Scholar] [CrossRef]
  62. Perron, Pierre, and Serena Ng. 1996. Useful modifications to some unit root tests with dependent errors and their local asymptotic properties. The Review of Economic Studies 63: 435–63. [Google Scholar] [CrossRef] [Green Version]
  63. Pesaran, M. Hashem, Yongcheol Shin, and Richard J. Smith. 2001. Bounds testing approaches to the analysis of level relationships. Journal of Applied Econometrics 16: 289–326. [Google Scholar] [CrossRef]
  64. Ramlan, Hamidah, Mohd Shafiq, and Izani Bin Suhaimi. 2017. The Relationship Between Interest Rates and Inflation Toward the Economic Growth in Malaysia. Journal of Humanities, Language, Culture and Business (HLCB) 1: 1268147. [Google Scholar]
  65. Ramsey, James. B. 2002. Studies in Nonlinear Dynamics and Econometrics Wavelets in Economics and Finance: Past and Future Wavelets in Economics and Finance. Past and Future 6: 1–27. [Google Scholar]
  66. Raza, Syed Ali, Muhammad Shahbaz, Rafi Amir-ud-Din, Rashid Sbia, and Nida Shah. 2018. Testing for wavelet based time-frequency relationship between oil prices and US economic activity. Energy 154: 571–80. [Google Scholar] [CrossRef]
  67. Rua, António, and Luís C. Nunes. 2009. International Comovement of Stock Market Returns: A Wavelet Analysis. Journal of Empirical Finance 16: 632–39. [Google Scholar] [CrossRef] [Green Version]
  68. Rua, António. 2012. Wavelets in Economics. Economic Bulletin and Financial Stability Report Articles and Banco de Portugal Economic Studies, Banco de Portugal, Economics and Research Department. pp. 71–79. Available online: https://www.bportugal.pt/sites/default/files/anexos/papers/ab201208_e.pdf (accessed on 15 April 2021).
  69. Saaed, Afaf. A. 2007. Inflation and economic growth in Kuwait: 1985–2005-Evidence from co-integration and error correction model. Applied Econometrics and International Development 7: 143–55. [Google Scholar]
  70. Schleicher, Christoph. 2002. An Introduction to Wavelets for Economists (No. 2002-3). Ottawa: Monetary and Financial Analysis Department, Bank of Canada. [Google Scholar]
  71. Shahbaz, Muhammad, Tiwari Aviral Kumar, and Tahir Mohammad Iqbal. 2013. Analyzing Time-Frequency Relationship between Oil Price and Exchange Rate in Pakistan through Wavelets, COMSATS Institute of Information Technology, Lahore, Pakistan, Paper No. 48086. Available online: https://mpra.ub.uni-muenchen.de/48086/MPRA (accessed on 15 April 2021).
  72. Shahid, Muhammad. 2014. Effect of Inflation and Unemployment on Economic Growth in Pakistan. Journal of Economics and Sustainable Development 5: 103–7. [Google Scholar]
  73. Singh, R. C. 2013. Wavelet transforms in time series analysis. İstanbul Aydın Üniversitesi Dergisi 3: 61–94. [Google Scholar]
  74. Smyth, David. J. 1994. Inflation and growth. Journal of Macroeconomics 16: 261–70. [Google Scholar] [CrossRef]
  75. Sumon, Khairul Kabir, and Sazib Miyan. 2017. Inflation and Economic Growth: An Empirical Evidence of Bangladesh 1986–2016. International Journal of Economics and Financial Issues 7: 454–64. [Google Scholar]
  76. Swastika, Purti, Ginanjar Dewandaru, and Mansur Masih. 2013. The Impact of Debt on Economic Growth: A Case Study of Indonesia. MPRA Paper 58837. Munich: University Library of Munich. [Google Scholar]
  77. Taderera, Christie, Runganga Raynold, Mhaka Simbarashe, and Mishi Syden. 2021. Inflation, Interest Rate and Economic Growth Nexuses in SACU Countries, MPRA Paper No. 105419. Available online: https://mpra.ub.uni-muenchen.de/105419/ (accessed on 27 May 2021).
  78. Tiwari, Aviral Kumar, Arif Billah Dar, and Niyati Bhanja. 2013. Oil Price and Exchange Rates: A Wavelet Based Analysis for India. Economic Modelling 31: 414–22. [Google Scholar] [CrossRef]
  79. Toda, Hiro Y., and Taku Yamamoto. 1995. Statistical inference in vector autoregressions with possibly integrated processes. Journal of Econometrics 66: 225–50. [Google Scholar] [CrossRef]
  80. Torrence, Christopher, and Gilbert P. Compo. 1998. A practical guide to wavelet analysis. Bulletin of the American Meteorological Society 79: 61–78. [Google Scholar] [CrossRef] [Green Version]
  81. Uddin, Gazi Salah, Ahmed Taneem Muzaffar, Mohamed Arouri, and Bo Sjö. 2017. Understanding the Relationship between Inflation and Growth: A Wavelet Transformation Approach in the Case of Bangladesh. World Economy 40: 1918–33. [Google Scholar] [CrossRef]
  82. Vacha, Lukas, and Jozef Barunik. 2012. Co-Movement of Energy Commodities Revisited: Evidence from Wavelet Coherence Analysis. Energy Economics 34: 241–47. [Google Scholar] [CrossRef] [Green Version]
  83. Varona, Luis, and Jorge R. Gonzales. 2021. Dynamics of the impact of COVID-19 on the economic activity of Peru. PLoS ONE 16: e0244920. [Google Scholar] [CrossRef]
  84. Vitenu-Sackey, Prince Asare, and Richard Barfi. 2021. The Impact of Covid-19 Pandemic on the Global Economy: Emphasis on Poverty Alleviation and Economic Growth, The Economics and Finance Letters. Conscientia Beam 8: 32–43. [Google Scholar]
  85. WHO. 2020. Statement on the Second Meeting of the International Health Regulations (2005) Emergency Committee Regarding the Outbreak of Novel Coronavirus (2019-nCoV). Geneva: World Health Organization, Available online: https://www.who.int/news-room/detail/30-01-2020-statement-on-the-second-meeting-of-the-international-health-regulations-(2005)emergencycommittee-regarding-the-outbreak-of-novel-coronavirus-(2019-ncov) (accessed on 20 May 2021).
  86. World Bank. 2021. World Bank Country and Lending Groups, Country Classification. Available online: https://datahelpdesk.worldbank.org/knowledgebase/articles/906519-world-bank-country-and-lending-groups (accessed on 20 May 2021).
  87. Yang, Lu, Shuairu Tian, Wei Yang, Mingli Xu, and Shigeyuki Hamori. 2018. Dependence Structures between Chinese Stock Markets and the International Financial Market: Evidence from a Wavelet-Based Quantile Regression Approach. North American Journal of Economics and Finance 45: 116–37. [Google Scholar] [CrossRef]
  88. Yang, Lu, Xiao Jing Cai, and Shigeyuki Hamori. 2017. Does the Crude Oil Price Influence the Exchange Rates of Oil-Importing and Oil-Exporting Countries Differently? A Wavelet Coherence Analysis. International Review of Economics and Finance 49: 536–47. [Google Scholar] [CrossRef]
Figure 1. Decomposition of all variables. Panel (a): Growth, (b): Inflation, and (c): Interest rate. Source: Author’s own contribution.
Jrfm 14 00277 g001aJrfm 14 00277 g001b
Figure 2. Wavelet power spectrum. Panel (a): Growth, (b): Inflation, and (c): Interest rate. Source: Author’s own contribution.
Jrfm 14 00277 g002aJrfm 14 00277 g002b
Figure 3. Cross-wavelet power spectrum. Panel (a): Growth-Inflation, (b) Growth-Interest rate. Source: Author’s own contribution.
Jrfm 14 00277 g003
Figure 4. Cross-wavelet coherence. Source: Author’s own contribution.
Jrfm 14 00277 g004
Table 1. Summary statistics.
VariablesMeanStandard DeviationSkewnessKurtosisObservations
Interest Rate change (MOM)0.00042.48560.49047.2421352
Growth0.00190.09360.01435.0388352
Inflation0.00650.00740.40973.4237352
MOM: month over month. Source: Author’s own contribution.
Table 2. Unit root tests.
VariablesDickey–FullerPhillips–Perron
LN(IPI)−2.181
(0.213)
−2.161
(0.220)
LN(CPI)−1.352
(0.605)
−1.087
(0.720)
Growth−17.523 ***
(0.000)
−17.480 ***
(0.000)
Inflation−15.614 ***
(0.000)
−16.068 ***
(0.000)
Interest Rate−7.319 ***
(0.000)
−7.004 ***
(0.000)
*** Significance at 1% level. Source: Author’s own contribution.
Table 3. Results of ARDL cointegration.
Bound Test F-ValueLower BoundUpper Bound
(at 5%)
12.36 ***3.13.87
Long-Run Coefficients
Dependent Variable: Economic GrowthCoefficientSE
Inflation0.58 ***0.03
Interest rate−0.03 ***0.01
Constant2.22 ***0.19
Adj. R-square0.96
Notes: (i) optimal lag selection for ARDL is based on Akaike information criteria (AIC); (ii) *** significance at 1% level. Source: Author’s own contribution.
Table 4. Causality tests.
Causality TestsCausality PathF-Statistic
Pairwise Granger CausalityGDP→INF36.901 ***
INF→GDP135.65 ***
GDP→IR3.024 *
IR→GDP28.983 ***
Toda–Yamamoto CausalityGDP→INF47.234 ***
INF→GDP164.400 ***
GDP→IR5.904 **
IR→GDP33.948 ***
Note: *** significance at 1% level; ** significance at 5% level; * significance at 10% level. Source: Author’s own contribution.
Table 5. Transformation of wavelet scales into different time horizons.
Wavelet ScalesTime HorizonEconomic Horizon
D12 to 4 monthsShort run
D24 to 8 months
D38 to 16 monthsMedium run
D416 to 32 months
D532 to 64 monthsLong run
D664 to 128 months
S6Above 128 monthsVery long run
Source: Author’s own contribution.
Table 6. Multi-scale Granger causality tests (growth and inflation).
Null HypothesisTest Valuep-Value
D1 Growth ≠> D1 Inflation5.8180.009
D2 Growth ≠> D2 Inflation0.5850.322
D3 Growth ≠> D3 Inflation63.8070.000
D4 Growth ≠> D4 Inflation0.7910.225
D5 Growth ≠> D5 Inflation4.3680.000
D6 Growth ≠> D6 Inflation18.930.001
S6 Growth ≠> S6 Inflation486.750.002
D1 Inflation ≠>D1 Growth8.6910.003
D2 Inflation ≠>D2 Growth6.2320.001
D3 Inflation ≠>D3 Growth44.6640.000
D4 Inflation ≠>D4 Growth3.3840.901
D5 Inflation ≠>D5 Growth3.6690.000
D6 Inflation ≠>D6 Growth28.1150.000
S6 Inflation ≠>S6 Growth468.5810.000
Source: Author’s own contribution.
Table 7. Multi-scale Granger causality tests (growth and interest rate).
Null HypothesisTest Valuep-Value
D1 Growth ≠> D1 Interest Rate15.5820.000
D2 Growth ≠> D2 Interest Rate1.6140.204
D3 Growth ≠> D3 Interest Rate65.6790.000
D4 Growth ≠> D4 Interest Rate0.0330.855
D5 Growth ≠> D5 Interest Rate5.2580.022
D6 Growth ≠> D6 Interest Rate73.9640.000
S6 Growth ≠> S6 Interest Rate32.1740.000
D1 Interest Rate ≠>D1 Growth8.2240.004
D2 Interest Rate ≠>D2 Growth0.1120.739
D3 Interest Rate ≠>D3 Growth85.6550.000
D4 Interest Rate ≠>D4 Growth29.8480.000
D5 Interest Rate ≠>D5 Growth7.0220.008
D6 Interest Rate ≠>D6 Growth166.0300.000
S6 Inflation Rate ≠>S6 Growth597.5500.000
Source: Author’s own contribution.
Publisher’s Note: MDPI stays neutral with regard to jurisdictional claims in published maps and institutional affiliations.

