
COVID-19 Pandemic and Romanian Stock Market Volatility: A GARCH Approach


Department of Finance, Bucharest University of Economic Studies, 6 Piata Romana, 010374 Bucharest, Romania
*
Author to whom correspondence should be addressed.
J. Risk Financial Manag. 2021, 14(8), 341; https://0-doi-org.brum.beds.ac.uk/10.3390/jrfm14080341
Submission received: 18 June 2021
/
Revised: 15 July 2021
/
Accepted: 16 July 2021
/
Published: 22 July 2021
(This article belongs to the Special Issue Corporate Finance, Governance, and Social Responsibility)
Abstract
:This paper investigates the volatility of daily returns on the Romanian stock market between January 2020 and April 2021. Volatility is analyzed by means of the representative index for Bucharest Stock Exchange (BSE), namely, the Bucharest Exchange Trading (BET) index, along with twelve companies traded on BSE. The quantitative investigation was performed using GARCH approach. In the survey, the GARCH model (1,1) was applied to explore the volatility of the BET and BSE traded shares. Conditional volatility for the daily return series showed noticeable evidence of volatility that shifts over the explored period. In the first quarter of 2020, the Romanian equity market volatility increased to a level very close to that recorded during the global financial crisis of 2007–2009. Over the next two quarters, volatility had a downward trend. Besides, after VAR estimation, no causal connection was found among the COVID-19 variables and the BET index.
1. Introduction
The coronavirus malady (COVID-19) is a sanitary and economic turning point that has harmed the basis of the human condition (Verma and Gustafsson 2020), it being one of the most acute health emergencies in the recent past (Vera-Valdés 2021). The occurrence of the disease hurt the global economies and caused insecurity on worldwide equity markets (Engelhardt et al. 2021). The extensive uncertainty of the plague and its related economic failures has triggered markets to turn extremely volatile and unpredictable (Zhang et al. 2020). Baker et al. (2020) suggested that no prior contagious virus outburst, including the Spanish Flu, has disturbed the equity market as strongly as the COVID-19 pandemic. Since it was difficult to expect and has never hitherto arose, this slump was described as a “black swan” event (Yarovaya et al. 2021). As compared with the 2008 crash which commenced in the United States and progressively diffused to other nations with a substantial time postponement, the coronavirus disease rapidly brought the worldwide economy to a stoppage by instantaneously hampering demand and supply lines around the globe due to extensive lockdowns (Ozkan 2021). Anser et al. (2021) noticed that COVID-19 contaminated cases are the central element that impedes financial activities and reduces money allocation, but a growing number of recovered cases offer investors’ trust to boost stock trade across nations. Agarwalla et al. (2021) documented that the rescue package had limited the extreme tail risks, but the volatility level persisted at a high level. Ghorbel and Jeribi (2021) claimed that equity indices and financial assets rely not only on their earlier volatility, but also on the preceding volatility of the fuel prices. Therefore, in the aftermath of SARS-CoV-2 virus diffusion, the unpredictability in stock exchanges substantially increased, thus causing huge shortfalls for investors (Farid et al. 2021). The decline of the composite indicator of systemic stress among February and April 2020 was equivalent to the failures it recorded at the beginning of the 2008 global financial crisis and the 2011–2012 sovereign debt crisis, whereas the collapse in March 2020 was the fourth-greatest monthly change since the commence of the euro (Borgioli et al. 2020). Pan et al. (2021) emphasized that the level of sovereign credit default swap enlarged throughout periods when the coronavirus pandemic turned out to be more critical. S&P 500 and EURONEXT 100 indices plummeted by nearly 30–38% between January and 15 June 2020 (data.europa.eu 2020), whilst Romania ranked ninth by considering the top ten best-performing leading European indices in the first half of 2020 (Bucharest Stock Exchange 2020).
However, although the COVID-19 pandemic undesirably affected worldwide economies and stock exchanges, Fernandez-Perez et al. (2021) proved that culture significantly influences market volatility since nations with reduced individualism and great uncertainty avoidance respond more adversely and with larger instability than nations with high individualism and weak uncertainty avoidance. Thus, Hunjra et al. (2021) supported that East Asian markets reacted differently to manifold sanitation arrangements and virus security strategies. Additionally, Bannigidadmath et al. (2021) explored 25 nations and showed that their reaction to government measures was dissimilar, claiming that in states where the guidelines counted, the impact was mainly harmful. Orhun (2021) supported that equity markets of nations with greater health outflow, better promptitude for diseases and superior GDP per capita are more protected against the coronavirus crisis. Harjoto and Rossi (2021) proved that the current pandemic had a significantly larger adverse effect to the equity markets in emerging nations than in the developed states.
COVID-19 induced panic and concerns amidst investors, thus contributing to social mindsets such as the herding behavior (Mnif et al. 2020). Shaikh and Huynh (2021) documented that investors’ concern came out to be greater in the equity sector first—ever since the stock market crash of 1987 and the global financial crisis of 2008–2009. For instance, Subramaniam and Chakraborty (2021) found a robust negative relationship among COVID-19 fear and stock returns. Hence, returns were adversely influenced by fear through rising the market risk premium claimed by stockholders (Aggarwal et al. 2021). Bourghelle et al. (2021) found that the COVID-19 shock caused further oil price instability, primarily attributable to intensified insecurity, alongside stockholder tension and fear. Chang et al. (2020) argued that different to the Global Financial Crisis, investors panic about assuming risks, so they may imprudently get rid of all their holdings. Karamti and Belhassine (2021) advised that concern in the US market dispersed to the worldwide markets at the longer investment horizons. Hence, Kizys et al. (2021) documented herding conduct in the first three months of 2020, along with Espinosa-Méndez and Arias (2021), which confirmed that the pandemic heightened herding conduct in European equity markets. Ortmann et al. (2020) established that investors raised their brokerage deposits and launched further accounts, whereas mean weekly trading intensity expanded by 13.9% as the number of cases duplicated. Moreover, Pagano et al. (2021) proved that retail investors lessened momentum trading and heightened contrarian trading operations throughout the preliminary stage of this turning point, whilst Smales (2021) claimed that individual traders are more inclined to perform online explorations for facts to settle dwelling insecurity in the course of the corona crisis. On the contrary, Sun et al. (2021) argued that coronavirus-associated reports and economic-related publications do not generate unreasonable investment judgments. Besides, Hong et al. (2021) advised that the pandemic period was related with market inefficiency, establishing rewarding prospects for dealers and opportunists.
Prior papers were focused on volatility examination for African equity markets (Lo et al. 2021; Takyi and Bentum-Ennin 2021; Zoungrana et al. 2021), the Australian stock market (Brueckner and Vespignani 2021), BRICS and G7 states (Yu et al. 2021), Canada and the US (Xu 2021), the Chinese stock market (Chen et al. 2021; Liu et al. 2021b; Shahzad et al. 2021), seven emerging countries (Hashmi et al. 2021), euro area stock markets (Duttilo et al. 2021), the Indian financial market (Bora and Basistha 2021), the South Korea stock market (Hoshikawa and Yoshimi 2021), Thailand (Hongsakulvasu et al. 2020), the Tunisian sectorial stock market (Fakhfekh et al. 2021), the US stock market (Curto and Serrasqueiro 2021; Hong et al. 2021), Vietnam and Philippines (Le and Tran 2021), Visegrad Group member states (Czech et al. 2020), or several international markets (Al-Najjar et al. 2021; Al-Qudah and Houcine 2021; Anser et al. 2021; Banerjee 2021; Chowdhury et al. 2021; Contessi and Pace 2021; Engelhardt et al. 2021; Höhler and Lansink 2021; Rouatbi et al. 2021; Szczygielski et al. 2021b; Topcu and Gulal 2020; Vera-Valdés 2021; Youssef et al. 2021; Zhang et al. 2020). This paper aims to examine the volatility throughout the Romanian financial market during the COVID-19 pandemic. Investigating volatility is crucial, as an unexpected and substantial rise in instability may cause a financial meltdown (Uddin et al. 2021). We investigate an emerging stock exchange as long as these markets are more exposed to insecurity of pandemics and epidemics than developed markets (Salisu et al. 2020).
In the present article, it was analyzed how the volatility on the Romanian stock market manifested itself due to the COVID-19 pandemic outbreak. Thus, in order to fulfill the objective of the study, coronavirus daily data were used between January 2020 and April 2021 for the following markets: USA, Italy, and Romania. For the Romanian capital market, we selected the representative index for Bucharest Stock Exchange (BSE), namely, the Bucharest Exchange Trading (BET) index, as well as a number of twelve shares, these being positioned in the top of the most traded on BSE at the time of this research. Regarding the variables used as proxies for COVID-19, they are related to the evolution of the new number of cases of COVID-19 registered in the USA, Italy, and Romania. Italy was the epicenter of the COVID-19 pandemic in Europe, whereas the USA had the highest number of COVID-19 cases. Moreover, the USA has some of the largest stock markets that have a strong impact on other markets. For instance, Celık (2012) proved that emerging markets appear to be the most affected by the contagion consequences from the U.S. Moreover, Le and Tran (2021) found evidence that Vietnamese and the Philippine stock markets are affected by the contagion effect from the US stock market throughout the COVID-19 pandemic.
So far, the evidence for BSE is limited, this being, to the best of our knowledge, among the first studies that address the impact of COVID-19 on the Romanian capital market.
2. Literature Review
The occurrence of COVID-19 has harmful effects on worldwide markets (Naeem et al. 2021), being expected to be the largest economic shock in human history (Insaidoo et al. 2021). Broadly, Xu (2021) noticed an adverse effect of a rise in the COVID-19 cases on the financial market. Chowdhury et al. (2021) claimed that European financial markets were the most terrible victim related to others. In the same vein, Youssef et al. (2021) noticed that European equity markets, excepting Italy, spread more spillovers to the whole other financial markets than they obtained, mainly through the coronavirus outburst. Szczygielski et al. (2021b) showed that pandemic insecurity has affected nearly all territories via smaller returns and heightened market volatility. Hence, the insecurity triggered by the COVID-19 outbreak and the rapidity with which the novel coronavirus dispersed around the world produced a panic in international financial markets (Lo et al. 2021). As such, Zhang and Hamori (2021) noticed that the effect of disease on the volatility of the oil and stock markets surpassed that of the 2008 global financial crisis. Moreover, Szczygielski et al. (2021a) proved that no national energy market was unharmed by COVID-19 insecurity. Hence, coronavirus disease lessened stock market liquidity involving equally the depth and the tightness facets (Mdaghri et al. 2021). For S&P 500 enterprises, Chebbi et al. (2021) documented a negative link among the quotidian increase in the numbers of coronavirus cases and fatalities and stock liquidity. Moreover, for the Shanghai stock market, Ftiti et al. (2021) confirmed the rise of stock market volatility and liquidity risk justified by a ripple effect triggered by the vulnerability of the sanitary sector. However, Curto and Serrasqueiro (2021) argued that coronavirus occurrence did not strike evenly across all the US segments and stock quotes. For instance, Milcheva (2021) noticed that the most affected segments in the US are retail and hotels, but in Asia the most affected segment is the office. Nevertheless, Höhler and Lansink (2021) noted that the food sector was less influenced by the pandemic than other segments.
A first strand of literature was focused on the reaction of stock returns to the existing pandemic. Topcu and Gulal (2020) exhibited that Asian markets were the most influenced by the pandemic, succeeded by South America and the Middle East. As such, Hongsakulvasu et al. (2020) revealed that COVID-19 disquiet negatively influenced every kind of Thailand’s stock return. Al-Najjar et al. (2021) claimed that coronavirus incidents exert an adverse impact on equity market indices of G8 countries. Al-Qudah and Houcine (2021) noticed that the surge in established cases of COVID-19 negatively influenced stock returns for the main affected nations in the WHO Regions. For Central, North, and the South American realm, Amin et al. (2021) concluded that COVID-19 cases undesirably influence market indexes. Takyi and Bentum-Ennin (2021) revealed that African financial markets performance lessened between −2.7% and −20 % throughout and subsequently the incidence of the pandemic. Czech et al. (2020) reported a negative association among the Visegrad stock market indices and the COVID-19 diffusion. For the case of emerging markets, Hashmi et al. (2021) advised that the number of coronavirus cases negatively influences stock prices mainly when these financial markets are in a bearish condition. Contrariwise, O’Donnell et al. (2021) found that the everyday amounts of COVID-19 cases did not explain the index price variations in China, Spain, Italy, the United Kingdom, and the United States. Zoungrana et al. (2021) revealed for the West African Economic and Monetary Union’s (WAEMU) stock market that weekly validated cases do not influence stock returns, even if the impact of death cases is harmful. However, Brueckner and Vespignani (2021) documented that COVID-19 contaminations had a positive influence on the performance of the Australian equity market.
Another strand of research was oriented on how COVID-19 news influences stock returns and oil prices because terrific fear caused by the mass media is related with growing volatility in the financial markets (Haroon and Rizvi 2020). Chundakkadan and Nedumparambil (2021) provided evidence that emphasis on the pandemic has generated a pessimistic reaction between market players and weakened the stock exchanges. Weng et al. (2021) established that news throughout the coronavirus pandemic has more forecasting information, which is essential for the transient volatility estimating of fuel futures, whereas Salisu and Vo (2020) reinforced that considering health reports over illnesses boosts stock return foresight. Baek et al. (2020) advised a negativity tendency since adverse announcements concerning the number of fatalities are twice as impactful as optimistic facts with respect to recoveries. Wu et al. (2021) argued that media can stimulate the forecast of oil cost and usage over the COVID-19 contagion. Atri et al. (2021) noticed that the number of casualties and the COVID-19 panic adversely impact petroleum value, but the COVID-19 media coverage positively influences fuel cost in the short run.
Further studies were exploring safe-haven assets throughout ongoing health crises. Huang et al. (2021) suggested that Bitcoin can promote efficient diversification and risk alleviation, whereas Mariana et al. (2021) strengthened that Ethereum is a superior safe-haven than Bitcoin. Similarly, Disli et al. (2021) advised that gold, oil, and Bitcoin offer diversification benefits at extended investment perspectives. Ji et al. (2020) underlined that gold and soybean futures may uphold the worth of an investment. Contrariwise, Będowska-Sójka and Kliber (2021) claimed that cryptocurrencies rarely performed as weak safe-haven assets during several market disorders, whilst Conlon and McGee (2020) argued that Bitcoin does not behave as a safe haven over the bear market stemming from the coronavirus disease. For financial markets of Africa, Omane-Adjepong and Alagidede (2021) concluded that the safe-haven potential of precious metals, particularly gold, has diminished. In the same vein, Umar et al. (2021) contradicted the safe-haven feature of precious metals over the coronavirus plague, apart from silver. For the case of Chinese portfolios, Pho et al. (2021) found that Bitcoin is appropriate to risk-prone investors, whereas gold is adequate to prudent investors.
A summary of prior literature exploring equity market volatility due to the coronavirus pandemic is exhibited in Table 1.
3. Data and Methodology
3.1. Sample Selection
For our study, we selected the most traded companies on the Bucharest Stock Exchange (BSE)—ALR, BRD, BVB, COTE, EL, FP, SNG, SNP, TEL, TLV, TRP and WINE—for the period January 2020–April 2021. To capture the types of causality between the variables regarding COVID-19 and the Romanian stock exchange, we decided to select the latest number of cases of COVID-19 registered in the USA, Italy, and Romania. The selected measures are presented in Table 2.
The data consist of daily observations. For the variables regarding the Romanian financial market, the data source was Thomson Reuters Datastream, whereas for the variables regarding the COVID-19 pandemic, the data source was Our World in Data.
The formula for daily yields is in line with Banerjee (2021); Bora and Basistha (2021); Curto and Serrasqueiro (2021); Duttilo et al. (2021); Fakhfekh et al. (2021); Ftiti et al. (2021); Ghorbel and Jeribi (2021); Höhler and Lansink (2021); Hong et al. (2021); Hongsakulvasu et al. (2020); Le and Tran (2021); Orhun (2021); Tian and Ji (2021); Yousfi et al. (2021); Yu et al. (2021); Zoungrana et al. (2021):
where is the yield of the index/asset i in period l, is the asset price/stock market index value i in period l and is the price of the asset/stock market index value in the l-1 period. Logarithmic yields were used because they are expected to have a normal distribution.
3.2. Quantitative Methods
To explore the selected financial time series, we will employ ARCH/GARCH models as in prior studies (Salisu and Ogbonna 2021; Abuzayed et al. 2021; Bai et al. 2021; Banerjee 2021; Bora and Basistha 2021; Curto and Serrasqueiro 2021; Czech et al. 2020; Duttilo et al. 2021; Fakhfekh et al. 2021; Farid et al. 2021; Ghorbel and Jeribi 2021; Harjoto and Rossi 2021; Haroon and Rizvi 2020; Hongsakulvasu et al. 2020; Insaidoo et al. 2021; Le and Tran 2021; Liu et al. 2021b; Malik et al. 2021; Mariana et al. 2021; Omane-Adjepong and Alagidede 2021; Szczygielski et al. 2021a, 2021b; Uddin et al. 2021; Vera-Valdés 2021; Xu 2021; Yousaf 2021; Yousfi et al. 2021; Yu et al. 2021; Zhang and Hamori 2021; Zoungrana et al. 2021). These models simultaneously evaluate and test processes of yields and volatility processes.
ARCH models were introduced by Engle (1982) and Generalized (GARCH) by Bollerslev (1986). A GARCH model allows conditional variation to be dependent on its previous lags. GARCH models transform the AR process from the ARCH model into an ARMA process by adding an MA process. The GARCH model (p, q) has the following form:
where > 0 and ≥ 0.
From Equations (2) and (3), it can be seen that the conditioned variance of random perturbations depends both on the historical values of the shocks and on the values of the variance in the past. The coefficients of represent persistence of volatility, whereas the coefficients of signify the rate of reaction of volatility to shocks in the financial market. Parameter p is the order of the terms GARCH and q is the order of the ARCH terms.
According to Baybogan (2013), the core issue with an ARCH specification is that it involves a substantial number of lags to seize the type of the volatility, whereas the GARCH framework is generally much more parsimonious for the reason that it integrates much of the evidence that a larger ARCH model with considerable lags would cover.
In order to analyze the causality between the BET index and the number of new COVID-19 cases, we will estimate in the first instance three vector autoregression (VAR) models, much like those found in Anser et al. (2021), Chen et al. (2021), Chowdhury et al. (2021), and Youssef et al. (2021), incorporating the stock market index and each COVID-19 pandemic measure, as described below:
where and are the intercepts, β, γ, ψ, and φ are the endogenous variables coefficients, whereas u are the residual terms.
Further, for each estimated VAR model, we will employ the Granger causality test, as in earlier literature (Bourghelle et al. 2021; Chen et al. 2021; Liu et al. 2021b). So as to perform the causality test, the data series must be stationary and zero average (Granger 1969). The null hypothesis is that b does not cause Granger on c and that c does not cause Granger on b. The following bivariate regressions are given:
Thus, a first step in the present study is the examination of the stationarity of the selected variables, which is an important stage in any econometric study. This will be verified by the ADF test, much like Bai et al. (2021) and Chen et al. (2021). Next, we intend to model BSE volatility through the GARCH model and identify the types of causality that are established between BSE and COVID-19 variables through the Granger causality test after VAR estimation.
The research hypotheses are formulated as follows:
Hypothesis 1 (H1).
The COVID-19 pandemic negatively influences the return of the Bucharest Exchange Trading Index.
Hypothesis 2 (H2).
The COVID-19 pandemic adversely impacts the return of the companies traded on the Bucharest Stock Exchange.
4. Empirical Results
4.1. Preliminary Statistics
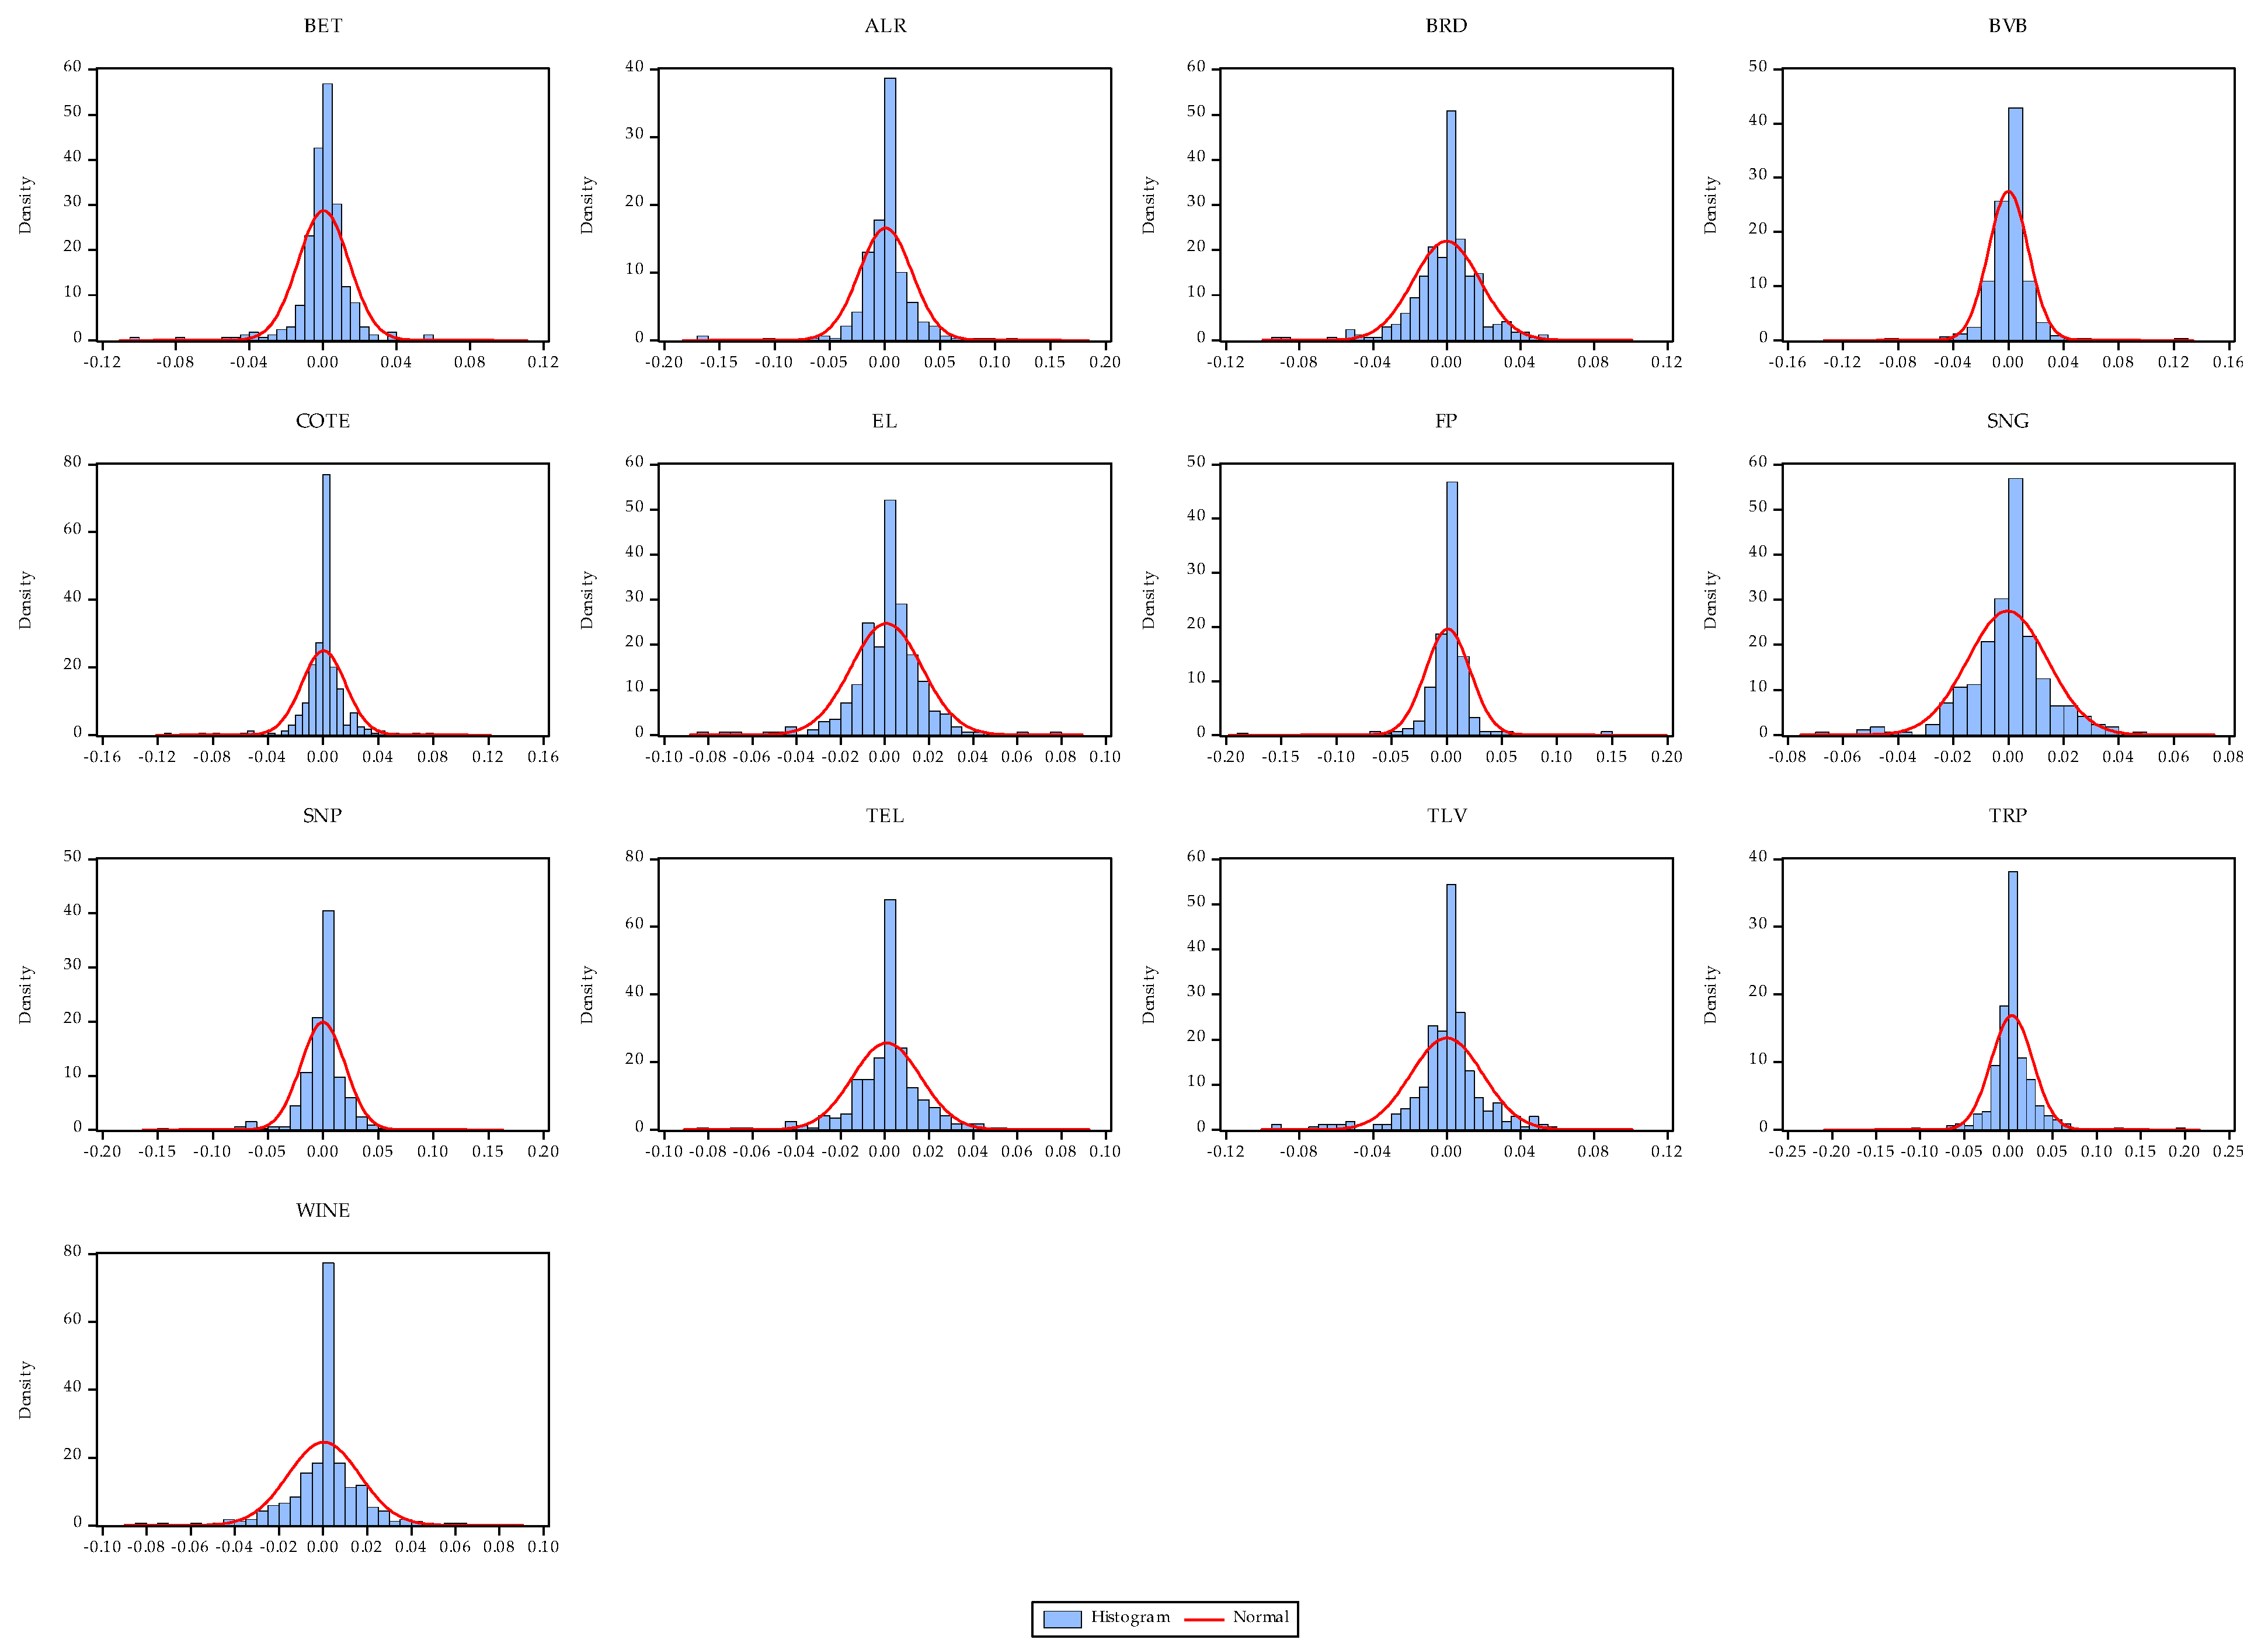
Table 3 shows descriptive statistics for the daily logarithmic returns of the shares traded on BSE, as well as for the BET stock market index, whereas Figure 1 reveals the density graphs. The selected shares have a negative skewness (except for the TRP share) in line with Agarwalla et al. (2021), Banerjee (2021), Malik et al. (2021),Yousaf (2021), and Zhang and Hamori (2021). As a common condition of financial markets, skewness is negative, suggesting an asymmetry to the left.
The Kurtosis indicator measures the magnitude of the extreme values. Accordingly, in the current investigation, all the explored variables register a value of kurtosis greater than three. This fact indicates that the return series has fatter tails than the normal distribution, similar to Banerjee (2021), Bourghelle et al. (2021), Fakhfekh et al. (2021), Ftiti et al. (2021), Malik et al. (2021), Yu et al. (2021), and Zhang and Hamori (2021). This feature is referred to as leptokurtosis, which could be caused by volatility clustering.
Additionally, through the Jarque–Bera test, we can decide the distribution of variables. Consistent with the empirical results presented in Table 2, the probability accompanying the test is 0%. Hence, the test values are quite different from those of the normal distribution, proving that the series are not normally distributed, much like Curto and Serrasqueiro (2021), Liu et al. (2021a), Malik et al. (2021), Yousfi et al. (2021), and Zhang and Hamori (2021).
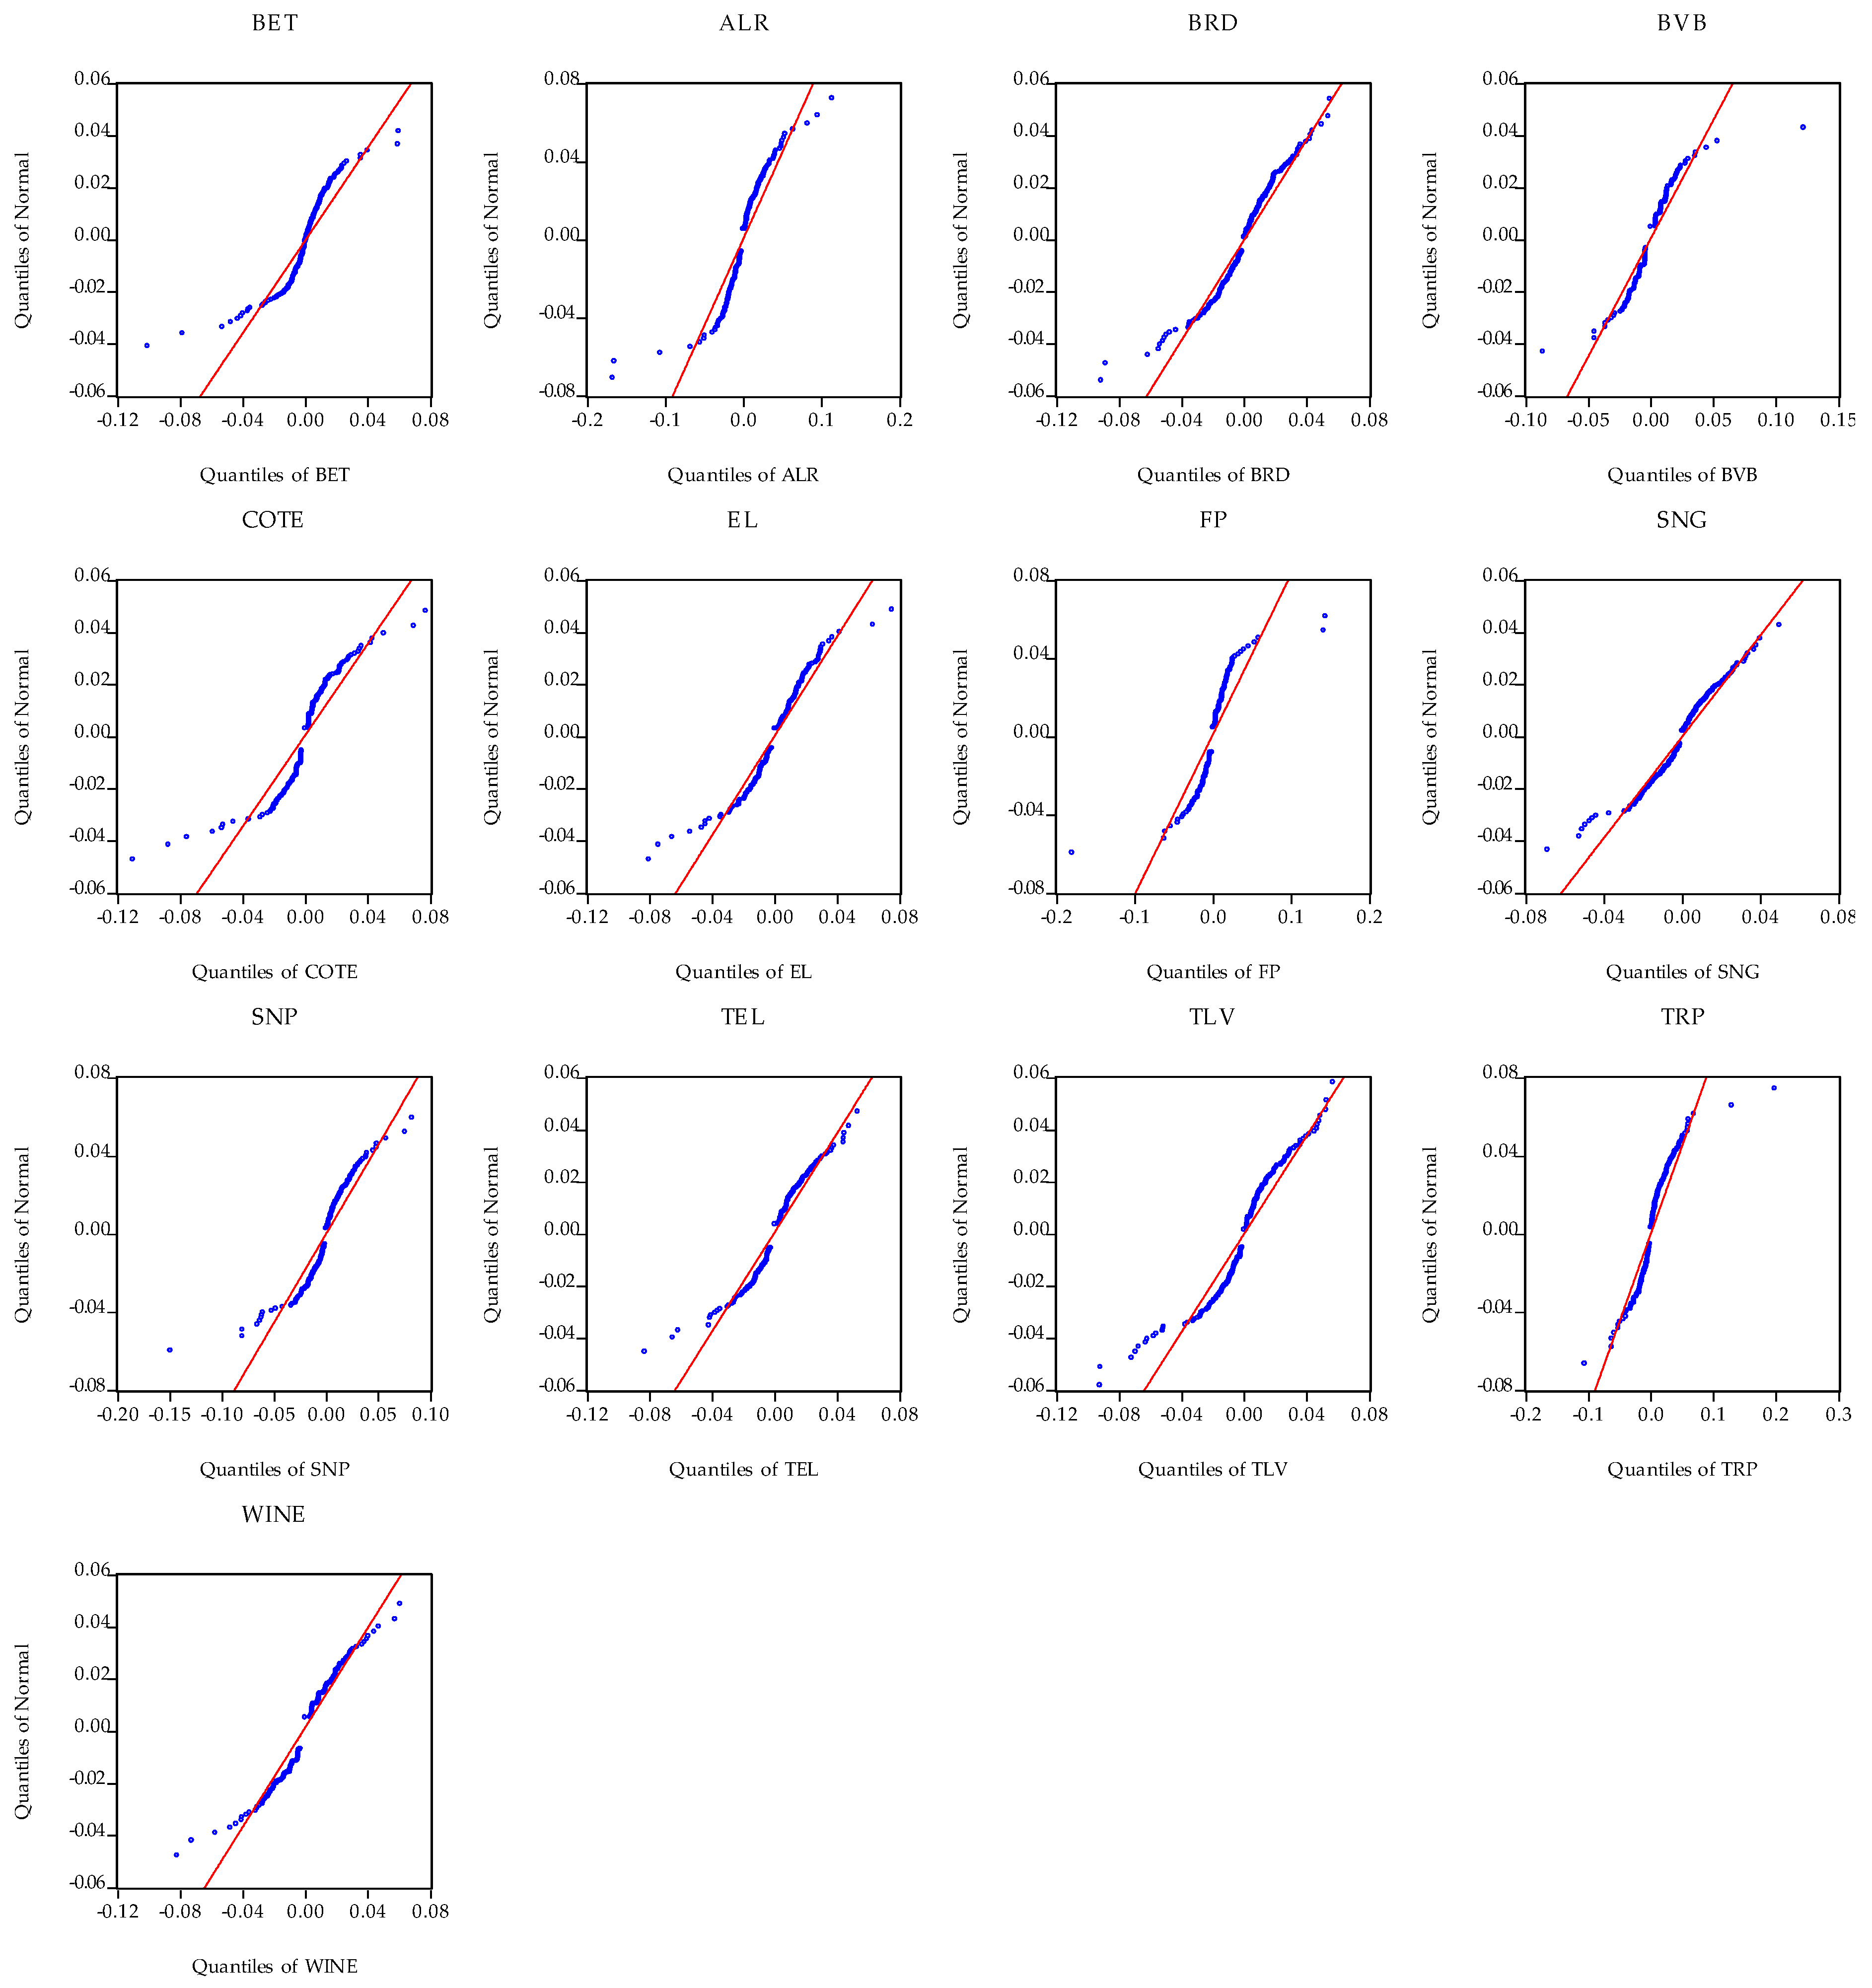
Figure 2 shows the Q–Q (quantile–quantile) plots. The quantiles–quantiles graph is a straightforward method used to compare two distributions. Therewith, it signifies the graph of an empirical distribution versus a theoretical distribution (normal distribution). If the empirical distribution is normal, the subsequent Q–Q graph should be the first bisector. However, in current investigation, the distribution is very different from the normal one.
The density graph (see Figure 1) and Q–Q plot (see Figure 2) against the normal distribution show that the returns distribution also exhibits fat tails confirming the results in Table 2.
Further, we studied the stationarity of stocks and the stock market index using the ADF (Augmented Dickey–Fuller) test, much like Abuzayed et al. (2021), Atri et al. (2021), Banerjee (2021), Bora and Basistha (2021), Insaidoo et al. (2021), Li (2021), Yousaf (2021), Yousfi et al. (2021), and Zhang and Hamori (2021). ADF test is a very common method of assessing stationarity. The null hypothesis of the test is that the analyzed data series is not stationary and has a root unit. The outcomes of ADF test are revealed in Table 4.
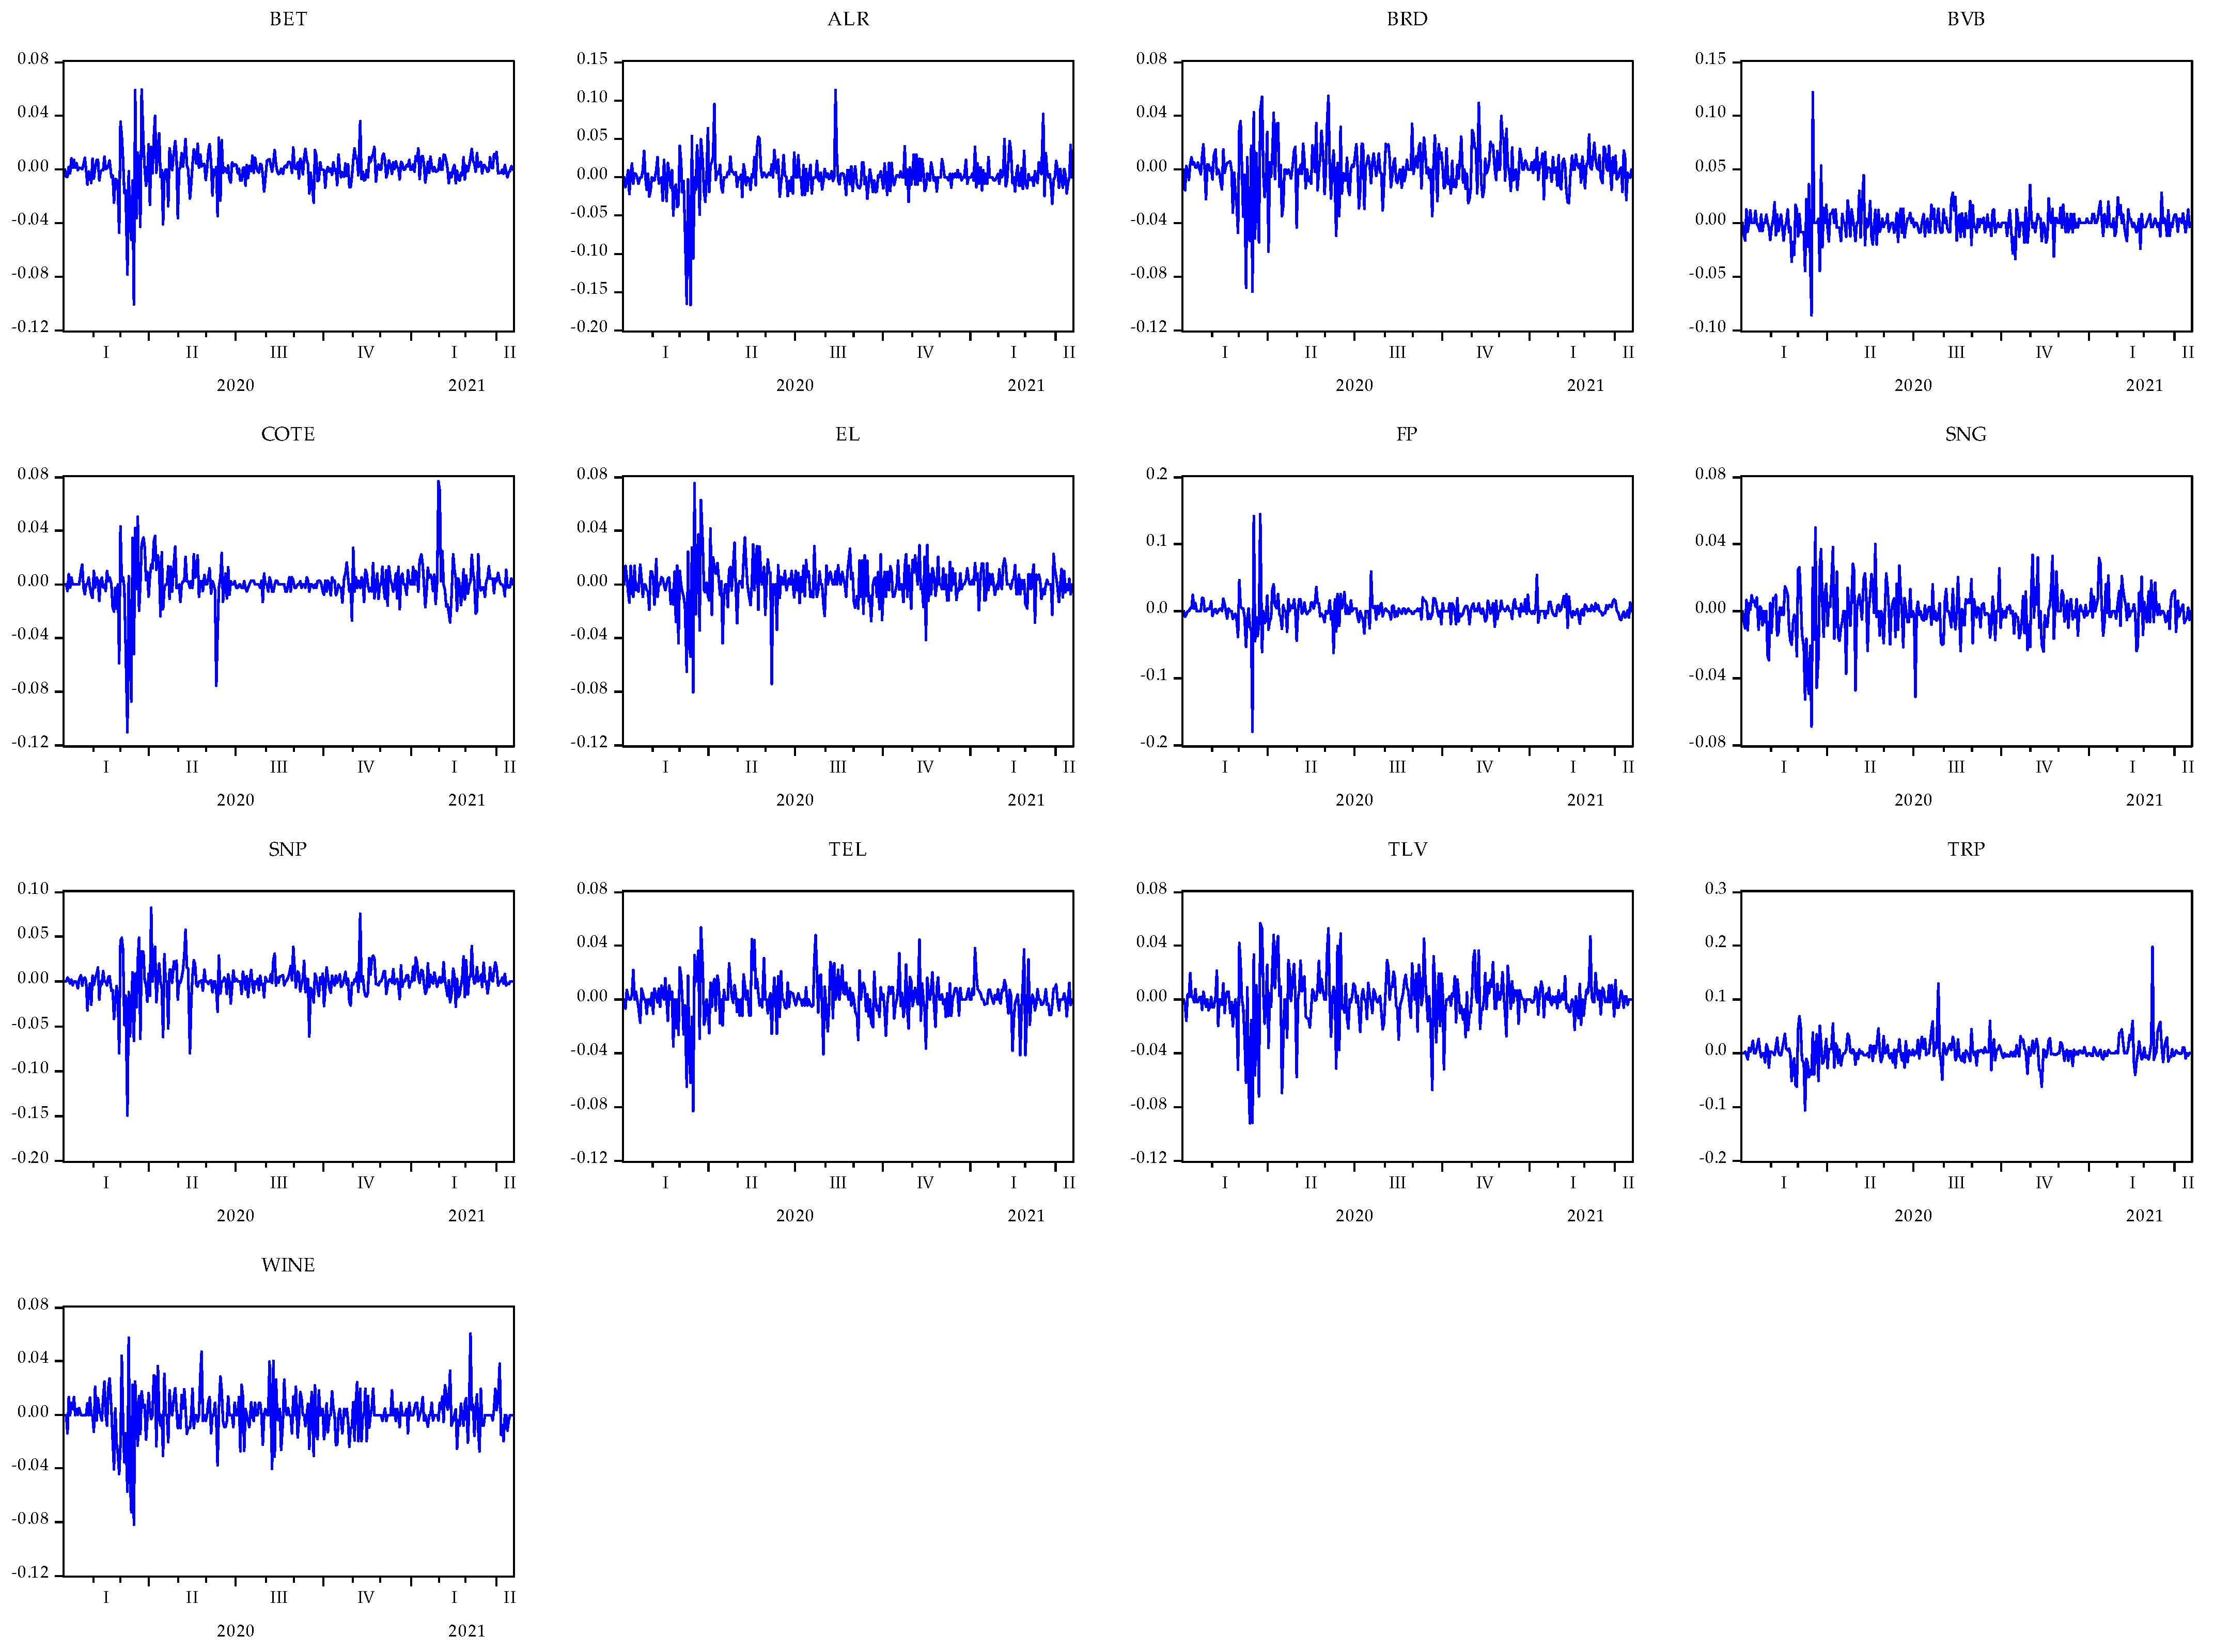
According to the results presented by the ADF stationarity test in Table 4, the null hypothesis of a unit root can be rejected, indicating that the daily logarithmic returns are significant at the 1% level, hence stationary, similar to Bai et al. (2021) and Yu et al. (2021). Thus, taking into account the empirical results of the ADF stationarity test, the examined variables are stationary and have an integration order I (0). Likewise, the stationarity of the series can be seen in Figure 3, where the daily yields of the analyzed series are represented.
Figure 3 shows the evolution of the selected returns. Hence, there is acknowledged a phenomenon of “volatility clustering” and an alternation between periods of low volatility and those with high volatility, similar to Abuzayed et al. (2021), Insaidoo et al. (2021), Malik et al. (2021), and Yousfi et al. (2021). Moreover, “volatility clustering” implies a strong autocorrelation of returns.
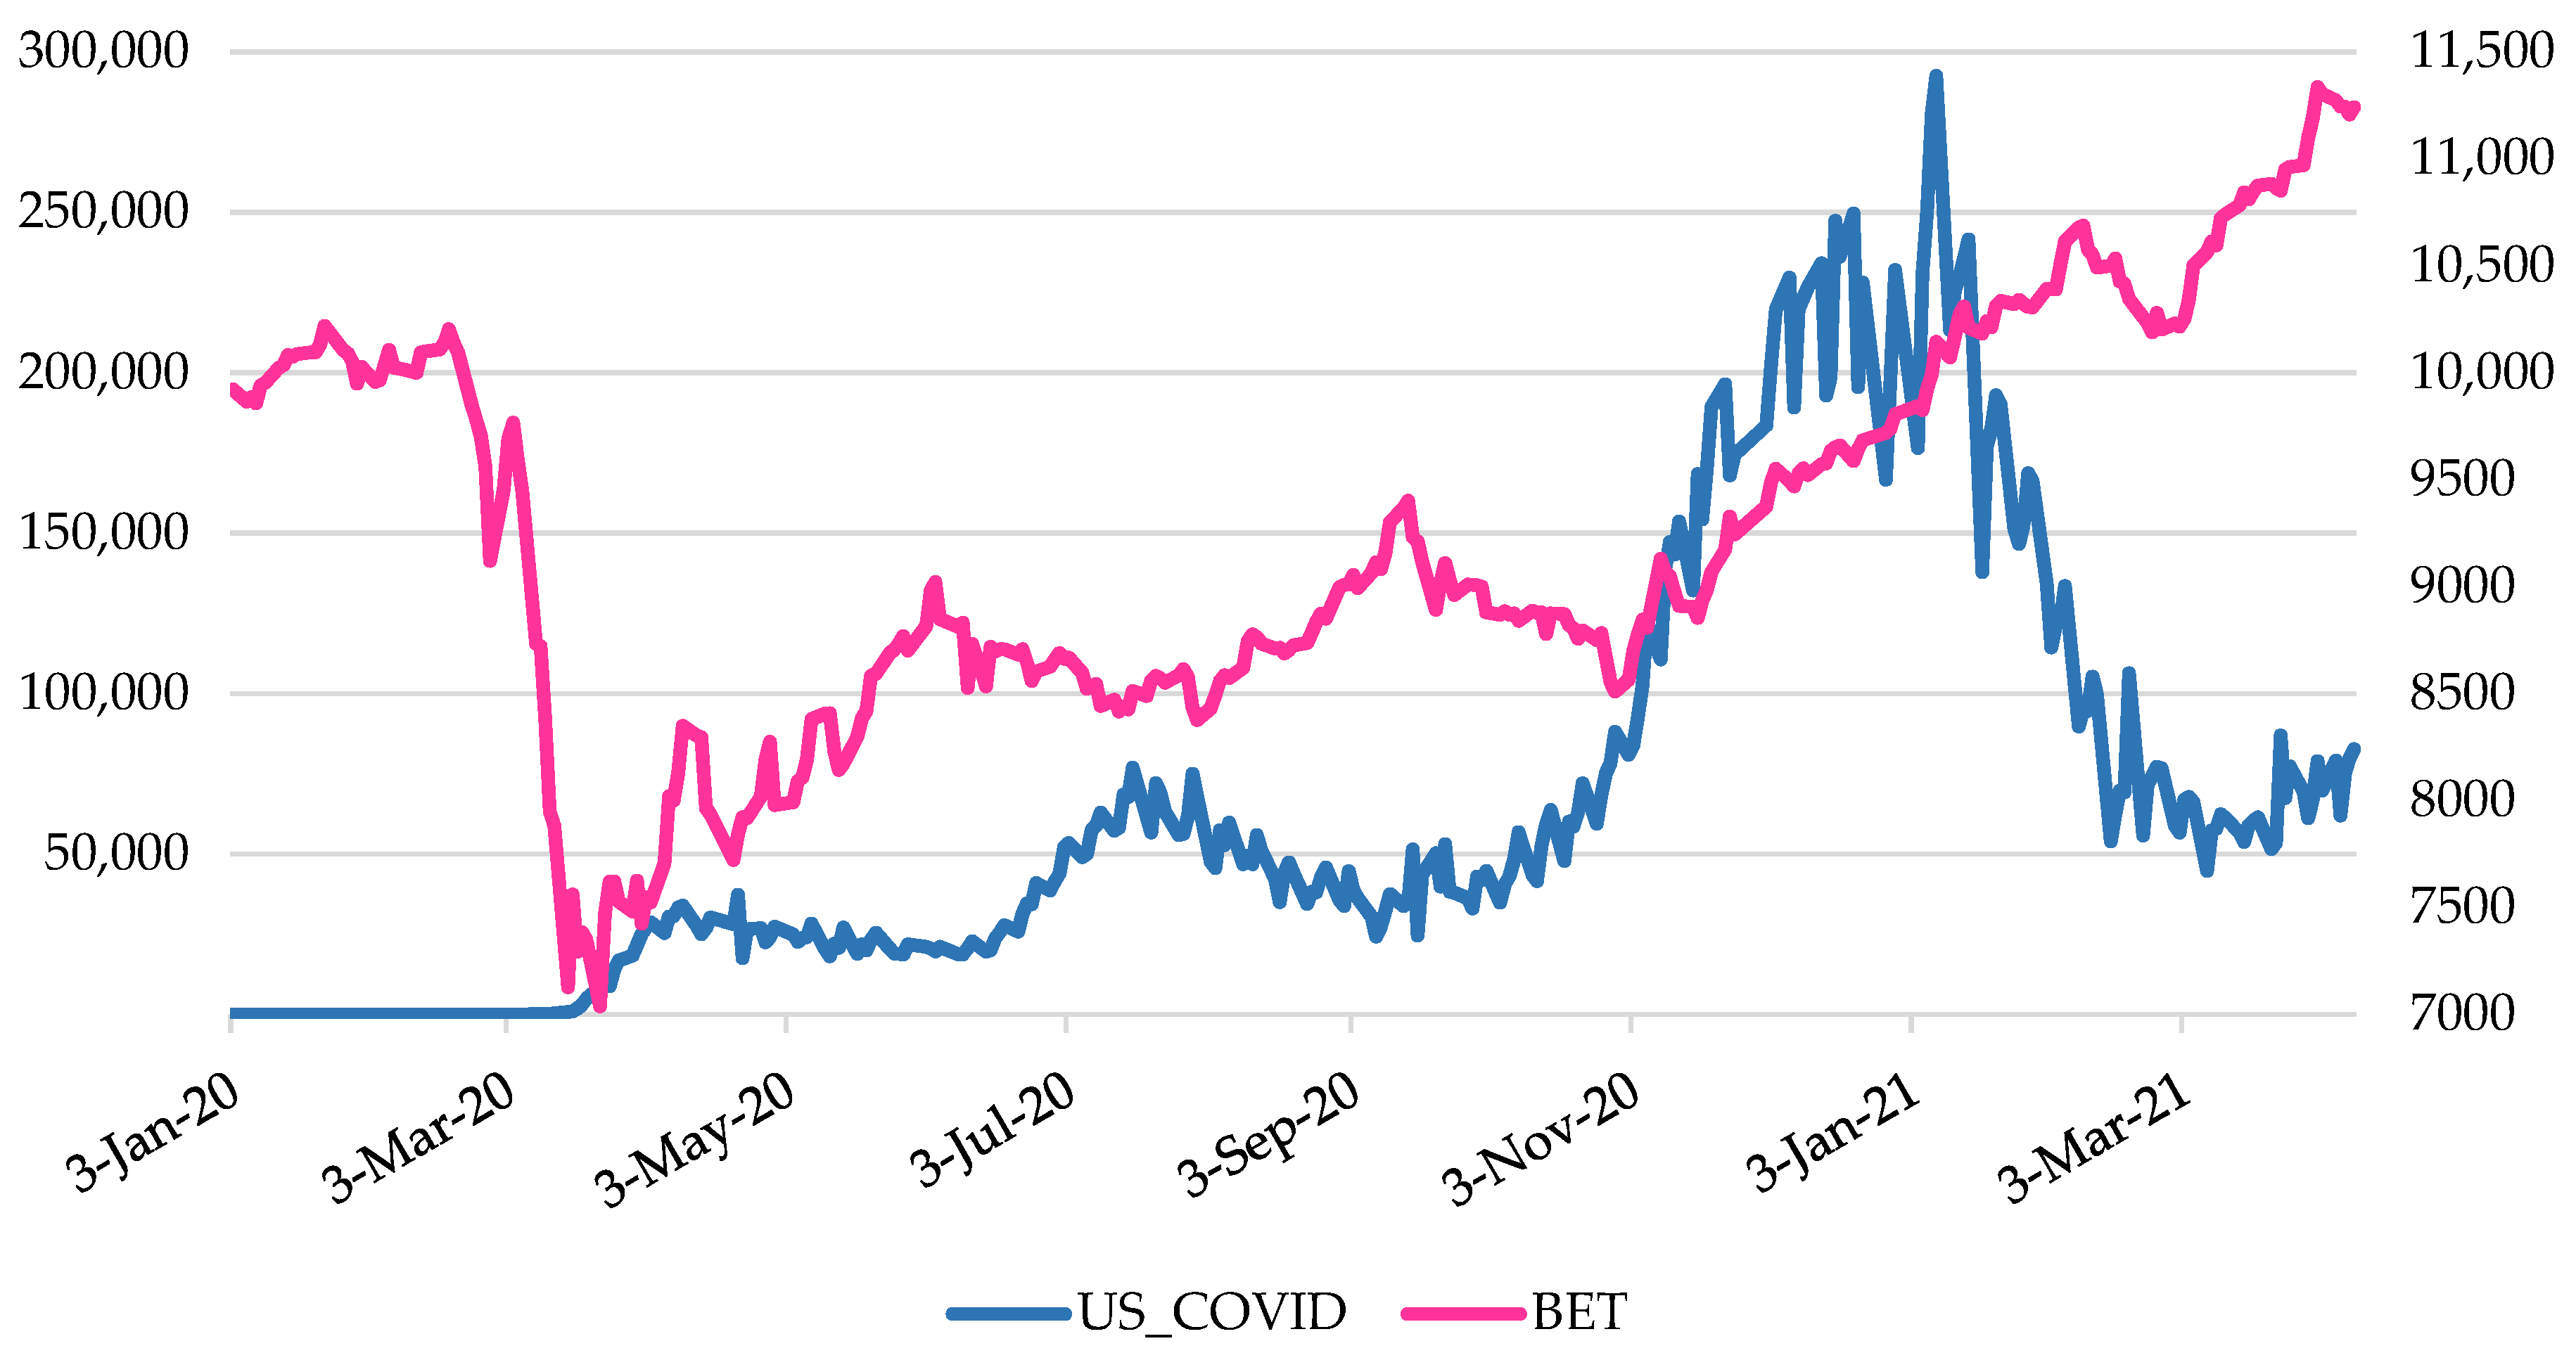
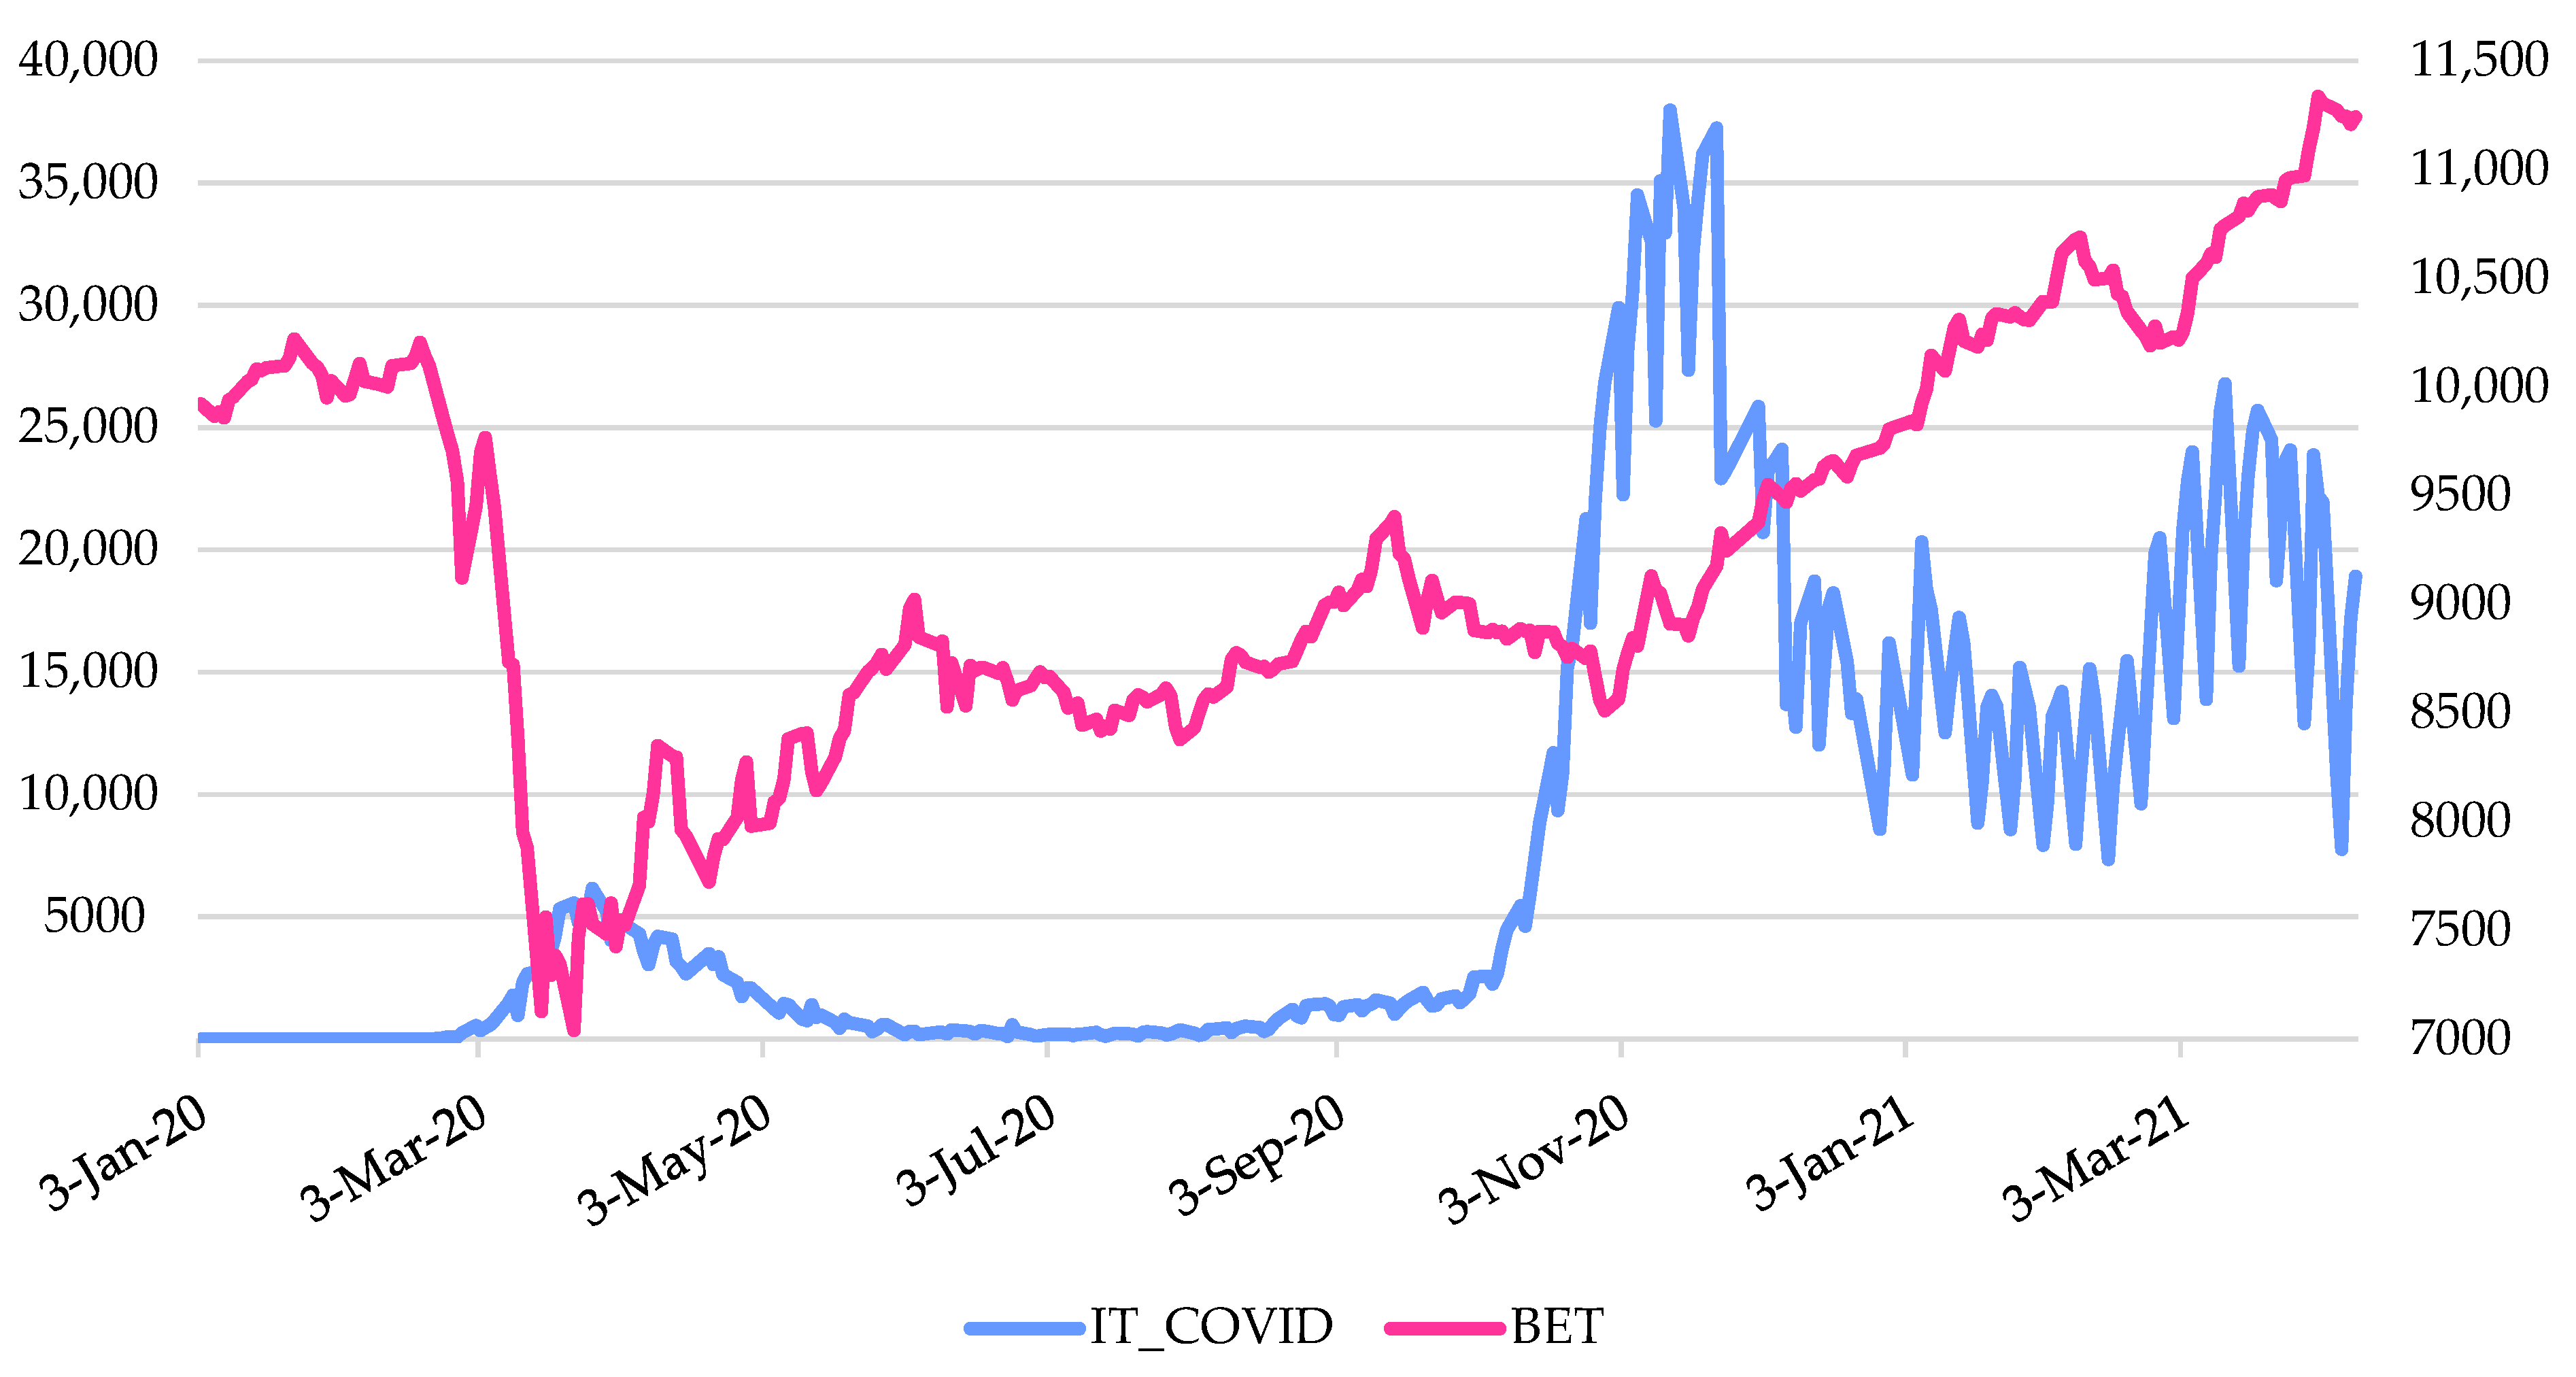
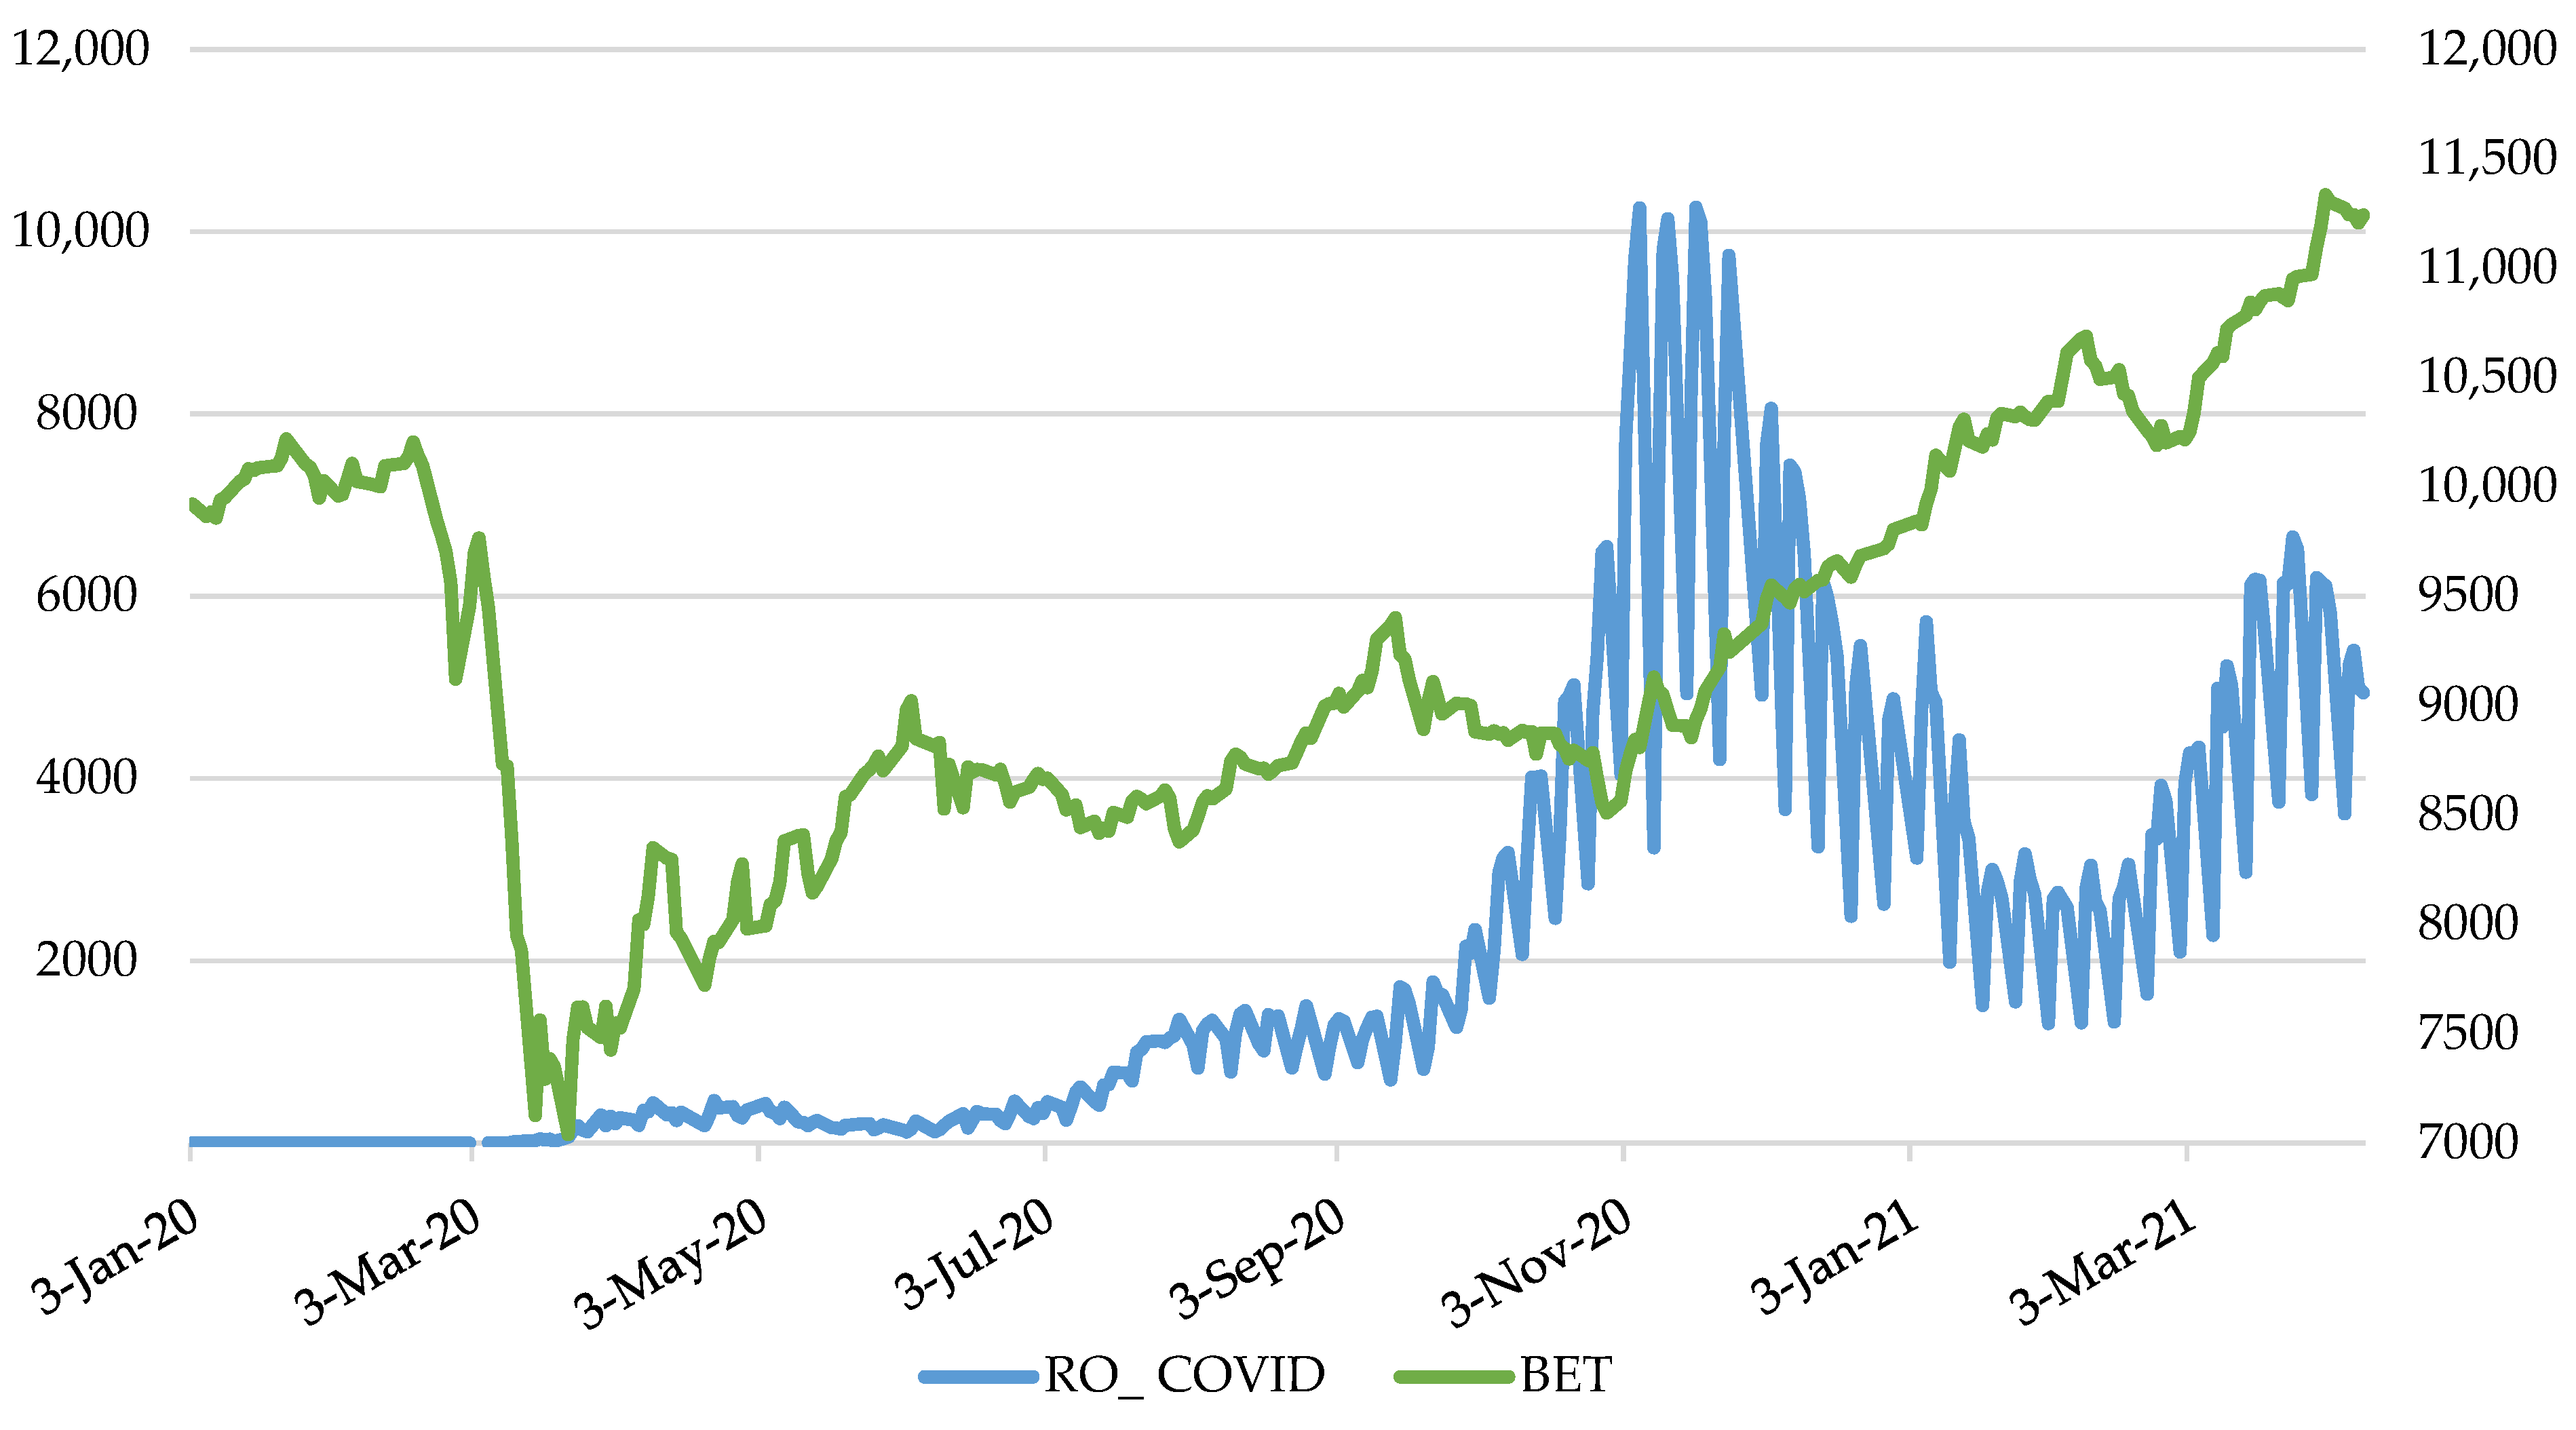
Figure 4, Figure 5 and Figure 6 reveal the evolution of the BET index against the new cases of COVID-19. The relationship between the evolution of the BET index and the number of new SARS-CoV-2 cases (USA, Italy, and Romania) is an indirect one. Thus, the increase in the number of infections (USA, Italy, and Romania) determined a decrease in the local stock market index and its return.
4.2. GARCH Outcomes
Before applying GARCH models, it is advisable to perform preliminary tests to detect the effects of ARCH. Heteroskedasticity was investigated by determining autocorrelation (AC), partial autocorrelation (PAC), and Q test. The number of offsets used for all the time series was 20. The outcomes of AC, PAC and Q-Stat are revealed in Table 5.
According to the results of the Q test, in most of the cases, the existence of the serial correlation, heteroscedasticity (p-value less than 5%), is confirmed. However, in the case of TRP, the probability is greater than 5% and the null hypothesis of the absence of the serial correlation up to lag 20 cannot be rejected. Therefore, the data series shows heteroscedasticity that can be modelled by GARCH models (except TRP, because heteroskedasticity is a pre-condition for applying GARCH models for financial time series, where we may not be able to match GARCH models).
Table 6 shows the outcomes of GARCH approach. The model used was GARCH (1,1), restriction-Variance target, error distribution: Student’s t being selected to register among the smallest AICs among the other available variants, similar to Czech et al. (2020) and Xu (2021). Only valid models, whose coefficients are statistically significant and different from 0, have been selected.
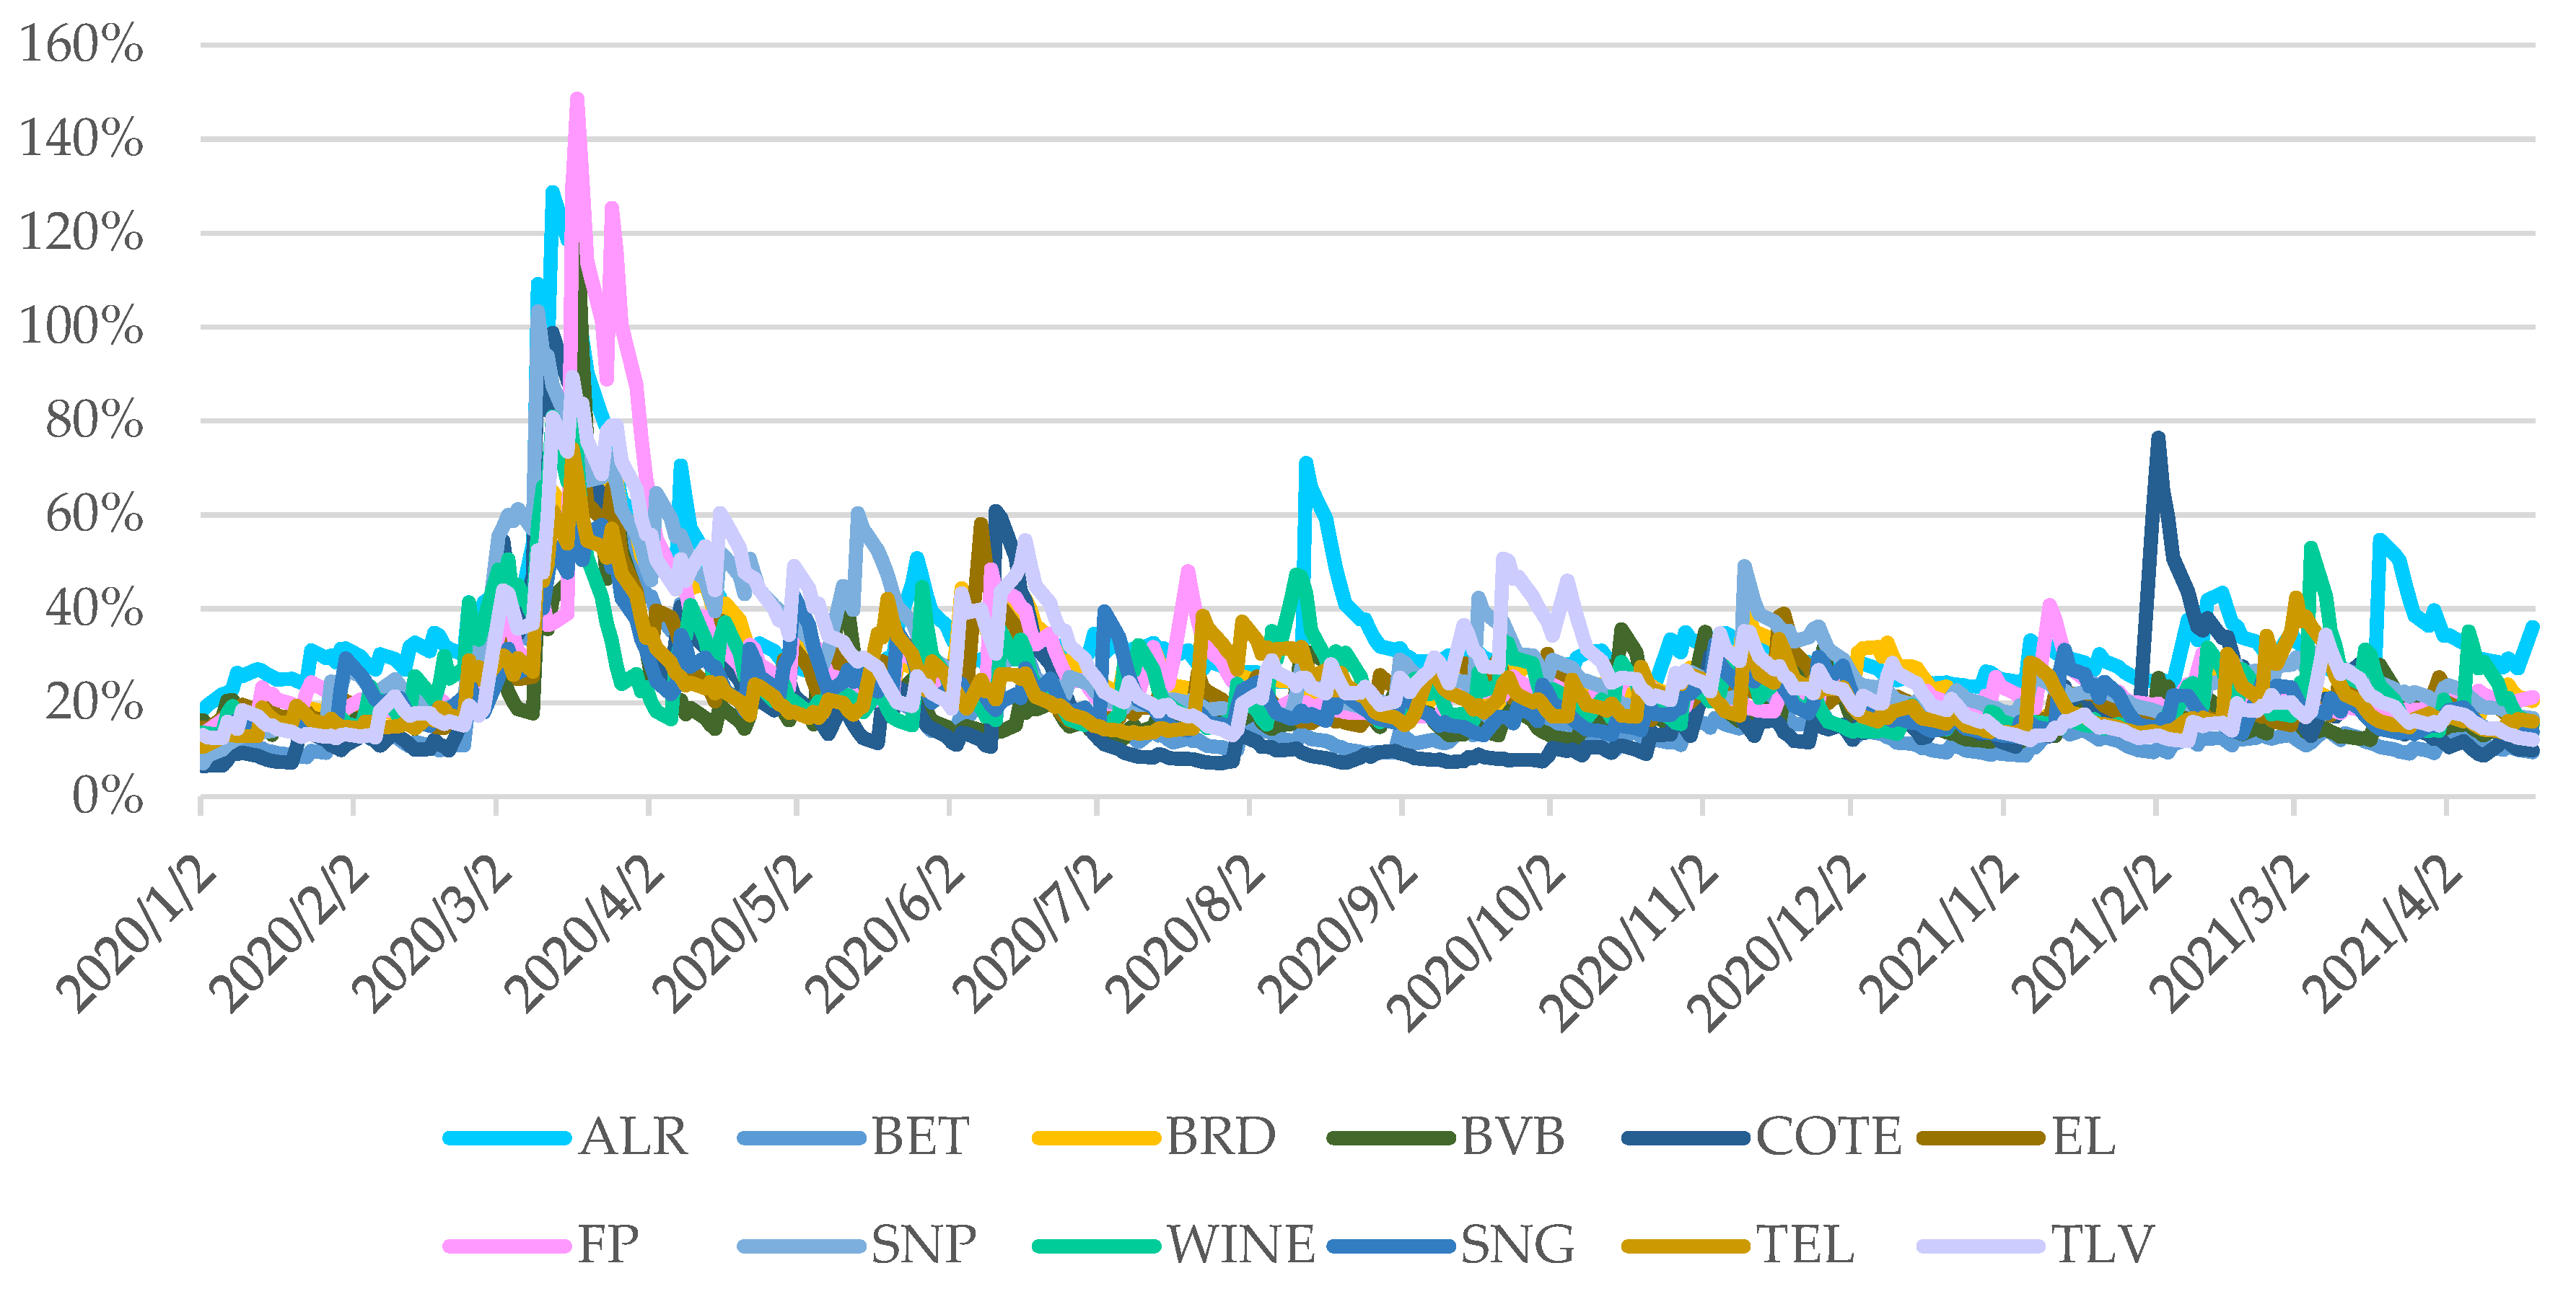
Following the application of a GARCH model (1,1), we estimated the conditioned volatilities which are plotted in Figure 7.
We notice that in the first quarter of 2020, the volatility of the Romanian capital market increased to a level very close to that recorded during the global financial crisis of 2007–2009. Similarly, Curto and Serrasqueiro (2021) noticed an intensification of volatility following February 2020. Hence, this outcome is in line with both of the proposed hypotheses H1 and H2. Our results are consistent with Czech et al. (2020), which noted that Visegrad Group member countries were hit by the COVID-19 disease at the outset of March 2020 when the first case was registered.
Besides, in the next two quarters, volatility had a downward trend, argued by the fact that COVID-19 vaccine findings were declared (Yu et al. 2021). In the same vein, Rouatbi et al. (2021) reinforced that the launch and expansion of the vaccinations reduce stock market volatility.
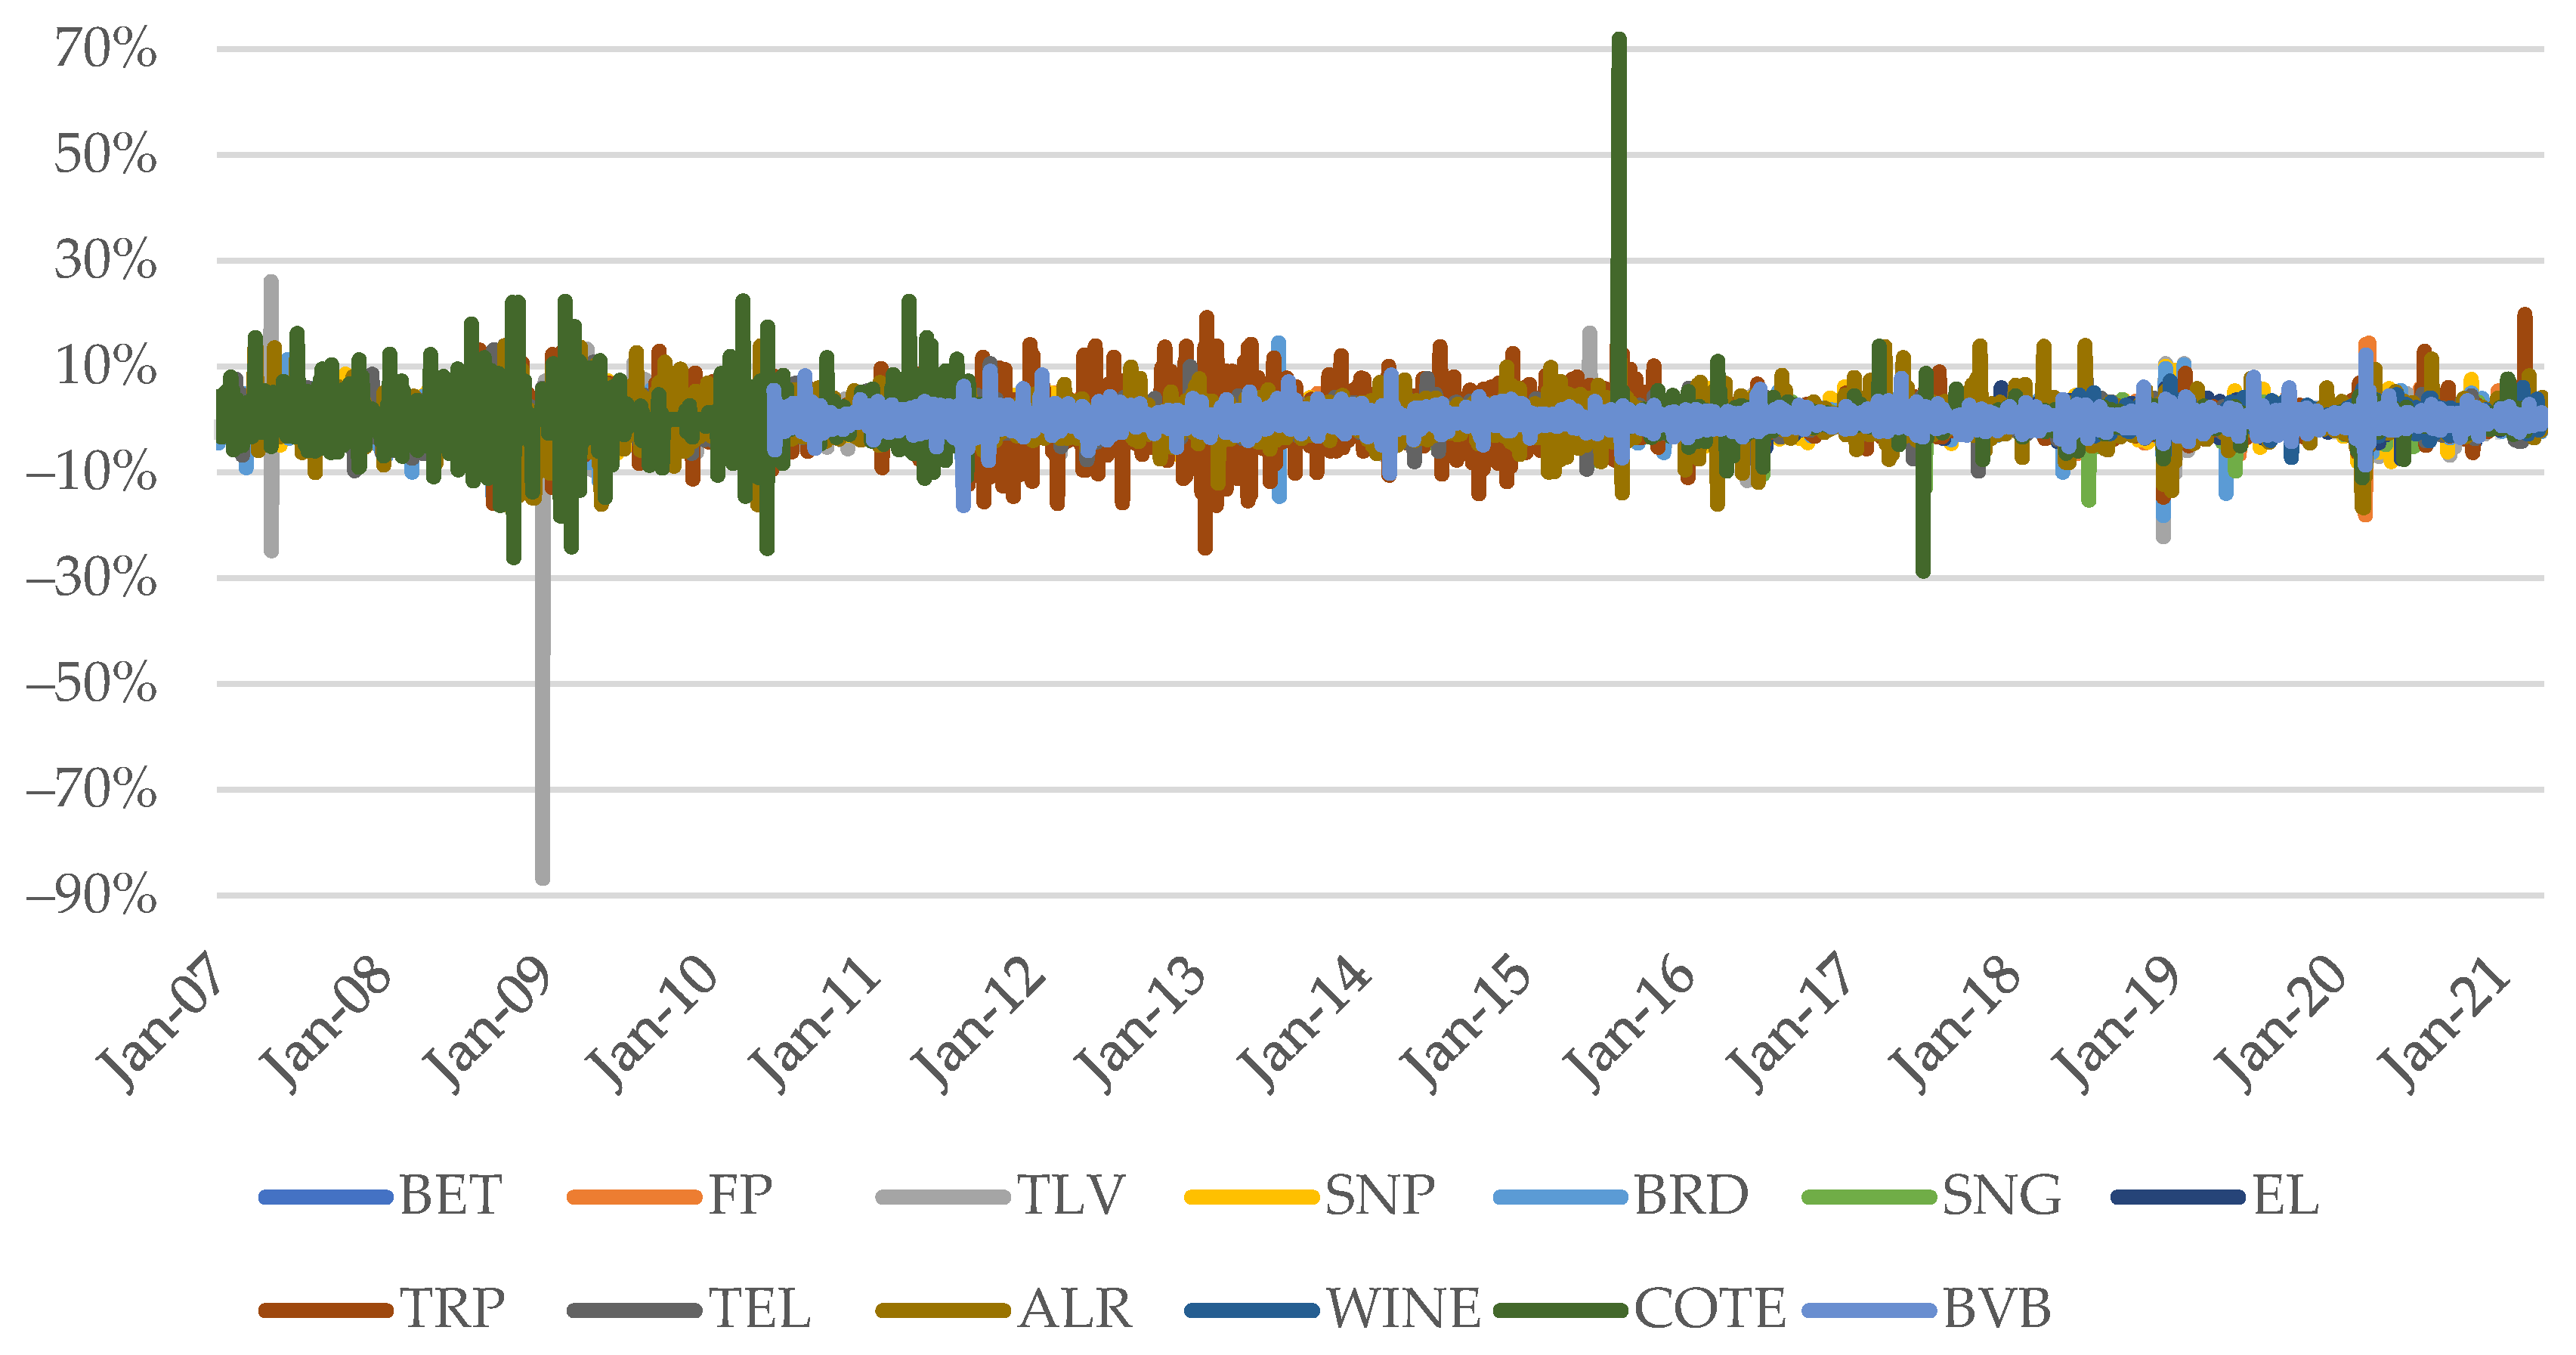
Further, Figure 8 exhibits the daily evolution of selected shares’ yields and the BET index for the period 2007–2021 in order to highlight the fact that the volatility in the period 2007–2009 was much more significant than that during the COVID-19 pandemic. This fact supports Le and Tran (2021), which pointed out for the case of Vietnam that the contagion effect throughout the coronavirus period was lesser than that over the global financial crisis.
Thus, the first two quarters of 2020 were marked by an increase in volatility on international financial markets, more pronounced in March and April, and the companies FP, ALR, SNP, and BVB had the highest volatilities during this period. August, September, and October show moderate volatility, being higher than before the outbreak of the COVID-19 pandemic.
4.3. Causality Analysis
Given that the health crisis has a significant impact on the global economy, we also aimed to explore the causal relationships that are established between the variables regarding COVID-19 and the BET stock market index. Primarily, it was checked if the stock market index and each COVID-19 pandemic measure were cointegrated. In this regard, Table 7 exhibits the outcomes of the Phillips–Ouliaris cointegration test. Accordingly, we reject the null hypothesis and decide that the series are cointegrated.
Further, the lag selection criterion is explored. Table 8 reveals the related lag order selection criteria. Hence, the Schwarz information criterion suggests five and seven lags.
After estimating the VAR model for the stock market index and each COVID-19 variable (see Table A1, Table A2 and Table A3), we proceed to explore the Granger causality relationships. According to Freeman (1983), a variable, X, which evolves over time, causes another variable in evolution, Y, if the predictions of the value Y based on its own past values and on the previous values of X are better than the predictions of Y based only on Y’s own past values. Table 9 shows the empirical results of the Granger causality test after VAR estimation.
Thus, for the analyzed period January 2020–April 2021, no causal relationship was identified between the COVID-19 variables and the BET index. This outcome is not consistent with Liu et al. (2021b), who found that fear sentiment causes stock market crash risk. Therefore, Yu et al. (2021) cannot be maintained either since it was found that the COVID-19 Anxiety Index causes stock market returns.
5. Concluding Remarks
The COVID-19 virus has spread very rapidly around the globe, negatively impacting the economy, and according to the latest information, it undergoes various mutations, with new variants of COVID-19 always appearing. The study of volatility has always been a hotly debated topic by experts, especially now in these times of uncertainty. The impact of COVID-19 on the capital markets did not take long to appear, so it initially manifested itself on the largest stock markets in the world, then, due to the contagion effect, it was transmitted to the other smaller markets. To our knowledge, the studies conducted on the Romanian capital market related to the research of volatility during the pandemic are extremely limited, which led us to focus on analyzing the volatility of the BSE indices.
Our main goal of the article was to analyze the BSE volatilities during the COVID-19 pandemic, selecting indices and a group of traded shares (these being among the most traded on BSE, which are also found in the BET stock index). To study volatility, we used the GARCH model (1,1), and the graphical outputs capture the episodes of volatility. Finally, through the Granger causality test, after VAR estimation, we were able to identify the relationships to be established between BSE stock index, respectively, the shares traded on BSE and variables that capture the evolution of the COVID-19 pandemic in the USA, Italy, and Romania.
This research contributes to the existing literature, which is the reason that we studied the volatility of the main companies traded on the Bucharest Stock Exchange, between January 2020 and April 2021, a period subject to a major change due to the COVID-19 pandemic, using GARCH models. We found that the distribution of the daily return series for the Romanian stock market is leptokurtic, it is not normally distributed, and has significant time dependencies. The GARCH (1,1) model was used to model volatility on the Romanian stock market.
The study revealed strong evidence of volatility that lasts over time, a trend of high and low volatility periods, and a high persistence of volatility on the Bucharest Stock Exchange. In the first quarter of 2020, capital market volatility in Romania increased to a level very close to that recorded during the global financial crisis of 2007–2009. In the next two quarters, volatility had a downward trend. Nevertheless, no causal association was noticed between the COVID-19 variables and the BET index.
The empirical outcomes could help investors and asset managers to adjust their trading strategies. Moreover, the government should consider economic relief packages and formulate policies to lessen severe falls in prices (Hashmi et al. 2021).
Author Contributions
Conceptualization, Ș.C.G., D.Ș.A. and C.C.J.; methodology, Ș.C.G., D.Ș.A. and C.C.J.; software, Ș.C.G., D.Ș.A. and C.C.J.; validation, Ș.C.G., D.Ș.A. and C.C.J.; formal analysis, Ș.C.G., D.Ș.A. and C.C.J.; investigation, Ș.C.G., D.Ș.A. and C.C.J.; resources, Ș.C.G., D.Ș.A. and C.C.J.; data curation, Ș.C.G., D.Ș.A. and C.C.J.; writing—original draft preparation, Ș.C.G., D.Ș.A. and C.C.J.; writing—review and editing, Ș.C.G., D.Ș.A. and C.C.J.; visualization, Ș.C.G., D.Ș.A. and C.C.J.; supervision, Ș.C.G., D.Ș.A. and C.C.J.; project administration, Ș.C.G., D.Ș.A. and C.C.J.; funding acquisition, Ș.C.G., D.Ș.A. and C.C.J. All authors have read and agreed to the published version of the manuscript.
Funding
This research received no external funding.
Institutional Review Board Statement
Not applicable.
Informed Consent Statement
Not applicable.
Data Availability Statement
Not applicable.
Conflicts of Interest
The authors declare no conflict of interest.
Appendix A

Table A1.
Vector autoregression estimates for stock market index and the number of new cases of COVID-19 in Romania.
Table A1.
Vector autoregression estimates for stock market index and the number of new cases of COVID-19 in Romania.
| RBET | DRO_COVID | |
|---|---|---|
| RBET(−1) | −0.039042 | −1347.071 |
| −0.05944 | −3387.07 | |
| [−0.65686] | [−0.39771] | |
| RBET(−2) | 0.104624 | −2907.972 |
| −0.05457 | −3109.71 | |
| [1.91723] | [−0.93513] | |
| RBET(−3) | −0.008179 | −1776.737 |
| −0.05343 | −3044.46 | |
| [−0.15309] | [−0.58360] | |
| RBET(−4) | −0.017674 | −1706.189 |
| −0.05245 | −2988.76 | |
| [−0.33699] | [−0.57087] | |
| RBET(−5) | 0.099649 | −3998.206 |
| −0.05212 | −2970.19 | |
| [1.91184] | [−1.34611] | |
| RBET(−6) | −0.195458 | −2384.377 |
| −0.05129 | −2922.5 | |
| [−3.81120] | [−0.81587] | |
| RBET(−7) | −0.012525 | 1802.935 |
| −0.05213 | −2970.85 | |
| [−0.24025] | [0.60687] | |
| DRO_COVID(−1) | −8.20 × 10⁻⁷ | −0.57646 |
| −9.40 × 10⁻⁷ | −0.05368 | |
| [−0.87075] | [−10.7389] | |
| DRO_COVID(−2) | 1.33 × 10⁻⁷ | −0.803286 |
| −1.10 × 10⁻⁶ | −0.06107 | |
| [0.12428] | [−13.1529] | |
| DRO_COVID(−3) | 2.53 × 10⁻⁸ | −0.150507 |
| −1.20 × 10⁻⁶ | −0.06772 | |
| [0.02129] | [−2.22260] | |
| DRO_COVID(−4) | 5.87 × 10⁻⁷ | −0.261028 |
| −1.20 × 10⁻⁶ | −0.06638 | |
| [0.50356] | [−3.93240] | |
| DRO_COVID(−5) | −1.44 × 10⁻⁷ | 0.637747 |
| −1.20 × 10⁻⁶ | −0.06798 | |
| [−0.12112] | [9.38180] | |
| DRO_COVID(−6) | 4.04 × 10⁻⁷ | 0.306384 |
| −1.10 × 10⁻⁶ | −0.06128 | |
| [0.37555] | [4.99998] | |
| DRO_COVID(−7) | 3.67 × 10⁻⁷ | 0.4326 |
| −9.50 × 10⁻⁷ | −0.05413 | |
| [0.38643] | [7.99193] | |
| C | 0.001192 | 31.51544 |
| −0.00066 | −37.8873 | |
| [1.79229] | [0.83182] | |
| R-squared | 0.107799 | 0.729229 |
| Adj. R-squared | 0.063661 | 0.715834 |
| Sum sq. resids | 0.034824 | 1.13 × 10⁸ |
| S.E. equation | 0.011093 | 632.1363 |
| F-statistic | 2.442354 | 54.44024 |
| Log likelihood | 926.2818 | −2336.982 |
| Akaike AIC | −6.115985 | 15.78511 |
| Schwarz SC | −5.92989 | 15.97121 |
| Mean dependent | 0.00113 | 16.43289 |
| S.D. dependent | 0.011464 | 1185.836 |
| Determinant resid covariance (dof adj.) | 49.15166 | |
| Determinant resid covariance | 44.32804 | |
| Log likelihood | −1410.638 | |
| Akaike information criterion | 9.668714 | |
| Schwarz criterion | 10.0409 | |
| Number of coefficients | 30 |
Source: Authors’ calculations. Notes: Standard errors in ( ) and t-statistics in [ ]. Sample (adjusted): 15 January 2020–9 April 2021. Included observations: 298 after adjustments. Variables’ descriptions are provided in Table 2.
Table A2.
Vector autoregression estimates for stock market index and the number of new cases of COVID-19 in Italy.
Table A2.
Vector autoregression estimates for stock market index and the number of new cases of COVID-19 in Italy.
| RBET | DIT_COVID | |
|---|---|---|
| RBET(−1) | −0.033198 | −4632.009 |
| −0.0569 | −8536.69 | |
| [−0.58340] | [−0.54260] | |
| RBET(−2) | 0.246594 | −2994.404 |
| −0.05647 | −8471.69 | |
| [4.36677] | [−0.35346] | |
| RBET(−3) | 0.029426 | −4806.22 |
| −0.05822 | −8734.25 | |
| [0.50542] | [−0.55027] | |
| RBET(−4) | −0.110034 | −10,837.98 |
| −0.05661 | −8492.63 | |
| [−1.94372] | [−1.27616] | |
| RBET(−5) | 0.177356 | −8666.519 |
| −0.05708 | −8562.82 | |
| [3.10725] | [−1.01211] | |
| DIT_COVID(−1) | 8.74 × 10⁻⁸ | −0.211916 |
| −3.40 × 10⁻⁷ | −0.05074 | |
| [0.25850] | [−4.17662] | |
| DIT_COVID(−2) | 1.75 × 10⁻⁸ | −0.302194 |
| −3.40 × 10⁻⁷ | −0.05081 | |
| [0.05158] | [−5.94763] | |
| DIT_COVID(−3) | −3.00 × 10⁻⁸ | −0.169155 |
| −3.50 × 10⁻⁷ | −0.05314 | |
| [−0.08468] | [−3.18296] | |
| DIT_COVID(−4) | −2.90 × 10⁻⁷ | −0.204575 |
| −3.50 × 10⁻⁷ | −0.05182 | |
| [−0.84012] | [−3.94743] | |
| DIT_COVID(−5) | 1.35 × 10⁻⁹ | 0.487342 |
| −3.50 × 10⁻⁷ | −0.05253 | |
| [0.00386] | [9.27781] | |
| C | 0.000266 | 76.10105 |
| −0.00079 | −118.787 | |
| [0.33573] | [0.64065] | |
| R-squared | 0.108079 | 0.452144 |
| Adj. R-squared | 0.078348 | 0.433882 |
| Sum sq. resids | 0.0579 | 1.30 × 10⁹ |
| S.E. equation | 0.013892 | 2084.126 |
| F-statistic | 3.635264 | 24.75893 |
| Log likelihood | 894.2746 | −2812.385 |
| Akaike AIC | −5.680222 | 18.15682 |
| Schwarz SC | −5.547947 | 18.28909 |
| Mean dependent | 0.000392 | 60.84887 |
| S.D. dependent | 0.014471 | 2769.942 |
| Determinant resid covariance (dof adj.) | 836.7493 | |
| Determinant resid covariance | 778.6048 | |
| Log likelihood | −1917.822 | |
| Akaike information criterion | 12.47474 | |
| Schwarz criterion | 12.73929 | |
| Number of coefficients | 22 |
Source: Authors’ calculations. Notes: Standard errors in ( ) and t-statistics in [ ]. Sample (adjusted): 13 January 2020–9 April 2021. Included observations: 311 after adjustments. Variables’ descriptions are provided in Table 2.
Table A3.
Vector autoregression estimates for stock market index and the number of new cases of COVID-19 in the US.
Table A3.
Vector autoregression estimates for stock market index and the number of new cases of COVID-19 in the US.
| RBET | DUS_COVID | |
|---|---|---|
| RBET(−1) | −0.033139 | 32,151.08 |
| −0.05671 | −50,868.3 | |
| [−0.58440] | [0.63205] | |
| RBET(−2) | 0.244778 | 24,680.63 |
| −0.0564 | −50,592.7 | |
| [4.34020] | [0.48783] | |
| RBET(−3) | 0.024836 | −17,993.17 |
| −0.05813 | −52,150.7 | |
| [0.42722] | [−0.34502] | |
| RBET(−4) | −0.108053 | −26,717.78 |
| −0.05637 | −50,566.7 | |
| [−1.91689] | [−0.52837] | |
| RBET(−5) | 0.181611 | 6054.621 |
| −0.05668 | −50,842.6 | |
| [3.20434] | [0.11909] | |
| DUS_COVID(−1) | 2.85 × 10⁻⁸ | −0.334621 |
| −5.90 × 10⁻⁸ | −0.05323 | |
| [0.48101] | [−6.28657] | |
| DUS_COVID(−2) | 4.52 × 10⁻⁸ | −0.172527 |
| −6.20 × 10⁻⁸ | −0.05599 | |
| [0.72473] | [−3.08140] | |
| DUS_COVID(−3) | 5.78 × 10⁻⁹ | −0.177546 |
| −6.20 × 10⁻⁸ | −0.056 | |
| [0.09263] | [−3.17063] | |
| DUS_COVID(−4) | 2.31 × 10⁻⁸ | −0.151236 |
| −6.20 × 10⁻⁸ | −0.05606 | |
| [0.36926] | [−2.69776] | |
| DUS_COVID(−5) | 5.54 × 10⁻⁸ | 0.389606 |
| −6.00 × 10⁻⁸ | −0.05339 | |
| [0.93125] | [7.29772] | |
| C | 0.000223 | 373.3586 |
| −0.00079 | −709.148 | |
| [0.28226] | [0.52649] | |
| R-squared | 0.108277 | 0.360989 |
| Adj. R-squared | 0.078553 | 0.339689 |
| Sum sq. resids | 0.057887 | 4.66 × 10¹⁰ |
| S.E. equation | 0.013891 | 12,461.02 |
| F-statistic | 3.64273 | 16.94756 |
| Log likelihood | 894.3091 | −3368.533 |
| Akaike AIC | −5.680444 | 21.73333 |
| Schwarz SC | −5.548169 | 21.8656 |
| Mean dependent | 0.000392 | 265.91 |
| S.D. dependent | 0.014471 | 15,334.84 |
| Determinant resid covariance (dof adj.) | 29,925.76 | |
| Determinant resid covariance | 27,846.27 | |
| Log likelihood | −2474.037 | |
| Akaike information criterion | 16.05169 | |
| Schwarz criterion | 16.31624 | |
| Number of coefficients | 22 |
Source: Authors’ calculations. Notes: Standard errors in ( ) and t-statistics in [ ]. Sample (adjusted): 13 January 2020–9 April 2021. Included observations: 311 after adjustments. Variables’ descriptions are provided in Table 2.
References
- Abuzayed, Bana, Elie Bouri, Nedal Al-Fayoumi, and Naji Jalkh. 2021. Systemic risk spillover across global and country stock markets during the COVID-19 pandemic. Economic Analysis and Policy 71: 180–97. [Google Scholar] [CrossRef]
- Agarwalla, Sobhesh Kumar, Jayanth R. Varma, and Vineet Virmani. 2021. The impact of COVID-19 on tail risk: Evidence from Nifty index options. Economics Letters 204: 109878. [Google Scholar] [CrossRef]
- Aggarwal, Shobhit, Samarpan Nawn, and Amish Dugar. 2021. What caused global stock market meltdown during the COVID pandemic–Lockdown strinsgency or investor panic? Finance Research Letters, 38. [Google Scholar] [CrossRef]
- Al-Najjar, Hazem, Nadia Al-Rousan, Dania Al-Najjar, Hamzeh F. Assous, and Dana Al-Najjar. 2021. Impact of COVID-19 pandemic virus on G8 countries’ financial indices based on artificial neural network. Journal of Chinese Economic and Foreign Trade Studies 14: 89–103. [Google Scholar] [CrossRef]
- Al-Qudah, Anas Ali, and Asma Houcine. 2021. Stock markets’ reaction to COVID-19: Evidence from the six WHO regions. Journal of Economic Studies. [Google Scholar] [CrossRef]
- Amin, Ali, Muhammad Arshad, Naheed Sultana, and Rabeeya Raoof. 2021. Examination of impact of COVID-19 on stock market: Evidence from American peninsula. Journal of Economic and Administrative Sciences. [Google Scholar] [CrossRef]
- Anser, Muhammad Khalid, Muhammad Azhar Khan, Khalid Zaman, Abdelmohsen A. Nassani, Sameh E. Askar, Muhammad Moinuddin Qazi Abro, and Ahmad Kabbani. 2021. Financial development during COVID-19 pandemic: The role of coronavirus testing and functional labs. Financial Innovation, 7. [Google Scholar] [CrossRef]
- Atri, Hanen, Saoussen Kouki, and Mohamed imen Gallali. 2021. The impact of COVID-19 news, panic and media coverage on the oil and gold prices: An ARDL approach. Resources Policy 72: 102061. [Google Scholar] [CrossRef]
- Baek, Seungho, Sunil K. Mohanty, Mina Glambosky, and Mohanty, and Mina Glambosky. 2020. COVID-19 and stock market volatility: An industry level analysis. Finance Research Letters, 37. [Google Scholar] [CrossRef]
- Bai, Lan, Yu Wei, Guiwu Wei, Xiafei Li, and Songyun Zhang. 2021. Infectious disease pandemic and permanent volatility of international stock markets: A long-term perspective. Finance Research Letters, 40. [Google Scholar] [CrossRef]
- Baker, Scott R., Nicholas Bloom, Steven J. Davis, Kyle Kost, Marco Sammon, and Tasaneeya Viratyosin. 2020. The Unprecedented Stock Market Reaction toCOVID-19. The Review of Asset Pricing Studies 10: 742–58. [Google Scholar] [CrossRef]
- Banerjee, Ameet Kumar. 2021. Futures market and the contagion effect of COVID-19 syndrome. Finance Research Letters, 102018. [Google Scholar] [CrossRef]
- Bannigidadmath, Deepa, Paresh Kumar Narayan, Dinh Hoang Bach Phan, and Qiang Gong. 2021. How stock markets reacted to COVID-19? Evidence from 25 countries. Finance Research Letters, 102161. [Google Scholar] [CrossRef]
- Baybogan, Barkan. 2013. Empirical Investigation of MGarch Models. Journal of Statistical and Econometric Methods 2: 75–93. [Google Scholar]
- Będowska-Sójka, Barbara, and Agata Kliber. 2021. Is there one safe-haven for various turbulences? The evidence from gold, Bitcoin and Ether. The North American Journal of Economics and Finance 56: 101390. [Google Scholar] [CrossRef]
- Bollerslev, Tim. 1986. Generalized autoregressive conditional heteroskedasticity. Journal of Econometrics 31: 307–27. [Google Scholar] [CrossRef] [Green Version]
- Bora, Debakshi, and Daisy Basistha. 2021. The outbreak of COVID-19 pandemic and its impact on stock market volatility: Evidence from a worst-affected economy. Journal of Public Affairs, e2623. [Google Scholar] [CrossRef]
- Borgioli, Stefano, Carl-Wolfram Horn, Urszula Kochanska, Philippe Molitor, and Francesco Paolo Mongelli. 2020. European financial integration during the COVID-19 crisis. ECB Economic Bulletin 7: 62–84. [Google Scholar]
- Bourghelle, David, Fredj Jawadi, and Philippe Rozin. 2021. Oil price volatility in the context of Covid-19. International Economics 167: 39–49. [Google Scholar] [CrossRef]
- Brueckner, Markus, and Joaquin Vespignani. 2021. COVID-19 Infections and the Performance of the Stock Market: An Empirical Analysis for Australia. Economic Papers. [Google Scholar] [CrossRef]
- Bucharest Stock Exchange. 2020. Monthly Report. Available online: https://m.bvb.ro/press/2020/BVB_Monthly%20report%20June%202020.pdf (accessed on 18 June 2021).
- Celık, Sibel. 2012. The more contagion effect on emerging markets: The evidence of DCC-GARCH model. Economic Modelling 29: 1946–59. [Google Scholar] [CrossRef]
- Chang, Chia-Lin, Michael McAleer, and Yu-Ann Wang. 2020. Herding behaviour in energy stock markets during the Global Financial Crisis, SARS, and ongoing COVID-19. Renewable and Sustainable Energy Reviews 134: 110349. [Google Scholar] [CrossRef]
- Chebbi, Kaouther, Mohammed Abdullah Ammer, and Affan Hameed. 2021. The COVID-19 pandemic and stock liquidity: Evidence from S&P 500. The Quarterly Review of Economics and Finance 81: 134–42. [Google Scholar] [CrossRef]
- Chen, Xingyi, Zhijing Wang, Xinyi Li, Zhongyang Liu, and Kun Li. 2021. The Impact of Covid-19 on the Securities Market: Evidence from Chinese Stock and Bond Markets. Procedia Computer Science, 187. [Google Scholar] [CrossRef]
- Chowdhury, Emon Kalyan, Iffat Ishrat Khan, and Bablu Kumar Dhar. 2021. Catastrophic impact of Covid-19 on the global stock markets and economic activities. Business and Society Review. [Google Scholar] [CrossRef]
- Chundakkadan, Radeef, and Elizabeth Nedumparambil. 2021. In search of COVID-19 and stock market behavior. Global Finance Journal, 100639. [Google Scholar] [CrossRef]
- Conlon, Thomas, and Richard McGee. 2020. Safe haven or risky hazard? Bitcoin during the Covid-19 bear market. Finance Research Letters 35: 101607. [Google Scholar] [CrossRef] [PubMed]
- Contessi, Silvio, and Pierangelo De Pace. 2021. The international spread of COVID-19 stock market collapses. Finance Research Letters, 101894. [Google Scholar] [CrossRef]
- Curto, José Dias, and Pedro Serrasqueiro. 2021. The impact of COVID-19 on S&P500 sector indices and FATANG stocks volatility: An expanded APARCH model. Finance Research Letters. [Google Scholar] [CrossRef]
- Czech, Katarzyna, Michał Wielechowski, Pavel Kotyza, Irena Benešová, and Adriana Laputková. 2020. Shaking Stability: COVID-19 Impact on the Visegrad Group Countries’ Financial Markets. Sustainability 12: 6282. [Google Scholar] [CrossRef]
- data.europa.eu. 2020. Thunder on the Financial Markets: A Retrospective View. Available online: https://data.europa.eu/en/impact-studies/covid-19/thunder-financial-markets-retrospective-view (accessed on 6 May 2021).
- Disli, Mustafa, Ruslan Nagayev, Kinan Salim, Siti K. Rizkiah, and Ahmet F. Aysan. 2021. In search of safe haven assets during COVID-19 pandemic: An empirical analysis of different investor types. Research in International Business and Finance, 101461. [Google Scholar] [CrossRef]
- Duttilo, Pierdomenico, Stefano Antonio Gattone, and Tonio Di Battista. 2021. Volatility Modeling: An Overview of Equity Markets in the Euro Area during COVID-19 Pandemic. Mathematics 9: 1212. [Google Scholar] [CrossRef]
- Engelhardt, Nils, Miguel Krause, Daniel Neukirchen, and Peter N. Posch. 2021. Trust and stock market volatility during the COVID-19 crisis. Finance Research Letters, 38. [Google Scholar] [CrossRef]
- Engle, Robert F. 1982. Autoregressive Conditional Heteroscedasticity with Estimates of the Variance of United Kingdom Inflation. Econometrica 50: 987–1007. [Google Scholar] [CrossRef]
- Espinosa-Méndez, Christian, and Jose Arias. 2021. COVID-19 effect on herding behaviour in European capital markets. Finance Research Letters 38: 101787. [Google Scholar] [CrossRef] [PubMed]
- Fakhfekh, Mohamed, Ahmed Jeribi, and Marwa Ben Salem. 2021. Volatility dynamics of the Tunisian stock market before and during the COVID-19 outbreak: Evidence from the GARCH family models. International Journal of Finance and Economics. [Google Scholar] [CrossRef]
- Farid, Saqib, Ghulam Mujtaba Kayani, Muhammad Abubakr Naeem, and Syed Jawad Hussain Shahzad. 2021. Intraday volatility transmission among precious metals, energy and stocks during the COVID-19 pandemic. Resources Policy 72: 102101. [Google Scholar] [CrossRef]
- Fernandez-Perez, Adrian, Aaron Gilbert, Ivan Indriawan, and Nhut H. Nguyen. 2021. COVID-19 pandemic and stock market response: A culture effect. Journal of Behavioral and Experimental Finance 29: 100454. [Google Scholar] [CrossRef]
- Freeman, John R. 1983. Granger Causality and the Times Series Analysis of Political Relationships. American Journal of Political Science 27: 327–58. [Google Scholar] [CrossRef]
- Ftiti, Zied, Hachmi Ben Ameur, and Waël Louhichi. 2021. Does non-fundamental news related to COVID-19 matter for stock returns? Evidence from Shanghai stock market. Economic Modelling 99: 105484. [Google Scholar] [CrossRef]
- Ghorbel, Achraf, and Ahmed Jeribi. 2021. Contagion of COVID-19 pandemic between oil and financial assets: The evidence of multivariate Markov switching GARCH models. Journal of Investment Compliance. [Google Scholar] [CrossRef]
- Granger, Clive W. J. 1969. Investigating Causal Relations by Econometric Models and Cross-spectral Methods. Econometrica 37: 424–38. [Google Scholar] [CrossRef]
- Harjoto, Maretno Agus, and Fabrizio Rossi. 2021. Market reaction to the COVID-19 pandemic: Evidence from emerging markets. International Journal of Emerging Markets. [Google Scholar] [CrossRef]
- Haroon, Omair, and Syed Aun R. Rizvi. 2020. COVID-19: Media coverage and financial markets behavior—A sectoral inquiry. Journal of Behavioral and Experimental Finance 27: 100343. [Google Scholar] [CrossRef]
- Hashmi, Shabir Mohsin, Bisharat Hussain Chang, and Li Rong. 2021. Asymmetric effect of COVID-19 pandemic on E7 stock indices: Evidence from quantile-on-quantile regression approach. Research in International Business and Finance, 58. [Google Scholar] [CrossRef]
- Höhler, Julia, and Alfons Oude Lansink. 2021. Measuring the impact of COVID-19 on stock prices and profits in the food supply chain. Agribusiness: An International Journal 37: 171–86. [Google Scholar] [CrossRef]
- Hong, Hui, Zhicun Bian, and Chien-Chiang Lee. 2021. COVID-19 and instability of stock market performance: Evidence from the U.S. Financial Innovation, 7. [Google Scholar] [CrossRef]
- Hongsakulvasu, Napon, Chatchai Khiewngamdee, and Asama Liammukda. 2020. Does COVID-19 Crisis Affects the Spillover of Oil Market’s Return and Risk on Thailand’s Sectoral Stock Return?: Evidence from Bivariate DCC GARCH-in-Mean Model. International Energy Journal 20: 647–62. [Google Scholar]
- Hoshikawa, Takeshi, and Taiyo Yoshimi. 2021. The Effect of the COVID-19 Pandemic on South Korea’s Stock Market and Exchange Rate. The Developing Economies 59: 206–22. [Google Scholar] [CrossRef]
- Huang, Yingying, Kun Duan, and Tapas Mishra. 2021. Is Bitcoin really more than a diversifier? A pre- and post-COVID-19 analysis. Finance Research Letters. [Google Scholar] [CrossRef]
- Hunjra, Ahmed Imran, Ploypailin Kijkasiwat, Murugesh Arunachalam, and Helmi Hammami. 2021. Covid-19 health policy intervention and volatility of Asian capital markets. Technological Forecasting and Social Change 169: 120840. [Google Scholar] [CrossRef]
- Insaidoo, Michael, Lilian Arthur, Samuel Amoako, and Francis Kwaw Andoh. 2021. Stock market performance and COVID-19 pandemic: Evidence from a developing economy. Journal of Chinese Economic and Foreign Trade Studies 14: 60–73. [Google Scholar] [CrossRef]
- Ji, Qiang, Dayong Zhang, and Yuqian Zhao. 2020. Searching for safe-haven assets during the COVID-19 pandemic. International Review of Financial Analysis 71: 101526. [Google Scholar] [CrossRef]
- Karamti, Chiraz, and Olfa Belhassine. 2021. COVID-19 pandemic waves and global financial markets: Evidence from wavelet coherence analysis. Finance Research Letters, 102136. [Google Scholar] [CrossRef]
- Kizys, Renatas, Panagiotis Tzouvanas, and Michael Donadelli. 2021. From COVID-19 herd immunity to investor herding in international stock markets: The role of government and regulatory restrictions. International Review of Financial Analysis 74: 101663. [Google Scholar] [CrossRef]
- Le, Thao Phan Thi Dieu, and Hieu Luong Minh Tran. 2021. The Contagion Effect from U.S. Stock Market to the Vietnamese and the Philippine Stock Markets: The Evidence of DCC-GARCH Model. The Journal of Asian Finance, Economics and Business 8: 759–70. [Google Scholar] [CrossRef]
- Li, Wenqi. 2021. COVID-19 and asymmetric volatility spillovers across global stock markets. The North American Journal of Economics and Finance, 101474. [Google Scholar] [CrossRef]
- Liu, Yuntong, Yu Wei, Qian Wang, and Yi Liu. 2021a. International stock market risk contagion during the COVID-19 pandemic. Finance Research Letters, 102145. [Google Scholar] [CrossRef]
- Liu, Zhifeng, Toan Luu Duc Huynh, and Peng-Fei Dai. 2021b. The impact of COVID-19 on the stock market crash risk in China. Research in International Business and Finance 57: 101419. [Google Scholar] [CrossRef]
- Lo, Gaye Del, Théophile Basséne, and Babacar Séne. 2021. COVID-19 And the african financial markets: Less infection, less economic impact? Finance Research Letters, 102148. [Google Scholar] [CrossRef]
- Malik, Kunjana, Sakshi Sharma, and Manmeet Kaur. 2021. Measuring contagion during COVID-19 through volatility spillovers of BRIC countries using diagonal BEKK approach. Journal of Economic Studies. [Google Scholar] [CrossRef]
- Mariana, Christy Dwita, Irwan Adi Ekaputr, and Zaäfri Ananto Husodo. 2021. Are Bitcoin and Ethereum safe-havens for stocks during the COVID-19 pandemic? Finance Research Letters 38: 101798. [Google Scholar] [CrossRef]
- Mdaghri, Anas Alaoui, Abdessamad Raghibi, Cuong Nguyen Thanh, and Lahsen Oubdi. 2021. Stock market liquidity, the great lockdown and the COVID-19 global pandemic nexus in MENA countries. Review of Behavioral Finance 13: 51–68. [Google Scholar] [CrossRef]
- Milcheva, Stanimira. 2021. Volatility and the Cross-Section of Real Estate Equity Returns during Covid-19. The Journal of Real Estate Finance and Economics. [Google Scholar] [CrossRef]
- Mnif, Emna, Anis Jarboui, and Khaireddine Mouakhar. 2020. How the cryptocurrency market has performed during COVID 19? A multifractal analysis. Finance Research Letters 36: 101647. [Google Scholar] [CrossRef] [PubMed]
- Naeem, Muhammad Abubakr, Saba Sehrish, and Mabel D. Costa. 2021. COVID-19 pandemic and connectedness across financial markets. Pacific Accounting Review. [Google Scholar] [CrossRef]
- O’Donnell, Niall, Darren Shannon, and Barry Sheehan. 2021. Immune or at-risk? Stock markets and the significance of the COVID-19 pandemic. Journal of Behavioral and Experimental Finance 30: 100477. [Google Scholar] [CrossRef] [PubMed]
- Omane-Adjepong, Maurice, and Imhotep Paul Alagidede. 2021. Exploration of safe havens for Africa’s stock markets: A test case under COVID-19 crisis. Finance Research Letters 38: 101877. [Google Scholar] [CrossRef]
- Orhun, Eda. 2021. The impact of COVID-19 global health crisis on stock markets and understanding the cross-country effects. Pacific Accounting Review. [Google Scholar] [CrossRef]
- Ortmann, Regina, Matthias Pelster, and Sascha Tobias Wengerek. 2020. COVID-19 and investor behavior. Finance Research Letters 37: 101717. [Google Scholar] [CrossRef]
- Ozkan, Oktay. 2021. Impact of COVID-19 on stock market efficiency: Evidence from developed countries. Research in International Business and Finance 58: 101445. [Google Scholar] [CrossRef]
- Pagano, Michael S., John Sedunov, and Raisa Velthuis. 2021. How did retail investors respond to the COVID-19 pandemic? The effect of Robinhood brokerage customers on market quality. Finance Research Letters. [Google Scholar] [CrossRef]
- Pan, Wei-Fong, Xinjie Wang, Ge Wu, and Weike Xu. 2021. The COVID-19 pandemic and sovereign credit risk. China Finance Review International. [Google Scholar] [CrossRef]
- Pho, Kim Hung, Sel Ly, Richard Lu, Thi Hong Van Hoang, and Wing-Keung Wong. 2021. Is Bitcoin a better portfolio diversifier than gold? A copula and sectoral analysis for China. International Review of Financial Analysis 74: 101674. [Google Scholar] [CrossRef]
- Rouatbi, Wael, Ender Demir, Renatas Kizys, and Adam Zaremba. 2021. Immunizing markets against the pandemic: COVID-19 vaccinations and stock volatility around the world. International Review of Financial Analysis 77: 101819. [Google Scholar] [CrossRef]
- Salisu, Afees A., Abdulsalam Abidemi Sikiru, and Xuan Vinh Vo. 2020. Pandemics and the emerging stock markets. Borsa Istanbul Review 20: S40–S48. [Google Scholar] [CrossRef]
- Salisu, Afees A., and Ahamuefula E. Ogbonna. 2021. The return volatility of cryptocurrencies during the COVID-19 pandemic: Assessing the news effect. Global Finance Journal, 100641. [Google Scholar] [CrossRef]
- Salisu, Afees A., and Xuan Vinh Vo. 2020. Predicting stock returns in the presence of COVID-19 pandemic: The role of health news. International Review of Financial Analysis 71: 101546. [Google Scholar] [CrossRef]
- Shahzad, Syed Jawad Hussain, Muhammad Abubakr Naeem, Zhe Peng, and Elie Bouri. 2021. Asymmetric volatility spillover among Chinese sectors during COVID-19. International Review of Financial Analysis 75: 101754. [Google Scholar] [CrossRef]
- Shaikh, Imlak, and Toan Luu Duc Huynh. 2021. Does disease outbreak news impact equity, commodity and foreign exchange market? Investors’ fear of the pandemic COVID-19. Journal of Economic Studies. [Google Scholar] [CrossRef]
- Smales, L. A. 2021. Investor attention and global market returns during the COVID-19 crisis. International Review of Financial Analysis 43: 101616. [Google Scholar] [CrossRef]
- Subramaniam, Sowmya, and Madhumita Chakraborty. 2021. COVID-19 fear index: Does it matter for stock market returns? Review of Behavioral Finance 13: 40–50. [Google Scholar] [CrossRef]
- Sun, Yunpeng, Qun Bao, and Zhou Lu. 2021. Coronavirus (Covid-19) outbreak, investor sentiment, and medical portfolio: Evidence from China, Hong Kong, Korea, Japan, and U.S. Pacific-Basin Finance Journal, 65. [Google Scholar] [CrossRef]
- Szczygielski, Jan Jakub, Janusz Brzeszczyński, Ailie Charteris, and Princess Rutendo Bwanya. 2021a. The COVID-19 storm and the energy sector: The impact and role of uncertainty. Energy Economics, 105258. [Google Scholar] [CrossRef]
- Szczygielski, Jan Jakub, Princess Rutendo Bwanya, Ailie Charteris, and Janusz Brzeszczyński. 2021b. The only certainty is uncertainty: An analysis of the impact of COVID-19 uncertainty on regional stock markets. Finance Research Letters, 101945. [Google Scholar] [CrossRef]
- Takyi, Paul Owusu, and Isaac Bentum-Ennin. 2021. The impact of COVID-19 on stock market performance in Africa: A Bayesian structural time series approach. Journal of Economics and Business 111: 105968. [Google Scholar] [CrossRef]
- Tian, Maoxi, and Hao Ji. 2021. GARCH copula quantile regression model for risk spillover analysis. Finance Research Letters, 102104. [Google Scholar] [CrossRef]
- Topcu, Mert, and Omer Serkan Gulal. 2020. The impact of COVID-19 on emerging stock markets. Finance Research Letters 36: 101691. [Google Scholar] [CrossRef]
- Uddin, Moshfique, Anup Chowdhury, Keith Anderson, and Kausik Chaudhuri. 2021. The effect of COVID-19 pandemic on global stock market volatility: Can economic strength help to manage the uncertainty? Journal of Business Research 128: 31–44. [Google Scholar] [CrossRef]
- Umar, Zaghum, Saqib Aziz, and Dima Tawil. 2021. The impact of COVID-19 induced panic on the return and volatility of precious metals. Journal of Behavioral and Experimental Finance, 100525. [Google Scholar] [CrossRef]
- Vera-Valdés, J. Eduardo. 2021. The persistence of financial volatility after COVID-19. Finance Research Letters, 102056. [Google Scholar] [CrossRef]
- Verma, Surabhi, and Anders Gustafsson. 2020. Investigating the emerging COVID-19 research trends in the field of business and management: A bibliometric analysis approach. Journal of Business Research 118: 253–61. [Google Scholar] [CrossRef] [PubMed]
- Weng, Futian, Hongwei Zhang, and Cai Yang. 2021. Volatility forecasting of crude oil futures based on a genetic algorithm regularization online extreme learning machine with a forgetting factor: The role of news during the COVID-19 pandemic. Resources Policy 73: 102148. [Google Scholar] [CrossRef]
- Wu, Binrong, Lin Wang, Sirui Wang, and Yu-Rong Zeng. 2021. Forecasting the U.S. oil markets based on social media information during the COVID-19 pandemic. Energy, 120403. [Google Scholar] [CrossRef]
- Xu, Libo. 2021. Stock Return and the COVID-19 pandemic: Evidence from Canada and the US. Finance Research Letters, 38. [Google Scholar] [CrossRef]
- Yarovaya, Larisa, Roman Matkovskyy, and Akanksha Jalan. 2021. The effects of a “black swan” event (COVID-19) on herding behavior in cryptocurrency markets. Journal of International Financial Markets, Institutions and Money, 101321. [Google Scholar] [CrossRef]
- Yousaf, Imran. 2021. Risk transmission from the COVID-19 to metals and energy markets. Resources Policy 73: 102156. [Google Scholar] [CrossRef]
- Yousfi, Mohamed, Younes Ben Zaied, Nidhaleddine Ben Cheikh, Béchir Ben Lahouel, and Houssem Bouzgarrou. 2021. Effects of the COVID-19 pandemic on the US stock market and uncertainty: A comparative assessment between the first and second waves. Technological Forecasting and Social Change 167: 120710. [Google Scholar] [CrossRef]
- Youssef, Manel, Khaled Mokni, and Ahdi Noomen Ajmi. 2021. Dynamic connectedness between stock markets in the presence of the COVID-19 pandemic: Does economic policy uncertainty matter? Financial Innovation, 7. [Google Scholar] [CrossRef]
- Yu, Xiaoling, Kaitian Xiao, and Junping Liu. 2021. Dynamic co-movements of COVID-19 pandemic anxieties and stock market returns. Finance Research Letters. [Google Scholar] [CrossRef]
- Zaremba, Adam, Renatas Kizys, David Y.Aharon, and Ender Demir. 2020. Infected Markets: Novel Coronavirus, Government Interventions, and Stock Return Volatility around the Globe. Finance Research Letters 35: 101597. [Google Scholar] [CrossRef] [PubMed]
- Zhang, Dayong, Min Hu, and Qiang Ji. 2020. Financial markets under the global pandemic of COVID-19. Finance Research Letters 36: 101528. [Google Scholar] [CrossRef] [PubMed]
- Zhang, Wenting, and Shigeyuki Hamori. 2021. Crude oil market and stock markets during the COVID-19 pandemic: Evidence from the US, Japan, and Germany. International Review of Financial Analysis 74: 101702. [Google Scholar] [CrossRef]
- Zoungrana, Tibi Didier, Daouda Lawa tan Toé, and Mamadou Toé. 2021. Covid-19 outbreak and stocks return on the West African Economic and Monetary Union’s stock market: An empirical analysis of the relationship through the event study approach. International Journal of Finance and Economics. [Google Scholar] [CrossRef]
Figure 1.
Density plots for daily logarithmic returns. Source: Authors’ own work. Notes: Variables’ descriptions are provided in Table 2.
Figure 1.
Density plots for daily logarithmic returns. Source: Authors’ own work. Notes: Variables’ descriptions are provided in Table 2.

Figure 2.
Q–Q plots for daily logarithmic returns. Source: Authors’ own work. Notes: Variables’ descriptions are provided in Table 2.
Figure 2.
Q–Q plots for daily logarithmic returns. Source: Authors’ own work. Notes: Variables’ descriptions are provided in Table 2.

Figure 3.
Daily values of the logarithmic returns. Source: Authors’ own work. Notes: Variables’ descriptions are provided in Table 2.
Figure 3.
Daily values of the logarithmic returns. Source: Authors’ own work. Notes: Variables’ descriptions are provided in Table 2.

Figure 4.
The evolution of the daily BET index quotes vs. no. of SUA new cases of SARS-COV-2. Source: Authors’ own work. Notes: Variables’ descriptions are provided in Table 2.
Figure 4.
The evolution of the daily BET index quotes vs. no. of SUA new cases of SARS-COV-2. Source: Authors’ own work. Notes: Variables’ descriptions are provided in Table 2.

Figure 5.
The evolution of the daily BET index quotes vs. no. of Italy new cases of SARS-COV-2. Source: Authors’ own work. Notes: Variables’ descriptions are provided in Table 2.
Figure 5.
The evolution of the daily BET index quotes vs. no. of Italy new cases of SARS-COV-2. Source: Authors’ own work. Notes: Variables’ descriptions are provided in Table 2.

Figure 6.
The evolution of the daily BET index quotes vs. no. of Romania new cases of SARS-COV-2. Source: Authors’ own work. Notes: Variables’ descriptions are provided in Table 2.
Figure 6.
The evolution of the daily BET index quotes vs. no. of Romania new cases of SARS-COV-2. Source: Authors’ own work. Notes: Variables’ descriptions are provided in Table 2.

Figure 7.
Conditional volatility of stock market shares and BET stock market index over January 2020–April 2021. Source: Authors’ own work. Notes: Variables’ descriptions are provided in Table 2.
Figure 7.
Conditional volatility of stock market shares and BET stock market index over January 2020–April 2021. Source: Authors’ own work. Notes: Variables’ descriptions are provided in Table 2.

Figure 8.
Daily values of the selected data over the period 2007–2021. Source: Authors’ own work. Notes: Variables’ descriptions are provided in Table 2.
Figure 8.
Daily values of the selected data over the period 2007–2021. Source: Authors’ own work. Notes: Variables’ descriptions are provided in Table 2.

Table 1.
Brief review of earlier studies towards the effect of the COVID-19 pandemic on stock market volatility.
Table 1.
Brief review of earlier studies towards the effect of the COVID-19 pandemic on stock market volatility.
| Author(s) | Sample | Period | Quantitative Methods | Outcomes |
|---|---|---|---|---|
| Shahzad et al. (2021) | CSI 300 sector index series for ten sectors | 3 January 2019–30 September 2020 | Vector autoregressive model | Bad volatility spillover shocks dominate good volatility spillover shocks |
| Salisu and Ogbonna (2021) | Prices of Bitcoin, Ethereum, Litecoin and Ripple | 2 September 2019–29 September 2020 | GARCH MIDAS | Return unpredictability of cryptocurrencies is riskier throughout the pandemic as related to prior financial slumps |
| Abuzayed et al. (2021) | 14 country-specific stock markets | 7 January 2016–1 July 2020 | Dynamic conditional correlation (DCC) conditional autoregressive heteroscedastic (GARCH) model | Developed stock exchanges in North America and Europe spread and received more marginal extreme risk to and from the worldwide market index compared to Asian equity markets |
| Bai et al. (2021) | US, China, UK, and Japan financial markets | 4 January 2005–30 April 2020 | GARCH-MIDAS | Pandemic positively influence perpetual volatility up to 24-month lag |
| Li (2021) | G7 and 3 emerging nations (China, India, and Brazil) | 1 June 2009–28 August 2020 | Asymmetry in volatility spillovers | Equity markets of Japan, China, India, and Brazil are risk receivers Stock markets of the US, Germany, the U.K., France, Italy, and Canada are risk spreaders |
| Tian and Ji (2021) | MSCI indices of the US, the UK, France, Germany and the MSCI developed markets | 2 January 2001–31 December 2020 | GARCH copula quantile regression-based CoVaR model | Germany exhibits the greatest risk spillovers, succeeded by France, the US and, the UK |
| Malik et al. (2021) | Brazil, Russia, India, China, South Africa | 1 January 2013–24 April 2020 | Baba-Engle-Kraft-Kroner (BEKK) model | The US, China and Brazil exhibited the highest individual volatility spillovers |
| Yousfi et al. (2021) | S&P 500 index and the CSI 300 index | 5 January 2011–21 September 2020 | GARCH models, DCC process, and wavelet coherence | Higher volatility spillover among US and Chinese equity markets throughout the pandemic period than before it |
| Contessi and Pace (2021) | 18 main stock market indices | 1 November 2019–29 May 2020 | Generalized Supremum ADF (GSADF) test | Volatility spread from the Chinese equity market to all other markets |
| Liu et al. (2021a) | 16 main equity markets in the world | 24 January 2019–30 December 2020 | Spillover analysis in time and frequency domain | Following the outbreak of COVID-19 pandemic, the integration of global stock markets increases considerably and the market risk contagion between them also raised substantially |
| Zaremba et al. (2020) | 67 nations | 1 January 2020–3 April 2020 | Regression models | Government interventions increase worldwide stock markets’ volatility |
| Duttilo et al. (2021) | European stock markets | 4 January 2016–31 December 2020 | Threshold GARCH | The first wave of pandemic affected stock market volatility of euro area nations with middle-large financial centers, but the second wave impacted merely stock market volatility of Belgium |
| Banerjee (2021) | China and its key trading partners’ index futures contracts | 1 August 2015–31 July 2020 | Bivariate asymmetric dynamic conditional (ADCC) GARCH model | Substantial financial contagion in most developed and emerging markets showing sizeable business relations with China throughout COVID-19 period |
| Liu et al. (2021b) | Shanghai A shares | 1 January 2017–31 March 2020. | GARCH with skewness | The pandemic boosts financial market crash risk |
| Hoshikawa and Yoshimi (2021) | Volatility index of the South Korean Stock market (KVI) | 2 January 2019–31 August 2020 | VAR, OLS, GARCH | The rise of new infection cases caused an upsurge in stock market volatility |
| Bora and Basistha (2021) | Nifty and Sensex stock indices | 3 September 2019–10 July 2020 | GJR GARCH | Indian equity market has undergone volatility throughout the pandemic |
| Fakhfekh et al. (2021) | 12 sectorial indices | 4 January 2016–30 April 2020 | EGARCH, FIGARCH, FIEGARCH, TGARCH | Subsequent COVID-19 eruption, volatility is frequent in all series |
| Yousaf (2021) | Precious metals, industrial metals and, energy markets | 22 January 2020–4 January 2021 | BEKK-MGARCH | Volatility diffusion is significantly negative from the COVID-19 to gold, palladium, and brent oil markets, but positively spread to the WTI oil market |
Source: Authors’ work based on the literature review.
Table 2.
Variables’ descriptions.
| Variables | Description |
|---|---|
| Variables regarding Romanian financial market | |
| BET | Bucharest Exchange Trading is the first index developed by BSE and signifies the reference index for the Romanian equity market. BET indicates the performance of the most traded corporations on BSE’s regulated market, apart from financial investment enterprises. It is a free float market capitalization weighted index, with the highest weight of its components of 20%. |
| ALR | Alro is affiliate of Vimetco N.V., a worldwide, vertically-integrated primary and processed aluminium manufacturer. Field of activity: Aluminium production. |
| BRD | BRD Groupe Societe Generale is the second leading bank in Romania and the fourth market capitalization on the BSE. Field of activity: Other monetary intermediation. |
| BVB | The Bucharest Stock Exchange is the most significant organization of the local capital market. It coordinates and operates the regulated markets of financial instruments under European guidelines. Field of activity: Administration of financial markets. |
| COTE | CONPET delivers specific gas transport services via tubes and by rail, ensuring the supply of the factories with domestic and imported crude oil and derivatives. It manages a 3800 km pipeline grid encompassing 24 Romanian counties. Field of activity: Transport via pipeline. |
| EL | Societatea Energetica Electrica is a major participant in the energy sharing and supply market in Romania. Field of activity: Business and other management consultancy activities. |
| FP | Fondul Proprietatea is a joint stock company running as a closed-end investment company (Alternative Investment Fund) short of a set period, integrated in Romania, trading on the BSE since January 2011, and on the London Stock Exchange since April 2015. Field of activity: Trusts, funds and similar financial entities. |
| SNG | Romgaz is the leading natural gas manufacturer and the key provider in Romania. It is a joint stock corporation whose majority stockholder is the Romanian State owning a 70% share. Field of activity: Extraction of natural gas. |
| SNP | OMV Petrom is the leading energy corporation in Southeastern Europe. The firm is involved along the whole energy value chain: from exploration and fabrication of oil and gas, to processing and fuels supply, and further on to power production and advertising of gas and power. Field of activity: Extraction of crude petroleum. |
| TEL | Transelectrica is the Romanian Transmission and System Operator which performs a vital position in the Romanian electricity market. It operates and runs the energy spread system and delivers the electricity connections among the Central and Eastern European nations as a member of European Network of Transmission and System Operators for Electricity. Field of activity: Transmission of electricity. |
| TLV | Banca Transilvania is the first largest bank in Romania in terms of total assets. Field of activity: Other monetary intermediation. |
| TRP | TeraPlast SA is the parent corporation of the TeraPlast Group, respectively the major Romanian manufacturer of construction materials. Field of activity: Manufacture of plastic plates, sheets, tubes and profiles. |
| WINE | Purcari Wineries Group is a prominent participant in the wine and brandy sectors in the Central and Eastern Europe area, handling around 1,300 hectares of vineyards and 4 wineries placed in Romania and the Republic of Moldova. Field of activity: wineries. |
| Variables regarding COVID-19 pandemic | |
| RO_COVID | Number of new cases of COVID-19 in Romania |
| IT_COVID | Number of new cases of COVID-19 in Italy |
| US_COVID | Number of new cases of COVID-19 in USA |
Source: Authors’ own work.
Table 3.
Descriptive statistics for daily logarithmic returns.
| Variables | Mean | Std. Dev. | Skewness | Kurtosis | Jarque–Bera | Probability |
|---|---|---|---|---|---|---|
| BET | 0.000328 | 0.013891 | −1.69758 | 16.55179 | 2748.758 | 0 |
| ALR | 0.000654 | 0.024085 | −1.52064 | 18.71394 | 3607.831 | 0 |
| BRD | −8.72 × 10⁻⁵ | 0.018169 | −0.82825 | 7.13984 | 280.0083 | 0 |
| BVB | −6.82 × 10⁻⁵ | 0.014499 | 1.201959 | 21.34744 | 4822.239 | 0 |
| COTE | 0.000448 | 0.016037 | −1.33521 | 16.31311 | 2596.545 | 0 |
| EL | 0.000723 | 0.016134 | −0.64638 | 8.430259 | 438.822 | 0 |
| FP | 0.000995 | 0.020352 | −0.23783 | 34.51292 | 13,988.84 | 0 |
| SNG | −0.000359 | 0.01451 | −0.52513 | 6.038829 | 145.5867 | 0 |
| SNP | −8.05 × 10⁻⁵ | 0.020049 | −1.47295 | 14.83691 | 2095.471 | 0 |
| TEL | 0.000837 | 0.01552 | −0.65783 | 7.630885 | 326.3964 | 0 |
| TLV | 6.32E−05 | 0.01956 | −0.99008 | 7.62791 | 356.8519 | 0 |
| TRP | 0.003905 | 0.023626 | 1.82107 | 19.48105 | 4012.206 | 0 |
| WINE | 0.000398 | 0.016247 | −0.52416 | 7.145975 | 257.5572 | 0 |
Source: Authors’ calculations. Notes: Variables’ descriptions are provided in Table 2.
Table 4.
ADF test results for daily logarithmic returns.
| Level | Augmented Dickey–Fuller Test Statistic | 1% Level | 5% Level | 10% Level |
|---|---|---|---|---|
| BET | −7.012889 | −3.44986 | −2.87003 | −2.571363 |
| ALR | −7.440329 | −3.44968 | −2.86995 | −2.571321 |
| BRD | −18.45231 | −3.44956 | −2.8699 | −2.571293 |
| BVB | −16.64729 | −3.44962 | −2.86993 | −2.571307 |
| COTE | −10.02282 | −3.44962 | −2.86993 | −2.571307 |
| EL | −23.85922 | −3.44956 | −2.8699 | −2.571293 |
| FP | −7.815322 | −3.44986 | −2.87003 | −2.571363 |
| SNG | −16.81902 | −3.44956 | −2.8699 | −2.571293 |
| SNP | −17.54115 | −3.44956 | −2.8699 | −2.571293 |
| TEL | −17.88766 | −3.44956 | −2.8699 | −2.571293 |
| TLV | −17.41272 | −3.44956 | −2.8699 | −2.571293 |
| TRP | −15.9066 | −3.44956 | −2.8699 | −2.571293 |
| WINE | −6.367165 | −3.44980 | −2.8700 | −2.571349 |
Source: Authors’ calculations. Notes: Intercept included in test equation. Lag length: Automatic selection based on Schwarz Info Criterion. Variables’ descriptions are provided in Table 2.
Table 5.
Estimated autocorrelation (AC), partial autocorrelation (PAC) and Q-statistics with 20 lags for daily squared returns.
Table 5.
Estimated autocorrelation (AC), partial autocorrelation (PAC) and Q-statistics with 20 lags for daily squared returns.
| Variables | AC | PAC | Q-Stat | Prob |
|---|---|---|---|---|
| BET | 0.013 | −0.062 | 269.34 | 0.000 |
| ALR | −0.017 | −0.079 | 100.97 | 0.000 |
| BRD | −0.039 | −0.068 | 304.44 | 0.000 |
| BVB | −0.020 | −0.001 | 94.308 | 0.000 |
| COTE | 0.006 | 0.016 | 133.29 | 0.000 |
| EL | −0.009 | 0.021 | 201.63 | 0.000 |
| FP | −0.008 | 0.059 | 140.89 | 0.000 |
| SNG | −0.028 | −0.073 | 204.75 | 0.000 |
| SNP | 0.036 | −0.024 | 80.962 | 0.000 |
| TEL | −0.028 | 0.004 | 146.21 | 0.000 |
| TLV | 0.020 | −0.012 | 220.99 | 0.000 |
| TRP | −0.023 | −0.028 | 7.8138 | 0.993 |
| WINE | 0.041 | −0.071 | 204.04 | 0.000 |
Source: Authors’ own work. Notes: Variables’ descriptions are provided in Table 2.
Table 6.
GARCH estimations.
| Dependent Variable: BET | Dependent Variable: ALRO | ||||||||
| Variable | Coeff | Std. Error | z-Stat | Prob. | Variable | Coeff | Std. Error | z-Stat | Prob. |
| C | 0.00118 | 0.000391 | 3.014619 | 0.0026 | C | 0.000289 | 0.000749 | 0.385655 | 0.6998 |
| Variance Equation | Variance Equation | ||||||||
| C | 4.76 × 10⁻⁶ | C | 4.51 × 10⁻⁵ | ||||||
| RESID(−1)^2 | 0.184229 | 0.054926 | 3.35414 | 0.0008 | RESID(−1)^2 | 0.139141 | 0.050071 | 2.778885 | 0.0055 |
| GARCH(−1) | 0.7911 | 0.062407 | 12.67647 | 0 | GARCH(−1) | 0.782887 | 0.077865 | 10.05445 | 0 |
| T-DIST. DOF | 4.264243 | 0.887964 | 4.80227 | 0 | T-DIST. DOF | 2.915888 | 0.214055 | 13.62215 | 0 |
| R-sq | −0.003773 | Mean dependent var | 0.000328 | R-sq | −0.000231 | Mean dependent var | 0.000654 | ||
| Adj R-sq | −0.003773 | S.D. dependent var | 0.013891 | Adj R-sq | −0.000231 | S.D. dependent var | 0.024085 | ||
| S.E. of regr | 0.013917 | Akaike info crit | −6.537876 | S.E. of regr | 0.024088 | Akaike info crit | −5.236626 | ||
| Sum sq resid | 0.065275 | Schwarz crit | −6.492633 | Sum sq resid | 0.195534 | Schwarz crit | −5.191383 | ||
| Log likelihood | 1108.901 | Hannan–Quinn crit | −6.519845 | Log likelihood | 888.9898 | Hannan–Quinn crit | −5.218595 | ||
| DW stat | 2.106484 | DW stat | 1.936172 | ||||||
| Dependent Variable: BRD | Dependent Variable: BVB | ||||||||
| Variable | Coeff | Std. Error | z-Stat | Prob. | Variable | Coeff | Std. Error | z-Stat | Prob. |
| C | 0.00077 | 0.000709 | 1.085874 | 0.2775 | C | −0.000109 | 0.000504 | −0.21581 | 0.8291 |
| Variance Equation | Variance Equation | ||||||||
| C | 1.43 × 10⁻⁵ | C | 2.12 × 10⁻⁵ | ||||||
| RESID(−1)^2 | 0.150634 | 0.043495 | 3.463245 | 0.0005 | RESID(−1)^2 | 0.292829 | 0.072636 | 4.031475 | 0.0001 |
| GARCH(−1) | 0.806065 | 0.061517 | 13.10319 | 0 | GARCH(−1) | 0.606027 | 0.102678 | 5.902193 | 0 |
| T-DIST. DOF | 5.300367 | 1.31796 | 4.021645 | 0.0001 | T-DIST. DOF | 4.976087 | 1.251612 | 3.975743 | 0.0001 |
| R-sq | −0.002232 | Mean dependent var | −8.72 × 10⁻⁵ | R-sq | −0.000008 | Mean dependent var | −6.82 × 10⁻⁵ | ||
| Adj R-sq | −0.002232 | S.D. dependent var | 0.018169 | Adj R-sq | −0.000008 | S.D. dependent var | 0.014499 | ||
| S.E. of regr | 0.018189 | Akaike info crit | −5.52442 | S.E. of regr | 0.014499 | Akaike info crit | −6.126467 | ||
| Sum sq resid | 0.11149 | Schwarz crit | −5.479177 | Sum sq resid | 0.07084 | Schwarz crit | −6.081224 | ||
| Log likelihood | 937.627 | Hannan−Quinn crit | −5.506389 | Log likelihood | 1039.373 | Hannan–Quinn crit | −6.108436 | ||
| DW stat | 2.011758 | DW stat | 2.525927 | ||||||
| Dependent Variable: COTE | Dependent Variable: EL | ||||||||
| Variable | Coeff | Std. Error | z-Stat | Prob. | Variable | Coeff | Std. Error | z-Stat | Prob. |
| C | 0.000205 | 0.00034 | 0.604738 | 0.5454 | C | 0.001186 | 0.000632 | 1.87812 | 0.0604 |
| Variance Equation | Variance Equation | ||||||||
| C | 4.99 × 10⁻⁶ | C | 2.13 × 10⁻⁵ | ||||||
| RESID(−1)^2 | 0.250596 | 0.04803 | 5.217482 | 0 | RESID(−1)^2 | 0.209315 | 0.052881 | 3.958218 | 0.0001 |
| GARCH(−1) | 0.729937 | 0.053054 | 13.75829 | 0 | GARCH(−1) | 0.708624 | 0.078695 | 9.004646 | 0 |
| T-DIST. DOF | 3.486178 | 0.373561 | 9.332278 | 0 | T-DIST. DOF | 5.627834 | 1.419299 | 3.965221 | 0.0001 |
| R-sq | −0.000229 | Mean dependent var | 0.000448 | R-sq | −0.000828 | Mean dependent var | 0.000723 | ||
| Adj R-sq | −0.000229 | S.D. dependent var | 0.016037 | Adj R-sq | −0.000828 | S.D. dependent var | 0.016134 | ||
| S.E. of regr | 0.016039 | Akaike info crit | −6.427494 | S.E. of regr | 0.016141 | Akaike info crit | −5.754231 | ||
| Sum sq resid | 0.086694 | Schwarz crit | −6.382251 | Sum sq resid | 0.087795 | Schwarz crit | −5.708987 | ||
| Log likelihood | 1090.246 | Hannan–Quinn crit | −6.409463 | Log likelihood | 976.465 | Hannan–Quinn crit | −5.736199 | ||
| DW stat | 1.767033 | DW stat | 2.51603 | ||||||
| Dependent Variable: FP | Dependent Variable: SNP | ||||||||
| Variable | Coeff | Std. Error | z-Stat | Prob. | Variable | Coeff | Std. Error | z-Stat | Prob. |
| C | 0.001227 | 0.000524 | 2.341939 | 0.0192 | C | 0.000648 | 0.001333 | 0.486339 | 0.6267 |
| Variance Equation | Variance Equation | ||||||||
| C | 2.92 × 10⁻⁵ | C | 0.00016 | ||||||
| RESID(−1)^2 | 0.191734 | 0.06115 | 3.13549 | 0.0017 | RESID(−1)^2 | 0.000401 | 0.007995 | 0.050126 | 0.96 |
| GARCH(−1) | 0.737594 | 0.078636 | 9.379818 | 0 | GARCH(−1) | 0.6 | 0.56513 | 1.061702 | 0.2884 |
| T-DIST. DOF | 2.80621 | 0.225963 | 12.41887 | 0 | T-DIST. DOF | 20 | 3.777537 | 5.294455 | 0 |
| R-sq | −0.00013 | Mean dependent var | 0.000995 | R-sq | −0.001325 | Mean dependent var | −8.05 × 10⁻⁵ | ||
| Adj R-sq | −0.00013 | S.D. dependent var | 0.020352 | Adj R-sq | −0.001325 | S.D. dependent var | 0.020049 | ||
| S.E. of regr | 0.020353 | Akaike info crit | −5.925241 | S.E. of regr | 0.020062 | Akaike info crit | −5.118899 | ||
| Sum sq resid | 0.139607 | Schwarz crit | −5.879998 | Sum sq resid | 0.135641 | Schwarz crit | −5.073656 | ||
| Log likelihood | 1005.366 | Hannan–Quinn crit | −5.90721 | Log likelihood | 869.0939 | Hannan–Quinn crit | −5.100868 | ||
| DW stat | 2.534692 | DW stat | 1.912486 | ||||||
| Dependent Variable: SNG | Dependent Variable: WINE | ||||||||
| Variable | Coefficient | Std. Error | z-Statistic | Prob. | Variable | Coeff | Std. Error | z-Stat | Prob. |
| C | −0.00011 | 0.000579 | −0.190745 | 0.8487 | C | 0.00093 | 0.000575 | 1.616535 | 0.106 |
| Variance Equation | Variance Equation | ||||||||
| C | 0.0000175 | C | 2.53E-05 | ||||||
| RESID(−1)^2 | 0.206748 | 0.053863 | 3.838396 | 0.0001 | RESID(−1)^2 | 0.274618 | 0.063641 | 4.315126 | 0 |
| GARCH(−1) | 0.709914 | 0.084466 | 8.404724 | 0 | GARCH(−1) | 0.629318 | 0.093136 | 6.757009 | 0 |
| T-DIST. DOF | 4.572915 | 0.814926 | 5.611448 | 0 | T-DIST. DOF | 4.076108 | 0.615755 | 6.61969 | 0 |
| R-squared | −0.000296 | Mean dependent var | −0.000359 | R-sq | −0.001074 | Mean dependent var | 0.000398 | ||
| Adjusted R-squared | −0.000296 | S.D. dependent var | 0.01451 | Adj R-sq | −0.001074 | S.D. dependent var | 0.016247 | ||
| S.E. of regression | 0.014512 | Akaike info criterion | −5.903807 | S.E. of regr | 0.016256 | Akaike info crit | −5.761172 | ||
| Sum squared resid | 0.070969 | Schwarz criterion | −5.858564 | Sum sq resid | 0.089052 | Schwarz crit | −5.715929 | ||
| Log likelihood | 1001.743 | Hannan–Quinn criter. | −5.885776 | Log likelihood | 977.6381 | Hannan–Quinn crit | −5.743141 | ||
| Durbin-Watson stat | 1.830748 | DW stat | 2.292014 | ||||||
| Dependent Variable: TEL | Dependent Variable: TLV | ||||||||
| Variable | Coefficient | Std. Error | z-Statistic | Prob. | Variable | Coefficient | Std. Error | z-Statistic | Prob. |
| C | 0.000993 | 0.00053 | 1.873592 | 0.061 | C | 0.000385 | 0.00059 | 0.652159 | 0.5143 |
| Variance Equation | Variance Equation | ||||||||
| C | 0.0000155 | C | 0.00000789 | ||||||
| RESID(−1)^2 | 0.184978 | 0.055272 | 3.346684 | 0.0008 | RESID(−1)^2 | 0.169068 | 0.040267 | 4.198672 | 0 |
| GARCH(−1) | 0.750384 | 0.07748 | 9.684826 | 0 | GARCH(−1) | 0.810254 | 0.046858 | 17.2916 | 0 |
| T-DIST. DOF | 3.593242 | 0.439082 | 8.183526 | 0 | T-DIST. DOF | 3.940655 | 0.593309 | 6.64183 | 0 |
| R-squared | −0.000102 | Mean dependent var | 0.000837 | R-squared | −0.000272 | Mean dependent var | 0.0000632 | ||
| Adjusted R-squared | −0.000102 | S.D. dependent var | 0.01552 | Adjusted R-squared | −0.000272 | S.D. dependent var | 0.01956 | ||
| S.E. of regression | 0.015521 | Akaike info criterion | −5.879238 | S.E. of regression | 0.019563 | Akaike info criterion | −5.561135 | ||
| Sum squared resid | 0.081186 | Schwarz criterion | −5.833995 | Sum squared resid | 0.128969 | Schwarz criterion | −5.515892 | ||
| Log likelihood | 997.5912 | Hannan–Quinn criter. | −5.861207 | Log likelihood | 943.8319 | Hannan–Quinn criter. | −5.543104 | ||
| Durbin-Watson stat | 1.953884 | Durbin-Watson stat | 1.899838 | ||||||
Source: Authors’ calculations. Notes: Notes: Variables’ descriptions are provided in Table 2. Method: ML ARCH—Student’s t distribution (BFGS/Marquardt steps). Included observations: 338. Coefficient covariance computed using outer product of gradients. Presample variance: backcast (parameter = 0.7).
Table 7.
The outcomes of the Phillips–Ouliaris cointegration test.
| Series: RBET, DRO_COVID Included observations: 312 after adjustments | Dependent | tau-Statistic | Prob.* | z-Statistic | Prob.* |
| RBET | −20.03971 | 0 | −387.7359 | 0 | |
| DRO_COVID | −37.24025 | 0 | −316.0871 | 0 | |
| Series: RBET, DIT_COVID Included observations: 316 after adjustments | Dependent | tau-Statistic | Prob.* | z-Statistic | Prob.* |
| RBET | −18.96646 | 0 | −400.8999 | 0 | |
| DIT_COVID | −23.96736 | 0 | −284.9561 | 0 | |
| Series: RBET, DUS_COVID Included observations: 316 after adjustments | Dependent | tau-Statistic | Prob.* | z-Statistic | Prob.* |
| RBET | −18.93794 | 0 | −400.6069 | 0 | |
| DUS_COVID | −27.8585 | 0 | −369.0163 | 0 |
Source: Authors’ calculations. Notes: * MacKinnon (1996) p-values. Sample (adjusted): 6 January 2020–9 April 2021. Cointegrating equation deterministics: C. Long-run variance estimate (Bartlett kernel, Newey–West fixed bandwidth). No d.f. adjustment for variances. Variables’ descriptions are provided in Table 2.
Table 8.
VAR lag order selection criteria.
| Endogenous variables: RBET, DRO_COVID Exogenous variables: C Included observations: 296 | Lag | LogL | LR | FPE | AIC | SC | HQ |
| 0 | −1607.62 | NA | 181.2816 | 10.87581 | 10.90074 | 10.88579 | |
| 1 | −1587.74 | 39.35295 | 162.8402 | 10.76852 | 10.84333 | 10.79847 | |
| 2 | −1559.53 | 55.4685 | 138.2672 | 10.60494 | 10.72961 | 10.65485 | |
| 3 | −1551.44 | 15.79743 | 134.5 | 10.5773 | 10.75184 | 10.64718 | |
| 4 | −1458.68 | 179.8884 | 73.8342 | 9.977539 | 10.20195 | 10.06739 | |
| 5 | −1439.81 | 36.32215 | 66.78202 | 9.87712 | 10.1514 | 9.986937 | |
| 6 | −1429.8 | 19.15297 | 64.12454 | 9.836468 | 10.16062 | 9.966253 | |
| 7 | −1399.38 | 57.75557 * | 53.64450 * | 9.657959 * | 10.03198 * | 9.807711 * | |
| 8 | −1398.9 | 0.893729 | 54.94222 | 9.681783 | 10.10568 | 9.851501 | |
| Endogenous variables: RBET, DIT_COVID Exogenous variables: C Included observations: 308 | Lag | LogL | LR | FPE | AIC | SC | HQ |
| 0 | −2012.61 | NA | 1645.988 | 13.08185 | 13.10607 | 13.09153 | |
| 1 | −2007.18 | 10.74477 | 1630.827 | 13.0726 | 13.14526 | 13.10165 | |
| 2 | −1987.05 | 39.60666 | 1468.66 | 12.96785 | 13.08896 | 13.01628 | |
| 3 | −1975.61 | 22.36096 | 1399.403 | 12.91954 | 13.08909 | 12.98733 | |
| 4 | −1947.2 | 55.16232 | 1194.285 | 12.76102 | 12.97902 | 12.84819 | |
| 5 | −1902.16 | 86.8554 | 914.9435 | 12.49456 | 12.76099 * | 12.60109 | |
| 6 | −1892.38 | 18.73185 | 881.2824 | 12.45703 | 12.77191 | 12.58293 | |
| 7 | −1884.43 | 15.12514 * | 859.0133 * | 12.43138 * | 12.79471 | 12.57666 * | |
| 8 | −1883.75 | 1.295962 | 877.7618 | 12.4529 | 12.86467 | 12.61755 | |
| Endogenous variables: RBET, DUS_COVID Exogenous variables: C Included observations: 308 | Lag | LogL | LR | FPE | AIC | SC | HQ |
| 0 | −2539.78 | NA | 50478.62 | 16.50506 | 16.52928 | 16.51474 | |
| 1 | −2520.57 | 38.04213 | 45731.93 | 16.4063 | 16.47897 | 16.43536 | |
| 2 | −2508.57 | 23.61618 | 43416.26 | 16.35434 | 16.47544 | 16.40276 | |
| 3 | −2503.86 | 9.195366 | 43218.5 | 16.34976 | 16.51931 | 16.41756 | |
| 4 | −2483.95 | 38.65642 | 38977.11 | 16.24645 | 16.46444 | 16.33361 | |
| 5 | −2453.01 | 59.68167 | 32721.35 | 16.07148 | 16.33791 * | 16.17801 | |
| 6 | −2442.42 | 20.28741 * | 31351.76 * | 16.02868 * | 16.34356 | 16.15458 * | |
| 7 | −2441.24 | 2.234599 | 31934.01 | 16.04703 | 16.41035 | 16.1923 | |
| 8 | −2439.71 | 2.89233 | 32452.48 | 16.06306 | 16.47483 | 16.2277 |
Source: Authors’ calculations. Notes: Sample: 3 January 2020–9 April 2021. * indicates lag order selected by the criterion. LR: sequential modified LR test statistic (each test at 5% level). FPE: Final prediction error. AIC: Akaike information criterion. SC: Schwarz information criterion. HQ: Hannan–Quinn information criterion. Variables’ descriptions are provided in Table 2.
Table 9.
The results of the VAR Granger causality/block exogeneity Wald tests.
| Sample: 3 January 2020–9 April 2021 Included observations: 298 | Dependent variable: RBET | |||
| Excluded | Chi-sq | df | Prob. | |
| DRO_COVID | 2.811942 | 7 | 0.9018 | |
| All | 2.811942 | 7 | 0.9018 | |
| Dependent variable: DRO_COVID | ||||
| Excluded | Chi-sq | df | Prob. | |
| RBET | 4.566812 | 7 | 0.7127 | |
| All | 4.566812 | 7 | 0.7127 | |
| Sample: 3 January 2020–9 April 2021 Included observations: 311 | Dependent variable: RBET | |||
| Excluded | Chi-sq | df | Prob. | |
| DIT_COVID | 1.199299 | 5 | 0.9449 | |
| All | 1.199299 | 5 | 0.9449 | |
| Dependent variable: DIT_COVID | ||||
| Excluded | Chi-sq | df | Prob. | |
| RBET | 3.959237 | 5 | 0.5553 | |
| All | 3.959237 | 5 | 0.5553 | |
| Sample: 3 January 2020–9 April 2021 Included observations: 311 | Dependent variable: RBET | |||
| Excluded | Chi-sq | df | Prob. | |
| DUS_COVID | 1.266153 | 5 | 0.9384 | |
| All | 1.266153 | 5 | 0.9384 | |
| Dependent variable: DUS_COVID | ||||
| Excluded | Chi-sq | df | Prob. | |
| RBET | 0.801005 | 5 | 0.977 | |
| All | 0.801005 | 5 | 0.977 | |
Source: Authors’ calculations. Notes: Variables’ descriptions are provided in Table 2.
Publisher’s Note: MDPI stays neutral with regard to jurisdictional claims in published maps and institutional affiliations. |
© 2021 by the authors. Licensee MDPI, Basel, Switzerland. This article is an open access article distributed under the terms and conditions of the Creative Commons Attribution (CC BY) license (https://creativecommons.org/licenses/by/4.0/).
Share and Cite
MDPI and ACS Style
Gherghina, Ș.C.; Armeanu, D.Ș.; Joldeș, C.C. COVID-19 Pandemic and Romanian Stock Market Volatility: A GARCH Approach. J. Risk Financial Manag. 2021, 14, 341. https://0-doi-org.brum.beds.ac.uk/10.3390/jrfm14080341
AMA Style
Gherghina ȘC, Armeanu DȘ, Joldeș CC. COVID-19 Pandemic and Romanian Stock Market Volatility: A GARCH Approach. Journal of Risk and Financial Management. 2021; 14(8):341. https://0-doi-org.brum.beds.ac.uk/10.3390/jrfm14080341
Chicago/Turabian StyleGherghina, Ștefan Cristian, Daniel Ștefan Armeanu, and Camelia Cătălina Joldeș. 2021. "COVID-19 Pandemic and Romanian Stock Market Volatility: A GARCH Approach" Journal of Risk and Financial Management 14, no. 8: 341. https://0-doi-org.brum.beds.ac.uk/10.3390/jrfm14080341