
Factor Endowments, Economic Integration, Round-Tripping, and Inward FDI: Evidence from the Baltic Economies


Department of Macroeconomics and International Trade Theory, Faculty of Economic Sciences, University of Warsaw, ul. Długa 44/50, 00-241 Warszawa, Poland
*
Author to whom correspondence should be addressed.
J. Risk Financial Manag. 2021, 14(8), 348; https://0-doi-org.brum.beds.ac.uk/10.3390/jrfm14080348
Submission received: 10 June 2021
/
Revised: 18 July 2021
/
Accepted: 22 July 2021
/
Published: 29 July 2021
(This article belongs to the Special Issue Foreign Direct Investment and International Trade)
Abstract
:This paper studies the location choice of foreign multinational firms in the Baltic economies of Estonia, Latvia, and Lithuania using a knowledge-and-physical capital model across 2004–2017. We used the Bayesian model averaging estimation method to investigate a set of possible factors that drive inward FDI. Our analysis demonstrates that factor endowments play a dominant role in driving vertical foreign direct investment, while external market barriers generate “tariff-jumping” FDI. Our analysis quantifies the effects of round-trip FDI, European integration, and external bilateral free trade agreements vis-à-vis inward FDI in the Baltics.
Keywords:
Baltic economies; foreign direct investment; Bayesian model averaging; factor endowments; round-trip investmentsJEL:
C11; F21; F231. Introduction
With the fall of Communism, and the beginning of privatization in the early 1990s, the former Soviet republics finally opened their domestic markets to the entry of multinational firms (MNEs) and foreign direct investment (FDI). The end of central planning and further deregulation of state-owned industries opened significant opportunities for MNEs with strong proprietary assets (e.g., patents, trademarks, proprietary technology, etc.) from all over the developed economies of Western Europe and across the Atlantic.
In particular, the Baltic economies of Estonia, Latvia, and Lithuania achieved remarkable progress in transitioning to an open market, and subsequent economic integration with the European Union (EU), and European Free Trade Association (EFTA) members. Surprisingly, the broad empirical literature on FDI has ignored the study of factors that generate inward FDI across the Baltics. Given the favorable geography, existing industrial capacities, and human capital, it comes as no surprise that the Baltics are currently competing with other central European economies (CEEs) for FDI. As of 2019, inward FDI equity in Estonia (USD 7.8 billion), Latvia (USD 17.8 billion), and Lithuania (USD 20.7 billion) has been catching up with foreign investments found in the Czech Republic (USD 22.4 billion), and Poland (USD 32.2 billion) (Bank of Estonia 2020; Bank of Czech Republic 2020; Bank of Latvia 2020; Bank of Lithuania 2020; Bank of Poland 2020).
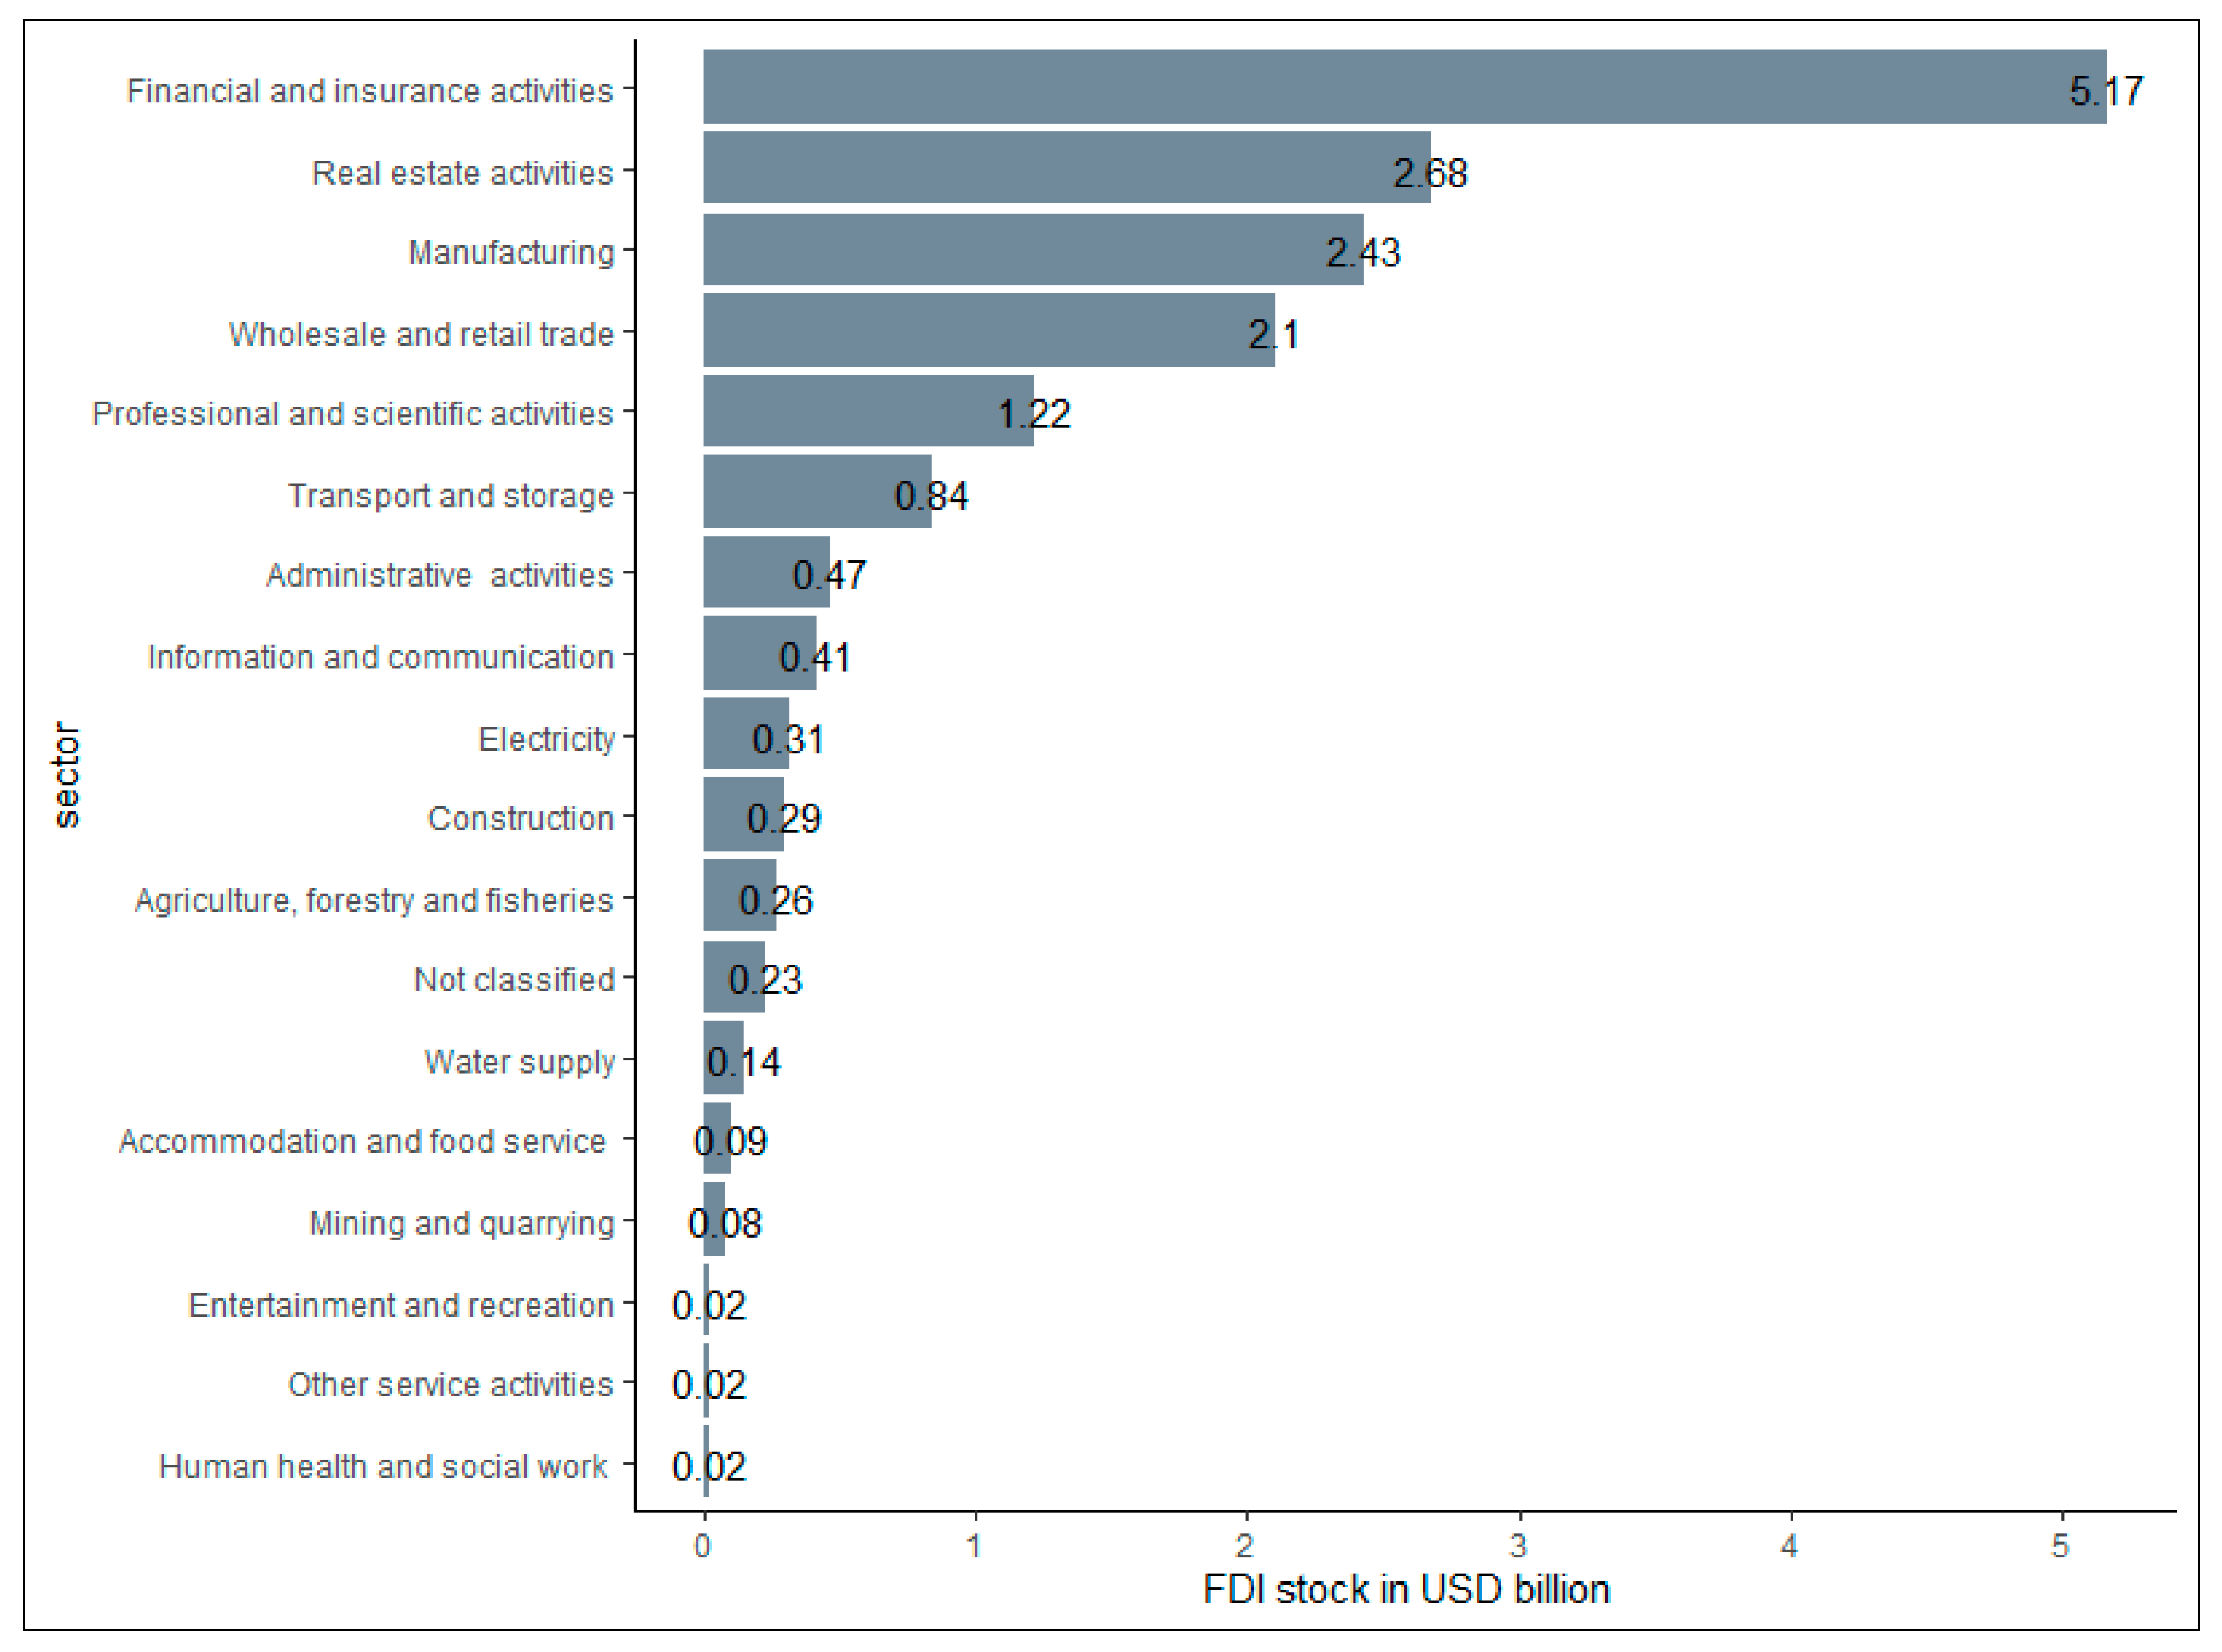
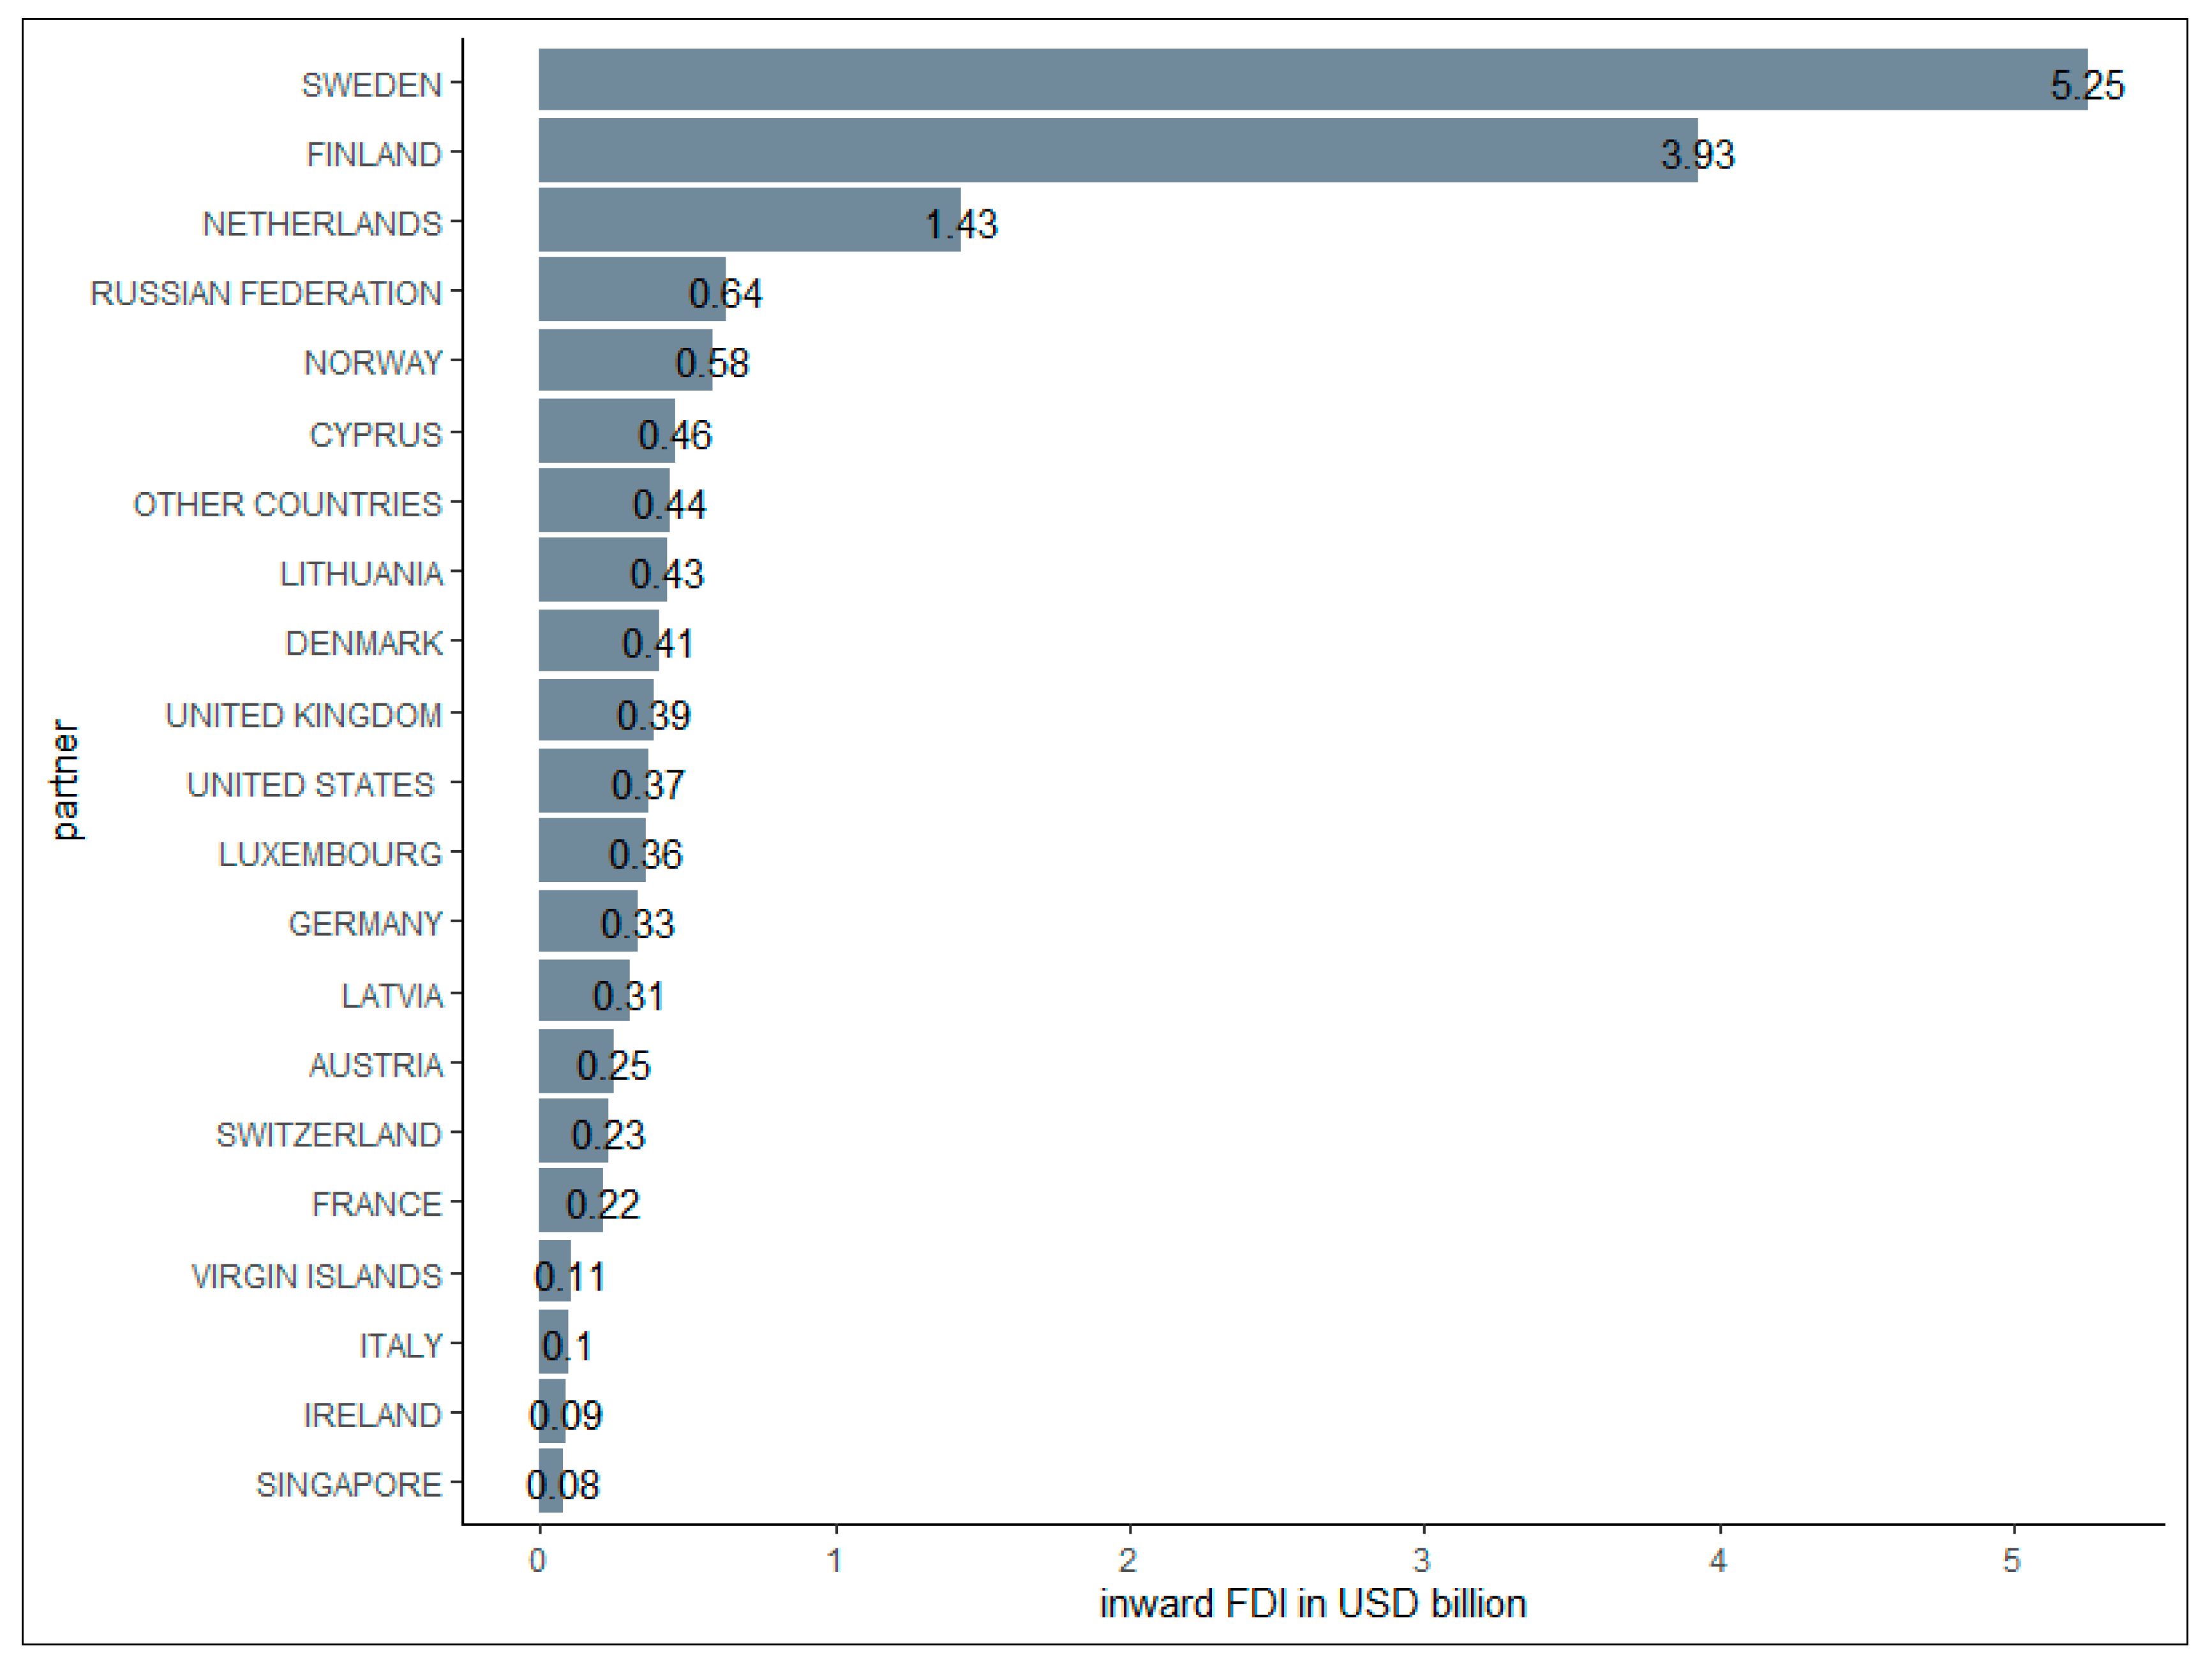
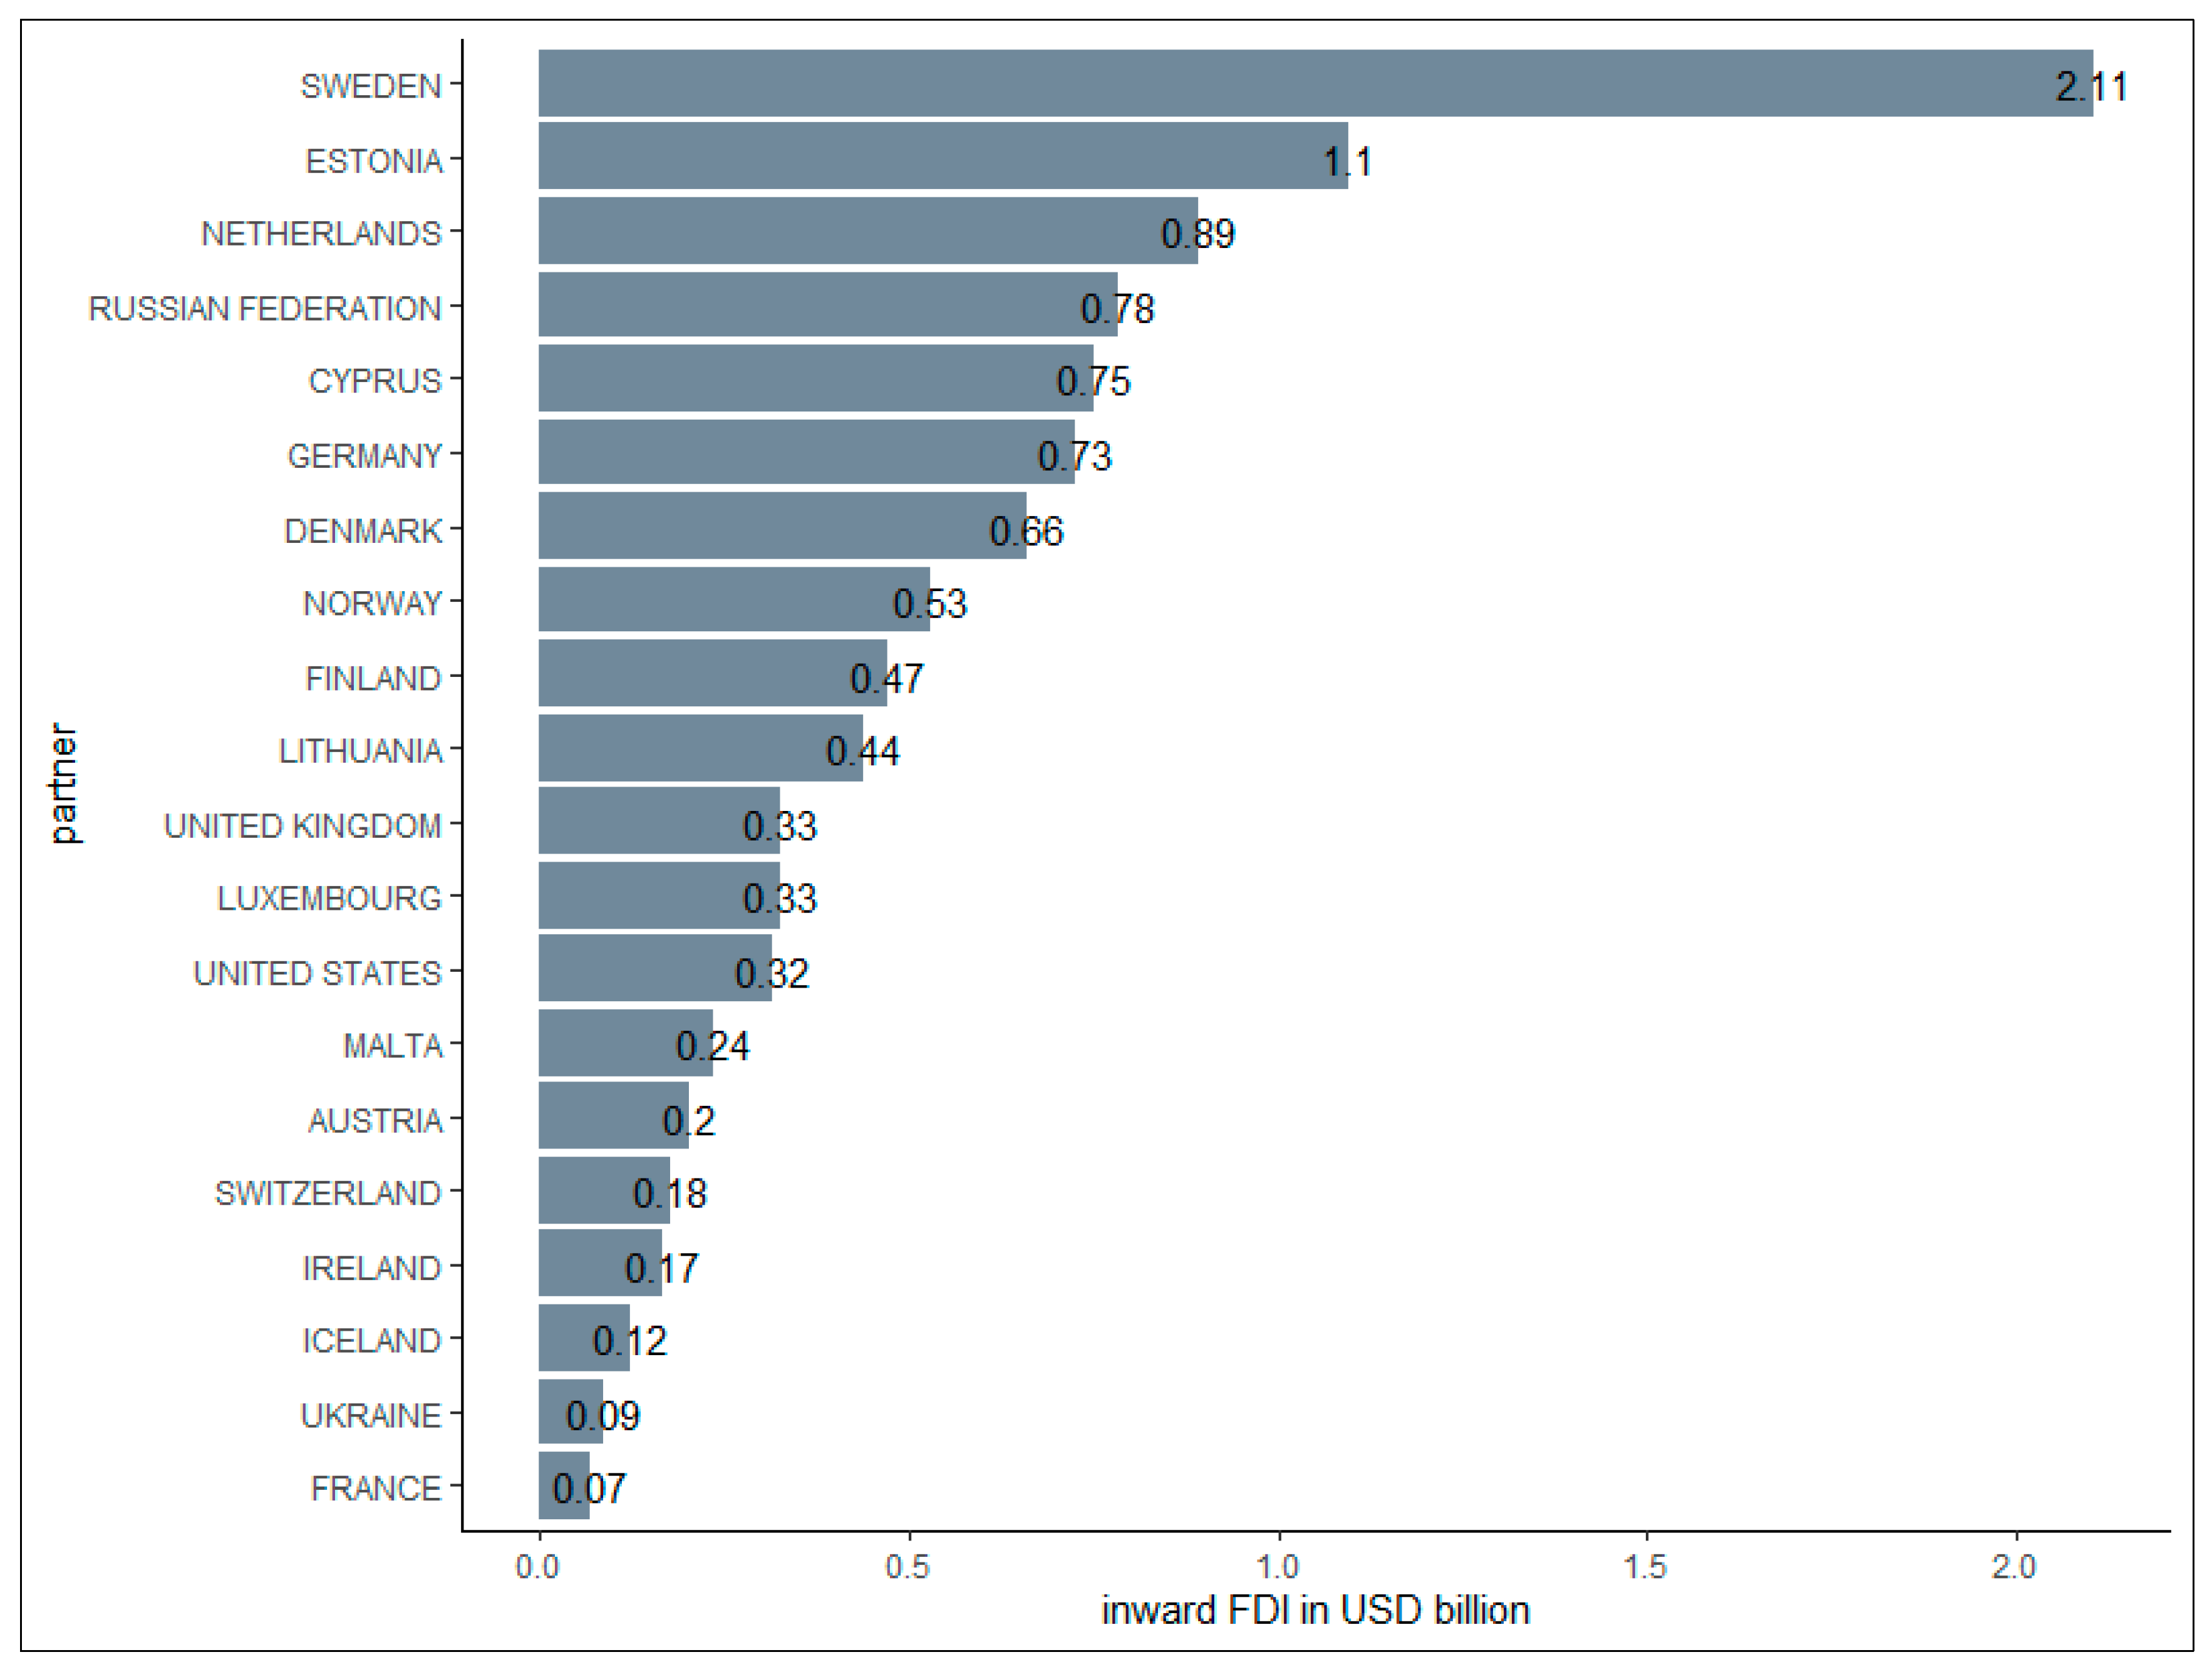
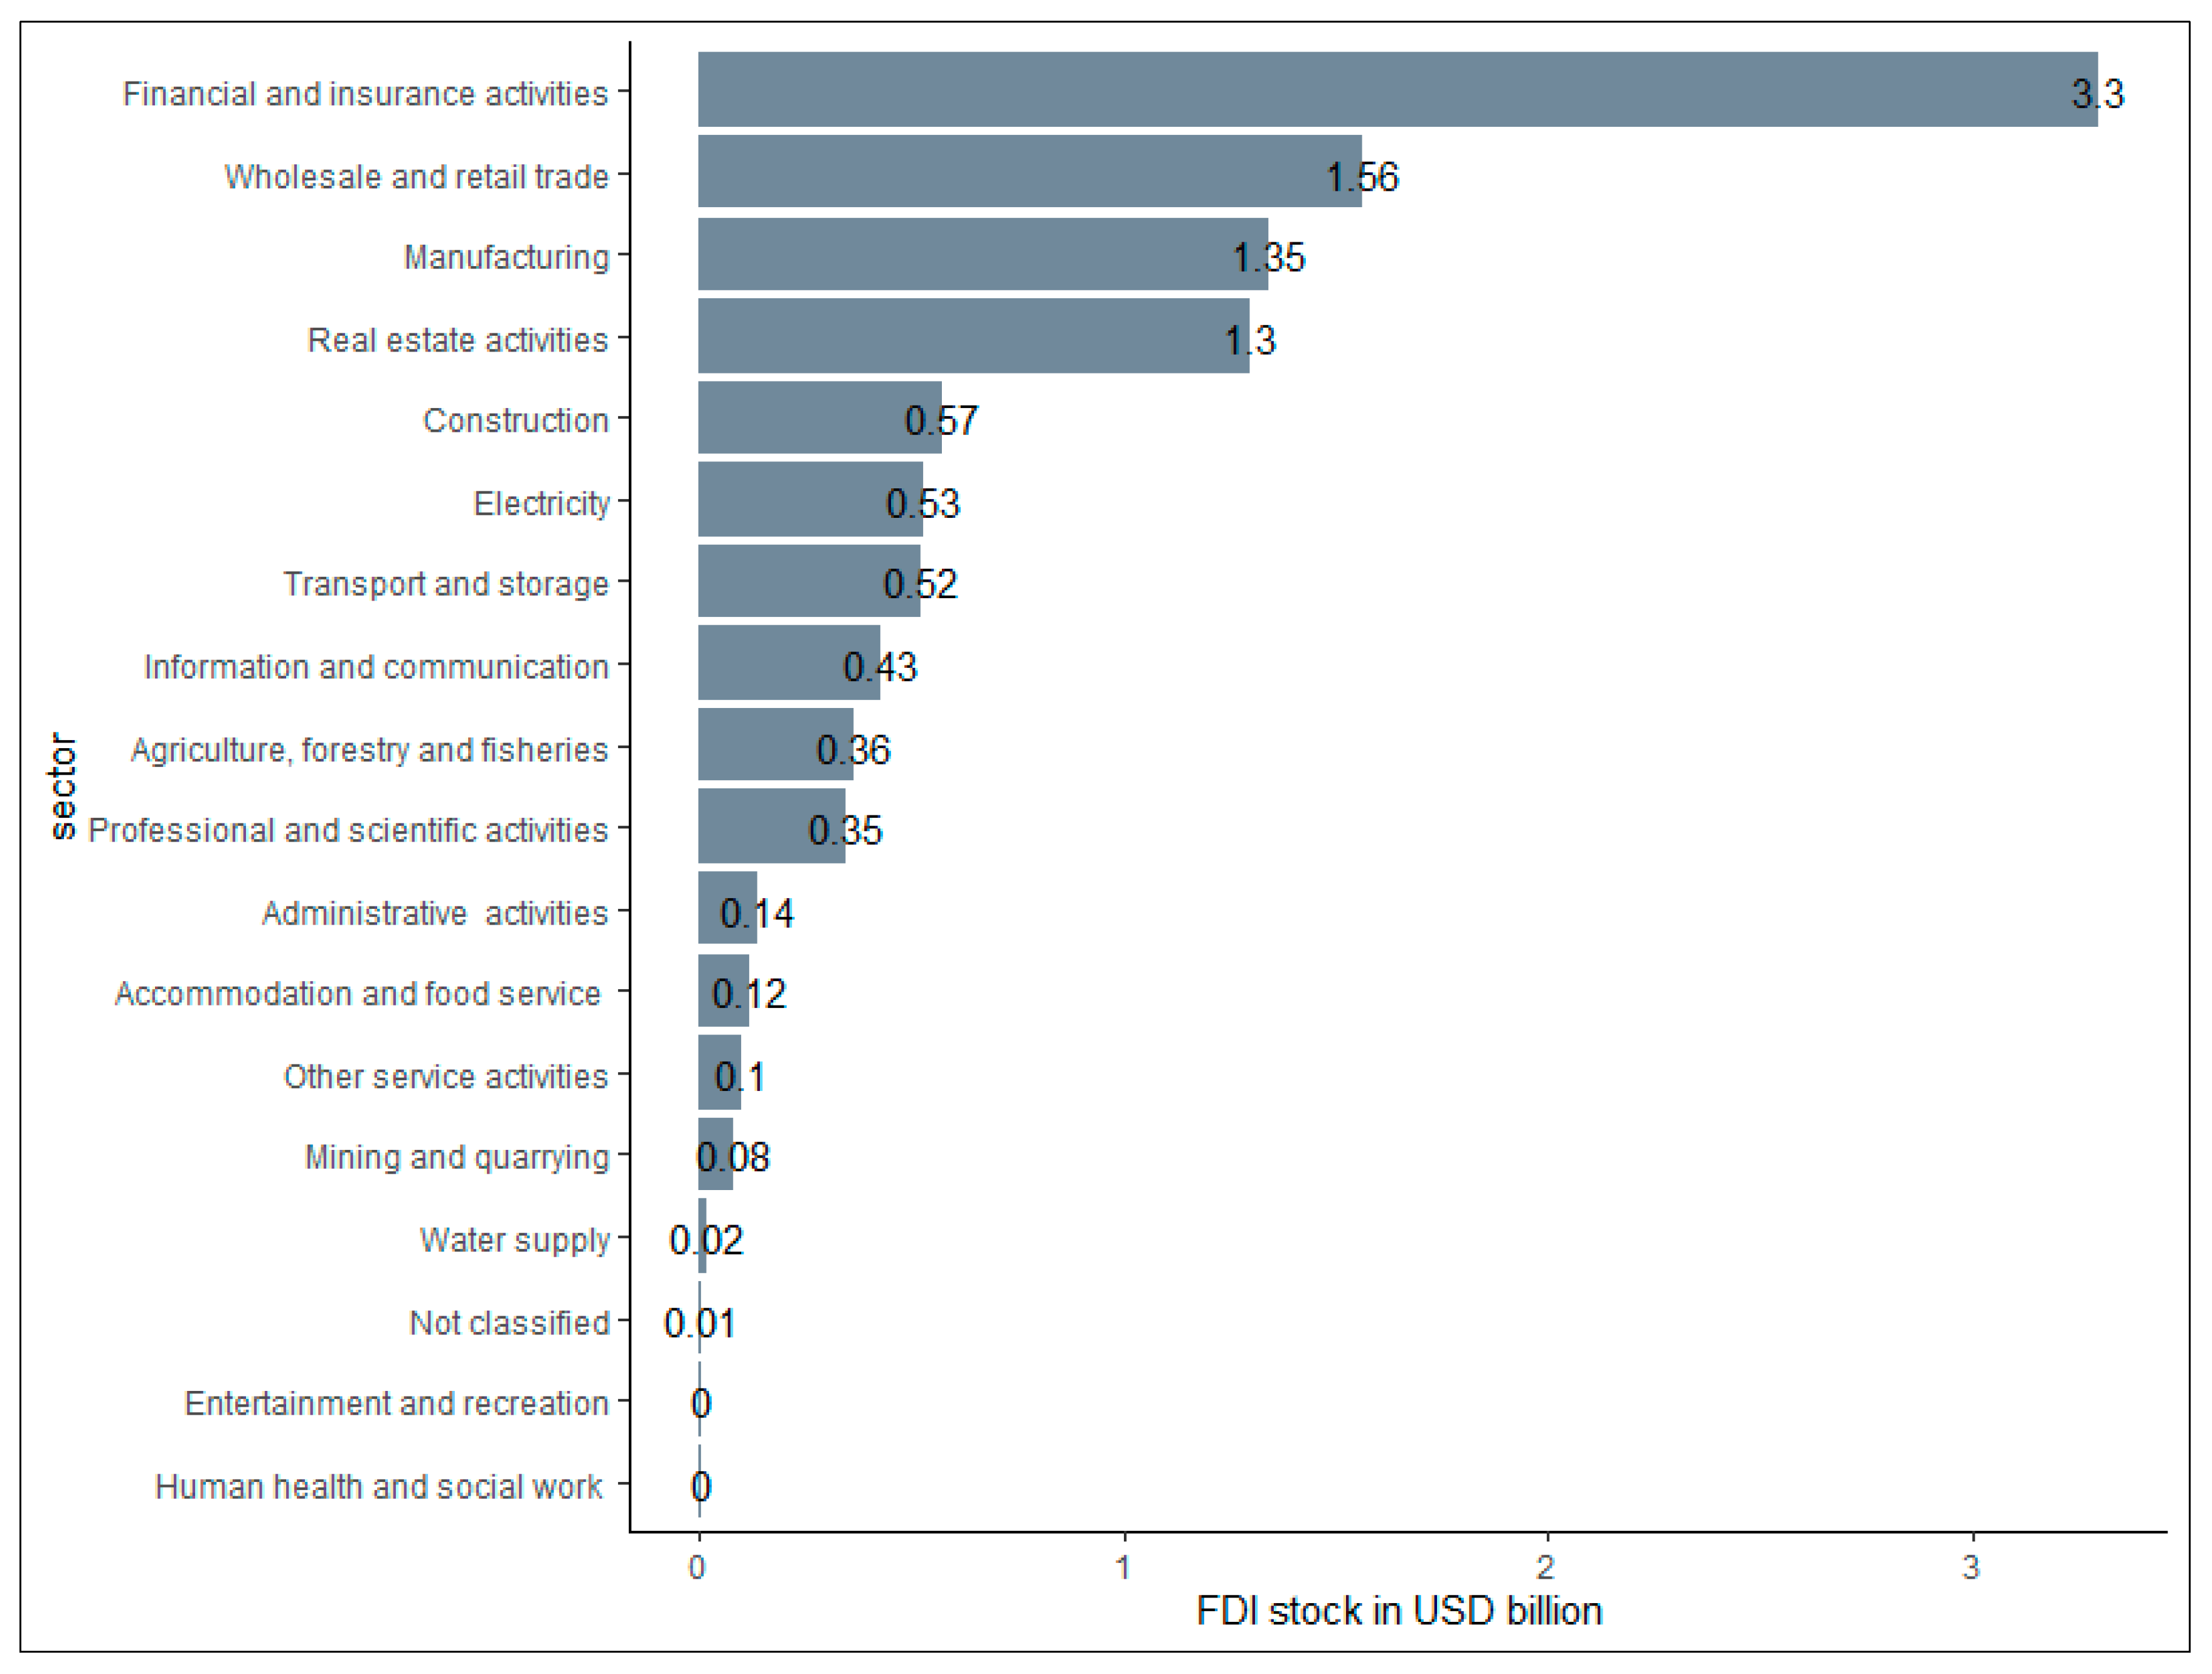
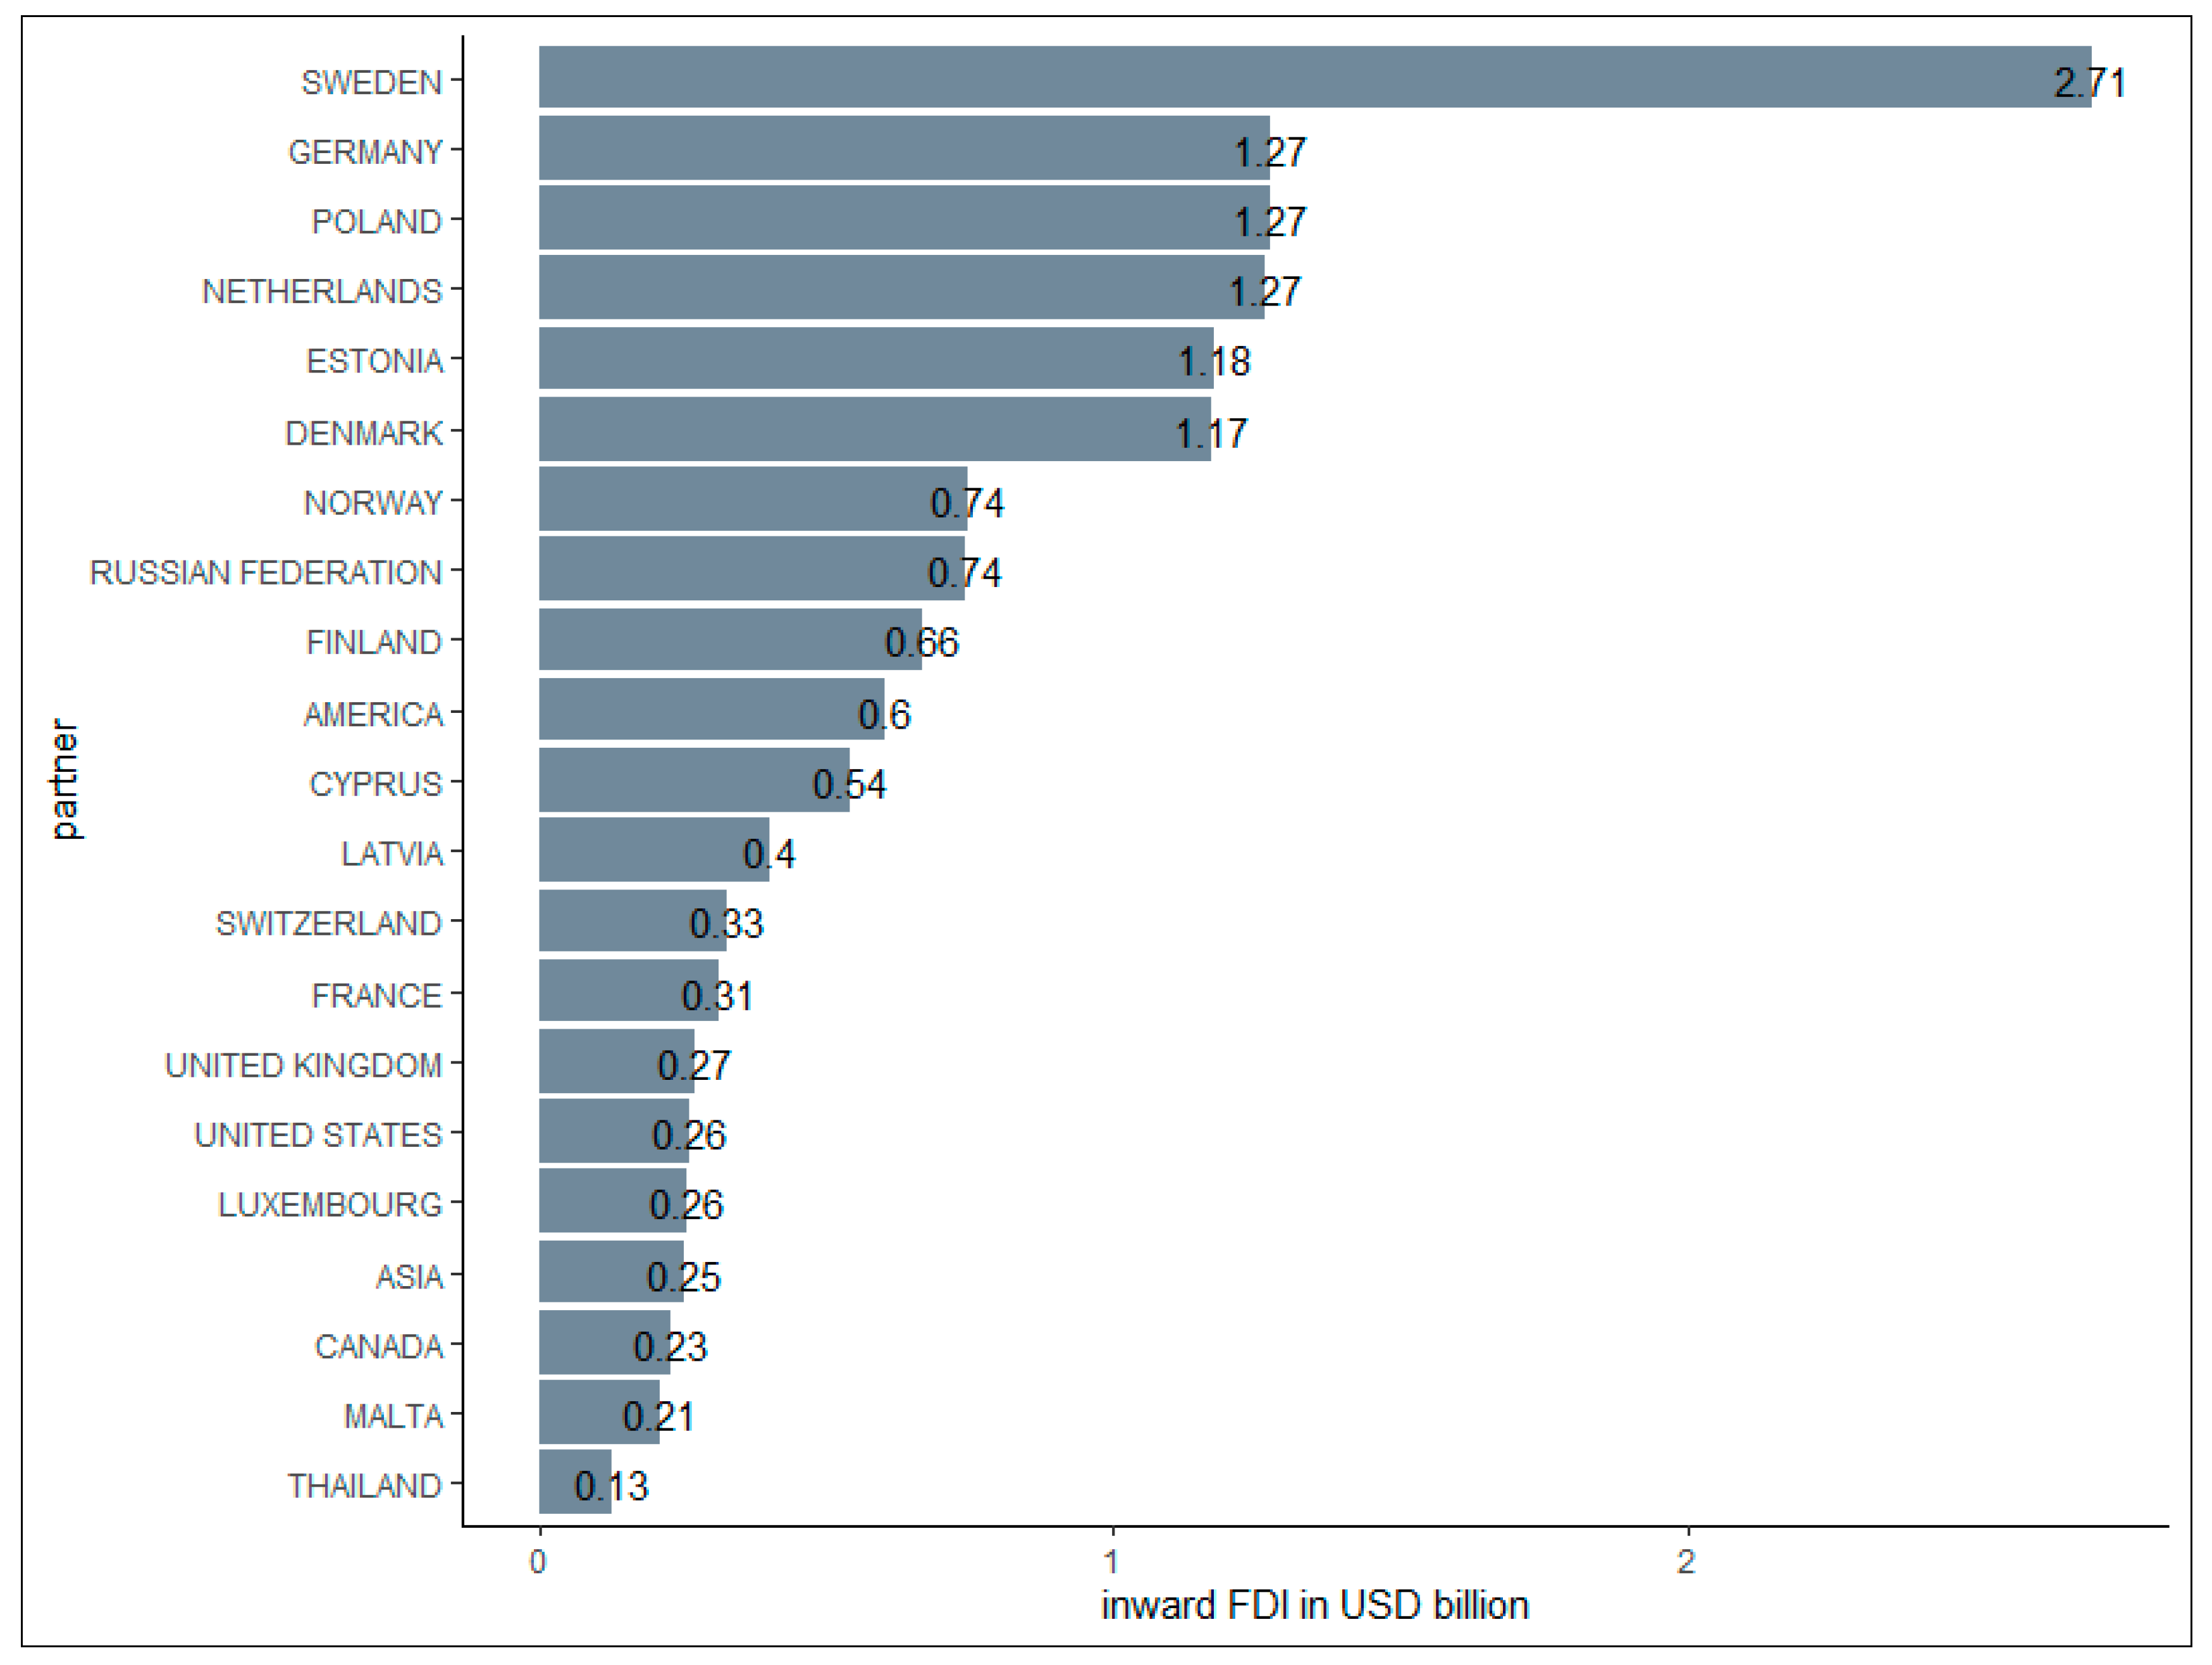
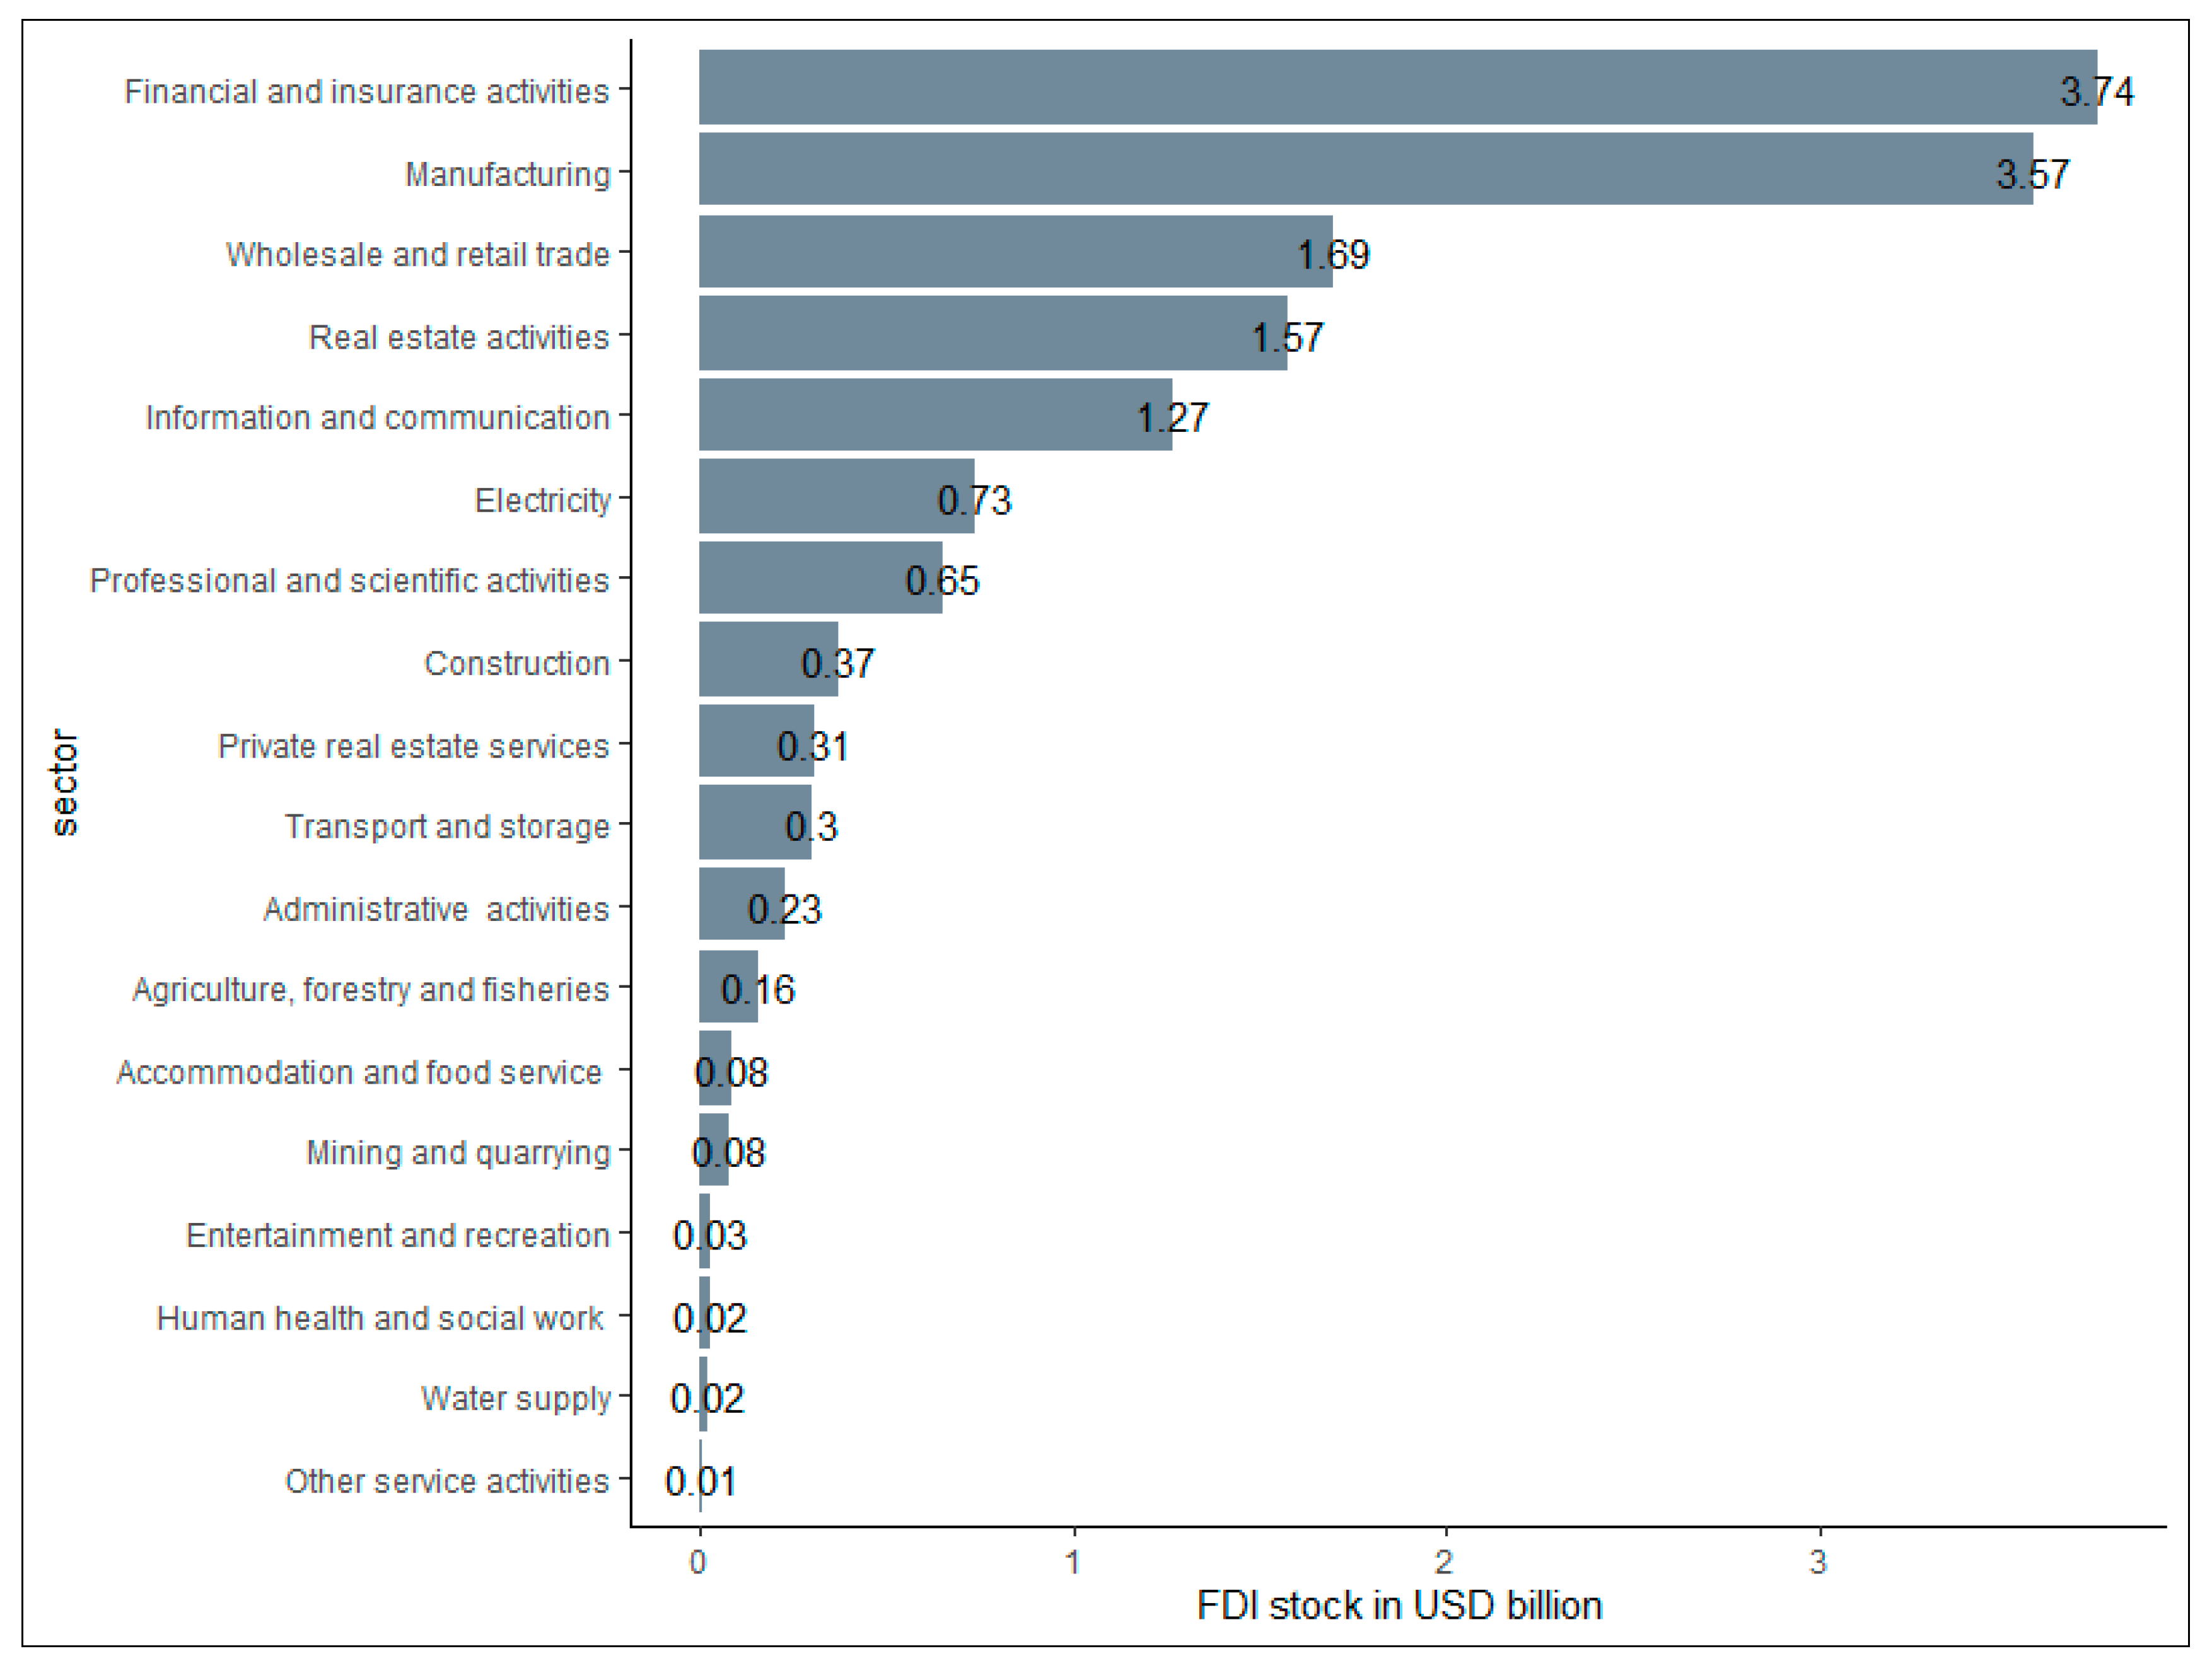
Inward FDI in the Baltics originates from three groups of countries: (a) EU/EFTA members: Sweden, Finland, Norway; (b) round-trip partners: Cyprus, The Netherlands, Luxembourg; (c) non-EU members: United States, Russia, Ukraine. Figure A2, Figure A4 and Figure A6 (Appendix A) picture average FDI stocks for the leading investment partners. In terms of sectoral distribution of inward FDI, the majority of stock is concentrated in sectors such as financial and insurance activities (Estonia: USD 5.17 billion, Latvia: USD 3.3 billion, Lithuania: USD 3.74 billion), manufacturing (Estonia: USD 1.35 billion, Latvia: USD 1.3 billion, Lithuania: USD 3.57 billion), and real estate services (Estonia: USD 2.68 billion, Latvia: USD 1.35 billion, Lithuania: USD 1.57 billion). The reported data do not exactly follow the typical set of MNEs’ operations found in developing countries (Caves 2007), as MNEs do not perform any form of resource-based activities, nor pursue large-scale manufacturing projects. The existing affiliates have mostly focused on serving the domestic markets. Figure A1, Figure A3 and Figure A5 (Appendix A) illustrate the detailed sectoral distribution of inward FDI (Bank of Estonia 2020; Bank of Latvia 2020; Bank of Lithuania 2020).
The main goal of this paper is to lay the empirical groundwork for the study of location choice of foreign MNEs in Estonia, Latvia, and Lithuania using national bilateral FDI stock data across 2004–2017. We apply a Bayesian model averaging (BMA) estimation technique that enables us to investigate a diverse set of possible factors and select the most promising candidate variables in explaining the motives behind inward FDI. The use of BMA is not entirely new to the economic literature (Sala-i-Martin et al. 2004), although it has been becoming increasingly popular in empirical study topics related to FDI; examples are Blonigen and Piger (2014); Camarero et al. (2019); Camarero et al. (2021); and Beck (2021). Further, we consider counter-factual estimations using empirical findings of Damgaard et al. (2019) regarding the presence of round-trip FDI, which refers to investments made due to corporate tax evasion, rather than real-world investments, from partners such as Honk Kong SAR, Luxembourg, and The Netherlands.
The paper’s contribution to the literature is threefold. First, this paper offers the very first empirical treatment of MNEs’ location choice in the Baltic economies. Second, we contribute to the literature that uses BMA as a primary estimation methodology and provide novel empirical evidence using bilateral inward FDI stock data. Finally, we contribute to the study of the role of round-trip FDI as Baltic stock data provides us with the ability to experiment with the sample composition of investment partners.
The findings of this paper are multiple. First, we find that the modus operandi of foreign MNEs is of a vertical nature, which is due to the existing cost differences in factor endowments: skilled labor and physical capital. Second, the existing trade and market barriers have facilitated “tariff-jumping” FDI from non-EU/EFTA members. Third, the presence of round-trip FDI partners results in mixed horizontal and vertical motives behind inward investments.
2. Literature Review
The research on inward FDI in the Baltics has focused on the spillover effects from MNEs’ market entry after their post-Soviet independence in the early 1990s. In Estonia, early studies have examined possible technology and knowledge transfers from foreign MNEs to indigenous firms. It was found that foreign investors played an important role in providing new production capacities, technology, know-how, as well as cooperation links to domestic firms (Borsos 1997). Further, foreign MNEs significantly facilitated job creation during the first decade of Estonia’s transition to a market economy (Mickiewicz et al. 2000). In the early 2000s, foreign MNEs were considering significant vertical FDI investments in anticipation of Estonia’s accession to the European Union (Reiljan et al. 2001). In addition, the potential economic spillovers and specifics of market entry were considered in the context of regional integration between Estonia, Russia, and the other Scandinavian economies (Borsos and Erkkilä 2002; Ehrlich et al. 2002; Hunya 2004). More related empirical work of Vahter (2004) studied the link between MNEs and labor productivity using the firm-level panel on manufacturing industries of Estonia across 1996–2001 using random and fixed effects OLS and Heckman estimators. This study concluded that export-oriented MNEs had on average much lower labor productivity levels than the domestic market-oriented ones. In addition, it found no horizontal spillovers from inward FDI to domestic firms in Estonia.
In Latvia, Titarenko (2006) analyzed the impact of FDI in the context of a crowding-in and crowding-out econometric model across 1995–2004 using quarterly stock data and OLS. The conclusion was that there was a significant crowding-out effect from inward FDI, which can be attributed to two primary reasons: first, the relatively low intensity in Latvia, and second, that inward FDI was concentrated in the most dynamically developing sectors such as telecommunications, retail, banking, etc. Hence, due to the oligopolistic nature of these markets or the ability of foreign MNEs to merge and acquire local firms, MNEs were able to outcompete and/or replace incumbent firms. Additionally, Latvia was part of a cross-country panel data study of the CEE economies, which applied the vector autoregression (VAR) model to study the relationship between GDP and FDI. The authors found that FDI was an important determinant for economic growth in the new post-2004 enlargement of EU member states (Cicak and Soric 2015).
While there have not been any studies in Lithuania, it was considered in the empirical FDI studies with a cross-country focus, including firm-level surveys (Kotilainen and Nikula 2010), and studies on EU accession (Güngör and Binatli 2010), and economic growth (Irandoust 2016; Simionescu 2018). The abovementioned studies relied on the extensive use of FDI flows, and a plethora of estimators, e.g., generalized method of moments (GMM), VAR, and Bayesian linear regressions. While these studies emphasize the fact that FDI has played an important role in facilitating economic growth and development in Lithuania, the estimation models have largely been data-driven and did not provide a link between the existing MNE theory and empirical results in their efforts to identify the effects behind inward FDI in Lithuania.
While the presented literature has shed some light on the discussion of the role of inward FDI in Estonia, Latvia, and Lithuania, only the studies of Vahter (2004) and Titarenko (2006) provide a convincing empirical treatment of the related topics. Little has been accomplished in understanding the motives behind inward FDI, the role of factor endowments, and subsequent European integration of the Baltic economies. Besides, to the best of our knowledge, no studies have examined the role of round-trip partners in inward FDI in the Baltics. Henceforth, the contribution of this article is threefold. First, we provide a comprehensive investigation of MNEs’ location choice among the Baltic countries using a knowledge-and-physical capital (KPC) model, which we extend to study the variety of unexplored factors that may or may not affect the investment decisions of foreign MNEs and present the treatment of the role of round-trip FDI vis-à-vis the Baltic economies and investigate the sensitivity of empirical results.
3. Theoretical Framework
The international economics literature distinguishes between two primary motives for foreign investment of MNEs: horizontal and vertical (Markusen 2013; Davies and Markusen 2020). In the horizontal type of FDI, firms face the trade-off between maximizing proximity to customers and concentrating production to achieve scale economies. In contrast, vertical-type FDI is related to countries’ differences in relative factor endowments. From the theoretical perspective, the early research efforts on modeling FDI focused on explaining multinational activity between countries, which were similar in terms of per capita income and economic development. Initial theoretical models of horizontally-motivated FDI were proposed by Krugman (1983) and Markusen (1984). In parallel, Helpman (1984) and Helpman and Krugman (1985) proposed the first models of vertically-motivated FDI arising as a result of differences in factor proportions between economies with different stages of development. Subsequently, horizontal and vertical reasons for FDI were integrated into a single hybrid analytical framework called the knowledge-capital (KC) model proposed by Markusen (2002). One of the main contributions of the KC model to the empirical literature on MNEs’ location choice is that it has made possible to differentiate between the pure horizontal and vertical reasons for FDI with the use of endowment characteristics. In our paper, we adopt an extension of the KC model, which features physical capital as a factor of production (Bergstrand and Egger 2007). This choice was made because the ongoing accumulation of physical capital stock remains an important economic driver for the Baltic economies due to their Soviet legacy.
The model’s three core assumptions are: first, services of knowledge-based activities such as R&D, patents, and know-how can be geographically separated from physical production and supplied to operating facilities when needed at low cost. Second, the knowledge-based activities are skilled and labor-intensive relative to production. The first two assumptions imply the vertical fragmentation of MNE operations, where skilled-intensive facilities are located in the advanced human capital-abundant economies, while actual production takes place elsewhere. Finally, the knowledge-based services have a partial joint-input characteristic, so that they can be used at the same time by many production facilities. This creates firm-level economies of scale and motivates the horizontal investments that serve the domestic market with principally similar goods to what is available in the parent country. Thus, the resulting trade interaction between countries in the model is endogenous.
The model assumes two homogeneous goods ( and ), three countries (, , and ), and three homogeneous production factors: unskilled labor (), skilled labor (), and physical capital (). and are internationally immobile, while is mobile in the sense that firms will endogenously choose the optimal allocation of domestic physical capital between and locations to maximize profits. Introduction of a Rest of the World helps in explaining the “complementarity” of bilateral affiliate sales and trade with respect to country pairs’ economic size and similarity, as bilateral FDI empirically tends to be maximized when the home country’s GDP is larger than the host’s. This allows two-country H-MNEs, and three-country H-MNEs, to emerge in the equilibrium.
The setup of firm headquarters requires home skilled labor, while the setup of a plant requires the home country’s physical capital. This assumption permits the “coexistence” of H-MNEs and N-type firms in the equilibrium for two identically sized countries. Good is unskilled labor-intensive and requires physical capital, and is produced under constant returns to scale in a perfectly competitive industry, while good is skilled labor-intensive and produced under increasing returns to scale at the plant level subject to oligopolistic competition à la Cournot with free market entry and exit. With such market structure, there are several types of firms that can arise in the equilibrium: national firms (N-type firms) that serve domestic market and export abroad, horizontally-integrated firms (H-MNEs) with two plants in both and countries with no trade, and vertically-integrated firms (V-MNEs) that maintain headquarters and plant in different countries with exports from an affiliate to a parent.
The cross-country distribution of three types of firms is driven by country-pair endowment characteristics. For example, N-type firms arise in the equilibrium if one of the countries is relatively larger and trade costs are low, which encourages domestic production and exports to a smaller country. H-MNEs become important once both and are similar in size and factor endowments, while trade costs are high. Firms will find it advantageous to locate themselves in the country and serve its domestic market to avoid transport and trade costs. However, if countries have different factor endowments and trade costs are low, firms prefer to specialize vertically and leverage the variation in skilled and unskilled labor between and . Finally, the model allows all three types of firms to co-exist in the equilibrium. Therefore, we use differences in physical and human capital endowments, output characteristics, bilateral trade and investment barriers, and distance between countries as a base for our analysis, and propose the following research hypotheses for empirical analysis:
Hypothesis 1.
Estonia, Latvia, and Lithuania primarily attract V-type MNEs due to the existing cost differences in skilled labor and physical capital between the Baltic and EU or EFTA countries.
Hypothesis 2.
The presence of round-trip partners’ stock in the pooled estimation leads to an overestimation of horizontal investment motive for the Baltic countries (as both feature similar output levels).
Hypothesis 3.
The EU’s ongoing efforts to facilitate signing of bilateral free trade agreements have had an impact on inward FDI across the Baltics.
4. Data and Methodology
This section introduces our data and empirical methodology for hypotheses verification. Our dependent variable (inward FDI stocks) is measured using equity stock data owned by foreign firms. The data were collected from the annual reports of the respective national central banks (Bank of Estonia 2020; Bank of Latvia 2020; Bank of Lithuania 2020). Our scope of analysis covers the period between 2004 and 2019. Figure A1 (Appendix A) illustrates the average annual inward FDI stock in Estonia, Latvia, and Lithuania. We used equity stock data because they represent “the long-run factors that explain the distribution of FDI” (Blonigen and Piger 2014, p. 782). In comparison to net flow data, which are often subject to frequent fluctuations, influence of debt instruments, and higher distortion due to round-trip FDI, the stock data may better reflect the postulated theoretical relationship rather than the sum of equity and debt instruments that are frequently used in the FDI literature (Cieślik 2019). The complete list of investment partners used in the estimation is provided in Table A1, Table A2 and Table A3 (Appendix A).
Data on market size and relative production factor endowments were sourced from the most recent version of the Penn World Table (PWT) database (Feenstra et al. 2015). Distance-related costs between Estonia, Latvia, Lithuania, and MNEs’ parent countries are expressed as a geographical distance, which is measured as the distance between the host country capital and particular partner countries, expressed in kilometers. The distance data were sourced from the Centre d’Etudes Prospectives et d’Informations Internationales (CEPII) database. This baseline dataset was then augmented with additional explanatory variables that proxied market access barriers, domestic policies, population characteristics, trade agreements, and geographic features (Gygli et al. 2018; Heritage Foundation 2020; The World Bank 2020). While we tried to consider an exhaustive contextual list of the candidate covariates, it is entirely permissible that our analysis may have missed the effects of certain domestic policies in the selected economies. The final sample sizes for Estonia, Latvia, and Lithuania were respectively 465, 548, and 742. The detailed description of explanatory variables is provided in Table A4 (Appendix A).
We extended our analytical framework of the KPC model to include a finite model space of ~67 million competing models. The estimating equation in the generalized form is specified as follows:
where is the model space and contains competing models, is a p dimensional binary vector to identify competing models, is the n-dimensional vector of observations for the dependent variable (inward FDI stock for a given host), is the matrix of potential FDI determinants in , is the vector of linear regressors.
Alternative model comparison was based on the posterior probability that was the true model that generated the data. Formally, the model selection problem was defined by the Bayes theorem:
where is the researcher’s prior probability that is the true model and is the integrated likelihood with respect to the prior :
Posterior inclusion probabilities for each competing variable can be summarized:
The advantage of the “robust prior” is the ability to have closed-form Bayes posterior inclusion probabilities for the employed covariates in integral (3), as well as the statistical robustness of the obtained parameters for covariates.
The prior distribution over the model space is the Scott–Berger prior as it allows control for multiplicity with the prior probabilities (Scott and Berger 2006). Its function is to assign a uniform probability to models of the same dimension . The Scott–Berger prior is defined as:
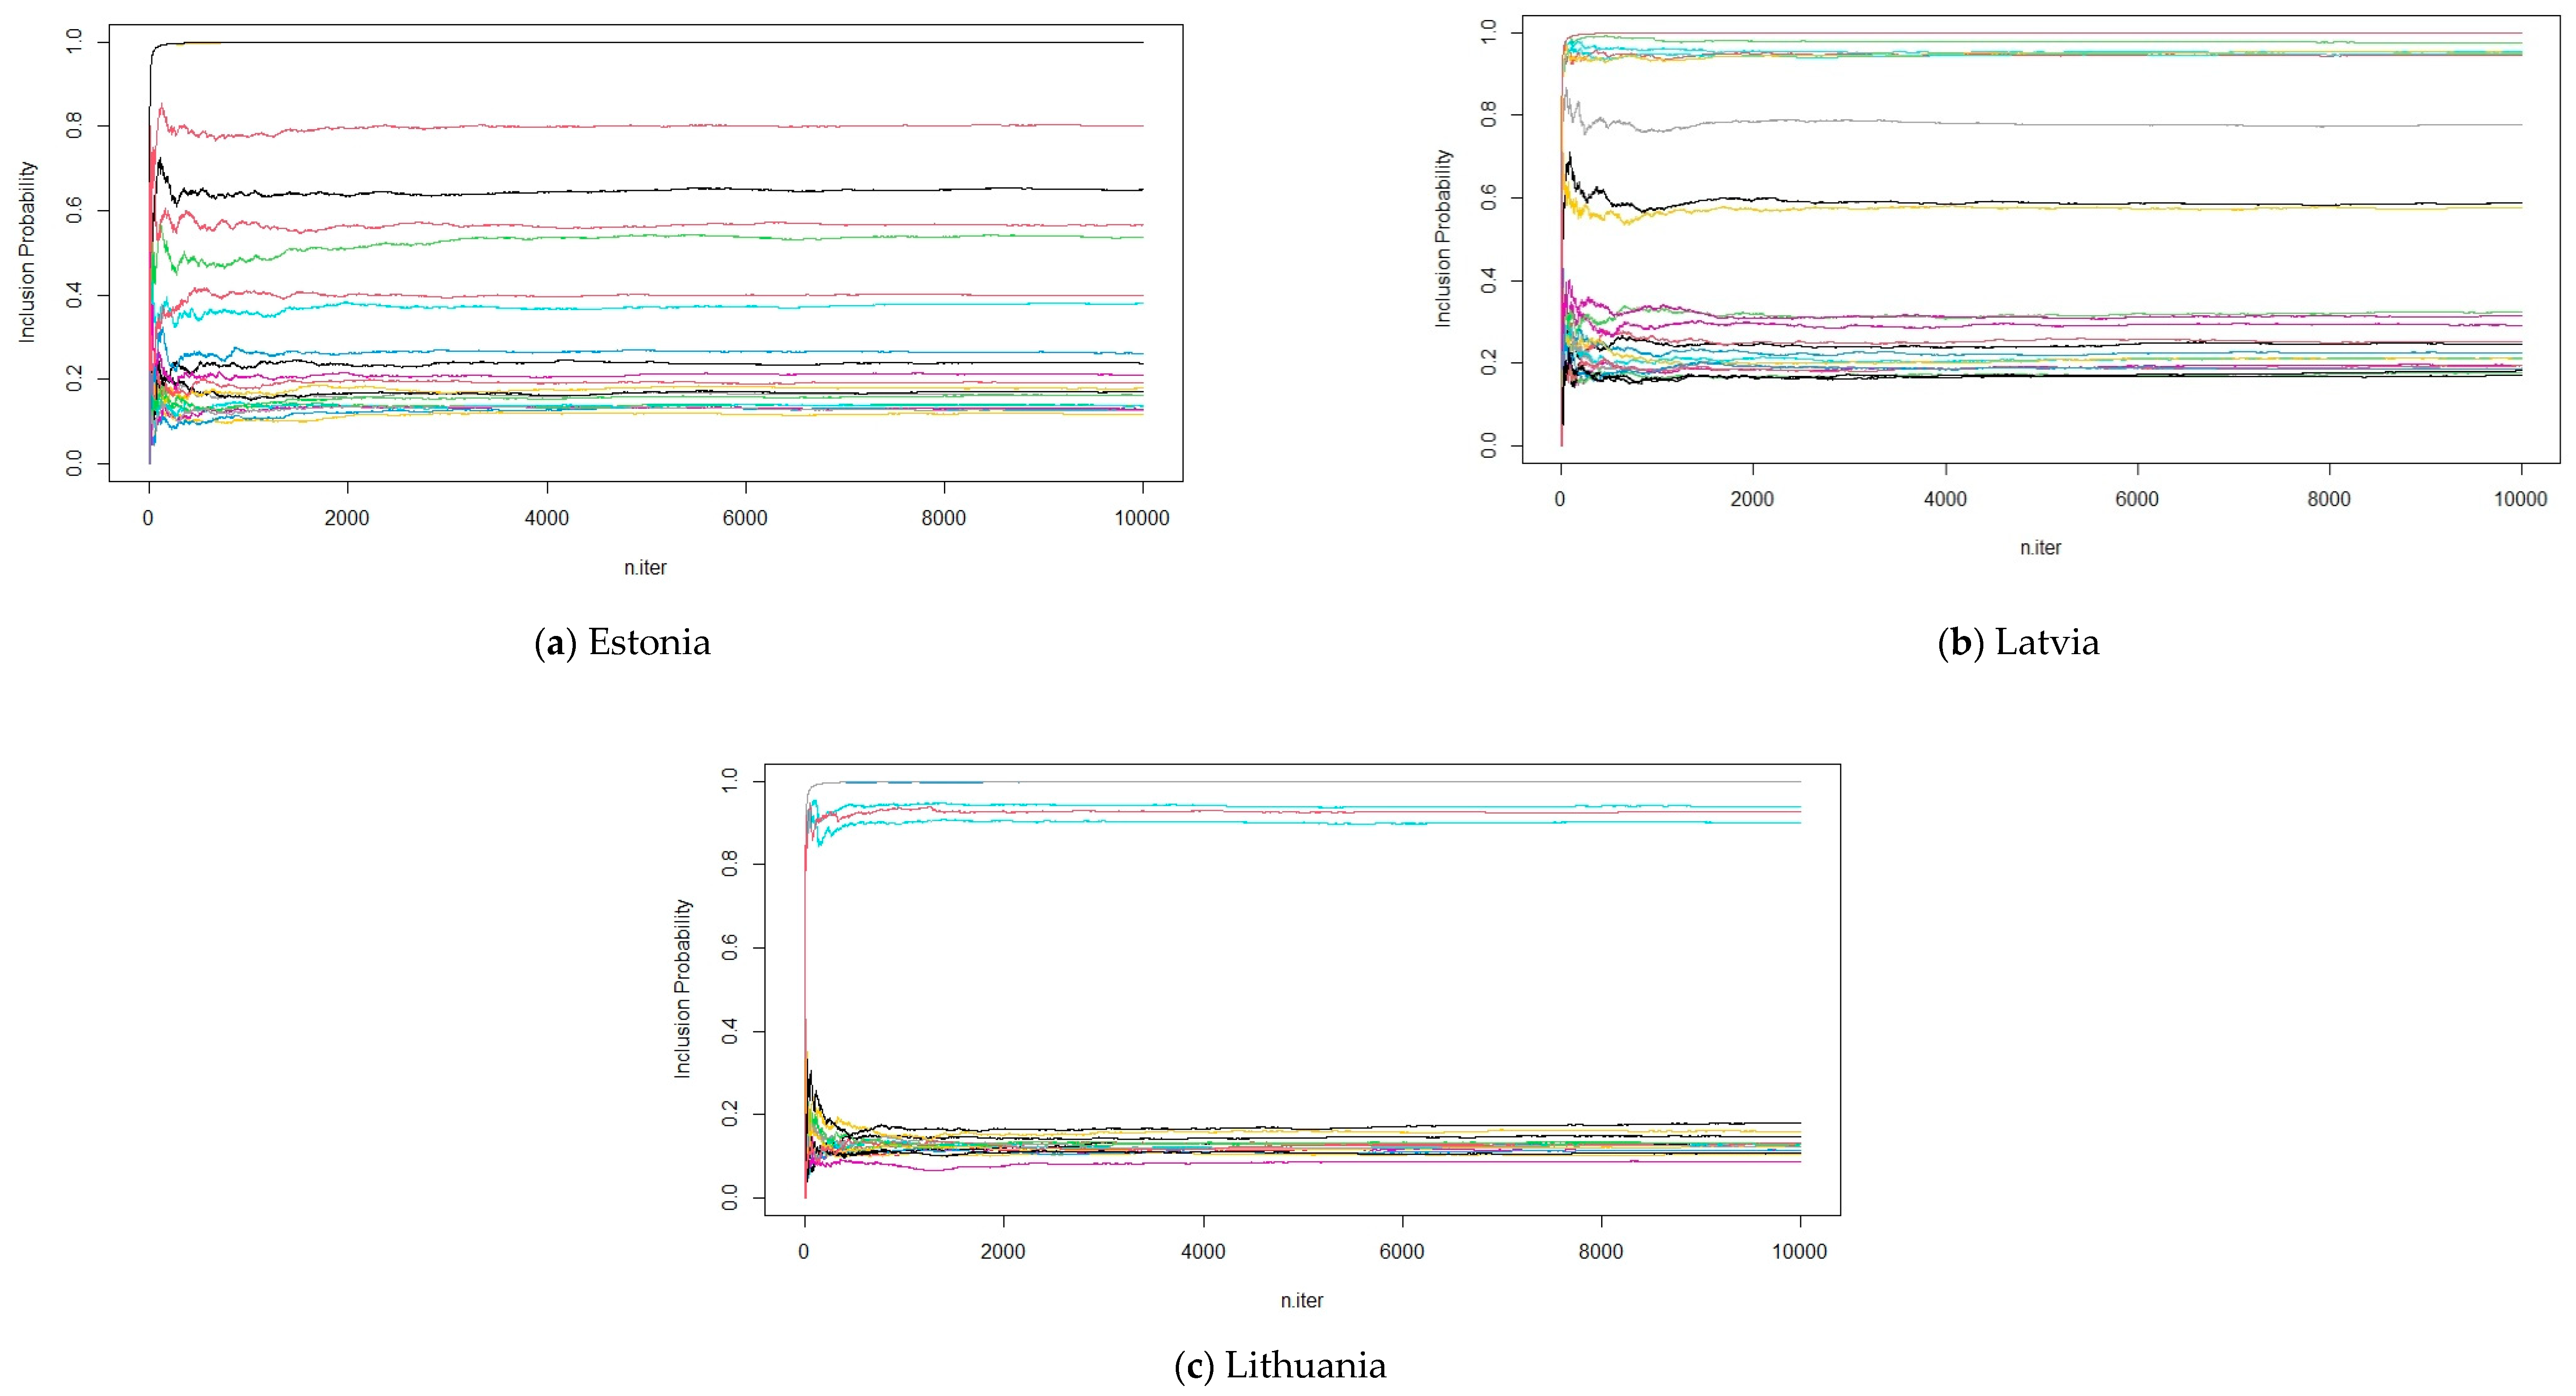
Additional approximations were done using the Gibbs sampling scheme which is built around the Markov chain Monte Carlo (MCMC) algorithm that samples the resulting model space and yields the posterior inclusion probabilities of the covariates. We ran through 100,000 iterations, and the probabilities stabilized between the 4000 and 6000 mark. The detailed evolution of the inclusion probabilities with the iterations in Gibbs sampling is illustrated in Figure A2 (Appendix A). The proposed econometric approach is implemented in R using statistical package BayesVarSel (Forte et al. 2018). We rely on the function GibbsBvs to obtain reported posterior inclusion probabilities of covariates based on the methodology by Garcia-Donato and Martinez-Beneito (2013).
5. Empirical Analysis
In this section, we report and discuss our estimation results from the BMA analysis of the potential determinants of inward FDI. We report results for the Baltic countries and primarily investigate the vertical motive, the role of the EU, EFTA, and offshore centers in driving inward FDI stocks. Hence, our interest lies in the two groups factors: (a) factors that point to the vertical nature of inward FDI, and (b) factors that may impact the degree of market access, such as entry into the common currency union, external EU FTA agreements, etc. Firstly, we estimate the specification (1) discussed in Section 4 with all of the investment partners present (general case). The results are structured as follows: the reported posterior inclusion probabilities (PIP) reflect the marginal importance of different covariates of inward FDI. As with the existing body of the empirical work on BMA application (Raftery 1995), we consider robust FDI determinants those variables having a PIP above the recommended threshold of 50%. Obtained PIP value for a regressor from 50 to 75% is considered weak, from 75 to 95% positive, from 95 to 99% strong, and >99% very strong. When combined together, variables with an inclusion probability greater than 50% (0.5 in the Figures) define a median probability model (MPM) and under general conditions, the MPM can be considered as an optimal model for analytical purposes and prediction (Barbieri and Berger 2004). Because we relied on the log-linearized model specification for the BMA analysis, our results may suffer from selection bias (Eicher et al. 2012). Further, one of the significant drawbacks of the method is the non-endogeneity assumption on the covariates; hence, due to possible endogeneity issues, our results should be treated with caution. The obtained PIP values for Estonia, Latvia, and Lithuania are presented in Figure 1, Figure 2, Figure 3, Figure 4, Figure 5 and Figure 6. The detailed numerical outputs of PIPs can be found in Table A5, Table A6 and Table A7 (Appendix A). We also report joint measures for our general cases in order to emphasize the relationship between factor endowments and round-trip FDI; outputs of jointness matrices are available in Table A8, Table A9 and Table A10 (Appendix A). The methodology of jointness calculation is based on Ley and Steel (2007).
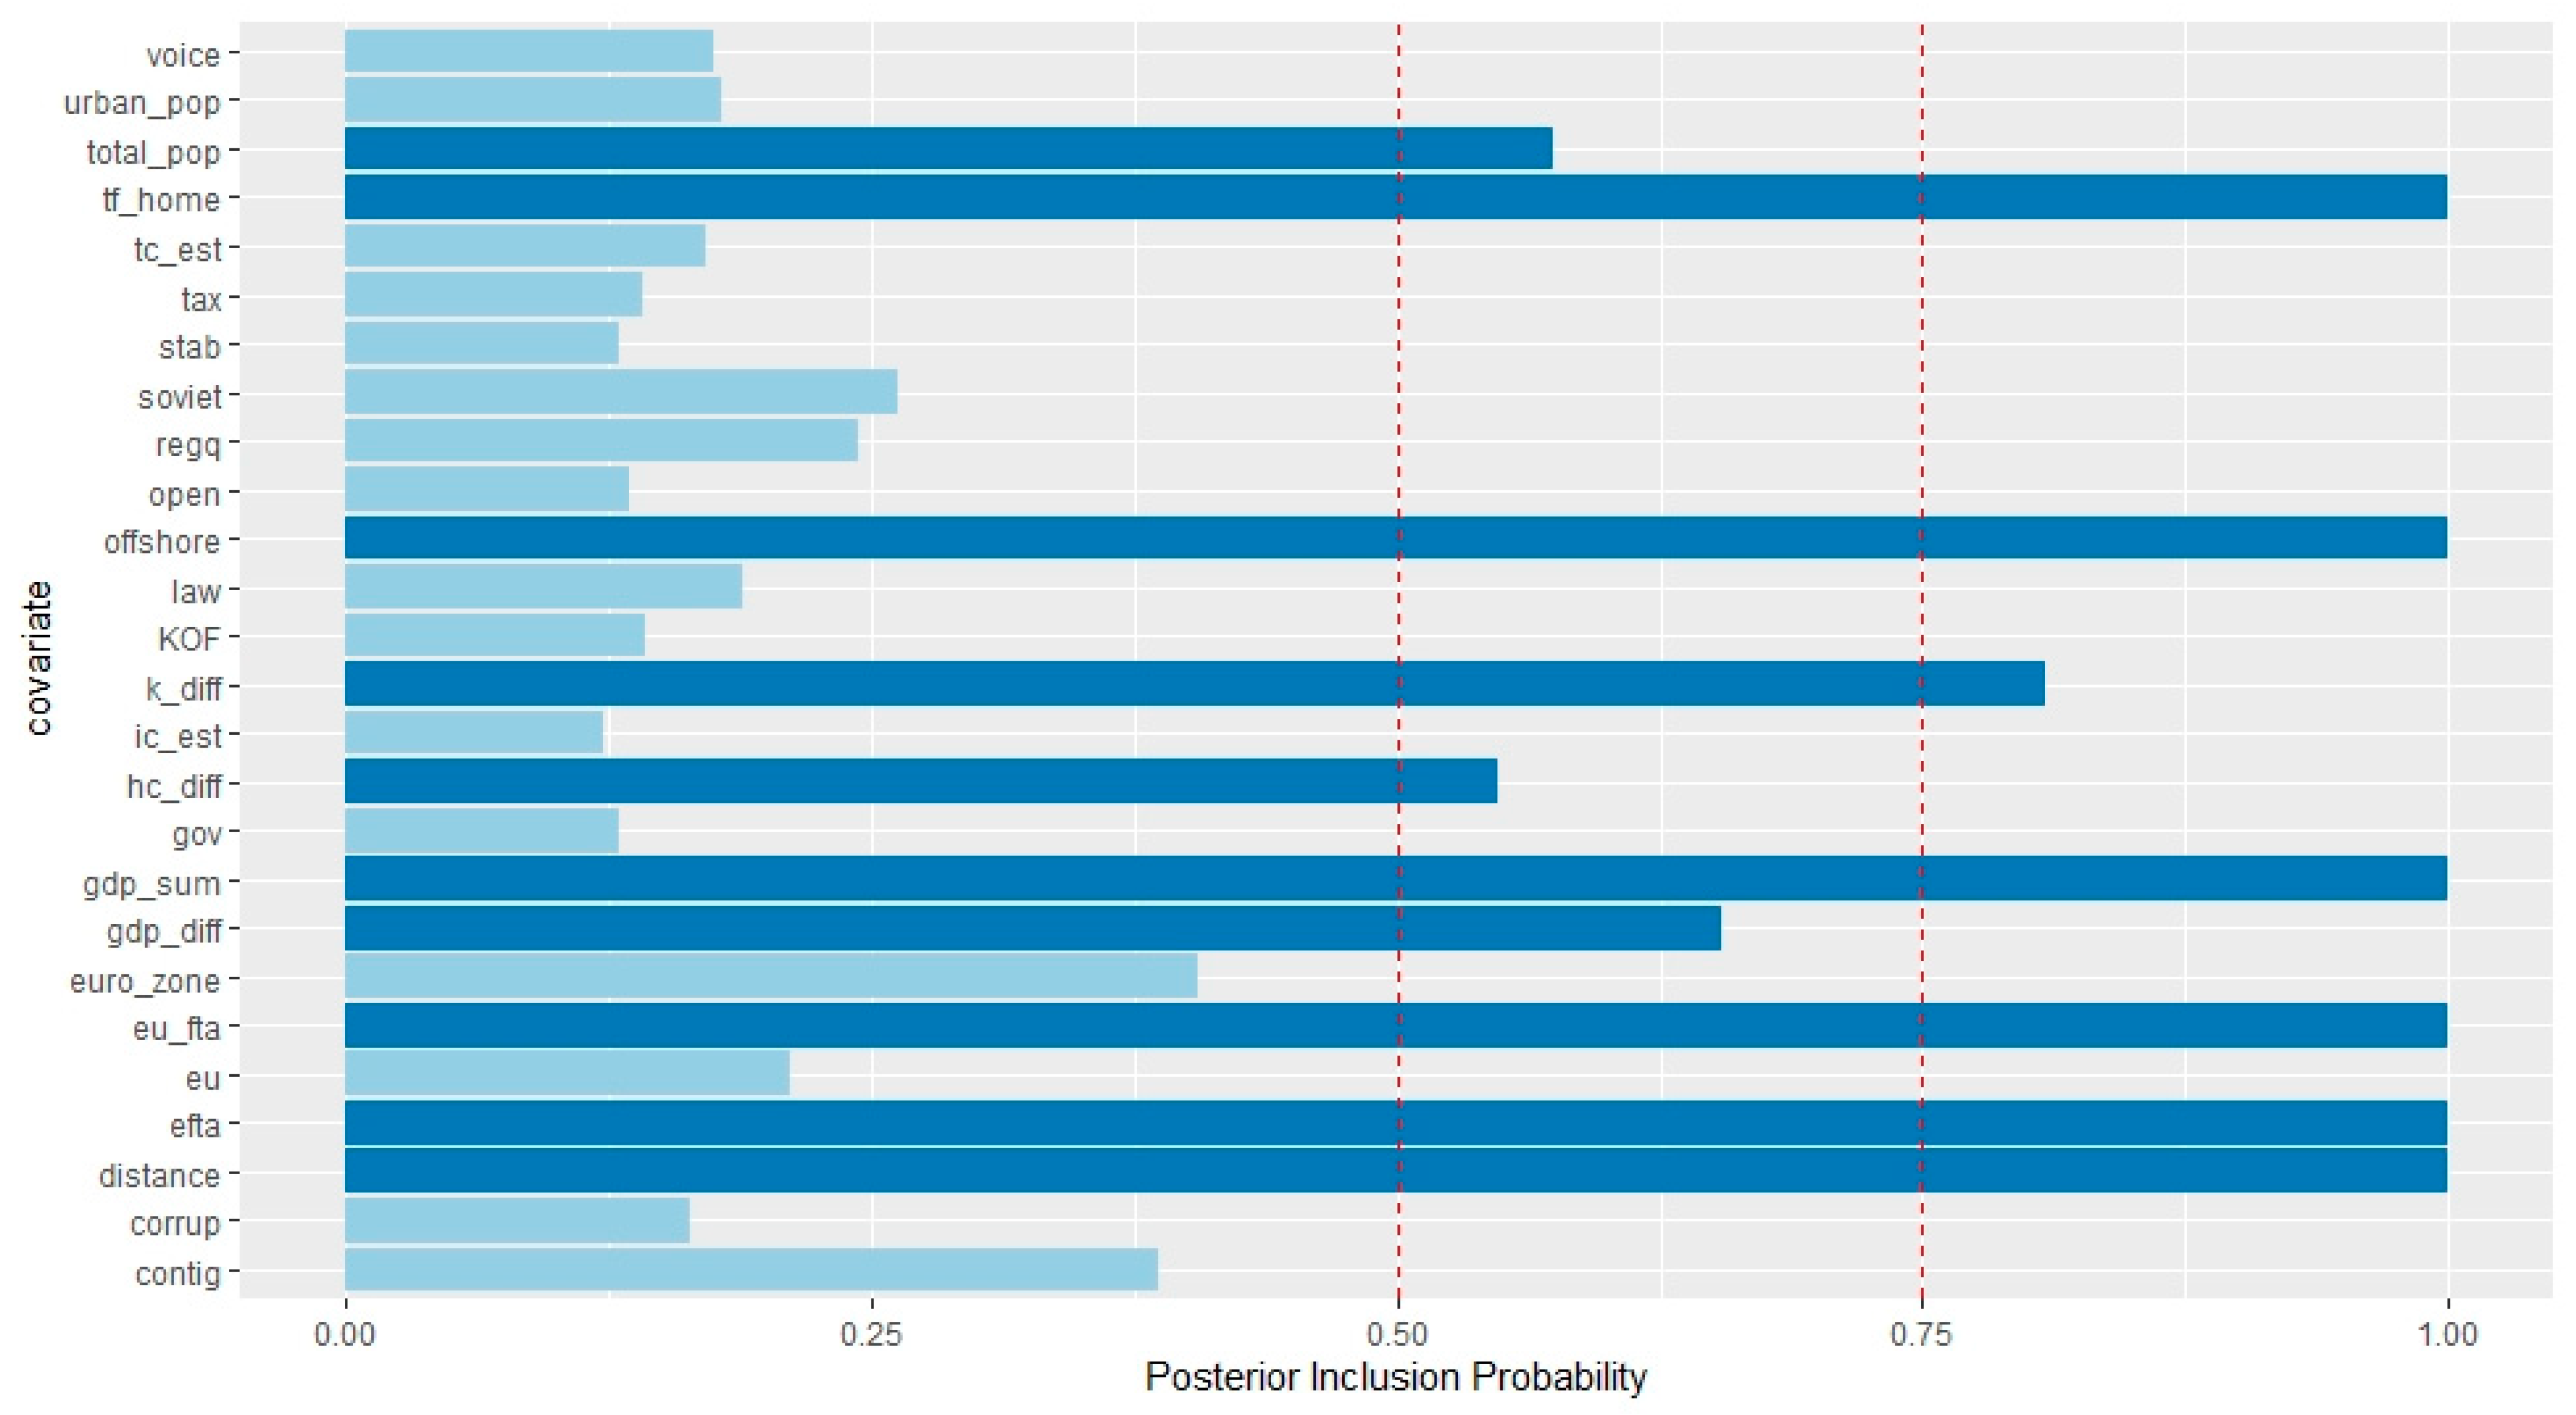
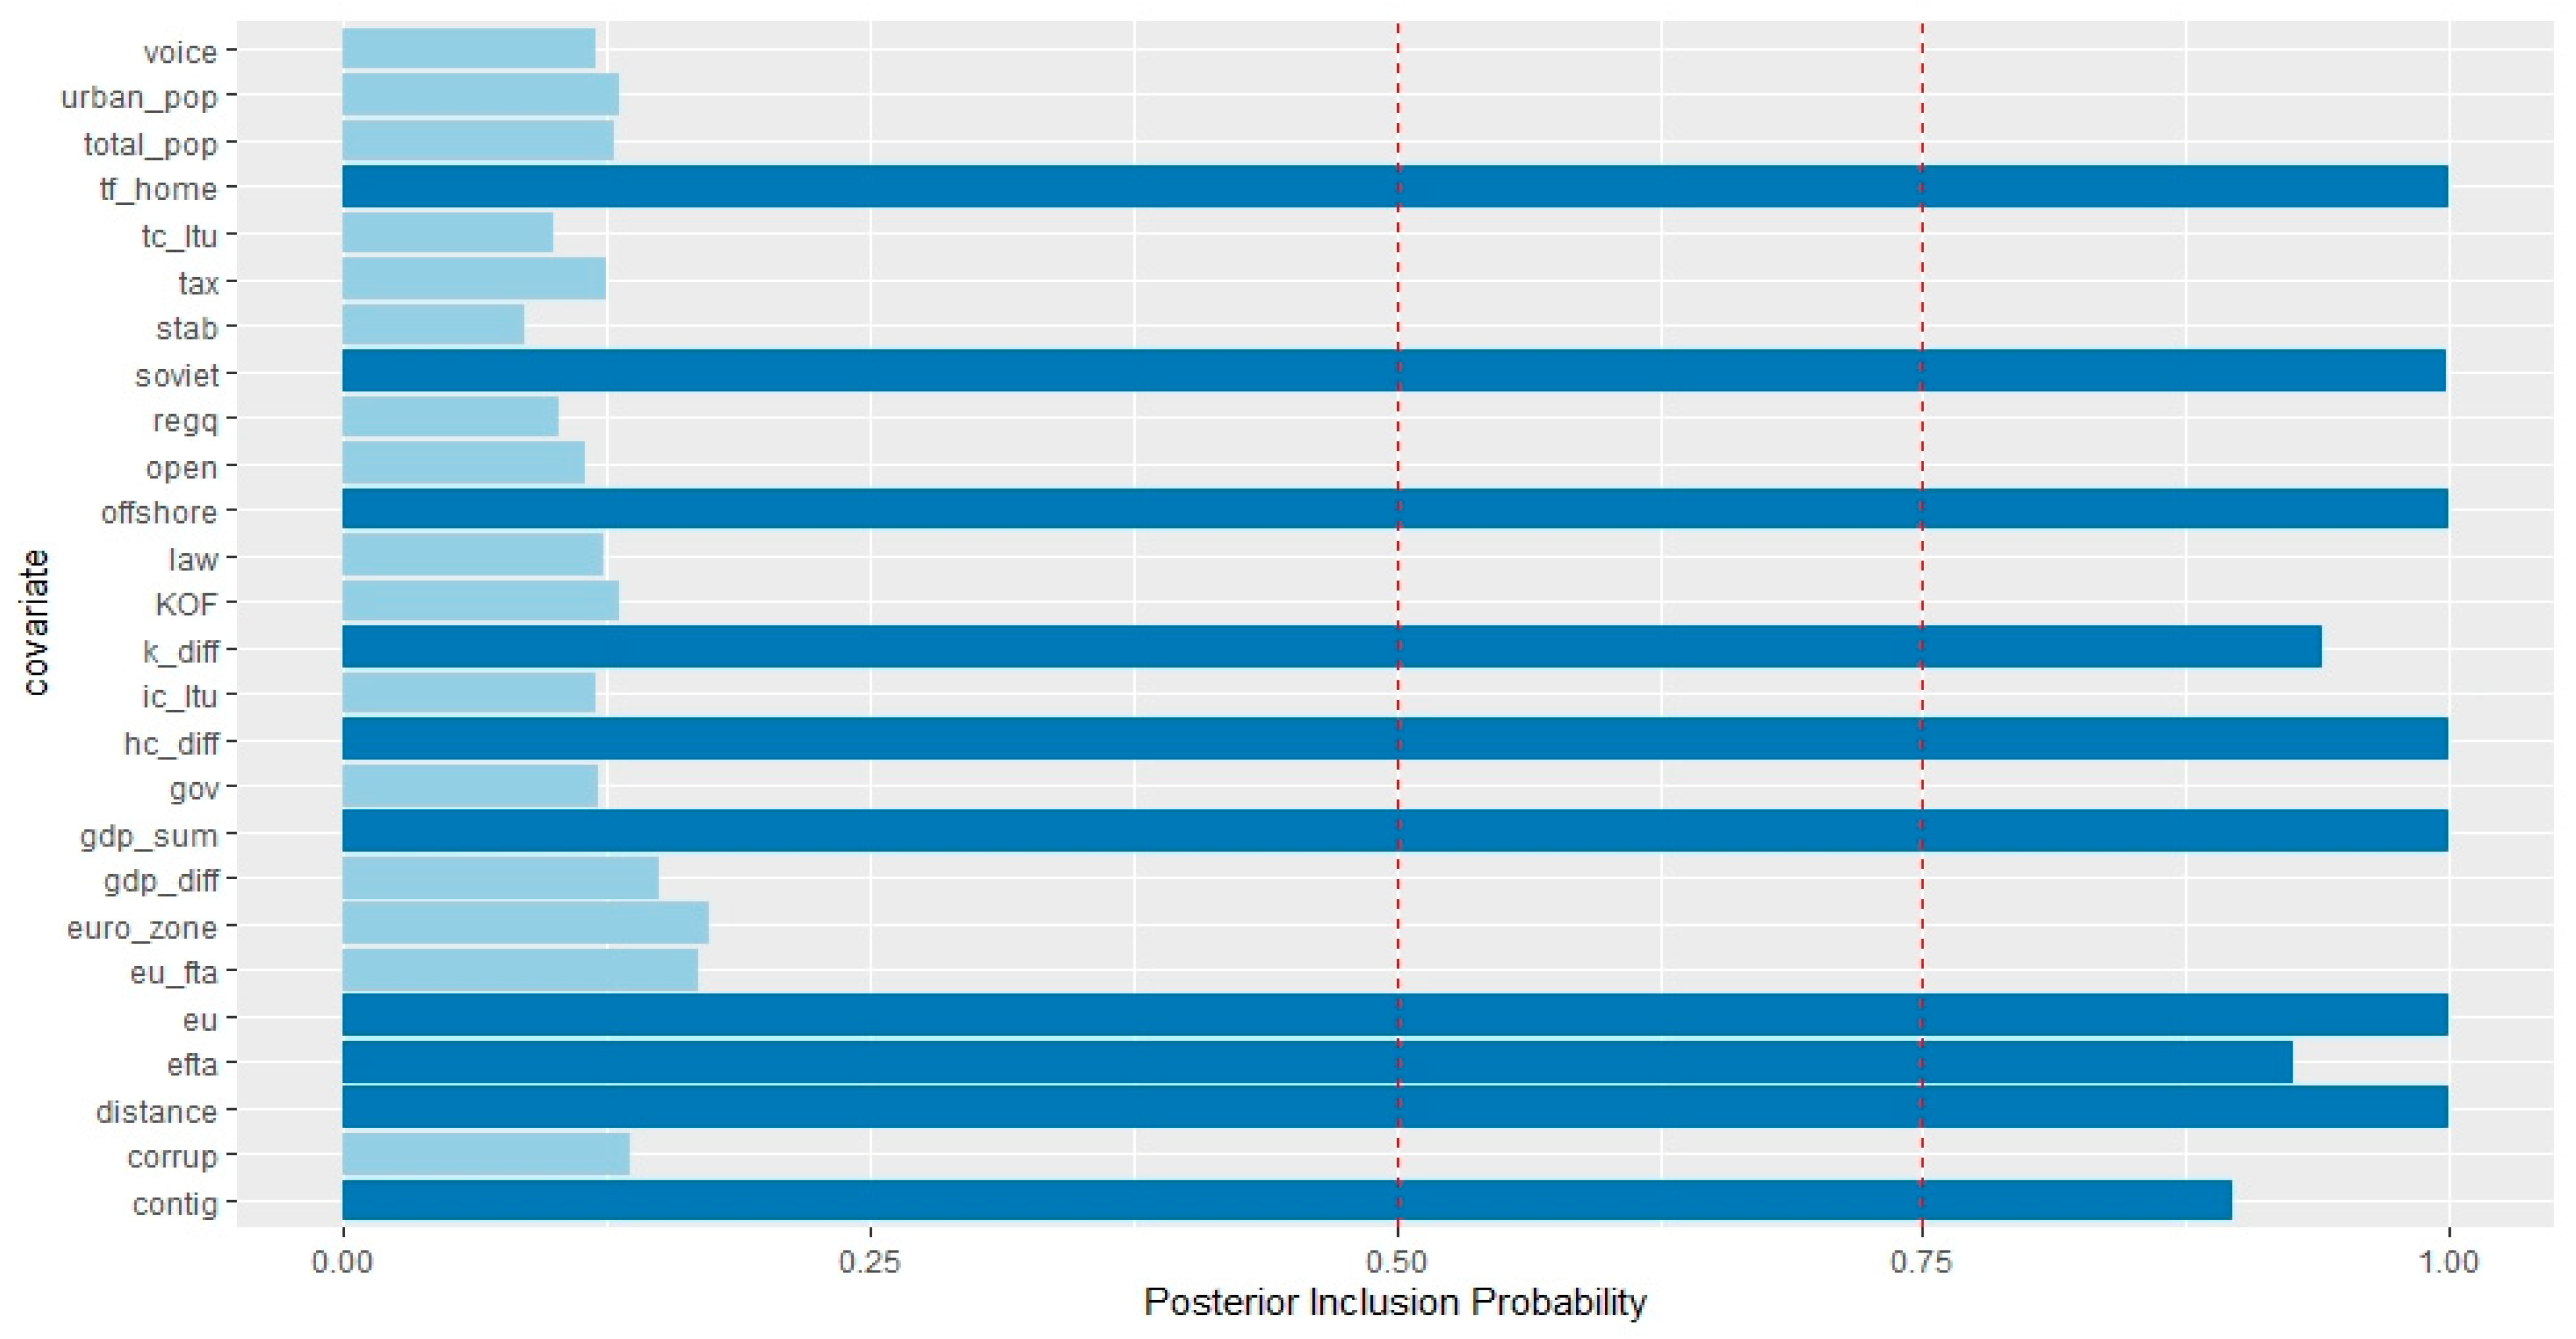
Figure 1 reports general case results for Estonia. The results indicate very strong PIP values for the variables of MNE parent country trade barriers, offshore control dummy, joint market size, the EU FTA proxy, the EFTA dummy, and geographical proximity of parent country of MNE to Estonia. A strong PIP value was found for the physical capital difference per worker, while weak PIPs were obtained for the host’s total population, human capital difference per worker, and difference in market size. Our model finds no support for the variables concerning the degree of free speech, host’s share of the urban population, host’s trade barriers, national taxation regime, host’s political stability, host’s regulatory quality, economic openness, quality of host’s legislation, KOF globalization index, host’s investment barriers, national government effectiveness, the Eurozone dummy, perceptions of domestic corruption, and contingency dummy. These results imply, that in the general case, both vertical and horizontal motives for FDI are present in Estonia, with market access and joint economic size driving the horizontal motive, and physical capital, human capital, and market size differences driving the vertical motive. Our results contrast the empirical findings of Camarero et al. (2019), who did not find strong PIPs for the covariates representing similarity in joint market size when studying German outward FDI in the Baltic economies.
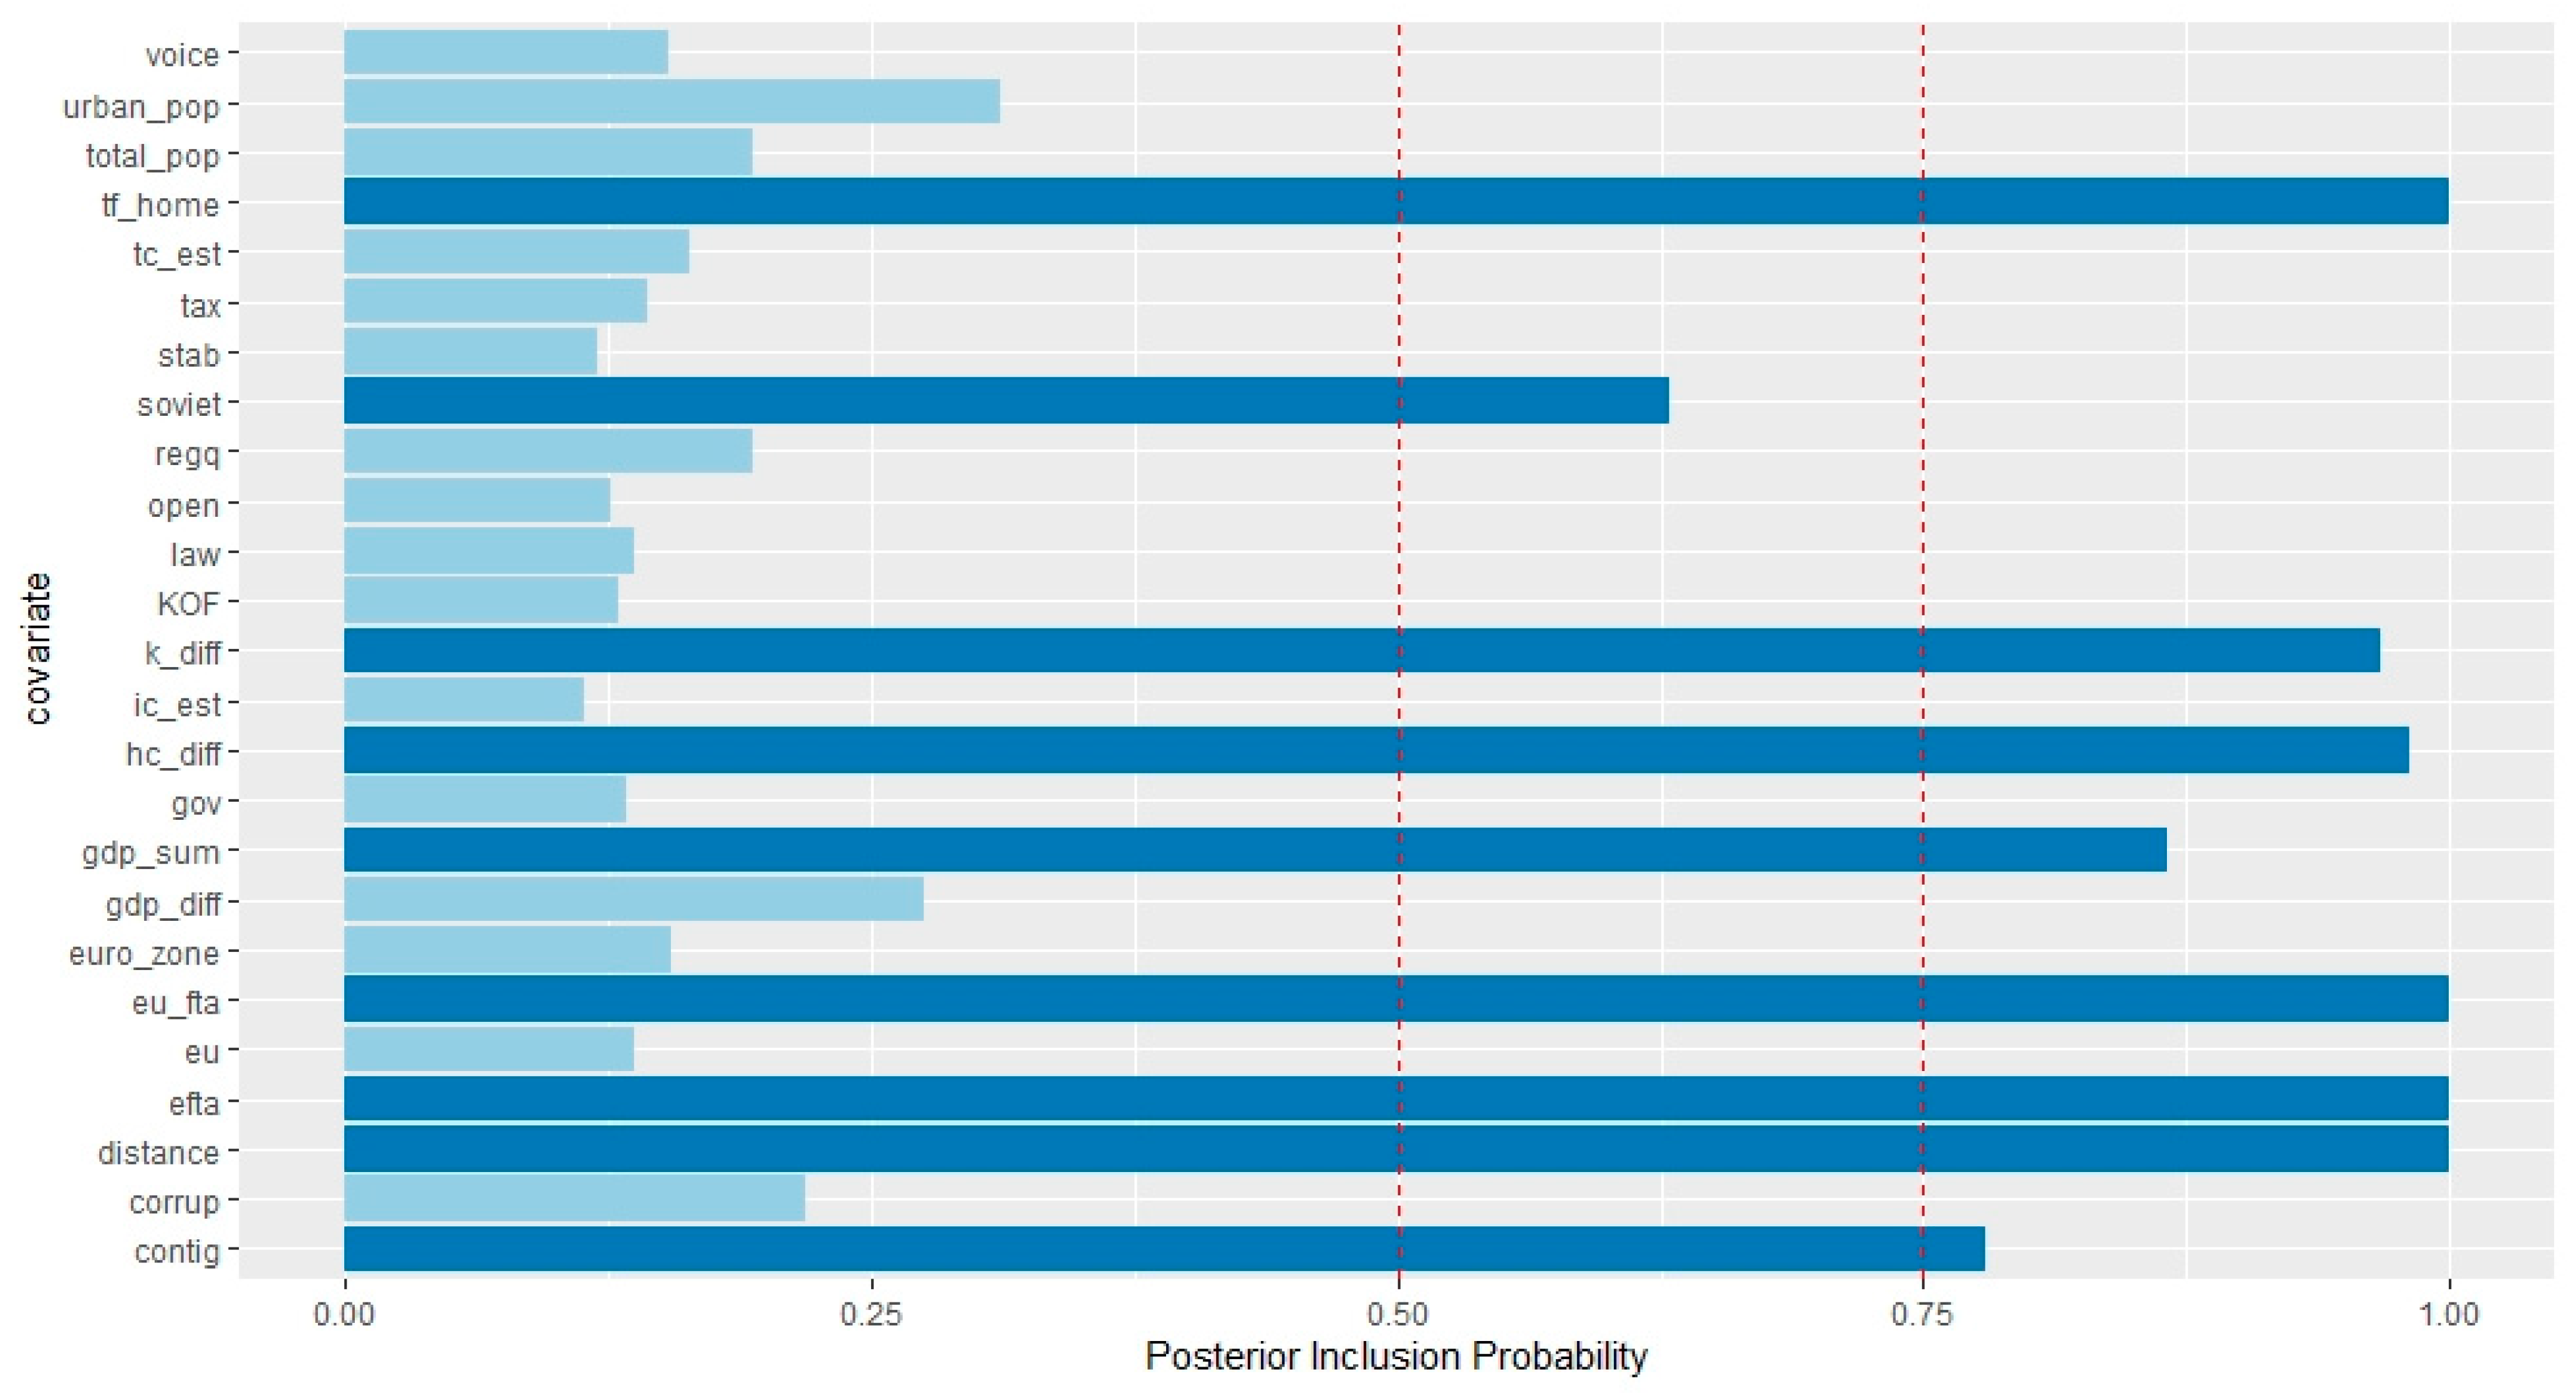
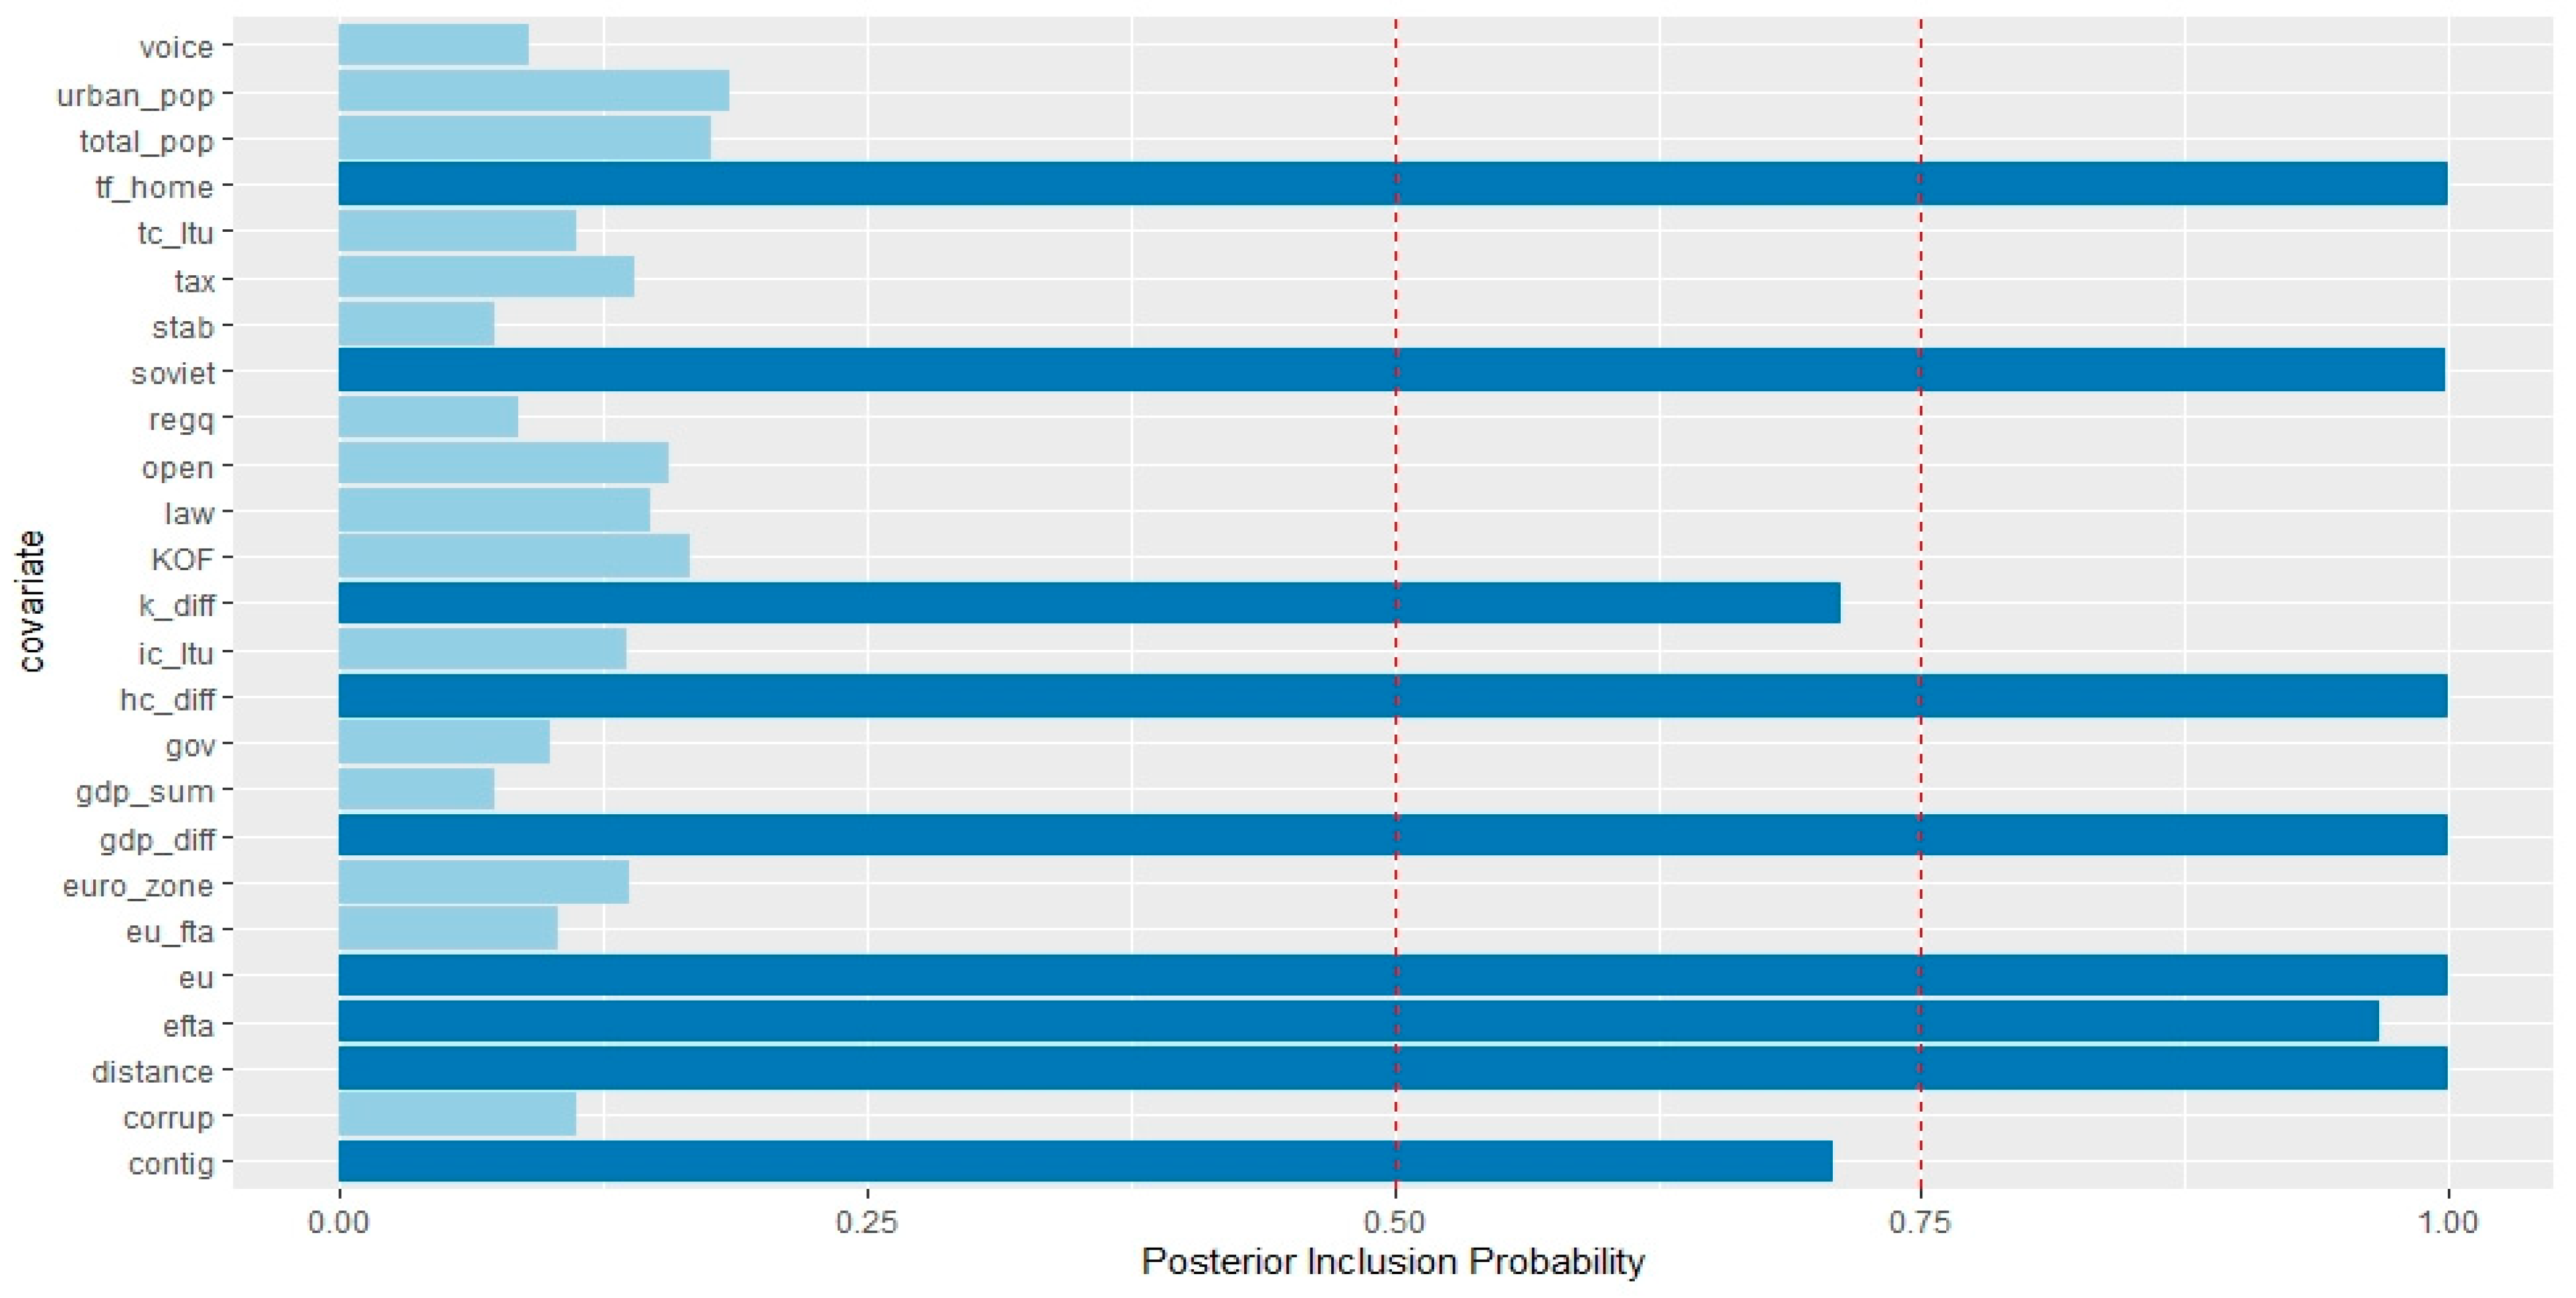
Following the procedure proposed by Damgaard et al. (2019), we excluded potential round-trip partners and report our results in Figure 2. They decompose inward FDI position into real FDI and round-trip FDI using data on special purpose entities (SPEs) and non-SPEs. The obtained results dictate that for financial centers such as Luxembourg, The Netherlands, Hong Kong SAR, and Panama, real FDI could be as low as 5% of the total FDI stock. Hence, they proceeded to apply such a share of real FDI stock uniformly across all counterpart economies. Hence, we excluded round-trip partners such as Belize, Cyprus, Hong Kong SAR, Macau, Malaysia, Mauritius, The Netherlands, Luxembourg, Panama, and Singapore from our sample.
The restricted partner sample results for Estonia signal very strong PIP values for the variables of MNE home country trade barriers, the EU FTA proxy, the EFTA dummy, and geographical proximity of the parent country of MNE to Estonia. Positive PIP values were obtained for physical capital difference per worker, human capital difference per worker, joint market size, and contingency. Although these results are quite similar in quantitative terms to the general case results, the horizontal motive was notably weaker, while the significance of human capital and physical capital differences per worker was more pronounced. Additionally, the strength of the contingency dummy could be indicative of FDI stocks originating from either Russia or Latvia.
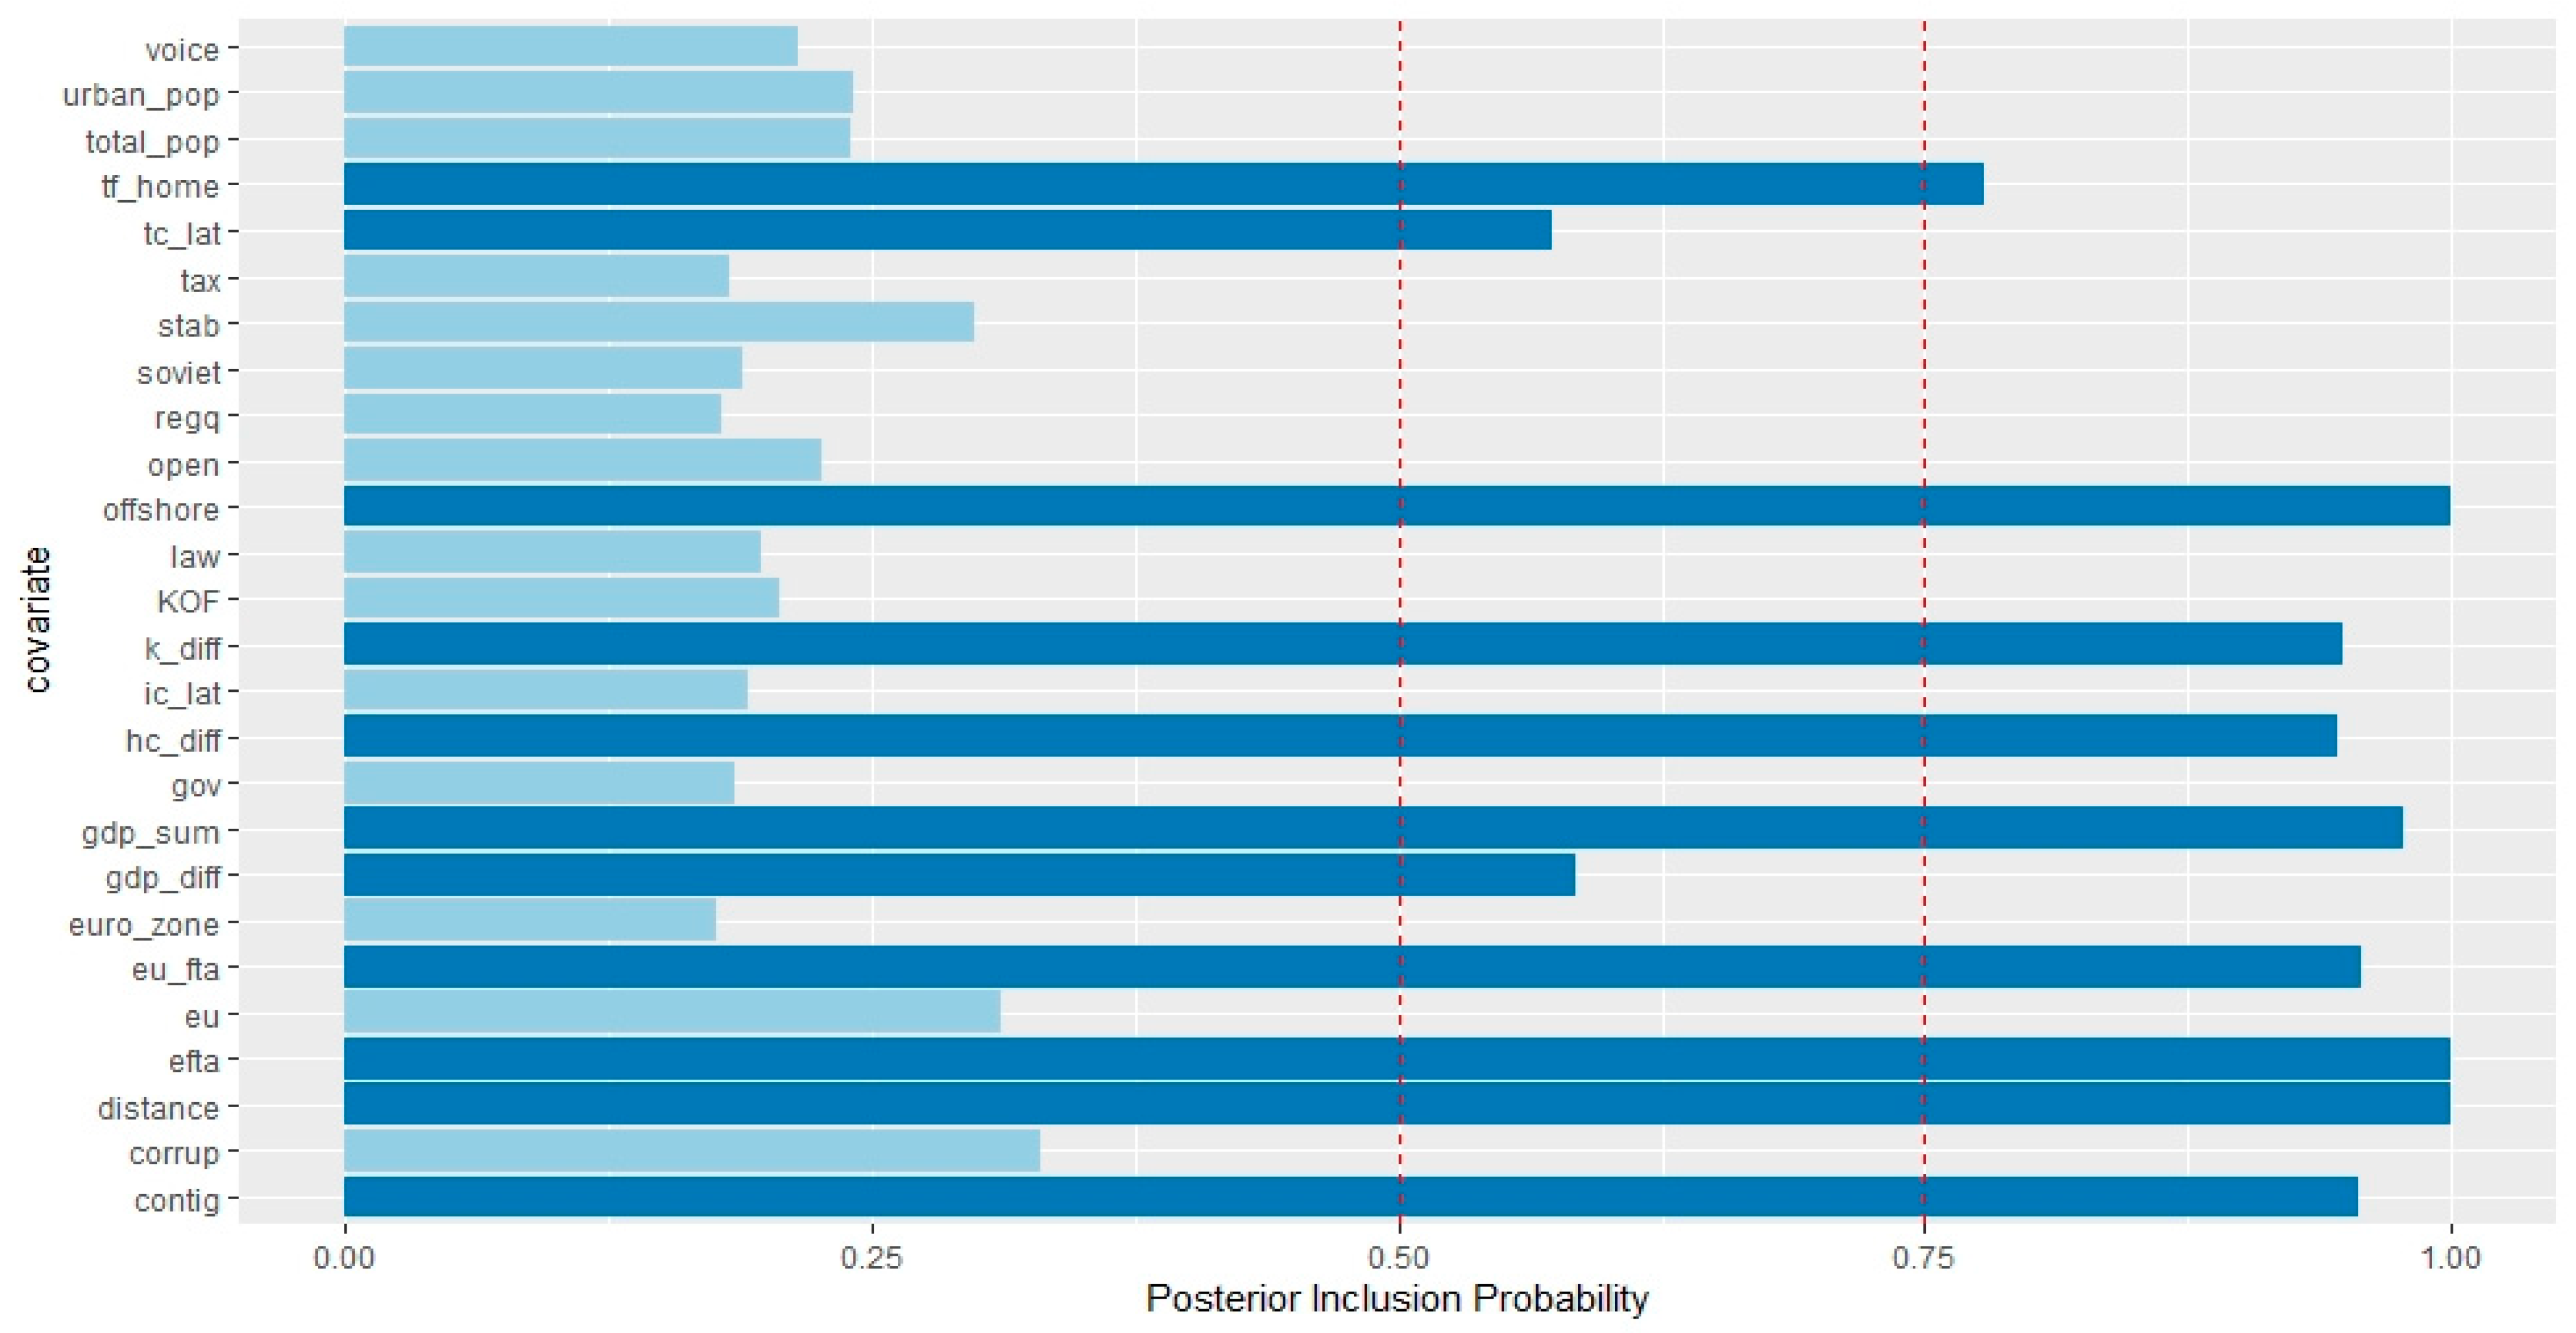
Figure 3 pictures general case results for Latvia. The results imply very strong PIP values for the offshore dummy, the EFTA dummy, and geographical proximity of the parent country of MNE to Latvia. Strong PIP values were obtained for variables of physical and human capital differences, joint economic size, the EU FTA proxy, and contingency proxy. A positive PIP was only obtained for the variable representing MNE parent country trade barriers. Weak PIPs were found for market size difference and host trade barriers. There was no support for the variables concerning degree of free speech, host’s total and urban population, national taxation regime, host’s political stability, Soviet dummy, national regulatory quality, economic openness, quality of domestic legislation, KOF globalization index, host’s investment barriers, national government effectiveness, the Eurozone dummy, and the EU accession dummy. These results strongly support the vertical motive for inward FDI in Latvia, with physical capital difference and human capital differences driving the vertical motive of investment, while the horizontal motive was only supported by potential market access dummies or joint economic size.
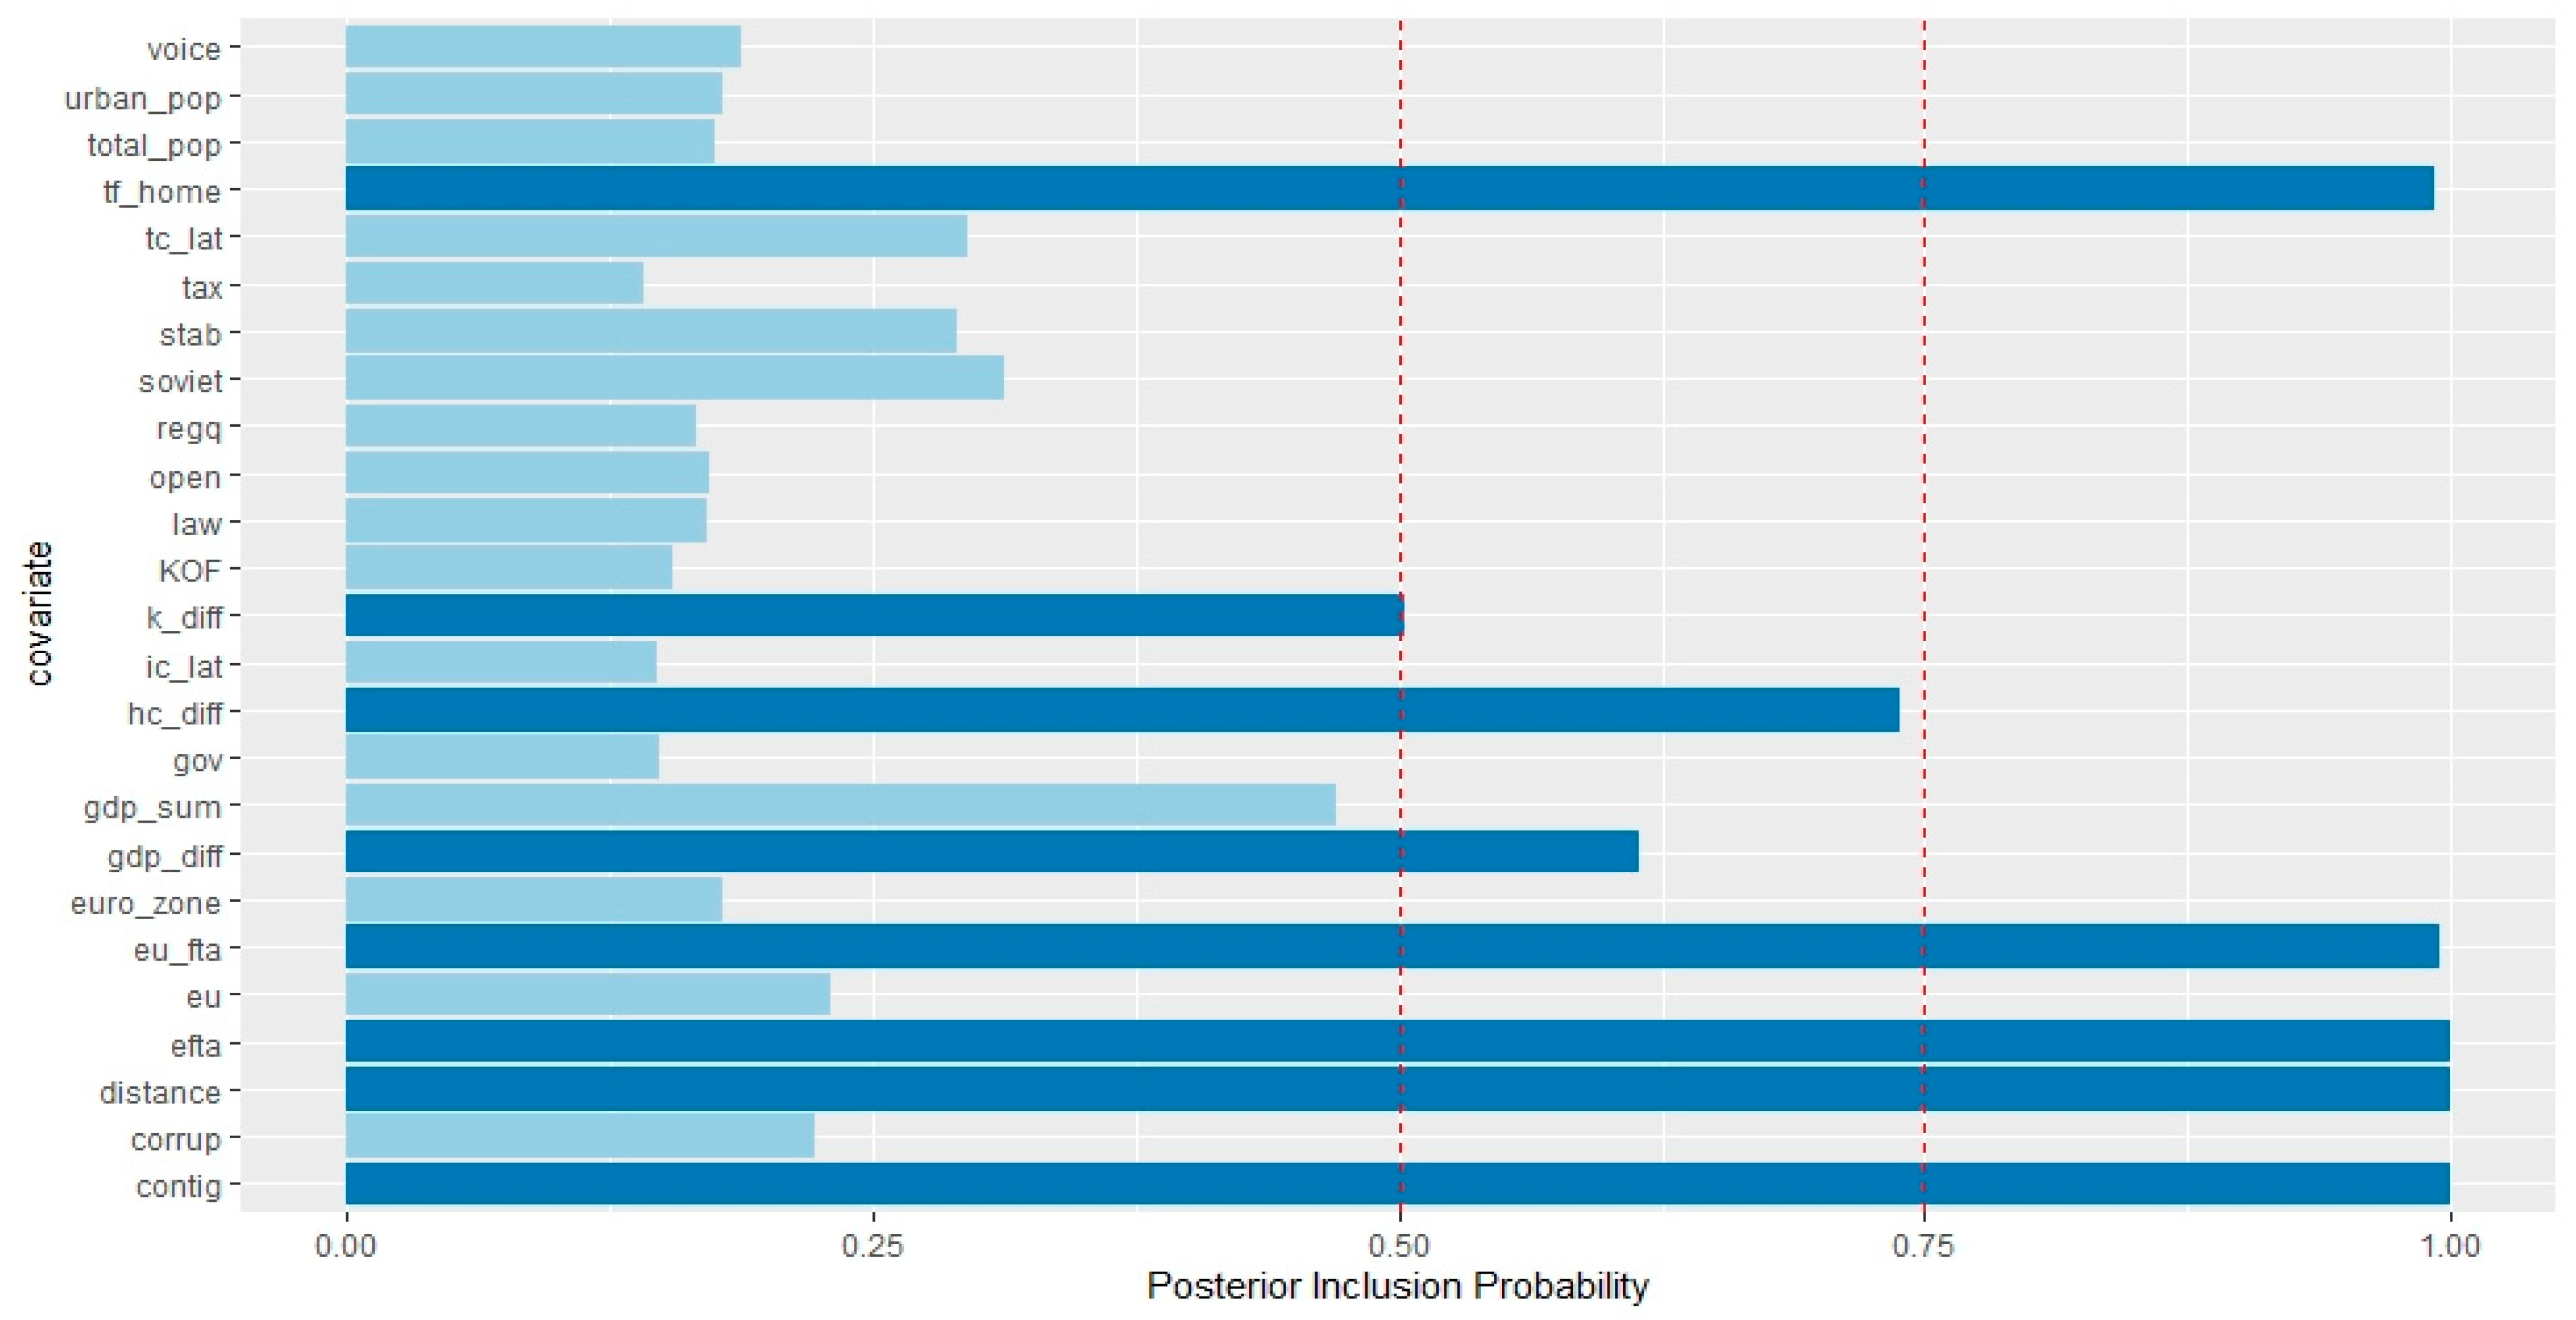
Figure 4 illustrates restricted case results for Latvia. The results indicate very strong PIPs for the variables of MNE home country trade barriers, geographical proximity, the EU FTA proxy, the EFTA dummy, and contingency dummy. Weak PIPs were found for human and physical, and market size differences. Such results imply that given a non-round-trip partner sample, MNEs primarily invest in Latvia due to the existing cost differences in skilled labor and ease of market access, and the investment is done by the MNE parent countries, which are located in close geographic proximity (e.g., within a Baltic Sea region or border Latvia).
Figure 5 reports the results for a general case in Lithuania. The results demonstrate very strong PIPs for the variables of MNE parent country trade barriers, Soviet dummy, offshore control dummy, human capital difference, joint market size, the EU accession dummy, and geographical proximity of parent country of MNE. Good PIPs were found for physical capital difference and the EU FTA proxy. The general case results find no support for the variables concerning the degree of free speech, host’s total and urban population, host’s trade barriers, national taxation regime, host’s degree of political stability, national regulatory quality, economic openness, quality of domestic legislation, KOF globalization index, host’s investment barriers, national government effectiveness, difference in market size, the Eurozone dummy, and perceptions of domestic corruption. These results imply that, in a general case, both vertical and horizontal motives for FDI are present in Lithuania, with market access (the EU accession, Soviet dummy, and the EU FTA dummy), and joint economic size driving the horizontal motive, while physical and human capital differences are driving the vertical motive of FDI. Similar to other Baltic countries, Lithuania also experiences inward FDI from the MNE parent countries that are located in close geographic proximity, e.g., the EU, the EFTA, and the Baltic Sea region.
Figure 6 demonstrates restricted case results for Lithuania. The results signal very strong PIPs for the variables of MNE home country trade barriers, Soviet dummy, human capital difference per worker, difference in market size, the EU accession dummy, and geographical proximity of parent country of MNE to Lithuania. A good PIP was obtained for the EFTA partner dummy, while weak PIPs were found for physical capital difference per worker and contingency dummy. Contrary to the general sample results, the horizontal motive was much weaker as joint economic size was no longer significant in the model, and we again see that foreign MNEs primarily invest in Lithuania due to the existing cost differences in skilled labor, with market access factors again playing an important role.
Overall, the results find strong support for H1, H2, and H3. In sum, foreign MNEs primarily engage in vertical-type FDI in the Baltics, due to the existing cost differences in skilled labor (primary), and differences in physical capital (secondary). The averaged posterior coefficients on the endowment covariates largely displayed positive signs, further confirming the notion that the endowment differences generate inward FDI across the Baltics. Second, we observe that variables related to market access (trade freedom of parent country, the EU/EFTA membership) are important in driving horizontal-type FDI across the Baltics. The estimated average posterior coefficients displayed positive signs, indicating that parent barriers generate “tariff-jumping” horizontal FDI originating from non-EU/EFTA members, and the clearly significant role of the EU/EFTA members in generating foreign equity across the Baltics. Lastly, the presence of round-trip partners leads to a more pronounced horizontal motive in the general case results for Estonia, Latvia, and Lithuania. This is confirmed by the fact that the averaged posterior coefficient on the offshore covariate remained highly significant and positive throughout the general case estimations. In addition, the results from joint PIPs matrices indicate a strong relationship between round-trip FDI stocks and factor endowments of human and physical capital.
6. Conclusions
This paper empirically studied the determinants of inward FDI across the Baltic economies of Estonia, Latvia, and Lithuania using the framework of the KPC model and BMA estimation technique across 2004–2017. Our core result is that foreign MNEs are mainly interested in vertical-type FDI in the Baltics, which is due to the existing cost differences in skilled labor and physical capital. The obtained posterior averaged coefficients indicate that the endowment differences generate inward FDI across the Baltics. Further, we observe that variables related to market access are important in driving “tariff-jumping” horizontal FDI from non-EU/EFTA members. Finally, the presence of round-trip partners leads to a more pronounced horizontal motive in all of the considered host economies. The presented results should be treated with caution as the applied methodology is based on the following assumptions regarding the data: (i) non-endogeneity of the covariates, (ii) log-linearization of the dependant variable, and (iii) the treatment of round-trip partners’ FDI stocks.
Given the obtained results and the shortcomings of the methodology, this paper offers multiple policy recommendation. First, the primary mode of attracting EU-based MNEs in the Baltics should be based on the exploitation of cost differences in skilled labor and physical capital. Second, non-EU MNEs can and will consider the Baltics as a destination for horizontal-type FDI as long as trade barriers exist at a certain level. Finally, the observed FDI originating from round-trip centers such as Cyprus and Luxembourg are very unlikely to have any meaningful economic effects on the Baltics due to the pass-through nature of the FDI.
Author Contributions
Conceptualization, A.C. and O.G.; literature review, A.C. and O.G.; data and methodology, A.C. and O.G.; empirical analysis, A.C. and O.G.; Writing–original draft preparation, A.C. and O.G., writing–review and editing, A.C. and O.G. Both authors have read and agreed to the published version of the manuscript.
Funding
This research received no external funding.
Informed Consent Statement
Not applicable.
Data Availability Statement
Data sets and scripts can be requested from Oleg Gurshev by an email at [email protected].
Conflicts of Interest
The authors declare no conflict of interest.
Appendix A
Figure A1.
Average inward FDI stocks in economic sectors of Estonia across 2004–2017.

Figure A2.
Average inward FDI stocks by partners in Estonia across 2004–2017.

Figure A3.
Average inward FDI stocks in economic sectors of Latvia across 2004–2017.

Figure A4.
Average inward FDI stocks by partners in Latvia across 2004–2017.

Figure A5.
Average inward FDI stocks in economic sectors of Lithuania across 2004–2017.

Figure A6.
Average inward FDI stocks by partners in Lithuania across 2004–2017.

Figure A7.
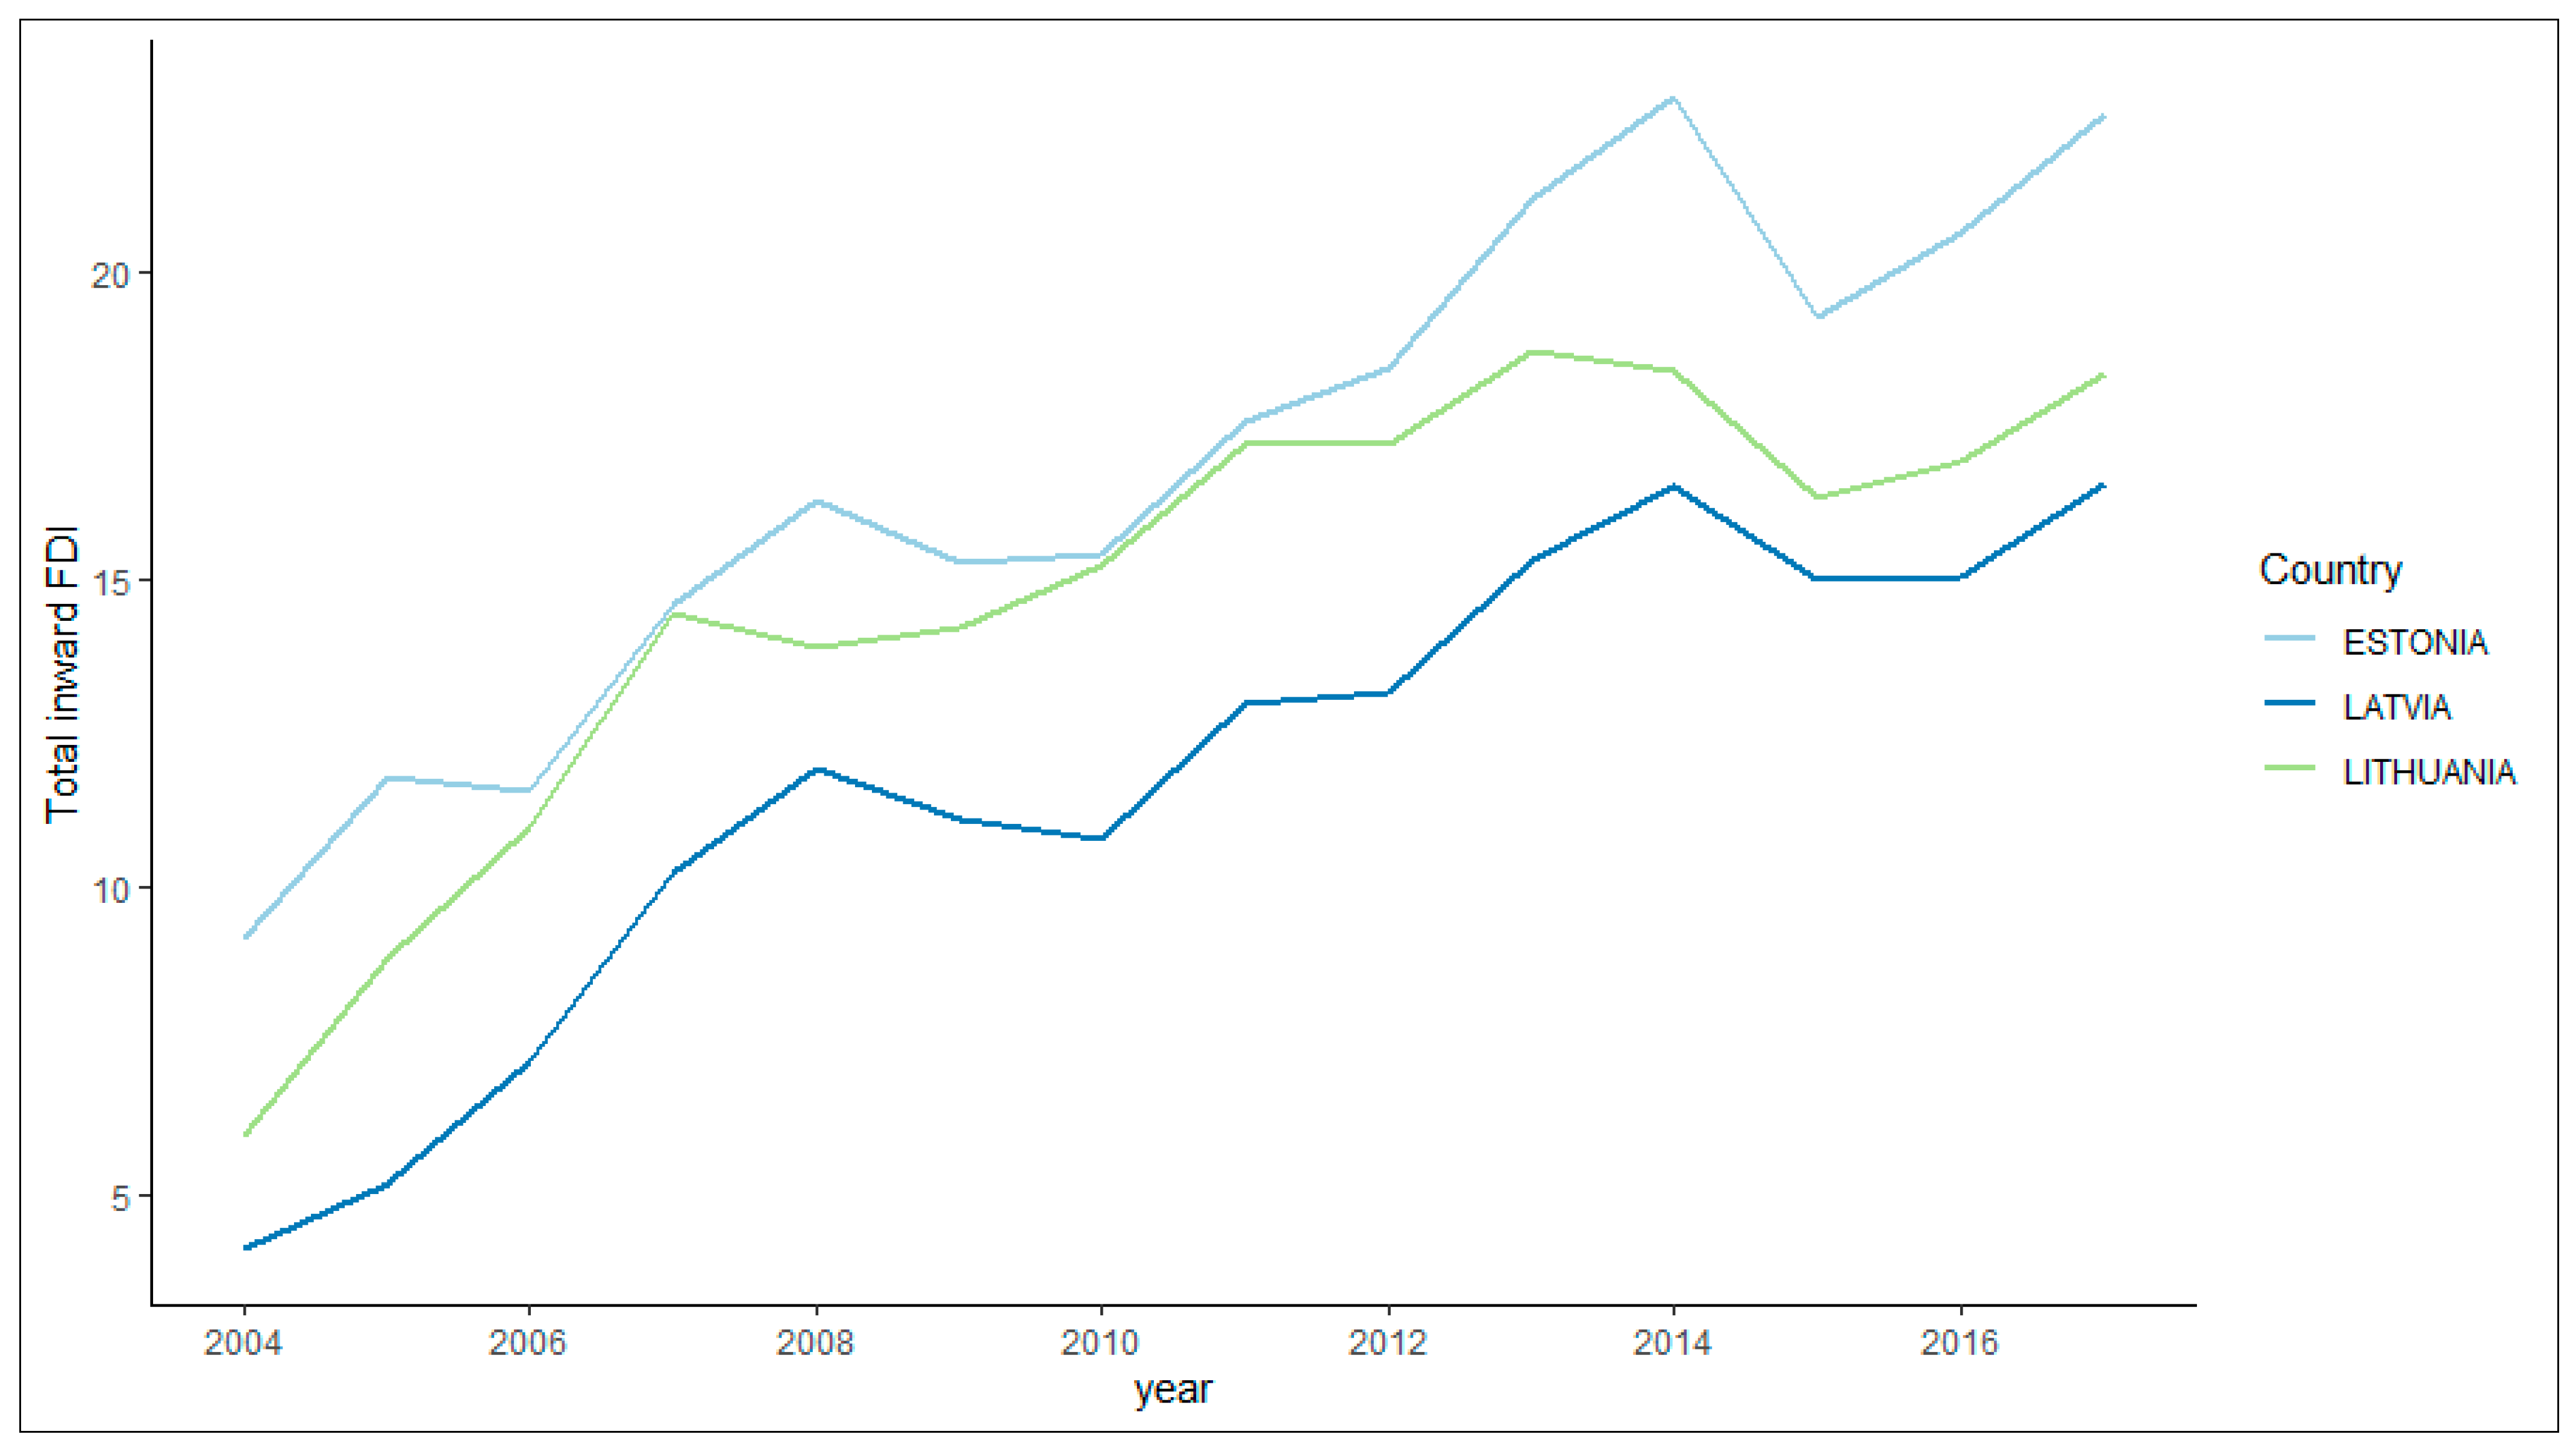
Inward FDI stocks in Estonia, Latvia, and Lithuania across 2004–2017 (current USD billion). Source: Bank of Estonia (2020), Bank of Latvia (2020), Bank of Lithuania (2020).
Figure A7.
Inward FDI stocks in Estonia, Latvia, and Lithuania across 2004–2017 (current USD billion). Source: Bank of Estonia (2020), Bank of Latvia (2020), Bank of Lithuania (2020).


Table A1.
List of inward FDI partners for Latvia.
| Partners scope: 2004–2017; N: 548 | Armenia, Australia, Austria, Bangladesh, Belgium, Belize, Bulgaria, Canada, China, Cyprus, Czech Republic, Denmark, Estonia, Finland, France, Germany, Greece, Hong Kong SAR, Hungary, Iceland, India, Ireland, Israel, Italy, Japan, Kazakhstan, Kyrgyzstan, Lithuania, Luxembourg, Malta, Mauritius, Moldova, The Netherlands, New Zealand, Norway, Panama, Poland, Romania, Russia, Saudi Arabia, Singapore, Slovakia, South Africa, South Korea, Spain, Sweden, Switzerland, Turkey, Ukraine, United Kingdom, United States, Vietnam. |
| Offshore sample | Belize, Cyprus, Hong Kong SAR, Malaysia, Mauritius, The Netherlands, Luxembourg, Panama, Singapore. |
| Soviet sample | Armenia, Estonia, Kazakhstan, Kyrgyzstan, Lithuania, Moldova, Russia, Ukraine. |
| EU sample | Austria, Belgium, Cyprus, Czech Republic, Denmark, Estonia, Finland, France, Germany, Greece, Hungary, Ireland, Italy, Latvia, Lithuania, Luxembourg, Malta, The Netherlands, Poland, Portugal, Slovakia, Slovenia, Spain, Sweden, United Kingdom. |
| EFTA sample | Iceland, Norway, Switzerland. |
| EU FTA sample | Canada, Iceland, Kazakhstan, South Korea, Norway, Switzerland, Turkey, Ukraine. |
Source: own calculation.
Table A2.
List of inward FDI partners for Estonia.
| Partners scope: 2004–2017; N: 465 | Austria, Belgium, Bulgaria, Canada, China, Cyprus, Czech Republic, Denmark, Finland, France, Germany, Hong Kong SAR, Hungary, Iceland, India, Ireland, Italy, Japan, Kazakhstan, Latvia, Lithuania, Luxembourg, Malta, The Netherlands, Norway, Poland, Russia, Singapore, Slovakia, South Korea, Spain, Sweden, Switzerland, Turkey, Ukraine, United Kingdom, United States. |
| Offshore sample | Cyprus, Hong Kong SAR, The Netherlands, Luxembourg, Singapore. |
| Soviet sample | Latvia, Lithuania, Moldova, Russia, Tajikistan, Ukraine. |
| EU sample | Austria, Belgium, Cyprus, Czech Republic, Denmark, Estonia, Finland, France, Germany, Greece, Hungary, Ireland, Italy, Latvia, Lithuania, Luxembourg, Malta, The Netherlands, Poland, Portugal, Slovakia, Slovenia, Spain, Sweden, United Kingdom. |
| EFTA sample | Iceland, Norway, Switzerland. |
| EU FTA sample | Canada, Iceland, Kazakhstan, Norway, South Korea, Switzerland, Turkey, Ukraine. |
Source: own calculation.
Table A3.
List of inward FDI partners for Lithuania.
| Partners scope: 2004–2017; N: 742 | Albania, Algeria, Argentina, Armenia, Australia, Austria, Bangladesh, Belgium, Belize, Brazil, Bulgaria, Canada, Chile, China, Croatia, Cyprus, Czech Republic, Denmark, Egypt, Estonia, Finland, France, Germany, Greece, Honduras, Hong Kong SAR, Hungary, Iceland, India, Ireland, Israel, Italy, Japan, Jordan, Kazakhstan, Korea, Kyrgyzstan, Latvia, Luxembourg, Malta, Malaysia, Mexico, The Netherlands, New Zealand, Norway, Pakistan, Panama, Poland, Portugal, Romania, Russia, Saudi Arabia, Singapore, Slovakia, Slovenia, South Africa, Spain, Syria, Sweden, Switzerland, Tajikistan, Thailand, Tunisia, Turkey, Ukraine, United Kingdom, United States, Vietnam. |
| Offshore sample | Belize, Cyprus, Hong Kong SAR, Luxembourg, Malaysia, The Netherlands, Panama, Singapore. |
| Soviet sample | Armenia, Estonia, Kazakhstan, Kyrgyzstan, Latvia, Moldova, Russia, Tajikistan, Ukraine. |
| EU sample | Austria, Belgium, Cyprus, Czech Republic, Denmark, Estonia, Finland, France, Germany, Greece, Hungary, Ireland, Italy, Latvia, Lithuania, Luxembourg, Malta, The Netherlands, Poland, Portugal, Slovakia, Slovenia, Spain, Sweden, United Kingdom. |
| EFTA sample | Iceland, Norway, Switzerland. |
| EU FTA sample | Canada, Iceland, Kazakhstan, Norway, South Korea, Switzerland, Turkey, Ukraine. |
Source: own calculation.
Table A4.
Variables used in the estimation.
| Variable | Definition | Source |
|---|---|---|
| FDI | Bilateral direct investment equity stock data from non-resident entities includes investment by a direct investor in its direct investment enterprise (immediate or not), retail funds, real estate investment (including investment properties and vacation homes), pass-through transactions, transactions that reach or surpass the threshold of 10% or more voting power, reverse investment by a direct investment enterprise in its own immediate or indirect investor (IMF 2019). We then applied Pacific exchange rate and used USD to obtain final results (Antweiler 2020), log. | Bank of Estonia (2020) Bank of Latvia (2020) Bank of Lithuania (2020) |
| voice | Perceptions of the extent to which a host country citizens are able to participate in selecting their government, freedom of association, and a free media, percentile rank, log. | World Development Indicators |
| urban_pop | Total urban population in host country, millions, log. | World Development Indicators |
| total_pop | Total population in host country, millions, log. | World Development Indicators |
| tf_home | Trade freedom index for the country-of-origin of FDI, log. | Heritage Foundation |
| tc | Trade freedom index for the recipient country of FDI, log. | Heritage Foundation |
| tax | Tax revenue in host country (% of GDP), log. | World Development Indicators |
| stab | Political stability and absence of violence/terrorism in the host country measures perceptions of the likelihood of political instability, including terrorism, percentile rank, log. | World Development Indicators |
| soviet | Dummy variable reflects if partner country was a former member of the Soviet Union. | Own calculation |
| regq | Perceptions of the ability of the government to formulate and implement sound policies and regulations and promote private sector, percentile rank, log. | World Development Indicators |
| offshore | Dummy variable reflects if partner country is in one of the offshore blacklists or indicated as round-trip FDI partner. | Damgaard et al. (2019) |
| law | Perceptions of the extent to which agents have confidence in and abide by the rules of society, quality of contract enforcement, property rights, percentile rank, log. | World Development Indicators |
| KOF | KOF globalization index, de facto, log. | Gygli et al. (2018) |
| k_diff | Physical capital difference adjusted for the number of employed population (in constant 2010 USD million), log. | Penn World Table |
| ic | Investment freedom index for the recipient country of inward FDI, log. | Heritage Foundation |
| hc_diff | Human capital difference, adjusted for the number of employed population, log. | Penn World Table |
| gov | Perceptions of the quality of public services, the quality of the civil service and the degree of its independence from political pressures, percentile rank, log. | World Development Indicators |
| gdp_sum | Sum of real GDPs (in constant 2010 USD million), log. | Penn World Table |
| gdp_diff | Squared difference of GDPs (in constant 2010 USD million), log. | Penn World Table |
| distance | Geographical distance between home and host countries, log (between capital cities, in km). | CEPII |
| open | Economic openness index of host country, log | World Development Indicators |
| corrup | Perceptions of the extent to which public power is exercised for private gain in the host country, percentile rank, log. | World Development Indicators |
| contig | Dummy, one if partner country shares common border with the recipient country of inward FDI. | Own calculation |
| efta | Dummy, one if parent country is a member of the European Free Trade Association. | Own calculation |
| euro_zone | Dummy, one if parent and host countries are both members of the Eurozone. | Own calculation |
| eu | Dummy, one if parent and host countries are both members of the European Union. | Own calculation |
| eu_fta | Dummy, one if has active bilateral trade agreement with third party countries. | European Commission (2020) |
Source: own calculation.
Figure A8.
Evolution of the inclusion probabilities with the iterations in Gibbs sampling: Estonia, Latvia, Lithuania (general case).
Figure A8.
Evolution of the inclusion probabilities with the iterations in Gibbs sampling: Estonia, Latvia, Lithuania (general case).

Table A5.
Determinants of inward FDI in Estonia (2004–2017).
| Variable | General Case | Restricted Case | ||
|---|---|---|---|---|
| incl. prob. | post mean | incl. prob. | post mean | |
| gdp_diff | 0.659 | −0.110 | 0.274 | 0.017 |
| k_diff | 0.808 | 0.220 | 0.966 | 0.323 |
| hc_diff | 0.554 | 0.399 | 0.978 | 1.195 |
| gdp_sum | 1 | 0.895 | 0.865 | 0.613 |
| distance | 1 | −1.472 | 1 | −1.422 |
| tf_home | 0.999 | 4.746 | 1 | 7.200 |
| ic_est | 0.124 | C | 0.114 | C |
| tc_est | 0.175 | −0.861 | 0.162 | −1.178 |
| urban_pop | 0.179 | 5.974 | 0.309 | 14.190 |
| total_pop | 0.572 | −15.770 | 0.193 | −3.253 |
| tax | 0.144 | 0.026 | 0.145 | 0.116 |
| open | 0.135 | −0.018 | 0.127 | 0.031 |
| KOF | 0.143 | 0.126 | 0.130 | 0.140 |
| stab | 0.130 | −0.132 | 0.120 | −0.067 |
| voice | 0.177 | 0.506 | 0.152 | 0.327 |
| gov | 0.129 | −0.096 | 0.129 | −0.312 |
| regq | 0.245 | 1.366 | 0.190 | 1.014 |
| law | 0.187 | 0.764 | 0.135 | 0.295 |
| corrup | 0.164 | −0.049 | 0.222 | 0.543 |
| soviet | 0.264 | 0.107 | 0.632 | 0.420 |
| contig | 0.388 | 0.286 | 0.778 | 0.845 |
| eu | 0.214 | 0.082 | 0.135 | 0.004 |
| eu_fta | 0.999 | −2.034 | 0.999 | −2.096 |
| offshore | 1 | 2.422 | N/A | N/A |
| euro_zone | 1 | 0.162 | 1 | 0.033 |
| efta | 0.407 | 3.134 | 0.157 | 3.017 |
Notes: N/A—variable was not used in the estimation, C—coefficient not available. Source: own calculation.
Table A6.
Determinants of inward FDI in Latvia (2004–2017).
| Variable | General Case | Restricted Case | ||
|---|---|---|---|---|
| incl. prob. | post mean | incl. prob. | post mean | |
| gdp_diff | 0.584 | −0.112 | 0.613 | 0.109 |
| k_diff | 0.948 | −0.276 | 0.503 | −0.103 |
| hc_diff | 0.945 | 0.427 | 0.738 | 0.322 |
| gdp_sum | 0.977 | 0.586 | 0.470 | 0.122 |
| distance | 1 | −1.070 | 1 | −0.886 |
| tf_home | 0.778 | 1.438 | 0.991 | 3.166 |
| ic_lat | 0.227 | −0.090 | 0.147 | −0.104 |
| tc_lat | 0.573 | 4.427 | 0.295 | 1.584 |
| urban_pop | 0.241 | −9.333 | 0.178 | −3.587 |
| total_pop | 0.240 | 8.565 | 0.175 | 3.193 |
| tax | 0.182 | −0.046 | 0.141 | −0.028 |
| open | 0.226 | 0.278 | 0.172 | 0.196 |
| KOF | 0.206 | 0.214 | 0.154 | 0.091 |
| stab | 0.299 | −0.515 | 0.289 | −0.489 |
| voice | 0.215 | −1.183 | 0.188 | −1.206 |
| gov | 0.185 | −0.163 | 0.148 | −0.170 |
| regq | 0.178 | 0.268 | 0.166 | 0.559 |
| law | 0.197 | 0.154 | 0.171 | 0.287 |
| corrup | 0.329 | 1.366 | 0.222 | 0.760 |
| soviet | 0.188 | −0.026 | 0.313 | −0.159 |
| contig | 0.955 | 1.116 | 0.999 | 1.880 |
| eu | 0.311 | 0.121 | 0.230 | −0.104 |
| eu_fta | 0.957 | −1.041 | 0.994 | −1.250 |
| offshore | 1 | 1.266 | N/A | N/A |
| euro_zone | 0.177 | 0.021 | 0.179 | −0.046 |
| efta | 1 | 2.192 | 1 | 2.484 |
Notes: N/A—variable was not used in the estimation, C—coefficient not available. Source: own calculation.
Table A7.
Determinants of inward FDI in Lithuania (2004–2017).
| Variable | General Case | Restricted Case | ||
|---|---|---|---|---|
| incl. prob. | post mean | incl. prob. | post mean | |
| gdp_diff | 1 | −0.014 | 0.999 | 0.413 |
| k_diff | 1 | 0.348 | 1 | 0.234 |
| hc_diff | 1 | 0.818 | 0.716 | 0.960 |
| gdp_sum | 0.941 | 0.986 | 0.073 | 0.002 |
| distance | 1 | −1.313 | 1 | −1.494 |
| tf_home | 1 | 6.367 | 1 | 6.983 |
| ic_ltu | 0.133 | −0.153 | 0.137 | −0.268 |
| tc_ltu | 0.132 | −0.145 | 0.115 | −0.462 |
| urban_pop | 0.129 | 0.446 | 0.185 | 1.397 |
| total_pop | 0.128 | 0.106 | 0.177 | −0.085 |
| tax | 0.115 | 0.115 | 0.139 | 0.184 |
| open | 0.129 | −0.217 | 0.157 | −0.175 |
| KOF | 0.119 | −0.217 | 0.167 | −0.454 |
| stab | 0.086 | −0.014 | 0.073 | 0.034 |
| voice | 0.122 | −0.413 | 0.091 | −0.226 |
| gov | 0.126 | −0.220 | 0.100 | −0.187 |
| regq | 0.104 | −0.134 | 0.086 | −0.100 |
| law | 0.126 | −0.160 | 0.144 | −0.350 |
| corrup | 0.136 | −0.221 | 0.110 | −0.177 |
| soviet | 0.998 | 1.435 | 0.998 | 1.447 |
| contig | 0.902 | 1.318 | 0.714 | 0.900 |
| eu | 1 | 1.869 | 0.999 | 1.650 |
| eu_fta | 0.172 | 0.099 | 0.105 | −0.005 |
| offshore | 1 | 2.370 | N/A | N/A |
| euro_zone | 0.174 | 0.079 | 0.140 | 0.061 |
| efta | 0.922 | 1.452 | 0.966 | 1.353 |
Notes: N/A—variable was not used in the estimation, C—coefficient not available. Source: own calculation.
Table A8.
Estonia, general case: the joint inclusion probability matrix for all covariates.
| gdp_diff | k_diff | hc_diff | gdp_sum | distance | tf_home | ic_est | tc_est | urb_pop | tax | open | KOF | stab | voice | gov | regq | law | corrup | soviet | contig | eu | eu_fta | offshore | euro_z | efta | |
|---|---|---|---|---|---|---|---|---|---|---|---|---|---|---|---|---|---|---|---|---|---|---|---|---|---|
| gdp_diff | 0.67881 | 0.59644 | 0.50137 | 0.67881 | 0.67881 | 0.67881 | 0.10339 | 0.11533 | 0.11081 | 0.12664 | 0.11696 | 0.12646 | 0.11613 | 0.18467 | 0.11557 | 0.29482 | 0.20207 | 0.14982 | 0.21713 | 0.29711 | 0.14891 | 0.67861 | 0.67881 | 0.33797 | 0.67881 |
| k_diff | 0.59644 | 0.81591 | 0.56895 | 0.81591 | 0.81591 | 0.81589 | 0.12134 | 0.13653 | 0.12958 | 0.15047 | 0.13684 | 0.14898 | 0.13526 | 0.22036 | 0.13463 | 0.34945 | 0.24326 | 0.17624 | 0.27248 | 0.39248 | 0.2007 | 0.81547 | 0.81591 | 0.39393 | 0.81591 |
| hc_diff | 0.50137 | 0.56895 | 0.60316 | 0.60316 | 0.60316 | 0.60314 | 0.0975 | 0.10742 | 0.10453 | 0.11861 | 0.10811 | 0.11676 | 0.10863 | 0.16853 | 0.10872 | 0.26469 | 0.19216 | 0.13933 | 0.22955 | 0.30001 | 0.15841 | 0.60286 | 0.60316 | 0.29252 | 0.60316 |
| gdp_sum | 0.67881 | 0.81591 | 0.60316 | 1 | 1 | 0.99998 | 0.13705 | 0.15552 | 0.14595 | 0.17358 | 0.156 | 0.16996 | 0.1536 | 0.25789 | 0.15217 | 0.40955 | 0.28254 | 0.2015 | 0.30807 | 0.42845 | 0.2213 | 0.99955 | 1 | 0.51186 | 1 |
| distance | 0.67881 | 0.81591 | 0.60316 | 1 | 1 | 0.99998 | 0.13705 | 0.15552 | 0.14595 | 0.17358 | 0.156 | 0.16996 | 0.1536 | 0.25789 | 0.15217 | 0.40955 | 0.28254 | 0.2015 | 0.30807 | 0.42845 | 0.2213 | 0.99955 | 1 | 0.51186 | 1 |
| tf_home | 0.67881 | 0.81589 | 0.60314 | 0.99998 | 0.99998 | 0.99998 | 0.13705 | 0.15552 | 0.14595 | 0.17358 | 0.156 | 0.16996 | 0.1536 | 0.25789 | 0.15216 | 0.40953 | 0.28253 | 0.20149 | 0.30807 | 0.42845 | 0.22129 | 0.99953 | 0.99998 | 0.51185 | 0.99998 |
| ic_est | 0.10339 | 0.12134 | 0.0975 | 0.13705 | 0.13705 | 0.13705 | 0.13705 | 0.02869 | 0.02724 | 0.03108 | 0.02787 | 0.02964 | 0.02902 | 0.04125 | 0.02902 | 0.05941 | 0.04727 | 0.03434 | 0.05365 | 0.07066 | 0.04118 | 0.13699 | 0.13705 | 0.07359 | 0.13705 |
| tc_est | 0.11533 | 0.13653 | 0.10742 | 0.15552 | 0.15552 | 0.15552 | 0.02869 | 0.15552 | 0.03193 | 0.03243 | 0.02981 | 0.03157 | 0.03077 | 0.04161 | 0.03231 | 0.06071 | 0.05479 | 0.03651 | 0.0579 | 0.07741 | 0.04522 | 0.15547 | 0.15552 | 0.08204 | 0.15552 |
| urb_pop | 0.11081 | 0.12958 | 0.10453 | 0.14595 | 0.14595 | 0.14595 | 0.02724 | 0.03193 | 0.14595 | 0.03212 | 0.03106 | 0.03357 | 0.03287 | 0.04199 | 0.03342 | 0.06149 | 0.0531 | 0.03781 | 0.05703 | 0.07662 | 0.04345 | 0.14588 | 0.14595 | 0.07785 | 0.14595 |
| tax | 0.12664 | 0.15047 | 0.11861 | 0.17358 | 0.17358 | 0.17358 | 0.03108 | 0.03243 | 0.03212 | 0.17358 | 0.03979 | 0.04063 | 0.03474 | 0.04279 | 0.03285 | 0.06281 | 0.05548 | 0.03582 | 0.0656 | 0.08559 | 0.0483 | 0.17349 | 0.17358 | 0.09247 | 0.17358 |
| open | 0.11696 | 0.13684 | 0.10811 | 0.156 | 0.156 | 0.156 | 0.02787 | 0.02981 | 0.03106 | 0.03979 | 0.156 | 0.03305 | 0.03249 | 0.04129 | 0.03195 | 0.06046 | 0.04983 | 0.0368 | 0.05716 | 0.07813 | 0.04578 | 0.15589 | 0.156 | 0.08003 | 0.156 |
| KOF | 0.12646 | 0.14898 | 0.11676 | 0.16996 | 0.16996 | 0.16996 | 0.02964 | 0.03157 | 0.03357 | 0.04063 | 0.03305 | 0.16996 | 0.03501 | 0.04196 | 0.03228 | 0.06502 | 0.0522 | 0.03838 | 0.06136 | 0.08459 | 0.04869 | 0.16989 | 0.16996 | 0.08316 | 0.16996 |
| stab | 0.11613 | 0.13526 | 0.10863 | 0.1536 | 0.1536 | 0.1536 | 0.02902 | 0.03077 | 0.03287 | 0.03474 | 0.03249 | 0.03501 | 0.1536 | 0.05091 | 0.03313 | 0.06022 | 0.05265 | 0.04072 | 0.05884 | 0.07898 | 0.04581 | 0.15354 | 0.1536 | 0.08246 | 0.1536 |
| voice | 0.18467 | 0.22036 | 0.16853 | 0.25789 | 0.25789 | 0.25789 | 0.04125 | 0.04161 | 0.04199 | 0.04279 | 0.04129 | 0.04196 | 0.05091 | 0.25789 | 0.04527 | 0.06036 | 0.06003 | 0.04404 | 0.08541 | 0.11936 | 0.0663 | 0.25779 | 0.25789 | 0.11583 | 0.25789 |
| gov | 0.11557 | 0.13463 | 0.10872 | 0.15217 | 0.15217 | 0.15216 | 0.02902 | 0.03231 | 0.03342 | 0.03285 | 0.03195 | 0.03228 | 0.03313 | 0.04527 | 0.15217 | 0.06359 | 0.06067 | 0.03854 | 0.05906 | 0.07815 | 0.04586 | 0.1521 | 0.15217 | 0.08042 | 0.15217 |
| regq | 0.29482 | 0.34945 | 0.26469 | 0.40955 | 0.40955 | 0.40953 | 0.05941 | 0.06071 | 0.06149 | 0.06281 | 0.06046 | 0.06502 | 0.06022 | 0.06036 | 0.06359 | 0.40955 | 0.08712 | 0.05781 | 0.12527 | 0.18262 | 0.10184 | 0.4094 | 0.40955 | 0.16589 | 0.40955 |
| law | 0.20207 | 0.24326 | 0.19216 | 0.28254 | 0.28254 | 0.28253 | 0.04727 | 0.05479 | 0.0531 | 0.05548 | 0.04983 | 0.0522 | 0.05265 | 0.06003 | 0.06067 | 0.08712 | 0.28254 | 0.07047 | 0.1003 | 0.1313 | 0.0744 | 0.2824 | 0.28254 | 0.1606 | 0.28254 |
| corrup | 0.14982 | 0.17624 | 0.13933 | 0.2015 | 0.2015 | 0.20149 | 0.03434 | 0.03651 | 0.03781 | 0.03582 | 0.0368 | 0.03838 | 0.04072 | 0.04404 | 0.03854 | 0.05781 | 0.07047 | 0.2015 | 0.07263 | 0.09955 | 0.05449 | 0.20142 | 0.2015 | 0.09992 | 0.2015 |
| soviet | 0.21713 | 0.27248 | 0.22955 | 0.30807 | 0.30807 | 0.30807 | 0.05365 | 0.0579 | 0.05703 | 0.0656 | 0.05716 | 0.06136 | 0.05884 | 0.08541 | 0.05906 | 0.12527 | 0.1003 | 0.07263 | 0.30807 | 0.13472 | 0.10569 | 0.30778 | 0.30807 | 0.17655 | 0.30807 |
| contig | 0.29711 | 0.39248 | 0.30001 | 0.42845 | 0.42845 | 0.42845 | 0.07066 | 0.07741 | 0.07662 | 0.08559 | 0.07813 | 0.08459 | 0.07898 | 0.11936 | 0.07815 | 0.18262 | 0.1313 | 0.09955 | 0.13472 | 0.42845 | 0.14431 | 0.42802 | 0.42845 | 0.21064 | 0.42845 |
| eu | 0.14891 | 0.2007 | 0.15841 | 0.2213 | 0.2213 | 0.22129 | 0.04118 | 0.04522 | 0.04345 | 0.0483 | 0.04578 | 0.04869 | 0.04581 | 0.0663 | 0.04586 | 0.10184 | 0.0744 | 0.05449 | 0.10569 | 0.14431 | 0.2213 | 0.22089 | 0.2213 | 0.09477 | 0.2213 |
| eu_fta | 0.67861 | 0.81547 | 0.60286 | 0.99955 | 0.99955 | 0.99953 | 0.13699 | 0.15547 | 0.14588 | 0.17349 | 0.15589 | 0.16989 | 0.15354 | 0.25779 | 0.1521 | 0.4094 | 0.2824 | 0.20142 | 0.30778 | 0.42802 | 0.22089 | 0.99955 | 0.99955 | 0.51172 | 0.99955 |
| offshore | 0.67881 | 0.81591 | 0.60316 | 1 | 1 | 0.99998 | 0.13705 | 0.15552 | 0.14595 | 0.17358 | 0.156 | 0.16996 | 0.1536 | 0.25789 | 0.15217 | 0.40955 | 0.28254 | 0.2015 | 0.30807 | 0.42845 | 0.2213 | 0.99955 | 1 | 0.51186 | 1 |
| euro_z | 0.33797 | 0.39393 | 0.29252 | 0.51186 | 0.51186 | 0.51185 | 0.07359 | 0.08204 | 0.07785 | 0.09247 | 0.08003 | 0.08316 | 0.08246 | 0.11583 | 0.08042 | 0.16589 | 0.1606 | 0.09992 | 0.17655 | 0.21064 | 0.09477 | 0.51172 | 0.51186 | 0.51186 | 0.51186 |
| efta | 0.67881 | 0.81591 | 0.60316 | 1 | 1 | 0.99998 | 0.13705 | 0.15552 | 0.14595 | 0.17358 | 0.156 | 0.16996 | 0.1536 | 0.25789 | 0.15217 | 0.40955 | 0.28254 | 0.2015 | 0.30807 | 0.42845 | 0.2213 | 0.99955 | 1 | 0.51186 | 1 |
Source: own calculation.
Table A9.
Latvia, general case: the joint inclusion probability for all covariates.
| gdp_diff | hc_diff | gdp_sum | distance | k_diff | ic_lat | tc_lat | tf_home | urb_pop | total_pop | tax | open | KOF | stab | voice | gov | regq | law | corrup | soviet | contig | eu | eu_fta | euro_z | efta | offshore | |
|---|---|---|---|---|---|---|---|---|---|---|---|---|---|---|---|---|---|---|---|---|---|---|---|---|---|---|
| gdp_diff | 0.58619 | 0.57122 | 0.56294 | 0.58619 | 0.55142 | 0.12408 | 0.3304 | 0.48532 | 0.15485 | 0.15093 | 0.11907 | 0.14549 | 0.13262 | 0.19138 | 0.14286 | 0.12161 | 0.11636 | 0.12664 | 0.21138 | 0.11993 | 0.54489 | 0.17592 | 0.56459 | 0.11101 | 0.58614 | 0.58619 |
| hc_diff | 0.57122 | 0.94605 | 0.92944 | 0.94605 | 0.89363 | 0.18463 | 0.53536 | 0.76427 | 0.23545 | 0.22881 | 0.17674 | 0.21512 | 0.19644 | 0.28599 | 0.20852 | 0.17947 | 0.1741 | 0.19113 | 0.31604 | 0.18106 | 0.90408 | 0.2859 | 0.9071 | 0.16857 | 0.94591 | 0.94605 |
| gdp_sum | 0.56294 | 0.92944 | 0.97675 | 0.97675 | 0.92454 | 0.18732 | 0.55952 | 0.76677 | 0.24146 | 0.23438 | 0.18036 | 0.21985 | 0.20053 | 0.29124 | 0.21219 | 0.18286 | 0.17677 | 0.19436 | 0.32176 | 0.18467 | 0.93183 | 0.30362 | 0.93307 | 0.17217 | 0.97661 | 0.97675 |
| distance | 0.58619 | 0.94605 | 0.97675 | 1 | 0.94733 | 0.19112 | 0.57401 | 0.78022 | 0.24613 | 0.23908 | 0.18385 | 0.22407 | 0.20441 | 0.29662 | 0.21627 | 0.18653 | 0.18002 | 0.19852 | 0.32793 | 0.18897 | 0.95497 | 0.3121 | 0.95497 | 0.17588 | 0.99986 | 1 |
| k_diff | 0.55142 | 0.89363 | 0.92454 | 0.94733 | 0.94733 | 0.18291 | 0.54502 | 0.73112 | 0.23483 | 0.22806 | 0.17518 | 0.21425 | 0.19555 | 0.28362 | 0.20644 | 0.17808 | 0.17177 | 0.18952 | 0.3144 | 0.17754 | 0.90289 | 0.29282 | 0.90801 | 0.16845 | 0.94722 | 0.94733 |
| ic_lat | 0.12408 | 0.18463 | 0.18732 | 0.19112 | 0.18291 | 0.19112 | 0.10522 | 0.15756 | 0.05319 | 0.05213 | 0.04487 | 0.05585 | 0.04943 | 0.06844 | 0.05127 | 0.0433 | 0.04196 | 0.04619 | 0.07418 | 0.04385 | 0.18412 | 0.06674 | 0.18406 | 0.04301 | 0.19108 | 0.19112 |
| tc_lat | 0.3304 | 0.53536 | 0.55952 | 0.57401 | 0.54502 | 0.10522 | 0.57401 | 0.4141 | 0.09776 | 0.09664 | 0.09501 | 0.10814 | 0.10219 | 0.11082 | 0.10717 | 0.09414 | 0.0909 | 0.09523 | 0.13307 | 0.10568 | 0.54418 | 0.18801 | 0.54325 | 0.10012 | 0.57393 | 0.57401 |
| tf_home | 0.48532 | 0.76427 | 0.76677 | 0.78022 | 0.73112 | 0.15756 | 0.4141 | 0.78022 | 0.19958 | 0.1942 | 0.15019 | 0.18226 | 0.1665 | 0.24212 | 0.17724 | 0.15227 | 0.14993 | 0.16486 | 0.2664 | 0.15294 | 0.75628 | 0.21631 | 0.75616 | 0.14281 | 0.78012 | 0.78022 |
| urb_pop | 0.15485 | 0.23545 | 0.24146 | 0.24613 | 0.23483 | 0.05319 | 0.09776 | 0.19958 | 0.24613 | 0.072 | 0.05366 | 0.05752 | 0.05443 | 0.0768 | 0.06247 | 0.05671 | 0.05044 | 0.05189 | 0.09919 | 0.05425 | 0.23642 | 0.08262 | 0.23678 | 0.05078 | 0.2461 | 0.24613 |
| total_pop | 0.15093 | 0.22881 | 0.23438 | 0.23908 | 0.22806 | 0.05213 | 0.09664 | 0.1942 | 0.072 | 0.23908 | 0.05301 | 0.0562 | 0.05481 | 0.07619 | 0.06059 | 0.05476 | 0.04854 | 0.05002 | 0.09675 | 0.05211 | 0.2298 | 0.0818 | 0.2304 | 0.04943 | 0.23905 | 0.23908 |
| tax | 0.11907 | 0.17674 | 0.18036 | 0.18385 | 0.17518 | 0.04487 | 0.09501 | 0.15019 | 0.05366 | 0.05301 | 0.18385 | 0.05258 | 0.04828 | 0.06467 | 0.04777 | 0.04233 | 0.04266 | 0.04659 | 0.07918 | 0.04273 | 0.17735 | 0.06574 | 0.17684 | 0.04144 | 0.18384 | 0.18385 |
| open | 0.14549 | 0.21512 | 0.21985 | 0.22407 | 0.21425 | 0.05585 | 0.10814 | 0.18226 | 0.05752 | 0.0562 | 0.05258 | 0.22407 | 0.05025 | 0.09813 | 0.05495 | 0.05131 | 0.04821 | 0.05335 | 0.08803 | 0.05054 | 0.21506 | 0.07747 | 0.21543 | 0.04896 | 0.22403 | 0.22407 |
| KOF | 0.13262 | 0.19644 | 0.20053 | 0.20441 | 0.19555 | 0.04943 | 0.10219 | 0.1665 | 0.05443 | 0.05481 | 0.04828 | 0.05025 | 0.20441 | 0.08611 | 0.05252 | 0.04748 | 0.04678 | 0.04986 | 0.08651 | 0.04744 | 0.19645 | 0.0719 | 0.19703 | 0.04438 | 0.20438 | 0.20441 |
| stab | 0.19138 | 0.28599 | 0.29124 | 0.29662 | 0.28362 | 0.06844 | 0.11082 | 0.24212 | 0.0768 | 0.07619 | 0.06467 | 0.09813 | 0.08611 | 0.29662 | 0.06893 | 0.06607 | 0.06329 | 0.06487 | 0.1514 | 0.06721 | 0.28506 | 0.10198 | 0.28568 | 0.06142 | 0.29659 | 0.29662 |
| voice | 0.14286 | 0.20852 | 0.21219 | 0.21627 | 0.20644 | 0.05127 | 0.10717 | 0.17724 | 0.06247 | 0.06059 | 0.04777 | 0.05495 | 0.05252 | 0.06893 | 0.21627 | 0.04924 | 0.0489 | 0.05737 | 0.10342 | 0.04983 | 0.20776 | 0.07496 | 0.20782 | 0.04835 | 0.21624 | 0.21627 |
| gov | 0.12161 | 0.17947 | 0.18286 | 0.18653 | 0.17808 | 0.0433 | 0.09414 | 0.15227 | 0.05671 | 0.05476 | 0.04233 | 0.05131 | 0.04748 | 0.06607 | 0.04924 | 0.18653 | 0.04207 | 0.04413 | 0.07344 | 0.04318 | 0.17943 | 0.06535 | 0.17992 | 0.0417 | 0.18652 | 0.18653 |
| regq | 0.11636 | 0.1741 | 0.17677 | 0.18002 | 0.17177 | 0.04196 | 0.0909 | 0.14993 | 0.05044 | 0.04854 | 0.04266 | 0.04821 | 0.04678 | 0.06329 | 0.0489 | 0.04207 | 0.18002 | 0.04194 | 0.07227 | 0.04165 | 0.17315 | 0.06186 | 0.17375 | 0.03917 | 0.18 | 0.18002 |
| law | 0.12664 | 0.19113 | 0.19436 | 0.19852 | 0.18952 | 0.04619 | 0.09523 | 0.16486 | 0.05189 | 0.05002 | 0.04659 | 0.05335 | 0.04986 | 0.06487 | 0.05737 | 0.04413 | 0.04194 | 0.19852 | 0.08006 | 0.04553 | 0.19132 | 0.0683 | 0.19126 | 0.04307 | 0.1985 | 0.19852 |
| corrup | 0.21138 | 0.31604 | 0.32176 | 0.32793 | 0.3144 | 0.07418 | 0.13307 | 0.2664 | 0.09919 | 0.09675 | 0.07918 | 0.08803 | 0.08651 | 0.1514 | 0.10342 | 0.07344 | 0.07227 | 0.08006 | 0.32793 | 0.07502 | 0.31527 | 0.11294 | 0.31654 | 0.06893 | 0.32788 | 0.32793 |
| soviet | 0.11993 | 0.18106 | 0.18467 | 0.18897 | 0.17754 | 0.04385 | 0.10568 | 0.15294 | 0.05425 | 0.05211 | 0.04273 | 0.05054 | 0.04744 | 0.06721 | 0.04983 | 0.04318 | 0.04165 | 0.04553 | 0.07502 | 0.18897 | 0.18284 | 0.05789 | 0.18234 | 0.0405 | 0.18893 | 0.18897 |
| contig | 0.54489 | 0.90408 | 0.93183 | 0.95497 | 0.90289 | 0.18412 | 0.54418 | 0.75628 | 0.23642 | 0.2298 | 0.17735 | 0.21506 | 0.19645 | 0.28506 | 0.20776 | 0.17943 | 0.17315 | 0.19132 | 0.31527 | 0.18284 | 0.95497 | 0.30601 | 0.91033 | 0.16987 | 0.95483 | 0.95497 |
| eu | 0.17592 | 0.2859 | 0.30362 | 0.3121 | 0.29282 | 0.06674 | 0.18801 | 0.21631 | 0.08262 | 0.0818 | 0.06574 | 0.07747 | 0.0719 | 0.10198 | 0.07496 | 0.06535 | 0.06186 | 0.0683 | 0.11294 | 0.05789 | 0.30601 | 0.3121 | 0.27292 | 0.05853 | 0.31196 | 0.3121 |
| eu_fta | 0.56459 | 0.9071 | 0.93307 | 0.95497 | 0.90801 | 0.18406 | 0.54325 | 0.75616 | 0.23678 | 0.2304 | 0.17684 | 0.21543 | 0.19703 | 0.28568 | 0.20782 | 0.17992 | 0.17375 | 0.19126 | 0.31654 | 0.18234 | 0.91033 | 0.27292 | 0.95497 | 0.16952 | 0.95492 | 0.95497 |
| euro_z | 0.11101 | 0.16857 | 0.17217 | 0.17588 | 0.16845 | 0.04301 | 0.10012 | 0.14281 | 0.05078 | 0.04943 | 0.04144 | 0.04896 | 0.04438 | 0.06142 | 0.04835 | 0.0417 | 0.03917 | 0.04307 | 0.06893 | 0.0405 | 0.16987 | 0.05853 | 0.16952 | 0.17588 | 0.17584 | 0.17588 |
| efta | 0.58614 | 0.94591 | 0.97661 | 0.99986 | 0.94722 | 0.19108 | 0.57393 | 0.78012 | 0.2461 | 0.23905 | 0.18384 | 0.22403 | 0.20438 | 0.29659 | 0.21624 | 0.18652 | 0.18 | 0.1985 | 0.32788 | 0.18893 | 0.95483 | 0.31196 | 0.95492 | 0.17584 | 0.99986 | 0.99986 |
| offshore | 0.58619 | 0.94605 | 0.97675 | 1 | 0.94733 | 0.19112 | 0.57401 | 0.78022 | 0.24613 | 0.23908 | 0.18385 | 0.22407 | 0.20441 | 0.29662 | 0.21627 | 0.18653 | 0.18002 | 0.19852 | 0.32793 | 0.18897 | 0.95497 | 0.3121 | 0.95497 | 0.17588 | 0.99986 | 1 |
Source: own calculation.
Table A10.
Lithuania, general case: the joint inclusion probability for all covariates.
| gdp_diff | hc_diff | gdp_sum | distance | k_diff | ic_ltu | tc_ltu | tf_home | urb_pop | total_pop | tax | open | KOF | stab | voice | gov | regq | law | corrup | soviet | contig | eu | eu_fta | euro_z | efta | offshore | |
|---|---|---|---|---|---|---|---|---|---|---|---|---|---|---|---|---|---|---|---|---|---|---|---|---|---|---|
| gdp_diff | 0.15023 | 0.15023 | 0.15023 | 0.15023 | 0.14458 | 0.02078 | 0.01785 | 0.15023 | 0.02307 | 0.02326 | 0.02305 | 0.02 | 0.0228 | 0.01606 | 0.02234 | 0.02123 | 0.01779 | 0.02234 | 0.02474 | 0.15002 | 0.13717 | 0.15023 | 0.03177 | 0.03158 | 0.13721 | 0.15023 |
| hc_diff | 0.15023 | 1 | 1 | 1 | 0.94212 | 0.1209 | 0.10104 | 1 | 0.1285 | 0.12987 | 0.12898 | 0.11512 | 0.13086 | 0.08617 | 0.12081 | 0.12148 | 0.10158 | 0.12605 | 0.13706 | 0.99799 | 0.9014 | 0.99999 | 0.17239 | 0.17304 | 0.92337 | 1 |
| gdp_sum | 0.15023 | 1 | 1 | 1 | 0.94212 | 0.1209 | 0.10104 | 1 | 0.1285 | 0.12987 | 0.12898 | 0.11512 | 0.13086 | 0.08617 | 0.12081 | 0.12148 | 0.10158 | 0.12605 | 0.13706 | 0.99799 | 0.9014 | 0.99999 | 0.17239 | 0.17304 | 0.92337 | 1 |
| distance | 0.15023 | 1 | 1 | 1 | 0.94212 | 0.1209 | 0.10104 | 1 | 0.1285 | 0.12987 | 0.12898 | 0.11512 | 0.13086 | 0.08617 | 0.12081 | 0.12148 | 0.10158 | 0.12605 | 0.13706 | 0.99799 | 0.9014 | 0.99999 | 0.17239 | 0.17304 | 0.92337 | 1 |
| k_diff | 0.14458 | 0.94212 | 0.94212 | 0.94212 | 0.94212 | 0.11515 | 0.0963 | 0.94212 | 0.12241 | 0.12356 | 0.12314 | 0.10961 | 0.12468 | 0.08253 | 0.11578 | 0.1154 | 0.09712 | 0.11937 | 0.13099 | 0.94012 | 0.87986 | 0.94211 | 0.16811 | 0.16473 | 0.86612 | 0.94212 |
| ic_ltu | 0.02078 | 0.1209 | 0.1209 | 0.1209 | 0.11515 | 0.1209 | 0.01253 | 0.1209 | 0.01417 | 0.01409 | 0.01378 | 0.01295 | 0.01475 | 0.01212 | 0.01579 | 0.0155 | 0.01281 | 0.01398 | 0.01522 | 0.12062 | 0.11078 | 0.1209 | 0.02192 | 0.02246 | 0.11203 | 0.1209 |
| tc_ltu | 0.01785 | 0.10104 | 0.10104 | 0.10104 | 0.0963 | 0.01253 | 0.10104 | 0.10104 | 0.01325 | 0.01346 | 0.01293 | 0.01223 | 0.01304 | 0.01059 | 0.01493 | 0.01381 | 0.01154 | 0.01298 | 0.0151 | 0.1009 | 0.0932 | 0.10103 | 0.01913 | 0.02212 | 0.09348 | 0.10104 |
| tf_home | 0.15023 | 1 | 1 | 1 | 0.94212 | 0.1209 | 0.10104 | 1 | 0.1285 | 0.12987 | 0.12898 | 0.11512 | 0.13086 | 0.08617 | 0.12081 | 0.12148 | 0.10158 | 0.12605 | 0.13706 | 0.99799 | 0.9014 | 0.99999 | 0.17239 | 0.17304 | 0.92337 | 1 |
| urb_pop | 0.02307 | 0.1285 | 0.1285 | 0.1285 | 0.12241 | 0.01417 | 0.01325 | 0.1285 | 0.1285 | 0.01339 | 0.01394 | 0.01373 | 0.01303 | 0.0128 | 0.01472 | 0.01532 | 0.01318 | 0.01366 | 0.01548 | 0.1283 | 0.11863 | 0.1285 | 0.0244 | 0.0281 | 0.11862 | 0.1285 |
| total_pop | 0.02326 | 0.12987 | 0.12987 | 0.12987 | 0.12356 | 0.01409 | 0.01346 | 0.12987 | 0.01339 | 0.12987 | 0.01436 | 0.01363 | 0.01336 | 0.01306 | 0.01451 | 0.01479 | 0.01295 | 0.01366 | 0.01473 | 0.12954 | 0.11935 | 0.12987 | 0.02441 | 0.02888 | 0.12023 | 0.12987 |
| tax | 0.02305 | 0.12898 | 0.12898 | 0.12898 | 0.12314 | 0.01378 | 0.01293 | 0.12898 | 0.01394 | 0.01436 | 0.12898 | 0.01348 | 0.01499 | 0.0131 | 0.01644 | 0.01923 | 0.01456 | 0.01603 | 0.01556 | 0.12878 | 0.11831 | 0.12898 | 0.02372 | 0.02414 | 0.11941 | 0.12898 |
| open | 0.02 | 0.11512 | 0.11512 | 0.11512 | 0.10961 | 0.01295 | 0.01223 | 0.11512 | 0.01373 | 0.01363 | 0.01348 | 0.11512 | 0.01346 | 0.0117 | 0.01614 | 0.01666 | 0.01305 | 0.01423 | 0.0165 | 0.11492 | 0.1057 | 0.11512 | 0.02225 | 0.02358 | 0.10658 | 0.11512 |
| KOF | 0.0228 | 0.13086 | 0.13086 | 0.13086 | 0.12468 | 0.01475 | 0.01304 | 0.13086 | 0.01303 | 0.01336 | 0.01499 | 0.01346 | 0.13086 | 0.01294 | 0.01484 | 0.01443 | 0.0125 | 0.01343 | 0.01555 | 0.13066 | 0.12008 | 0.13086 | 0.02412 | 0.02865 | 0.12077 | 0.13086 |
| stab | 0.01606 | 0.08617 | 0.08617 | 0.08617 | 0.08253 | 0.01212 | 0.01059 | 0.08617 | 0.0128 | 0.01306 | 0.0131 | 0.0117 | 0.01294 | 0.08617 | 0.01268 | 0.01273 | 0.01003 | 0.01228 | 0.01442 | 0.08604 | 0.07985 | 0.08617 | 0.01785 | 0.0186 | 0.07908 | 0.08617 |
| voice | 0.02234 | 0.12081 | 0.12081 | 0.12081 | 0.11578 | 0.01579 | 0.01493 | 0.12081 | 0.01472 | 0.01451 | 0.01644 | 0.01614 | 0.01484 | 0.01268 | 0.12081 | 0.01358 | 0.01258 | 0.01379 | 0.01448 | 0.1206 | 0.11172 | 0.12081 | 0.02327 | 0.02834 | 0.11146 | 0.12081 |
| gov | 0.02123 | 0.12148 | 0.12148 | 0.12148 | 0.1154 | 0.0155 | 0.01381 | 0.12148 | 0.01532 | 0.01479 | 0.01923 | 0.01666 | 0.01443 | 0.01273 | 0.01358 | 0.12148 | 0.01262 | 0.01457 | 0.01581 | 0.12129 | 0.11174 | 0.12147 | 0.02357 | 0.03211 | 0.11213 | 0.12148 |
| regq | 0.01779 | 0.10158 | 0.10158 | 0.10158 | 0.09712 | 0.01281 | 0.01154 | 0.10158 | 0.01318 | 0.01295 | 0.01456 | 0.01305 | 0.0125 | 0.01003 | 0.01258 | 0.01262 | 0.10158 | 0.01262 | 0.0147 | 0.1014 | 0.09375 | 0.10157 | 0.01935 | 0.02086 | 0.09396 | 0.10158 |
| law | 0.02234 | 0.12605 | 0.12605 | 0.12605 | 0.11937 | 0.01398 | 0.01298 | 0.12605 | 0.01366 | 0.01366 | 0.01603 | 0.01423 | 0.01343 | 0.01228 | 0.01379 | 0.01457 | 0.01262 | 0.12605 | 0.0153 | 0.12584 | 0.1152 | 0.12605 | 0.02383 | 0.02899 | 0.11675 | 0.12605 |
| corrup | 0.02474 | 0.13706 | 0.13706 | 0.13706 | 0.13099 | 0.01522 | 0.0151 | 0.13706 | 0.01548 | 0.01473 | 0.01556 | 0.0165 | 0.01555 | 0.01442 | 0.01448 | 0.01581 | 0.0147 | 0.0153 | 0.13706 | 0.13682 | 0.12578 | 0.13706 | 0.02663 | 0.02978 | 0.12651 | 0.13706 |
| soviet | 0.15002 | 0.99799 | 0.99799 | 0.99799 | 0.94012 | 0.12062 | 0.1009 | 0.99799 | 0.1283 | 0.12954 | 0.12878 | 0.11492 | 0.13066 | 0.08604 | 0.1206 | 0.12129 | 0.1014 | 0.12584 | 0.13682 | 0.99799 | 0.8994 | 0.99799 | 0.17223 | 0.17272 | 0.92139 | 0.99799 |
| contig | 0.13717 | 0.9014 | 0.9014 | 0.9014 | 0.87986 | 0.11078 | 0.0932 | 0.9014 | 0.11863 | 0.11935 | 0.11831 | 0.1057 | 0.12008 | 0.07985 | 0.11172 | 0.11174 | 0.09375 | 0.1152 | 0.12578 | 0.8994 | 0.9014 | 0.90139 | 0.16355 | 0.16062 | 0.82739 | 0.9014 |
| eu | 0.15023 | 0.99999 | 0.99999 | 0.99999 | 0.94211 | 0.1209 | 0.10103 | 0.99999 | 0.1285 | 0.12987 | 0.12898 | 0.11512 | 0.13086 | 0.08617 | 0.12081 | 0.12147 | 0.10157 | 0.12605 | 0.13706 | 0.99799 | 0.90139 | 0.99999 | 0.17238 | 0.17303 | 0.92336 | 0.99999 |
| eu_fta | 0.03177 | 0.17239 | 0.17239 | 0.17239 | 0.16811 | 0.02192 | 0.01913 | 0.17239 | 0.0244 | 0.02441 | 0.02372 | 0.02225 | 0.02412 | 0.01785 | 0.02327 | 0.02357 | 0.01935 | 0.02383 | 0.02663 | 0.17223 | 0.16355 | 0.17238 | 0.17239 | 0.03207 | 0.09746 | 0.17239 |
| euro_z | 0.03158 | 0.17304 | 0.17304 | 0.17304 | 0.16473 | 0.02246 | 0.02212 | 0.17304 | 0.0281 | 0.02888 | 0.02414 | 0.02358 | 0.02865 | 0.0186 | 0.02834 | 0.03211 | 0.02086 | 0.02899 | 0.02978 | 0.17272 | 0.16062 | 0.17303 | 0.03207 | 0.17304 | 0.16197 | 0.17304 |
| efta | 0.13721 | 0.92337 | 0.92337 | 0.92337 | 0.86612 | 0.11203 | 0.09348 | 0.92337 | 0.11862 | 0.12023 | 0.11941 | 0.10658 | 0.12077 | 0.07908 | 0.11146 | 0.11213 | 0.09396 | 0.11675 | 0.12651 | 0.92139 | 0.82739 | 0.92336 | 0.09746 | 0.16197 | 0.92337 | 0.92337 |
| offshore | 0.15023 | 1 | 1 | 1 | 0.94212 | 0.1209 | 0.10104 | 1 | 0.1285 | 0.12987 | 0.12898 | 0.11512 | 0.13086 | 0.08617 | 0.12081 | 0.12148 | 0.10158 | 0.12605 | 0.13706 | 0.99799 | 0.9014 | 0.99999 | 0.17239 | 0.17304 | 0.92337 | 1 |
Source: own calculation.
References
- Pacific Exchange Rate Service. Available online: https://fx.sauder.ubc.ca/ (accessed on 10 December 2020).
- Bank of Czech Republic. 2020. Foreign Direct Investment Statistics: 2019 (EUR Million). Available online: https://www.cnb.cz/export/sites/cnb/en/statistics/bop_stat/bop_publications/pzi_books/PZI_2019_EN.pdf (accessed on 10 December 2020).
- Bank of Estonia. 2020. Direct Investment Position in Estonia and Abroad by Country (EUR Million). Available online: https://statistika.eestipank.ee/#/en/p/146/r/2293/2122 (accessed on 10 December 2020).
- Bank of Latvia. 2020. Direct Investment Position in Latvia (EUR Million). Available online: https://statdb.bank.lv/lb/Data.aspx?id=128 (accessed on 10 December 2020).
- Bank of Lithuania. 2020. Foreign Direct Investment by Country (EUR Million). Available online: https://www.lb.lt/en/inward-foreign-direct-investment-by-country-1 (accessed on 10 December 2020).
- Bank of Poland. 2020. Foreign Direct Investment in Poland. Available online: https://www.nbp.pl/homen.aspx?f=/en/publikacje/ziben/ziben.html (accessed on 10 December 2020).
- Barbieri, Maria Maddalena, and James O. Berger. 2004. Optimal predictive model selection. The Annals of Statistics 32: 870–97. [Google Scholar] [CrossRef]
- Bayarri, Maria J., James O. Berger, Anabel Forte, and Gonzalo García-Donato. 2012. Criteria for Bayesian model choice with application to variable selection. The Annals of Statistics 40: 1550–77. [Google Scholar] [CrossRef] [Green Version]
- Beck, Krzysztof. 2021. Capital mobility and the synchronization of business cycles: Evidence from the European Union. Review of International Economics. [Google Scholar] [CrossRef]
- Bergstrand, Jeffrey H., and Peter Egger. 2007. A knowledge and physical capital model of international trade flows, foreign direct investment and multinational enterprises. Journal of International Economics 73: 278–308. [Google Scholar] [CrossRef]
- Blonigen, Bruce A., and Jeremy Piger. 2014. Determinants of foreign direct investment. Canadian Journal of Economics/Revue Canadienne D’économique 47: 775–812. [Google Scholar] [CrossRef] [Green Version]
- Borsos, Julianna. 1997. Foreign Direct Investment and Technology Transfer. Results of a Survey in Selected Branches in Estonia (No. 580). ETLA Discussion Papers. Helsinki: ETLA Economic Research. [Google Scholar]
- Borsos, Julianna, and Mika Erkkilä. 2002. Regional Integration in the Baltic Rim-FDI and Trade-Based Integration in the Triangle of Finland, Estonia and St. Petersburg (No. 539). ETLA Discussion Papers. Helsinki: ETLA Economic Research. [Google Scholar]
- Camarero, Mariam, Laura Montolio, and Cecilio Tamarit. 2019. What drives German foreign direct investment? New evidence using Bayesian statistical techniques. Economic Modelling 83: 326–45. [Google Scholar] [CrossRef]
- Camarero, Mariam, Sergi Moliner, and Cecilio Tamarit. 2021. Japan’s FDI drivers in a time of financial uncertainty. New evidence based on Bayesian Model Averaging. Japan and the World Economy 57: 101058. [Google Scholar] [CrossRef]
- Caves, Richard E. 2007. Multinational Enterprise and Economic Analysis, 2nd ed. Cambridge: Cambridge University Press. [Google Scholar]
- Cicak, Kresimir, and Petar Soric. 2015. The interrelationship of FDI and GDP in European transition countries. International Journal of Management Science and Business Administration 1: 41–58. [Google Scholar] [CrossRef] [Green Version]
- Cieślik, Andrzej. 2019. Determinants of foreign direct investment from EU-15 countries in Poland. Central European Economic Journal 6: 39–52. [Google Scholar] [CrossRef] [Green Version]
- Damgaard, Jannick, Thomas Elkjaer, and Niels Johannesen. 2019. What Is Real and What Is not in the Global FDI Network? IMF Working Paper WP/19/274. Washington, DC: International Monetary Fund. [Google Scholar]
- Davies, Ronald B., and James R. Markusen. 2020. The Structure of Multinational Firms’ International Activities. NBER Working Paper 26827. Cambridge: National Bureau of Economic Research. [Google Scholar]
- Ehrlich, Laura, Ulo Kaasik, and Anu Randveer. 2002. The Impact of Scandinavian Economies on Estonia via Foreign Trade and Direct Investments (No. 2002-4). Tallinn: Bank of Estonia. [Google Scholar]
- Eicher, S. Theo, Helfman Lindy, and Lenkoski Alex. 2012. Robust FDI determinants: Bayesian model averaging in the presence of selection bias. Journal of Macroeconomics 34: 637–51. [Google Scholar] [CrossRef] [Green Version]
- European Commission. 2020. Negotiations and Agreements. Available online: https://ec.europa.eu/trade/policy/countries-and-regions/negotiations-and-agreements/index_en.htm#_europe (accessed on 15 December 2020).
- Feenstra, Robert C., Robert Inklaar, and Marcel P. Timmer. 2015. The Next Generation of the Penn World Table. American Economic Review 105: 3150–82. [Google Scholar] [CrossRef] [Green Version]
- Forte, Anabel, Gonzalo Garcia-Donato, and Mark Steel. 2018. Methods and tools for Bayesian variable selection and model averaging in normal linear regression. International Statistical Review 86: 237–58. [Google Scholar] [CrossRef] [Green Version]
- Garcia-Donato, Gonzalo, and Miguel A. Martinez-Beneito. 2013. On sampling strategies in Bayesian variable selection problems with large model spaces. Journal of the American Statistical Association 108: 340–52. [Google Scholar] [CrossRef]
- Güngör, Hakan, and Ayla Ogus Binatli. 2010. The Effect of European Accession Prospects on Foreign Direct Investment Flows. Working Papers in Economics (No. 10/06). Izmir: Izmir University of Economics. [Google Scholar]
- Gygli, Savina, Florian Haelg, Niklas Potrafke, and Jan-Egbert Sturm. 2018. The KOF Globalization Index-Revisited. Munich: Center for Economic Studies and Ifo Institute. [Google Scholar] [CrossRef] [Green Version]
- Helpman, Elhanan. 1984. A simple theory of international trade with multinational corporations. Journal of Political Economy 92: 451–71. [Google Scholar] [CrossRef] [Green Version]
- Helpman, Elhanan, and Paul R. Krugman. 1985. Market Structure and Foreign Trade: Increasing Returns, Imperfect Competition, and the International Economy. Cambridge: MIT Press. [Google Scholar]
- Heritage Foundation. 2020. Index of Economic Freedom. Available online: https://www.heritage.org/index/ (accessed on 17 December 2020).
- Hunya, Gabor. 2004. FDI in Small Countries: The Baltic States. WIIW Research Report No. 307. Vienna: Vienna Institute for International Economic Studies. [Google Scholar]
- International Monetary Fund. 2019. Glossary of Foreign Direct Investment Terms. Available online: https://www.imf.org/external/np/sta/di/glossary (accessed on 1 December 2020).
- Irandoust, Manuchehr. 2016. Structural changes, FDI, and economic growth: Evidence from the Baltic States. Journal of Economic Structures 5: 14. [Google Scholar] [CrossRef] [Green Version]
- Kotilainen, Markku, and Nuutti Nikula. 2010. Why Do Firms Invest in The Baltic Sea Region? ETLA Discussion Papers (No. 1229). Helsinki: ETLA Economic Research. [Google Scholar]
- Krugman, Paul. 1983. The New Theories of International Trade and Multinational Enterprise: In the International Corporation in the 1980s. Edited by David. B. Audretsch and Charles Kindleberger. Cambrige: MIT Press. [Google Scholar]
- Ley, Eduardo, and Mark F. J. Steel. 2007. Jointness in Bayesian variable selection with applications to growth regression. Journal of Macroeconomics 29: 476–93. [Google Scholar] [CrossRef] [Green Version]
- Markusen, James R. 1984. Multinationals, multi-plant economies, and the gains from trade. Journal of International Economics 16: 205–26. [Google Scholar] [CrossRef]
- Markusen, James R. 2002. Multinational Firms and the Theory of International Trade. Cambridge: MIT Press. [Google Scholar]
- Markusen, James R. 2013. Putting per-capita income back into trade theory. Journal of International Economics 90: 255–65. [Google Scholar] [CrossRef] [Green Version]
- Mickiewicz, T., S. Radosevic, and U. Varblane. 2000. The Value of Diversity: Foreign Direct Investment and Employment in Central Europe during Economic Recovery (No. 5). Tartu: Tartu University Press. [Google Scholar]
- Raftery, E. Adrian. 1995. Bayesian model selection in social research. Sociological Methodology, 111–63. [Google Scholar] [CrossRef]
- Reiljan, Janno, Ele Reiljan, and Kairi Andresson. 2001. Attractiveness of central and Eastern European countries for foreign direct investment in the context of European integration: The case of Estonia. In 41st ERSA Congress, Zagreb. Louvain-la-Neuve: European RegionalScience Association (ERSA). [Google Scholar]
- Sala-i-Martin, Xavier, Gernot Doppelhofer, and Ronald I. Miller. 2004. Determinants of long-term growth: A Bayesian averaging of classical estimates (BACE) approach. American Economic Review 94: 813–35. [Google Scholar] [CrossRef] [Green Version]
- Scott, James G., and James O. Berger. 2006. An exploration of aspects of Bayesian multiple testing. Journal of Statistical Planning and Inference 136: 2144–62. [Google Scholar] [CrossRef]
- Simionescu, Mihaela. 2018. What drives economic growth in some CEE countries? Studia Universitatis Vasile Goldis Arad–Economics Series 28: 46–56. [Google Scholar] [CrossRef] [Green Version]
- The World Bank. 2020. The Worldwide Governance Indicators. Available online: https://info.worldbank.org/governance/wgi/ (accessed on 10 December 2020).
- Titarenko, Deniss. 2006. The influence of foreign direct investment on domestic investment processes in Latvia. Transport and Telecommunication 7: 76–83. [Google Scholar]
- Vahter, Priit. 2004. The effect of foreign direct investment on labor productivity: Evidence from Estonia and Slovenia. In University of Tartu Economics and Business Administration Working Paper (32-2004). Tartu: Tartu University Press. [Google Scholar]
Figure 1.
Inclusion probabilities for each of the potential covariates for Estonia, general case (2004–2017).
Figure 1.
Inclusion probabilities for each of the potential covariates for Estonia, general case (2004–2017).

Figure 2.
Inclusion probabilities for each of the potential covariates for Estonia, restricted case (2004–2017).
Figure 2.
Inclusion probabilities for each of the potential covariates for Estonia, restricted case (2004–2017).

Figure 3.
Inclusion probabilities for each of the potential covariates for Latvia, general case (2004–2017).
Figure 3.
Inclusion probabilities for each of the potential covariates for Latvia, general case (2004–2017).

Figure 4.
Inclusion probabilities for each of the potential covariates for Latvia, restricted case (2004–2017).
Figure 4.
Inclusion probabilities for each of the potential covariates for Latvia, restricted case (2004–2017).

Figure 5.
Inclusion probabilities for each of the potential covariates for Lithuania, general case (2004–2017).
Figure 5.
Inclusion probabilities for each of the potential covariates for Lithuania, general case (2004–2017).

Figure 6.
Inclusion probabilities for each of the potential covariates for Lithuania, restricted case (2004–2017).
Figure 6.
Inclusion probabilities for each of the potential covariates for Lithuania, restricted case (2004–2017).

Publisher’s Note: MDPI stays neutral with regard to jurisdictional claims in published maps and institutional affiliations. |
© 2021 by the authors. Licensee MDPI, Basel, Switzerland. This article is an open access article distributed under the terms and conditions of the Creative Commons Attribution (CC BY) license (https://creativecommons.org/licenses/by/4.0/).
Share and Cite
MDPI and ACS Style
Cieślik, A.; Gurshev, O. Factor Endowments, Economic Integration, Round-Tripping, and Inward FDI: Evidence from the Baltic Economies. J. Risk Financial Manag. 2021, 14, 348. https://0-doi-org.brum.beds.ac.uk/10.3390/jrfm14080348
AMA Style
Cieślik A, Gurshev O. Factor Endowments, Economic Integration, Round-Tripping, and Inward FDI: Evidence from the Baltic Economies. Journal of Risk and Financial Management. 2021; 14(8):348. https://0-doi-org.brum.beds.ac.uk/10.3390/jrfm14080348
Chicago/Turabian StyleCieślik, Andrzej, and Oleg Gurshev. 2021. "Factor Endowments, Economic Integration, Round-Tripping, and Inward FDI: Evidence from the Baltic Economies" Journal of Risk and Financial Management 14, no. 8: 348. https://0-doi-org.brum.beds.ac.uk/10.3390/jrfm14080348