1. Introduction
The insurance industry continues to play an important role in the financial and economic development of a country (
Islam et al. 2021). The willingness of insurance companies to cushion individuals and financial institutions from financial risks contributes to an increased demand for people to spend and grow more resources. This contributes to an improvement throughout the performance of the economy as a result of the gross domestic product (GDP) (
Dash et al. 2020). By incorporating risk pooling as well as reducing the effect of major losses on companies and families, the industry decreases the amount of capital required to fund these losses individually, promoting increased production, expenditure, innovation and competitiveness (
Asongu and Odhiambo 2020). By implementing risk-based insurance premiums, the industry can adjust the behaviour of business firms leading to the avoidance of injuries, improved quality of care and productivity gains. As long-term investment intermediaries, insurance companies can play a pivotal role in the sustainability of long-term finance and more cost management (
Asongu and Odhiambo 2019). Ultimately, the industry will also increase the performance of other components of the economic industry, including banking as well as bond markets, for instance, by improving the valuation of assets through mortgage protection and lowering default risks through credit guarantees and improvements. Empirical findings typically find evidence to support the correlation between the development of the insurance industry and economic growth (
Akinlo and Apanisile 2014). Given the critical role which the insurance sector must play in economic and financial development and the logical evidence that the sector has facilitated economic growth, minimal studies have investigated the dynamics that drive the expansion of the insurance industry. Furthermore, the majority of established empirical research enhances the development of the insurance sector, as gauged by premiums paid (
Rakshit 2017;
Okonkwo and Eche 2019).
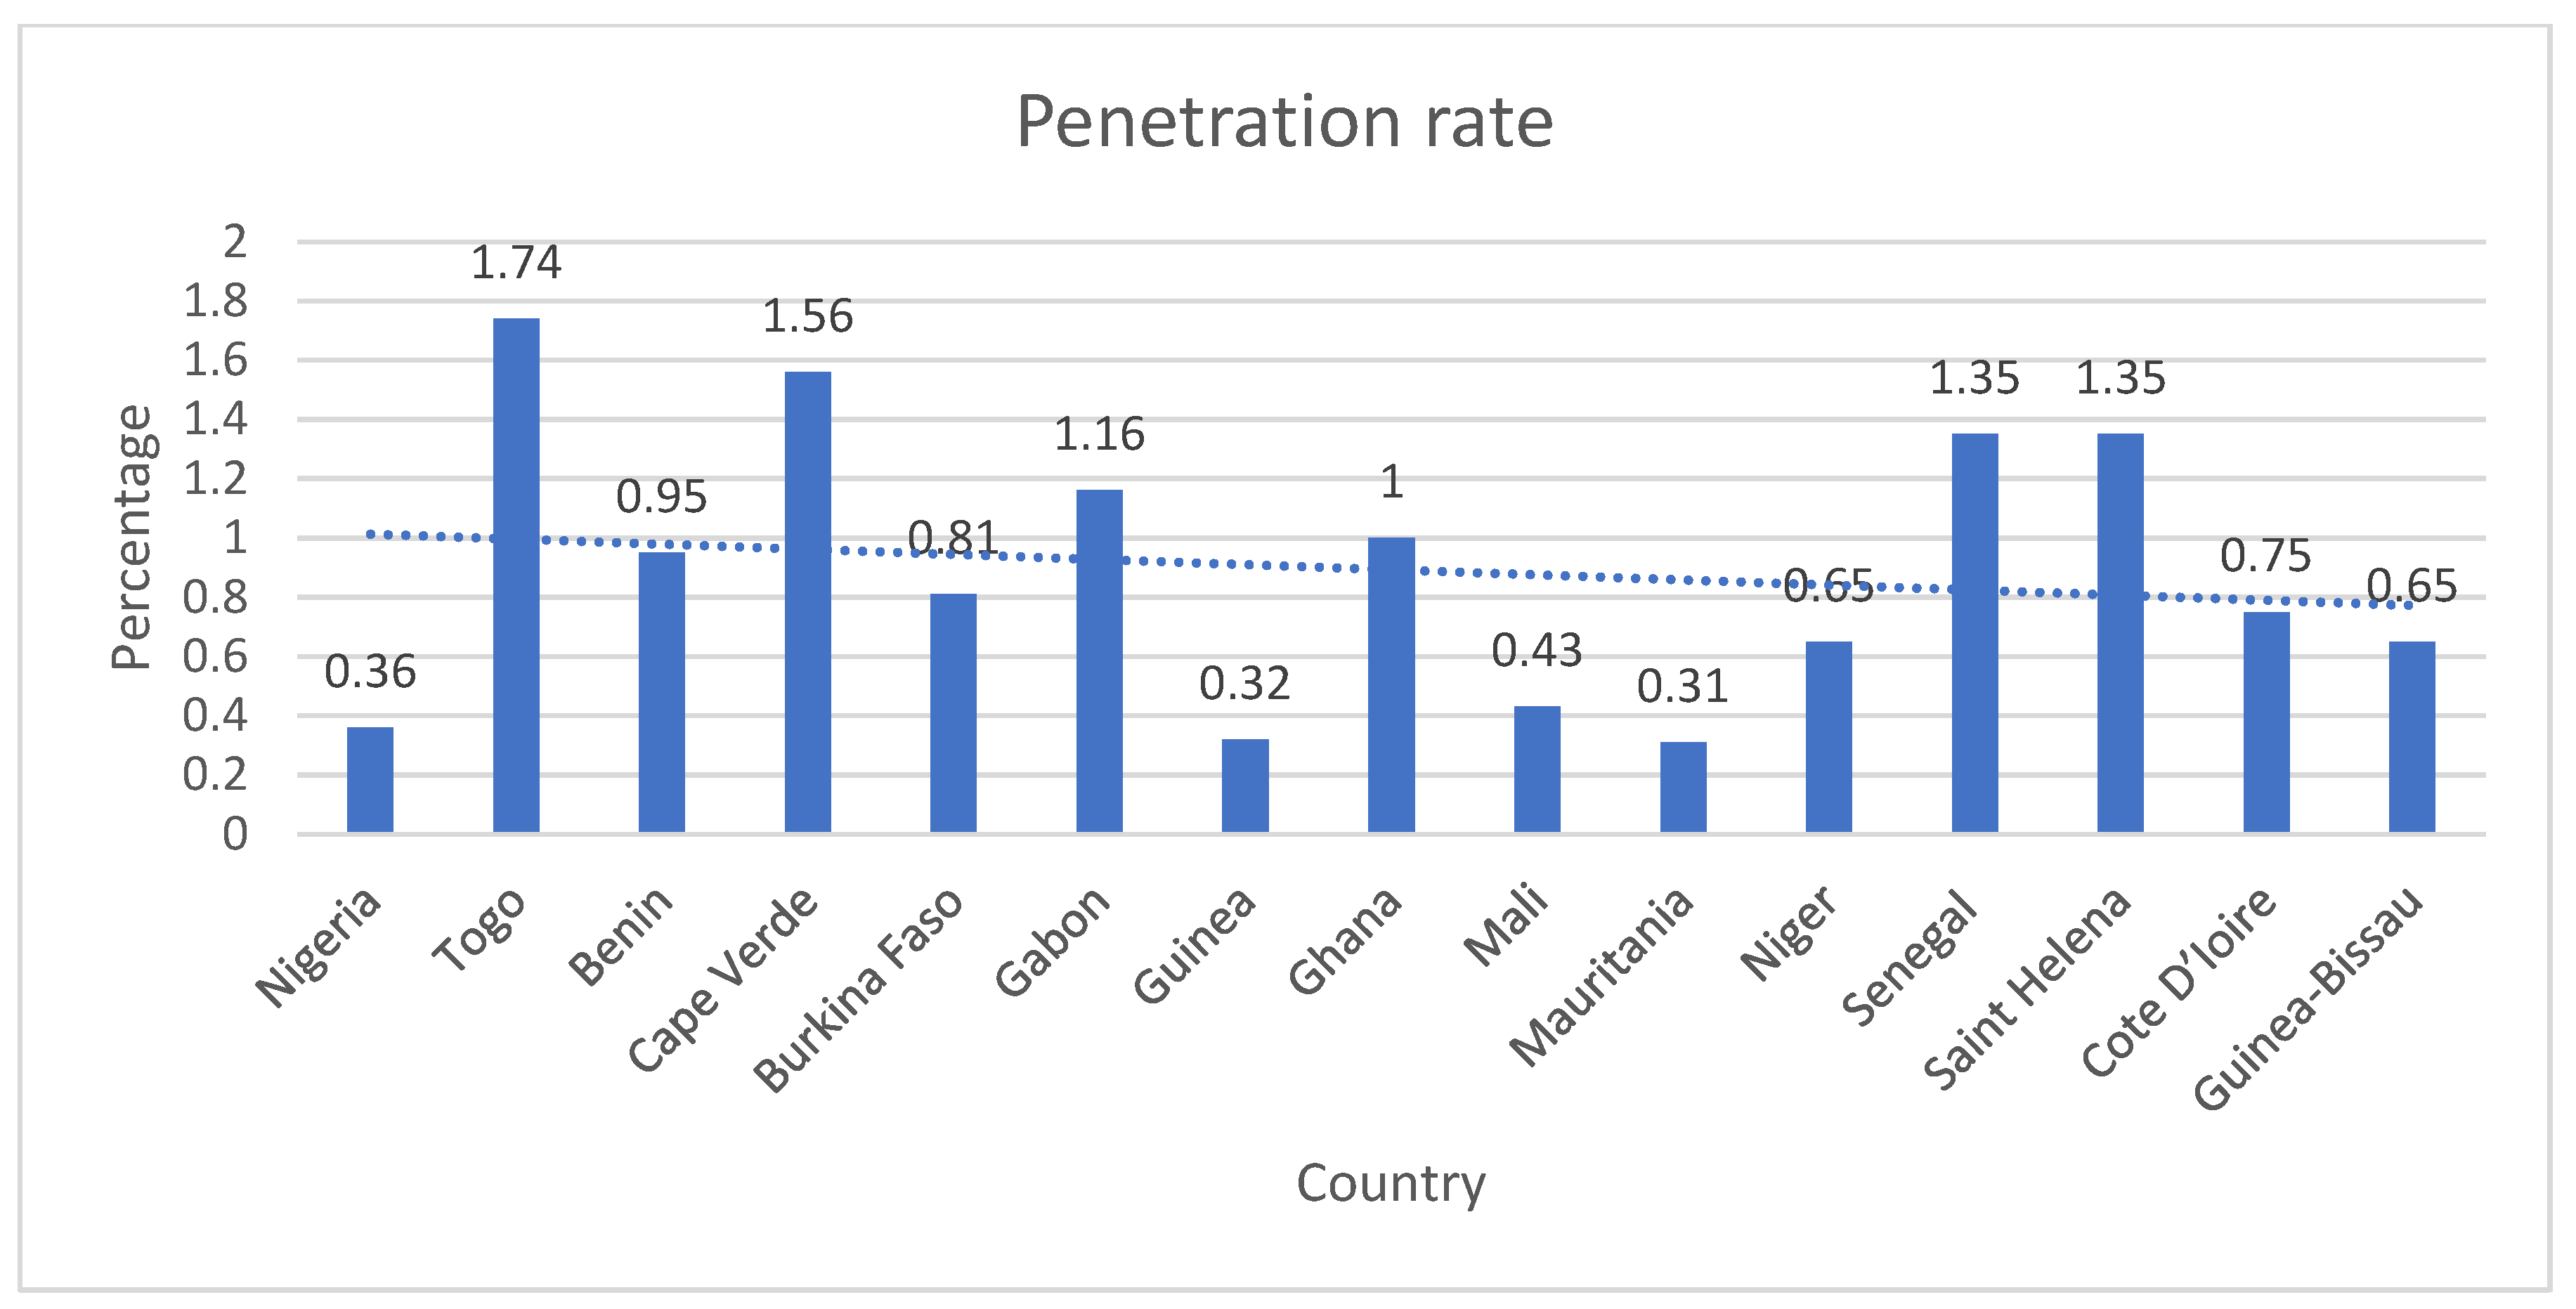
The African insurance sector remains poorly penetrated in the world, with high growth potential (
Olayungbo and Akinlo 2016). The market is facing major transformation, and the changing preferences of its clients are affecting the future of the industry. Notwithstanding the scope for growth of the insurance industry in Africa, some regions of Africa, such as West Africa, have shown extremely low penetration compared to other regions on the continent (
Alhassan and Fiador 2014). It has been identified that there are many reasons affecting low insurance penetration in West Africa including lack of information and public understanding of insurance products and benefits, negative attitudes, cultural and religious values, inappropriate goods, small distribution channels, to name a few (
Africa Insurance Market 2020). The degree of insurance penetration in a country suggests that markets are able to embrace insurance as a risk reduction policy and a source of investment. Low insurance penetration is an indication of less growth (
Olayungbo and Akinlo 2016).
As a result, this paper aims to examine the determinants of insurance penetration in West Africa, acknowledging variables that lead to insurance penetration in countries with high insurance penetration that may be deficient in countries with low insurance penetration. Most of the theoretical queries and insurance demand reviews have centred on individual developed countries or have been advanced across continent-wide queries. Less exposure is paid to developing countries when there are identifying conditions that deter the growth of insurance markets. This study undertakes to investigate the determinants of insurance penetration in West Africa. Lessons can be taken for less developed countries by distinguishing variables that lead to the consumption of insurance and how to enhance these variables in order to grow an insurance market that can promote economic growth. This is a great benefit of creating a thriving insurance industry.
The contribution to literature offered by this study firstly involves using a panel auto regressive distributed lag (P-ARDL) approach, as researchers investigate the determinants of insurance penetration in West African countries. Our inclination to initiate this research lies in the fact that the insurance sector substantially qualifies both the stability of a financial system and the economic growth of a country. In view of the need to examine the effect of economic indicators on the estimation and control of the potential systemic risk of insurance companies, the Western African region was considered both important and interesting in the context of this issue. To the best of our knowledge, this paper will, for the first time, investigate the determinants of insurance penetration as a regional study using West African countries and a (P-ARDL) method.
Furthermore, this study is a regional study, which is the first of its kind on insurance companies in West Africa. This study will be of interest to regulators and financial system institutions, economic analysts and other subjects in West African countries in order to carry out a timely analysis and forecast of the trend in insurance market growth. According to the researchers’ knowledge, limited regional research has been conducted on the same subject within the continent of Africa.
For easy flow of presentation, the next section, Section Two, presents a brief description of the insurance sector in West Africa, followed by the review of prior related studies and hypotheses development in Section Three. Section Four presents the methodology; model estimation and discussion are presented in Section Five, and the conclusions and recommendations are presented in Section Six.
3. Review of Prior Related Studies and Hypotheses Development
Inflation rate influence on insurance penetration: Studies conducted by
Ehiogu and Eze (
2018),
Alhassan and Biekpe (
2016) and
Das and Shome (
2016) have shown that inflation or price stabilisation is a main undesirable driver of insurance demand as higher inflation rates contribute to comparatively higher demand in the immediate term. The impact of increased inflation tends to be more serious for marginalised people with low income, as their earnings, which are typically produced by sporadic and informal means, take longer to respond to inflation fluctuations, thus weakening their actual buying power. Although higher necessities prices represent a meaningfully above average amount of their disposable income, fewer funds are available for the acquisition of a funeral insurance policy. As a result, this phenomenon is projected to adversely affect the traditional funeral insurance industry, potentially pushing low-income earners to use informal networks to satisfy their insurance needs.
Hypothesis 1 (H1): Inflation rate does not determine insurance penetration in West African countries.
Education influence on insurance penetration: Empirical studies have shown that there is a significant and optimistic correlation between the concentration of education and intake of life insurance (
Kamau 2013;
Dragos 2014).
Outreville (
2015) suggested that higher education helps people to be aware of all types of life insurance, those who protect themselves and their dependents easily.
Pradhan et al. (
2016) concluded that there is a favourable connection between higher education and the use of life insurance. As life insurance is part of the total insurance, it is therefore clear that education has an impact on insurance penetration.
Hypothesis 2 (H2): Education does not determine insurance penetration in West African countries.
The productivity of labour’s effect on insurance penetration: This determinant reflects the relationship between output and the labour input unit (
Oluoma 2017). Labour production is a cornerstone of economic development in the world (
Melchor-Ferrer 2020). Performance in labour efficiency tends to produce more profits (
Oluoma 2017). The amount of the individual’s salary determines life insurance. Life insurance provisions therefore have an indirect effect on labour efficiency. It can also be argued that insurance penetration is often influenced by labour efficiency.
Hypothesis 3 (H3): Productivity of labour does not determine insurance penetration in West African countries.
Dependency ratio’s influence on insurance penetration: According to
Guerineau and Sawadogo (
2015), the age-population ratio is the ratio between those usually not in the labour force (the dependent part) and those usually in the labour force (the active part). It is used to calculate the strain on the productive workforce. Some of the studies break this further into old age dependency and young age dependency.
Zerriaa et al. (
2017) analysed the relationship between insurance demand and the dependency ratio. Many scholars found that with some finding a stronger connection, the relationship was positive. This result is surprising for life insurance consumption as one would assume young age dependence to be relevant but not old age dependence. To alleviate the financial susceptibility that comes with damage of a principal income earner, it is assumed that the greater the number of dependents per person, the greater the need for life and funeral insurance. A higher dependence ratio suggests higher vulnerability amongst individuals, and consequently, they will consume more insurance (
Zerriaa et al. 2017).
Hypothesis 4 (H4): Dependency ratio does not determine insurance penetration in West African countries.
Income influence on insurance penetration: Research has suggested that there is a good association between income level and life insurance (
Das and Shome 2016;
Ndalu 2011). Most recent research draws the conclusion that income (as measured by per capita income) has a positive and significant influence on insurance premiums. On the other hand, the major conclusion of income inequality on demand for life insurance is confusing (
Putra 2017;
Reschiwati and Solikhah 2018). While demand should generally increase with income, very affluent groups may not even need life insurance because they have sufficient assets, while very poor people do not have enough means to buy life products. As
Dragos (
2014) argued, insurance may usually be more affordable to the higher classes, but life insurance can also be cheap to the middle classes in lower-income countries. In such cases, the presence of a wealthier upper class could boost the market for insurance. In total, the market for insurance will depend on the correlation between the sum of income along with the income distribution, which may make the influence of income disparities on the market for insurance unclear.
Dragos (
2014) found that higher inequality (as measured by the Gini coefficient) does not have a considerable bearing on the demand for life insurance.
Hypothesis 5 (H5): Income level does not determine insurance penetration in West African countries.
Theoretical Framework: The Theory of Insurance: Individuals and business organisations are defined as risk-takers in classical theory. The degree of risk-taking relies on each particular entity’s risk preferences. Some risk must be recognised by companies and individuals who operate a business, however, they can pass it to an insurance provider at a premium instead of keeping this risk (
Poposki et al. 2015). Many business entities have a potential risk correlated with them, which varies depending on the market and the sector in which the organisation operates. This means that the danger may be identified, but it is not possible to assess its magnitude. The severity may be known to some extent, but not the frequency. As a way of padding or reducing the loss that could occur, any reasonable economic agent will want to pass on or reduce that risk (
Talesh 2015).
4. Methodology
As a quantitative study, this study falls under the positivist paradigm. Secondary data traced and extracted from the World Development Indicators and International Financial Statistics (IFS) for 15 countries (Nigeria, Togo, Benin, Cape Verde, Burkina Faso, Gabon, Guinea, Ghana, Mali, Mauritania, Niger, Senegal, Saint Helena, Cote D’Ioire and Guinea-Bissau) for the years 1999 to 2019 was used for this study. Quarterly data was extracted from the databases to increase the frequency of the data as required by P-ARDL. P-ARDL, introduced by
Chudik and Pesaran (
2013), was used to examine the determinants of insurance penetration in West Africa. The justification of P-ARDL is that it is a flexible technique as it sets no constraint on having variables to be integrated in an order. More so, variables integrated at order I (1) and I (0) can be used (
Gerni et al. 2013). Furthermore, P-ARDL gives reliable and steady estimates of long-run coefficients in as much as they are asymptotically normal irrespective of their order, either I (0) or I (1). Despite the possibility of endogeneity, P-ARDL utilises both the lags of dependent variables and the regressors, hence it gives reliable coefficients (
Pesaran et al. 2001). Most importantly,
Akinlo (
2008) posits that the pre-testing glitches encountered in the other cointegration techniques are evaded using P-ARDL estimation.
Pesaran et al. (
2001).
The model for this study is:
Therefore, explicitly, the dynamic form is:
The explicit description of the variables is stated thus in
Table 1 below:
The Model in P-ARDL format:
where ∆ signifies the first difference operator,
signifies the selected number of lags and
signifies the optimal lag length.
is the constant term and
is the composite error term.
are the short-run coefficients of the regressors, respectively, while
are the long-run coefficients of the regressors.
represents the number of countries (15) examined, while
represents the number of years examined (21).
To achieve the objective of this study, the first step was to conduct the unit root test; the second was to test for the cross-sectional dependence of residuals; the third was to determine the optimal lag length; the fourth was to apply the P-ARDL to survey the short- and long-run relationship using the null and alternate hypothesis: and the alternate hypothesis:
This was done using an error correction model, which postulates the dynamic coefficients of the short-run deviation from the long-run. The model will then be:
are the dynamic short-run model coefficients while the speed of adjustment is denoted by
. The decision criteria is that the null hypothesis of no cointegration is rejected if the F-statistic is higher than the upper bounds value, and on the other hand should be accepted if the calculated F-statistic is smaller than the lower bounds value (See Pesaran critical bounds table in
Pesaran et al. (
2001)).
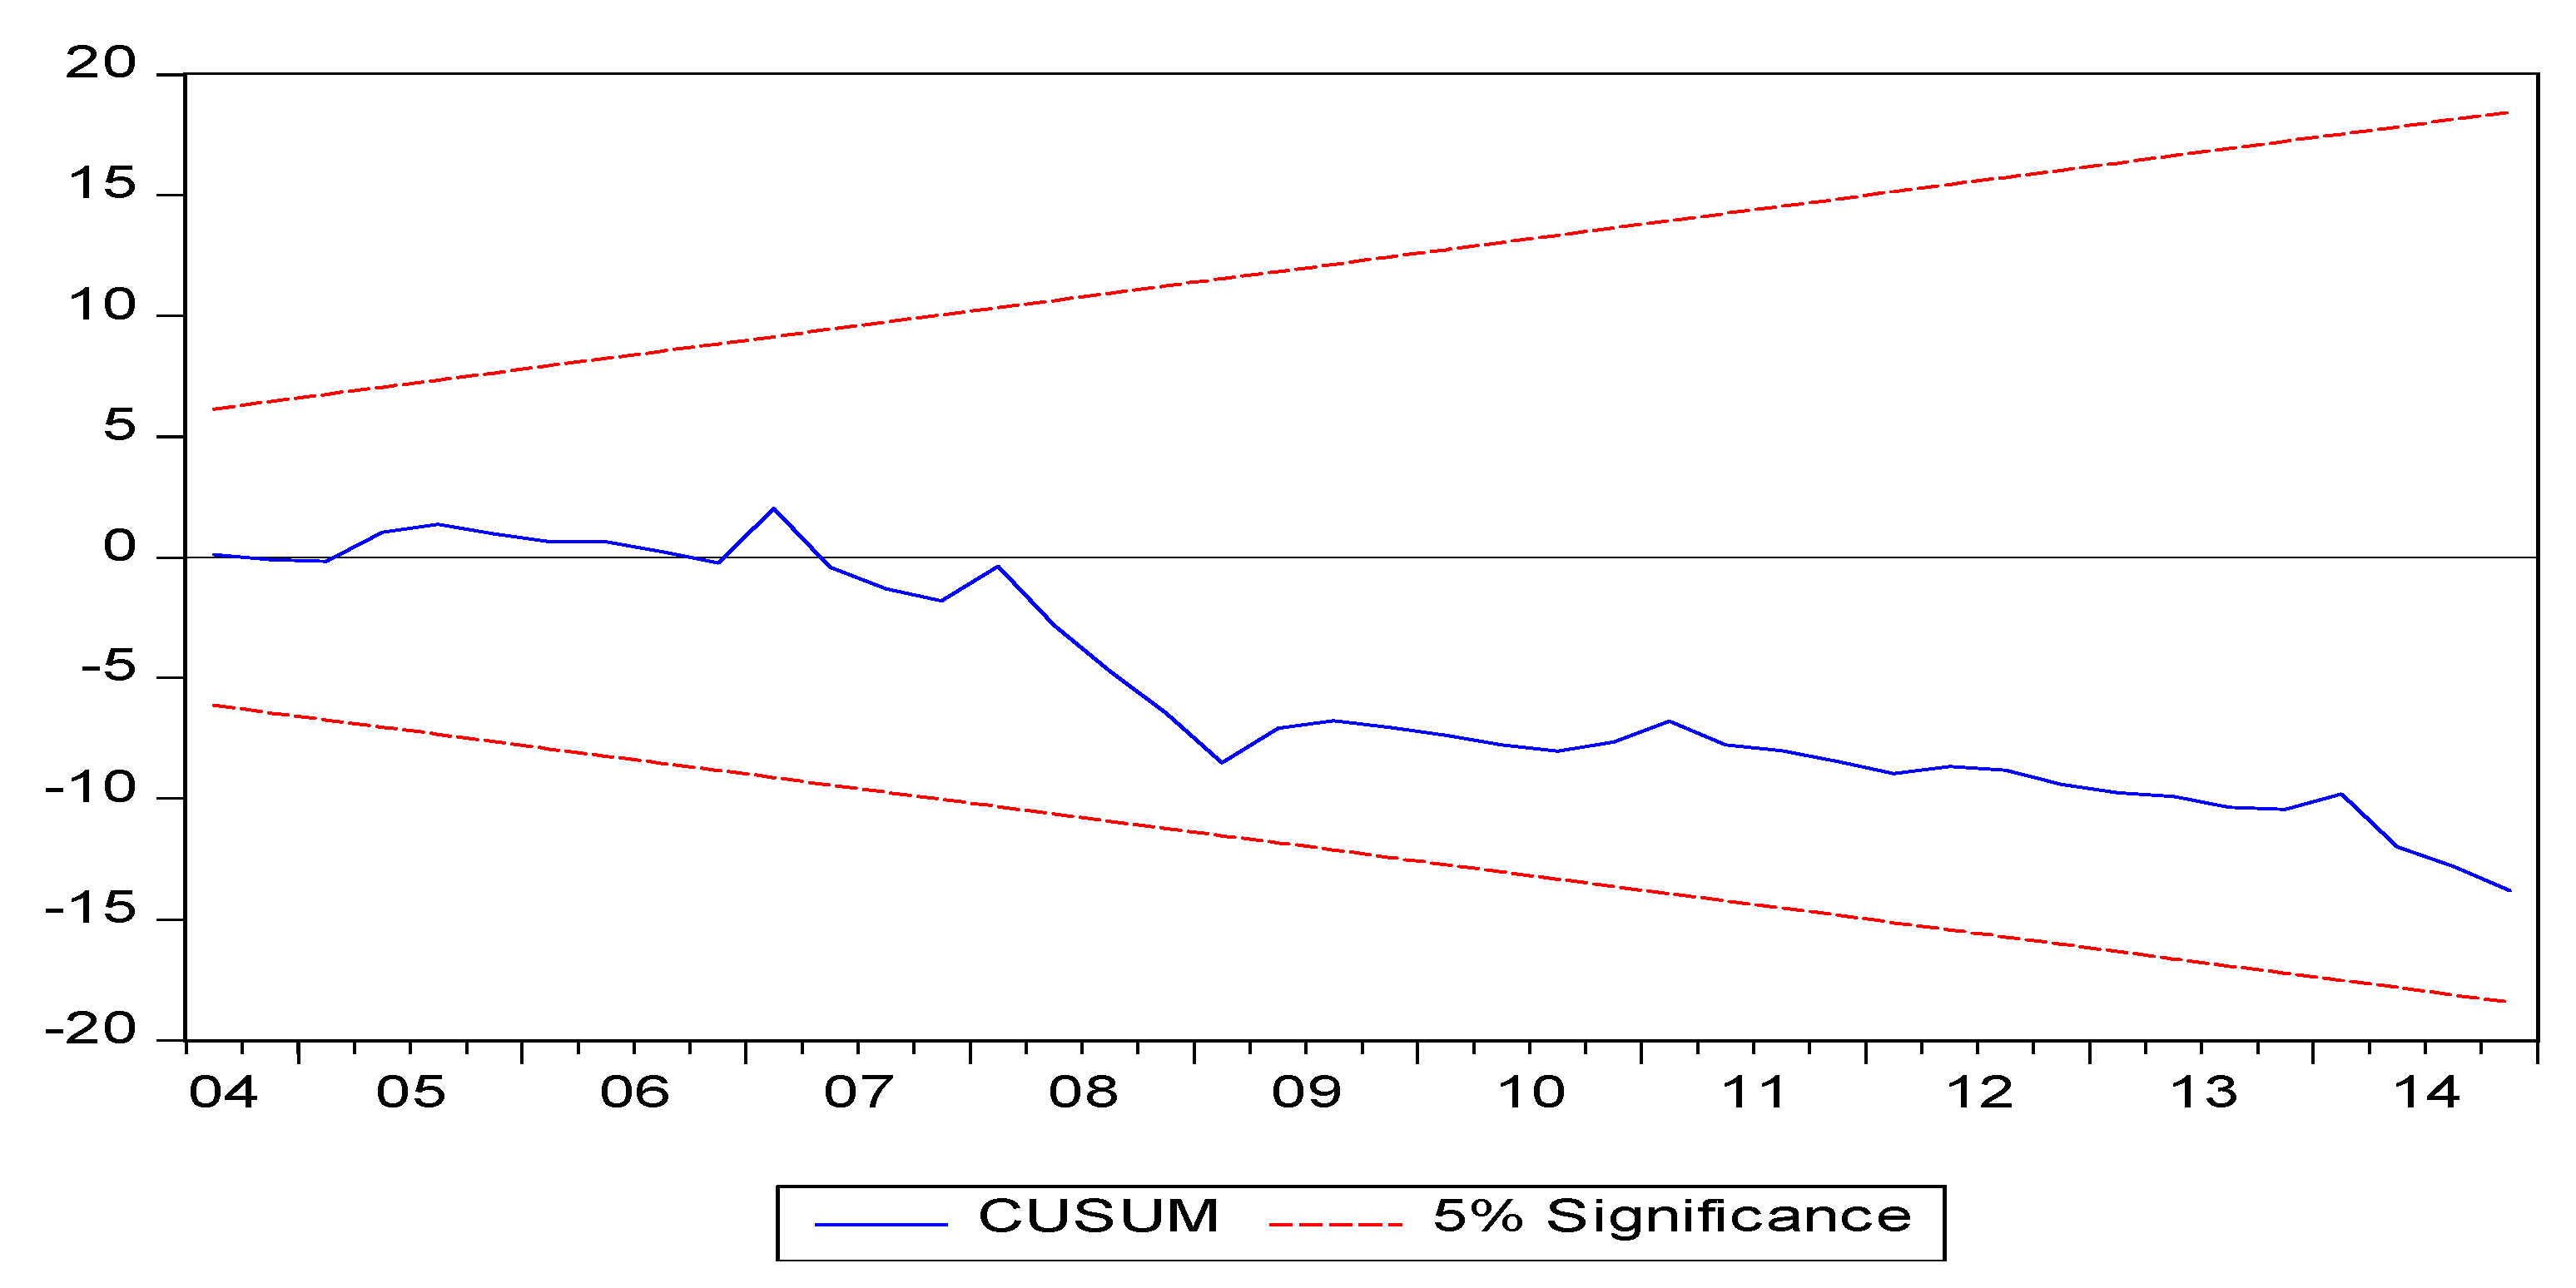
The fifth was to estimate the P-ARDL and finally, estimating the serial correlation and recursive CUSUM test at 5% level of significance to check the reliability of the estimations conducted.
5. Model Estimation and Discussion
Basically, the essence of the unit root test is to justify the reliability of data and the results of the analysis. From
Table 2, all the variables in this study were stationary at level and order, one as all the probability values were significant at 1, 5 and 10%. Categorically, INP, which is the dependent variable, was stationary at order 1 and this justifies the test of cointegration among the variables. This result is in line with the postulation of
Pesaran et al. (
2001), hence the use of a P-ARDL model.
Test for Residual Cross-Sectional Dependency (RCD): This test was run to ensure the absence of cross-sectional dependency across the 15 countries and to justify the panel data model in this study. For this study, the Pesaran scaled LM, Pesaran cross dependence (CD) and robust Breusch–Pagan LM tests were conducted to depict if there is correlation among the residuals or not. The yardstick for this test is to accept H0 when the probability value is less than 5% and reject H0 when the probability value is more than 5% for the hypotheses:
, no correlation of the residuals exists.
, correlation of the residuals exists.
Based on the results shown in
Table 3, the null hypothesis is accepted while the alternate hypothesis is rejected. It is therefore concluded that there was no cross-sectional dependence of residuals in the model for this study due to the 1% significant level of all the three tests.
Optimal Lag Selection and Justification of Selected Model: ARDL gives room for adequate lag selection of more than two (2) and this has made it more beneficial than other conventional cointegrating techniques (
Giles 2013). The optimal lag number is said to be the lag with the smallest Akaike information criterion (AIC) and Schwarz information criterion (SIC): a lower AIC and SIC value is said to lead to a better model. Thus, the optimal lag for this study is six (6) as it is the lowest and positive AIC and SIC value, as shown in
Table 4 below.
From the lag selection table, the model with the least AIC is the best model (
Bahmani-Oskooee and Brooks 2003;
Ahmad and Du 2017). Based on the fact that the lower the AIC, the better the model, model 3, 5, 5, 1, 4, 6 is the best as it gives the least positive AIC value of 47.113.
Furthermore, using the Wald test, a cointegration relationship among the variables in this study was detected.
The results in
Table 5 indicate that a long-run relationship exists among the variables. From the bound testing, F statistics of 4.652 was greater than the 4.01 upper bound critical value at 5%. The long-run relationship was confirmed among the variables following the decision rule to reject the null hypothesis when F-statistics is more than the upper bound value. Therefore, the P-ARDL estimate is shown in
Table 5 below, revealing the long-run and short-run estimations of the examined variables.
From
Table 6, the result from the long-run estimate shows that all the variables examined were significant determinates of insurance penetration in West African countries at a 1% significant level. However, education and dependency ratio have a negative effect on insurance penetration. The negative effect of education on insurance penetration contradicts the findings of
Das and Shome (
2016) in India but aligns with the findings of
Alhassan and Biekpe (
2016) in Africa and
Zerriaa et al. (
2017) in Tunisia. Higher education leads to the ability to spread portfolios and manage risk such that people invest in risky financial instruments that can generate higher return on investment (ROI) rather than investing in insurance which can be referred to as a safe investment. Hence, the more proportion of educated people, most importantly the financial literates in an economy, reduces the investment in insurance as they can easily invest in other sectors. This implies that improved education has not been accompanied by the consciousness of financial service benefits. Based on the formulae used to capture this variable, it is concluded that tertiary education might justify this negative effect since the tertiary education field of specialisation varies and not all are centred on financial services. This negative effect of dependency ratio on insurance penetration aligns with the findings of
Zerriaa and Noubbigh (
2016),
Alhassan and Biekpe (
2016) and
Das and Shome (
2016) and with the life-cycle hypothesis, but negates the findings of
Zerriaa et al. (
2017). This implies that real income per capita is reduced by improving the dependency ratio and this inadvertently impacts negatively on insurance penetration.
Unlike the education and dependency ratio, inflation, labour productivity and income have a positive effect on insurance penetration. The positive effect of inflation on insurance penetration negates the findings of
Hwang and Greenford (
2005),
Alhassan (
2016) and
Alhassan and Biekpe (
2016), who concluded that inflation should wear down the value of insurance services. However, the findings are in line with
Das and Shome (
2016). This finding implies that during inflation, there is the tendency of fear of the unknown or fear about the future, which will result in people investing higher amounts of money in the insurance sector to secure their life and assets. Likewise, the positive effect of labour productivity indicates that the productive labour force tends to insure its assets and/or life as there are adequate funds emanating from productivity. Although this finding contradicts the finding of
Das and Shome (
2016), it conforms to the study of
Oluoma (
2017).
A positive effect of income level on insurance penetration aligns with
Ndalu (
2011),
Dragos (
2014),
Çelik and Kayali (
2009) and
Zerriaa et al. (
2017). This finding implies that as income increases, insurance turns out to be more affordable. Per capita income, which was used to proxy the income, indicates the standard of living for a nation. The positive effect and significance of income signals that there is an equitable income in the economy which is used to maintain the standard of living of citizens. This greatly and positively affects the insurance sector penetration because they find it affordable, and the insurance sector is one of the major divisions of the financial sector of an economy
From the short-run estimates, all the factors examined at various lagged periods are significant at either 1, 5 or 10%, except for some of the lagged periods that are not significant. Contrary to the long-run estimate, inflation has a negative effect on insurance penetration, while other variables have the same direction of relationship as the long-run estimates. This implies that an increased price leads to economic hardship, which invariably reduces people’s investment in insurance.
Overall, in the short- and long-run, inflation, education, labour productivity, dependency ratio and income are the significant determinants of insurance penetration in West Africa.
From
Table 7,
Rabbi (
2011) and
Rabbi et al. (
2013) posited that a very significant cointegrating error correction term (ECT) is a revelation of the existence of a stable long-run relationship between the variables of the study. Using a period lagged ECT cointegration among variables is further confirmed. The coefficient of error correction reveals the speediness at which the variables go back to equilibrium, and hence, adjust to the accurate direction. Generally, ECT must have a negative sign and be statistically significant. –0.564 divulges that the previous disequilibrium takes a reasonable speed of about 56% to regulate to long-run equilibrium every quarter over the years. Furthermore, the probability value of 0.003 reveals statistical significance at 1%, which is an assurance that the long-run equilibrium is achievable quarterly. Thus, there is a steady, stable and consistent long-run relationship among the variables of this study.
Post Estimation Tests: Serial correlation and a CUSUM test were conducted to confirm the reliability of the findings of this study.
Table 8 shows the Breusch–Godfrey serial correlation LM test. The null hypothesis is accepted because the probability is more than 5%. Thus, no serial correlation exists in the model estimated with the insignificance of the probability value (0.205).
Following this, to determine the stability of the model, a CUSUM test was conducted.
From
Figure 3, the CUSUM test reveals the stability and steady nature of the variables used in the study. The CUSUM test conducted in this study shows the stability of the model at a 5% significance level. This is because the blue line falls between the two red/restricted lines and this justifies the stability, reliability and effectiveness of the model with stable recursive residuals.
Tests for Short-Run Causality: This study further tested for short-run causality among the variables using the decision rule: Accept null hypothesis when the P-Value is greater than 5% and reject the null hypothesis when P-Value is less than 5%. The following hypothesis was tested. and the alternate hypothesis:
there is no short run causality between the independent and dependent variable.
there is short run causality between the independent and dependent variable.
This causality test seeks to detect if pairs of the regressors will jointly cause the insurance penetration in west Africa. As shown in
Table 9 below,
(1) combines inflation rate and education ratio;
(2) combines education ratio and productivity of labour;
(3) combines productivity of labour and dependency ratio,
(4) combines education ratio and dependency ratio;
(5) combines inflation rate and productivity of labour;
(6) combines inflation rate and dependency ratio;
(7) combines dependency ratio and income level; and
(8) combines inflation rate and income level. We found all the tests were statistically significant at a 1% level. Thus, the null hypothesis that there is no short-run causality of the different pairs of variables and insurance penetration in West Africa is rejected. This means that all these pairs can jointly cause insurance penetration in West Africa.
6. Conclusions and Recommendations
Insurance penetration infers the contribution of the insurance sector to the GDP and also reveals the development of the sector. Taking motivation from low insurance penetration in Africa generally, this paper examined the determinants of insurance (life and non-life) in 15 West African countries from 1999 to 2019. It was found that the demographic variables examined are all significant both in the long- and short-run. Thus, it was concluded that education, productivity, dependency, inflation and income are the determinants of insurance penetration in West Africa. It is therefore recommended that these factors should inform the economy-wide policies developed by the government and the regulators of insurance markets in these economies. This is necessary because all these policies will promote or mar the growth of the insurance sector. Furthermore, finance-related modules should be electives among all courses of study in higher education institutions and should not be restricted to only commerce courses. This will lead to the exposure of students to the benefits of financial services. In fact, there should be a collaboration between the education sector and insurance such that relevant research that is relevant in the 21st century can be conducted and the findings practically applied.
Moreover, the research and development segment of insurance should investigate the viability of growth opportunities in the insurance sector. This will ensure that growth opportunities are maximised accurately and efficiently. In the same manner, the youth or active group of the population must be exposed to financial literacy training by insurers such that the awareness of the benefits associated with insurance will be made known and there will be intensified effort to make insurance known to them as a safe and viable investment. Lastly, “Bancassurance” should be encouraged in these economies as the intensification of cooperation between the banking and insurance sectors makes access to their services easy and possible. Thus, penetration to insurance business will be much easier and more reassuring in West Africa.
It is of importance to note that COVID-19 control and mitigation measures in Africa, inclusively in West Africa, have restricted the movement of goods, services and people. This also has a significant impact on insurers’ operations because of the physical engagement required. This has massively affected insurers’ ability to collect premiums, service existing customers, unveil new products, conclude innovative sales strategy and process and clear outstanding claims.
Hence, it would be better to have further researchers conduct studies on the impact of COVID-19 on insurance penetration in Africa. In addition, this same study should be carried out in other sub-regions of the African continent to enable a comparison of all economic regions on the continent. This will give room to uniform determining factors of insurance penetration on the continent, which will reflect in their policies and greatly improve the penetration of insurance on the continent. Likewise, the determinants of life and non-life insurance penetration can be examined separately to be able to discover the uniqueness of each stream of insurance business.


