
Enhancing Oil Recovery from Chalk Reservoirs by a Low-Salinity Water Flooding Mechanism and Fluid/Rock Interactions


Department of Petroleum Engineering, University of Stavanger, 4036 Stavanger, Norway
*
Author to whom correspondence should be addressed.
Energies 2017, 10(4), 576; https://0-doi-org.brum.beds.ac.uk/10.3390/en10040576
Submission received: 7 February 2017
/
Revised: 20 March 2017
/
Accepted: 17 April 2017
/
Published: 22 April 2017
(This article belongs to the Special Issue Oil and Gas Engineering)
Abstract
:Different Low Salinity Waters (LSWs) are investigated in this work to understand the role of some ions, which were recognized from our previous work and the literature for their effect on wettability alteration. Different flooding stages were followed. The primary stage was by injecting synthetic seawater (SSW) and the secondary stage was with SSW diluted by 10 (LSW 1:10) and 50 (LSW 1:50) times, single and two salt brines, such as Na2SO4, MgCl2, and NaCl+MgCl2 at 70 °C. The flooding sequence was due to that most of the fields in the North Sea were flooded with seawater. Two flooding rates were followed, 4 PV/day (PV = Pore Volume) and 16 PV/day in all the experiments. One of the observations was the increase of the pH during the flooding with LSW and single salt brines. The increase of the pH was attributed to mineral precipitation/dissolution as the results of ionic interactions. The effluent ion concentrations measured to understand the most likely oil recovery mechanisms. The results showed that the higher the SSW dilution the slower the oil recovery response. In presence of SO42−, Ca/Mg, higher oil recovery. The exchange between Ca/Mg, was in line with field observations. A geochemical simulation was done for a comparison with the experimental data.
1. Introduction
During the early life of a reservoir, the hydrocarbons are extracted using the reservoir’s natural energy. As the pressure of the reservoir depletes, there is a need of maintain the reservoir pressure by means of some external help. Water injection has been proven to be an economical and effective secondary recovery method. Over the last decade, low salinity water (LSW) flooding has been considered as a viable Enhanced Oil Recovery (EOR) method. Several Lab experiments has been performed, which show a significant increase in oil recovery in chalk from LSW after the injection of high salinity water/brine.
Low Salinity Water Flooding is one of the emerging EOR techniques for wettability alteration in carbonate reservoirs. This technique is widely popular because of ease of injection into oil-bearing formations, its efficiency in displacing light to medium gravity crude oil, and low capital and operating cost, all of which lead to favorable economics compared to other EOR methods [1]. Initially, extensive laboratory studies have been conducted on sandstone rocks after producing 15% additional oil from a Kansas oil field [2]. The increase in oil recovery from sandstone rocks was found to be in the range of 5–20% of OOIP as reported in several studies [3,4,5,6].
Low Salinity Water Flooding was first attempted by [7], at the University of Wyoming. Since then both laboratory experiments and various field tests had shown that injecting modified water can help increase oil recovery. A number of low salinity water flooding mechanisms have been proposed, i.e., fine migration (dispersion of rock minerals), pH increase, double layer expansion effect and wettability alteration, including adsorption of SO42− with co-adsorption of Ca2+ and replacement of Ca2+ by Mg2+ on chalk surface because of increase in ion reactivity at higher temperature [8], but a concise mechanism which conforms to the LSW effect is still debatable. Based on whatever has been published so far in the literature, the mechanisms are mainly related to the presence of clay minerals, oil composition, and presence of formation water. Concentration of divalent ions (Ca2+, Mg2+, SO42−) and salinity level of high saline water in range of 1000 ppm–3000 ppm also play an important role in LSW effects [9].
This work is focused mainly on observing the effects of the type and concentration of ions on the increase in secondary recovery. From the experiments it has shown that the injection of water/brine with modified composition alters the wettability and enhances the oil recovery. These effects are linked to exchange of effective ions (Ca2+, Mg2+, SO42−) from/to the reservoir surface and brine. This work is concerned towards secondary injection of brine containing only a single ion (Mg2+/SO42−) and brines diluted in proportion of 1:10 and 1:50. Carbonate samples were recovered from the Bu-Hasa field in Abu Dhabi from the experiments observed by [10]. They observed an optimum concentration of SO42− at which highest recovery is obtained, which was 47 ppm.
This work also contributes towards confirming the best possible dilution ratio of SSW to observe optimum oil recovery. In addition, all the experiments were performed at 25 bar and 70 °C/90 °C. SSW is used as primary injection brine and brines with different monovalent and divalent cations were used as secondary injection brines. Effluent’s pH, pressure drop, and oil recovery were measured. Ion tracking results were obtained by ion chromatography and analyzed to assess the ion exchange between rock and brine.
2. Experimental
2.1. Materials
2.1.1. Porous Media
Stevens Klint (Denmark), chalk with an average permeability of 3.9 ± 0.5mD is used as the porous media for the experiments. Similar cores were created from the same rock. Stevens Klint chalk is stratigraphically comparable to the interval including the uppermost Tor formation and the lower Ekofisk formation in North Sea chalk reservoirs. All the core details such as, porosity, initial water saturation (swi), Residual Oil Saturation (sor) etc. are given in Table 1.
2.1.2. Oil
For experiments both crude oil and model oil were used. Model-oil—a mixture of n-decane and stearic acid—was used for the flooding experiments. The concentration of stearic acid in n-decane is 0.005 mole/L. n-Decane was supplied by Chiron AS (Trondheim, Norway) at 99% purity. Aldrich (Oslo, Norway) supplied stearic acid at 98.5% purity. Stearic acid acts as a natural surfactant and it is present in crude oils. The physical properties of synthetic oil are given in Table 2. A crude oil X, of a composition given in Table 3, is used for experiments. The Acid Number (AN) and Base Number (BN) for this crude oil is 0.06 KOH/g and 0.60 KOH/g, respectively. The physical properties and composition of the crude is given in Table 2 and Table 3.
2.1.3. Brines
Synthetic seawater (SSW) was used in the initial saturation of core and also as a primary injection brine in the flooding sequence. As a secondary brine, brines with different ionic composition were prepared and injected. Overall, six such modified brines are prepared, with different salt concentrations and dilution ratios, in distilled water (DW). The compositions of all the brines are given in Table 4.
2.1.4. Core Preparations and Flooding
The chalk cores were first dried at 100 °C for at least 48 h to remove all water that might be present in the pore spaces. Cores were then saturated with SSW using a vacuum setup. The initial water saturation was established at 25 bar and 50 °C. The saturated brine cores were flooded with the synthetic oil or crude oil X at different injection rates (0.02–0.2 mL/min) to establish initial water saturation for the core, swi (range 21−25%) and then aged for 2 weeks at 50 °C. Once the cores had aged, they were flooded with different LS brines at 70 °C/90 °C to perform the main experiment. The confining pressure was set at 25–30 bar, to simulate reservoir conditions and give a good seal between the heat-shrinkable plastic sleeve and core and the outlet pressure was set at 9–10 bar. For all the flooding experiment, the cores were weighed before and after to check for any discrepancy between the measured volumes and calculated saturations.
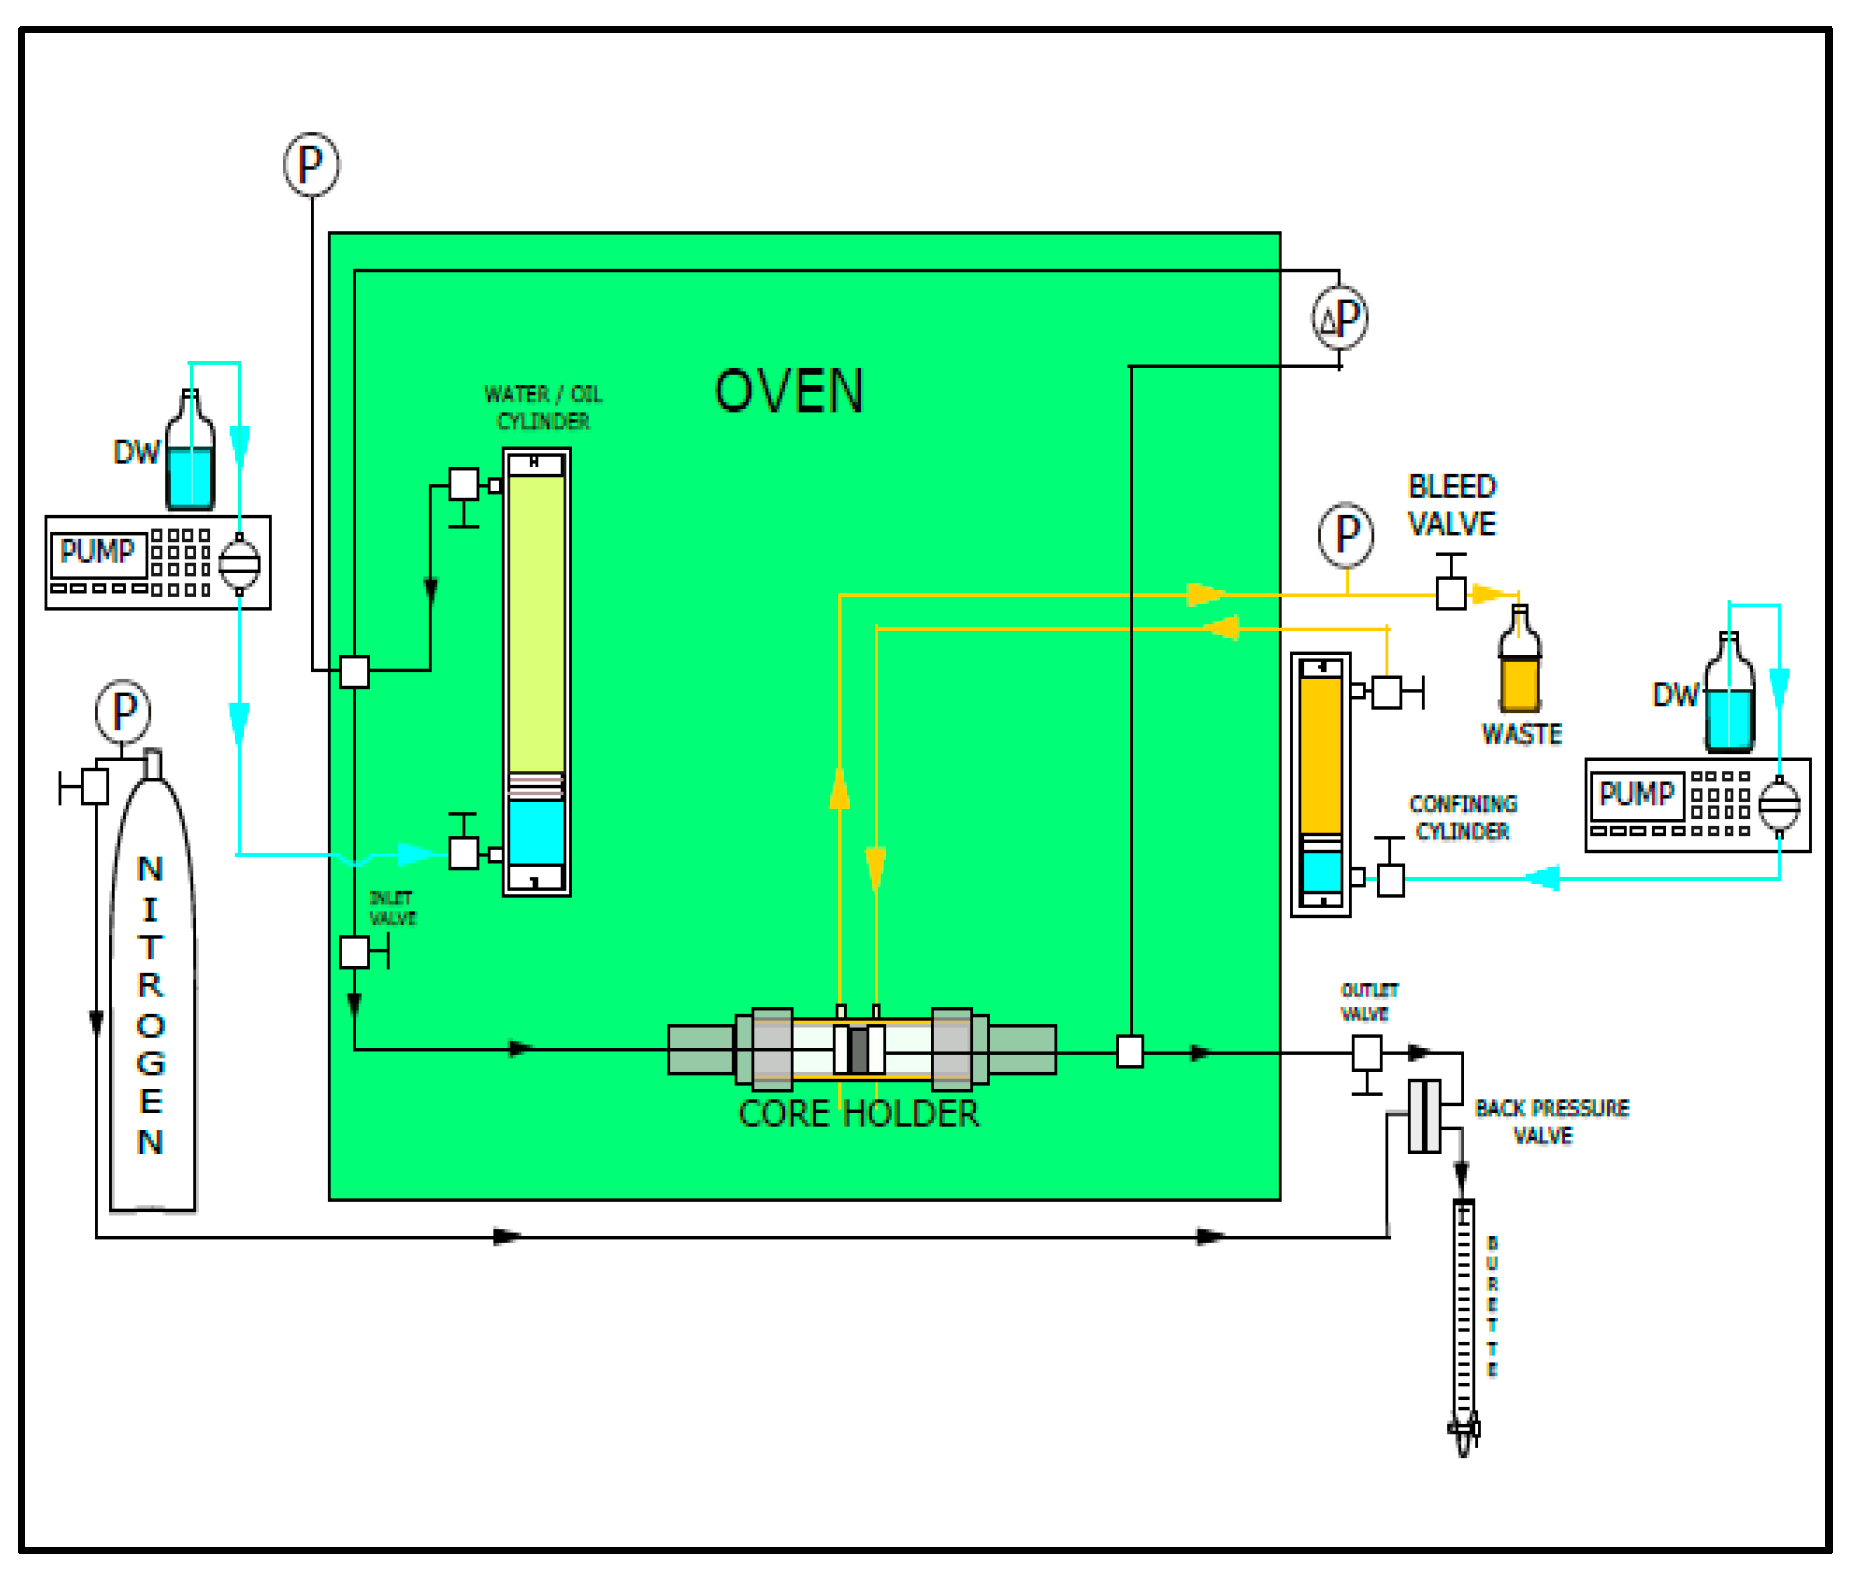
Each core was flooded for at least 4 PV (PV = pore volume) at the low flow rate of 4 PV/day, and then rest 4 PV of brine was flooded at the high flow rate of 16 PV/day. These flow rates were chosen to: (1) closely resemble rates at the reservoir; (2) compare the results obtained from the experiments performed in the laboratory earlier [11] and eliminate the capillary end effect. The schematic of system is shown in Figure 1. The pressure drop across the core was measured by the pressure gauge, and recorded using the Labview program. The effluent samples were collected after a preset interval, using a sample changer (Gilson, Middleton, WI, USA). The pH values of the effluent were measured using a Mettler Toledo pH meter (Mettler-Toledo, Hong Kong) at intervals. The ion tracking from the effluent were measured using an Dionex ICS-3000 chromatograph (ThermoFisher Scientific, Waltham, MA, USA). Data were processed after the analyses using the Chromeleon (Dionex) program.
3. Results and Discussion
In this work results were measured and analyzed during secondary injection of low salinity (LS) brines and single salt brines.
3.1. Oil Recovery from Secondary Flooding with LS
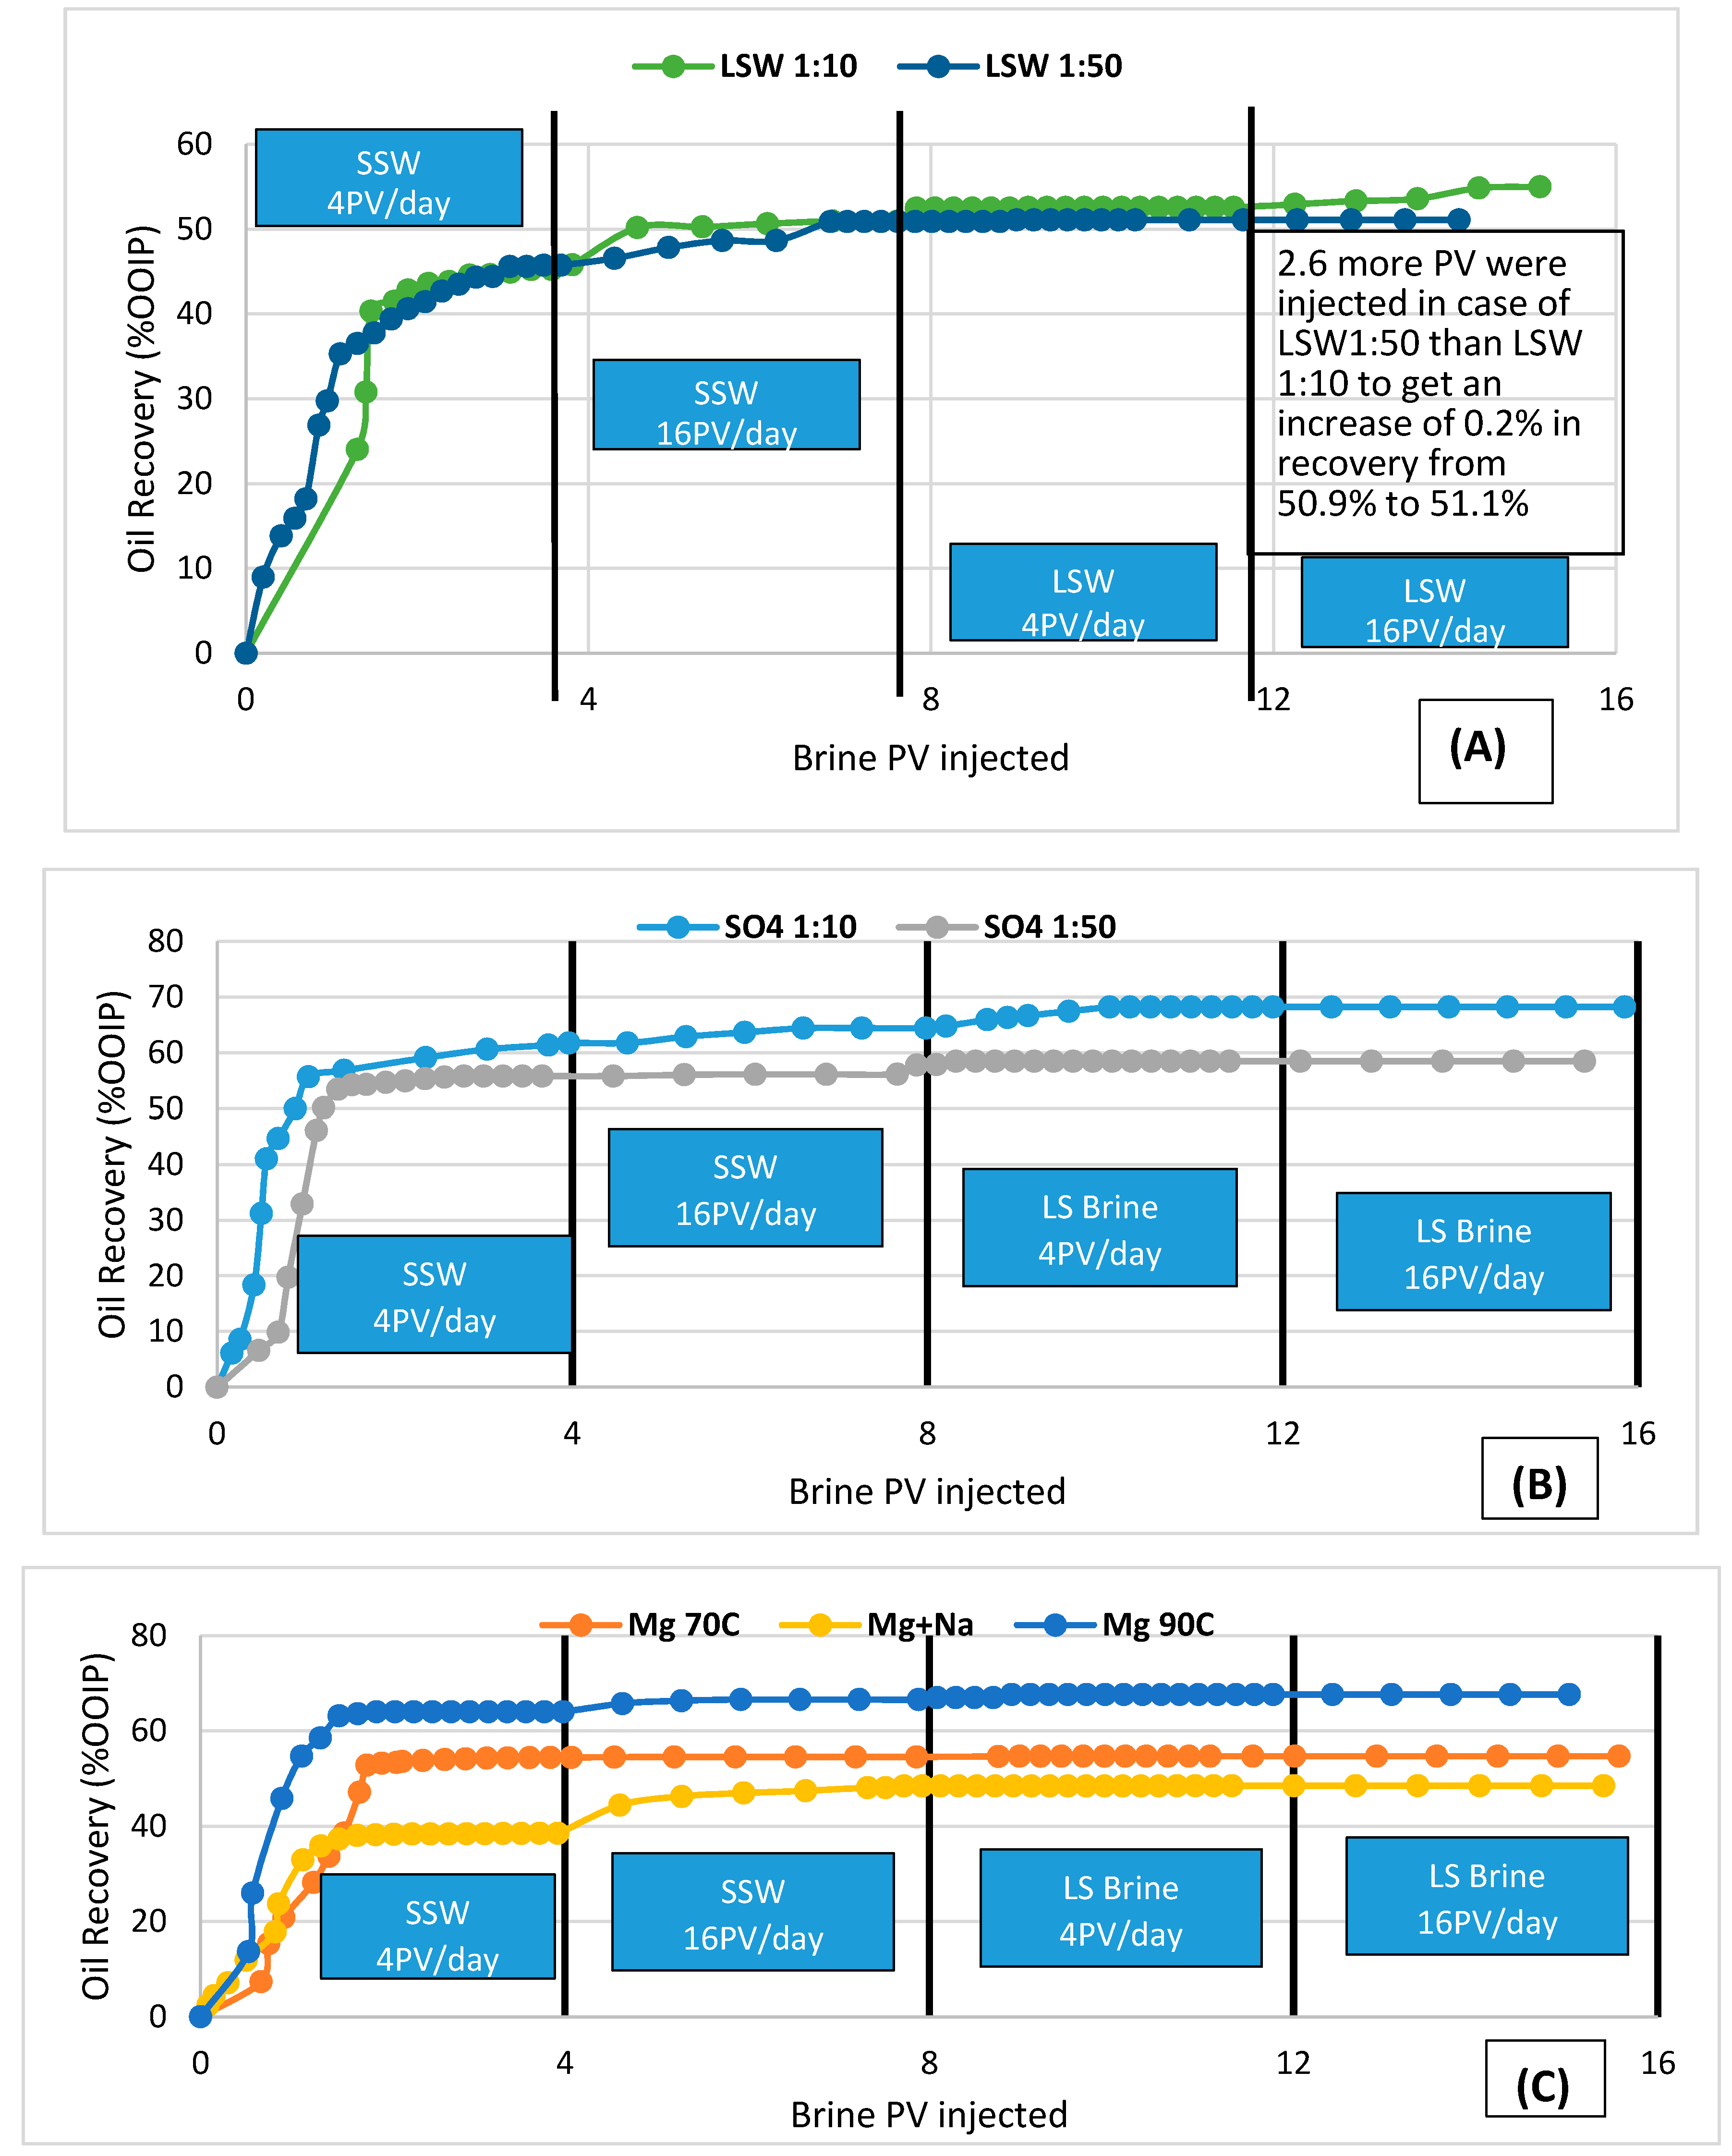
All the cores were flooded with SSW as a primary injection fluid and then flooded with different LS brines as secondary injection fluid. In Figure 2, oil recoveries after injection of LSWs, single and two salts brine into the cores are shown. The cores were flooded with two injection rates: 4 PV/day (0.09 mL/min) and 16 PV/day (0.36 mL/min). The differences in oil recovery by SSW may be due to the differences in the pore size distribution of the different cores. The lower swi for cores #2, #5, #6, #7 and #4 compared to the others (Table 1 and Table 2) may indicate the differences in the core composition. Ultimate recoveries after secondary flooding were: LSW 1:10 (52.9), LSW 1:50 (51.1), SO4 1:10 (68.2), SO4 1:50 (58.4), Mg70C (54.6), Mg90C (67.6) and Mg+Na (48.5) brines (% oil recovery) at 4 PV/day. The incremental oil recoveries after the secondary flooding may be summarized as: LSW 1:10 (1), LSW 1:50 (0.2), SO4 1:10 (3.8), SO4 1:50 (2.3), Mg70 (0.11), Mg90 (1.1) and Mg+Na (0.5), brines (% oil recovery). After switching the injection rate to 16 PV/day, no extra recovery was observed in any of the studied cases, except with LSW 1:10, which gave a 1.9% increase in recovery. Figure 2 shows that initial slopes of the oil recovery curves are different. This may be because the pore size distributions of the cores are not exactly same. The carbonate could be of two types: calcite or aragonite.
Figure 2A demonstrates a slightly slower recovery response. For example, the response time for LSW 1:50 compared to LSW 1:10, (circled in the figure) was an extra 2.6 PV to reach a recovery of 0.2%, i.e., from 50.9% to 51.1%. In [12], using a CMG-GEM reservoir simulator, a delay caused by the highest dilution, LSW (1:25), was observed. Figure 2B shows higher recovery by flooding with SO4 1:10 (68.2%) than that in the case of SO4 1:50, similar to the response observed by flooding with LSW 1:10 and 1:50.
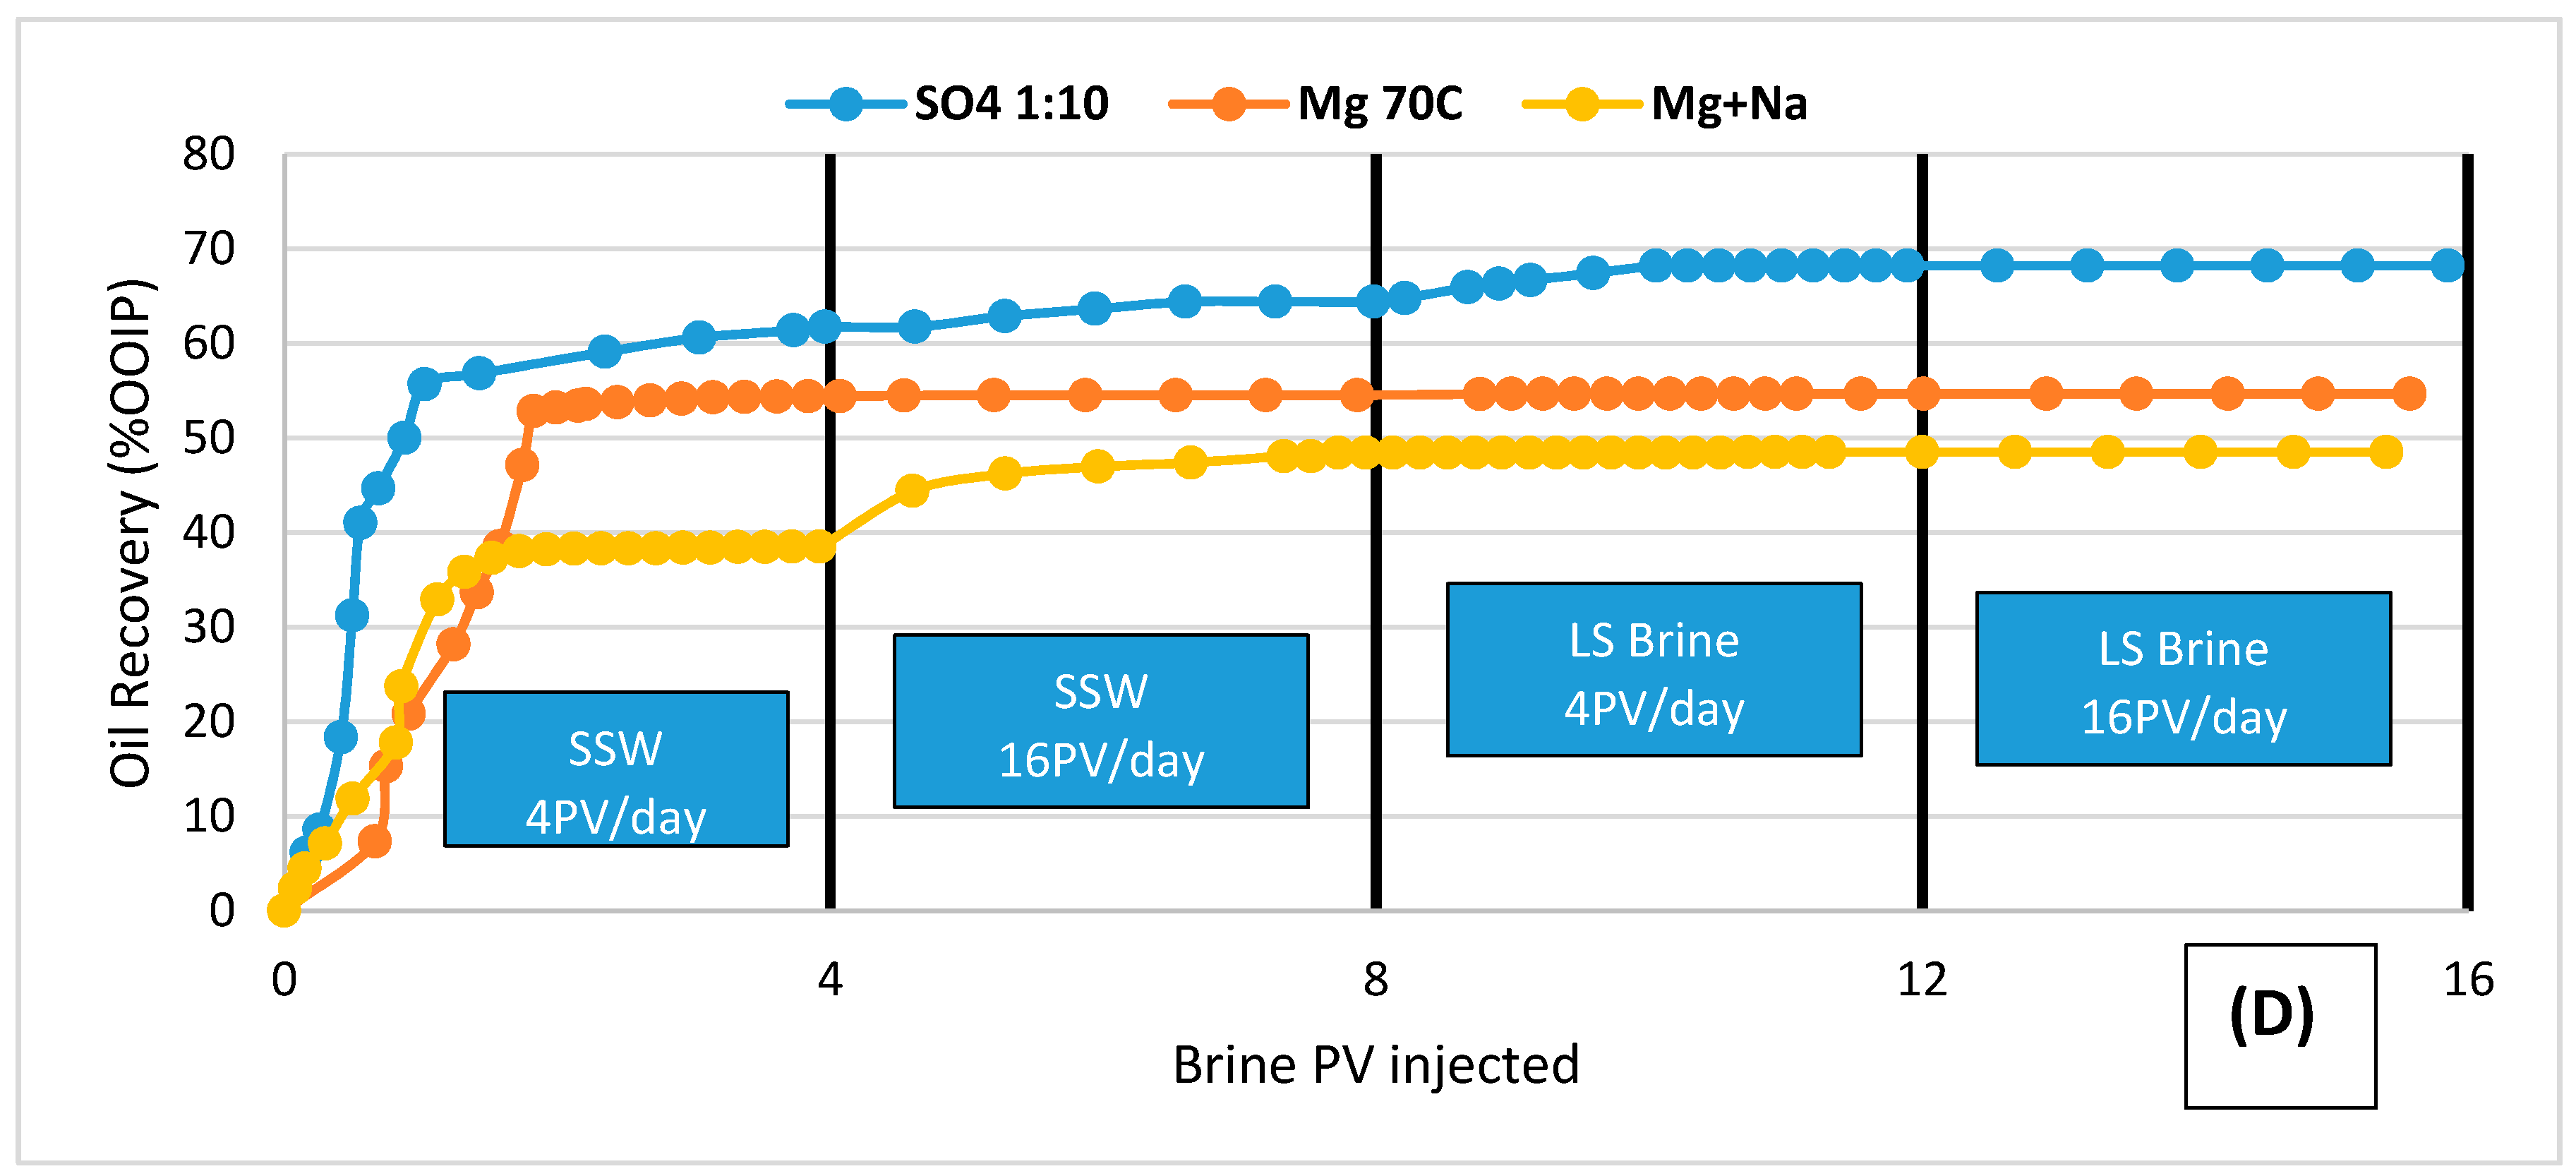
Comparison of oil recoveries from flooding with Mg salt brine (at 70 °C & 90 °C) and Mg + Na salt brines is shown in Figure 2C. Oil recovery was highest in case of Mg90 (67.6%) and lowest in case of Mg+Na brine (48.5%). This difference in oil recoveries may be due to differences in the affinity of Ca2+ and Mg2+ ions towards surface at different temperatures [13]. Figure 2B–D shows a higher oil recovery in case of SO4 1:10 (68.2%) compared to Mg70C (54.68%) and Mg+Na (48.5%). The reason, which may explain this difference in oil recovery, is ion interaction, which is explained later in this paper.
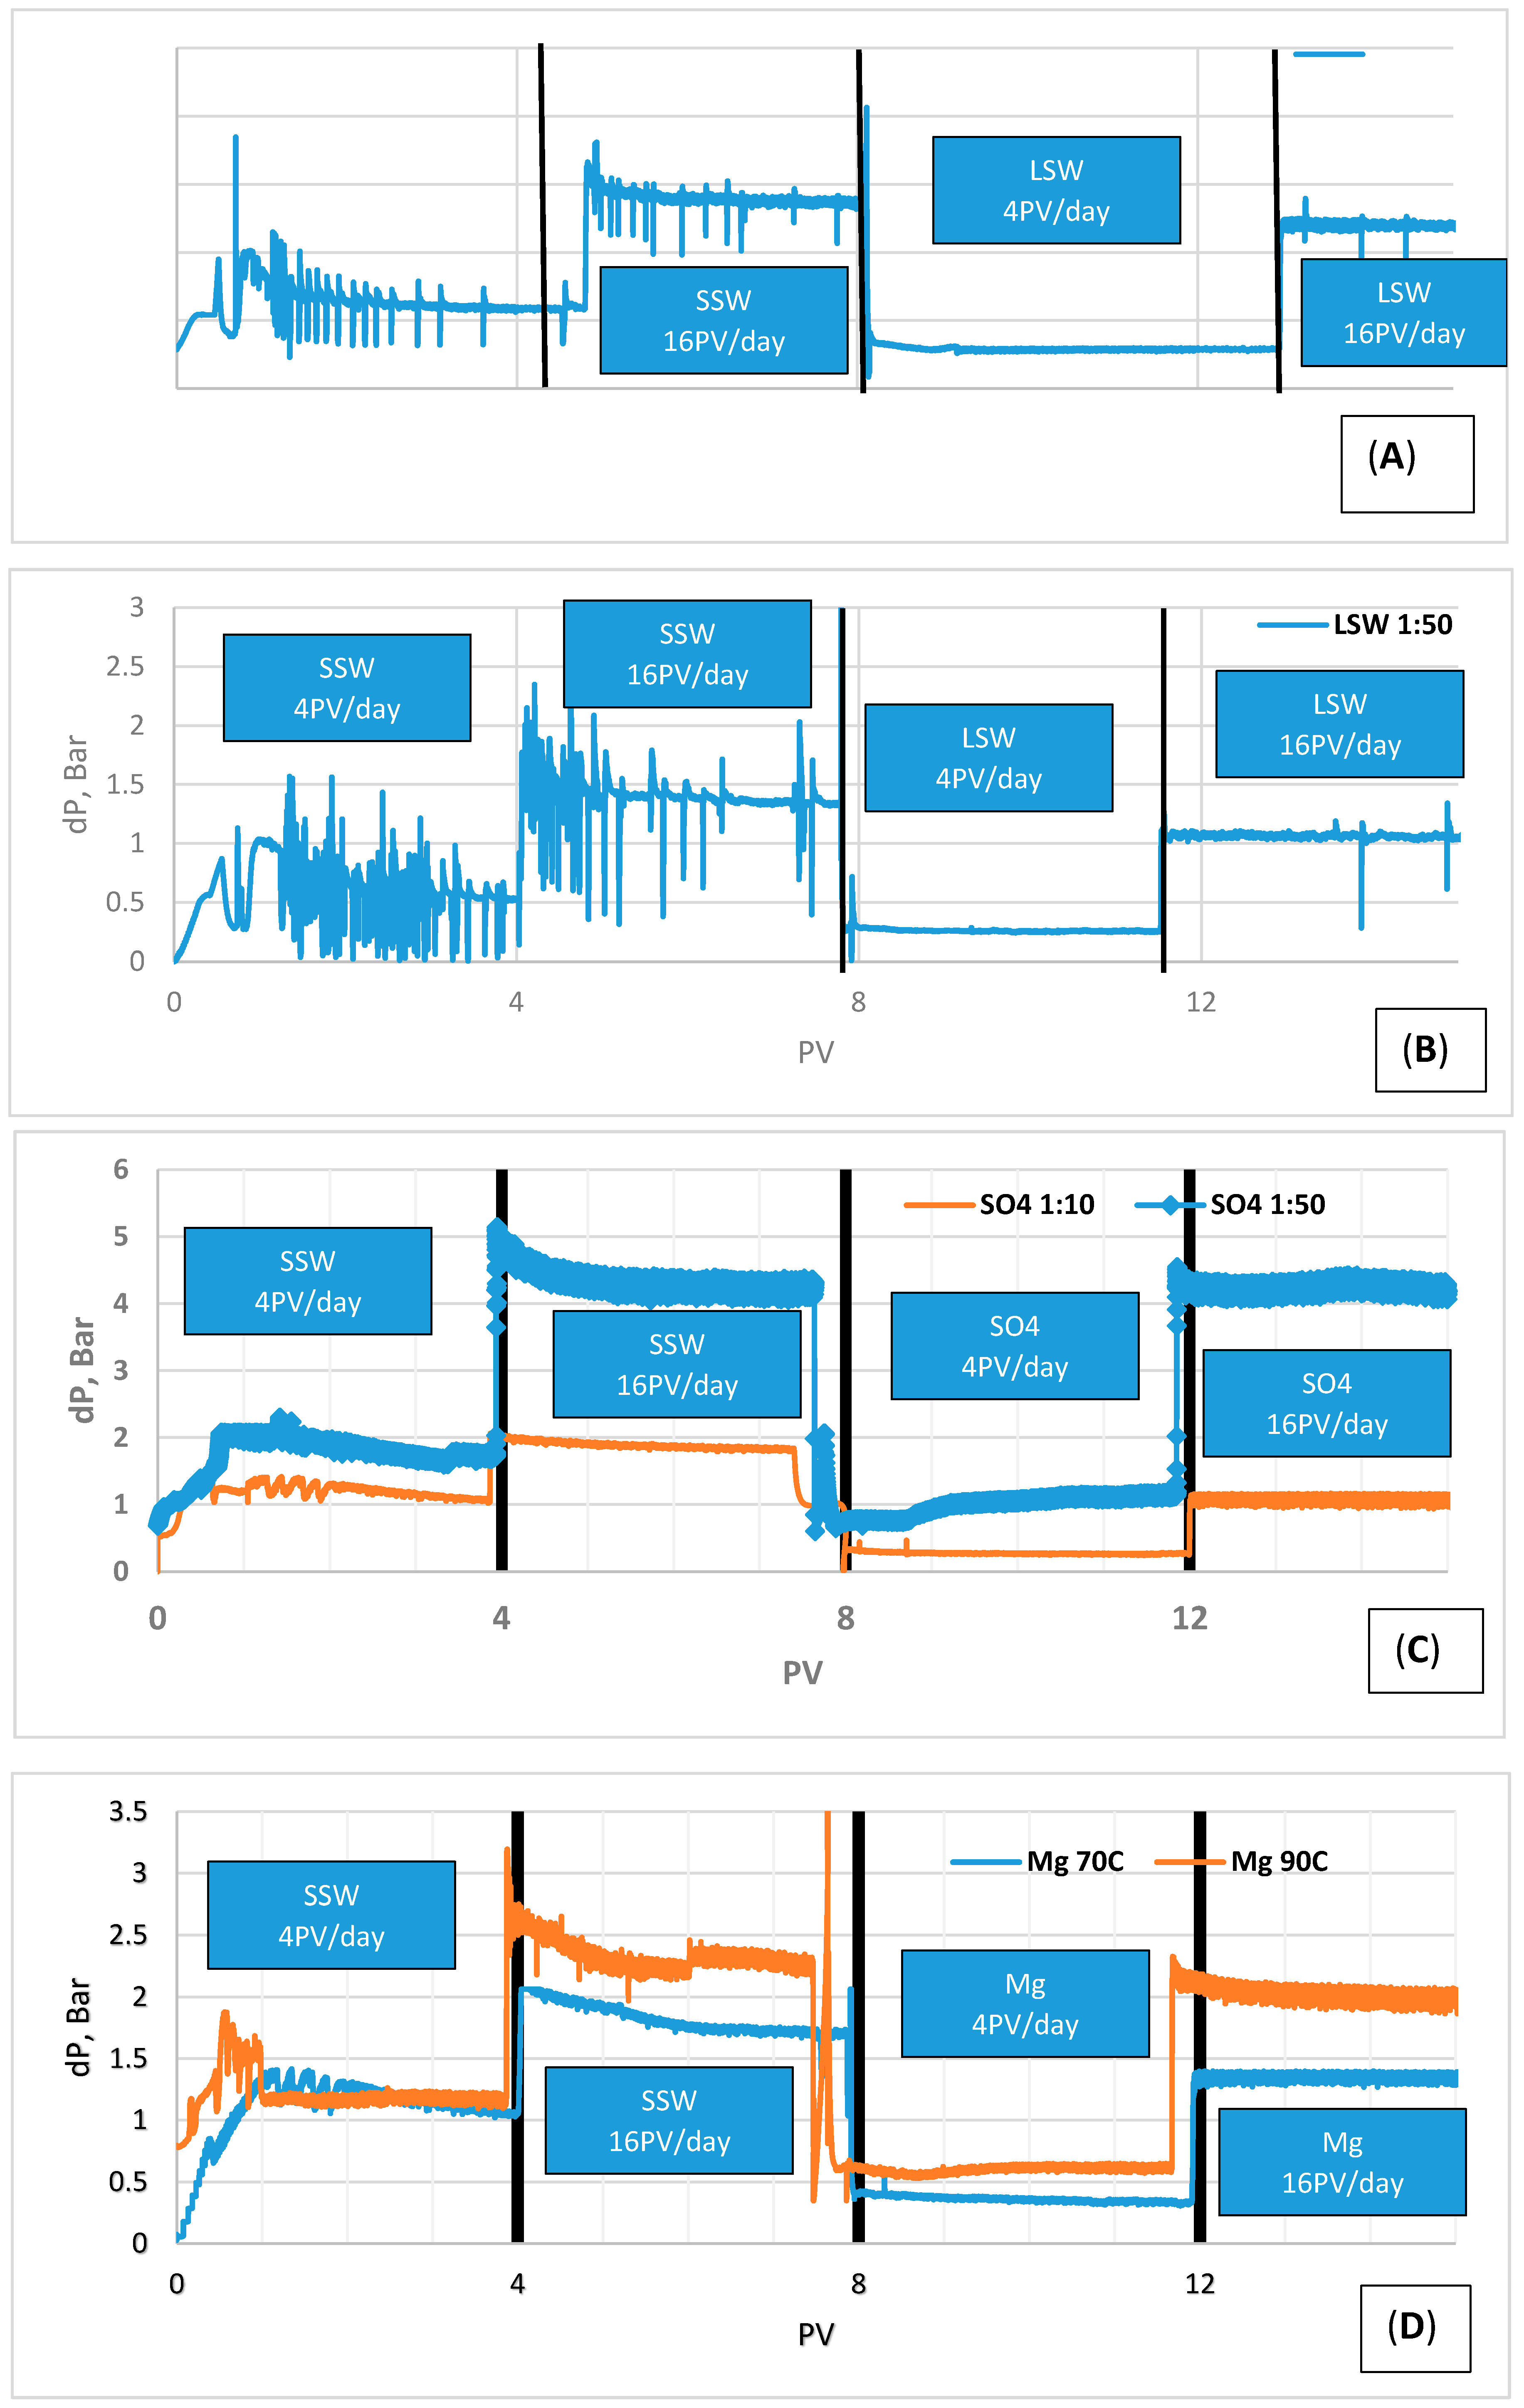
Pressure drop curves for the floodings are shown in Figure 3. During the flooding, pressure drop peaks were observed at various flooding PVs. From Figure 3A,B at the start of SSW flooding pressure drop (dP), at 4 PV/day, reached a peak of 1.8(0.69) and 1.5(1.3) bar (PV) for LSW 1:10 and LSW 1:50, respectively. The observed pressure drop peaks were stabilized at almost same point, i.e., 0.62 (3.8) for LSW 1:10 and 1:50. When the rate was increased to 16 PV/day, dP increased to 1.3 (4.9) and 2.3 (4.6) bar (PV) for LSW 1:10 and 1:50, respectively, after that dP stabilized at 1.33 (6.7 PV) for LSW 1:10 and 1:50. Pressure drop, dP, stabilizes when the rock/fluid interaction reaches equilibrium.
Figure 3C at the beginning of SSW flooding at 4 PV/day pressure drop reached a peak of 1.33 (0.59) and 2.064 (0.9) bar (PV) for SO4 brine 1:10 and 1:50, respectively. dP fluctuated and then stabilized at 1.13 (2.8) and 1.14 (2.7) bar (PV), respectively for SO4 1:10 and 1:50. When the rate was increased to 16 PV/day, dP spiked up to 2 (4.1) and 5 (4.2) bar (PV), after that dP stabilized at 1.9 (5) and 4 (5.5) bar (PV) respectively for SO4 1:10 and 1:50. Due to less calcite dissolution with SO4 1:10 than SO4 1:50, the pressure drop is lower in the case of SO4 1:10 than with SO4 1:50. At 16 PV/day less fluctuations in dP were observed during flooding with SO4 1:10 and 1:50. Constant dP may reflect constant resistance to the flow of brine, hence, a decrease in the sweep efficiency in the pores. This was also reflected in oil recovery curves. When brine was switched to SO4 brine at a rate of 4 PV/day, less fluctuations were observed in case of SO4 1:50 than SO4 1:10. dP stabilized roughly at 0.3 bar after 0.7 PV (equivalent to a total of 8.7 PV from start) and 1 bar after 1 PV (equivalent to a total of 9 PV from start) respectively for SO4 1:10 and 1:50.
Three main observations were made from injection of LSWs and SO4 brines (1:10 and 1:50):
- (1)
- Higher fluctuations were observed at 16 PV/day than 4 PV/day in the case of LSW 1:10 and 1:50 flooding. This may mean occasional resistance to the flow, hence a possible increase of the sweep efficiency.
- (2)
- The magnitude of dP was higher in case of dilution ratio 1:50 than 1:10, this is perhaps due to a higher availability of Ca2+ promoting precipitation of sulfate salt over the limit if diverting flow increasing the trapped oil.
- (3)
- Higher recovery in the case of dilution ratio 1:10 than 1:50, which has also been observed in the case of sulfate salt single brine flooding may support the above point (2). In [14], several dilutions of LSW were investigated and concluded that the dilution of 1:10 gave the best incremental oil recovery.
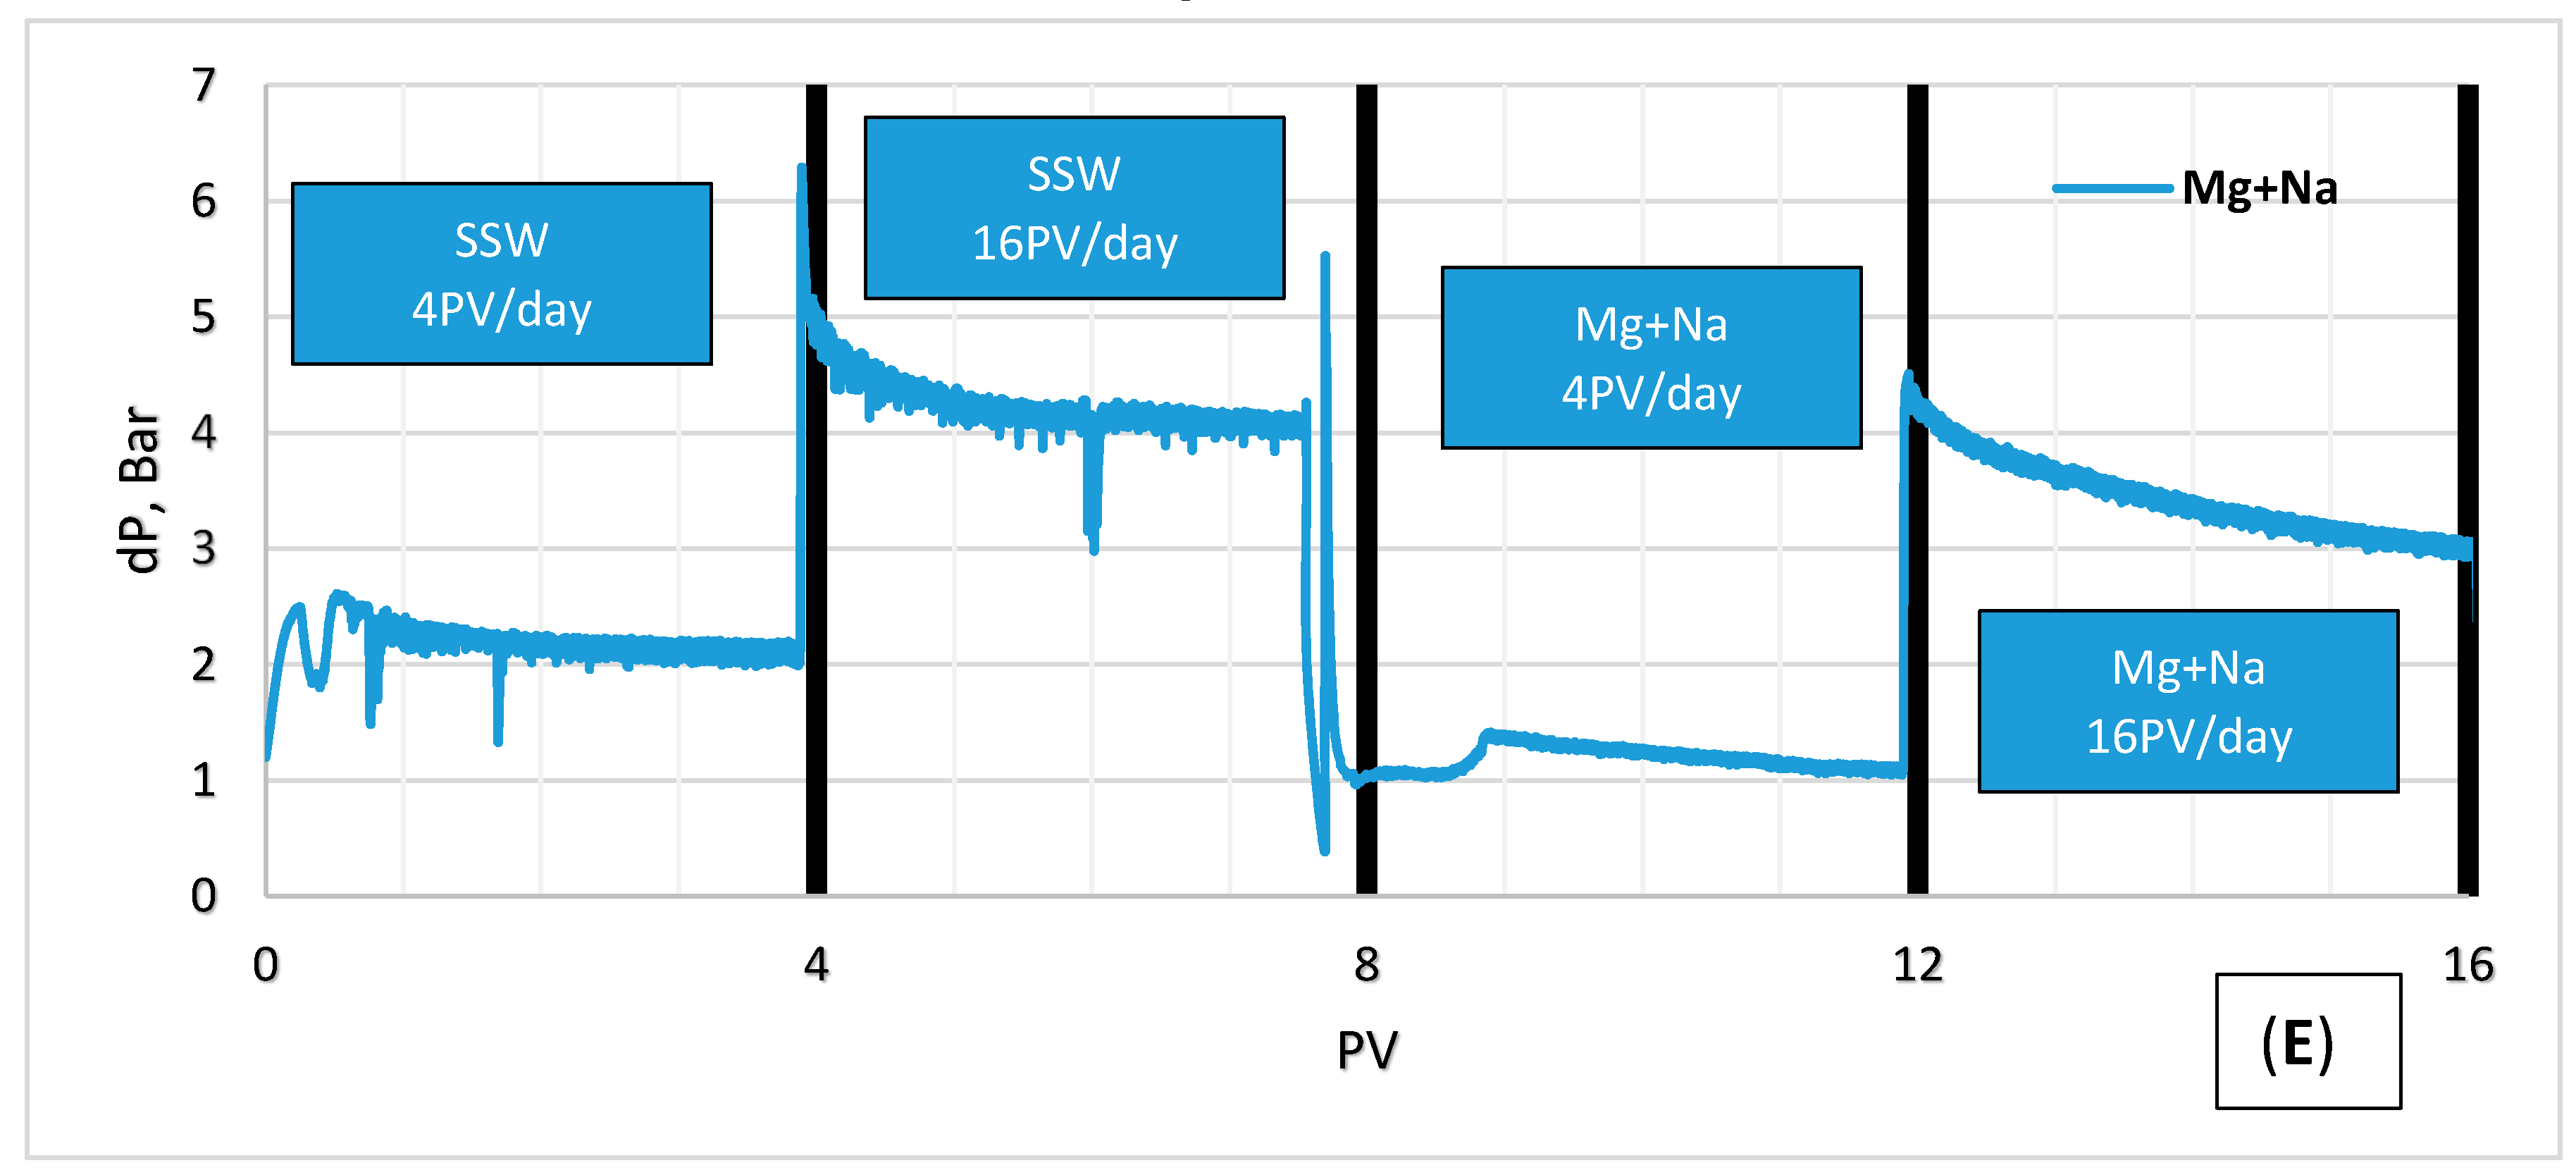
Similarly, from Figure 3D,E Mg brine was injected at 70 °C and 90 °C and MgCl2+NaCl brine was injected as a secondary injection fluid. From Figure 3D,E at the beginning of SSW flooding at 4 PV/day pressure drop reached a peak of 1.33(0.98), 1.7(0.58) and 2.42(0.46) bar (PV) for Mg70, Mg90 and Mg+Na, respectively. After some fluctuations, dP stabilized at 1.1(2.3), 1.14(1.1) and 2.11(1.84) bar (PV), respectively for Mg70, Mg90 and Mg+Na. When the rate was increased to 16 PV/day, dP spiked up 1.9(3.8), 3(3.91) and 5.9(3.8) bar PV, and it stabilized at 1.7(5.8), 2.2(6.05) and 3.9(5.8), respectively, for Mg70, Mg90 and Mg+Na. At 16 PV/day much less fluctuation in dP was observed than at 4 PV/day. When brine was switched to LS (Mg70, Mg90 & Mg+Na) brines at a rate of 4 PV/day, dP showed smaller fluctuations than SSW in all the cases. In case of Mg70, the magnitude of dP was constant (Figure 3D) and dP stabilized roughly at 0.3 bar after 2.86 PV (equivalent to a total of 10.86 PV from start), 0.56 bar after 1 PV (equivalent to a total of 9 PV from start) and 1.2 bar after 2.04 PV (equivalent to a total of 10.04 PV from start) respectively for Mg70, Mg90 and Mg+Na brines. When rate was increased to 16 PV/day, dP rose to 1.2(12), 2.05(11.83) and 3.11(11.8) bar (PV), respectively, for Mg70, Mg90 and Mg+Na, with no fluctuations. At 4 PV/day, 0.11, 1.1 and 0.5% increases in recovery were obtained, respectively, for Mg70, Mg90 and Mg+Na brines. Since there was no increase in pressure drop at 16 PV/day of LS brine injection, no resistance in flow occurred, hence less flow diversion. This could be the reason of no additional oil recovery at higher rate. The highest oil recovery was observed in case of Mg90 (67.2%) brine than Mg70 (54.6%) and Mg+Na (48.5%) brines.
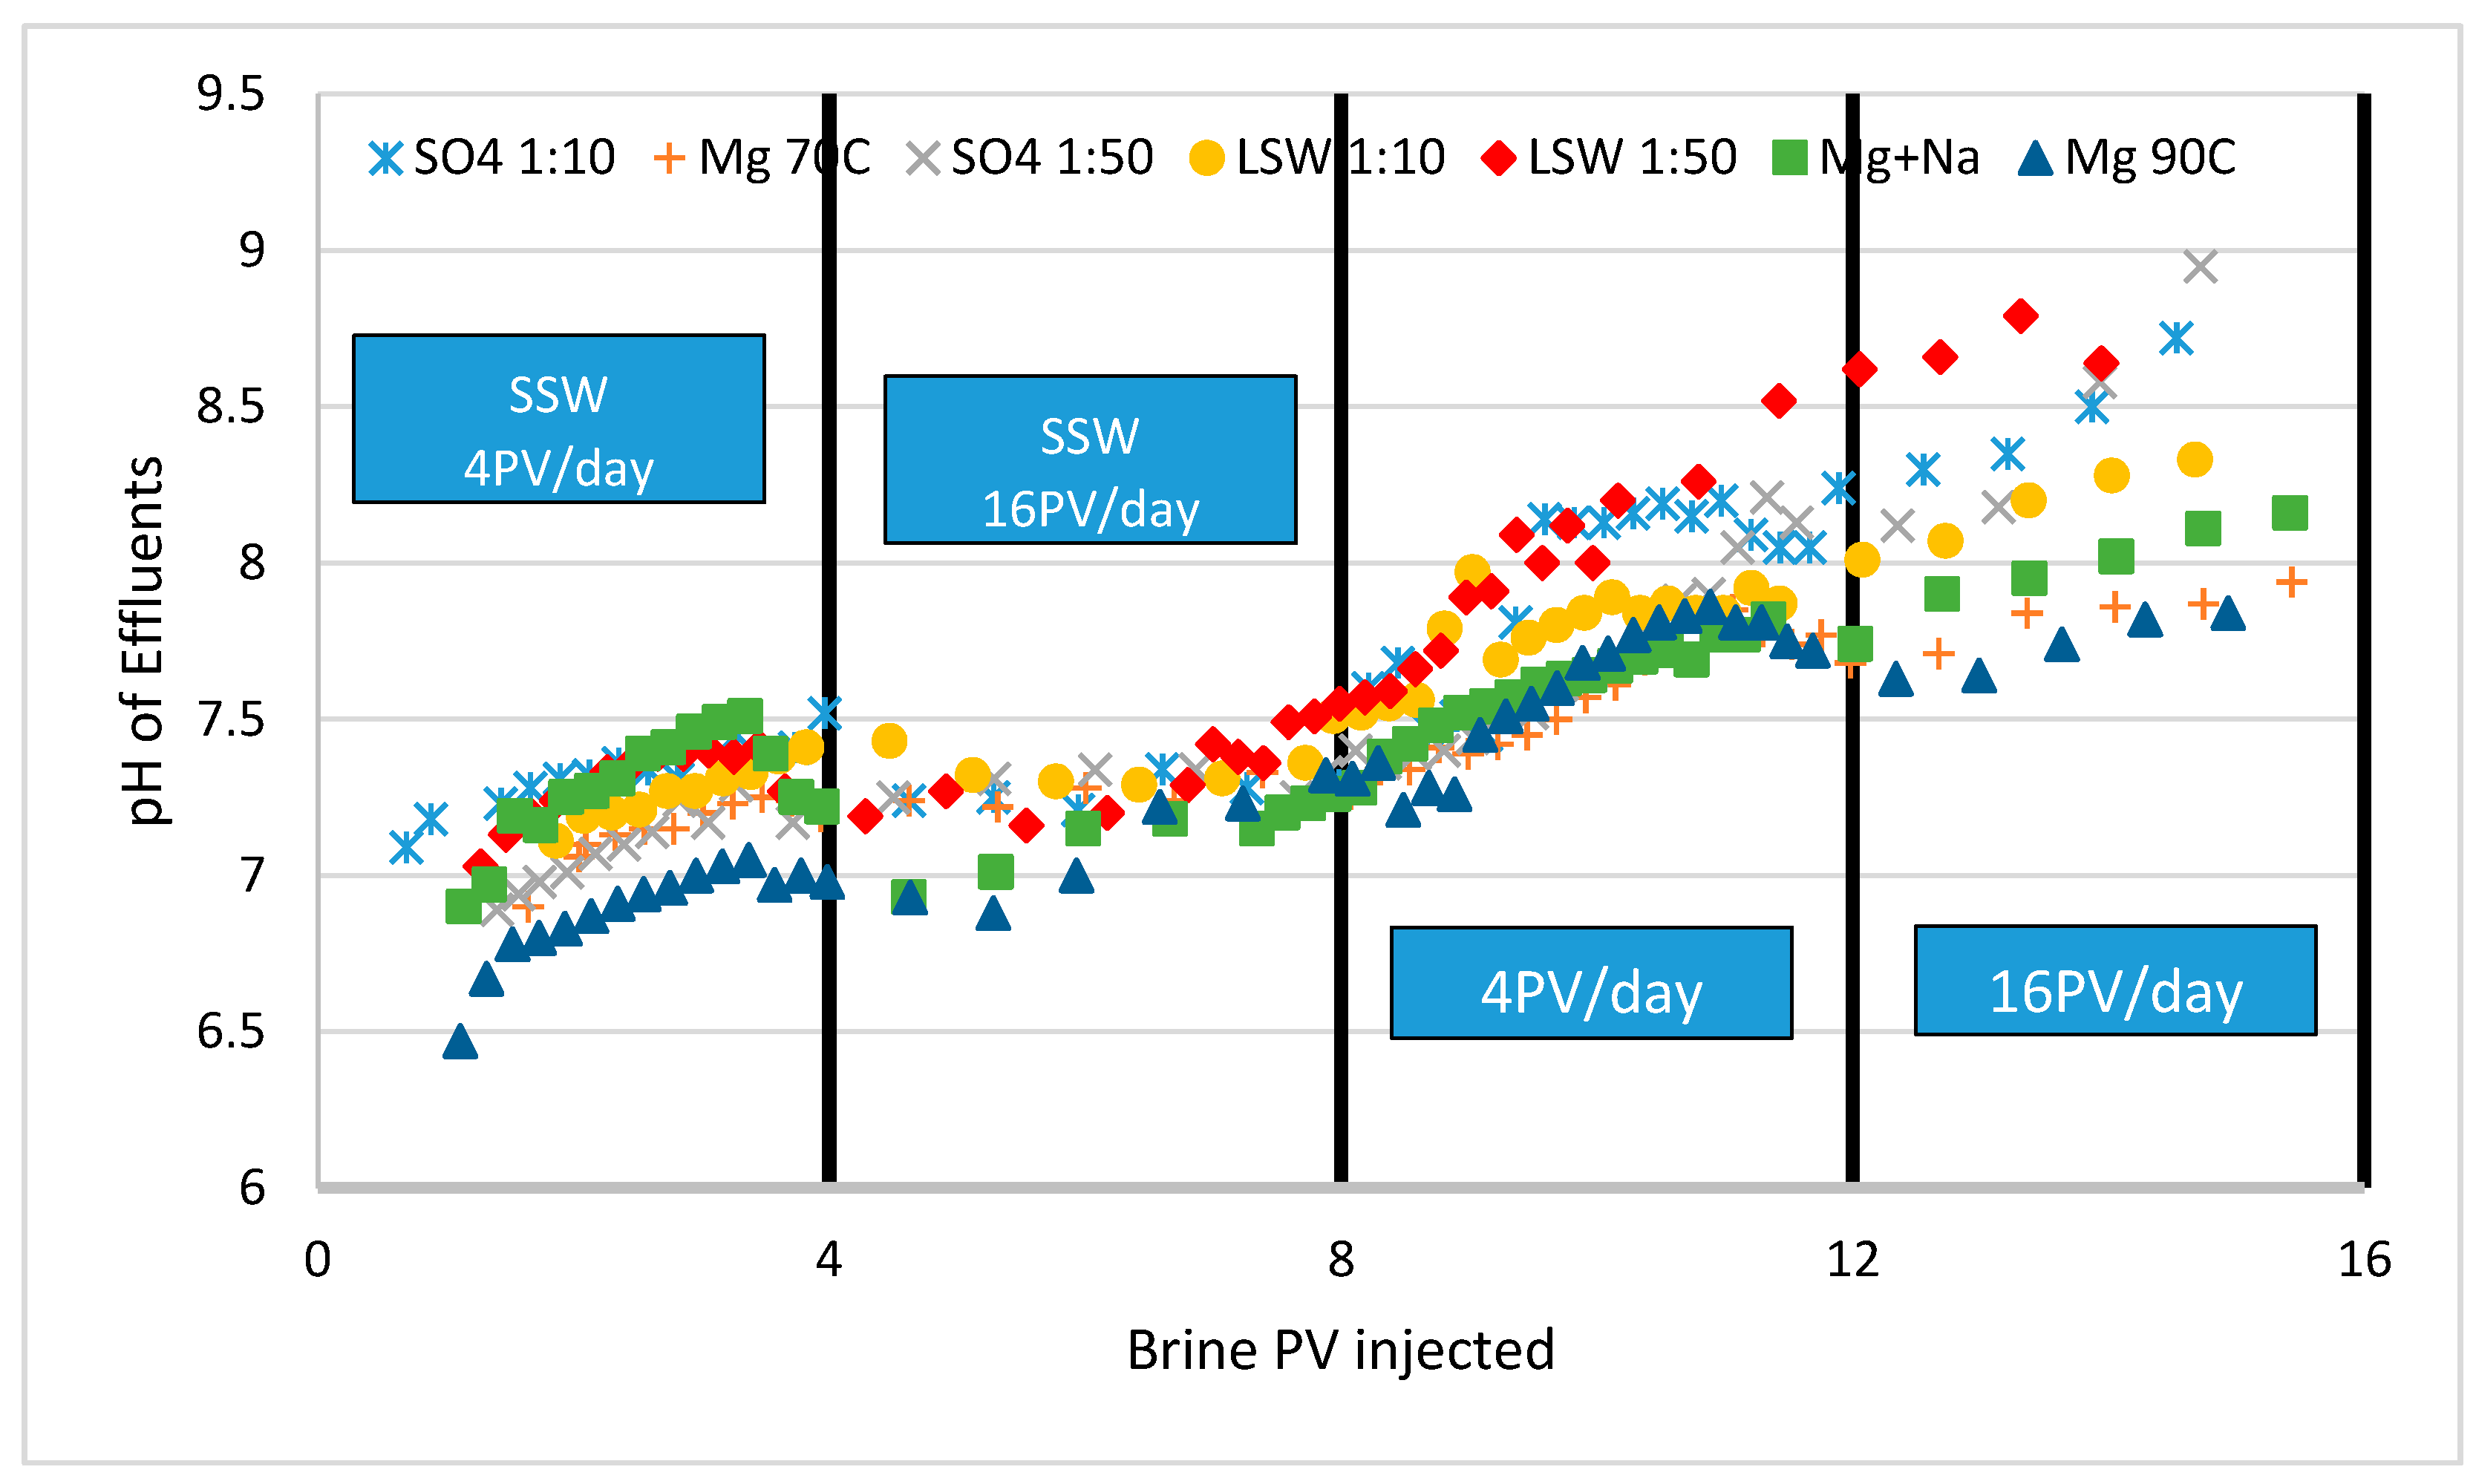
Figure 4 shows the pH effluents during SSW flooding (up till 8 PV the flooding was with SSW, from 8 PV on the flooding was done with low salinity waters, single and combined ions). In general, low salinity water flooding showed an increase of pH. This is in agreement with the pH results observed in [15].
In the case of 4 PV flooding with Mg2+ (70 and 90 °C), Mg+Na and LSW 10 showed almost the same pH (≈7.8). However, flooding with single brines SO4 (1:10 and 1:50) and LSW 50, were shown to give a higher pH at a flooding rate of 4 PV/day. When the flooding rate was increased to 16 PV/day, the pH of the individual brines shows a distinct trend. The highest value was for LSW 50 (highest ≈ 8.79) followed by SO4 (1:10 & 1:50) having (≈8.9). It is interesting to observe that the pH for the Mg (70 and 90 °C) have the lowest pH (≈7.8). When the Na+ was added to Mg2+, the pH of Mg+Na brine showed a higher pH trend reaching (≈8.33). Although Mg (70 and 90 °C) display an increasing trend, the highest value was ≈ 7.8, which is less than in the case of Mg+2+Na+ brine. This may indicate that addition of Na+ as in the case of Mg+Na brine enhanced the interaction with the calcite surface, due to the increased the CaCO3 solubility [16]. This may be confirmed by the level of Ca2+ ions, as shown by Figure 5, having almost the same level as that in the case of Mg2+ (90 °C). Increasing temperature increases the exchange process between Ca2+ and Mg2+.
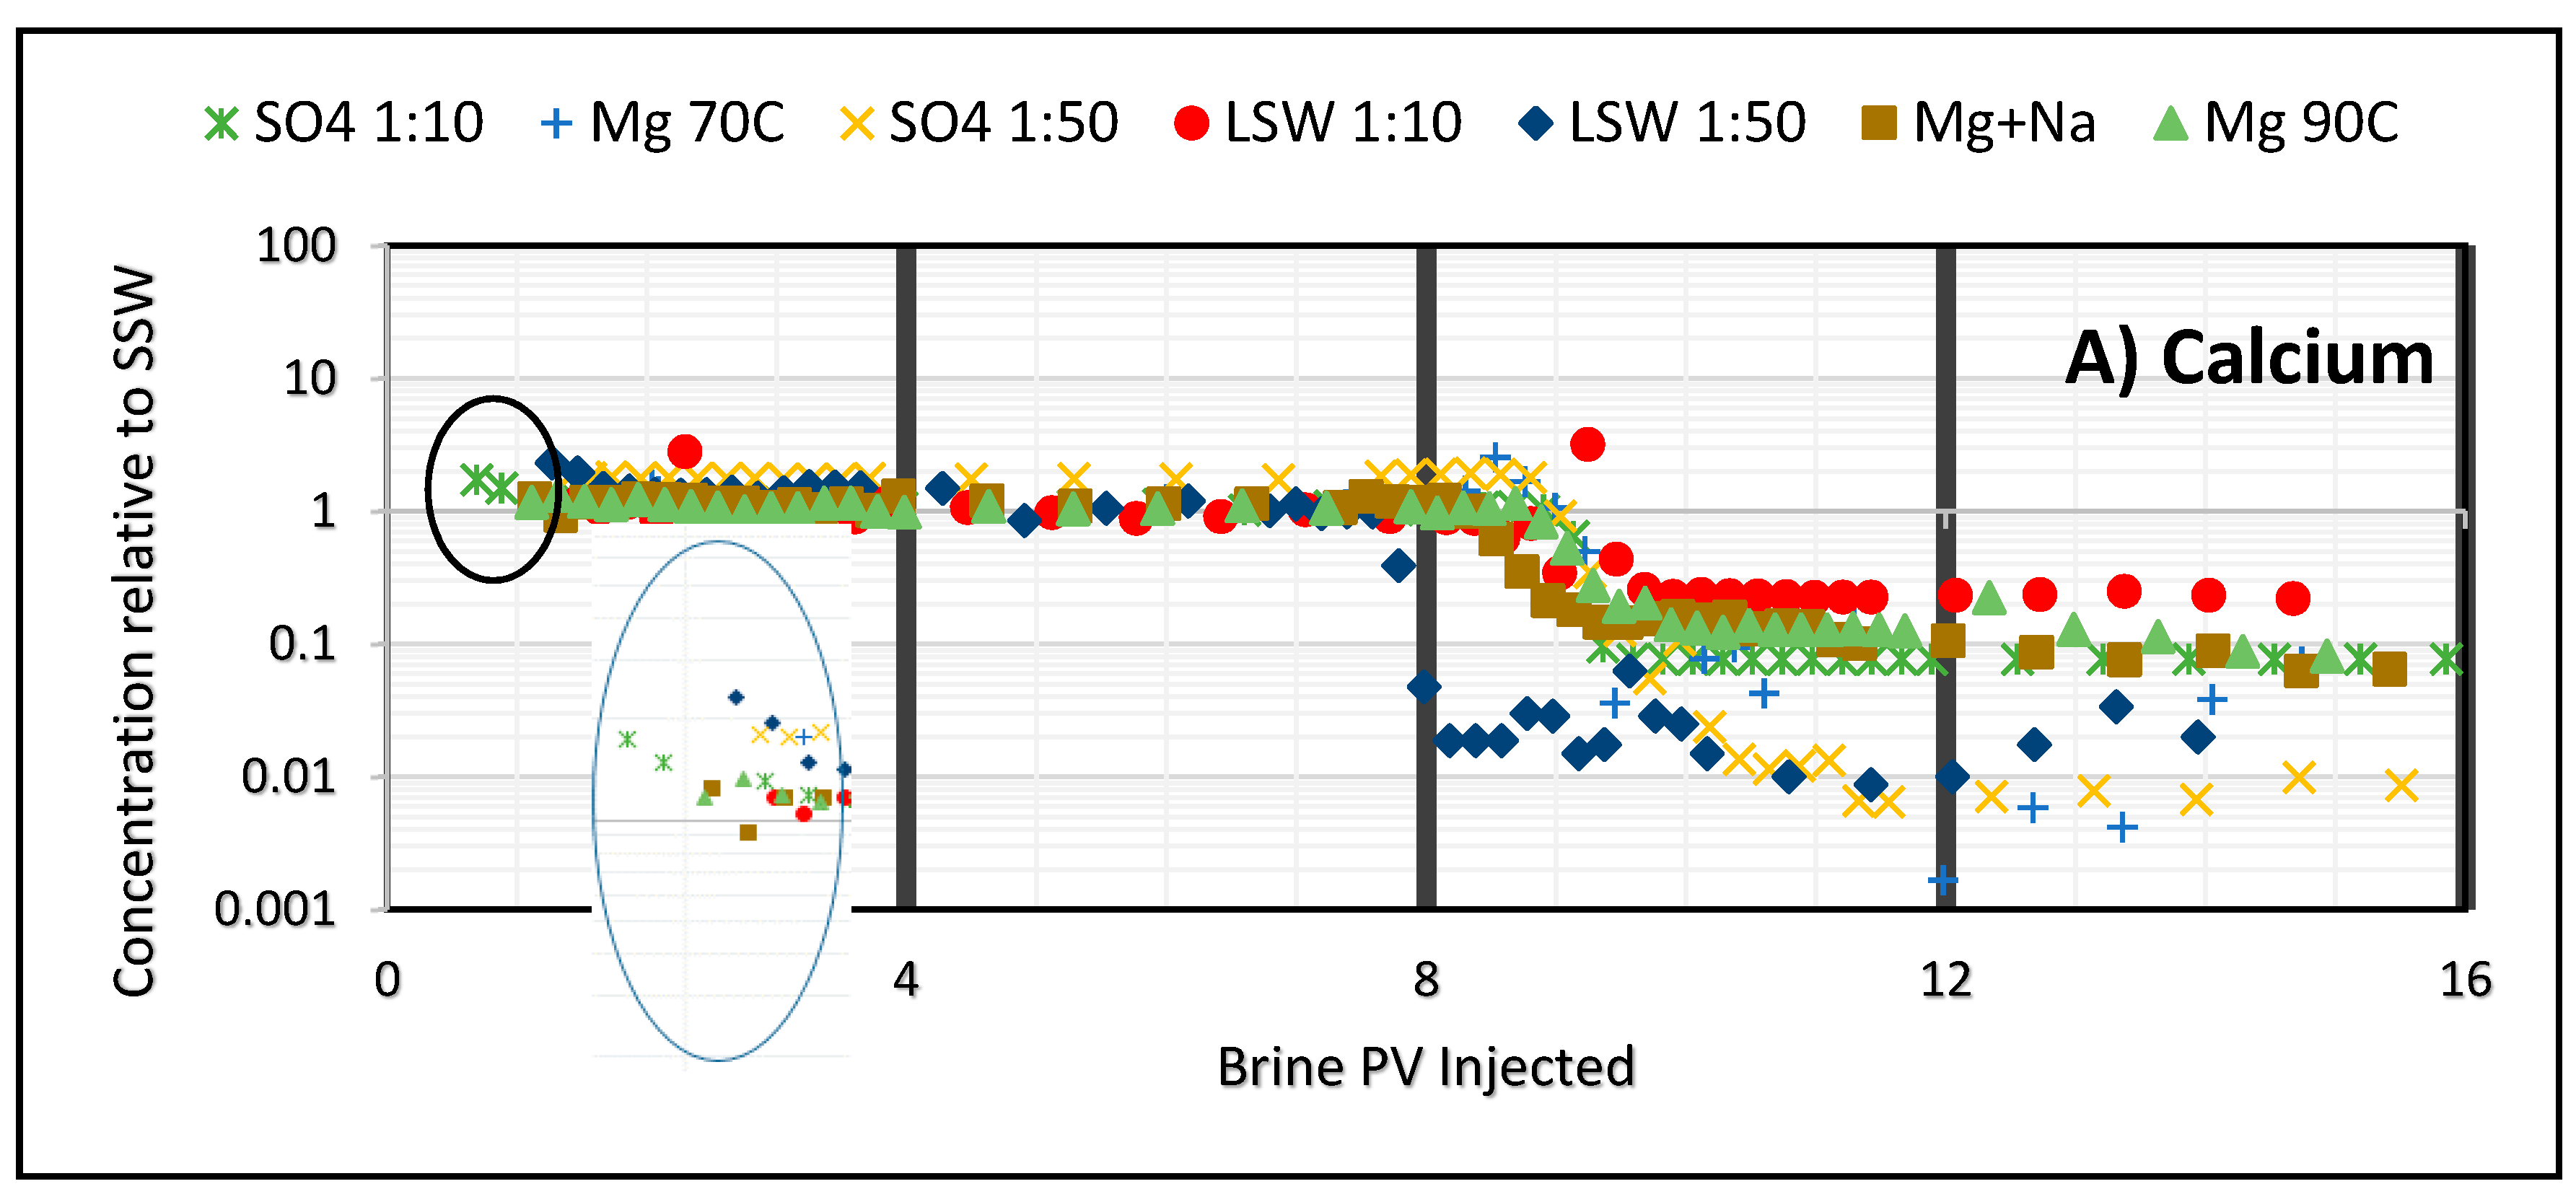
3.2. Ion Tracking from Secondary Flooding by LS Brines
Dimensionless ion concentration is estimated as the ratio between the measured ion concentrations in effluents to the ion concentration in SSW. The first 8 PVs, represent flooding with SSW (Figure 5), except [Ca2+], [Mg2+] and [SO42−]. When the water was switched to LSW brines, [Na+] declined at a rate of 0.035, 0.18, 0.039, 0.05, 0.38, 0.1, and 0.06 mol/L PV respectively for SO4 1:10, Mg70, SO4 1:50, LSW 1:10, LSW 1:50, Mg+Na and Mg90 brine. Compared to other ions [Na+] declined at the highest rate. Decline in sodium due to dilution was also observed in [17]. As stated earlier the effect of added sodium salt to magnesium brine enhanced the dissolution of calcium carbonate, hence increased the calcium ion concentration.
This is interesting to see that Mg+Na brine did not affect the oil recovery. This may support that the main mechanism of LSW is by enhancing sweep efficiency due to fines, i.e., dissolution of calcium carbonate alone does not contribute to the main mechanism unless the sulfate is present. Certainly it alters the wettability to more water wet [13].
Flooding with LS brines [SO42−] has become <1, Figure 5 (sulfate). This showed that there may be processes like sulfate adsorption and dissolution of CaSO4 are taking place. Rate of decline for [Ca2+] was about 1.5, 1.3, 1.11 and three times greater than [SO42−] in effluents during SO4 1:10 and 1:50, LSW 1:10 and 1:50 flooding. Faster decline of [Ca2+] may indicate less contribution by calcium in CaSO4 dissolution formed during establishment of the initial water saturation with SSW [15].
SO42− concentration of about 50 times dilution of SSW, gave the highest recovery [10]. However, in this work diluted SO4 1:10 gave higher recovery than that for SO4 1:50. This may supports the notion that sweep efficiency contributes greatly to enhancing oil recovery by LSW. Wettability alteration by sulfate ions was observed in [13]. Double layer expansion associated with LSW contributes to the overall Ca2+/SO42− interaction.
Recovery results were compared by flooding Na2SO4, NaCl, and MgCl2 brines as secondary mode [18]. They suggested that low salinity brine enriched in (SO42−) and depleted in monovalent ions is suitable in oil recovery. [SO42−] decline rate was faster in case of Mg+Na brine flooding (0.005 mol/L·PV) than SO4 1:10 (0.002 mol/L·PV), which supports that the effect of Na+ in enhancing the Ca2+ available.
The observed increase of the pH as well as concentration of carbonate may be expressed by the following equation [19]:
Average value for [HCO3−] after LSW flooding, reached to two and five times the SSW for LSW 1:10 and 1:50, respectively. For all the brines [HCO3−] stabilizes after 10 PV, i.e., after 2 PV of LS brine injection to a value of five times the SSW. After injecting LS brines, a continuous increase in concentration of bicarbonate ions was observed. Dissolution of calcite may be expressed by [20]:
In [13], it was reported that calcite dissolution causes lattice instability, hence producing fines. The flow of fines with injected brine increases the flow resistance and enhances sweep efficiency. Calcite dissolution increases calcium concentration available that may react with SO42− and possible precipitate CaSO4 depending on the solubility product at the specific conditions.
Calcite dissolution is not the only reason for the increase in [Ca+2]. Ion exchange between Ca/Mg affects the [Mg2+] and [Ca2+] in the effluents. For example, in case of flooding with Mg90, [Mg2+] stabilizes at 0.03[Mg+2]ssw after 11.68 PV at 4 PV/day but when the rate increased to 16 PV/day, [Mg2+] increased to 0.11[Mg+2]ssw at 12.33 PV and declined to 0.04[Mg2+]ssw at 14.28 PV with a rate of 0.001 mol/L PV. Exchange between Ca/Mg was also indicated in case of flooding with LSW 1:10, LSW 1:50, Mg+Na, and SO4 1:10 brine. At 16 PV/day [Mg2+] increased to 0.01(13 PV), 0.05(12.2 PV), 0.04(14 PV) and 0.02(12.1 PV) for LSW 1:10, LSW 1:50, and Mg+Na brine, respectively.
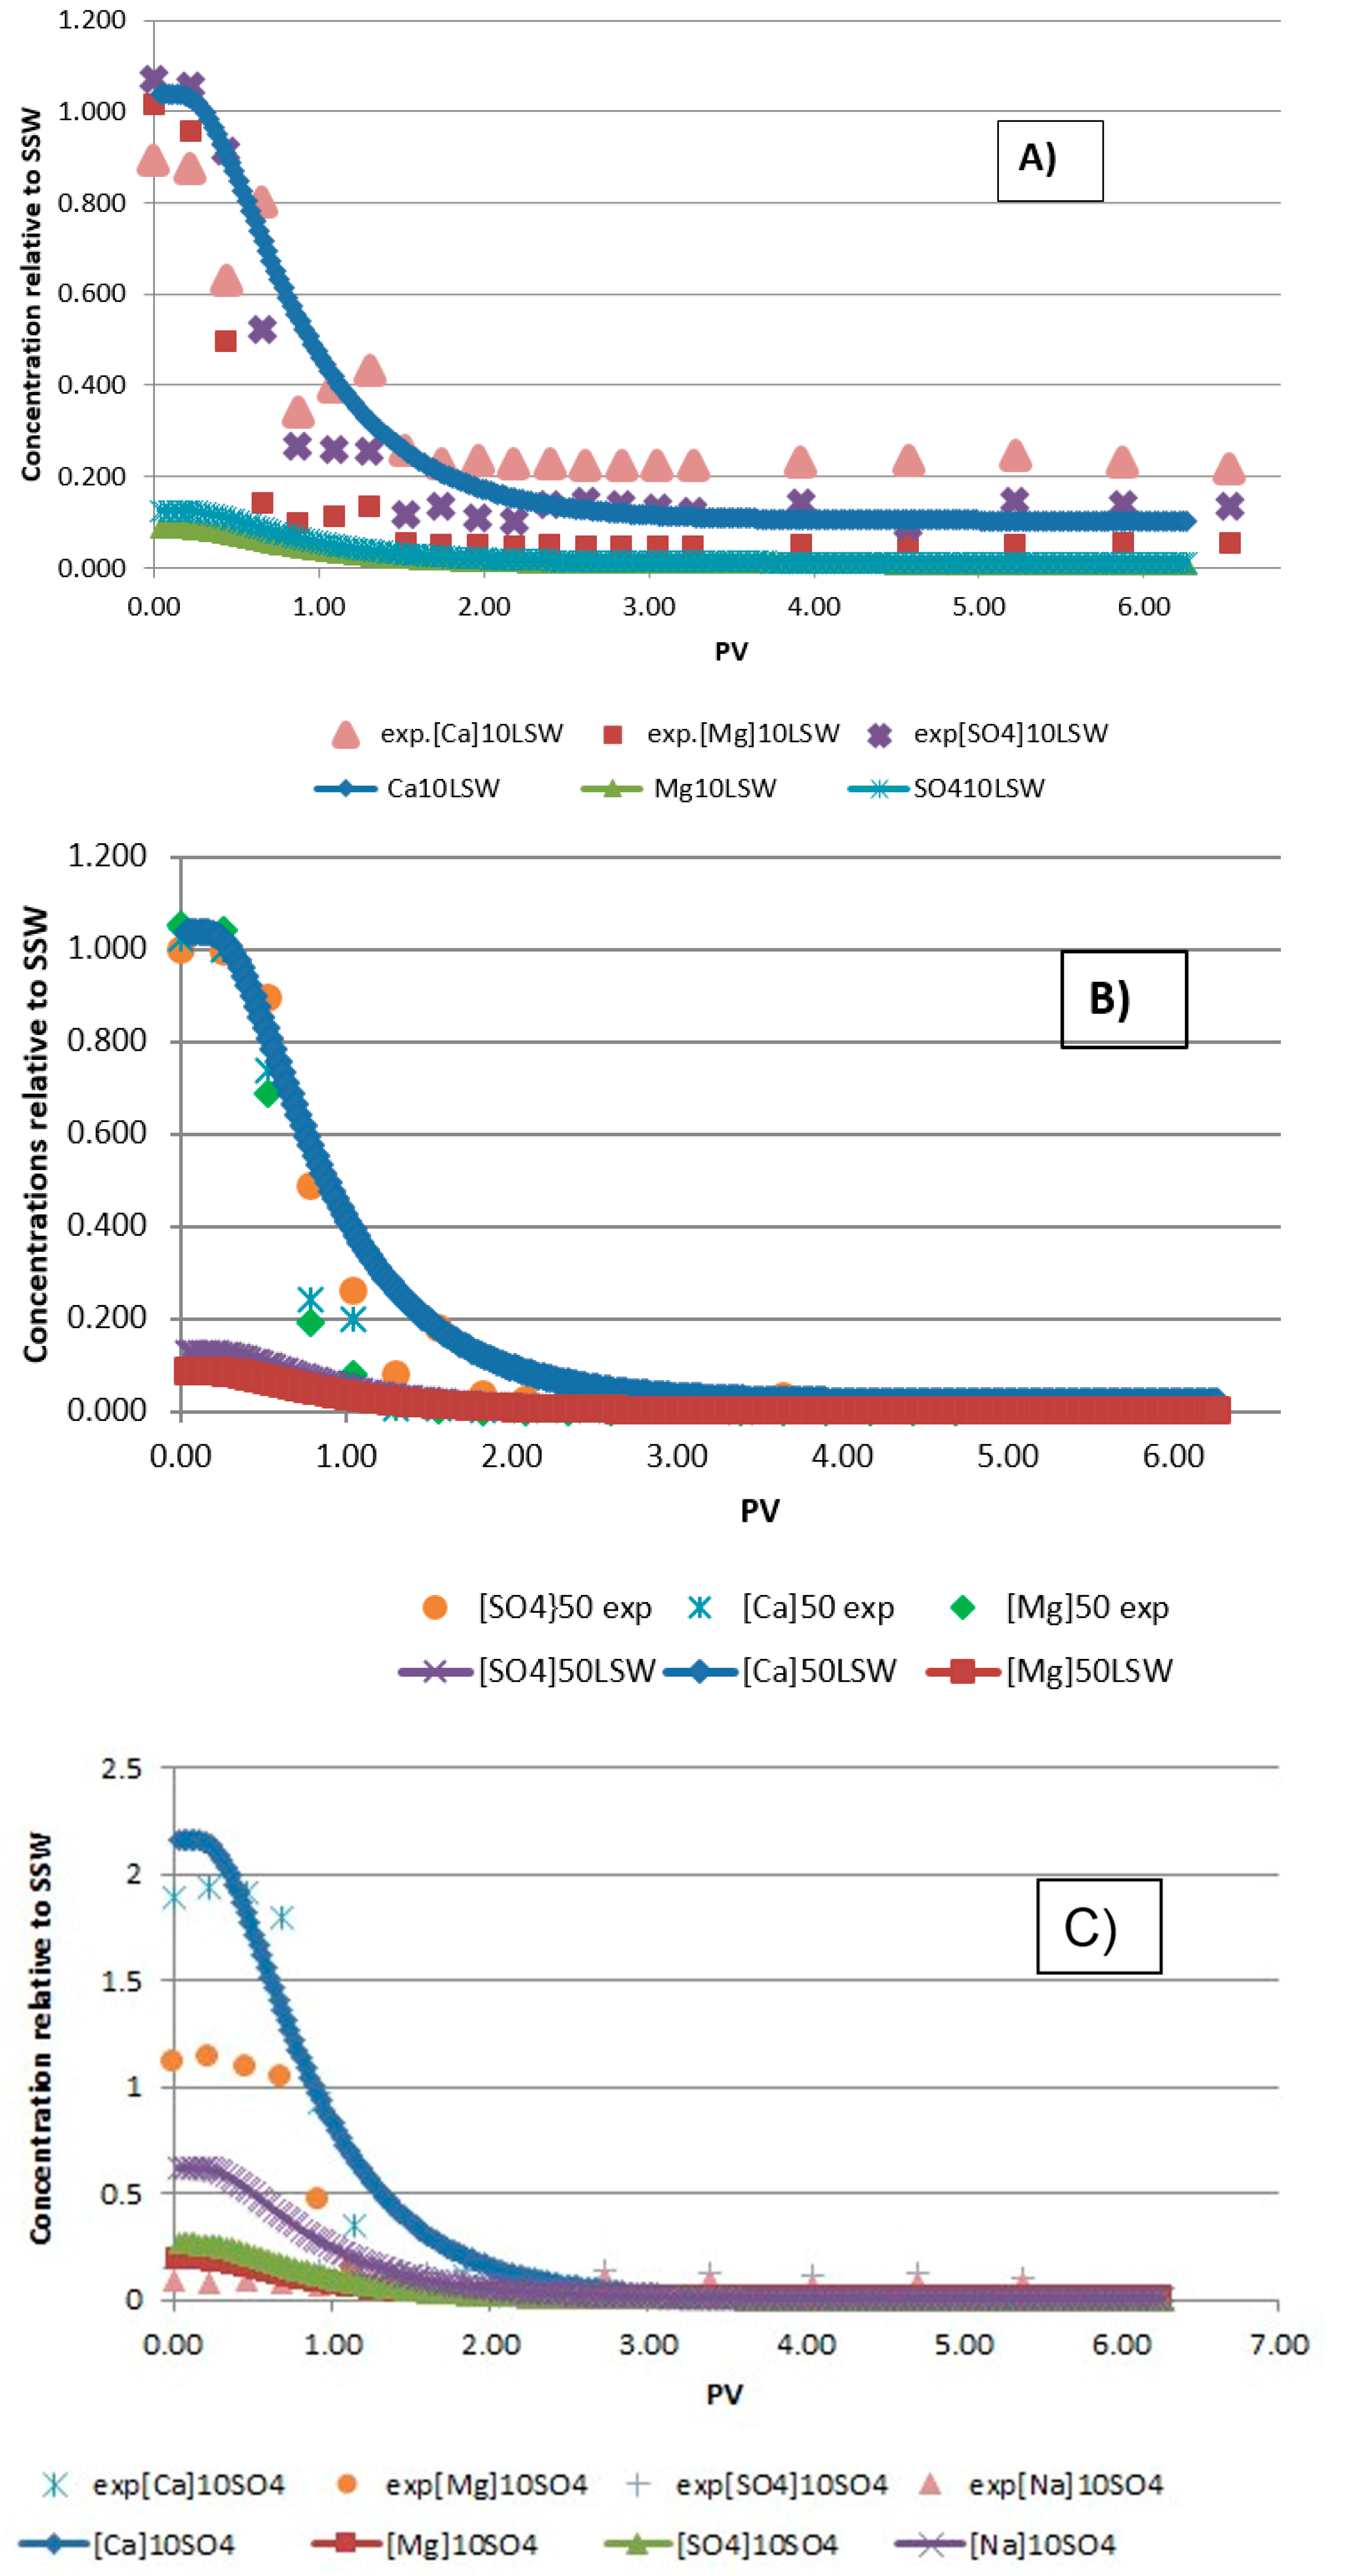
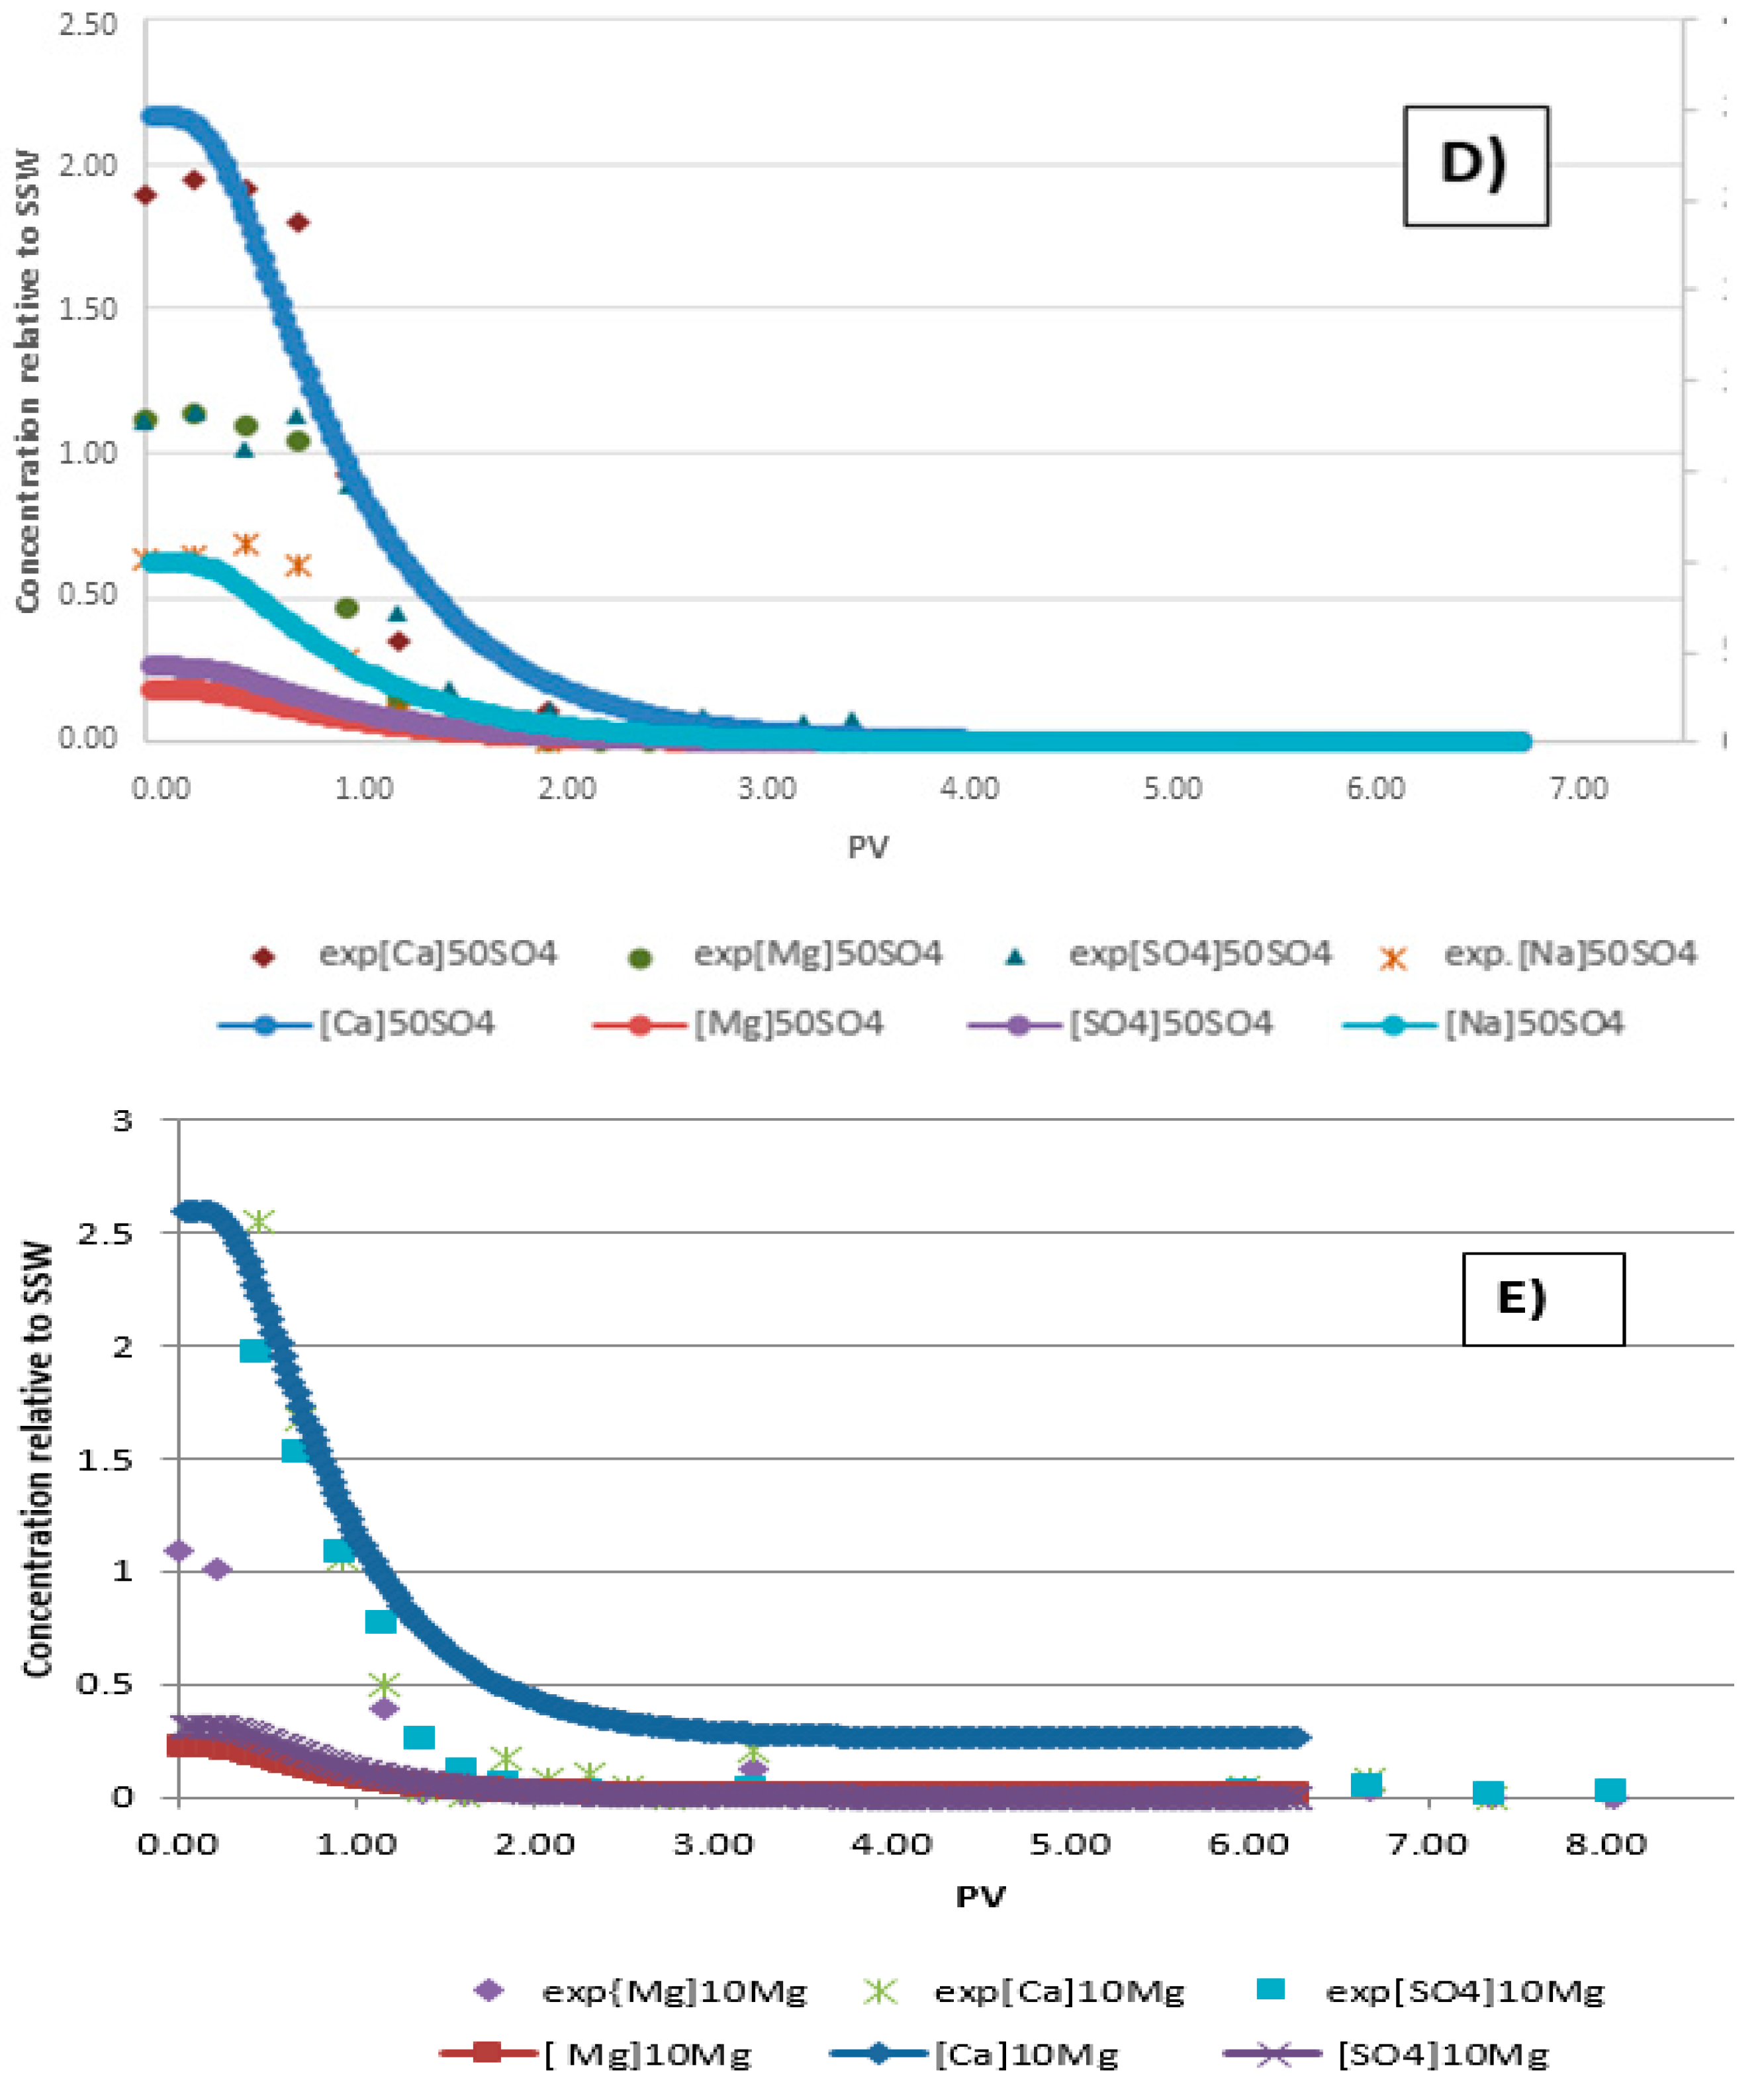
Comparisons between simulated and experimental ion concentrations relative to SSW are shown in Figure 6A–E. Simulation was done at the switching point from SSW to secondary flooding by LSW 1:10, LSW 1:50, SO4 1:10, SO4 1:50 and Mg brines mainly for calcium, magnesium and sulfate ions. For the ease of comparison, the simulation was run at 6 PV. The declining trends of the simulation data for LSW 1:10 & 1:50 and Mg brine are shown in Figure 6A,B,E.
In general, the simulated ion concentrations are lower than those of the experimental data except for calcium ions where there is a good match. The discrepancy in the case of sulfate ions may be explained by dissolution of the possibly formed calcium sulfate during establishment of the initial water saturation (swi) and subsequent aging of the cores. In the case of magnesium, the reason is not understood, however the simulation model (Phreeqc Interactive 3.3.7) predicted formation of dolomite, i.e., removal of Mg2+. The trend in all the data and the simulation agrees. Figure 6C,D show the comparison between simulated and experimental relative ion concentrations for SO4 brines (1:10 and 1:50). Only Na2SO4 salt was injected as a secondary brine, so in addition to active ions (Ca2+, Mg2+, SO42−). [Na+] was also compared. For both cases, the decline trend and equilibrium concentrations for calcium and sodium (Figure 6C,D) match well with the simulation data, except for calcium where the starting points for the experiments are lower than in the simulation.
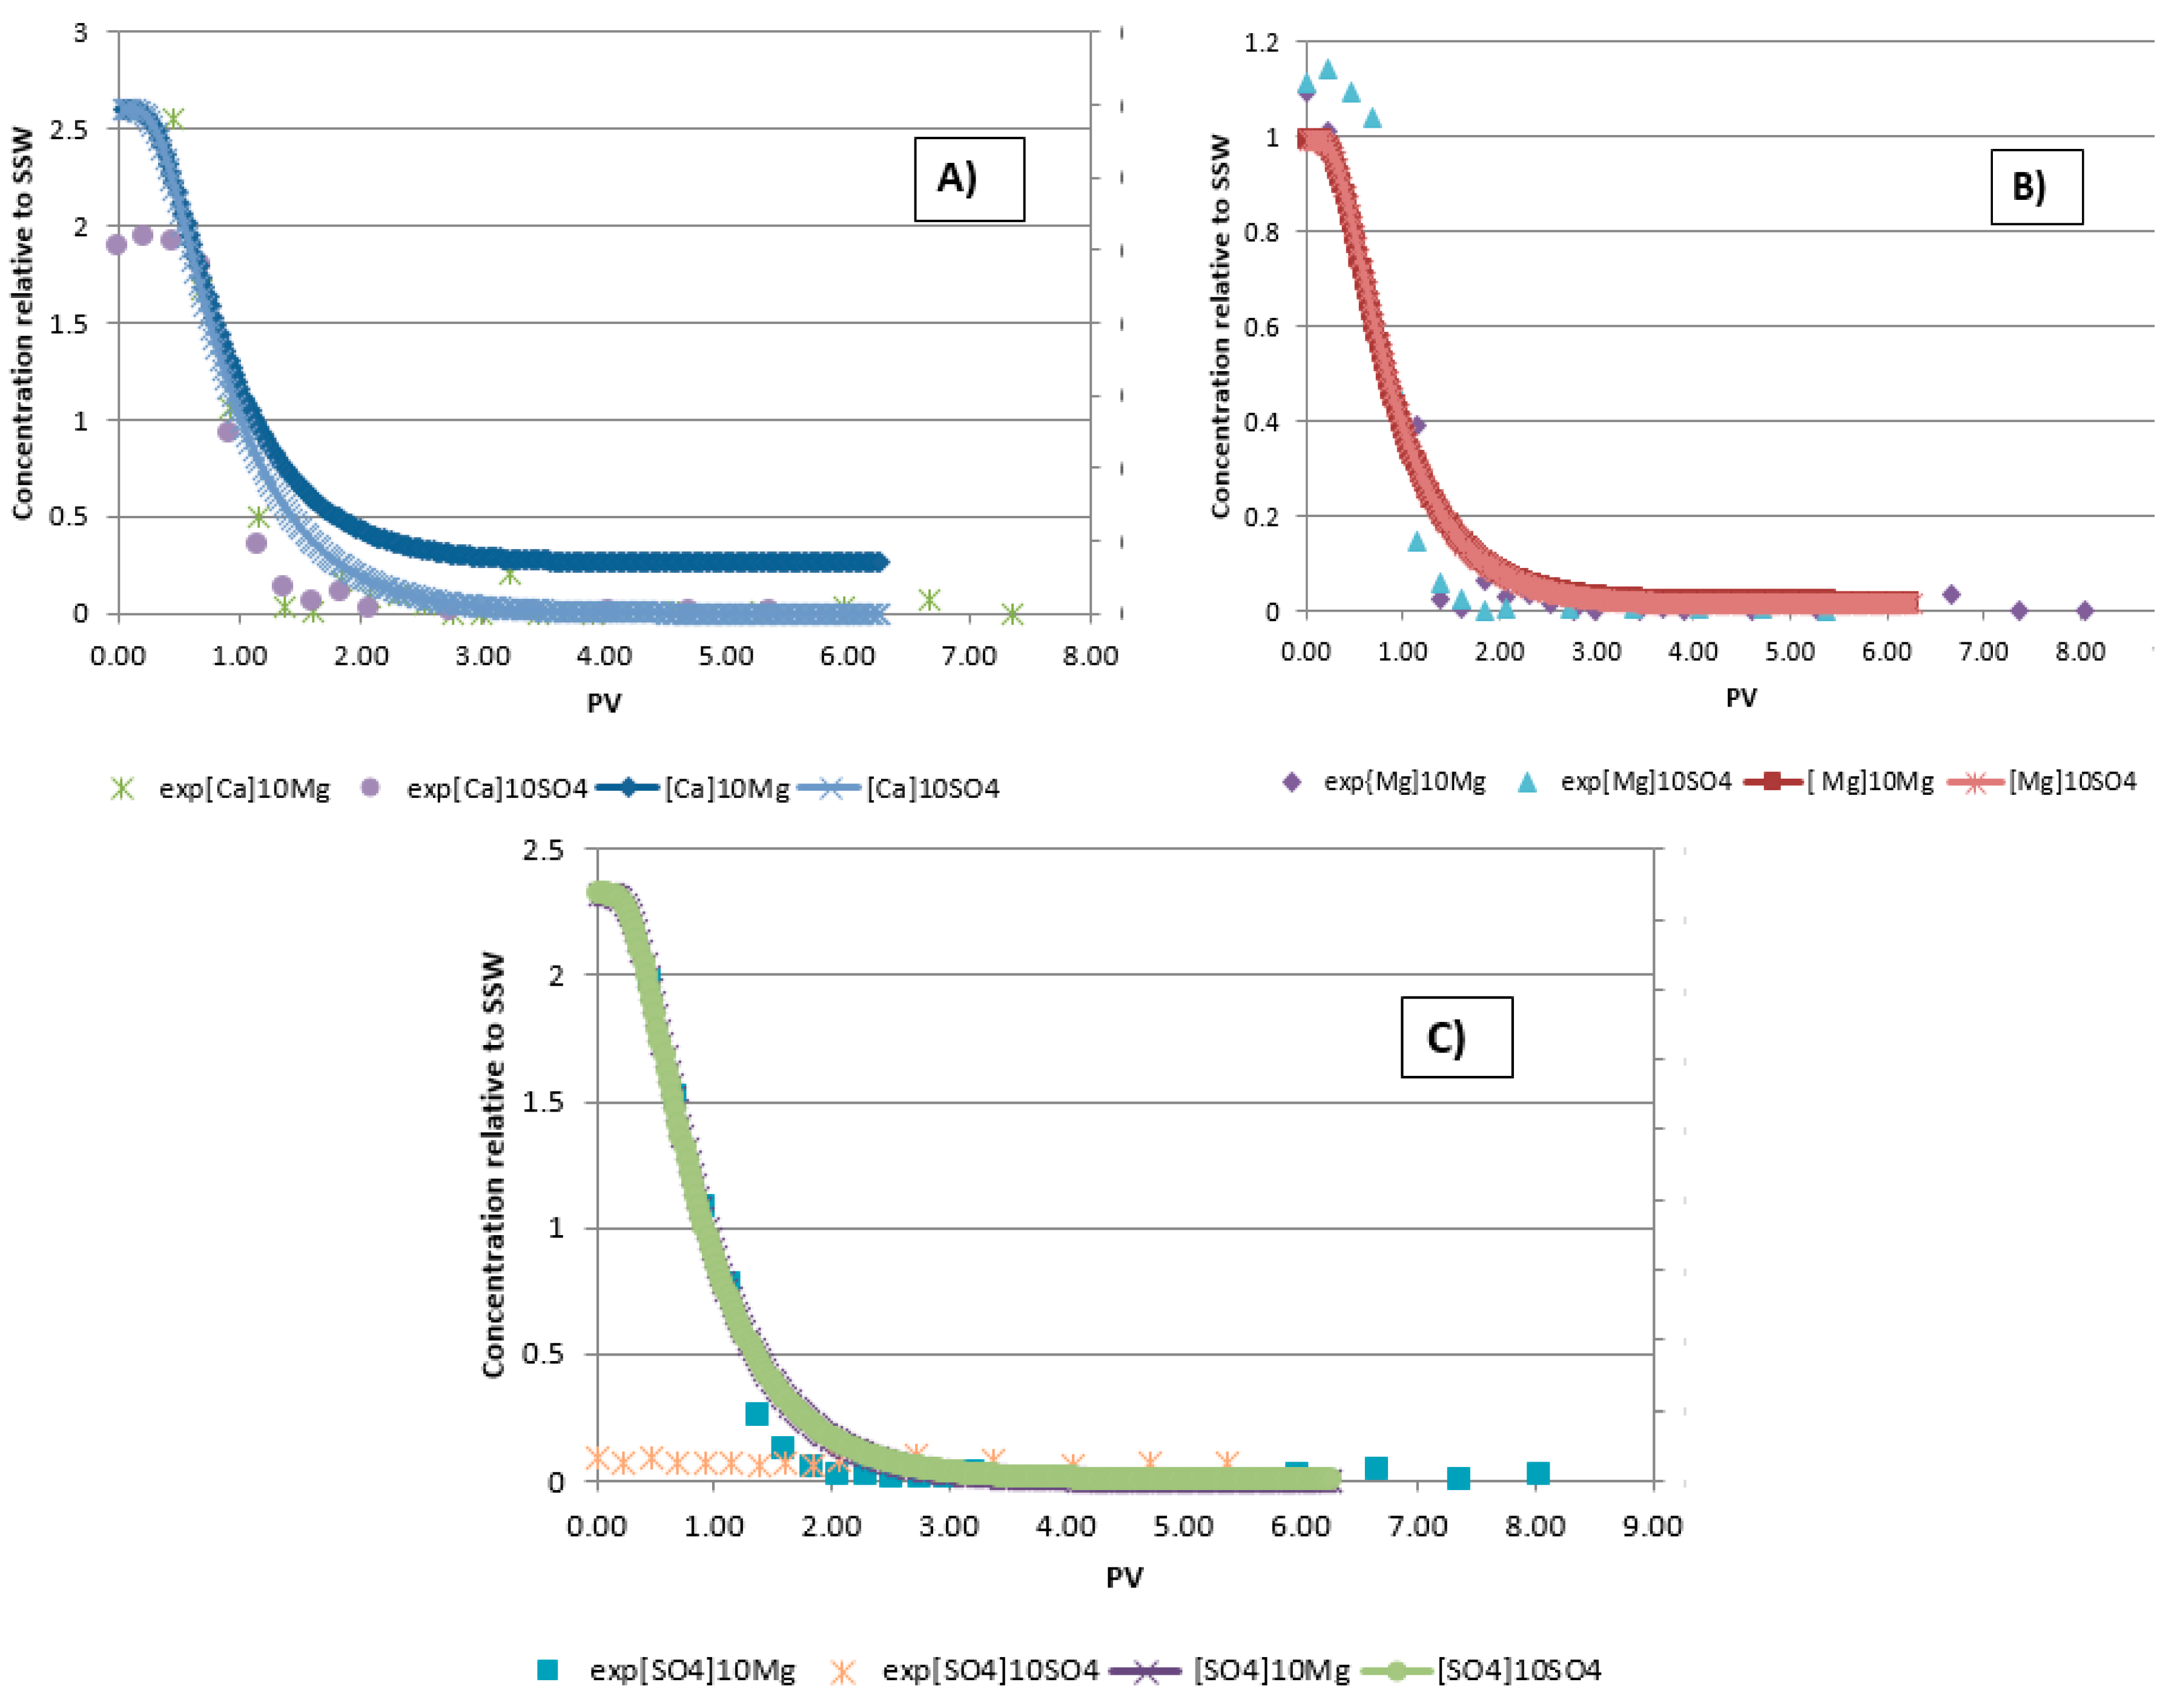
Oil recovery results (Figure 2) showed that SO4 1:10 (68.2%OOIP) and Mg90 (67.9%OOIP) gives the highest oil recovery than all other injected secondary brines. Simulation data matches for all the divalent ions for SO4 and Mg brine (Figure 7), except the equilibrium concentration for calcium (Figure 7A) for SO4 brine (1.007 × 10⁻⁷) is lower than Mg brine (3.46 × 10⁻⁴). Lower [Ca2+] in case of SO4 brine could be due to exchange between Ca/Mg ions.
Ion exchange between Ca2+ and Mg2+ ion may also be reflected in the experimental results. Higher concentration of Mg2+ and lower concentration of Ca2+ in SO4 brine than Mg brine (Figure 7A,B) showed that Ca/Mg ion exchange is more prominent in SO4 1:10 brine. Figure 7C shows lower experimental [SO42−] in SO4 brine than in the experimental and simulation [SO42−] in Mg brine. Adsorption of sulfate and precipitation of calcium sulfate on chalk surface causes a lower amount of calcium and sulfate in the effluents. Adsorption of sulfate on the chalk surface leads to alteration of the wettability towards more water-wet.
4. Summary and Conclusions
The mechanisms related to the increase in oil recovery in carbonate reservoirs are still not completely explainable. A series of experiments were performed for this study to test the low salinity effects in chalk reservoirs. Core were flooded with SSW and modified brines (single salt brines and LSWs) as primary and secondary injection fluids, respectively. Results obtained from these experiments support the observations made by other researchers. Based on the experimental and numerical results we can conclude the following:
- (1)
- Experimentally it is concluded that oil recovery response time depends on the ion dilution factor of the brine. LSW 1:10 gives earlier response than the LSW (1:50).
- (2)
- Divalent Ions have an effect in wettability alteration. Ca/Mg contributes largely in enhancing the sweep efficiency. But this effect increases in presence of SO42−. Highest recovery is obtained while flooding with SO4 brine than any other brine which shows that the presence of sulfate ion may contribute to the wettability alteration.
- (3)
- Increase in ion concentrations of Mg2+ and Ca2+ in the later part of modified brine injection confirms ion exchange between the ions and thus precipitation of magnesium.
- (4)
- 10 times SSW dilution ratio gives the best outcome. This is also in agreement with the case of single salt brine injection. For SO4 1:10 dilution, higher recovery was obtained compared to that with SO4 1:50.
- (5)
- Pressure drop in the secondary flooding may indicate fine migration during injection of single salt brine and LSW, though fines were not observed in the effluent samples during our experiments. This may be due to size of the particles being too small to be observed or the migration took place in the core, fines were trapped and the pressure was not high enough to overcome the trapping resistance of the particles.
Acknowledgments
The authors acknowledge the technical help in our laboratory by Krzysick Nowicki during experimental work. We also acknowledge the excellent help for data monitoring and equipment calibration from Kim Andre Nesse Voland and Svein Myhren. This research is funded by University of Stavanger as part of master thesis work of Sachin Gupta.
Author Contributions
Sachin Gupta performed the experiments collected and analyzed the experimental data. The work supervision and geochemical simulations were done by Aly A. Hamouda.
Conflicts of Interest
The authors declare no conflict of interest.
References
- Al Shalabi, E.W.; Sepehrnoori, K.; Delshad, M. Mechanisms Behind Low Salinity Water Flooding in Carbonate Reservoirs. In Proceedings of the SPE Western Regional & AAPG Pacific Section Meeting 2013 Joint Technical Conference, Monterey, CA, USA, 19–25 April 2013. [Google Scholar]
- Smith, K.W. Brines as Flooding Liquids. In Proceedings of the 7th annual technical meetings of the Bradford District Research Group, Penn. State College, PA, USA, 6–7 November 1942. [Google Scholar]
- Lager, A.; Webb, K.J.; Black, C.J. Impact of brine chemistry on oil recovery. In Proceedings of the 14th European Symposium on IOR, Cairo, Egypt, 22–24 April 2007. [Google Scholar]
- Lager, A.K.; Webb, K.J.; Collins, I.R.; Richmond, D.M. LoSalTM enhanced oil recovery: Evidence of enhanced oil recovery at the reservoir scale. In Proceedings of the SPE/DOE Symposium on Improved Oil Recovery, Tulsa, Oklahoma, 20–23 April 2008. [Google Scholar]
- Webb, K.J.; Black, C.J.J.; Edmonds, I.J. Low salinity oil recovery—The role of reservoir condition core floods. In Proceedings of the 13h European Symposium on Improved Oil Recovery, Budapest, Hungary, 25–27 April 2005. [Google Scholar]
- Webb, K.; Lager, A.; Black, C. Comparison of high/low salinity water/oil relative permeability. In Proceedings of the International Symposium of the Society of Core Analysts, Abu Dhabi, UAE, 29 October–2 November 2008. [Google Scholar]
- Tang, G.-Q.; Morrow, N.R. Influence of brine composition and fines migration on crude oil/brine/rock interactions and oil recovery. J. Pet. Sci. Eng. 1999, 24, 99–111. [Google Scholar] [CrossRef]
- Zhang, P.; Tweheyo, M.T.; Austad, T. Wettability alteration and improved oil recovery in chalk: The effect of calcium in the presence of sulfate. Energy & fuels 2006, 20, 2056–2062. [Google Scholar]
- Yousef, A.A.; Al-Saleh, S.; Al-Jawfi, M.S. The impact of the injection water chemistry on oil recovery from carbonate reservoirs. In Proceedings of the SPE EOR Conference at Oil and Gas West Asia, Muscat, Oman, 16–18 April 2012. [Google Scholar]
- Al-Attar, H.H.; Mahmoud, M.Y.; Zekri, A.Y.; Almehaideb, R.; Ghannam, M. Low-salinity flooding in a selected carbonate reservoir: Experimental approach. J. Pet. Explor. Prod. Technol. 2013, 3, 139–149. [Google Scholar] [CrossRef]
- Petrovich, R.; Hamouda, A. Dolomitization of Ekofisk Oil Field Reservoir Chalk by Injected Seawater. In Proceedings of the Ninth International Symposium on Water–Rock Interactions, Taupo, New Zealand, 30 March–3 April 1998. [Google Scholar]
- Hamouda, A.; Pranoto, A. Synergy between Low Salinity Water Flooding and CO2 for Eor in Chalk Reservoirs. In Proceedings of the SPE EOR Conference at Oil and Gas West Asia, Muscat, Oman, 21–23 March 2016; Society of Petroleum Engineers: Richardson, TX, USA. [Google Scholar]
- Hamouda, A.A.; Rezaei Gomari, K.A. Influence of Temperature on Wettability Alteration of Carbonate Reservoirs. In Proceedings of the SPE/DOE Symposium on Improved Oil Recovery, Tulsa, OK, USA, 22–26 April 2006; Society of Petroleum Engineers: Richardson, TX, USA. [Google Scholar]
- Yousef, A.A.; Al-Saleh, S.H.; Al-Kaabi, A.; Al-Jawfi, M.S. Laboratory investigation of the impact of injection-water salinity and ionic content on oil recovery from carbonate reservoirs. SPE Reservoir Eval. Eng. 2011, 14, 578–593. [Google Scholar] [CrossRef]
- Hamouda, A.A.; Valderhaug, O.M. Investigating enhanced oil recovery from sandstone by low-salinity water and fluid/rock interaction. Energy Fuels 2014, 28, 898–908. [Google Scholar] [CrossRef]
- Linke, W.F.; Seidell, A. Solubilities: Inorganic and Metal-Organic Compounds: A Compilation of Solubility Data from the Periodical Literature; American Chemical Society: Washington, DC, USA, 1958. [Google Scholar]
- Nasralla, R.A.; Nasr-El-Din, H.A. Coreflood Study of Low Salinity Water Injection in Sandstone Reservoirs. In Proceedings of the SPE/DGS Saudi Arabia Section Technical Symposium and Exhibition, Al-Khobar, Saudi Arabia, 15–18 May 2011; Society of Petroleum Engineers: Richardson, TX, USA. [Google Scholar]
- Gandomkar, A.; Rahimpour, M.R. Investigation of low-salinity waterflooding in secondary and tertiary enhanced oil recovery in limestone reservoirs. Energy Fuels 2015, 29, 7781–7792. [Google Scholar] [CrossRef]
- Hamouda, A.A.; Maevskiy, E. Oil recovery mechanism (s) by low salinity brines and their interaction with chalk. Energy Fuels 2014, 28, 6860–6868. [Google Scholar] [CrossRef]
- Lehmann, O.; Birnhack, L.; Lahav, O. Design aspects of calcite-dissolution reactors applied for post treatment of desalinated water. Desalination 2013, 314, 1–9. [Google Scholar] [CrossRef]
Figure 1.
Schematic of the flooding system.

Figure 2.
Comparison of Oil recovery as a function of PV after flooding with SSW as primary fluid and different secondary injection fluid (LSW and LS brines): (A) LSW (1:10 & 1:50); (B) SO4 (1:10 & 1:50); (C) Mg (70C & 90C), Mg+Na; (D) SO4 1:10, Mg70C & Mg+Na.
Figure 2.
Comparison of Oil recovery as a function of PV after flooding with SSW as primary fluid and different secondary injection fluid (LSW and LS brines): (A) LSW (1:10 & 1:50); (B) SO4 (1:10 & 1:50); (C) Mg (70C & 90C), Mg+Na; (D) SO4 1:10, Mg70C & Mg+Na.


Figure 3.
Pressure drop across the core during Primary secondary injection of SSW and different LS brines, respectively as a function of the flooded PV of brines: (A) LSW 1:10, (B) LSW 1:50, (C) SO4 1:10 and 1:50, (D) Mg70C and Mg90C, (E) Mg+Na.
Figure 3.
Pressure drop across the core during Primary secondary injection of SSW and different LS brines, respectively as a function of the flooded PV of brines: (A) LSW 1:10, (B) LSW 1:50, (C) SO4 1:10 and 1:50, (D) Mg70C and Mg90C, (E) Mg+Na.


Figure 4.
The effluent pH by flooding with SSW, LSW 10, LSW 50, SO42− (1:10 & 1:50) and Mg2+ (70 and 90C), Mg+Na brine.
Figure 4.
The effluent pH by flooding with SSW, LSW 10, LSW 50, SO42− (1:10 & 1:50) and Mg2+ (70 and 90C), Mg+Na brine.

Figure 5.
Dimensionless ion concentrations (ratio of the ions from the effluent to corresponding ion in SSW) as a function of PV: (A) calcium, (B) magnesium, (C) sodium, (D) carbonate and (E) sulfate.
Figure 5.
Dimensionless ion concentrations (ratio of the ions from the effluent to corresponding ion in SSW) as a function of PV: (A) calcium, (B) magnesium, (C) sodium, (D) carbonate and (E) sulfate.


Figure 6.
Comparison between experimental (points) and simulated (lines) ion concentrations relative to SSW of Ca2+, Mg2+, SO42− and Na+: (A) LSW 1:10, (B) LSW 1:50, (C) SO4 1:10, (D) SO4 1:50 and (E) Mg brine.
Figure 6.
Comparison between experimental (points) and simulated (lines) ion concentrations relative to SSW of Ca2+, Mg2+, SO42− and Na+: (A) LSW 1:10, (B) LSW 1:50, (C) SO4 1:10, (D) SO4 1:50 and (E) Mg brine.


Figure 7.
Comparison between experimental (points) and simulated (lines) ion concentrations relative to SSW for SO4 1:10 and Mg brines: (A) calcium, (B) magnesium and (C) sulfate.
Figure 7.
Comparison between experimental (points) and simulated (lines) ion concentrations relative to SSW for SO4 1:10 and Mg brines: (A) calcium, (B) magnesium and (C) sulfate.


Table 1.
Properties of cores saturated with Model Oil (n-decane+stearic acid, SA) and Crude Oil X from the North Sea.
Table 1.
Properties of cores saturated with Model Oil (n-decane+stearic acid, SA) and Crude Oil X from the North Sea.
| Oil Used in Saturation of Cores | Core | Length (cm) | Diameter (cm) | swi (%) | sor (%) | Pore Volume (mL) | Porosity (%) | Flooding Sequence of Brines in the Core |
|---|---|---|---|---|---|---|---|---|
| Model Oil (n-decane + stearic acid, SA) | 1 | 5.92 | 3.78 | 23 | 24.4 | 34.23 | 51.8 | SSW/SO4 (1:10) |
| 2 | 6.01 | 3.78 | 21 | 35.8 | 34.23 | 51.8 | SSW/Mg (1:10) | |
| 4 | 5.95 | 3.78 | 22.3 | 32.2 | 31.94 | 50.12 | SSW/SO4 (1:50) | |
| 7 | 6.00 | 3.78 | 21.8 | 40.2 | 34.8 | 52.22 | SSW/Mg+Na (1:10) | |
| 8 | 6.00 | 3.78 | 28.5 | 23.1 | 33 | 50.99 | SSW/Mg (1:10) at 90 °C | |
| Crude Oil X | 5 | 6.008 | 3.78 | 19.01 | 32.5 | 32.50 | 50.55 | SSW/LSW (1:10) |
| 6 | 6.00 | 3.78 | 21.1 | 38.4 | 34.50 | 52.04 | SSW/LSW (1:50) |
Table 2.
Physical Parameters of Model Oil (n-decane + Stearic acid, SA) and Crude Oil.
| Property | Temperature | Model Oil (n-decane + 0.005M SA) | Crude Oil X |
|---|---|---|---|
| Density (g/cc) | 20 °C | 0.73 | 0.7827 |
| 50 °C | 0.705 | 0.7009 | |
| 70 °C | 0.67 | 0.7537 | |
| Dynamic Viscosity (cP) | 70 °C | 0.41 | 0.4976 |
Table 3.
Composition of Crude Oil X.
| Components | Mole Fraction |
|---|---|
| i-C5 | 1.79 × 10⁻⁵ |
| n-C5 | 0.000117 |
| C6 | 0.002371 |
| C7 | 0.013287 |
| C8 | 0.039608 |
| C9 | 0.062886 |
| C10 | 0.881712 |
Table 4.
Ion compositions in SSW and LS Brines used in secondary injection.
| Ions/Brine | SSW | LSW 1:10 | LSW 1:50 | Mg+Na | SO42− Brine | SO42− Brine | Mg2+ Brine |
|---|---|---|---|---|---|---|---|
| (mole/L) | (mole/L) | (mole/L) | 1 to 10 | 1 to 10 | 1 to 50 | 1 to 10 | |
| (mole/L) | (mole/L) | (mole/L) | (mole/L) | ||||
| HCO3− | 0.002 | 0.0002 | 0.00004 | ||||
| Cl− | 0.525 | 0.0525 | 0.0105 | 0.0493 | 0.009 | ||
| SO42− | 0.024 | 0.0024 | 0.00048 | 0.0024 | 0.00048 | ||
| Mg+2 | 0.045 | 0.0045 | 0.0009 | 0.0045 | 0.0045 | ||
| Ca+2 | 0.013 | 0.0013 | 0.00026 | ||||
| Na+ | 0.45 | 0.045 | 0.009 | 0.0403 | 0.0046 | 0.00092 | |
| K+ | 0.01 | 0.001 | 0.0002 | ||||
| TDS (ppm) | 33,388 | 3338.8 | 667.76 | 2785 | 336.2 | 67.24 | 423 |
| TDS (g/L) | 33.33 | 3.33 | 0.667 | 2.78 | 0.336 | 0.067 | 0.423 |
| Ionic Strength | 0.657 | 0.0657 | 0.01314 | 0.0538 | 0.007 | 0.0014 | 0.0135 |
| pH | 7.83 | 7.32 | 6.74 | 5.85 | 7.12 | 6.74 | 6.11 |
© 2017 by the authors. Licensee MDPI, Basel, Switzerland. This article is an open access article distributed under the terms and conditions of the Creative Commons Attribution (CC BY) license (http://creativecommons.org/licenses/by/4.0/).
Share and Cite
MDPI and ACS Style
Hamouda, A.A.; Gupta, S. Enhancing Oil Recovery from Chalk Reservoirs by a Low-Salinity Water Flooding Mechanism and Fluid/Rock Interactions. Energies 2017, 10, 576. https://0-doi-org.brum.beds.ac.uk/10.3390/en10040576
AMA Style
Hamouda AA, Gupta S. Enhancing Oil Recovery from Chalk Reservoirs by a Low-Salinity Water Flooding Mechanism and Fluid/Rock Interactions. Energies. 2017; 10(4):576. https://0-doi-org.brum.beds.ac.uk/10.3390/en10040576
Chicago/Turabian StyleHamouda, Aly A., and Sachin Gupta. 2017. "Enhancing Oil Recovery from Chalk Reservoirs by a Low-Salinity Water Flooding Mechanism and Fluid/Rock Interactions" Energies 10, no. 4: 576. https://0-doi-org.brum.beds.ac.uk/10.3390/en10040576
Note that from the first issue of 2016, this journal uses article numbers instead of page numbers. See further details here.