Effects of Loading Rate on Gas Seepage and Temperature in Coal and Its Potential for Coal-Gas Disaster Early-Warning


1
Key Laboratory of Coal Methane and Fire Control (China University of Mining and Technology), Ministry of Education, Xuzhou 221116, China
2
School of Safety Engineering, China University of Mining and Technology, Xuzhou 221116, China
3
Department of Mining Engineering and Metallurgical Engineering, Western Australian School of Mines, Curtin University, Kalgoorlie, WA 6430, Australia
*
Authors to whom correspondence should be addressed.
Energies 2017, 10(9), 1246; https://0-doi-org.brum.beds.ac.uk/10.3390/en10091246
Submission received: 28 July 2017
/
Revised: 11 August 2017
/
Accepted: 15 August 2017
/
Published: 23 August 2017
(This article belongs to the Special Issue Oil and Gas Engineering)
Abstract
:The seepage velocity and temperature externally manifest the changing structure, gas desorption and energy release that occurs in coal containing gas failure under loading. By using the system of coal containing gas failure under loading, this paper studies the law of seepage velocity and temperature under different loading rates and at 1.0 MPa confining pressure and 0.5 MPa gas pressure, and combined the on-site results of gas pressure and temperature. The results show that the stress directly affects the seepage velocity and temperature of coal containing gas, and the pressure and content of gas have the most sensitivity to mining stress. Although the temperature is not sensitive to mining stress, it has great correlation with mining stress. Seepage velocity has the characteristic of critically slowing down under loading. This is demonstrated by the variance increasing before the main failure of the samples. Therefore, the variance of seepage velocity with time and temperature can provide an early warning for coal containing gas failing and gas disasters in a coal mine.
1. Introduction
With the depth of coal mining increasing, the geostress, gas pressure and gas content also increase, and the mechanism of a coal and gas outburst caused by stress and gas becomes complicated. In China, regulations, such as the Coal Mine Safety Regulations, Provisions on Prevention and Control of Coal and Gas Outbursts and others, are implemented in coal mines, and some measures, for example protective seam mining and gas drainage, are taken to eliminate the risk of coal and gas outburst [1,2,3,4,5,6]. Other countries also set standards for preventing dynamical disasters in coal mines, such as the American Mining Safety and Health Act, the Mining Safety Act in Japan and the Australian Mining Safety and Health Act. However, because of the effect of mining and geological structure, it is challenging to eliminate coal and gas outburst in the process of uncovering coal in crosscutting and roadway driving, so some methods for prediction and prevention should be undertaken. Before the coal and gas outburst occurs, some indicators, including gas pressure, cuttings, coal ruggedness coefficient, acoustic emission, temperature and others change abnormally [7,8,9,10,11], and those abnormal changes are used to predict disasters. Some scholars studied the characteristics of those indexes before the occurrence of disasters by on-site and off-site experiments and simulation methods. For the rock outburst and gas outburst that occurred in Hullera Vasco Leonesa coal mine in Spanish which caused injuries and fatalities, Toraño et al. [12] established a system that monitors the law of gas pressure, desorption velocity and other parameters. Based on these monitoring results, they ensured the desorption velocity as the optimal index to predict outburst. Stephen et al. [13] presented an obvious change in the permeability and acoustic properties of sandstone by conducting an experiment of sandstone outburst in the laboratory. Under gas fracturing, the samples deformed, and at the critical point of failure, the acoustic parameters obviously increased [14]. Through micro-seismic monitoring, Holub et al. [15] found that the microseismic parameters could be used to predict coal and gas outburst disaster. Based on past experience of coal and gas outburst prediction, gas parameters as the prediction index are the most used, with stress changes coming second, and other indices are only used in exploratory studies. Because the geostress, gas pressure and coal properties are different in different coal seams, the sensitivity of forecasting indicators is also different. This causes inaccuracy in some predictions, especially when the index uses only few parameters. Therefore, the combination of gas, stress and other indicators to predict coal and gas outburst has a positive practical significance.
During coal sample loading, the stress, loading rate and other factors cause changes to the structure and rupture mode of samples, and these affect the seepage channel and velocity [16,17,18,19,20,21]. By measuring the fracture aperture and the permeability of gas that flows through those fractures, Huy et al. [22] found that there was a linear relationship between permeability and fracture aperture. Siriwardane et al. [23] changed the experimental, confining pressure by using pressure transient methods, and found that confining pressure compressed the internal pores of the sample that caused CO2 permeability to decrease. Connell et al. [24] studied the permeability law under different experimental conditions, and proposed an analytical coal permeability model. Loading causes internal friction in the coal body and that produces internal energy, and part of it scatters as heat that causes change to the temperature field. The temperature change can be studied by temperature monitoring and infrared measurement technology [25,26,27,28,29,30]. When coal, rock and other materials are under loading, the action of failure and slip produce heat [31]. When the gas flowed from one end of an under-loaded sample to the other end, the gas temperature would increase and the distribution of the temperature field was affected by the flow gas [32]. So, the gas seepage velocity and coal temperature change is the external manifestation of the change of structure, loading state, gas desorption status, and energy release of samples under loading.
Using a self-developed testing system for gas containing coal samples, this paper examines the seepage velocity and temperature of samples under different loading rates, and uses the results of on-site gas pressure and temperature measurements to explain the experimental results. The study offers a basic reference for further study of coal and gas outburst prediction using the coupled method of gas and temperature.
2. Experimental Preparation
2.1. Preparation of Coal Samples
Briquette is an ideal substitute for raw coal for loading experiments [33]; therefore, this paper used briquette to conduct the experiment and samples were made of coal from Liangbei coal mine. Based on the study of Tian [34] and Ji [35], when the diameter of coal particles is between 0.015 mm and 0.5 mm, the mechanical properties of briquette are great, so the #40 mesh sieve (0.45 mm) was used to filter the coal powder for the experiment. The mass of coal, binder and water was selected by rule of thumb, and the pressure and time of making briquette were decided based on the study of Yu [36] and Hu [37]. The room temperature whilst working was between 14 °C and 16 °C. The subtle temperature change does not affect the properties of briquette, thus this temperature change is not considered. The steps are shown as follows. Pulverized coal particles passed through a #40 mesh sieve were used. The 220 g pulverized coal, 72 g binder and 43 g pure water were weighed and evenly mixed together. The mixture was put into the Φ 50 mm × 100 mm hole, which is in the mold. The molding pressure was 100 MPa and the compression time was 10 h. Under the abovementioned conditions, the briquettes were made. To avoid the effect of rough surface on the experiment, we used sandpaper to polish the upper and lower surfaces until they were smooth. The samples were placed in the oven until the quality was unchanged. After that, those briquettes were placed into a container. And the samples are shown as Figure 1.
2.2. Experimental Devices
The testing system consists of a nitrogen tank (to provide the confining pressure), a gas tank (to provide gas pressure), an integrated seepage velocity and temperature measurement device (made by ALICAT, Tucson, AZ, USA), and the triaxial loading system that consisted of a pressure machine (YAW4306, MTS Corporation, Eden Prairie, MN, USA) and a computer controlling load scheme. The system schematic diagram is shown in Figure 2. It can simulate the gas seepage in a coal seam under different levels of geostress.
2.3. Experimental Procedures
Under 1.0 MPa confining pressure and 0.5 MPa gas pressure, the seepage velocity and temperature of samples were tested at 50 N/s, 100 N/s and 200 N/s loading rates.
The detailed experimental procedures are:
- (a)
- Coal samples were put into heat-shrinkable tubes, and a gasket was inserted. The surfaces of the tube were heated by hot air, which made the heat-shrinkable tubes attached to the coal samples tight, and then both ends of the tube were closed.
- (b)
- Then the steel cavity was placed on the work platform of the loading system. The coal sample was placed inside the bottom of the device, and a gasket was put on top of it (for sealing).
- (c)
- After putting the lid on the cavity, the screw nuts were tightened. Next, all the pipelines were connected and the air tightness was checked.
- (d)
- The cavity was filled with 1.0 MPa N2, and when the confining pressure was stable, the heat-shrinkable tube was filled with 0.5 MPa methane gas. When it was steady and had remained stable for 12 h, the experiment under different loading rates (50 N/s, 100 N/s and 200 N/s) was conducted, and the data recorded.
3. Results
3.1. Seepage Velocity
From Figure 3, we can see that from the initial loading stage to before the peak stress, the seepage velocity decreases. When the stress reaches the peak, the seepage velocity reaches the minimum value. The stress continuously increases after the peak stress, and does so rapidly. This is because when the stress reaches the peak, the main rupture of samples occurs, and fissures run through coal in a very short time. This provides the transport channel for the gas flow. As the stress continuously increases, the damage and cracks of samples continue to develop, and the gas flows more smoothly.
In Figure 3a–c there are three curves showing the axial stress-time-seepage under 50 N/s, 100 N/s and 200 N/s loading rate.
Under different loading rates, the initial seepage velocity V0 varies, and the time ΔT from V0 to the minimum seepage velocity Vmin is 325 s, 149 s and 98 s, respectively. The decreasing range , is 0.5 mL/min, 1.3 mL/min and 0.3 mL/min, respectively. As the loading rate increases, the time ΔT decreases, and ΔV1 first decreases and then increases. Because the value of ΔV1 is small, it cannot intuitively reflect the change of seepage velocity. So the decrease ratio is used to describe the seepage change. Under different loading rates, the decrease ratio K1 is 38.5%, 92.9% and 14.3%, respectively. Namely, with the loading rate increasing, the K1 first increases and then decreases.
When the loading stress exceeds the peak, the seepage velocity dramatically increases. Under different loading rates, the maximum Vmax is 15.5 mL/min, 6.5 mL/min and 9.8 mL/min, and the increase range is 14.6 mL/min, 6.2 mL/min and 7.9 mL/min, respectively. That is to say with the loading rate increasing, the Vmax and ΔV2 first decrease and then increase. When the loading rate is 50 N/s, 100 N/s and 200 N/s, the increase ratio is 1622.2%, 2066.7% and 415.8%, respectively. Thus, with the loading rate increasing, K2 first increases and then decreases and this trend is the same as that of K1.
3.2. Seepage Temperature
Figure 4a–c has three curves, showing the axial stress-temperature under 50 N/s, 100 N/s and 200 N/s loading rate.
From Figure 4, we see that the coal sample temperature increases linearly with loading. When the loading rates are 50 N/s, 100 N/s and 200 N/s, the increase range of temperature is 2.29 °C, 1.27 °C and 0.74 °C, respectively. This indicates that the temperature increases more at higher loading rates. This means that the loading rate can affect the mechanical properties of samples, which further determines the amount of heat released. However, the load bearing capacity is not a key factor in determining the amount of heat released. When the loading rates are 50 N/s and 100 N/s, the load bearing capacity is not much different but the increased range of temperature differs substantially. When the loading rate is 200 N/s, the coal sample exhibits the highest bearing capacity, but the temperature increase range is smaller than that at lower loading rates.
After the peak stress, the temperature continues to increase linearly with time. The increasing rates for different loading rates before and after the peak stress are shown in Table 1. When the loading rate is 50 N/s and 100 N/s, the increase slope of temperature before peak stress is larger than that after peak stress. The opposite phenomenon is observed at the 200 N/s loading rate.
4. Discussion
4.1. The Effect of Loading Rate on the Seepage Velocity and Temperature
The loading rate affects the final failure modes of the sample, and based on those, the cracks of sample under different loading rates are drawn, as shown in Figure 5.
In Figure 5a–c are the final crack types under 50 N/s, 100 N/s and 200 N/s loading rate, and Figure 5d is the force analysis chart.
The loading rates have influence on the final form of coal sample damage. Based on the actual test results, the sketch drawing of the final failure cracks is presented in Figure 5. As can be seen, under different loading rates, the final damage forms all have a larger fracture angle and the failure mode is dominated by longitudinal tensile failure. The failure surface runs through samples. However, depending on the loading rate, a difference exists in the number and form of the cracks. When the loading rate is 50 N/s, there are two cracks, one of which runs through the sample and the other ends at the side of the sample. At 100 N/s, three cracks are generated at different positions at the top of samples. Secondary cracks merge with the main crack and form the final crack. When the loading rate is 200 N/s, the number of cracks is the highest. Secondary cracks are generated at the top of the sample and form the main crack. Two secondary cracks generated from the main crack finally converge and end at the side of the sample because of shear effects and slippage. These drawings illustrate that with the increase of loading rate, the number of cracks and rupture blocks are relatively more [10], and ‘the outburst tendency’ is more obvious. The number of cracks that run through the samples is increased, and the direction of the cracks has a smaller angle with the main stress direction.
Due to the effect of confining pressure, samples still have some bearing capacity after failing, and this is called residual stress. Under different loading rates, the residual stress is 5.94 kN, 13.99 kN and 18.62 kN, and its decrease range is 14.99%, 19.92% and 25.93%, respectively. In the failure mode, with the loading rate increasing, more cracks are generated and the damage is more serious. This causes a residual stress decrease and a shorter time before the samples completely lose their bearing capacity.
There are some differences of the seepage velocity before and after samples failure. Before the sample failure, the seepage velocity decreases. This is related to how the coal samples are made. The samples were made under 100 MPa pressure (equivalent to 200 kN). Therefore, the internal homogeneity of the samples is better than coal. The peak stresses in the experiment are 18.7 kN, 17.4 kN and 25.7 kN, which are well below the molding pressure. Therefore, before failure, the sample is in the plastic stage and there is no obvious transition from the elastic stage to the elastoplastic stage. With stress increase, the micro-pores inside the samples would be more compacted, and the gas flow channel is more obstructed, which makes seepage velocity decrease. When the stress reaches the peak, the macro-fracture occurs and the cracks run through the samples in an extremely short time. These provide channels for gas flow and seepage velocity increasing dramatically. After the peak stress, the samples have some bearing capacity and with the stress increasing, the damage and cracks of samples continuously develop such that the channel is made smoother, so that the seepage velocity continues to increase until the samples lose their residual bearing. The stronger the bearing capacity is after peak stress, the larger the increase range of seepage velocity. Compared with Figure 3, we see that 100 N/s loading rate has the longest time from peak stress to losing residual strength and largest K2 value.
Although coal temperature increases under all loading rates, the increase gradients are different before and after samples failure. Before the main failure, crystal friction and slip inside the sample produces heat that causes the seepage temperature to increase. Since the behaviors are a function of time, the dissipation energy continues to release during loading and leads to seepage temperature increase. At 50 N/s loading rate, the time from the beginning of the experiment to the main failure is the longest, so the increase range of temperature was the largest. After sample failure, the seepage velocity dramatically increases and gas takes away some heat. However, due to the bearing capacity of samples, crystal friction and crack expansion inside the sample produces more heat to supplement the heat of gas desorption, and that explains the continuing temperature increase after main failure as shown in Figure 4. This also explains why the temperature increase range after main failure is lower than that before the peak stress.
4.2. On-Site Verification
The Liangbei coal mine in Henan province has experienced coal and gas outburst, so it belongs to the group of ‘outburst coal mines’. The main mining coal seam is 4.18 m in thickness and has low permeability. The 11,061 mining face was selected as the monitor site and its upper part is a coal pillar (for protecting the border) and 11,041 goaf and the lower part is 11,081 goaf. So it is an island coal face. The integrated devices for pressure, gas flow and temperature monitoring were installed in the machinery tunnel as shown in Figure 6. The pressure sensor measures the coal stress by connecting hydraulic tubing and an oil pressure capsule inserted to a borehole. The gas pressure sensor is connected to a flow sensor to measure the gas desorption pressure in the borehole. The temperature sensor measures the coal temperature in the borehole [38]. The monitoring results over the course of mining are shown in Figure 7 and Figure 8.
(1) The change of coal stress
The initial oil pressure in the capsule is 10 MPa when the pressure sensor is installed. It takes time for it to be stabilized and fully contact with the surrounding coal. After it was stabilized, the oil pressure in the capsule was about 8.6 MPa. The change of oil pressure was about 0.1 MPa in three days, which verifies the stabilization status. The pressure value can be treated as close to the coal stress in the borehole. In Figure 7 and Figure 8, the oil pressure can be seen as the same as the coal stress.
From Figure 7, we can see that with the face advancing, the supported area gradually affects the monitor point, where the oil pressure in the capsule increases, and the maximum increase of coal stress surrounding the borehole is 2 MPa over 4 days. It can be seen that during mining, the mine pressure of the 11,061 mining face as an island coal face obviously increased, which affected mining safety. So pressure-relief boreholes were drilled to reduce the stress concentration and avoid high pressure occurring. Pressure-relief boreholes were drilled near the monitor point on December 4th. After that, the coal stress dramatically decreased by about 8.6 MPa and the time of coal stress decrease continued for about one day. Comparing the stress before and after pressure-release, it was found that after pressure release, the stress was only about 16% of the previous stabilized coal stress. With face mining advancing, the stress gradually increased. Before the data acquisition device was disassembled, the coal stress increased 2.6 MPa, and reached about 47% of the previous stabilized coal stress.
(2) The change of gas pressure
The gas pressure in the borehole can be divided into three stages by studying the monitor data.
The first stage was the gas pressure stabilization phase. In this stage, the gas pressure increased to a stable value.
In the second stage, gas pressure is affected by the mining process. In this stage, due to mining, the stress in borehole changed, and some gas in the surrounding coal runs into the borehole. Because of stress increase, the coal permeability decreased and the storage effect occurred surrounding the borehole. These caused a gas pressure increase.
The third stage was the effect of the pressure-relief boreholes. After drilling the pressure-relief boreholes, the gas pressure decreased. It takes time for coal stress to reduce and fissures to connect. Thus, gas pressure reduced slowly at the beginning. When the stress dramatically decreased and the cracks surrounding the borehole are connected, the gas pressure rapidly decreased. Although the gas pressure was extremely low, it still existed. From the monitoring data, the existence of the low pressure gas was reasonable, because there was no seepage dynamic force to release it.
(3) The change of temperature
The temperature experienced increase and decrease that was similar to the gas pressure change. From Figure 8 we can see that there was a dramatic temperature change after drilling the pressure-relief borehole. Before drilling the borehole, the coal stress slowly increased with the advance of the mining face, and because of squeezing and friction, the coal produced a larger amount of heat, and the temperature increased by about 0.4 °C. After that, the coal stress decreased and some released gas took away some heat such that temperature decreased about 1.3 °C. The temperature is mainly affected by the stress, so the stress rapidly decreasing caused the temperature change. The temperature decrease made cracks develop and open and that provided a channel for heat loss. The temperature decreased slowly but not dramatically illustrating the heat lost at a certain rate. In Figure 8, there was a short time in which the temperature rapidly increased, and that was possibly caused by coal squeezing and friction due to coal movement during pressure release. However, because of the heat loss in the channel, the temperature rapidly decreased.
After drilling the pressure-relief borehole, the temperature stayed low for a long time and kept at a similar temperature to the roadway. As the mining face advanced, the temperature increased. In the last stage of monitoring, because of high mining pressure in the 11,061 mining face, the roadway deformation was serious, and the temperature slowly increased. This could be because of two reasons. The first reason is stress. Due to serious roadway deformation, the collapse of the borehole made the temperature sensor completely attached to coal, so the coal squeezing and friction caused a temperature increase. The second reason is gas. Due to stress increasing, gas started to accumulate in the borehole, and this caused gas pressure increase and temperature increase.
Based on the above analysis, we can conclude that, during mining, mining stress affects the characteristic of gas seepage and storage, the pressure and content of gas and the coal temperature field. The pressure and content of gas are sensitive to the mining stress. Although the temperature is not as sensitive, it has a great correlation with the stress. This agrees with the experimental result described in Section 3. It verifies the feasibility of assessing the risk caused by the coupling effect of mining stress and gas by monitoring gas pressure, content, and temperature in the borehole.
4.3. Potential Application in Gas Disaster Warning
In this paper, the critical slowing down principle is introduced to study the response of gas seepage velocity with time during loading, and the seepage velocity is analyzed using the variance that characterizes the critical slowing down.
From the coal and rock failure in laboratories to the coal mine dynamical disasters, earthquakes and climate change in nature, there is some information about sudden changes before those events occur. So applying the critical slowing down principle to study the effective precursor information on the mutation has become a hot topic in recent years [39,40]. Critical slowing down is a concept in statistical physics. Before the mutation where the dynamical system moves from one phase to another, there is a scattered fluctuation phenomenon that is indicative of a new phase forming, which expressed in range decreasing and other phenomena. Those phenomena are called ‘slowing down’ [41].
When a control parameter in a random mechanism approaches a critical threshold, the critical slowing down will lead to an autocorrelation fluctuation and variance increase [42,43]. Assuming that the state parameters change in the period t, the equilibrium regression is approximately exponential and the recovery velocity is λ. In the simple autoregressive model, this can be described by Equation (1).
where: xn is the deviation of system state variable from equilibrium; εn is random quantity meeting the normal distribution; s is the mean square error. If λ and t do not depend on xn, Equation (1) can be simplified as a first order autoregressive model
where: autocorrelation coefficient .
The autoregressive process of Equation (2) is analyzed by variance
The rate of small perturbation recovery becomes slower as the system approaches the critical point [42]. When the system approaches the critical point, the recovery rate λ tends to zero and the autocorrelation term α approaches 1. From Equation (3) we know the variance approaches infinity. So the increased variance can be seen as the precursor signal for the system approaching the critical point. This is because the window length and lag step have a smaller effect on the variance of the precursor information [43]. Therefore, the window length and lag step are chosen to be 5 and 10, respectively, and the change of variance with time is shown in Figure 8.
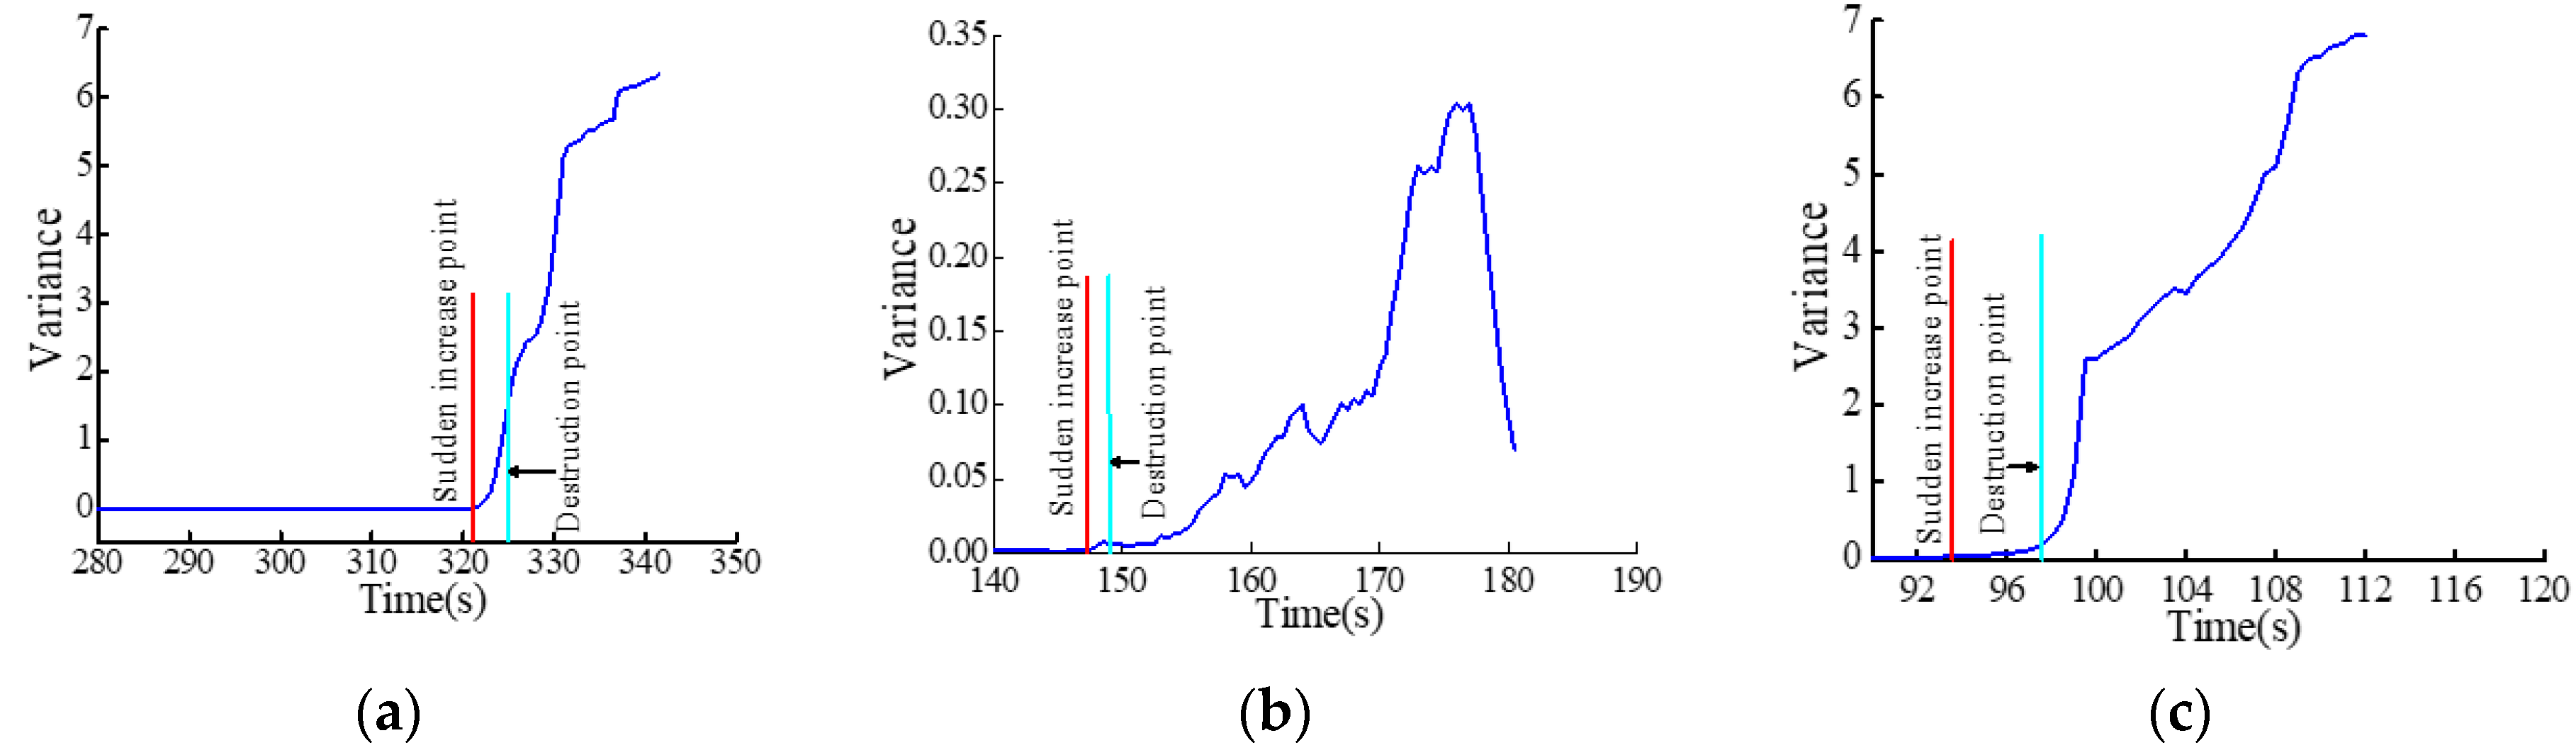
Figure 9a–c has three curves, showing the variance-time under 50 N/s, 100 N/s and 200 N/s loading rate.
From Figure 9, it can be seen that the variation of variance is basically the same in each case. At the beginning, the variance was near zero and undergoes no significant change. Then, it starts a constant increase. This phenomenon is consistent with the study of using variance as the precursor information [42,43]. When the loading rate is 50 N/s, 100 N/s and 200 N/s, the time for seepage velocity to reach a minimum is 325 s, 149 s, 98 s, respectively. By using the variance to deal with the seepage velocity, the precursor time becomes 321 s, 147 s and 93 s, and the time is advanced 4 s, 2 s, and 5 s, respectively. The advanced time ratios are 1.3%, 1.3% and 5.1%. It can be seen that with the increase of loading rate, the advance time ratio of variance increases gradually, from 1.3% at 50 N/s to 501% at 200 N/s, and the time of variance increasing occurred before reaching the samples’ maximum carrying capacity.
Before main failure, the variance of seepage velocity with time is sensitive, so it can be seen as precursor information for sample failure in the laboratory. Such information combined with temperature and stress can be used as an early warning and monitoring indicator for on-site coal seam failure and disaster.
4.4. Potential for Implementing the Results into Coal Mining in China
- (1)
- Based on Section 4.1 and Section 4.2, it can be found that the loading rate affects the rupture model, and with the loading rate increasing, the number of broken pieces increases, and the impact damage model, as well the change in gas seepage and temperature is more obvious. When the coal seam containing gas is mined, due to geostress and the advancing rate of increase, the phenomenon of “loading rate increase” occurring at the working face causes stress concentration. These factors increase the risk of dynamical disasters.
- (2)
- When the coal seam containing gas is mined, the mining stress determines the characteristics of gas seepage and storage, the change of gas pressure, gas content and temperature field. Before dynamical disasters happen, parameters, such as gas pressure, stress and temperature, change tremendously. Based on the critical slowing down, we established an early warning model using stress–gas–temperature indexes and combined real-time measuring data of the gas pressure, gas content (the two parameters could reflect gas seepage) and temperature in boreholes, realizing real-time monitoring and warning of danger in coal seam mining. When the monitoring indexes become abnormal, the model will provide a warning in reasonable time, and certain measures of pressure relief are taken to decrease the gas pressure, gas content and the danger of coal mining, which is important for coal mine safety.
- (3)
- China has some of the most serious coal and gas outbursts in the world. The gas source is 36.81 trillion m3 and the area from which gas can be extracted and utilized is about 10 trillion m3. The permeability is low in most coal mines, so gas extraction is hard. Due to the demand of economic development, mining depth increases at a rate between 10 m per year and 25 m per year, and the mining depth is between 800 m and 1000 m in the middle-east. There are 47 coal mines with a depth of more than 1000 m. There are a large number of deep coal mines with high gas stress and content, at high risk of outburst in Henan, Anhui, Heilongjiang, Liaoning and other provinces. Due to the high geostress, gas content, gas pressure and low permeability, the danger of dynamical disasters is serious [44]. This paper studied the law of stress, gas and temperature of samples and provides a theoretical basis for early warning of coal and gas outbursts using the “stress–gas–temperature” model. The research achievements have great potential application in early warning systems in coal mines with high geostress, gas content and gas pressure.
5. Conclusions
- (1)
- Under different loading rates, the large fracture angle and the main failure mode (longitudinal tensile and fracture face running through the sample) is the same, but the number and mode of cracks are different. As the loading rate increases, the fracture integrity of the sample is gradually weakened and the number of broken pieces and cracks increase.
- (2)
- There is some difference of seepage velocity before and after sample failure. Before failure, the seepage velocity continues to drop. After main failure, the cracks run through the sample and provide channels for gas flow, so the seepage velocity dramatically increases. As the sample has some bearing capacity after the peak stress, with continuous loading and the damage and crack developing, the seepage velocity continuously increases until the end of the loading process.
- (3)
- There is some difference of seepage temperature before and after sample failure. Before main failure, the seepage temperature increases proportionally with time and inversely proportional to loading rates; after main failure, gas desorption takes away some heat, and because of the residual bearing capacity, crystal friction and slip inside the sample produce heat that makes the seepage temperature increase at a slower rate.
- (4)
- Seepage velocity has the characteristic of critical slowing down under loading, which is expressed by the variance increasing before the sample failure. The on-site test result illustrates that the stress can affect the characteristics of seepage temperature and velocity. The gas pressure is more sensitive to the mining stress. Although temperature is less sensitive, it has a great correlation with coal seam stress.
- (5)
- The research results from laboratory and on-site verified the method of using gas pressure, gas content (the two indicators reflect the seepage velocity) and temperature as an early warning indicator for gas disasters introduced by stress and gas. Exploring the gas, temperature and stress and other indicators to predict coal disaster has great potential and importance for the accuracy and reliability on early warning of a coal and gas outburst.
- (6)
- China has some of the most serious coal and gas outbursts in the world. There are a large number of deep coal mines with high gas stress and content, at high risk of outburst in Henan, Anhui, Heilongjiang, Liaoning and other provinces. Due to the high geostress, gas content, gas pressure and low permeability, the danger of dynamical disasters is serious. The research achievements of this paper have great potential application in early warning systems in those coal mines.
Acknowledgments
This work was supported by the Fundamental Research Funds for the Central Universities (2017CXNL02) and A Project Funded by the Priority Academic Program Development of Jiangsu Higher Education Institutions (PAPD). The authors are grateful to all the people who helped us in this paper, and we are also very grateful to Enyuan Wang who provided the experimental system and contributed analysis tools.
Author Contributions
For this paper, the design of article ideas and experimental tests was by Chong Zhang; Xiaofei Liu put forwarded study ideas, conducted the on-site tests and wrote the paper; Guang Xu discussed experimental ideas with Xiaofei Liu and completed the data testing and analysis; the laboratory tests and analysis were completed by Xiaoran Wang and Chong Zhang.
Conflicts of Interest
The content of the paper is original and on behalf of all the authors, I can confirm that this material was not published elsewhere and the authors have no conflict of interest.
References
- Ma, Z.; Tu, M.; MA, J.; Zhang, B.; Han, M. Rock mass deformation characteristics for coal mining at remote lower protective seam. J. Min. Saf. Eng. 2008, 25, 253–257. [Google Scholar]
- State Administration of Work Safety (SAWS). Technical Criterion of Protective Coal Seam Exploitation; Coal Industry Publishing House: Beijing, China, 2009. [Google Scholar]
- State Administration of Work Safety (SAWS). Coal Mine Safety Regulations; Coal Industry Publishing House: Beijing, China, 2011. [Google Scholar]
- Shen, R.; Wang, E.; Liu, Z.; Li, Z. Rockburst prevention mechanism and technique of close-distance lower protective seam mining. J. China Coal Soc. 2011, 36, 63–67. [Google Scholar]
- Liang, Y.; Hua, G.; Ping, L. Theory and technology of goaf gas drainage with large diameter surface boreholes. J. China Coal Soc. 2013, 38, 1–8. [Google Scholar]
- Liu, H.; Cheng, Y. The elimination of coal and gas outburst disasters by long distance lower protective seam mining combined with stress-relief gas extraction in the Huaibei coal mine area. J. Nat. Gas Sci. Eng. 2015, 27, 346–353. [Google Scholar] [CrossRef]
- Xie, H.; Pariseau, W.G. Fractal character and mechanism of rock bursts. Int. J. Rock Mech. Min. Sci. Geomech. Abstr. 1993, 30, 343–350. [Google Scholar] [CrossRef]
- Frid, V.; Vozoff, K. Electromagnetic radiation induced by mining rock failure. Int. J. Coal Geol. 2005, 64, 57–65. [Google Scholar] [CrossRef]
- Wang, E.; He, X.; Nie, B.; Liu, Z. Principle of Predicting Coal and Gas Outburst Using Electromagnetic Emission. J. China Univ. Min. Technol. 2005, 3, 225–229. [Google Scholar]
- Lin, B.; Yan, F.; Zhu, C.; Zhou, Y.; Zou, Q.; Guo, C.; Liu, T. Cross-borehole hydraulic slotting technique for preventing and controlling coal and gas outbursts during coal roadway excavation. J. Nat. Gas Sci. Eng. 2015, 26, 518–525. [Google Scholar] [CrossRef]
- Tang, J.; Jiang, C.; Chen, Y.; Li, X.; Wang, G.; Yang, D. Line prediction technology for forecasting coal and gas outbursts during coal roadway tunneling. J. Nat. Gas Sci. Eng. 2016, 34, 412–418. [Google Scholar] [CrossRef]
- Toraño, J.; Torno, S.; Alvarez, E.; Riesgo, P. Application of outburst risk indices in the underground coal mines by sublevel caving. Int. J. Rock Mech. Min. Sci. 2012, 50, 94–101. [Google Scholar] [CrossRef]
- Stephen, D.B.; Frempong, P.K.; Chinmoy, M.; Upshall, J. Characterization of the permeability and acoustic properties of an outburst-prone sandstone. J. Appl. Geophys. 2005, 58, 1–12. [Google Scholar]
- Ishida, T.; Aoyagi, K.; Niwa, T.; Chen, Y.; Murata, S.; Chen, Q.; Nakayama, Y. Acoustic emission monitoring of hydraulic fracturing laboratory experiment with supercritical and liquid CO2. Geophys. Res. Lett. 2012, 39, 16309. [Google Scholar] [CrossRef]
- Holub, K.; Petroš, V. Some parameters of rockbursts derived from underground seismological measurements. Tectonophysics 2008, 456, 67–73. [Google Scholar] [CrossRef]
- Yin, G.; Li, X.; Zhao, H.; Li, X. Experimental research on effect of geostress on outburst coal’s gas seepage. Chin. J. Rock Mech. Eng. 2008, 27, 2557–2561. [Google Scholar]
- Liu, J.; Chen, Z.; Elsworth, D.; Miao, X.; Mao, X. Evaluation of stress-controlled coal swelling processes. Int. J. Coal Geol. 2010, 83, 446–455. [Google Scholar] [CrossRef]
- Liu, J.; Chen, Z.; Elsworth, D.; Miao, X.; Mao, X. Evolution of coal permeability from stress-controlled to displacement-controlled swelling conditions. Fuel 2011, 90, 2987–2997. [Google Scholar] [CrossRef]
- Zou, J.; Chen, W.; Yang, D.; Yu, H.; Yuan, J. The impact of effective stress and gas slippage on coal permeability under cyclic loading. J. Nat. Gas Sci. Eng. 2016, 31, 236–248. [Google Scholar] [CrossRef]
- Moghadam, A.A.; Chalaturnyk, R. Rate dependency of permeability in tight rocks. J. Nat. Gas Sci. Eng. 2017, 40, 208–225. [Google Scholar] [CrossRef]
- Yin, Q.; Jing, H.; Su, H.; Zhu, T. Loading rate effect on fracture properties of granite after high temperature. J. China Univ. Min. Technol. 2015, 44, 597–603. [Google Scholar]
- Huy, P.Q.; Sasaki, K.; Sugai, Y.; Ichikawa, S. Carbon dioxide gas permeability of coal core samples and estimation of fracture aperture width. Int. J. Coal Geol. 2010, 83, 1–10. [Google Scholar] [CrossRef]
- Siriwardane, H.; Haljasmaa, I.; McLendon, R.; Irdi, G.; Soong, Y.; Bromhal, G. Influence of carbon dioxide on coal permeability determined by pressure transient methods. Int. J. Coal Geol. 2009, 77, 109–118. [Google Scholar] [CrossRef]
- Connell, L.D.; Lu, M.; Pan, Z. An analytical coal permeability model for triaxial strain and stress conditions. Int. J. Coal Geol. 2010, 84, 103–114. [Google Scholar] [CrossRef]
- Offermann, S.; Beaudoin, J.L.; Bissieux, C.; Frick, H. Thermoelastic stress analysis under nonadiabatic conditions. Exp. Mech. 1997, 37, 409–413. [Google Scholar] [CrossRef]
- Wu, L.; Wu, Y.; Liu, S.; Li, G.; Li, Y. Infrared radiation of rock impacted at low velocity. Int. J. Rock Mech. Min. Sci. 2004, 41, 321–327. [Google Scholar] [CrossRef]
- Liu, S.; Wu, L.; Zhang, Y. Temporal-spatial evolution features of infrared thermal images before rock failure. J. Northeast. Univ. Nat. Sci. 2009, 30, 1034–1038. [Google Scholar]
- Ma, L.; Li, Q.; Cao, X.; Zhou, T. Variation characteristics of internal infrared radiation temperature of coal-rock mass in compression process. J. China Univ. Min. Technol. 2013, 42, 331–336. [Google Scholar]
- Zhang, Y.; Li, J.; Liu, X.; Tian, B. Infrared radiation portentous characteristics of rock burst in roadway. J. Min. Saf. Eng. 2015, 32, 786–792. [Google Scholar]
- Sun, X.; Xu, H.; He, M.; Zhang, F. Experimental investigation of the occurrence of rockburst in a rock specimen through infrared thermography and acoustic emission. Int. J. Rock Mech. Min. Sci. 2017, 93, 250–259. [Google Scholar] [CrossRef]
- Hintsala, E.D.; Bhowmick, S.; Xie, Y.; Ballarini, R.; Asif, S.A.S.; Gerberich, W.W. Temperature dependent fracture initiation in microscale silicon. Scr. Mater. 2017, 130, 78–82. [Google Scholar] [CrossRef]
- Brown, J.; Vardy, A.; Zeng, Z. Influence of radial seepage on temperature distribution around a cylindrical cavity in a porous medium. Int. J. Heat Mass Transf. 1998, 41, 1531–1541. [Google Scholar] [CrossRef]
- Yin, G.; Wang, D.; Zhang, D.; Wang, W. Test analysis of deformation characteristics and compressive strengths of two types of coal specimens containing gas. Chin. J. Rock Mech. Eng. 2009, 28, 410–417. [Google Scholar]
- Tian, B.; Xu, D.; Yang, F.; Pang, Y.; Xu, R.; Lin, X.; Wang, Y.; School of Chemical and Environment Engineering; China University of Mining and Technology. Briquetting Pressure and Fine Coal Particle Distribution Affected to Performances of Cool Pressed Briquette. Coal Sci. Technol. 2013, 41, 125–128. [Google Scholar]
- Ji, D.; Wang, Z.; Zhang, L.; Ma, Y. The examination study of the size-composition of the fine-coal briquetting. J. China Coal Soc. 2005, 30, 100–103. [Google Scholar]
- Yu, Y.; Zhang, H.; Zhang, C.; Hao, Z.; Wang, L. Effects of temperature and stress on permeability of standard coal briquette specimen. J. China Coal Soc. 2013, 38, 936–941. [Google Scholar]
- Hu, X.; Liang, W.; Hou, S.; Zhu, X.; Huang, W. Experimental study of effect of temperature and stress on permeability characteristics of raw coal and shaped coal. Chin. J. Rock Mech. Eng. 2012, 31, 1222–1229. [Google Scholar]
- Ma, Y. Real-Time Monitoring Multi-Parameters for Gas Bearing Coal Seam and Its Application; China University of Mining & Technology: Xuzhou, China, 2012. [Google Scholar]
- Scheffer, M.; Bascompte, J.; Brock, W.A.; Brovkin, V.; Carpenter, S.R.; Dakos, V.; Held, H.; van Nes, E.H.; Rietkerk, M.; Sugihara, G. Early-warning signals for critical transitions. Nature 2009, 461, 53–59. [Google Scholar] [CrossRef] [PubMed]
- Kump, L.R. Palaeoclimate: Foreshadowing the glacial era. Nature 2005, 436, 333–334. [Google Scholar] [CrossRef] [PubMed]
- Yu, L.; Hao, B. Phase Transition and Critical Phenomena; Science Press: Beijing, China, 1984. [Google Scholar]
- Gao, L.; Yang, Y.; Liu, J.; Zhu, C. Research on critical slowing down precursor before two moderate earthquake in Xinjiang. Inland Earthq. 2013, 27, 311–318. [Google Scholar]
- Kong, X.; Wang, E.; Hu, S.; Li, Z.; Liu, X.; Fang, B.; Zhan, T. Critical slowing down on acoustic emission characteristics of coal containing methane. J. Nat. Gas Sci. Eng. 2015, 24, 156–165. [Google Scholar] [CrossRef]
- Liang, Y. Strategic thinking of simultaneous exploitation of coal and gas in deep mining. J. China Coal Soc. 2016, 41, 8–13. [Google Scholar]
Figure 1.
Coal samples.

Figure 2.
Schematic diagram for the experimental system.

Figure 3.
The axial stress-time-seepage curve at different loading rates: (a) the curve of stress-time-seepage under 50 N/s loading rate; (b) the curve of stress-time-seepage under 100 N/s loading rate and (c) the curve of stress-time-seepage under 200 N/s.
Figure 3.
The axial stress-time-seepage curve at different loading rates: (a) the curve of stress-time-seepage under 50 N/s loading rate; (b) the curve of stress-time-seepage under 100 N/s loading rate and (c) the curve of stress-time-seepage under 200 N/s.

Figure 4.
The axial stress and temperature in the same time curve: (a) the curve of stress-temperature-time under 50 N/s loading rate; (b) the curve of stress-temperature-time under 100 N/s loading rate and (c) the curve of stress-temperature-time under 200 N/s.
Figure 4.
The axial stress and temperature in the same time curve: (a) the curve of stress-temperature-time under 50 N/s loading rate; (b) the curve of stress-temperature-time under 100 N/s loading rate and (c) the curve of stress-temperature-time under 200 N/s.

Figure 5.
The final crack types and force analysis chart: (a) the curve of final crack types under 50 N/s loading rate; (b) the curve of final crack types under 100 N/s loading rate; (c) the curve of final crack types under 200 N/s and (d) the force analysis chart.
Figure 5.
The final crack types and force analysis chart: (a) the curve of final crack types under 50 N/s loading rate; (b) the curve of final crack types under 100 N/s loading rate; (c) the curve of final crack types under 200 N/s and (d) the force analysis chart.

Figure 6.
The location of 11,061 mining face and measuring point in Liang Bei coal mine.

Figure 7.
Real-time comparison between gas pressure and oil pressure during the mining process.

Figure 8.
Real-time comparison between gas pressure and temperature during the mining process.

Figure 9.
The index of critical slowing down at different loading rates: (a) the curve of critical slowing down index under 50 N/s loading rate; (b) the curve of critical slowing down index under 100 N/s loading rate and (c) the curve of critical slowing down index under 200 N/s.
Figure 9.
The index of critical slowing down at different loading rates: (a) the curve of critical slowing down index under 50 N/s loading rate; (b) the curve of critical slowing down index under 100 N/s loading rate and (c) the curve of critical slowing down index under 200 N/s.


Table 1.
Increase slope of temperature-time during loading process.
| Loading Condition | Increase Slope of Temperature—Time | |
|---|---|---|
| Before Peak Stress | After Peak Stress | |
| 50 N/s | 0.00681 | 0.00529 |
| 100 N/s | 0.00609 | 0.00595 |
| 200 N/s | 0.00516 | 0.00581 |
© 2017 by the authors. Licensee MDPI, Basel, Switzerland. This article is an open access article distributed under the terms and conditions of the Creative Commons Attribution (CC BY) license (http://creativecommons.org/licenses/by/4.0/).
Share and Cite
MDPI and ACS Style
Zhang, C.; Liu, X.; Xu, G.; Wang, X. Effects of Loading Rate on Gas Seepage and Temperature in Coal and Its Potential for Coal-Gas Disaster Early-Warning. Energies 2017, 10, 1246. https://0-doi-org.brum.beds.ac.uk/10.3390/en10091246
AMA Style
Zhang C, Liu X, Xu G, Wang X. Effects of Loading Rate on Gas Seepage and Temperature in Coal and Its Potential for Coal-Gas Disaster Early-Warning. Energies. 2017; 10(9):1246. https://0-doi-org.brum.beds.ac.uk/10.3390/en10091246
Chicago/Turabian StyleZhang, Chong, Xiaofei Liu, Guang Xu, and Xiaoran Wang. 2017. "Effects of Loading Rate on Gas Seepage and Temperature in Coal and Its Potential for Coal-Gas Disaster Early-Warning" Energies 10, no. 9: 1246. https://0-doi-org.brum.beds.ac.uk/10.3390/en10091246
Note that from the first issue of 2016, this journal uses article numbers instead of page numbers. See further details here.