Characterization and Consecutive Prediction of Pore Structures in Tight Oil Reservoirs


1
College of Geosciences, China University of Petroleum, Beijing 102249, China
2
Institute of Geophysics and Geomatics, China University of Geosciences, Wuhan 430074, China
3
Research Institute of Exploration and Development, Xinjiang Oilfield Company, PetroChina, Karamay 834000, China
4
Petroleum Engineering Department, University of North Dakota, Grand Forks, ND 58202, USA
5
Wuhan Geomatic Institute, Wuhan 430022, China
*
Author to whom correspondence should be addressed.
Energies 2018, 11(10), 2705; https://0-doi-org.brum.beds.ac.uk/10.3390/en11102705
Submission received: 28 September 2018
/
Revised: 8 October 2018
/
Accepted: 9 October 2018
/
Published: 11 October 2018
(This article belongs to the Special Issue Flow and Transport Properties of Unconventional Reservoirs 2018)
Abstract
:The Lucaogou Formation in Jimuaser Sag of Junggar Basin, China is a typical tight oil reservoir with upper and lower sweet spots. However, the pore structure of this formation has not been studied thoroughly due to limited core analysis data. In this paper, the pore structures of the Lucaogou Formation were characterized, and a new method applicable to oil-wet rocks was verified and used to consecutively predict pore structures by nuclear magnetic resonance (NMR) logs. To do so, a set of experiments including X-ray diffraction (XRD), mercury intrusion capillary pressure (MICP), scanning electron microscopy (SEM) and NMR measurements were conducted. First, SEM images showed that pore types are mainly intragranular dissolution, intergranular dissolution, micro fractures and clay pores. Then, capillary pressure curves were divided into three types (I, II and III). The pores associated with type I and III are mainly dissolution and clay pores, respectively. Next, the new method was verified by “as received” and water-saturated condition T2 distributions of two samples. Finally, consecutive prediction in fourteen wells demonstrated that the pores of this formation are dominated by nano-scale pores and the pore structure of the lower sweet spot reservoir is more complicated than that in upper sweet spot reservoir.
1. Introduction
As a major unconventional resource, tight oil reservoirs have received significant attention for exploration and development all around the world [1,2,3]. Tight oil reservoirs are complex and highly heterogeneous, generally characterized by low porosity and ultra-low permeability [4,5]. Single wells have no natural production capacity, which requires horizontal drilling and hydraulic fracturing to obtain economic flow [5,6,7,8]. It is necessary to evaluate various properties of such reservoirs for a better exploitation of the resources. However, macroscopic petrophysical parameters such as porosity, permeability, and saturation cannot satisfy adequate evaluation of the effectiveness of tight oil reservoirs. In this regard, pore structures, in particular determine reservoir storage capacity and control rock transportation characteristics, represent microscopic properties of the rock [9,10,11,12]. Therefore, characterization and consecutive prediction of rock pore structure in wells is a key task in the study of tight oil reservoirs.
The Permian Lucaogou Formation of Jimusaer Sag, Junggar Basin, China is a typical tight oil reservoir which has been studied previously in terms of the pore structures. Kuang et al. [13], Zhang et al. [14], Zhou [15] and Su et al. [16] used diverse imaging techniques such as CT-scanning, SEM and FIB-SEM image analysis to qualitatively characterize the pore structures. They concluded that pore types include organic matter pores, mineral pores, inter-crystalline pore, dissolved pores, and micro cracks. Zhao et al. [17] presented that the median capillary radius of this reservoir ranges from 0.0063 to 0.148 μm with an average of 0.039 μm. Zhao et al. [18] studied the complexity and heterogeneity of pore structures based on multifractal characteristics of nuclear magnetic resonance (NMR) transverse relaxation (T2) distributions. Wang et al. [19] investigated pore size distributions and fractal characteristics of this formation by combining high pressure and constant rate mercury injection data. However, the limited number of core samples could not reflect general properties of this formation. The NMR logging which is consecutively recording the vertical variations of transverse relaxation time can reveal pore distributions and is widely used to overcome the discrete data points that core sample analysis owns.
Researchers have conducted extensive studies on the construction of mercury intrusion capillary pressure curves by NMR T2 distributions obtained in laboratory [20,21,22,23,24,25,26,27]. The pore structure evaluation methods by NMR technique are based on the fact the rocks are water-saturated and hydrophilic. However, in oil reservoirs, it is necessary to correct the effect of hydrocarbons on T2 spectra of NMR logging. Volokin and Looyedtijn [22,23] first studied the morphological correction of T2 spectra of NMR logging in hydrocarbon-bearing rocks. The basic idea is that the bound water of the T2 distribution is constant, and hydrocarbon would only affect the free fluid portion of the T2 distribution. Therefore, when performing a hydrocarbon-containing correction on the T2 distribution, it is only required to correct the T2 signal of the free fluid portion and remain the bound fluid of T2 signal intact. Xiao et al. [28] established a method for constructing capillary pressure curves based on J function and Schlumberger Doll Research (SDR) model. This method used T2 logarithmic mean value (T2lm) as an input parameter, which makes it possible for the correction of T2 distributions regarding hydrocarbons. This is possible because T2lm can be calibrated by core values. Hu et al. [29] proposed a novel method for hydrocarbon corrections where T2 distribution measured by short echo time (TE) was used to construct the T2 distribution under full-water conditions with long TE time. The difference between the measured and constructed water-saturated state T2 distributions determines the oil signal and the water signal, thereby the correction of the hydrocarbon-containing state T2 distribution would become achievable. Ge et al. [30] proposed a correction method through extracting oil signals from the echoes, which has been already applied to carbonate reservoirs. Xiao et al. [31] proposed a method to remove the effect of hydrocarbons on NMR T2 response based on a point-by-point calibration method. However, the application of these methods would be challenging when the wettability of the reservoir appears to be oleophilic or neutral. This is because the bulk transversal relaxation time could not be ignored according to NMR relaxation mechanism [32,33,34]. Zhao [35] proposed a new method for evaluating pore structures of reservoirs with neutral wettability and oil-wetting characteristics, but the method is not firmly verified.
In this research, the major objectives are to: (a) characterize the pore structures by MICP data and SEM images; (b) further confirm the Zhao method [35] by “as-received” and water saturated state T2 distributions; and finally (c) predict the global features of pore structures via field NMR logs.
2. Methods
2.1. Samples and Experiments
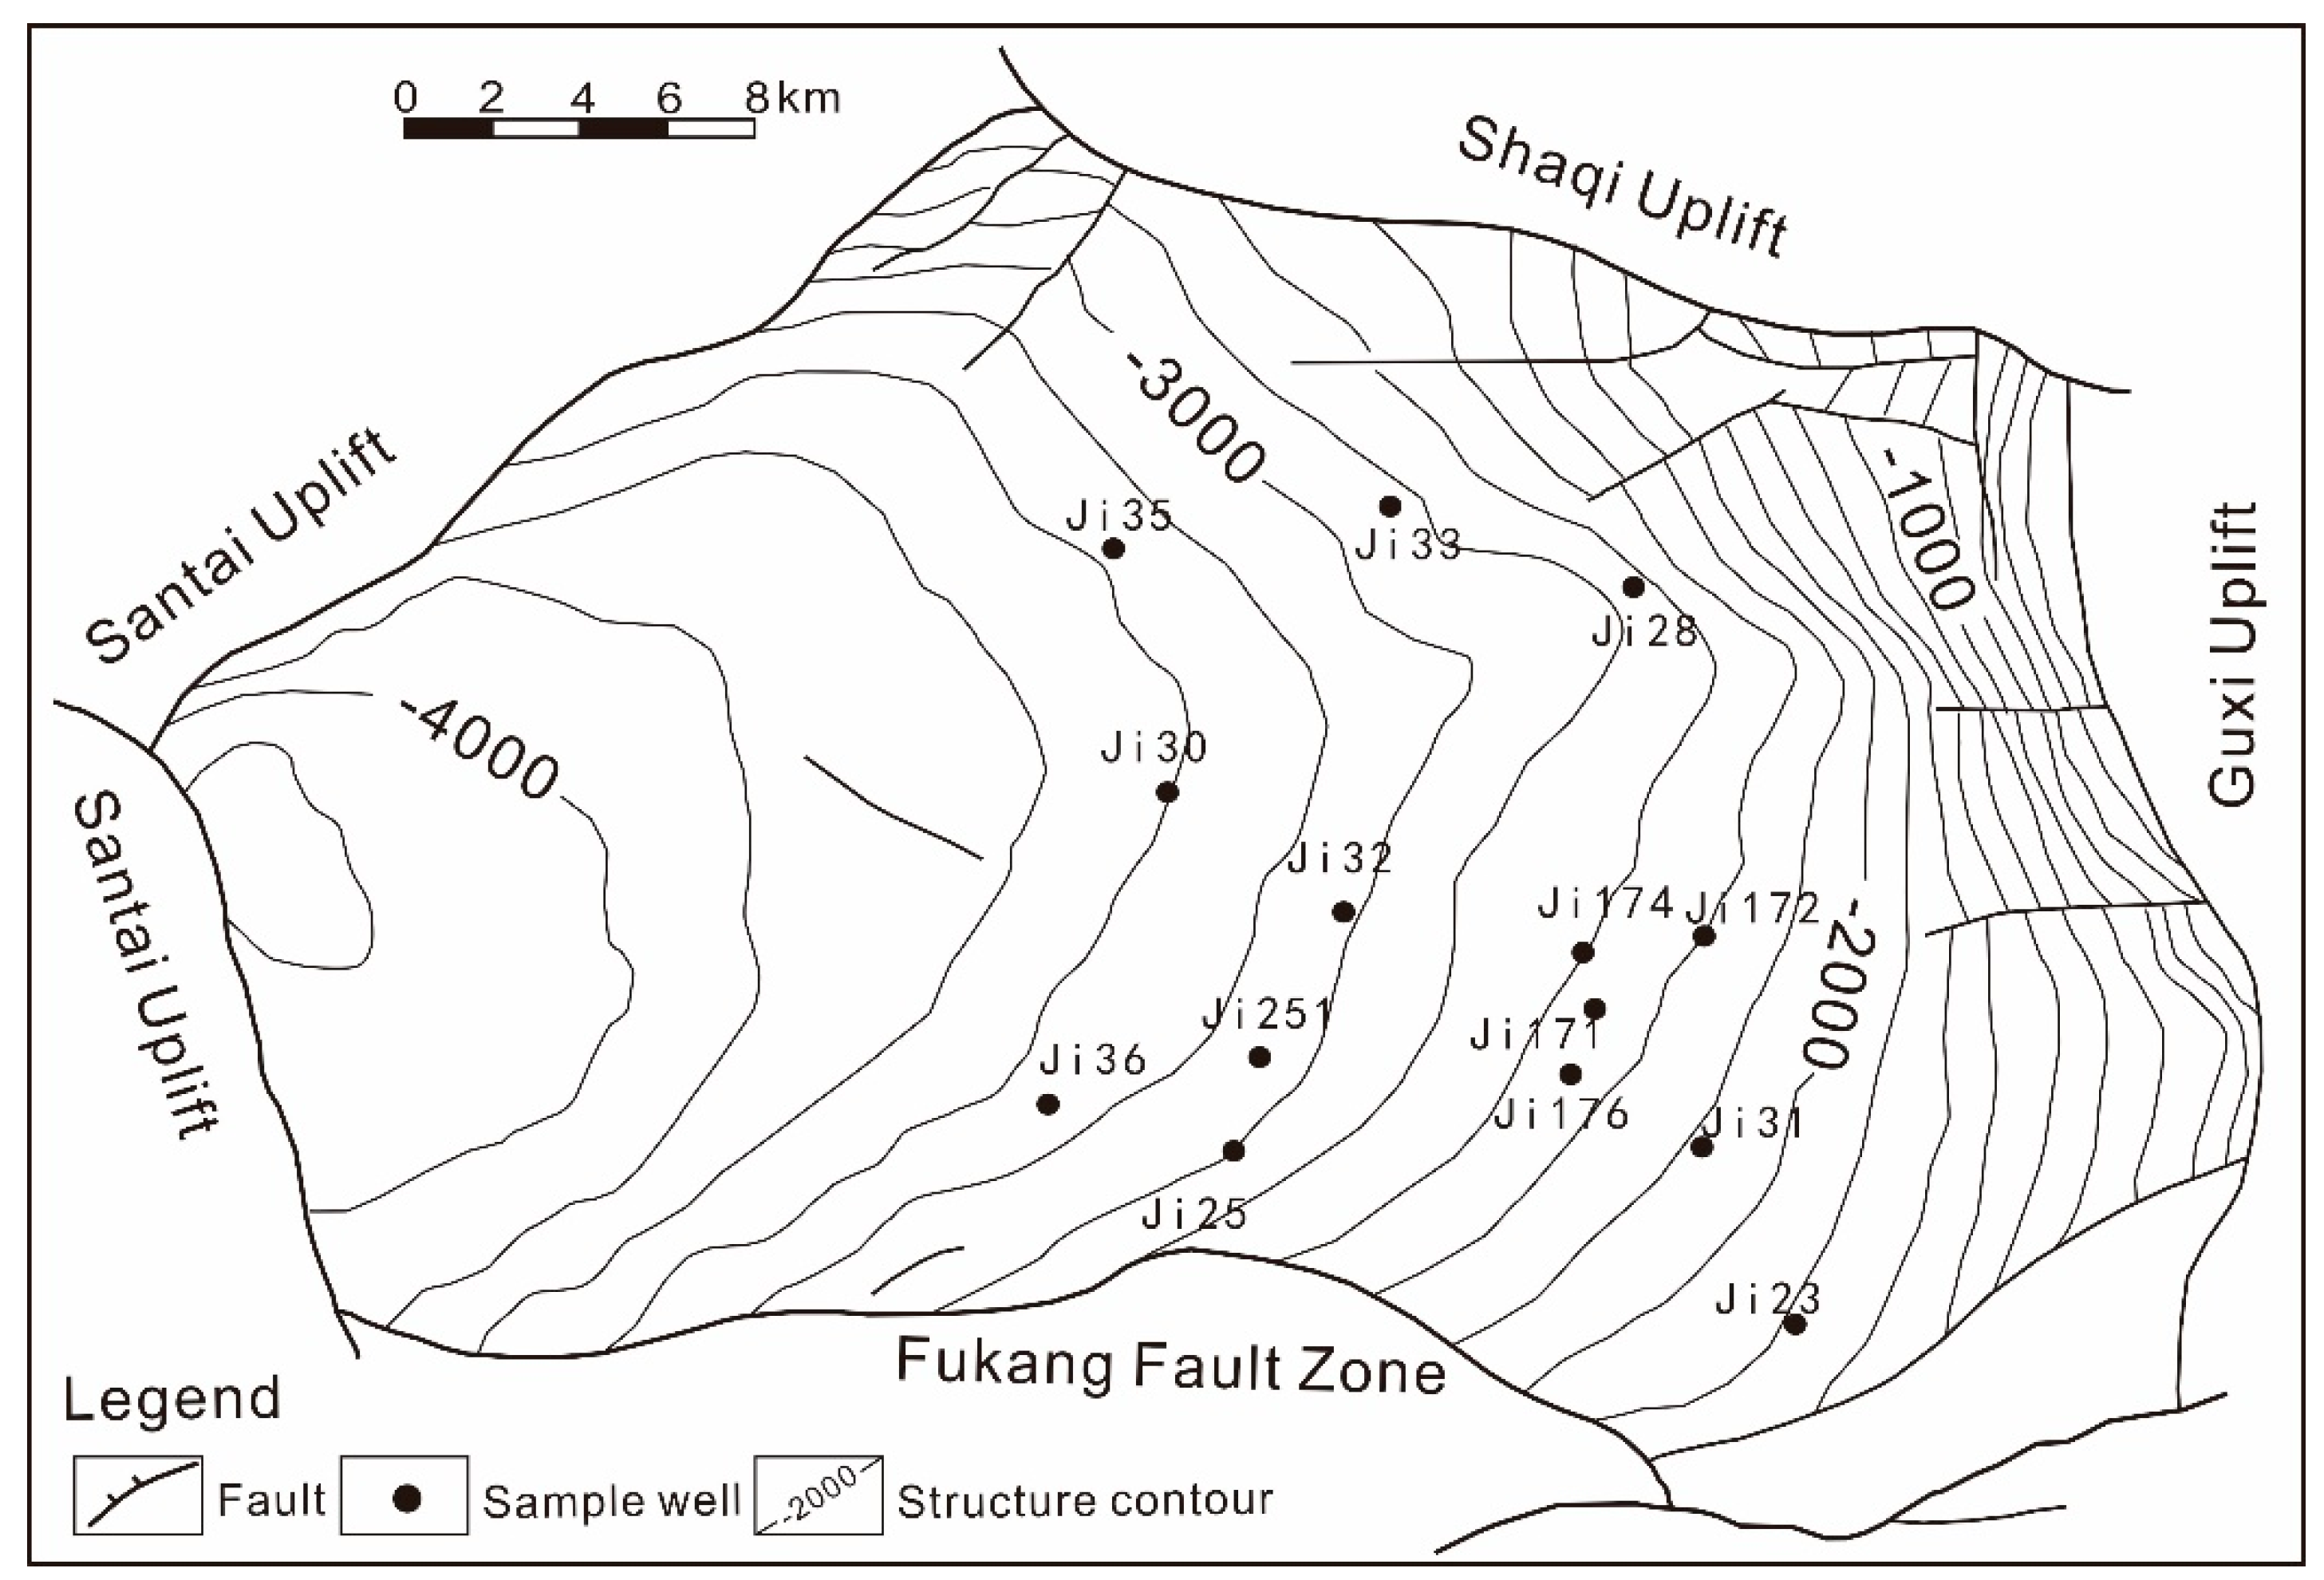
Samples were drilled from the Permian Lucaogou Formation in Jimusar Sag, Junggar Basin. The Junggar Basin is the second largest inland basin in China, which is located in north of the Xinjiang Province, Northwest China. The Jimusaer sag is structurally located in the eastern uplift of the Junggar Basin, adjacent to the Fukang Fault in the south, and the Santai Oilfield and the North Santai Oilfield in the west [36]. The Permian system is the main source rock strata in the Junggar Basin. The target Lucaogou Formation was developed in Permain System, which from bottom to top includes Jiangjunmiao, Jingjinggouzi, Lucaogou and Wutonggou Formations. The Lucaogou Formation in the Jimsar Sag is a set of stratigraphic layers deposited in an evaporitic (salt lake) environment. The formation is generally composed of dolomite dark argillaceous rocks and fine sandstones. The dolomite is mostly interbedded lacustrine deposits. The reservoir is tight, the physical properties are poor, and the dark mudstone has a high abundance of organic matter [13,37]. The Lucaogou formation consists of two “sweet spot” reservoirs and the shale source rocks is deposited between these two sweet spots [13,37]. The average porosity and permeability for “sweet spot” reservoirs are 9.93% and 0.0233 mD. The average porosity and permeability for non-sweet spot reservoirs are 7.03% and 0.0013 mD. Figure 1 depicts the depth contour of the top of Lucaogou Formation and location of the studied wells.
Mineralogical compositions of samples are determined using X-ray diffraction (XRD) analysis on non-oriented powdered samples (100 mesh) using an X-ray diffractometer equipped with a copper X-ray tube that operated at 30 kV and 40 mA [18]. The scan angle range was 5–90° at a speed of 2°/min. SEM was performed on a S4800 scanning electron microscope (Hitachi, Tokyo, Japan) with a lowest pixel resolution of 1.2 nm and accelerating voltage of 30 kV, following the standards of SY/T 5162-2014 China.
Core plugs were subjected to drying prior to porosity and permeability measurements with a helium porosimeter. A net confining pressure of 5000 psi (34.47 MPa) was carried on to simulate the formation pressure during the measurements. Mercury injection capillary pressure curves were acquired on a mercury porosimeter by following the China Standard of SY/T 5346-2005. Before the measurements, the samples were subjected to oil washing and drying at 105 °C to a constant weight. The minimum intrusion pressure was set as 0.005 MPa and the maximum intrusion pressure was as high as 163.84 MPa, corresponding to a pore-throat radius of roughly 4.5 nm.
To verify the method for predicting the pore structures, two rock samples were subjected to NMR T2 distributions measurements at the “as received” and water saturated conditions in the lab using a Geospace2 instrument (Oxford, UK). After the measurements on “as received” state sample, core plugs were cleaned, dried, vacuumed and fully water saturated for water saturated conditions NMR measurements. The resonant frequency of a Geospace2 instrument is 2 MHZ with the polarization time or waiting time (Tw), the echo spacing, the number of echoes and the number of scans as 10,000 ms, 0.3 ms, 4096 and 128, respectively. When the echoes are recorded, the T2 spectra are able to calculate using the Bulter-Reeds-Dawson (BRD) inversion method [38].
2.2. Prediction Method of Pore Structure by NMR Logs
According to NMR theory, for the T2 distribution of water saturated and hydrophilic rock samples, the following equation [32,33] was deduced:
where r is the pore radius (μm); ρ is surface relaxivitity (μm/s); Fs is the pore shape factor, equals to 2 and 3 for cylindrical and spherical pores, respectively. In this study, the pores are considered as cylindrical.
Known by reservoir physics, the relationship between injection pressure and pore throat radius is given by [39]:
where Pc is the capillary pressure (MPa); σ is the surface tension (mN/m); θ is the contact angle of mercury in air (°); and Rc is the pore throat radius (μm).
Assuming Rc to be proportional to r, both NMR and MICP would quantify similar pore size distributions. Generally, the following equation [22] is used:
where C is the coefficient which can be obtained by capillary pressure curves and nuclear magnetic resonance experiments of rock samples.
The above equations can also be applied to conventional water-wet reservoirs. As mentioned earlier, the reservoirs of Lucaogou Formation in Jimusaer Basin, are either neutral or oil-wet. Zhao [35] proposed a method for evaluating pore structures of oil-wet reservoirs that has been applied to tight oil reservoirs. He realized that the bigger pores in tight oil reservoirs are highly oil saturated, while the formation water is mainly occupies smaller pores. The bigger pores are oleophilic and the smaller pores are hydrophilic. The surface relaxivity of oleophilic pores to oil is lower than hydrophilic pores to water [40,41], and the lower surface relaxivity would lead to an increase in relaxation time. Hence, the long-relaxation signal of the NMR T2 spectra of tight oil reservoir rocks is mainly the relaxation signal of oil (referred to as oil spectrum), while the short relaxation signal of T2 spectrum is mainly the relaxation of water signal (referred to as water spectrum).
If the water saturation at a certain depth of the reservoir is known, the T2cutoff value for water can be determined by the following equation [35]:
where Sw is water saturation (%); T2cutoff is for determining the water and oil (ms); ϕi and T2i are porosity component (%) and T2 corresponding to the ith component; n is the total number of T2 distribution.
After determining the T2cutoff value, the water signal and the oil signal of the T2 spectra can be respectively converted into the size distributions for pores containing water and oil by utilizing the hydrophilic pore surface relaxivity and the oleophilic pore surface relaxivity:
where ro and rw respectively represent the radius of pores containing oil and water (μm); ρo and ρw respectively represent surface relaxivitity of oleophilic pore and hydrophilic pore (μm/s).
By superposing the size distribution of the water-containing pores with the size distribution of the oil-bearing pores, the pore size distribution of the whole rock can be obtained. Then, the Equations (2) and (3) can be employed to construct the capillary pressure curves.
The oil and water two-phase signals are cut directly by the T2cutoff values, and the resulting pore size distribution would not be smooth. The weight function of the pore fluid was introduced as [35]:
where m is the coefficient that controls the width of the transition zone for the water-containing and oil-bearing pores.
3. Results and Discussion
3.1. Mineralogical Compositions
The mineral compositions of sixteen samples obtained from the XRD analysis are listed in Table 1. As can be observed from this table, plagioclase and dolomite are the two most abundant minerals. The plagioclase contents vary from 13.7% to 44.4% with an average value of 30.9%. The dolomite content in the samples varies between 0–49.4% with an average value of 28.2%. The next most abundant mineral is quartz, ranging from 13% to 30% with an average value of 19.4%. Each sample has clay and K-feldspar minerals, with the average values of 8.9% and 4.4%, respectively. The calcite content of these samples found to vary significantly. Seven samples out of sixteen did not contain calcite, while the maximum content of calcite reaches 22.9% in the rest of the samples. In addition, a small fraction of pyrite and siderite was also detected in some samples.
3.2. Pore Types
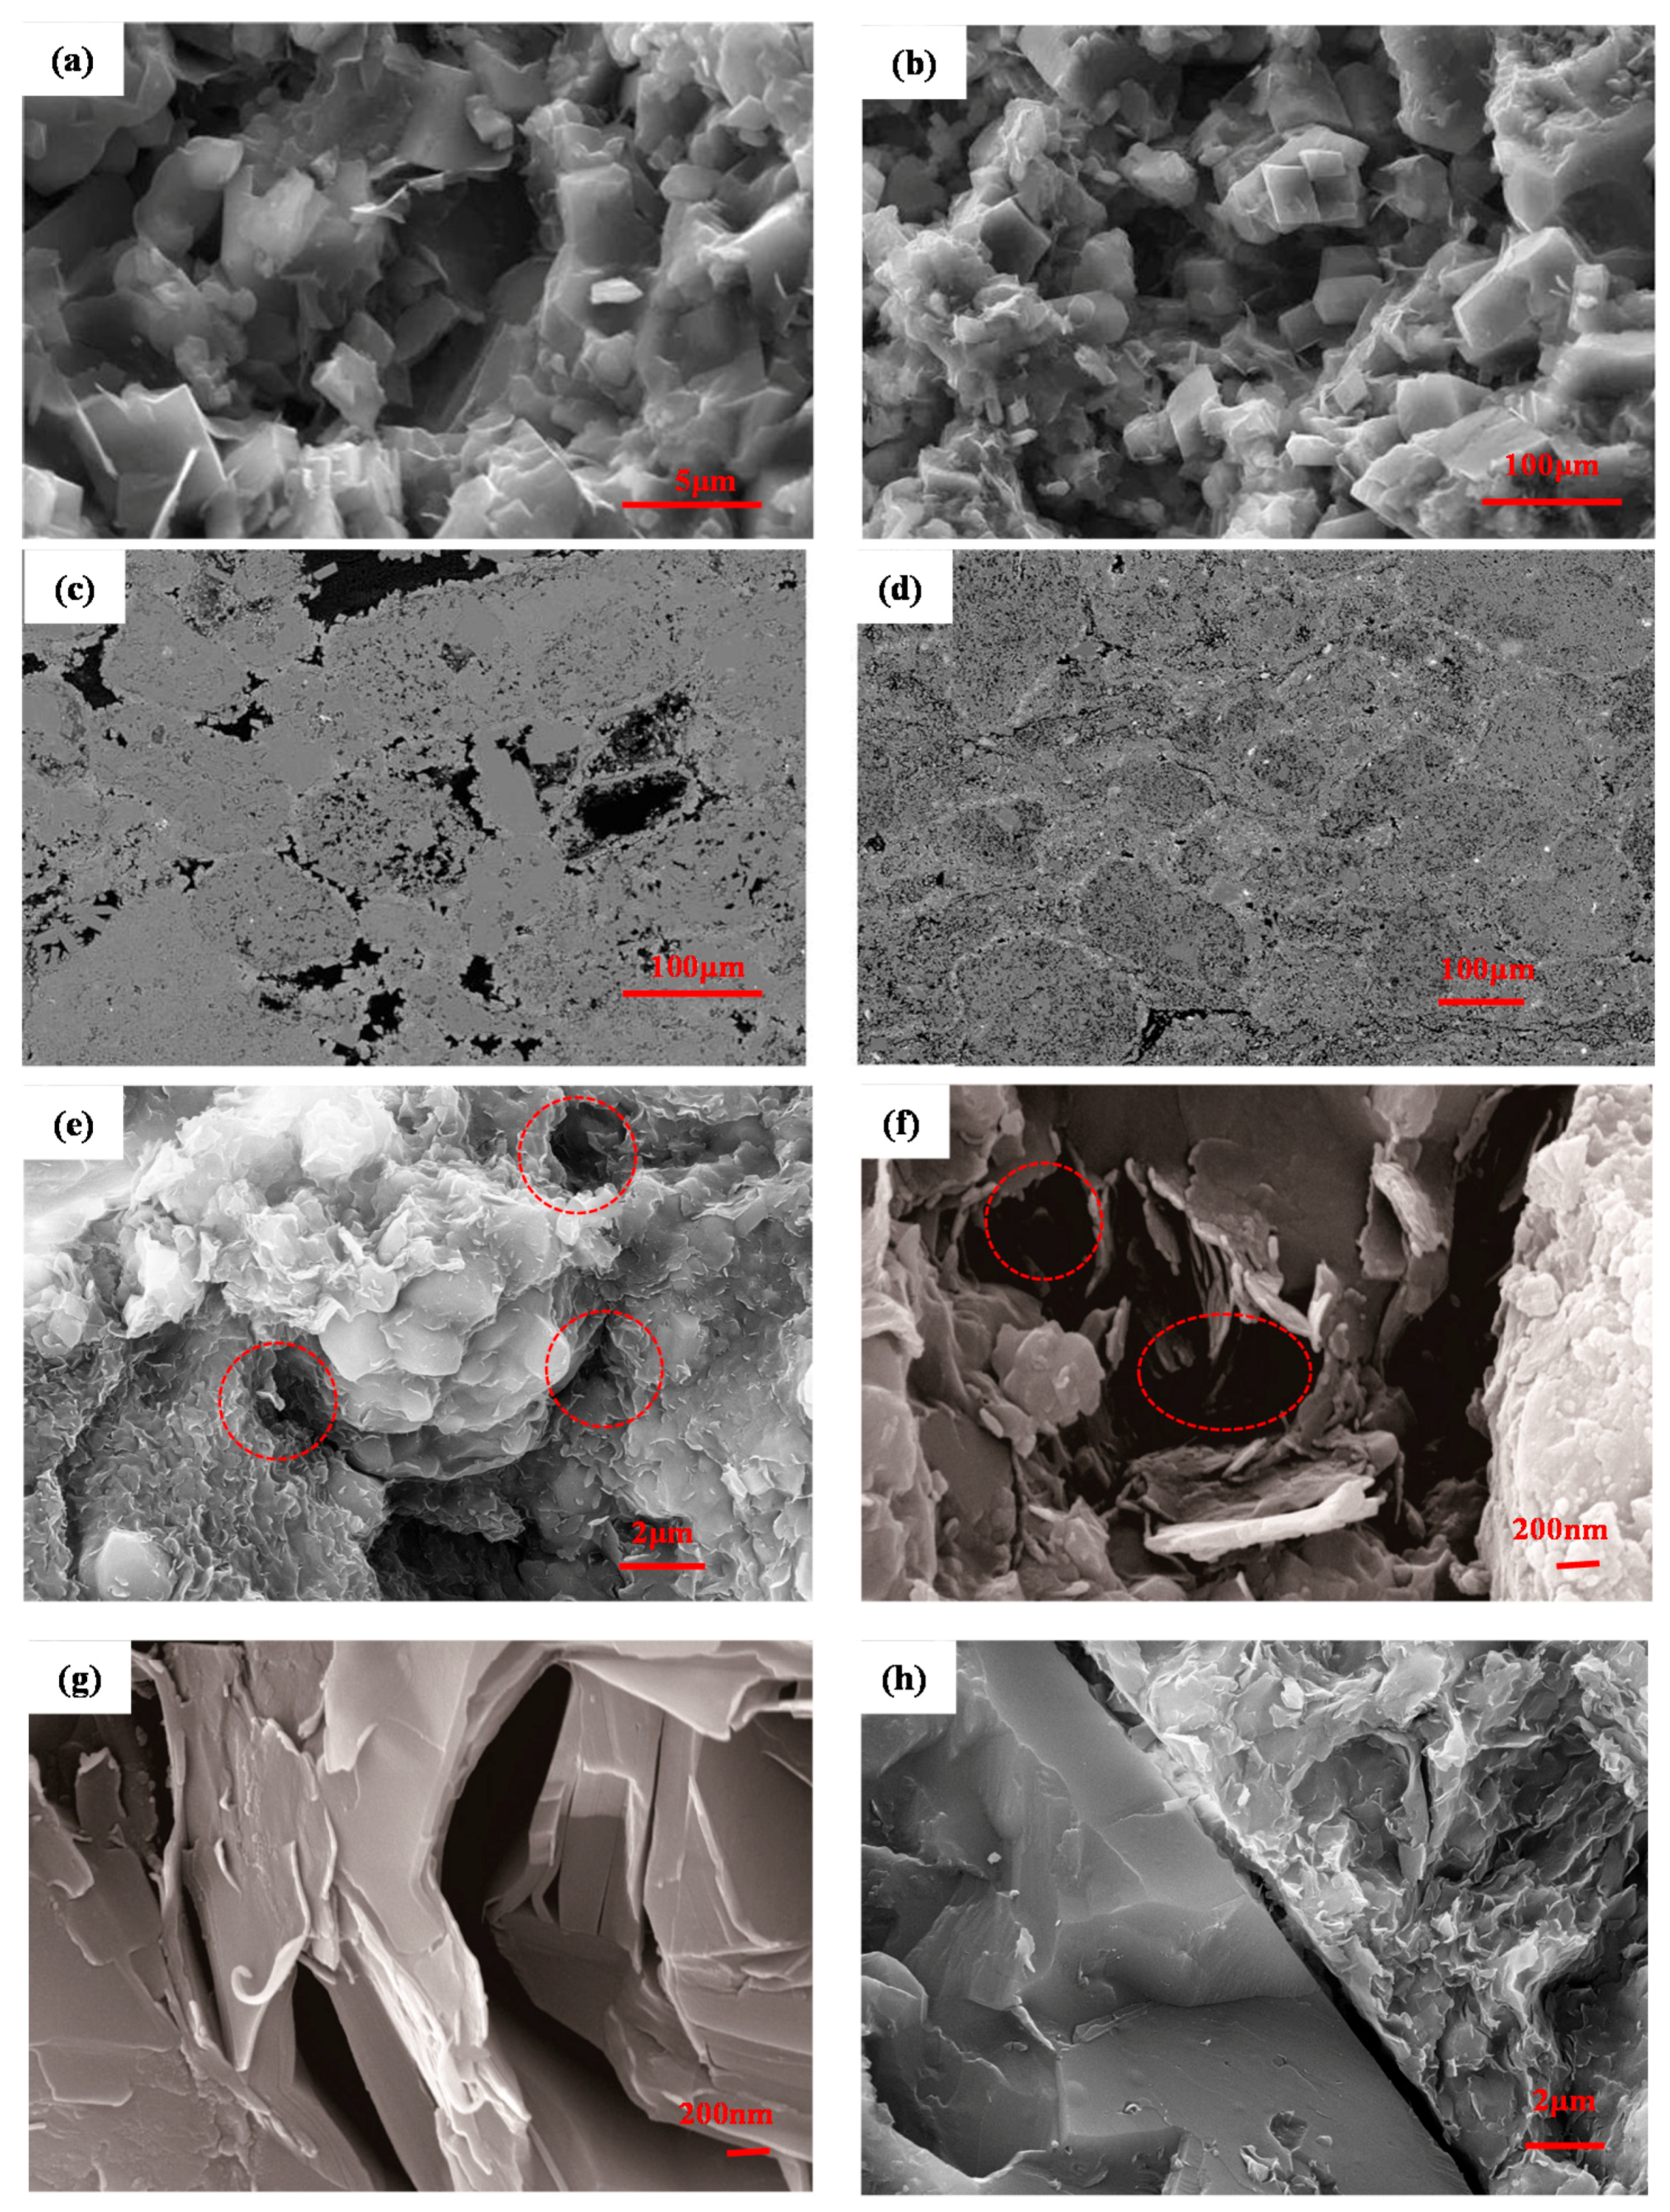
According to the SEM image analysis, the primary pores in the tight oil reservoirs of the Lucaogou Formation are very rare, and the main pore types are secondary pores developed during the diagenesis stage. The pores of the studied areas can be divided into the four types: intragranular dissolution pores, intergranular dissolution pores, micro fractures and clay pores.
Intergranular dissolved pores were formed by the selective corrosion of the edge of clastic grains, early intergranular cement and matrix. This type of pore is the main reservoir porosity in the Lucaogou Formation in the studied area. These pores are mainly distributed between the dolomitic sand crumbs and belong to cement dissolved pores. Intergranular dissolved pores usually develop between albite (a type of sodium feldspar) in dolomitic siltstone. The pore sizes are commonly less than 10μm, as shown in Figure 2a–c.
Intragranular dissolved pores refer to pores formed inside the grains or grains due to selective dissolution. They are also common pore types in the reservoir understudy of the Lucaogou Formation (Figure 2c,d). The dissolved pores in the sand are mainly formed by the dissolution of albite; the dissolved pores in the debris often show the dissolution of sodium feldspar, while the dissolved pores in the dolomite are usually the result of residual dissolution of internal calcite.
Clay pores refer to pores within clay aggregates of the studied samples. The clay pores were found in the illite/smectite mixed layers (Figure 2e) and chlorite minerals (Figure 2f). The sizes of the clay pores are smaller than the dissolution pores and mainly distributed between 300 nm and 800 nm in size. Fracture pores refer to the pores that penetrate into the particles and resemble cracks. They are not structural cracks in the traditional sense, but the fluid channel formed by organic acid dissolution (Figure 2g,h).
3.3. Petrophysiccal Properties and Mercury Injection Capillary Curves
The porosity, permeability and pore structure parameters obtained from MICP experiments are listed in Table 2. The porosity ranges from 7.38% to 20.1% with an average value of 12.83%. The permeability fluctuates from 0.0023 mD to 0.1487 mD. The logarithmic average value of the permeability is 0.01 mD. Only two samples (No. 1 and 2) were measured with the permeability greater than 0.1 mD, representing the tight nature of the studied samples.
Displacement pressure (Pd) represents the starting pressure of mercury entering the rock sample [42]. It is an important parameter to characterize the permeability of the rock sample. Small displacement pressure shows that the mercury is easy to be squeezed into the rock sample, attributing to a large throat radius, and higher permeability. The Pd values of the studied samples are relatively high, varying from 0.83 MPa to 13.01 MPa with an average value of 5.06 MPa. Saturation median pressure refers to the corresponding capillary pressure when the non-wetting phase saturation is 50% on the capillary pressure curve [42]. It ranges from 4.96 MPa to 83.02 MPa with an average of 31.47 MPa. The maximum mercury intrusion saturation (Smax) of the samples found to vary from 69.55% to 99.25% with an average of 89.96%, demonstrating that 89.96% of pores are greater than 4.5 nm (163 MPa of maximum mercury intrusion pressure). The mean capillary radius (Rm) varies from 0.02 μm to 0.26 μm with an average value measured to be 0.08 μm. In summary, the displacement pressure and median pressure are higher, and the capillary radius is smaller, revealing a poor pore structure characteristic of the samples.
MICP parameters Pd, Pc50, Smax, Rm are displacement pressure (MPa), median pressure for 50% mercury intrusion saturation (MPa), maximum mercury intrusion saturation (%), and mean pore throat radius (μm), respectively.
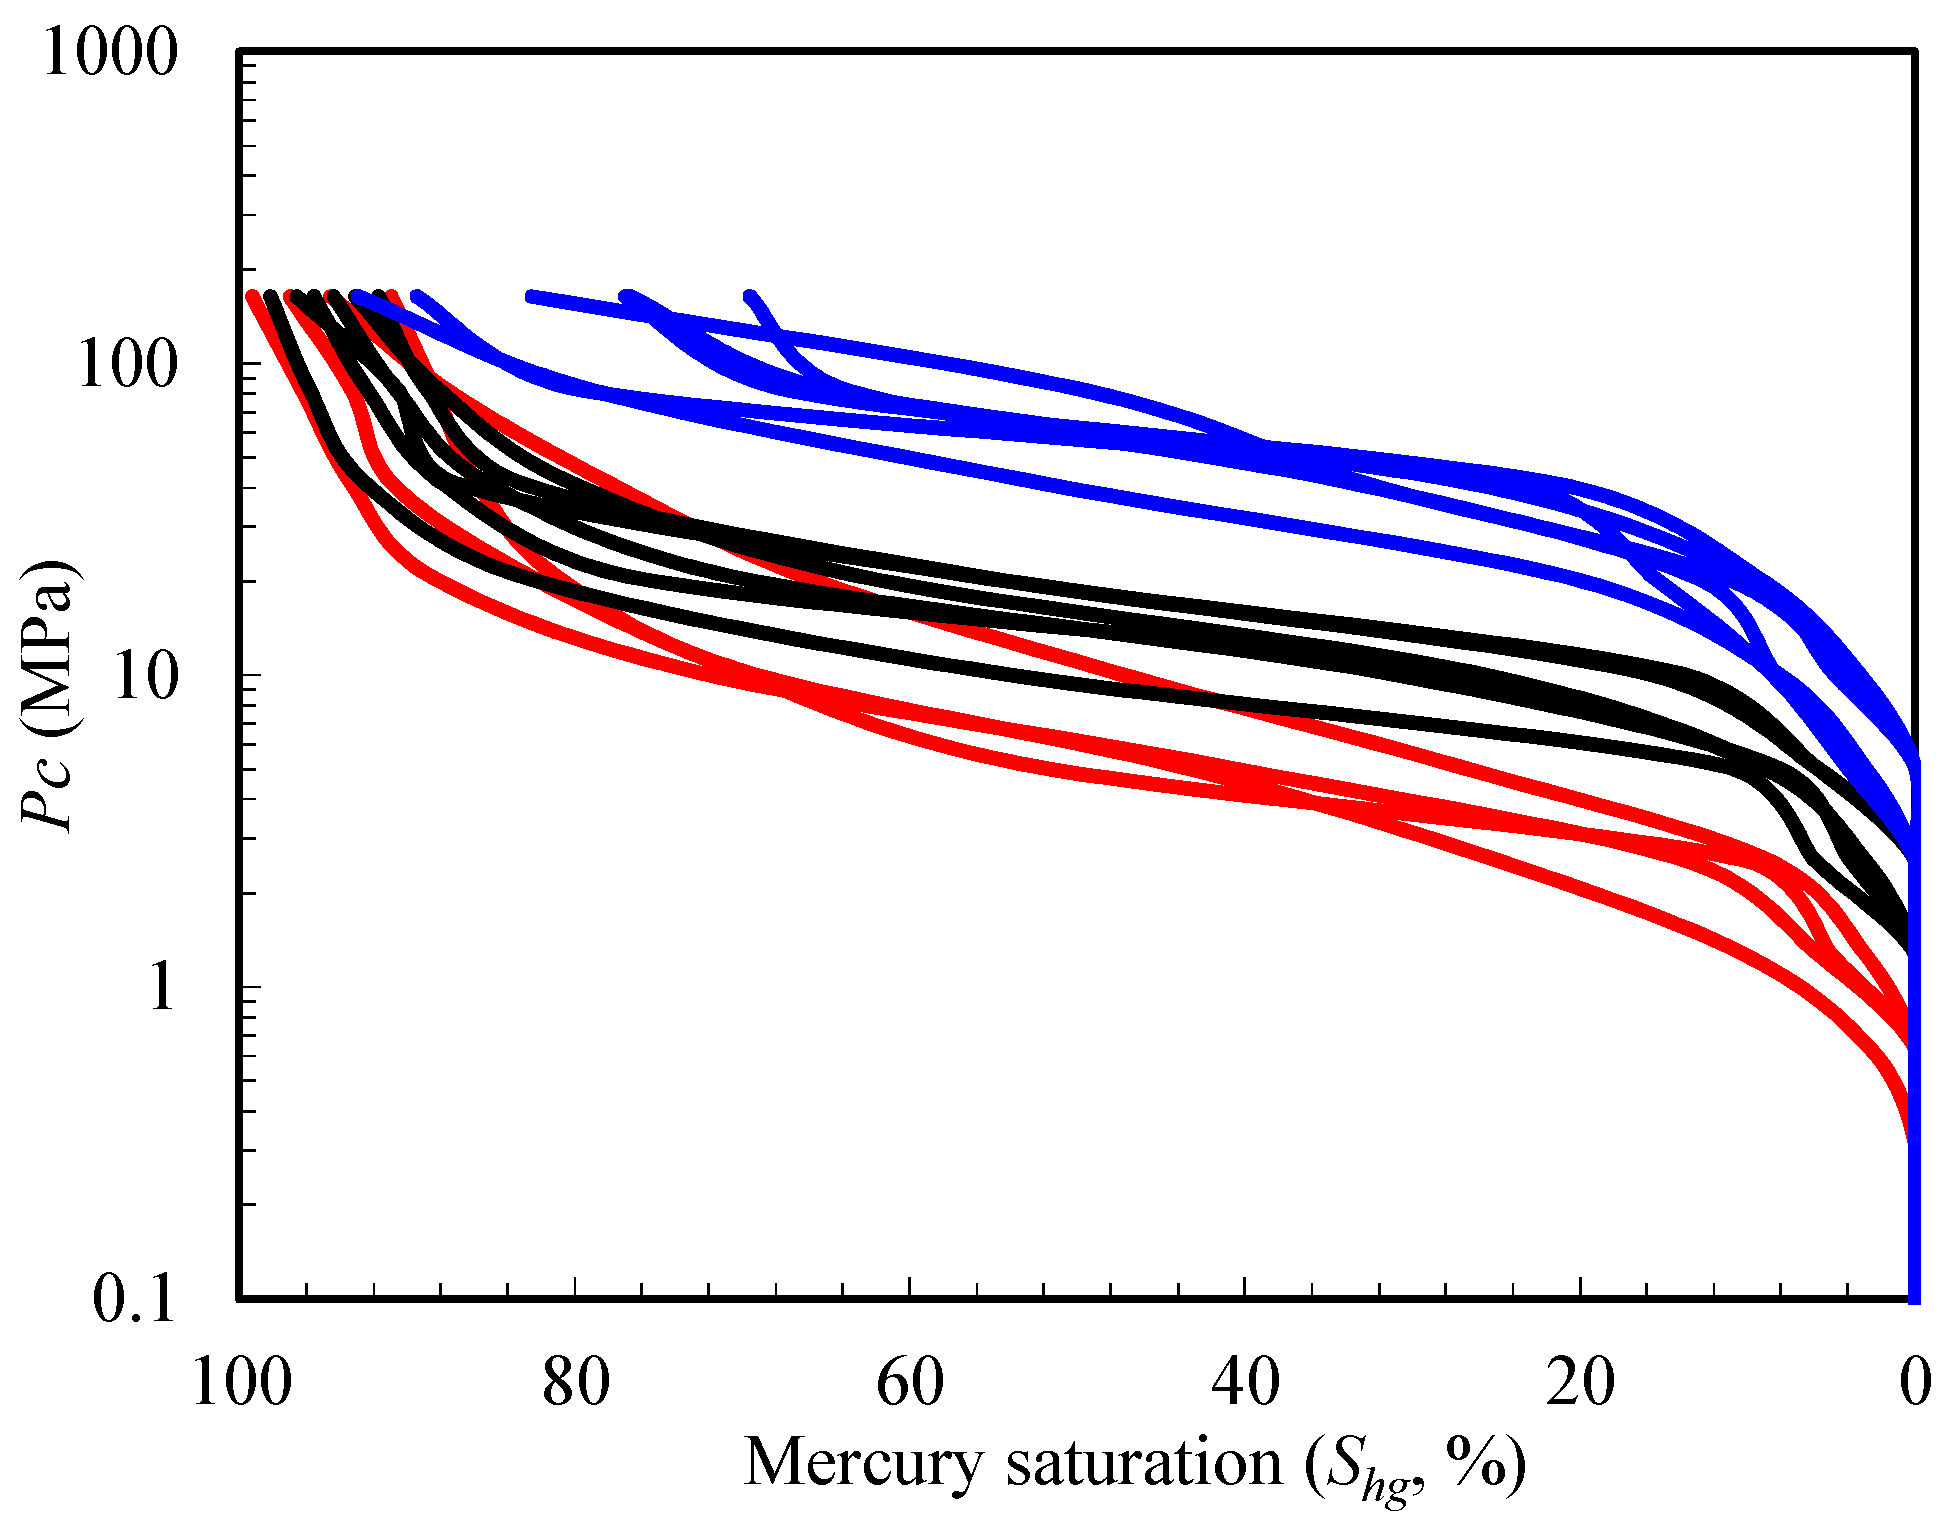
The MICP curves are shown in Figure 3. Based on the shape of these curves and their displacement pressure values, the rock samples were divided into three types: displacement pressure <2 MPa, 2–5 MPa and >5 MPa. Red, black and blue lines represent the types I, II and III, respectively. Type III rocks have the highest displacement pressures and the lowest maximum mercury intrusion saturation. Type I rocks have the smallest displacement pressures. Type I rocks have relatively good pore structure, whereas Type III has the worst pore structure. Unlike conventional reservoirs, the curves do not have the inflection point separating larger and smaller pores, indicating that larger pores do not exist in the tight oil reservoir samples.
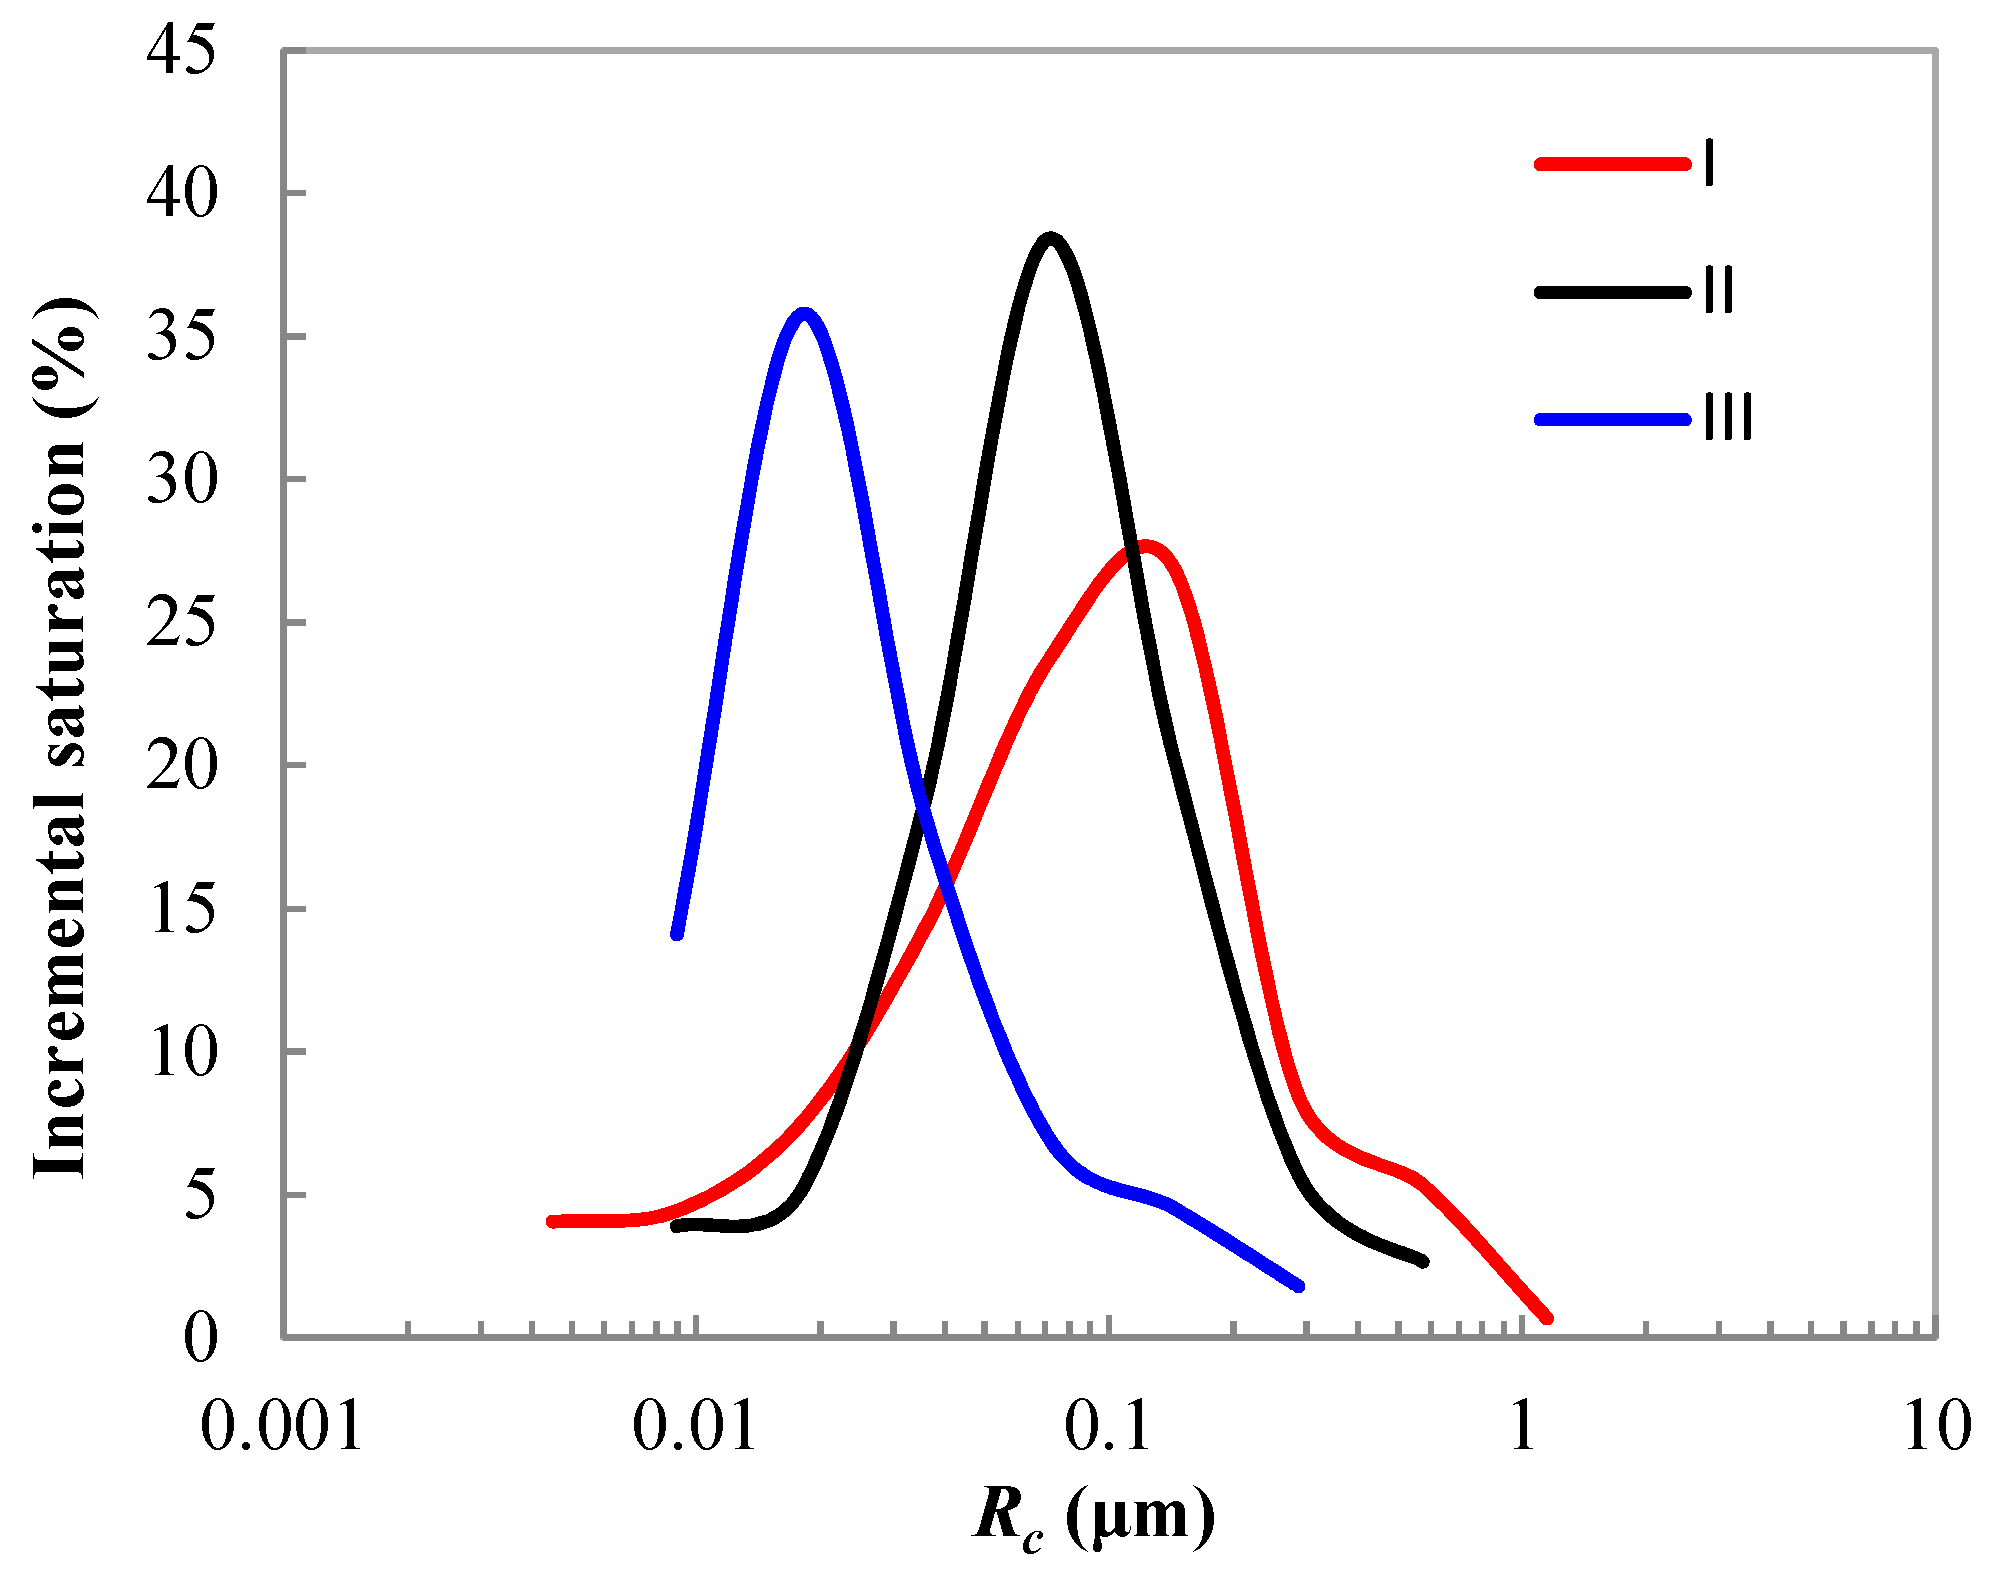
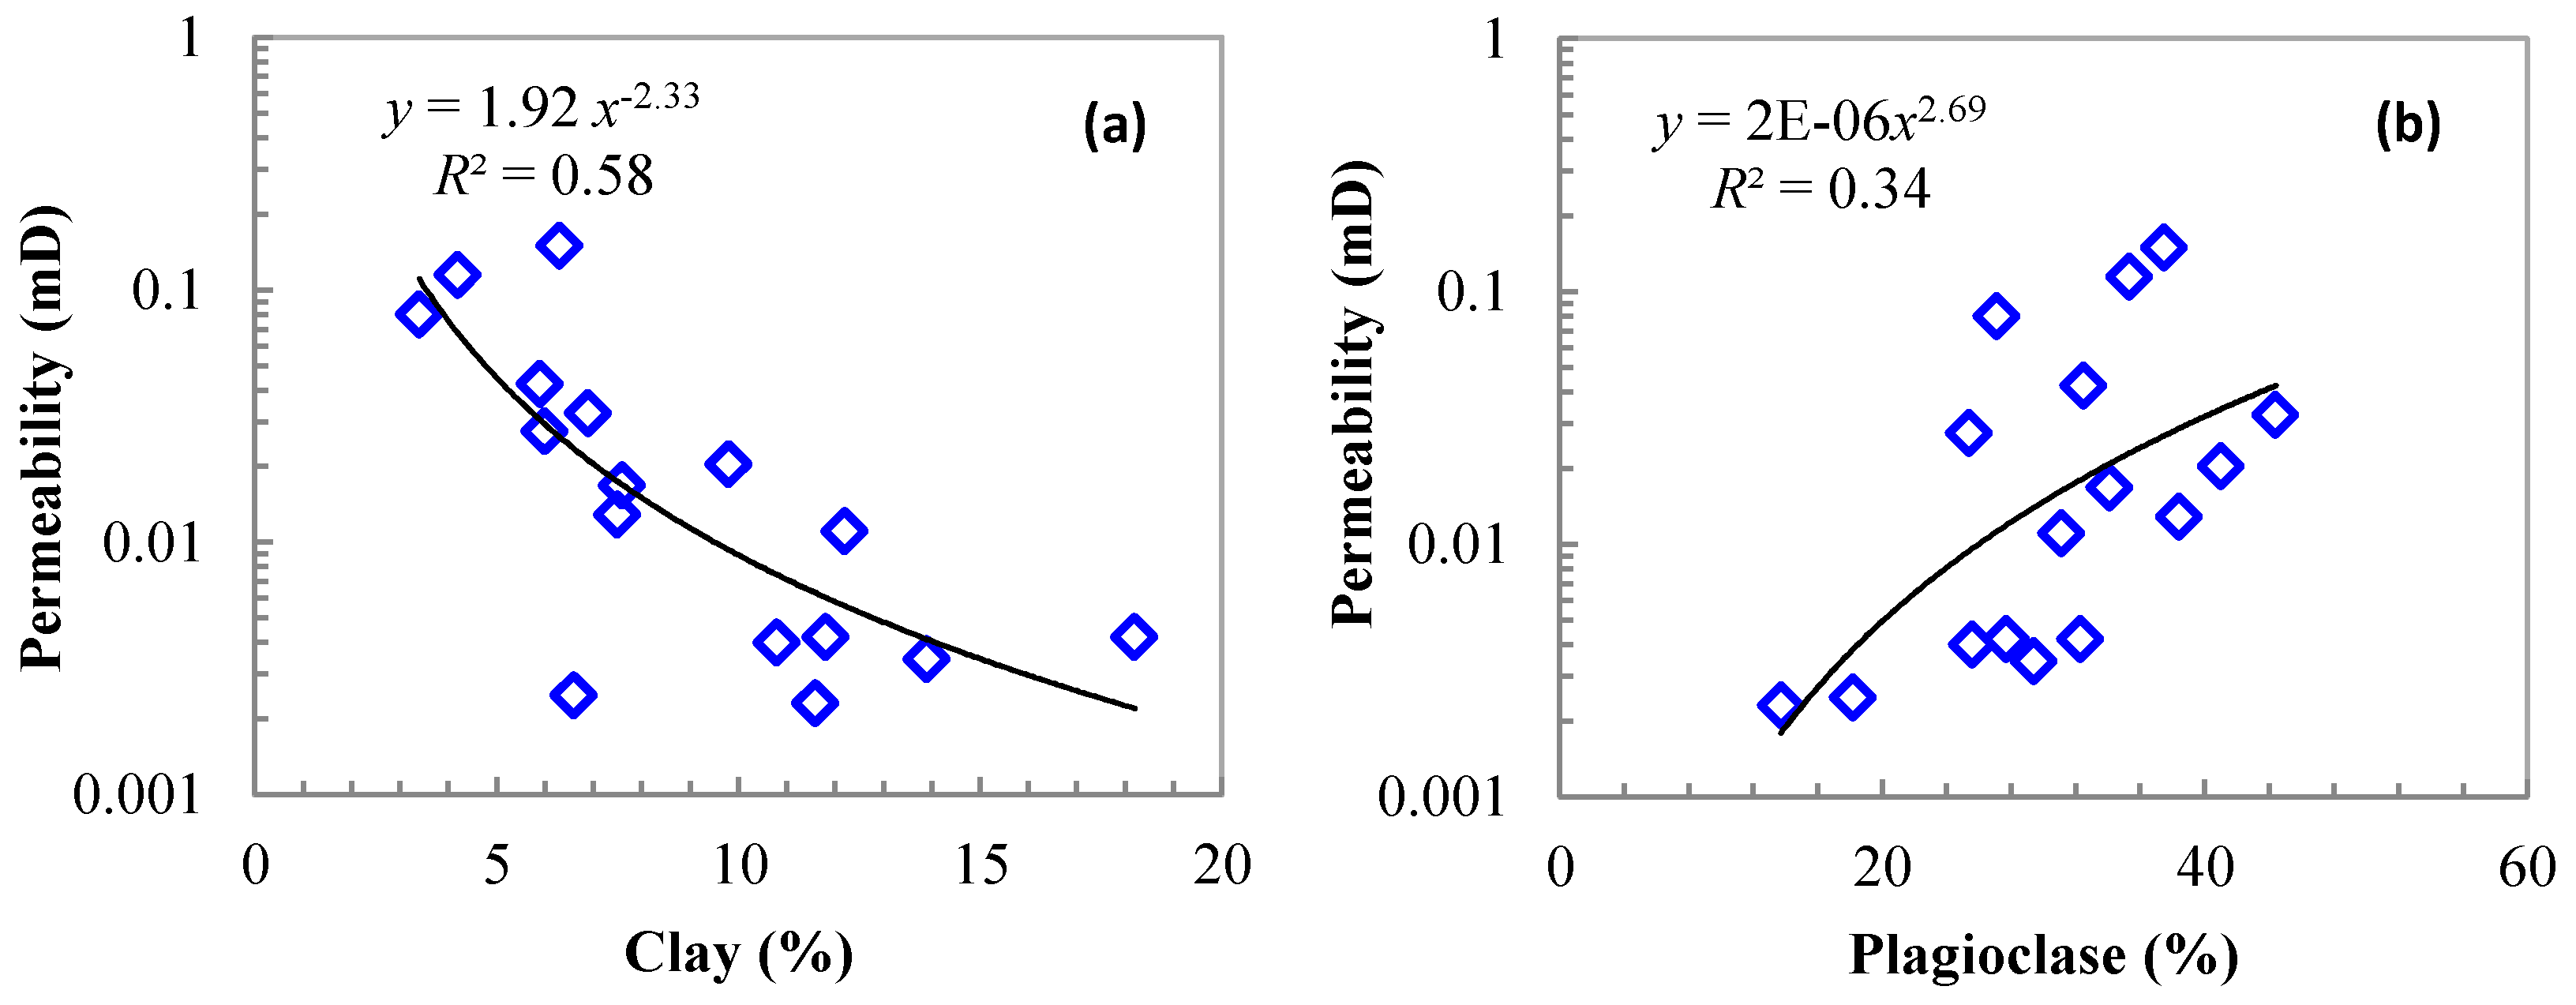
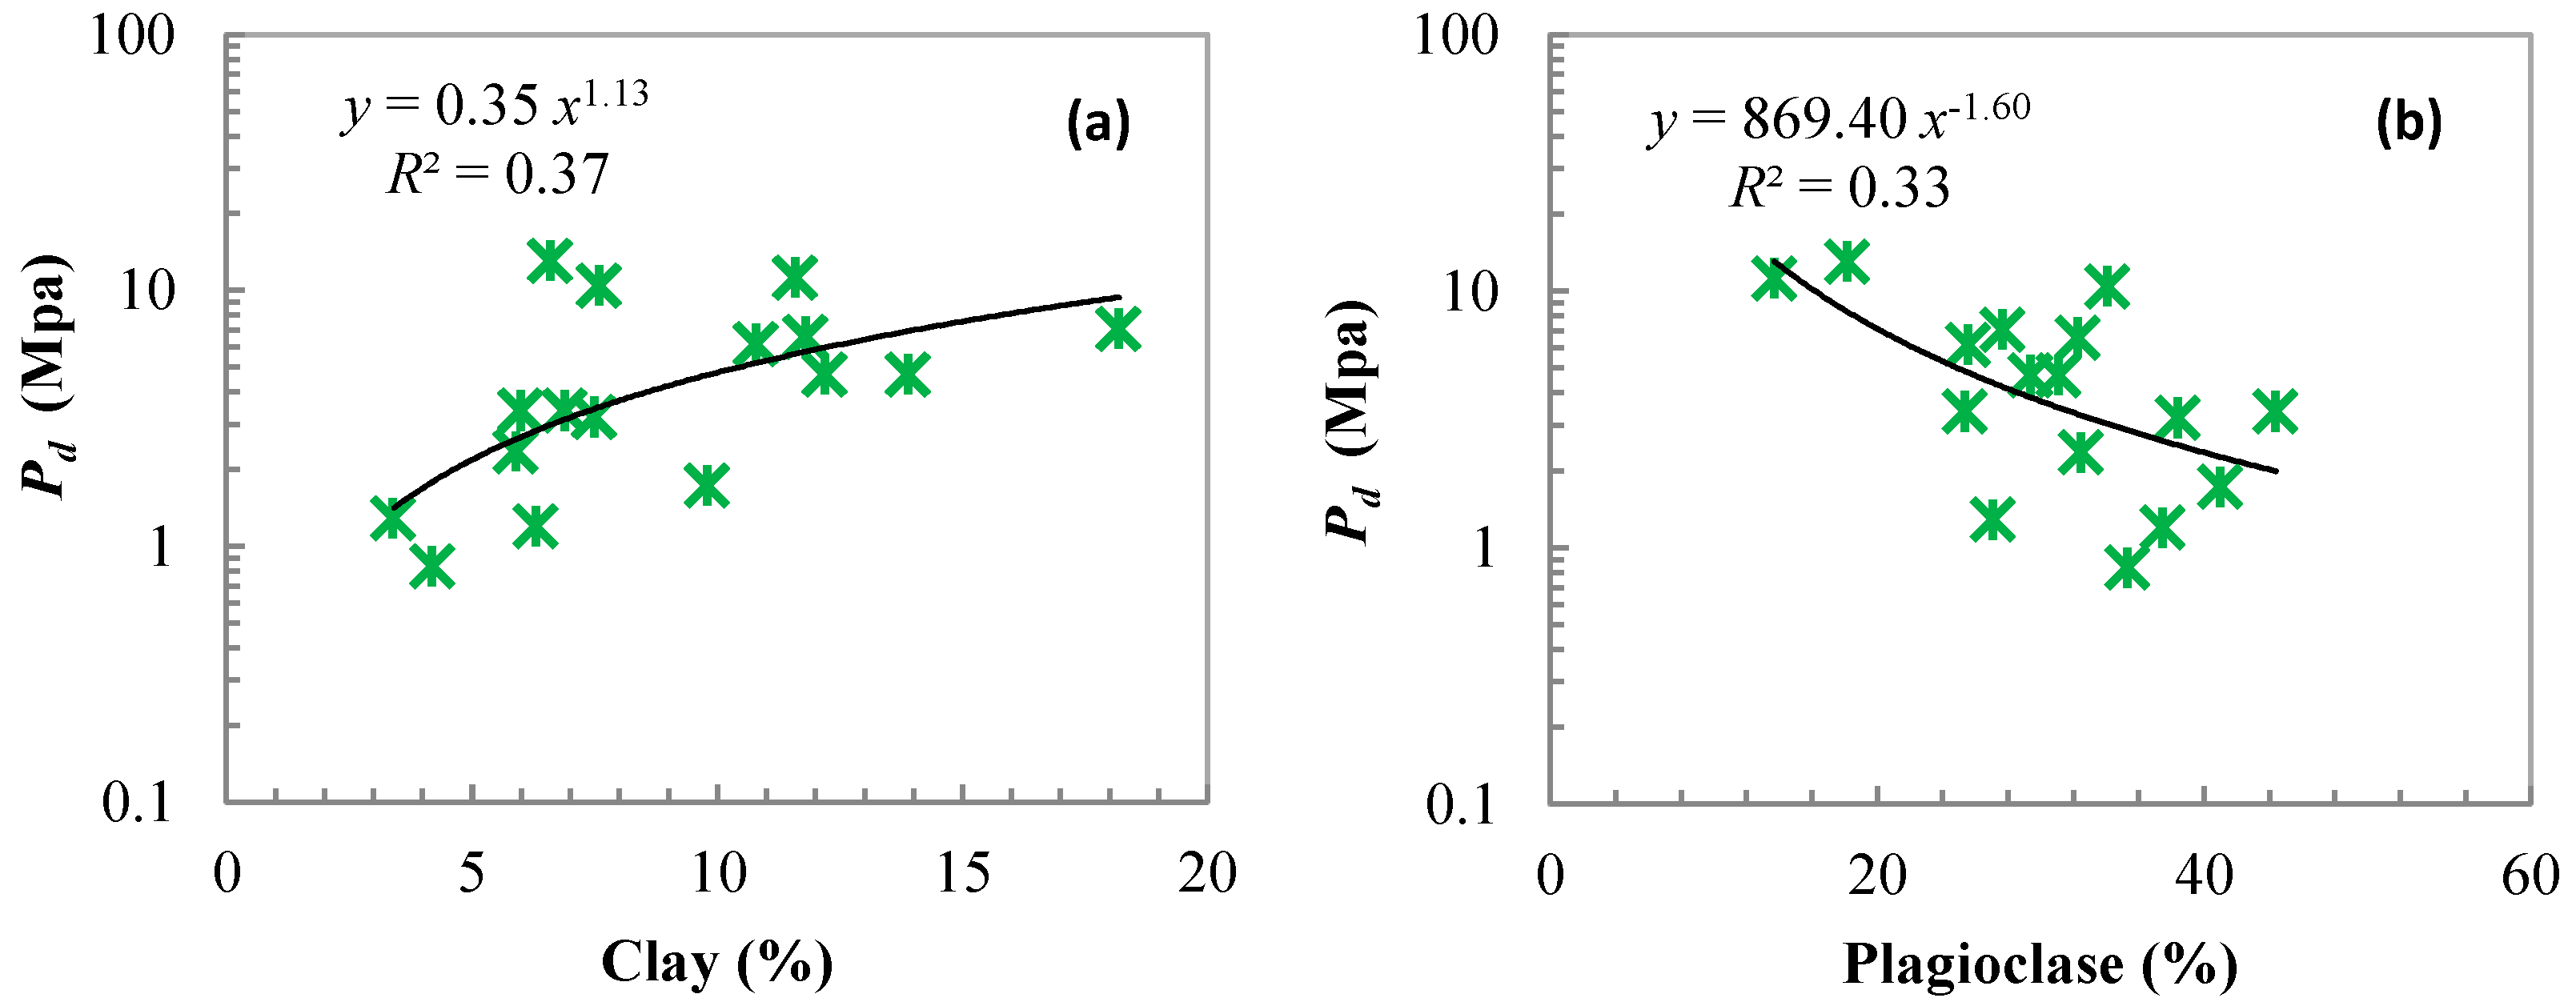
The pore size distributions were calculated using Equation (2). The average pore size distributions for these three types are presented in Figure 4. These pore size distributions are found to be unimodal. The pore size distribution of Type I rocks is the widest, while Type II is the narrowest. The peaks of pore size distributions for these three types are 0.144, 0.036 and 0.009 μm, respectively. The type I rock pores are mainly dissolution pores, type III rock pores are clay pores. This can be confirmed by the cross plot of permeability and displacement pressure with clay and plagioclase contents. As it can be observed from Figure 5, the permeability is negatively correlated with clay contents and positively correlated with plagioclase contents. In Figure 6, the displacement pressure is positively correlated with clay contents and negatively correlated with plagioclase contents. The clay pores are attributed to clays, and part of dissolution pores are attributed to feldspar.
3.4. Prediction by NMR Logs
3.4.1. Model Verification
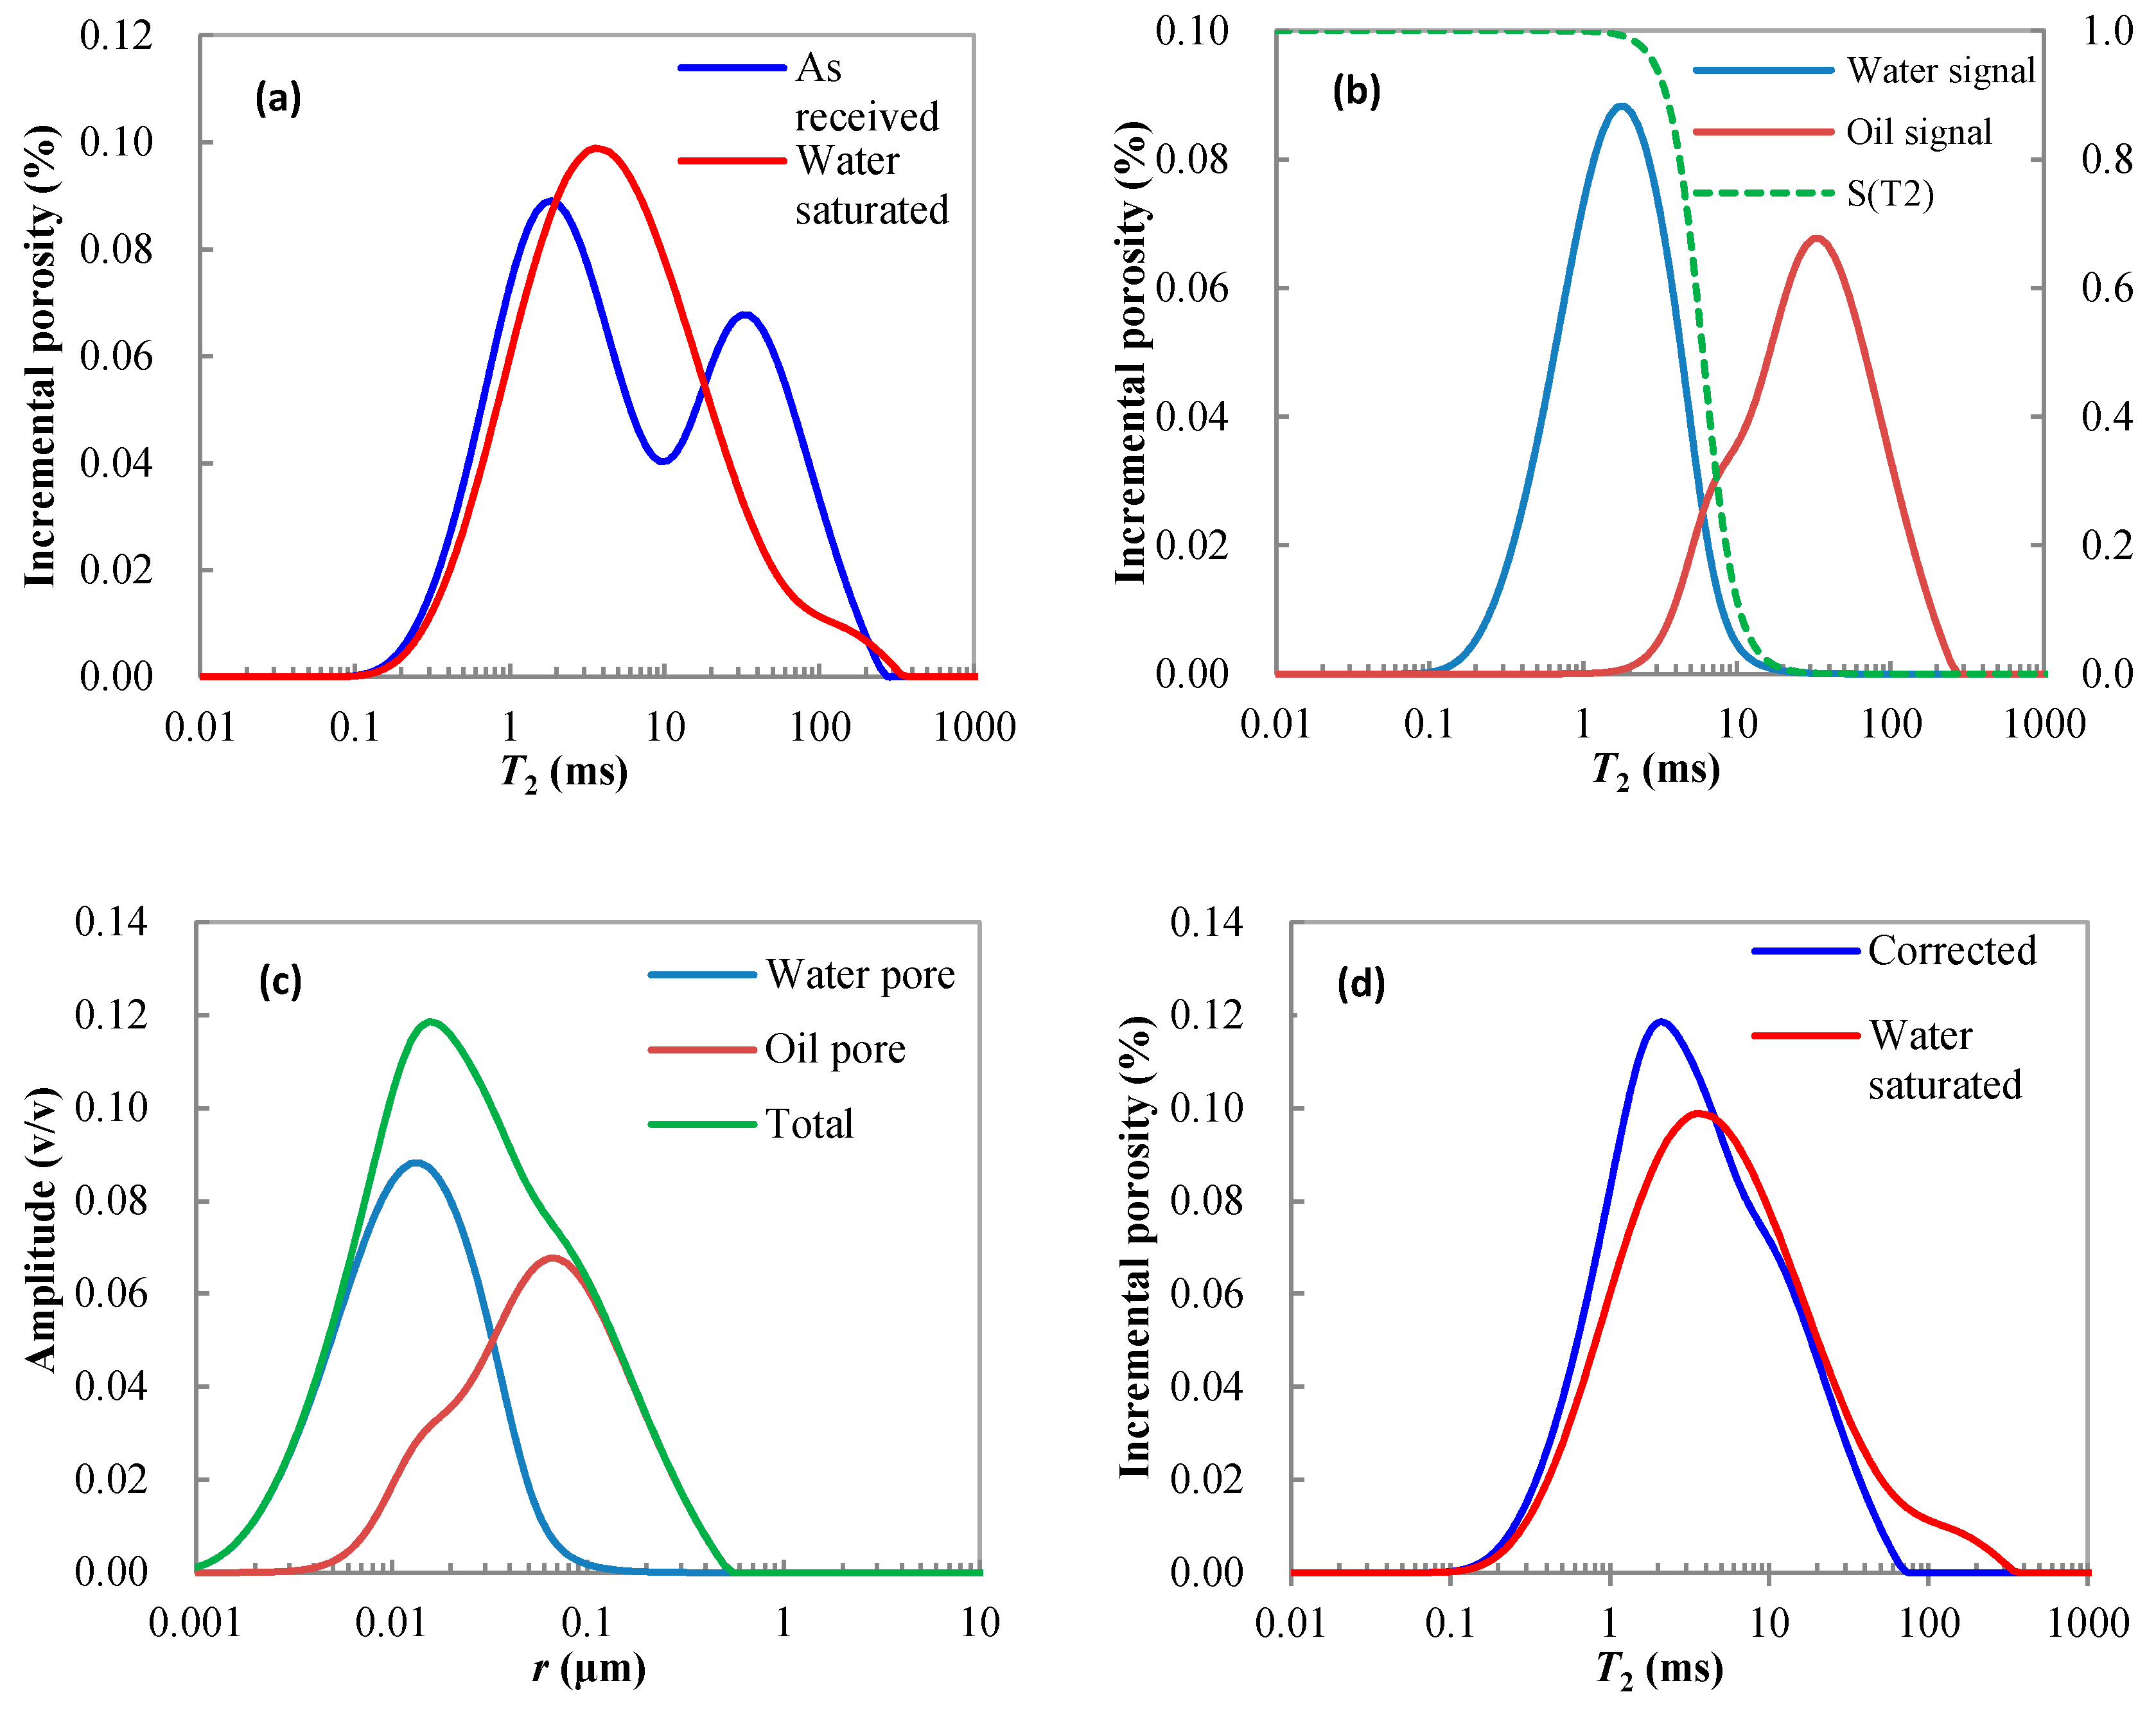
Zhao [35] used several capillary pressure curves and their corresponding T2 distributions from filed NMR logging to verify the model. However, the model was not fully verified by the NMR measurements in the laboratory. Figure 7a displays the T2 distributions for Sample M1 at both “as received” and water-saturated conditions. The “as received” state T2 distribution is bimodal and wider, which is similar to the T2 characteristics of the field NMR logging, while the water saturated state T2 distribution is narrower. The porosity and permeability for this sample is 12.7% and 0.0308 mD.
Using Equation (7), the “as received” state T2 distribution was divided into two segments: water and oil signal distributions, as shown in Figure 7b. In this case, the T2cutoff was determined as 6.2 ms according to the saturation that was obtained from core analysis. The coefficient m was set as 4, equal to Zhao [35] calculations. The green dotted line represents weight function S(T2).
The different values for surface relaxivity of the hydrophilic and oleophilic pores were used to calculate the pore size distributions from water and oil signal distributions (Equations (5) and (6)). The water-containing pore, oil-bearing pore and total pore size distributions are shown in Figure 7c with the peaks for the pore size distributions at 13.8 nm, 66.6 nm and 15.9 nm, respectively.
The corrected T2 distribution for water saturated state can be obtained using the total pore size distribution and surface relaxivity of the hydrophilic pores from Equation (5). The corrected and measured T2 distributions for water-saturated state are shown in Figure 7d where both T2 distributions are almost overlapping (compare with Figure 7a). The difference between the two T2 distributions may originate from the “as-received” state T2 distributions that does not truly represent the T2 distribution under reservoir conditions.
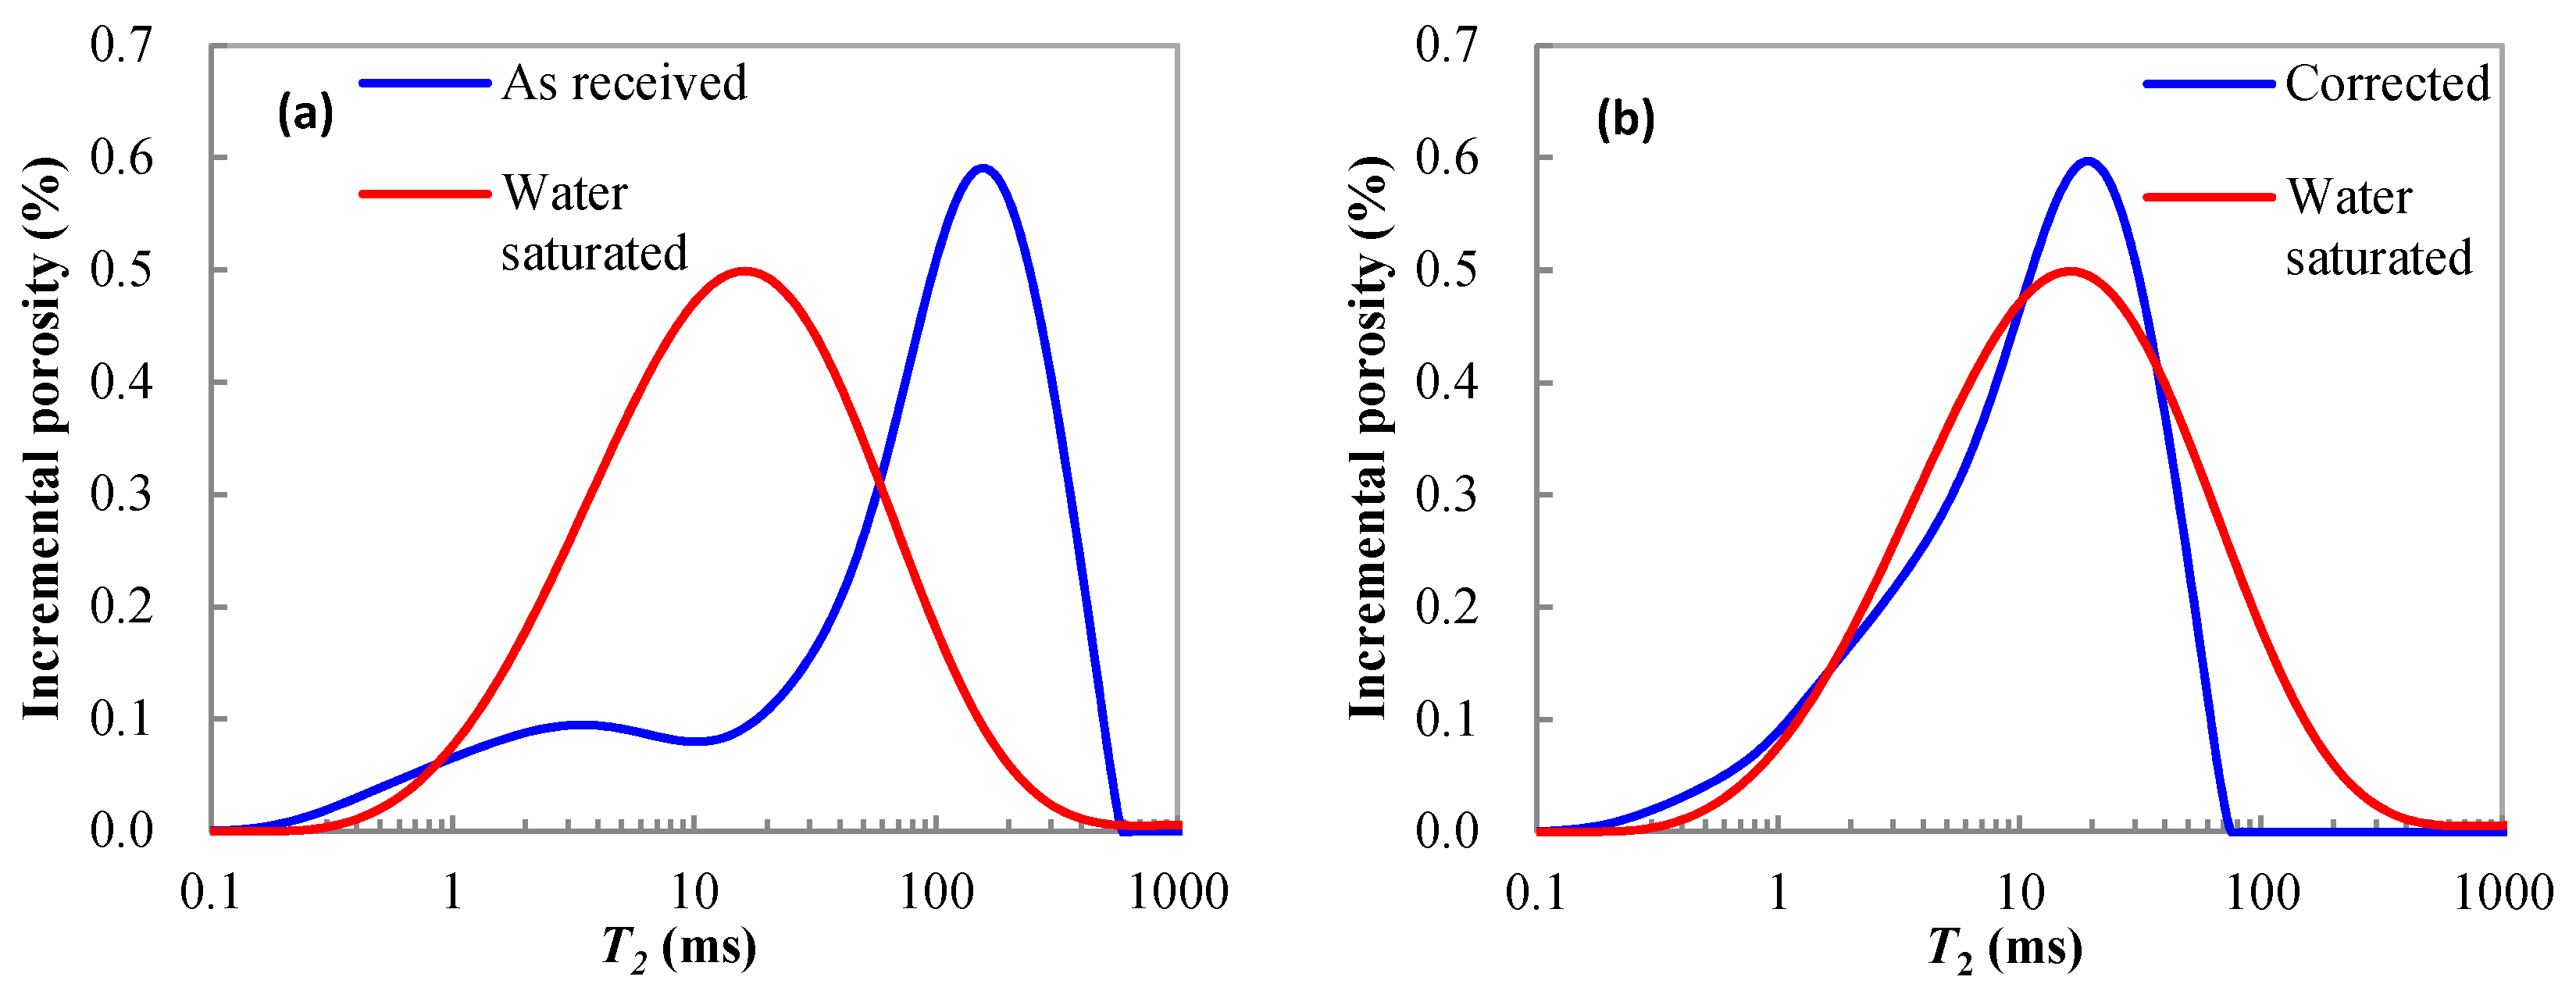
Figure 8 exhibits the T2 distributions of the sample M2. The porosity and permeability for this sample was measured 15.5% and 0.0299 mD, correspondingly. The corrected and measured T2 distributions for water-saturated conditions are shown in Figure 8b. It can be seen that the difference between the two T2 distributions is minor, presenting the effectiveness of the correction method.
3.4.2. Case Study
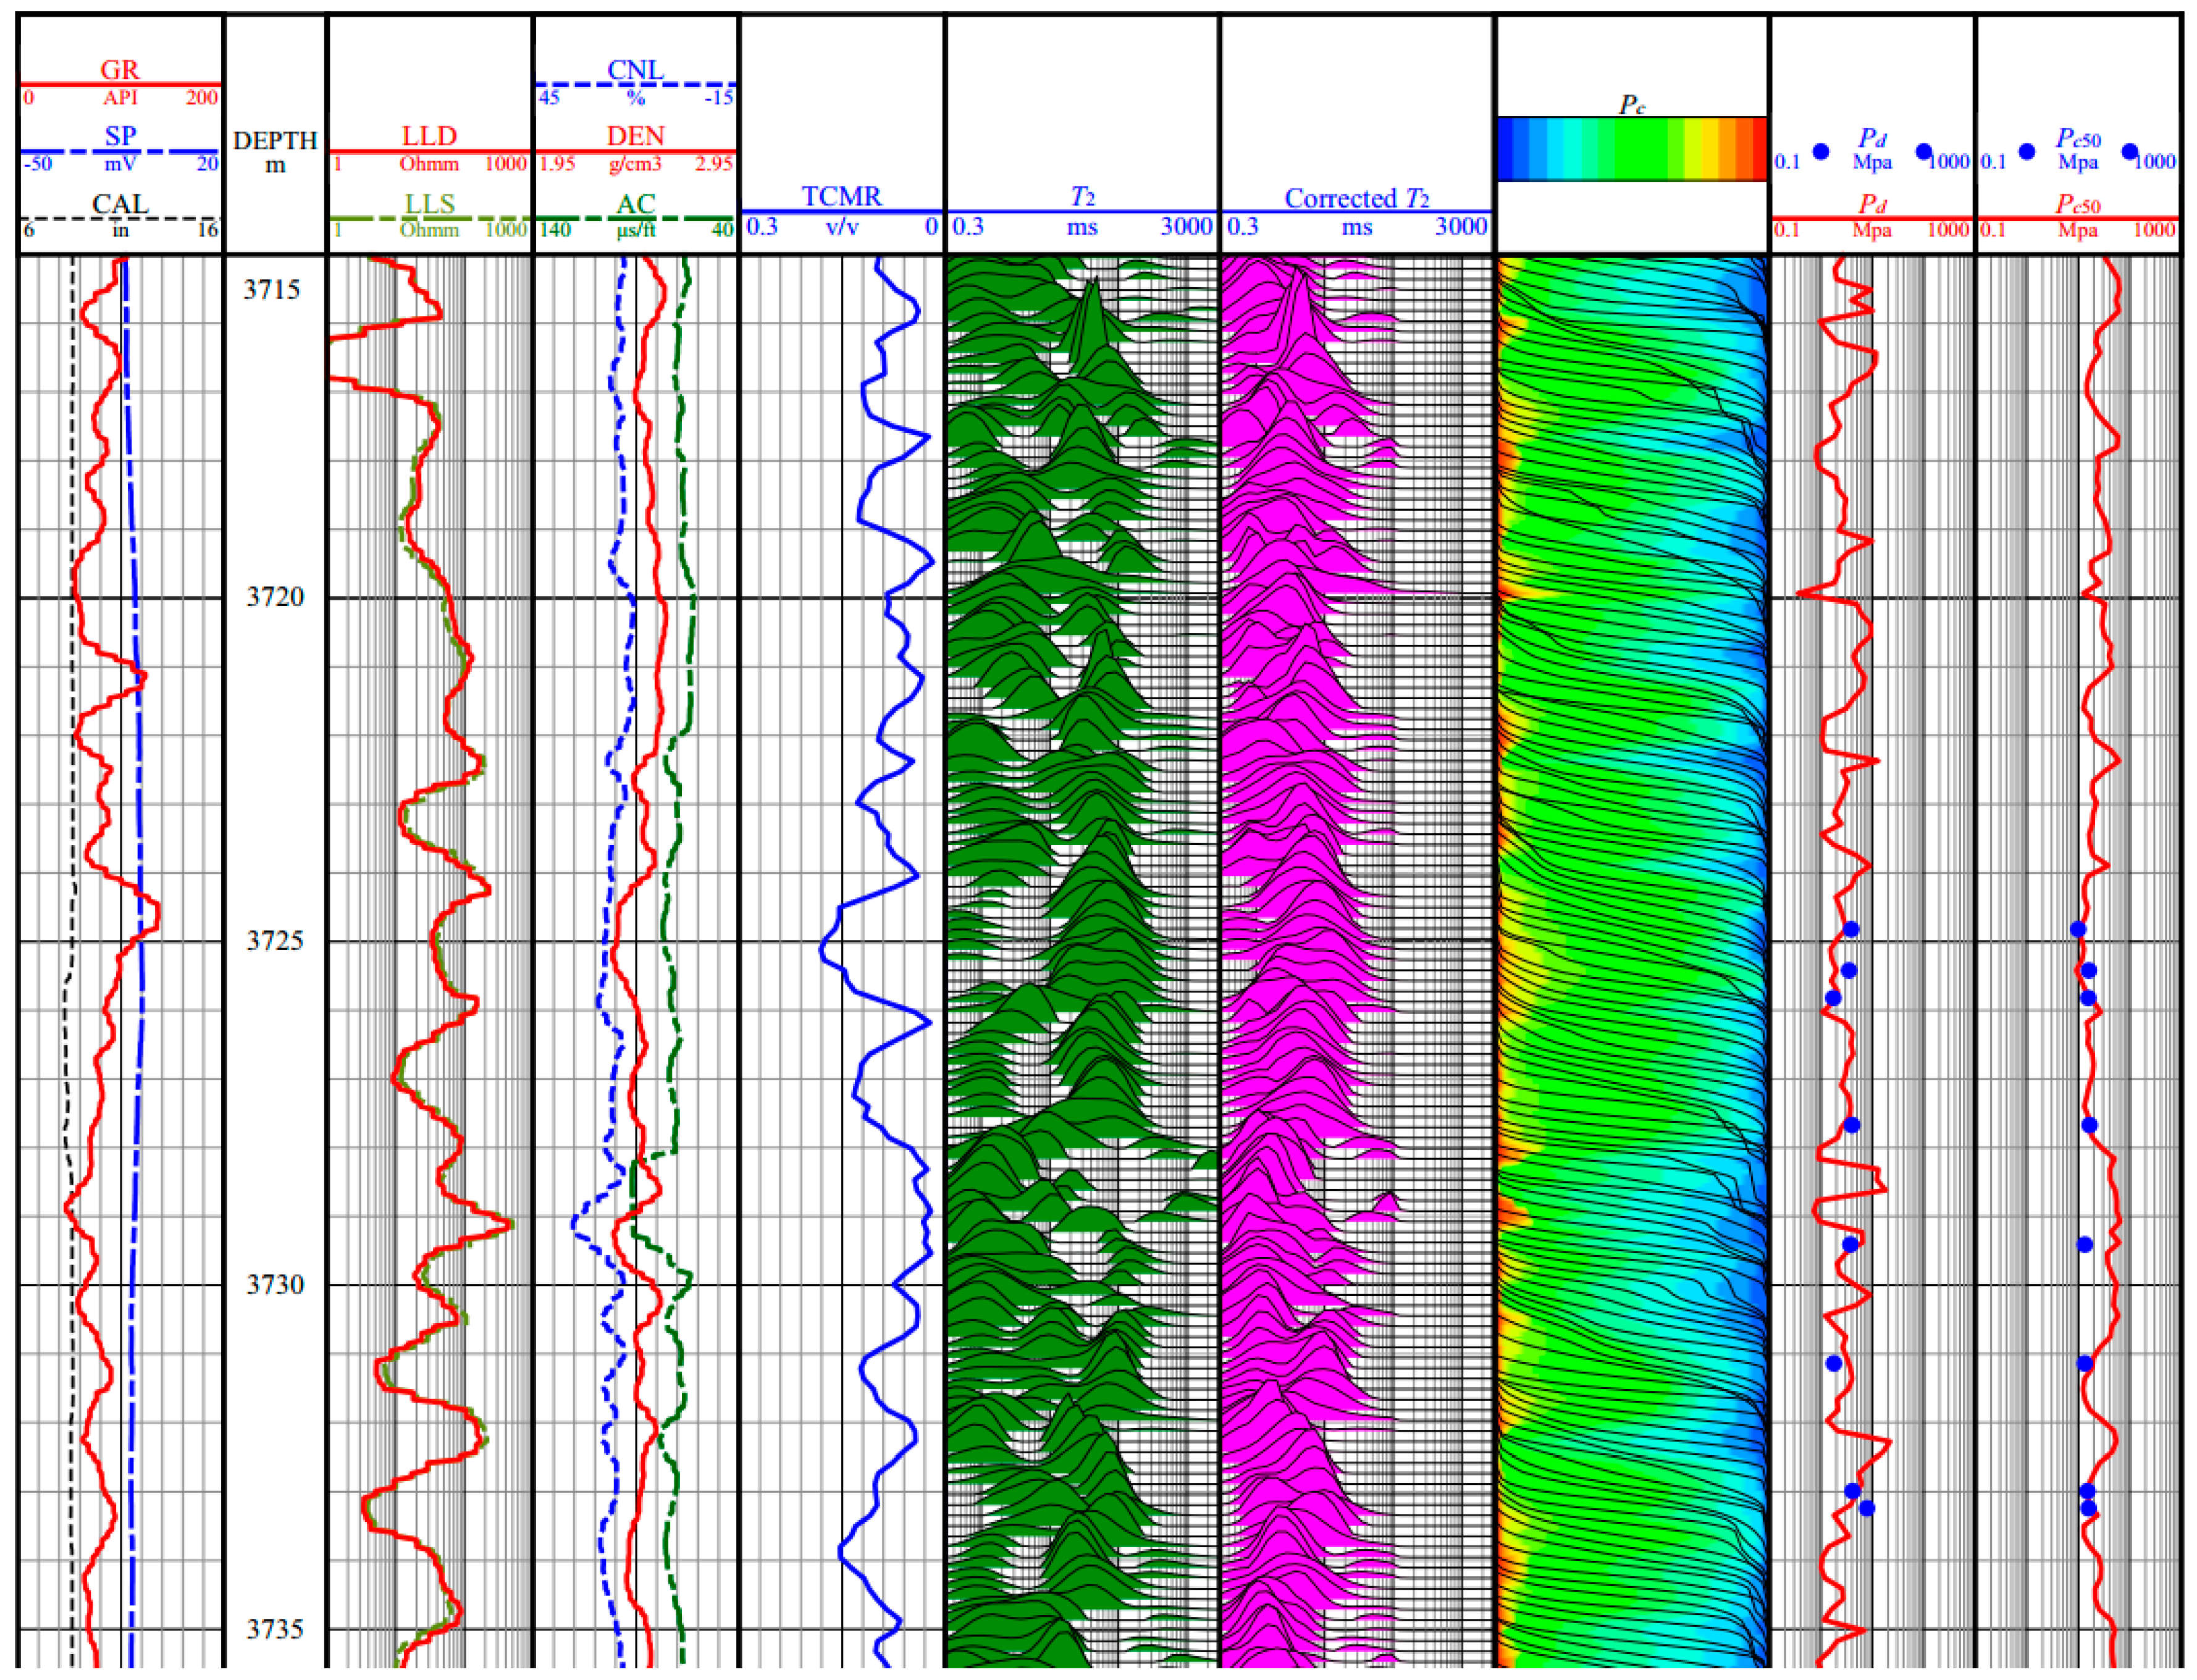
Figure 9 displays well logs from Well Ji32 from the lower sweet spot reservoir. The average hydrophilic pore surface relaxivity obtained by the capillary pressure curves and the T2 spectra of nuclear magnetic logging is scaled as 2.5 μm/s, and the oleophilic pore surface relaxivity is 0.75 μm/s. The first track from left in the figure presents the lithology logs including GR, SP and CAL. The second track is deep and shallow lateral resistivity (LLD and LLS) logs, and the third one shows the conventional porosity logs, in terms of DEN, CNL and AC logs. Track 4 presents the total porosity obtained from NMR logging. Track 5 shows the measured NMR T2 spectra. Track 6 presents the corrected T2 spectra for fully water-saturated state. From this track, it is known that T2 spectra for fully water-saturated state are narrower, revealing poor pore structure of the formation, exhibits a tight oil reservoir characteristic. Track 7 presents the capillary pressure curves constructed using the T2 spectra of water-saturated state. The last two tracks are the comparison of the displacement pressure and the median pressure calculated by the constructed capillary pressure (red curves) with the core data (blue dots). The prediction results are in good agreement with the core analysis results (blue dots), which verifies the reliability and effectiveness of the pore structure prediction method proposed in this paper. From this figure, it can be seen that a consecutively prediction result for pore structures. The capillary pressure curves and related parameters at different depths can be seen directly. The variation in pore structure with depth cannot be observed if only core samples are used.
3.4.3. Overall Pore Structure Characteristics of the Studied Formation
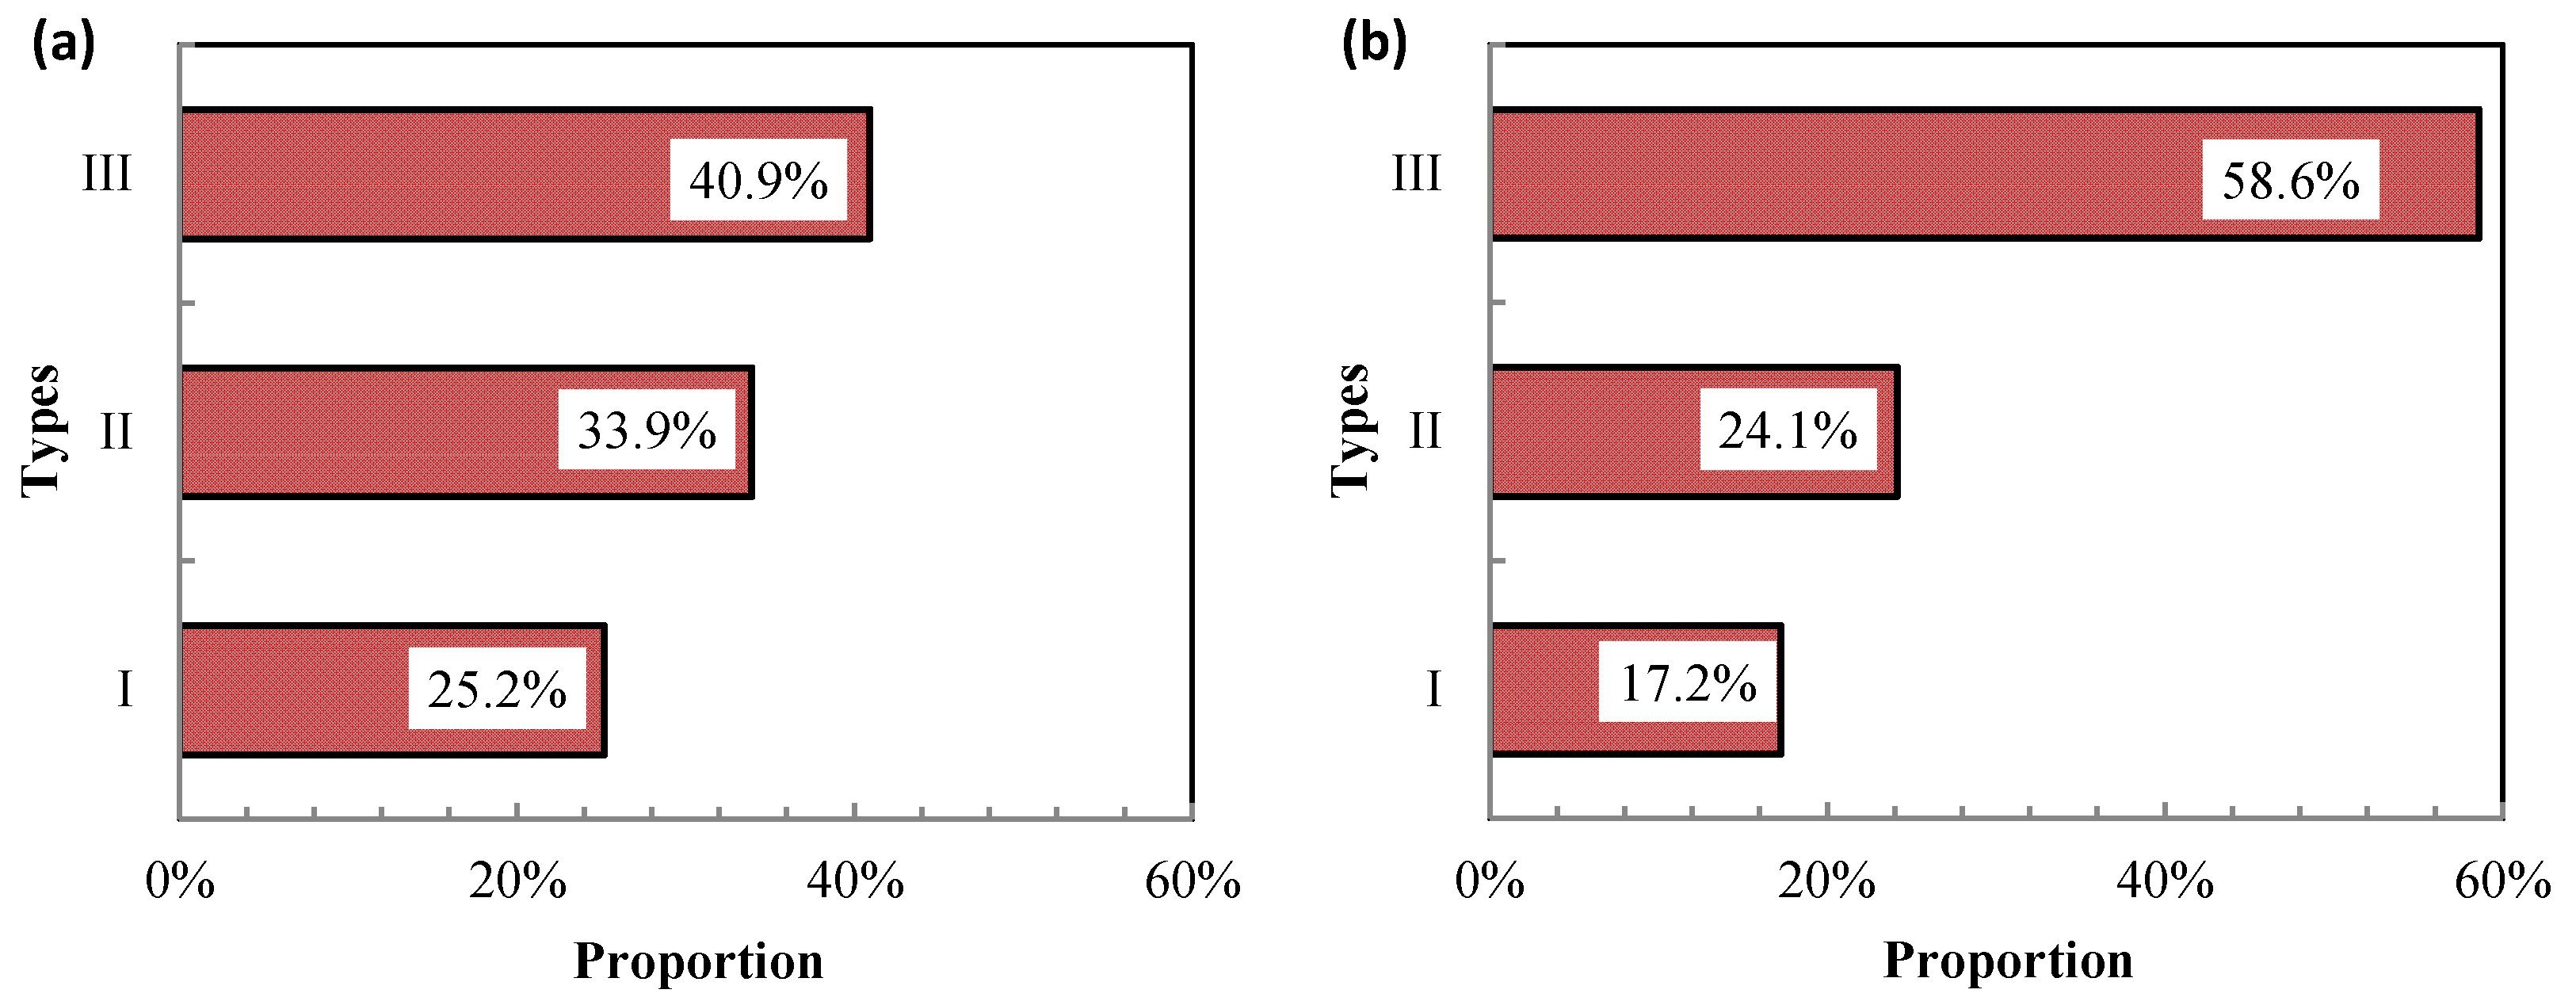
According to classification criteria presented earlier of MICP, the constructed capillary pressure curves of the fourteen wells with NMR logging measurements in the studied area were categorized. Types I, II, and III account for 25.2%, 33.9%, and 40.9% respectively in the upper sweet spot reservoir, while Types I, II, and III make up 17.2%, 24.1%, and 58.6% in the lower sweet spot reservoir, as shown in Figure 10.
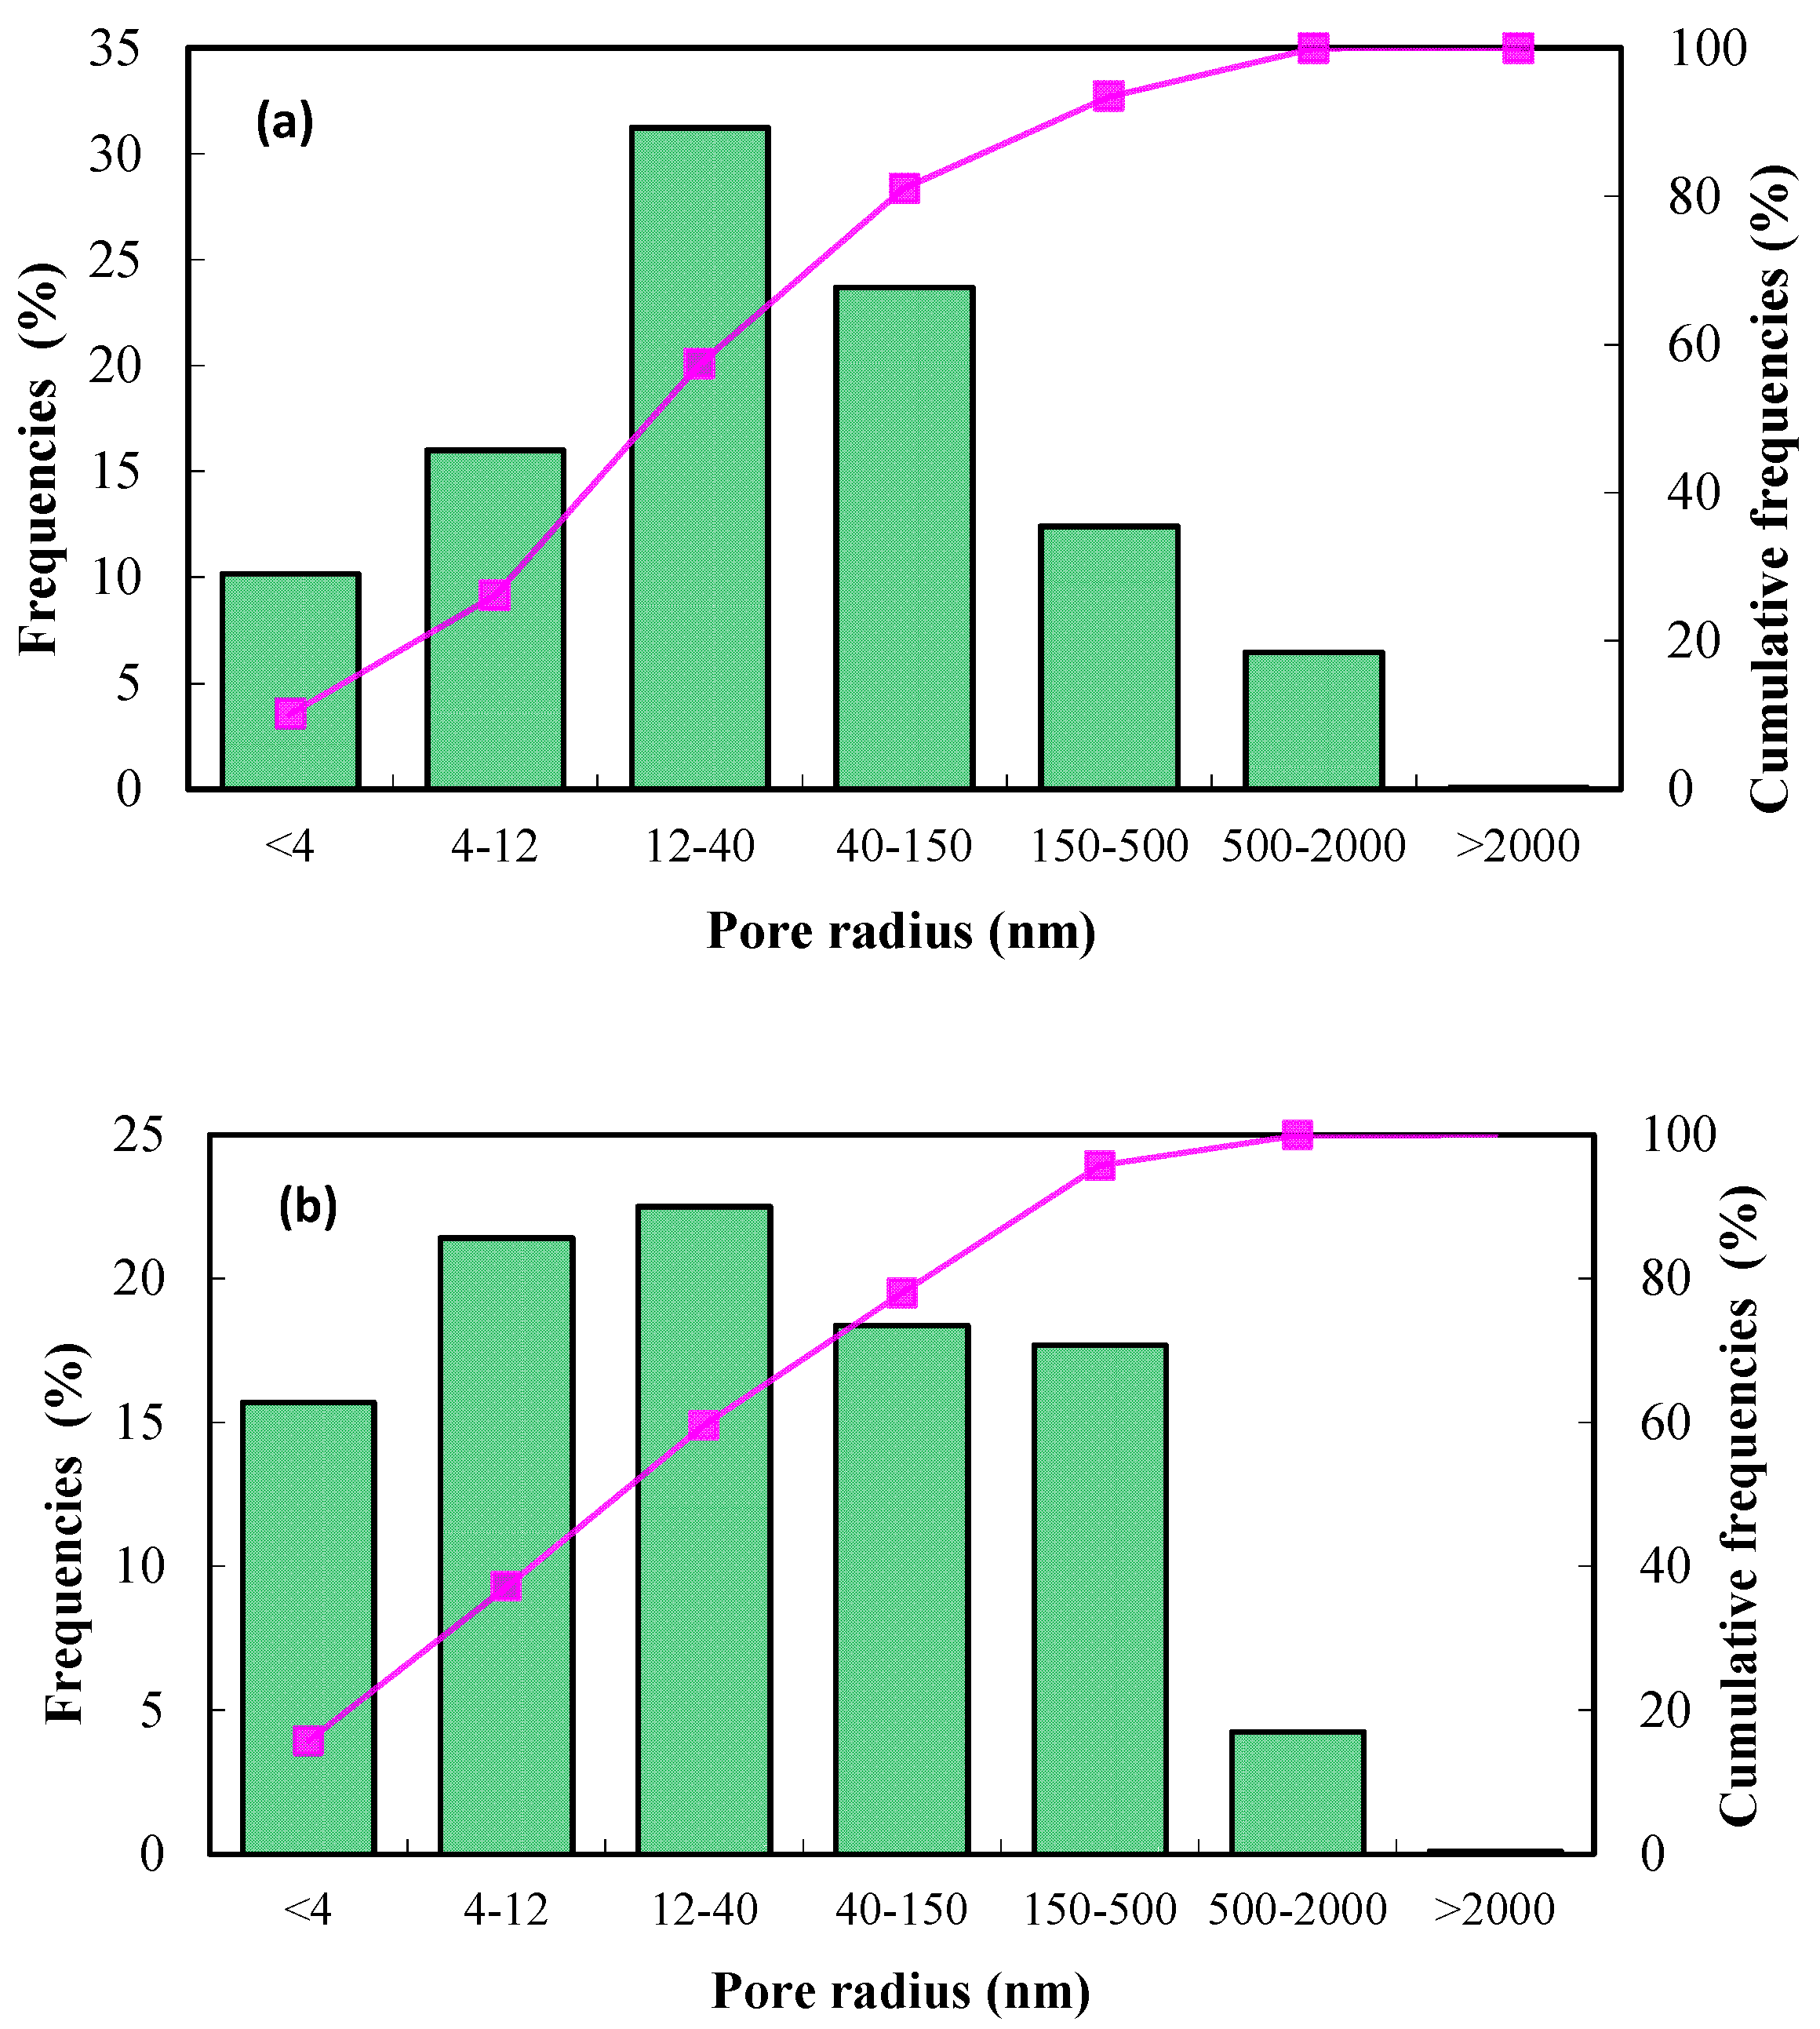
According to the constructed capillary pressure curves obtained from the fourteen wells in the studied area, the pore size distributions were further calculated for the reservoirs. Figure 11 demonstrates the average pore size distribution of the upper and lower sweet spot reservoirs in the studied area. It can be seen from Figure 11a that the main peak of the pore size is between 12 nm and 40 nm, while the pores smaller than 40 nm make up 57.4%, and the pores between 40 nm and 500 nm, 36.1% of all pores collectively. The pore size distribution of the lower sweet spot in Figure 11b is relatively dispersed, where the proportion of pores smaller than 40 nm and the pores between 40 and 500 nm are quiet the same as the upper sweet spot reservoir. However, the pores that smaller than 12 nm are more abundant in the lower sweet spot reservoir compared to the upper one. In addition, the pores smaller than 4 nm in both upper and lower sweet spots are 10.2% and 15.7%, found to be higher than similar pores calculated from capillary pressure curves.
4. Conclusions
In this paper, the pore structure of a tight oil reservoir in Permain Lucaogou formation of Jimusaer Sag was studied using SEM images and MICP data. NMR logs were used to provide a consecutive prediction of the pore structures. The following conclusions are made:
- According to the SEM images, the main pores of the tight oil reservoirs in the Lucaogou Formation are secondary pores. These pores can be divided into four categories: intragranular dissolution, intergranular dissolution, micro fractures and clay pores.
- The displacement pressure values of the studied samples ranges from 0.83 to 13.01 MPa with an average of 5.06 MPa. Saturation median pressure varied from 4.96 to 83.02 MPa with an average of 31.47 MPa. The mean capillary radius was measured from 0.02 to 0.26 μm.
- The capillary pressure curves are divided into three types: displacement pressure <2 MPa, 2–5 MPa and >5 MPa. Type I rocks have the smallest displacement pressures while Type III the highest displacement pressures and lowest maximum mercury intrusion saturation. The pores of type I rocks are mainly dissolution pores, and type III are clay pores.
- The T2 distributions of “as-received” and water-saturated state samples were measured. The model for predicting capillary pressure curves with NMR T2 distribution was verified by two state T2 distributions measurements. This model was applied to well logs where the estimated pore structure parameters by NMR T2 distribution were in a good agreement with core analysis.
- The predicted capillary pressure curves from NMR logging data of the fourteen wells in the studied area were categorized based on the proposed model. Types I, II, and III of the upper sweet spot reservoir account for 25.2%, 33.9%, and 40.9%, while in the lower sweet spot, 17.2%, 24.1%, and 58.6% was calculated respectively. The pores smaller than 12 nm in the lower sweet spot reservoirs are more abundant than the upper sweet spot, indicating the pore structure of the lower sweet spot reservoir is more complicated than that in the upper sweet spot reservoir.
Author Contributions
Investigation, Z.X.; Methodology, P.Z.; Resources, Z.W.; Writing—review & editing, M.O. and Z.P.
Acknowledgments
This paper is supported by the China National Science and Technology Major Project (2017ZX05009-001), the National Nature Science Foundation of China (41302109) and the Foundation of State Key Laboratory of Petroleum Resources and Prospecting, China University of Petroleum, Beijing (No. PRP/open-1601).
Conflicts of Interest
The authors declare no conflict of interest.
References
- Miller, B.A.; Paneitz, J.M.; Mullen, M.J.; Meijs, R.; Tunstall, K.M.; Garcia, M. The successful application of a compartmental completion technique used to isolate multiple hydraulic-fracture treatments in horizontal Bakken Shale wells in North Dakota. In Proceedings of the SPE Annual Technical Conference and Exhibition, Denver, CO, USA, 21–24 September 2008. SPE-116469-MS. [Google Scholar]
- Jia, C.Z.; Zou, C.N.; Li, J.Z.; Li, D.H.; Zheng, M. Assessment criteria, main types, basic features and resource prospects of the tight oil in China. Acta Pet. Sin. 2012, 33, 343–350. [Google Scholar]
- Li, C.; Ostadhassan, M.; Gentzis, T.; Kong, L.; Carvajal-Ortiz, H.; Bubach, B. Nanomechanical characterization of organic matter in the Bakken formation by microscopy-based method. Mar. Pet. Geol. 2018, 96, 128–138. [Google Scholar] [CrossRef]
- Wang, L.; Zhao, N.; Sima, L.; Meng, F.; Guo, Y. Pore Structure Characterization of the Tight Reservoir: Systematic Integration of Mercury Injection and Nuclear Magnetic Resonance. Energy Fuel 2018, 32, 7471–7484. [Google Scholar] [CrossRef]
- Zou, C.N.; Zhu, R.K.; Wu, S.T.; Yang, Z. Types, characteristics, genesis and prospects of conventional and unconventional hydrocarbon accumulations: Taking tight oil and tight gas in China as an instance. Acta Pet. Sin. 2012, 33, 173–187. [Google Scholar]
- Ramakrishna, S.; Balliet, R.; Miller, D.; Sarvotham, S.; Merkel, D. Formation evaluation in the Bakken Complex using laboratory core data and advanced logging technologies. In Proceedings of the SPWLA 51st Annual Logging Symposium, Perth, Australia, 19–23 June 2010. SPWLA-2010-74900. [Google Scholar]
- Wood, D.A.; Hazra, B. Characterization of organic-rich shales for petroleum exploration & exploitation: A review—Part 1: Bulk properties, multi-scale geometry and gas adsorption. J. Earth Sci. 2017, 28, 739–757. [Google Scholar] [CrossRef]
- Wood, D.A.; Hazra, B. Characterization of organic-rich shales for petroleum exploration & exploitation: A review—Part 3: Applied geomechanics, petrophysics and reservoir modeling. J. Earth Sci. 2017, 28, 739–757. [Google Scholar] [CrossRef]
- Ge, X.; Fan, Y.; Li, J.; Zahid, M.A. Pore structure characterization and classification using multifractal theory—An application in Santanghu basin of western China. J. Petrol. Sci. Eng. 2015, 127, 297–304. [Google Scholar] [CrossRef]
- Kong, L.; Ostadhassan, M.; Li, C.; Tamimi, N. Pore characterization of 3D-printed gypsum rocks: A comprehensive approach. J. Mater. Sci. 2018, 53, 5063–5078. [Google Scholar] [CrossRef]
- Lai, J.; Wang, G.; Wang, Z.; Chen, J.; Pang, X.; Wang, S.; Zhou, Z.; He, Z.; Qin, Z.; Fan, X. A review on pore structure characterization in tight sandstones. Earth Sci. Rev. 2018, 177, 436–457. [Google Scholar] [CrossRef]
- Xia, Y.; Cai, J.; Wei, W.; Hu, X.; Wang, X.; Ge, X. A new method for calculating fractal dimensions of porous media based on pore size distribution. Fractals 2018, 26. [Google Scholar] [CrossRef]
- Kuang, L.C.; Hu, W.X.; Wang, X.L.; Wu, H.G.; Wang, X.L. Research of the tight oil reservoir in the Lucaogou Formation in Jimusar Sag: Analysis of lithology and porosity characteristics. Geol. J. China Univ. 2013, 19, 529–535. [Google Scholar]
- Zhang, T.; Fan, G.; Li, Y.; Yu, C. Pore-throat characterization of tight oil reservoir in the Lucaogou formation, Jimusar sag. CT Theor. Appl. 2016, 25, 425–434. [Google Scholar]
- Zhou, P. Characterization and Evaluation of Tight Oil Reservoirs of Permian Lucaogou Formation in Jimusar Sag, Junggar Basin. Master’s Thesis, Northwest University, Xi’an, China, 2016. [Google Scholar]
- Su, Y.; Zha, M.; Ding, X. Pore type and pore size distribution of tight reservoirs in the Permian Lucaogou Formation of the Jimsar Sag, Junggar Basin, NW China. Mar. Pet. Geol. 2017, 89, 761–774. [Google Scholar] [CrossRef]
- Zhao, P.; Sun, Z.; Luo, X.; Wang, Z.; Mao, Z.; Wu, Y.; Xia, P. Study on the response mechanisms of nuclear magnetic resonance (NMR) log in tight oil reservoirs. Chin. J. Geophys. 2016, 29, 1927–1937. [Google Scholar] [CrossRef]
- Zhao, P.; Wang, Z.; Sun, Z.; Cai, J.; Wang, L. Investigation on the pore structure and multifractal characteristics of tight oil reservoirs using NMR measurements: Permian Lucaogou Formation in Jimusaer Sag, Junggar Basin. Mar. Pet. Geol. 2017, 86, 1067–1081. [Google Scholar] [CrossRef]
- Wang, X.; Hou, J.; Liu, Y.; Zhao, P.; Ma, K.; Wang, D.; Ren, X.; Yan, L. Overall PSD and fractal characteristics of tight oil reservoirs: A case study of Lucaogou formation in Junggar Basin, China. Fractals 2019, 27. [Google Scholar] [CrossRef]
- Loren, J.D.; Robinson, J.D. Relations between pore size fluid and matrix properties, and NML measurements. SPE J. 1970, 10, 50–58. [Google Scholar] [CrossRef]
- Kenyon, W.E. Petrophysical principles of applications of NMR logging. Log Anal. 1997, 38, 21–40. [Google Scholar]
- Volokitin, Y.; Looyestijn, W. A practical approach to obtain primary drainage capillary pressure curves from NMR core and log data. Petrophysics 2001, 42, 334–343. [Google Scholar]
- Volokitin, Y.; Looyestijn, W. Constructing capillary pressure curve from NMR log data in the presence of hydrocarbons. In Proceedings of the SPWLA 40th Annual Logging Symposium, Oslo, Norway, 30 May–3 June 1999. SPWLA-1999-KKK. [Google Scholar]
- Liu, T.; Wang, S.; Fu, R.; Li, Y.; Luo, M. Analysis of rock pore throat structure with NMR spectra. Oil Geophys. Prospect. 2003, 38, 328–333. [Google Scholar]
- Grattoni, C.A.; Al-Mahrooqi, S.H.; Moss, A.K.; Muggeridge, A.H.; Jing, X.D. An improved technique for deriving drainage capillary pressure from NMR T2 Distributions. In Proceedings of the International Symposium of the Society of Core Analysis, Pau, France, 21–24 September 2003. SCA2003-25. [Google Scholar]
- He, Y.; Mao, Z.; Xiao, L.; Ren, X. An improved method of using NMR T2 distribution to evaluate pore size distribution. Chin. J. Geophys. 2005, 48, 373–378. [Google Scholar]
- He, Y.; Mao, Z.; Xiao, L.; Zhang, Y. A new method to obtain capillary pressure curve using NMR T2 distribution. J. Jilin Univ. (Earth Sci. Ed.) 2005, 35, 177–181. [Google Scholar]
- Xiao, L.; Mao, Z.; Wang, Z.; Jin, Y. Application of NMR logs in tight gas reservoirs for formation evaluation: A case study of Sichuan basin in China. J. Petrol. Sci. Eng. 2012, 81, 182–195. [Google Scholar] [CrossRef]
- Hu, F.; Zhou, C.; Li, C.; Xu, H.; Zhou, F.; Si, Z. Water spectrum method of NMR logging for identifying fluids. Petrol. Explor. Dev. 2016, 43, 244–252. [Google Scholar] [CrossRef]
- Ge, X.; Fan, Y.; Liu, J.; Zhang, L.; Han, Y.; Xing, D. An improved method for permeability estimation of the bioclastic limestone reservoir based on NMR data. J. Magn. Reson. 2017, 283, 96–109. [Google Scholar] [CrossRef] [PubMed]
- Xiao, L.; Mao, Z.; Li, J.; Yu, H. Effect of hydrocarbon on evaluating formation pore structure using nuclear magnetic resonance (NMR) logging. Fuel 2018, 216, 199–207. [Google Scholar] [CrossRef]
- Coates, G.R.; Xiao, L.Z.; Prammer, M.G. NMR Logging Principles and Applications; Gulf Publishing Company: Houston, TX, USA, 1999. [Google Scholar]
- Dunn, K.J.; Bergman, D.J.; Latorraca, G.A. Nuclear Magnetic Resonance Petrophysical and Logging Application; Elservier: Amsterdam, The Netherlands, 2002. [Google Scholar]
- Daigle, H.; Johnson, A. Combining mercury intrusion and nuclear magnetic resonance measurements using percolation theory. Transp. Porous Med. 2016, 111, 669–679. [Google Scholar] [CrossRef]
- Zhao, P. Study on the NMR Log Responses and Models for Estimating Petrophysical Parameters from Well Logs in Tight Oil Reservoirs. Ph.D. Thesis, China University of Petroleum, Beijing, China, 2016. [Google Scholar]
- Cao, Z.; Liu, G.; Xiang, B.; Wang, P.; Niu, G.; Niu, Z.; Li, C.; Wang, C. Geochemical Characteristics of crude oil from a tight oil reservoir in the Lucaogou Formation, Jimusar Sag, Junggar, Basin. AAPG Bull. 2017, 101, 39–72. [Google Scholar] [CrossRef]
- Kuang, L.C.; Tang, Y.; Lei, D.W.; Chang, Q.S.; Ouyang, M.; Hou, L.H.; Liu, D.G. Formation conditions and exploration potential of tight oil in the Permian saline lacustrine dolomitic rock, Junggar Basin, NW China. Petrol. Explor. Dev. 2012, 39, 657–667. [Google Scholar] [CrossRef]
- Butler, J.P.; Reeds, J.A.; Dawson, S.V. Estimating solutions of first kind integral equations with nonnegative constraints and optimal smoothing. SIAM. J. Numer. Anal. 1981, 18, 381–397. [Google Scholar] [CrossRef]
- Washburn, E.D. The dynamics of capillary flow. Phys. Rev. 1921, 17, 273–283. [Google Scholar] [CrossRef]
- Latour, L.L.; Kleinberg, R.L.; Sezginer, A. Nuclear magnetic resonance properties of rocks at elevated temperatures. J. Colloid Interface Sci. 1994, 150, 535–548. [Google Scholar] [CrossRef]
- Looyestijn, W.J.; Hofman, J.P. Wettability determination by NMR. SPE Reserv. Eval. Eng. 2006, 6, 146–153. [Google Scholar] [CrossRef]
- Yang, S.L.; Wei, J.Z. Petrophysics; Petroleum Industry Press: Beijing, China, 2004; pp. 209–233. [Google Scholar]
Figure 1.
Depth contour in meters of the top of Lucaogou Formation and location of wells.

Figure 2.
The pore types according to SEM analysis. (a) Intergranular dissolved pores; (b) Intergranular dissolved pores; (c) Intergranular and intragranular dissolved pores; (d) Intergranular and intragranular dissolved pores; (e) Illite/smectite mixed layer clay pores; (f) Chlorite clay pores; (g) Fracture pore; (h) Fracture pore.

Figure 3.
Classified capillary pressure curves. Red, black and blue lines represent the types I, II and III, respectively.
Figure 3.
Classified capillary pressure curves. Red, black and blue lines represent the types I, II and III, respectively.

Figure 4.
Average pore size distributions for the three types. Red, black and blue lines represent the types I, II and III, respectively.
Figure 4.
Average pore size distributions for the three types. Red, black and blue lines represent the types I, II and III, respectively.

Figure 5.
The cross plot of permeability with clay and plagioclase contents.

Figure 6.
The cross plot of displacement pressure with clay and plagioclase contents.

Figure 7.
Sample M1: (a) T2 distributions for “as received” state and water saturated state; (b) Water and oil signal distributions obtained from “as received” state T2 distribution using weight function S(T2); (c) Water-containing pore, oil-bearing pore and total pore size distributions; (d) Comparison of corrected and measured T2 distributions for water-saturated state.

Figure 8.
Sample M2: (a) T2 distributions for “as received” state and water saturated state; (b) Comparison of corrected and measured T2 distributions for water-saturated state.
Figure 8.
Sample M2: (a) T2 distributions for “as received” state and water saturated state; (b) Comparison of corrected and measured T2 distributions for water-saturated state.

Figure 9.
Pore structure prediction results for lower sweet spot reservoir in Well Ji32.

Figure 10.
Proportions of reservoir types estimated by NMR logs: (a) Upper sweet spot reservoir; (b) Lower sweet spot reservoir.
Figure 10.
Proportions of reservoir types estimated by NMR logs: (a) Upper sweet spot reservoir; (b) Lower sweet spot reservoir.

Figure 11.
Average pore size distributions estimated by NMR logs: (a) Upper sweet spot reservoir; (b) Lower sweet spot reservoir.
Figure 11.
Average pore size distributions estimated by NMR logs: (a) Upper sweet spot reservoir; (b) Lower sweet spot reservoir.


Table 1.
Mineralogical composition (wt.%) of the sixteen core samples of tight oil reservoirs.
| No. | Clay | Quartz | K-Feldspar | Plagioclase | Calcite | Dolomite | Pyrite | Siderite |
|---|---|---|---|---|---|---|---|---|
| 1 | 4.2 | 15.9 | 2.2 | 35.3 | 17.5 | 24.9 | 0.0 | 0.0 |
| 2 | 6.3 | 21.4 | 7.9 | 37.5 | 1.0 | 18.9 | 0.0 | 7.0 |
| 3 | 3.4 | 13.0 | 6.1 | 27.1 | 8.7 | 41.7 | 0.0 | 0.0 |
| 4 | 9.8 | 16.5 | 3.9 | 41.0 | 13.3 | 15.0 | 0.0 | 0.5 |
| 5 | 5.9 | 15.8 | 4.9 | 32.5 | 0.5 | 40.1 | 0.3 | 0.0 |
| 6 | 7.5 | 16.3 | 5.0 | 38.4 | 22.9 | 9.9 | 0.0 | 0.0 |
| 7 | 6.0 | 15.6 | 4.4 | 25.4 | 0.0 | 48.6 | 0.0 | 0.0 |
| 8 | 6.9 | 17.8 | 5.4 | 44.4 | 0.0 | 23.6 | 0.0 | 1.9 |
| 9 | 12.2 | 24.7 | 4.5 | 31.1 | 0.0 | 26.5 | 1.0 | 0.0 |
| 10 | 13.9 | 23.2 | 3.9 | 29.4 | 21.9 | 7.7 | 0.0 | 0.0 |
| 11 | 18.2 | 16.4 | 4.7 | 27.7 | 0.0 | 32.5 | 0.5 | 0.0 |
| 12 | 10.8 | 20.3 | 3.8 | 25.6 | 0.0 | 38.5 | 1.0 | 0.0 |
| 13 | 11.6 | 22.6 | 2.5 | 13.7 | 0.0 | 49.4 | 0.0 | 0.2 |
| 14 | 7.6 | 32.0 | 3.9 | 34.1 | 22.0 | 0.0 | 0.4 | 0.0 |
| 15 | 11.8 | 18.3 | 5.8 | 32.3 | 0.0 | 31.3 | 0.0 | 0.5 |
| 16 | 6.6 | 21.0 | 1.8 | 18.2 | 5.8 | 41.2 | 5.4 | 0.0 |
| Ave. | 8.9 | 19.4 | 4.4 | 30.9 | 7.1 | 28.2 | 0.5 | 0.6 |
Table 2.
Petrophysical parameters and types of tight oil reservoir sample.
| No. | Porosity | Permeability | Pd | P50 | Smax | Rm | Type |
|---|---|---|---|---|---|---|---|
| (%) | (mD) | (MPa) | (MPa) | (%) | (μm) | ||
| 1 | 14.22 | 0.1142 | 0.83 | 6.32 | 90.93 | 0.26 | I |
| 2 | 16.02 | 0.1487 | 1.19 | 6.51 | 99.25 | 0.19 | I |
| 3 | 15.19 | 0.0799 | 1.28 | 4.96 | 96.99 | 0.18 | I |
| 4 | 14.14 | 0.0203 | 1.72 | 11.46 | 94.57 | 0.13 | I |
| 5 | 15.86 | 0.0424 | 2.35 | 9.64 | 98.16 | 0.10 | II |
| 6 | 13.43 | 0.0128 | 3.19 | 15.09 | 94.38 | 0.07 | II |
| 7 | 13.63 | 0.0275 | 3.38 | 14.97 | 95.57 | 0.07 | II |
| 8 | 13.63 | 0.0323 | 3.38 | 16.94 | 93.09 | 0.07 | II |
| 9 | 14.59 | 0.0110 | 4.69 | 19.09 | 96.59 | 0.05 | II |
| 10 | 7.38 | 0.0034 | 4.69 | 19.18 | 91.71 | 0.05 | II |
| 11 | 8.26 | 0.0042 | 7.03 | 39.8 | 92.95 | 0.03 | III |
| 12 | 10.3 | 0.0040 | 6.13 | 60.23 | 89.43 | 0.03 | III |
| 13 | 8.28 | 0.0023 | 11.18 | 83.02 | 82.56 | 0.02 | III |
| 14 | 20.1 | 0.0168 | 10.42 | 66.27 | 76.68 | 0.02 | III |
| 15 | 10.23 | 0.0042 | 6.55 | 63.48 | 69.55 | 0.03 | III |
| 16 | 10.0 | 0.0025 | 13.01 | 66.6 | 76.98 | 0.02 | III |
| Ave. | 12.83 | 0.01 | 5.06 | 31.47 | 89.96 | 0.08 |
© 2018 by the authors. Licensee MDPI, Basel, Switzerland. This article is an open access article distributed under the terms and conditions of the Creative Commons Attribution (CC BY) license (http://creativecommons.org/licenses/by/4.0/).
Share and Cite
MDPI and ACS Style
Xu, Z.; Zhao, P.; Wang, Z.; Ostadhassan, M.; Pan, Z. Characterization and Consecutive Prediction of Pore Structures in Tight Oil Reservoirs. Energies 2018, 11, 2705. https://0-doi-org.brum.beds.ac.uk/10.3390/en11102705
AMA Style
Xu Z, Zhao P, Wang Z, Ostadhassan M, Pan Z. Characterization and Consecutive Prediction of Pore Structures in Tight Oil Reservoirs. Energies. 2018; 11(10):2705. https://0-doi-org.brum.beds.ac.uk/10.3390/en11102705
Chicago/Turabian StyleXu, Zhaohui, Peiqiang Zhao, Zhenlin Wang, Mehdi Ostadhassan, and Zhonghua Pan. 2018. "Characterization and Consecutive Prediction of Pore Structures in Tight Oil Reservoirs" Energies 11, no. 10: 2705. https://0-doi-org.brum.beds.ac.uk/10.3390/en11102705
Note that from the first issue of 2016, this journal uses article numbers instead of page numbers. See further details here.