Evolution of Coal Permeability during Gas Injection—From Initial to Ultimate Equilibrium


1
College of Water Conservancy and Hydropower Engineering, Hohai University, Nanjing 210098, China
2
Beijing Key Laboratory for Precise Mining of Intergrown Energy and Resources, China University of Mining and Technology, Beijing 100083, China
3
Department of Chemical Engineering, School of Engineering, The University of Western Australia, 35 Stirling Highway, Perth, WA 6009, Australia
4
School of Civil Engineering, Shaoxing University, Shaoxing 312000, China
*
Author to whom correspondence should be addressed.
Energies 2018, 11(10), 2800; https://0-doi-org.brum.beds.ac.uk/10.3390/en11102800
Submission received: 4 September 2018
/
Revised: 6 October 2018
/
Accepted: 11 October 2018
/
Published: 17 October 2018
(This article belongs to the Special Issue Flow and Transport Properties of Unconventional Reservoirs 2018)
Abstract
:The evolution of coal permeability is vitally important for the effective extraction of coal seam gas. A broad variety of permeability models have been developed under the assumption of local equilibrium, i.e., that the fracture pressure is in equilibrium with the matrix pressure. These models have so far failed to explain observations of coal permeability evolution that are available. This study explores the evolution of coal permeability as a non-equilibrium process. A displacement-based model is developed to define the evolution of permeability as a function of fracture aperture. Permeability evolution is tracked for the full spectrum of response from an initial apparent-equilibrium to an ultimate and final equilibrium. This approach is applied to explain why coal permeability changes even under a constant global effective stress, as reported in the literature. Model results clearly demonstrate that coal permeability changes even if conditions of constant effective stress are maintained for the fracture system during the non-equilibrium period, and that the duration of the transient period, from initial apparent-equilibrium to final equilibrium is primarily determined by both the fracture pressure and gas transport in the coal matrix. Based on these findings, it is concluded that the current assumption of local equilibrium in measurements of coal permeability may not be valid.
1. Introduction
The permeability of coal is a key transport property in determining coalbed methane production and CO2 storage in coal seam reservoirs. Coal permeability is often determined by regular sets of fractures called cleats, with the aperture of cleats being a key factor defining the magnitude of permeability [1]. Coal permeability may vary significantly in both space and time in response to the complex coal–gas interactions and presents complex evolutionary paths in unconventional reservoirs [2].
Significant experimental efforts have been made to investigate and interpret the evolution of coal permeability. Many factors affect coal permeability, including gas types [3,4], pore pressure, sorption-induced matrix swelling/shrinkage [5,6,7,8,9,10], effective pressure [11,12], water content [13,14] and gas exposure time [15]. Most of the above studies were performed under stress-controlled (unconstrained) boundary conditions to replicate in situ conditions. A variety of coal permeability models have been formulated to quantify permeability evolution from such laboratory experiments [16,17,18,19,20,21,22,23]. Most of these permeability models fail to explain stress-controlled results since they improperly idealize the fractured coal as a matchstick or cubic geometry, or assume local equilibrium between the matrix and fracture pressures, or ignore matrix–fracture interactions [2]. Stress-controlled conditions, applied in such models, discount matrix swelling from affecting coal permeability. This is because matrix swelling that is induced by increasing pore pressure results in an increase in matrix block size, rather than a change in fracture [24]. This analytical conclusion contradicts laboratory observations of significant change coal permeability induced by matrix swelling under constant confining stress conditions [11,25].
Previous studies suggest that the discrepancies between laboratory observations and theoretical characterizations are mainly attributed to sorption-induced swelling strain. Connell et al. [1] distinguished the sorptive strain of the coal matrix, the pores (or the cleats) and the bulk coal to relax the equilibrium strain assumption between the bulk and pore strains, and derived several different forms of permeability models for the laboratory tests. Liu et al. [24] developed a new coal-permeability model for constant confining-stress conditions, which explicitly considers fracture–matrix interactions during coal-deformation processes based on the concept of internal swelling stress. Chen et al. [26] introduced a partition factor to split the contributions of swelling strain between fracture and bulk deformation and developed relations between the partition ratio and cleat porosity change based on model fitting results. Liu et al. [27] proposed a conceptual solution to consider the matrix–fracture interaction through introduction of the concept of a switch in processes between local swelling and global swelling. Peng et al. [28] further combined the concept of local swelling and macro-swelling and matrix–fracture interactions at the micro-scale into a more rigorous dual permeability model, which was applied to generate a series of coal permeability relations exhibiting the characteristic “V” shape as observed in experiments.
While a certain degree of success has been achieved using these models to explain and match experimental observations, the interaction between coal matrix and fracture remains incompletely understood. Studies involving the partitioning of sorption-induced strain between fracture and matrix have focused on incorporating fracture–matrix interactions into permeability models, but often the necessary coefficients obtained from model fitting results are non-physics-based [24,26] or the division between global swelling and local swelling typically overestimates local fracture swelling contributions to fracture closure [28]. As the matrix and fractures have dramatically different flow characteristics and mechanical properties, this leads to non-uniform gas pressure distributions and uneven matrix strain. Thus, dynamic interactions can exert significant temporal effects on both fracture aperture changes (permeability changes) and bulk deformation [19,26,27,29]. It is clear that these studies have two deficiencies that need to be addressed. Firstly, the effects of fracture gas pressure on both fracture aperture and matrix deformation must be correctly accommodated—this is not the case in these prior studies. Prior studies have required that fracture opening is only induced by the swelling of the bridging contacts and the opening effects are less competitive than the opposite effects of the intervening free-face swelling. This leads to a decrease in permeability at the beginning of gas injection rather than an increase as demonstrated in some laboratory observations [30]. Secondly, different contributions of confining stress and matrix swelling to fracture aperture change and bulk deformation are neglected. Although many studies focused on developing governing equations in dual-continuum systems (fractured rock) when modeling coupled liquid flow and mechanical processes [31,32], the lack of consideration of the fracture–matrix interaction may cause unacceptable errors if these equations are directly used for the fractured coal. This is because many studies only noted the temporal effect on aperture change but ignored the influence on bulk deformation [28,33,34]. Fracture pressure, confining pressure and matrix swelling all cause fracture deformation, which is different from, but related to, bulk deformation [35].
The primary motivations of this study are to restore the process of fracture aperture change in coal containing discrete fractures following gas injection under unconstrained conditions and to underscore the impact of gas pressure within the fractures on aperture change. In this study, a fracture–matrix interaction model is developed to explore the dynamic interactions between fracture gas pressure, matrix swelling/shrinkage, aperture change and bulk deformation, and to illuminate mechanisms of dynamic deformation response to gas flow from fracture to matrix. Furthermore, the evolution of aperture change associated with intrinsic and extrinsic factors such as fracture properties, initial matrix permeability, injection processes and confining pressure are quantitatively evaluated. The simulated results provide a spectrum of permeability evolutions from the initial equilibrium state, through a transient state, to the final equilibrium state.
2. Conceptual Model and Governing Equations
2.1. Conceptual Model
The key to model the dynamic interactions between matrix and fractures is to recover important non-linear responses due to effective stress effects. Thus, the mechanical influence must be rigorously coupled with the gas transport system. This can be achieved through a full coupling approach. For this approach, a single set of equations (generally a large system of non-linear coupled partial differential equations) incorporating all the relevant physics is solved simultaneously. In the following section, two kinds of simulation models are presented to investigate the permeability change and bulk deformation under unconstrained conditions.
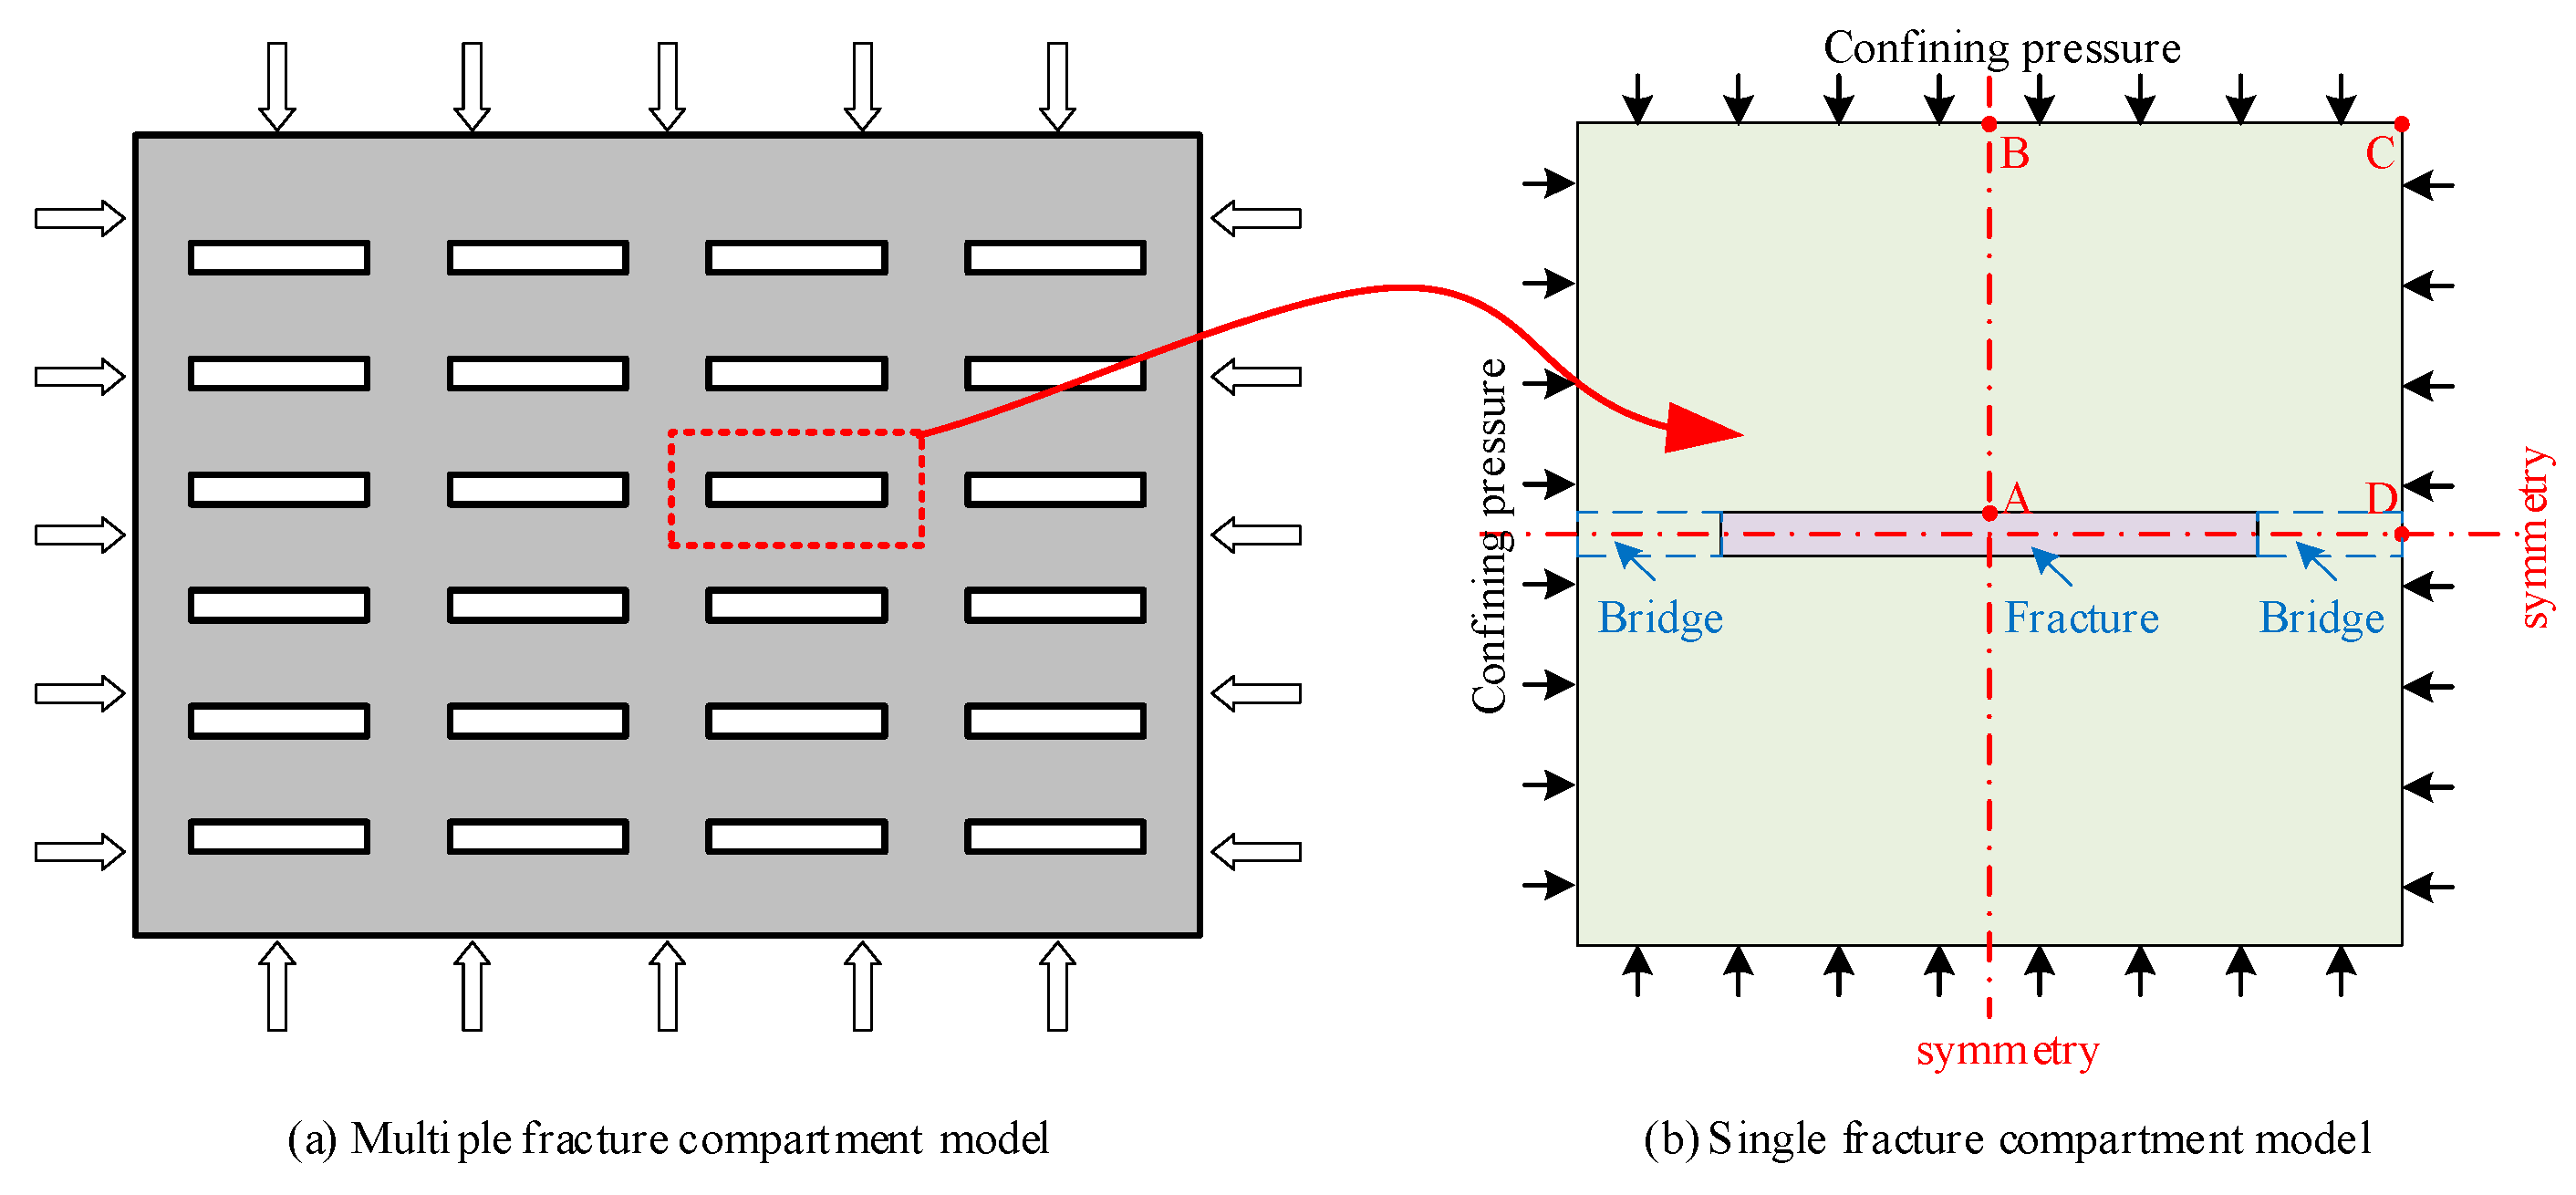
Coal is a typical dual porosity/permeability system [36] containing a porous matrix and fractures. In this study, it is assumed that cleats do not create a full separation between adjacent matrix blocks but solid rock bridges are present, as illustrated in Figure 1a. The coal bridge plays a significant role in the fracture–matrix interaction and its effect can be interpreted as follows: (a) restricting fracture opening induced by fracture pressure increase; (b) linking the spatial and temporal matrix swelling to the aperture change and bulk deformation; and (c) contributing to the final aperture increase. This assumption is also adopted in other studies [19,24]. The model examines the influence of effective stress and swelling response for a rectangular crack, similar to the matchstick model geometry, and a single component part removed from the array may be considered as a representative element. This represents the symmetry of the displacement boundary condition mid-way between flaws as shown in Figure 1b.
Two different methods may be used to represent the fracture:
- The fracture may be represented as a void [27,37]. Then the porous matrix is the only object to study, leading to a stress difference between the internal and external boundaries. The external stress boundaries are controlled by the confining stress, while the internal stress boundaries are controlled by the fracture gas pressure.
- The fracture may be represented as a softer material [19,29], with the equilibrium pressure applied on the cross section and no sorption-induced strain. Then, both the matrix and the fracture must be studied and only the external stress boundaries are relevant, and these are controlled by the constant confining stress. If the fracture pressure increases significantly faster than that in the pores in the surrounding matrix, a compressive stress due to fracture swelling will inevitably arise at the interface. This is similar to the internal swelling stress proposed by Liu et al. [24].
In the following sections, a set of field equations are defined which govern the gas transport and deformation of both the solid matrix and the fracture. Since the difference in these two approaches lies in the presence of the fractures, the governing equations are chosen accordingly.
The field equations are based on the following assumptions: (a) the matrix is homogeneous, isotropic and elastic continuum; (b) strains are infinitesimal; (c) gas contained within the pores, and its viscosity is constant under isothermal conditions; (d) gas flow through the coal matrix is assumed to be viscous flow obeying Darcy’s law; (e) if the fracture is also regarded as a homogeneous, isotropic and elastic continuum, the fracture is instantly filled with gas and no sorption-induced strain arises.
2.2. Governing Equation for Mechanical Response
The strain-displacement relationship is defined as:
where denotes the component of the total strain tensor and is the component of the displacement. The equilibrium equation is defined as:
where denotes the component of the total stress tensor and denotes the component of the body force.
Based on poroelasticity and by making an analogy between thermal contraction and matrix shrinkage, the constitutive relation for the coal matrix and the fracture becomes [22]:
where , , and , where is the bulk modulus, is the shear modulus, is the Young’s modulus, is the Possion’s ratio, is the Biot coefficient, is the gas pressure, is the Kronecker delta, and is the sorption-induced volumetric strain usually expressed by a Langmuir-type equation [18]:
where is a constant representing the volumetric strain at infinite pore pressure and is the Langmuir pressure constant representing the pore pressure at which the measured volumetric strain is equal to . From Equations (3) and (4), the effective stress in coal matrix, , can be modified as:
Combining Equations (2)–(5) yields the Navier-type equation expressed as:
Equation (6) is the general form of the governing equation for the deformation of the matrix and fracture, where the gas pressure can be solved from the gas flow equation as discussed below. It should be noted that if the gradient terms of pore pressure and sorption-induced swelling are treated as a body force, the stress at boundaries should be transformed as effective stresses. The discrepancy between the matrix and the fracture is embodied in different values of mechanical parameters in the governing equations:
where the subscripts, and , denote matrix and fracture, respectively.
As the propensity of the fracture to swell is stronger than the matrix, a compressive stress arises on the interface to satisfy deformation compatibility. This restricts the fracture expansion and enhances matrix swelling as illustrated in Figure 2. The strain for the matrix and the fracture can be expressed as:
where and are the strain at the interface for the fracture and the matrix, respectively, is the fracture pressure increment, is the induced interface stress, is the matrix strain induced by gas transport within the matrix and is the coefficient concerning the position and the geometry of the matrix and fracture. Due to equivalent strains of the fracture and the matrix at the interface, the induced interface stress can be expressed as:
The strain at the interface, , is then expressed as:
When equilibrium is achieved, the matrix strain induced by gas transport can be expressed as:
Substituting Equation (13) into Equation (12), the strain can be obtained as:
When the fracture is regarded as a void and the compressive stress equivalent to the fracture pressure is applied at the internal boundaries of the matrix, the strain at steady state can be expressed as:
From Equations (14) and (15), it can be seen that the two different treatments have an equivalent effect if the Young’s modulus of the fracture is reduced to zero.
2.3. Dynamic Permeability Model
Porosity, permeability and the grain-size distribution in porous media may be related via capillary models. Chilingar (1964) [38] defined this relation as:
where is the permeability, is porosity and is the effective diameter of grains. Based on this equation, one obtains:
where the subscript, 0, denotes the initial value of the variable. When the porosity is much smaller than 1 (normally less than 10%), the second term of the right-hand side asymptotes to unity. This yields the cubic relationship between permeability and porosity for the coal matrix:
Coal porosity can be defined as a function of the effective strain [2] as:
where is defined as the total effective volumetric strain increment, which is responsible for permeability change, is total volumetric strain increment, is the gas pressure increment, is the bulk modulus of the coal grains, is the compressive strain increment, and is gas sorption-induced volumetric strain increment. Substituting Equation (19) into Equation (18) yields the permeability ratio as:
Equations (19) and (21) define matrix porosity and permeability, which are derived based on the fundamental principles of poroelasticity and can be applied to the evolution of matrix porosity and permeability under variable boundary conditions.
The fracture permeability is usually defined by the well-known “cubic law” [39] and the fracture permeability ratio can be expressed as:
where is initial fracture aperture and is the fracture aperture change.
2.4. Governing Equation for Gas Flow within the Matrix
Conservation of mass for the gas phase is defined as:
where is the gas density, is the Darcy velocity vector, is the gas source or sink, is time, and is the gas content including free -phase gas and adsorbed gas [40], defined as:
where is the gas density at standard conditions, is the matrix density, is the matrix porosity, represents the Langmuir volume constant, and represents the Langmuir pressure constant. According to the ideal gas law, the relationship between gas density and pressure in the matrix is described as:
where is the molar mass of the gas, is the universal gas constant, and is the absolute gas temperature. From Equation (25), one obtains another expression for the gas density:
where,
where is the coefficient between the gas density and pressure, and are the temperature and gas pressure at standard conditions. From Equation (27), the coefficient, , depends on the temperature thus it is a constant for isothermal conditions.
Neglecting the effect of gravity, the Darcy velocity, , is defined as
where is the matrix permeability and is the dynamic viscosity of the gas. Substituting Equations (24) and (26)–(28) into Equation (23), yields,
2.5. Governing Equation for Gas Flow within Fractures
Gas transfer through fractures is also governed by the mass conservation relation of Equation (23), but it is rarely used in models of matrix-fracture interaction, due to its rapid equilibration. Usually, a time-injection pressure is specified for the fracture [27]:
where is the initial pressure, is the pressure increment due to gas injections, is the characteristic time for transport, and is the starting time for the gas injection.
From Equation (30), the partial differential equation of the fracture gas pressure can be expressed as:
2.6. Coupled Governing Equations
From Equations (4), (19) and (20), the partial derivative of matrix porosity with respect to time is expressed as:
Substituting Equation (32) into Equation (29) yields the governing equation for gas flow in the coal matrix with gas sorption as:
Equations (7), (21), (32) and (33) define the coupled gas flow and matrix deformation model, while Equations (8) and (30) form an uncoupled model for fracture gas pressure and fracture deformation.
The interaction between the matrix and the fracture is achieved by the stress specified on internal boundaries of the matrix induced by (a) the gas pressure in the fracture when the fracture is regarded as a void; or (b) the generated compressive stress due to fracture swelling due to the fracture gas pressure increasing when the fracture is treated as a soft inclusion.
3. Implementation and Simulation
3.1. Finite Element Implementation
The coupled processes of gas flow and coal deformation for the medium with a centrally-located void representing a fracture are defined by Equations (7), (21), (32) and (33), while those for the medium with a centrally-located soft inclusion are defined by Equations (7), (8), (21), and (30)–(33). The mathematical model comprises a fully coupled finite element approach which simultaneously solves the matrix pore pressure and the displacement of the coal matrix or fracture. COMSOL Multiphysics, a commercial partial differential equation (PDE) solver, is used as the platform for the implementation.
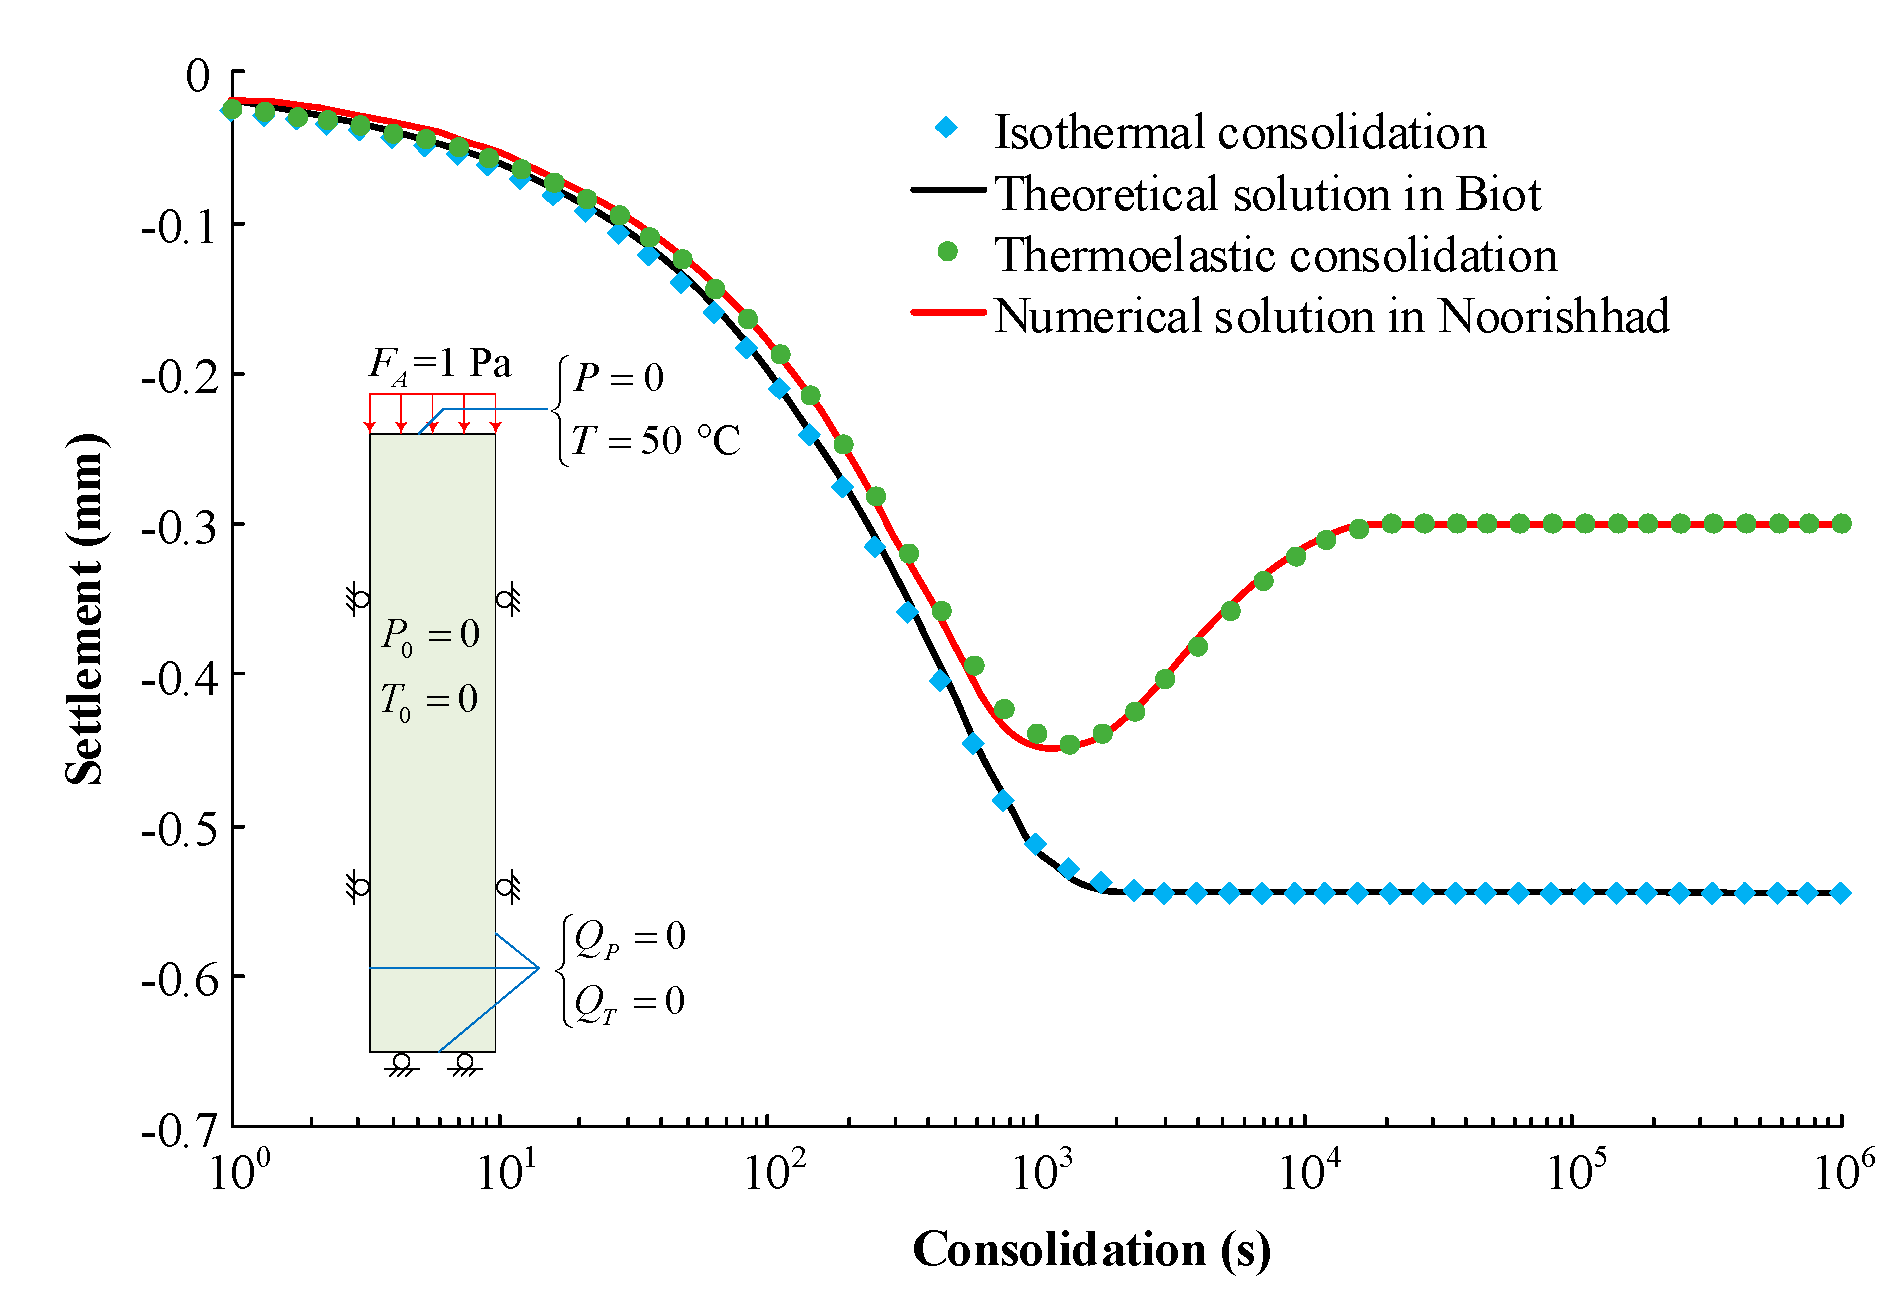
Exploiting the analogy between thermal contraction and matrix shrinkage, the typical example of the thermal consolidation of a column is used. The input data are given in Table 1. Both isothermal and thermoelastic consolidation are simulated and comparisons are made with the analytical solution of Biot [41] and the numerical solution of Noorishad et al. [42] (Figure 3). The excellent match establishes the validity of our modeling approach.
3.2. Simulations
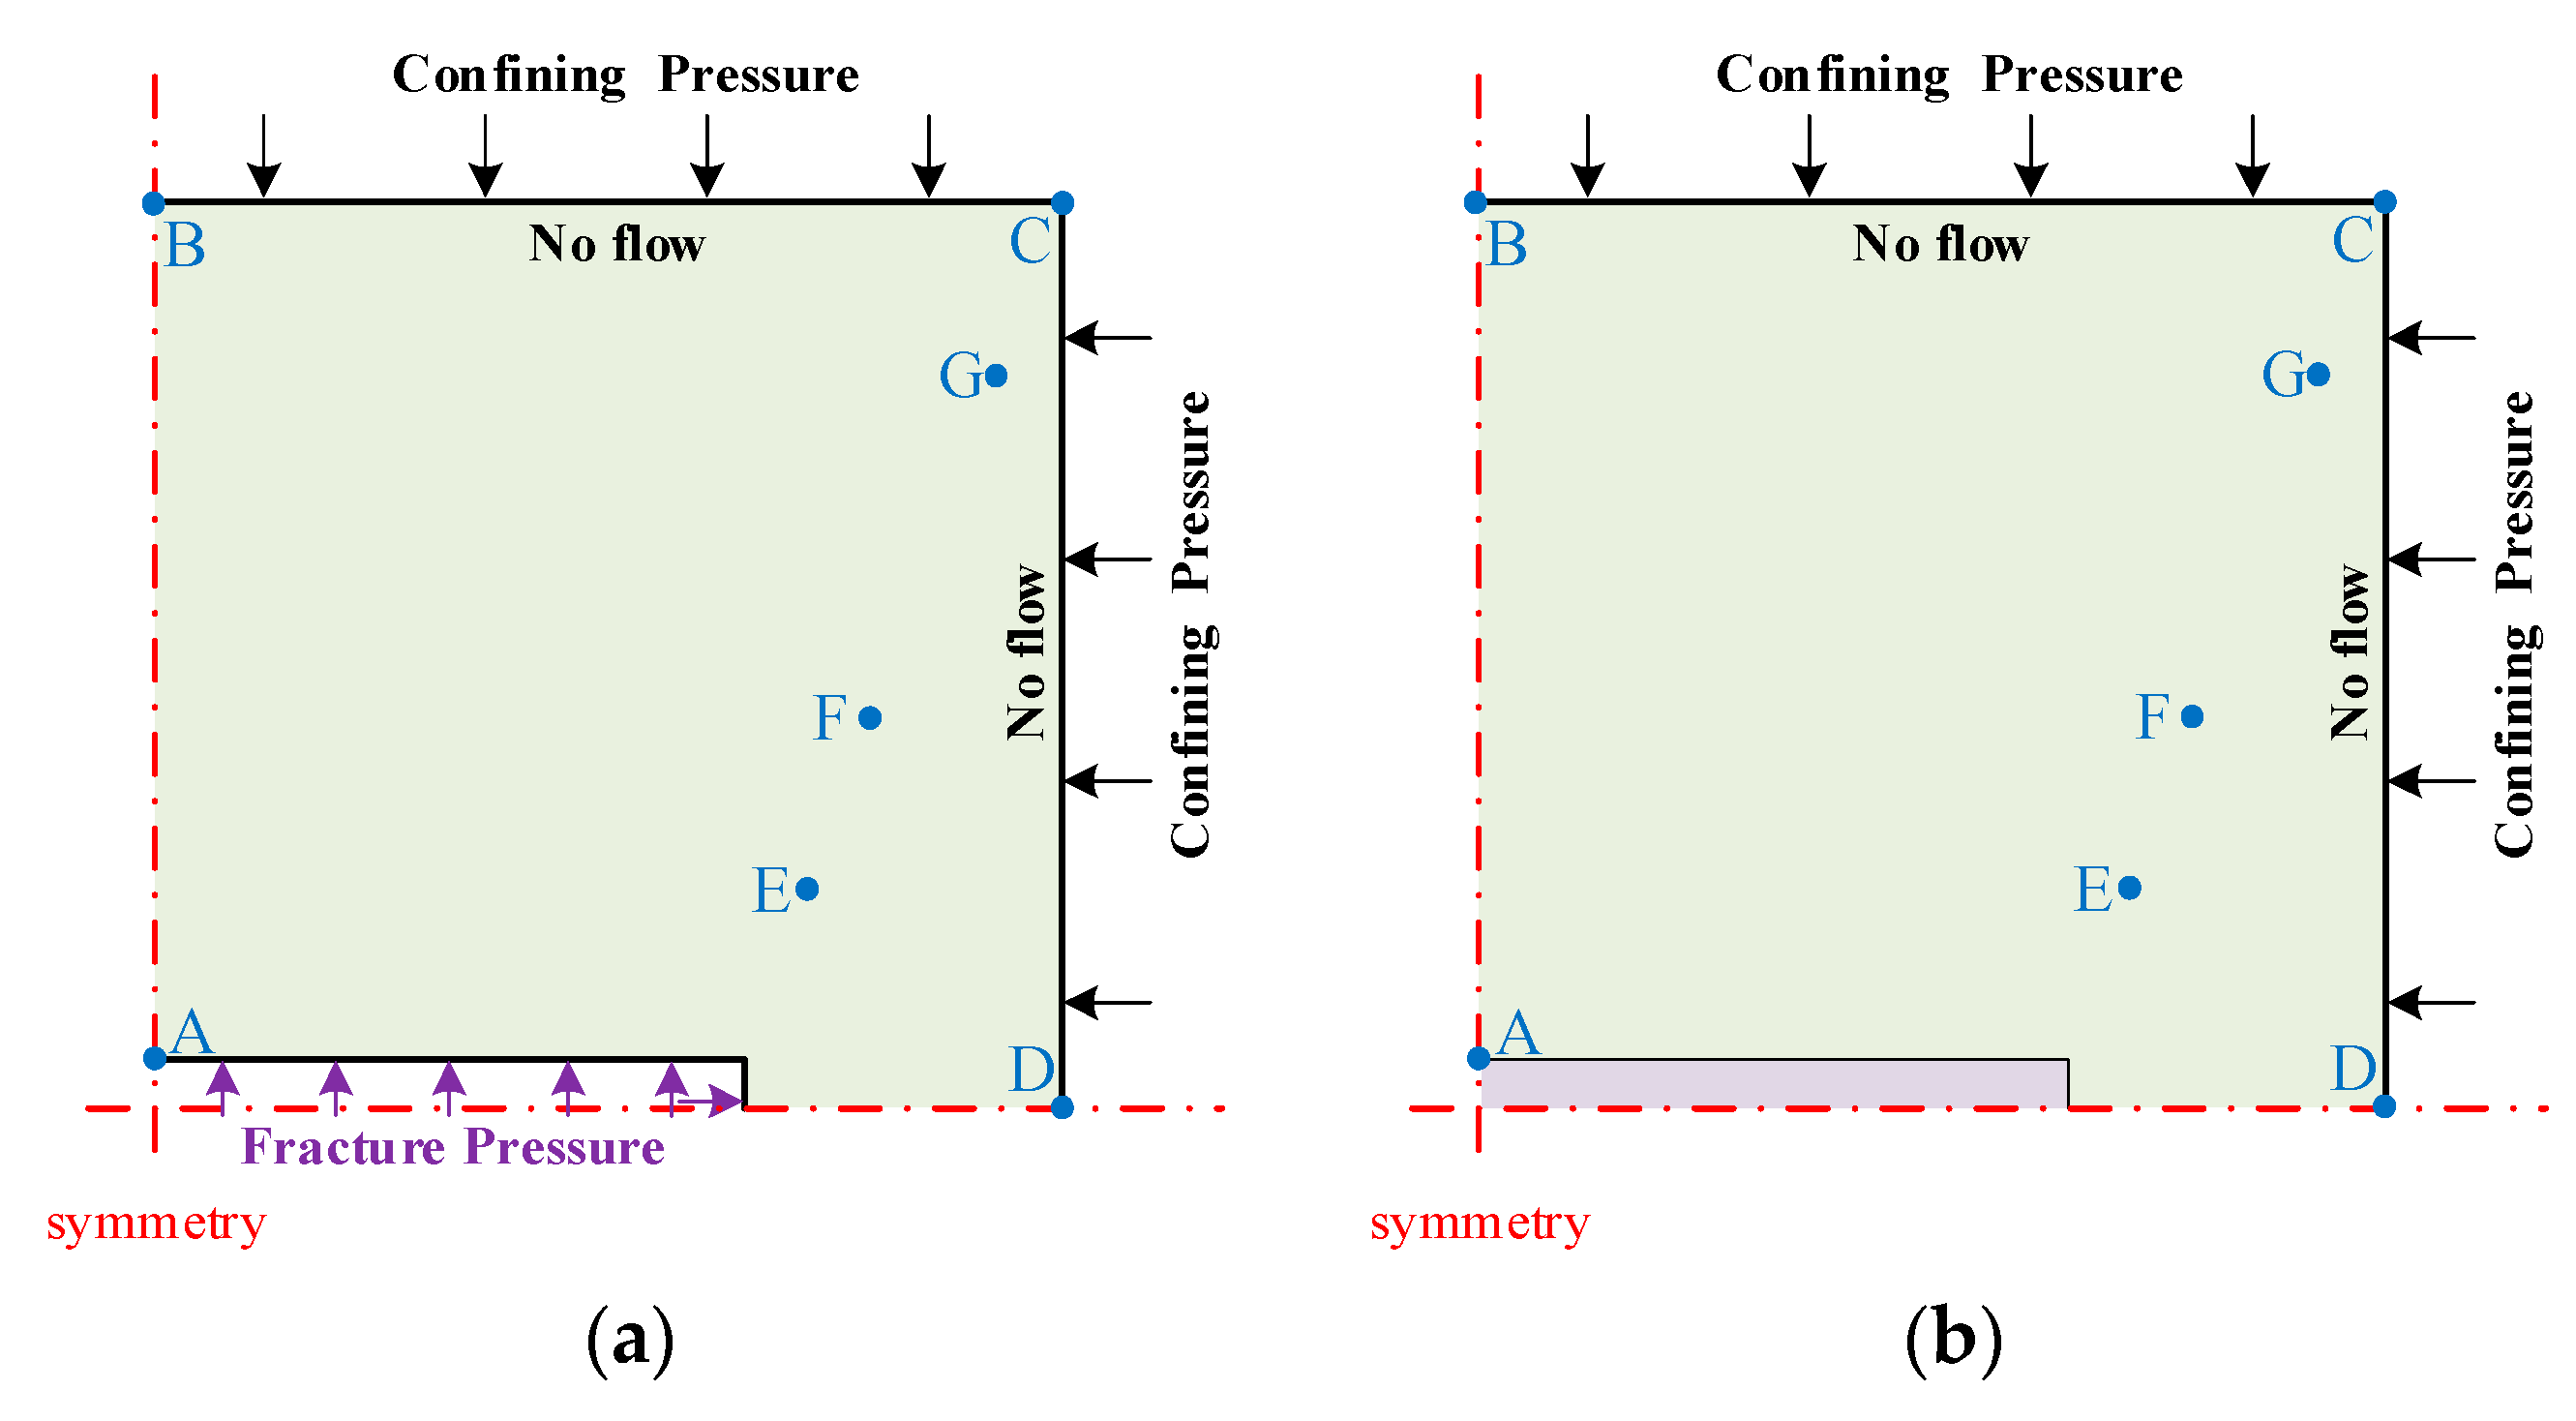
The simulation geometry is 10 mm by 10 mm with a fracture located at the center. The fracture is 5 mm in length and 0.5 mm in width. As shown in Figure 1b, all the simulation models exhibit horizontal and vertical symmetry. Because of the different treatment of the fracture, appropriate boundary conditions must be applied as shown in Figure 4:
- The fracture is regarded as void. For the deformation model, the confining stress is applied to all the external boundaries and the fracture pressure (injection pressure) is applied to the internal boundaries. For gas flow, the injection pressure in Equation (30) is applied to the internal boundaries and no flow conditions are applied to all the external boundaries.
- The fracture is regarded as a soft inclusion without sorption. For the deformation model, the confining stress is applied to all the external boundaries. For the gas flow model, no flow conditions are applied to all the external boundaries.
Firstly, one numerical simulation using the fracture void is conducted to investigate the evolution of fracture aperture, matrix permeability and bulk deformation and to quantify the effects of the change in (M1) the matrix pressure and (M2) the fracture pressure. With the assumption of linear elasticity, the effect of the matrix pressure change can be decomposed into that of (M1a) the body force, (M1b) the effective stress change induced by pore pressure increase on internal boundaries, and (M1c) the effective stress change induced by pore pressure increase on internal boundaries. Input parameters are listed in Table 2 and the values of these parameters are chosen from the literature [2,8]. Then, a series of numerical conditions as listed in Table 3 are simulated to investigate the impacts of factors, involving fracture properties, matrix permeability, injection processes and confining pressure, on the matrix–fracture interaction.
4. Results and Discussion
4.1. Analysis of Evolving Mechanisms
As shown in Equation (30), we use the characteristic time to define the injection process—a smaller characteristic injection time indicates faster injection. If the characteristic injection time is extremely small, then the fracture pressure reaches the maximum pressure (essentially) immediately. In this simulation, the characteristic time is set to 5 s to replicate a very rapid injection process.
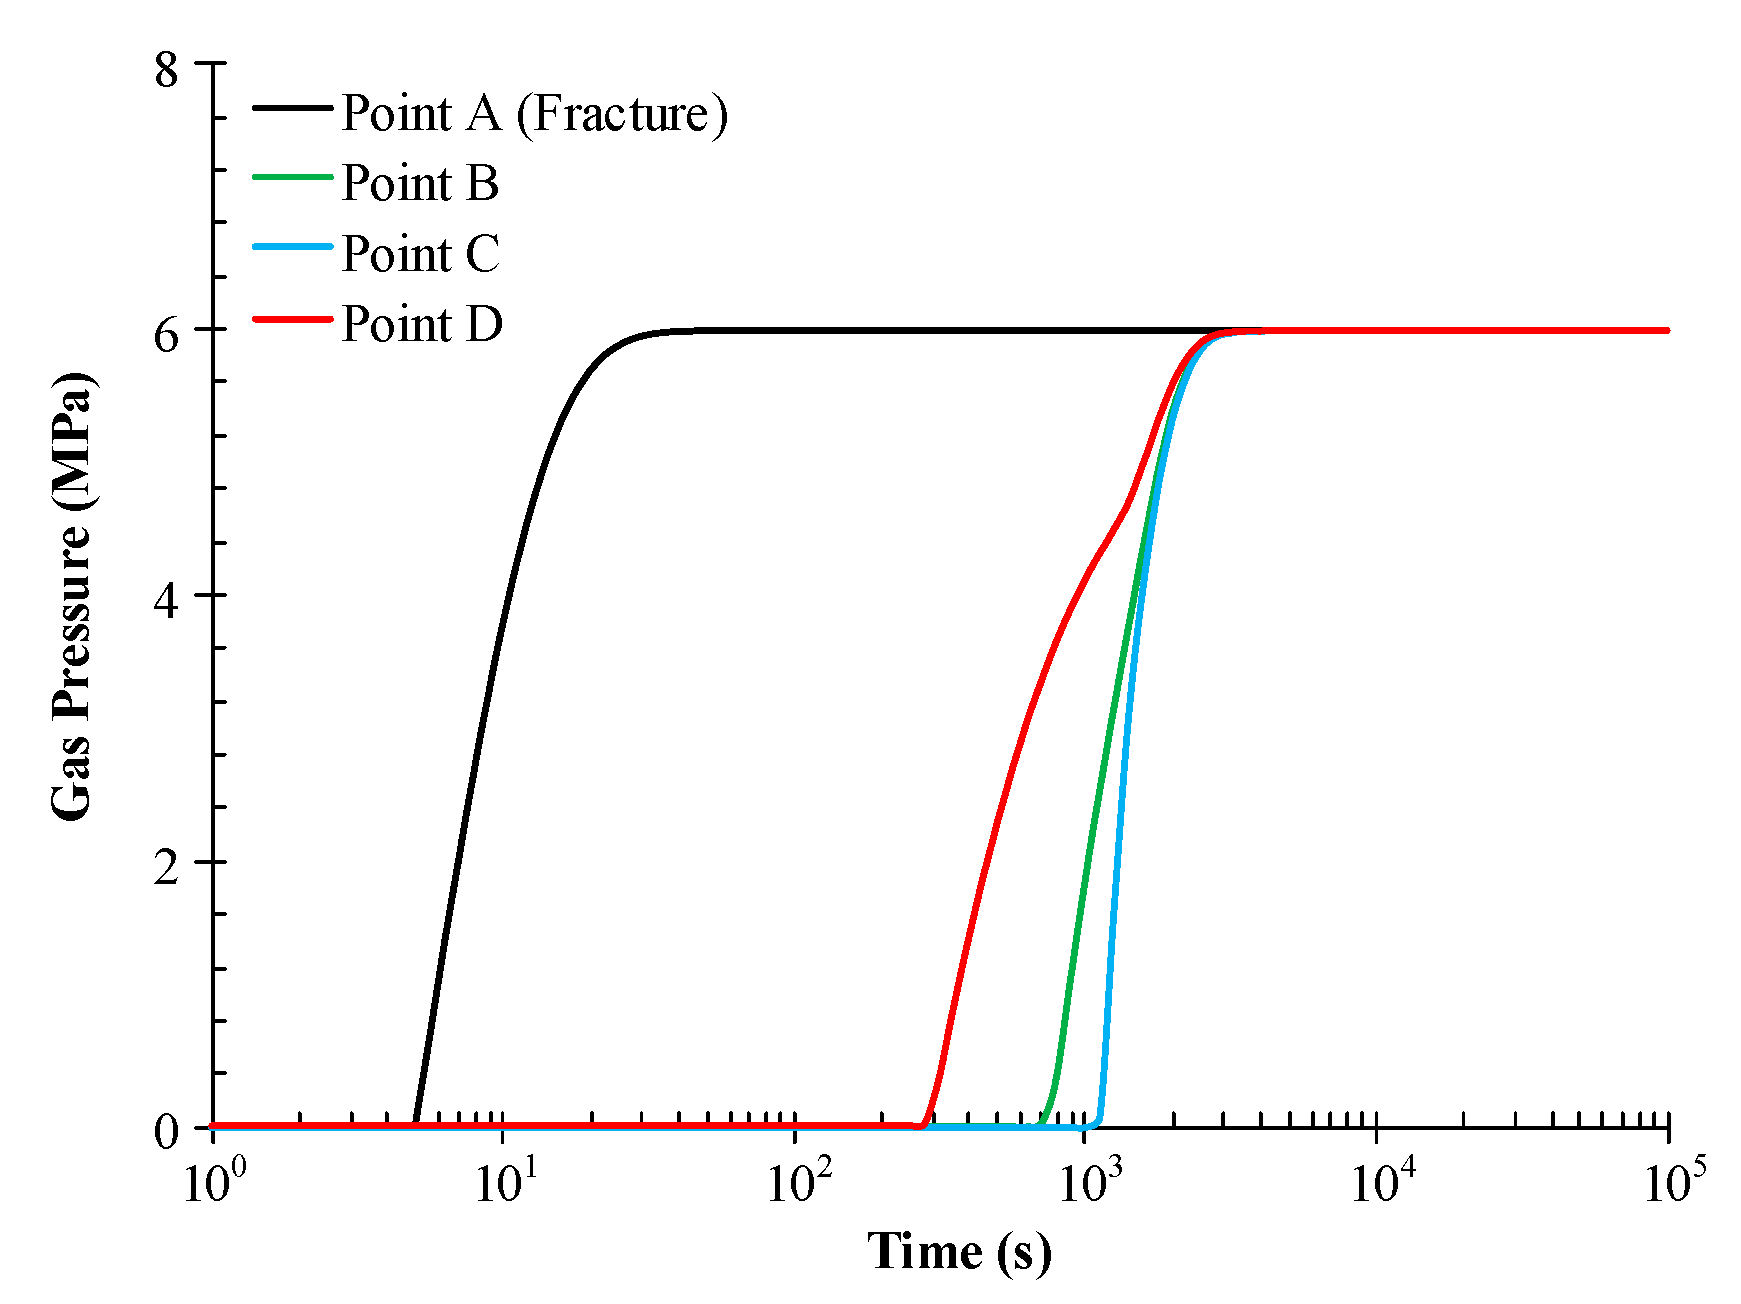
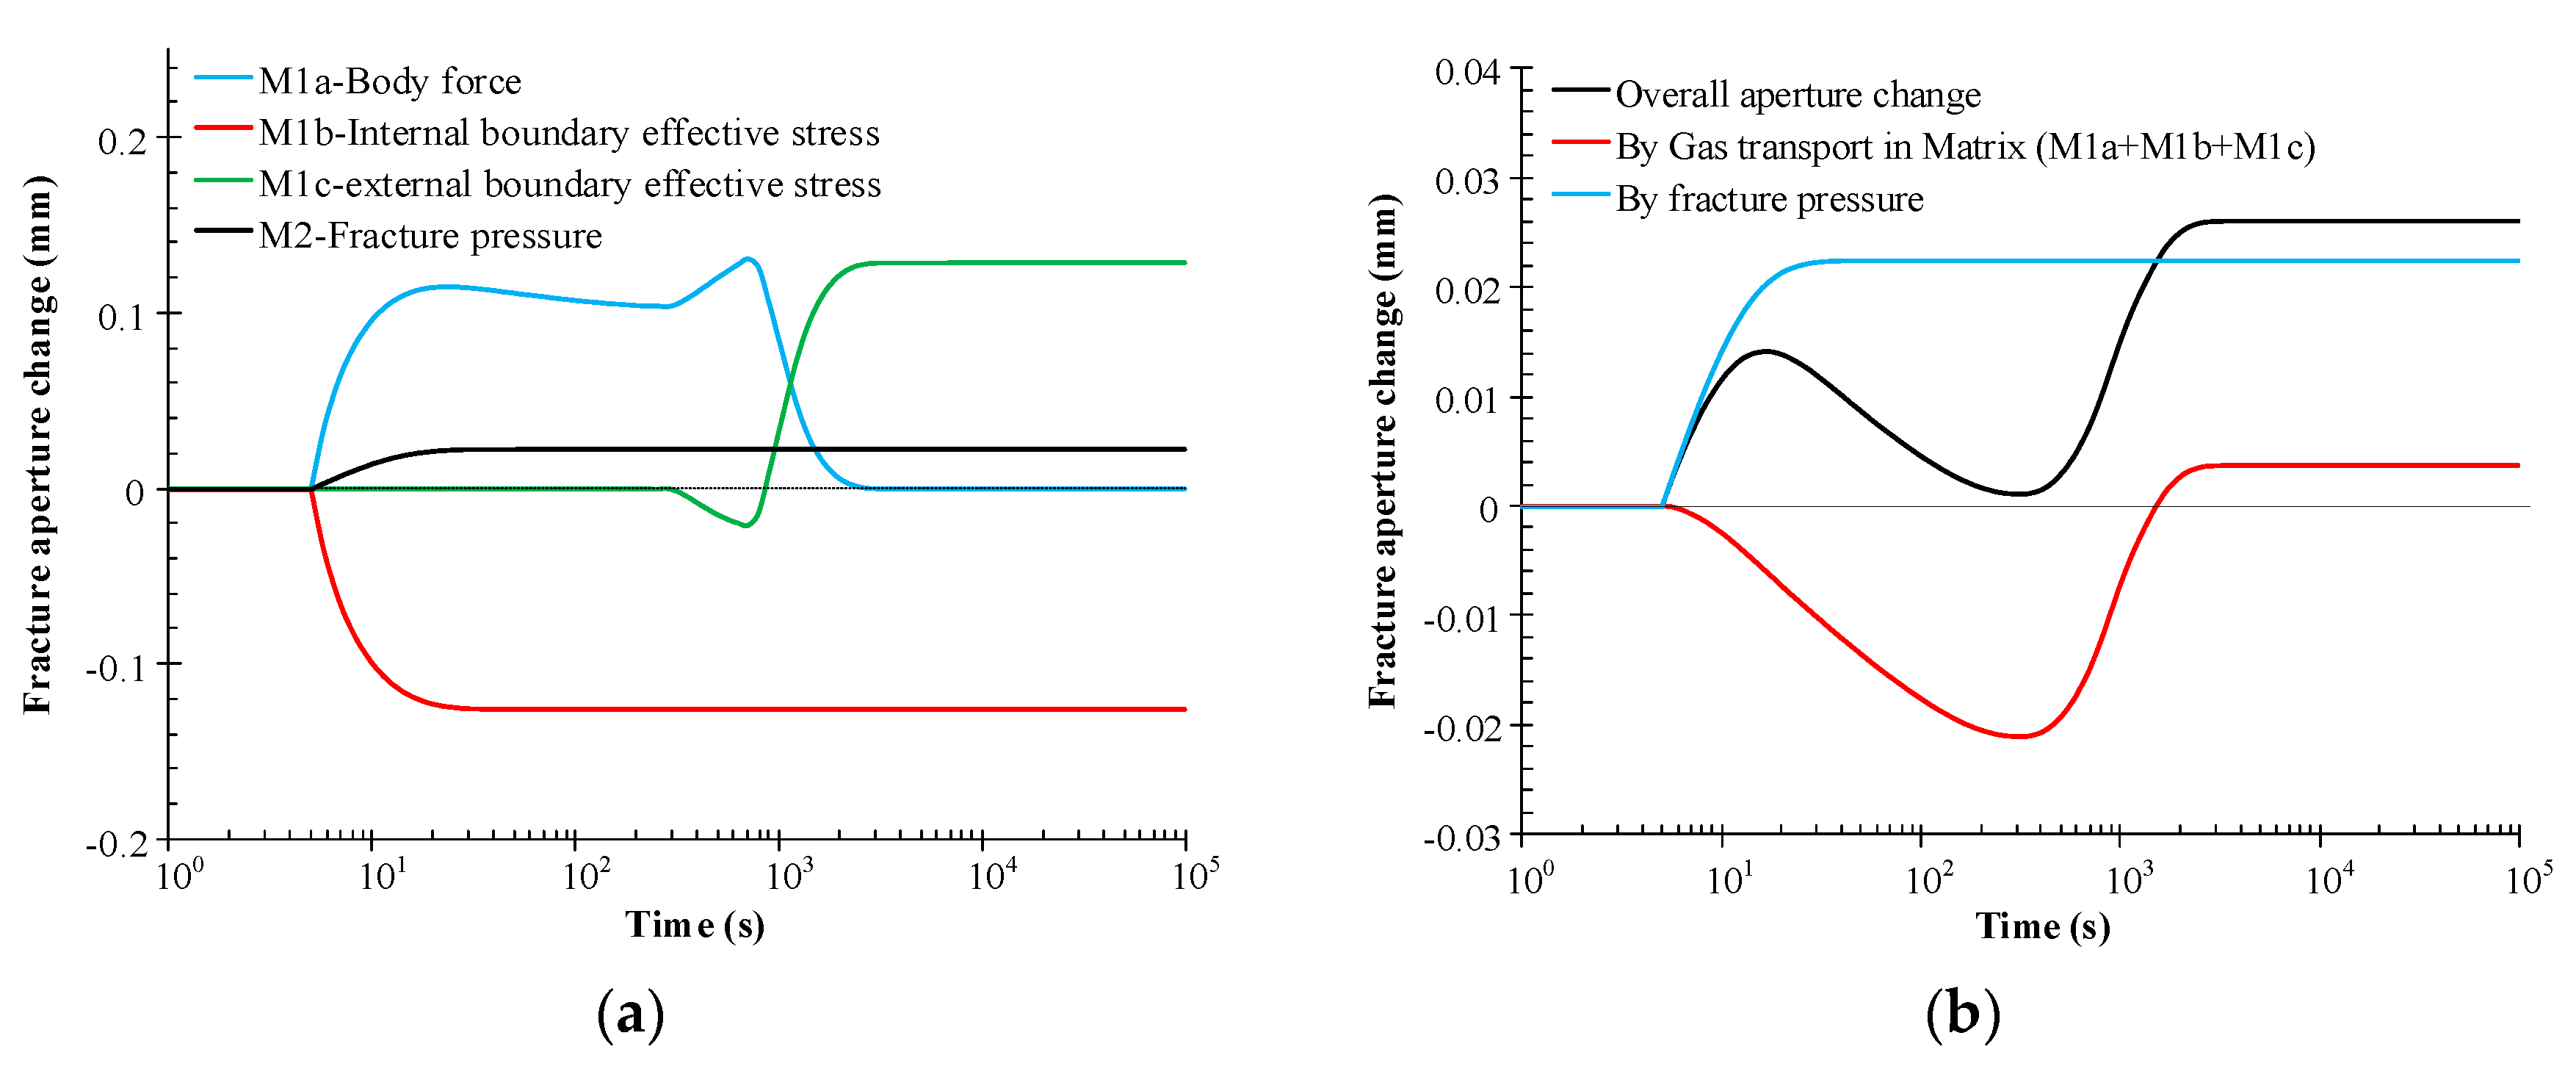
As discussed in Section 2, the changes in fracture pressure, body force and effective stress at boundaries are three influencing factors and they are all related to the pressure. The pressure evolutions at four representative points within the medium are shown in Figure 5 and the evolutions of fracture aperture due to different mechanisms are shown in Figure 6a,b. Four representative points are chosen to illustrate the area of gas propagation within the matrix and to interpret the various mechanical responses. The pressure at Point A represents the fracture pressure, which acts as an internal boundary stress applied to the matrix and opens the fracture due to matrix contraction; Point B and Point D are the nearest external points in the horizontal and vertical directions, respectively, which represent the initiation of gas storage and the effective stress change at the external boundaries; Point C is the furthest external point within the matrix and represents the lowest zone to gain gas increase. From Figure 5, the fracture pressure reaches a maximum pressure at about 40 s, Point D and Point B begin to increase gas pressure at about 300 s and 700 s, respectively and the gas propagates to all external boundaries of the matrix at about 1000 s. As shown in Figure 6a,b, these four representative times are closely related to the deformation induced by different mechanisms:
- (1)
- Gas injection with increasing pressure inflates the fracture due to an increase in the external stress applied to the internal boundaries but narrows the fracture aperture due to the increase of the pore pressure on the internal boundaries. These two effects are enhanced from 5 s to 40 s due to the continuous increase in fracture pressure and remain unchanged after the fracture pressure reaches the maximum. It should be noted that the effect of the body force is determined by the gas pressure gradient in the matrix, thus it can be influenced by the increasing rate of the fracture pressure rather than the fracture pressure itself.
- (2)
- From 40 s to 300 s, the fracture pressure remains constant, causing no change to the opening or narrowing effects induced by effective stress on the internal boundaries, and the pore pressure on the external boundaries remains at the initial value. This induces no change in effective stress on the external boundaries and has a null effect on fracture aperture change. However, the opening effect induced by the body force is slightly weakened as the gas propagates into the matrix.
- (3)
- From 300 s to 700 s, the pore pressure on the external vertical boundaries increases gradually and the pressure gradient on the boundary further drives gas transport inside. During this period, the horizontal body force decreases while the vertical body force continues to increase, leading to the enhanced opening of the fracture. The pore pressure increase on the external vertical boundaries results in a horizontal stress, leading to the narrowing of the fracture.
- (4)
- From 700 s to 4000 s, the pore pressure on the external horizontal boundaries increases gradually, and the gas is transported from the center to the corner as driven by the pressure gradient. During this period, both horizontal and vertical body forces decrease, and the fracture recovers from the opening state. The pore pressure increase on the external horizontal boundaries generates vertical stress. This leads to the fracture opening after counteracting the narrowing effect of horizontal stress on the external vertical boundaries.
- (5)
- From 4000 s, the pore pressure in the whole matrix is equalized with the fracture pressure, and an ultimate equilibrium state is achieved.
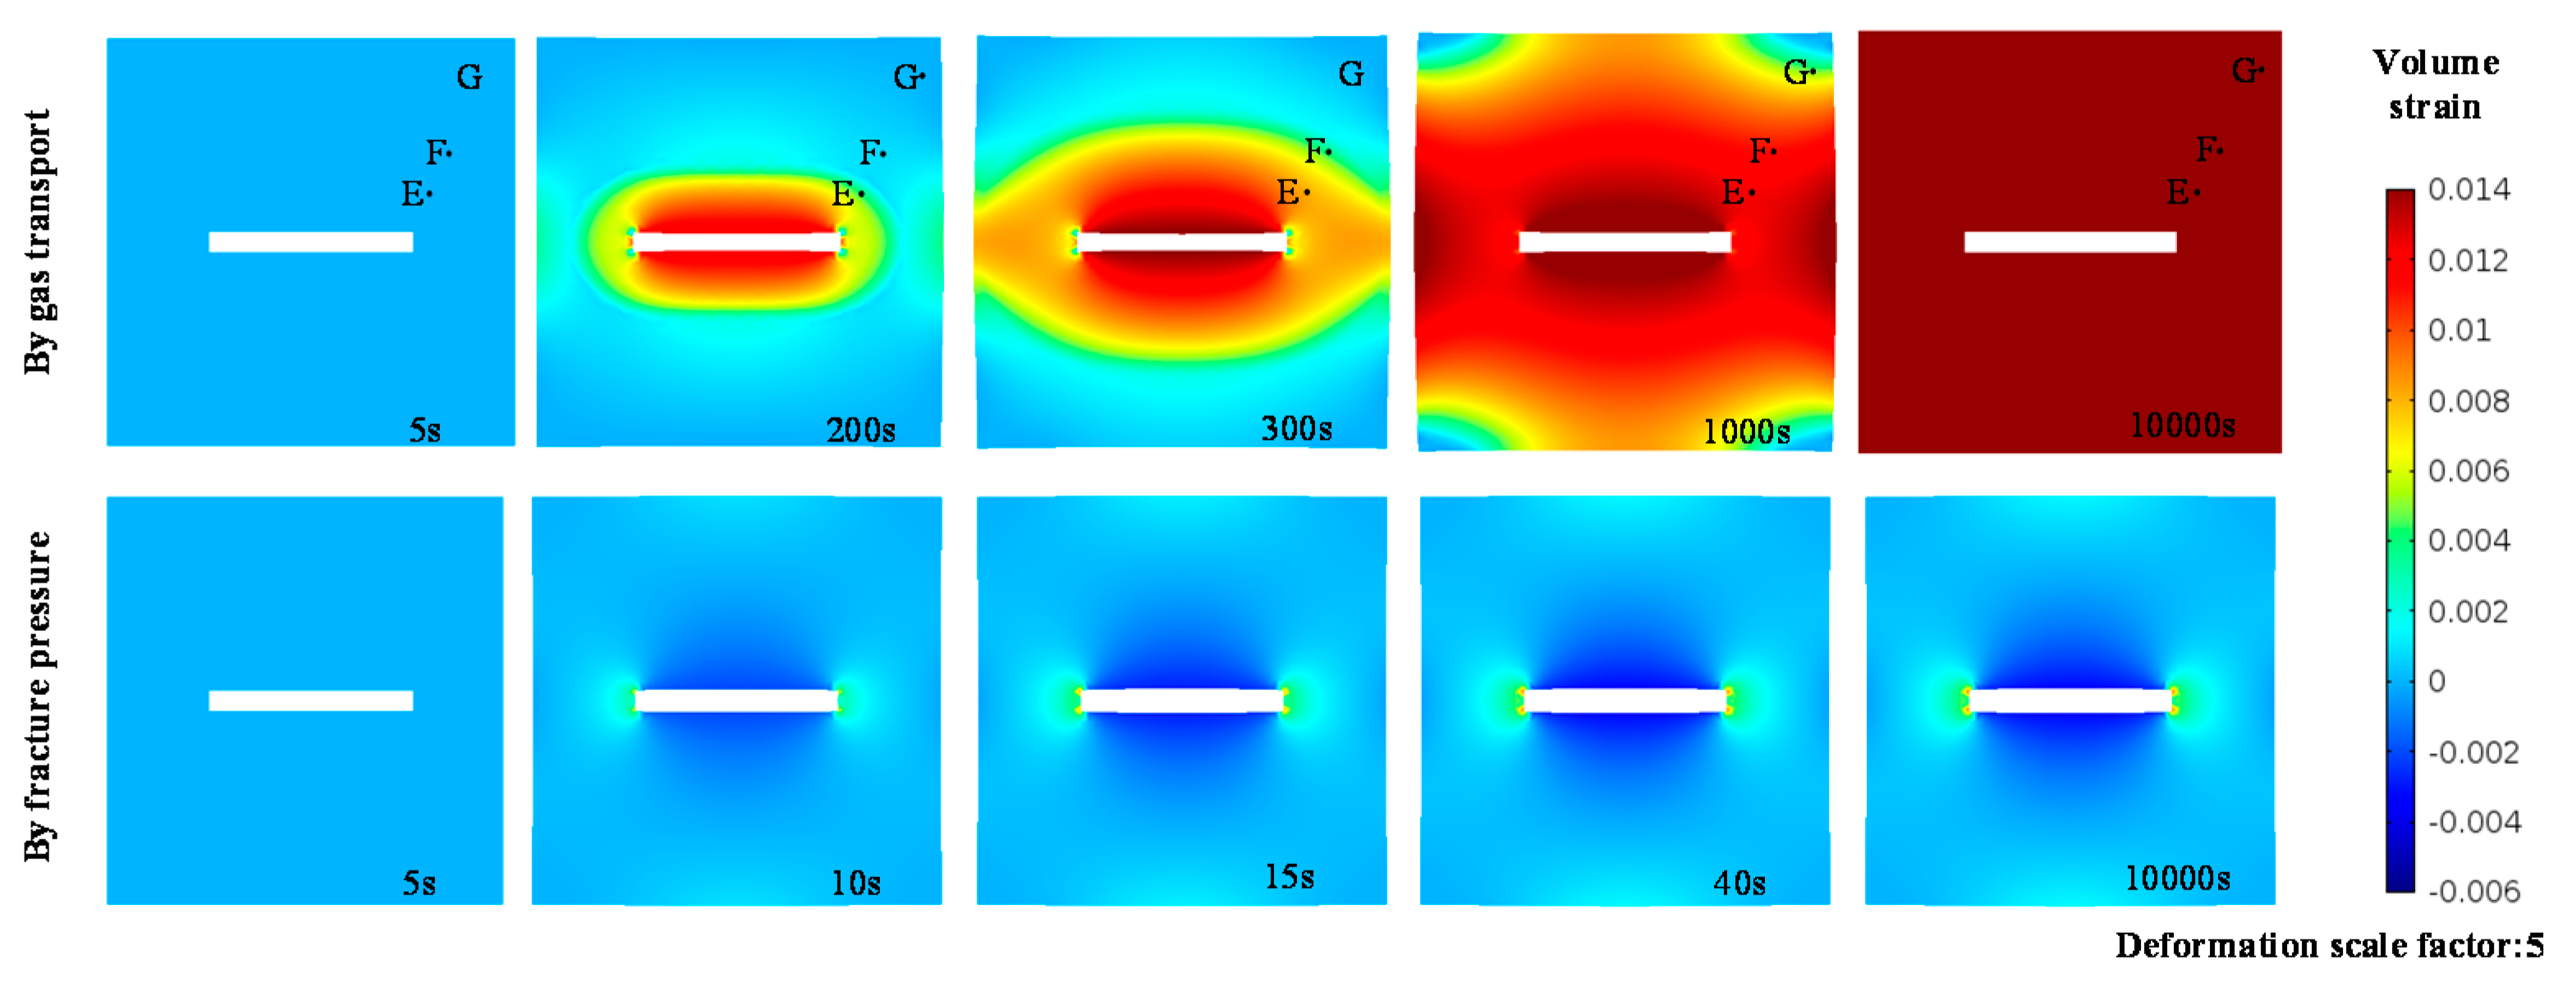
If the effects of the body force and the effective stress change on the boundaries are combined and called the “effect of gas transport in the matrix” as shown in Figure 6b, the fracture would first narrow and then rebound. The maximum reduction in fracture aperture induced by gas transport in the matrix is 0.021 mm and the final fracture aperture increment is 0.003 mm. The trend of fracture aperture change is similar to our previous results [2,37] that are obtained by ignoring the mechanical effects of fracture pressure under the free swelling condition. Furthermore, it has been proposed that a switch occurs from constant volume to constant stress boundaries during the stress-controlled coal swelling process and the critical pressure or permeability should be used to define this boundary switch [27,43]. Clearly, the concept of such a switch on the external boundaries is not reasonable due to the reality of unchanged boundary conditions. For the case of rapid injection under unconstrained boundary conditions, the fracture still experiences a narrowing trend with injection time, and the critical time for the fracture aperture rebound is at about 300 s, the time at which the pressure at the nearest point on the external boundaries increases. The effects of gas transport in the matrix and fracture pressure on the bulk deformation are expressed in terms of the displacement of Point B and Point D as shown in Figure 7. It can be seen that the gas transport process causes the matrix to experience a transition from contraction to expansion in the vertical direction due to the rectangular geometry of the fracture. Although the horizontal expansion is greater than that in the vertical during gas transport, the discrepancy between horizontal and vertical expansion would vanish as a final equilibrium state results. The final values of both vertical and horizontal displacements is 0.075 mm. The equivalent effective stress change in terms of pore pressure produces a uniform volume strain in the matrix, leading to the equivalent bulk deformation in all directions and uniform matrix permeability as shown in Figure 8. At 300 s, the ratio of the vertical displacement to the final displacement is ~10%, while the ratio of the horizontal displacement to the final displacement is ~61%, meaning that the assumption of a constant volume condition before the switch is triggered may result in unacceptable errors.
If the effect of fracture pressure increase is incorporated, the fracture aperture would increase, first due to the stronger opening effect induced by the fracture pressure that overcomes the narrowing effect induced by gas transport in the vicinity of the fracture. This will then decrease due to the narrowing effect as the dominant mode with a final recovery to a stable value due to the expansion of gas invasion area. From Figure 6b, it is apparent that the fracture aperture change has a peak value of 0.014 mm and a minimum trough of 0.001 mm; the final value is obviously enlarged (from 0.004 mm to 0.026 mm). As shown in Figure 7, the bulk deformation of the matrix shows a horizontal contraction and vertical expansion with the fracture pressure exerted on the rectangular fracture surface. Consequently, the entire matrix would have a larger vertical expansion than the horizontal expansion, demonstrating the heterogeneity of the matrix imposed by the fracture geometry.
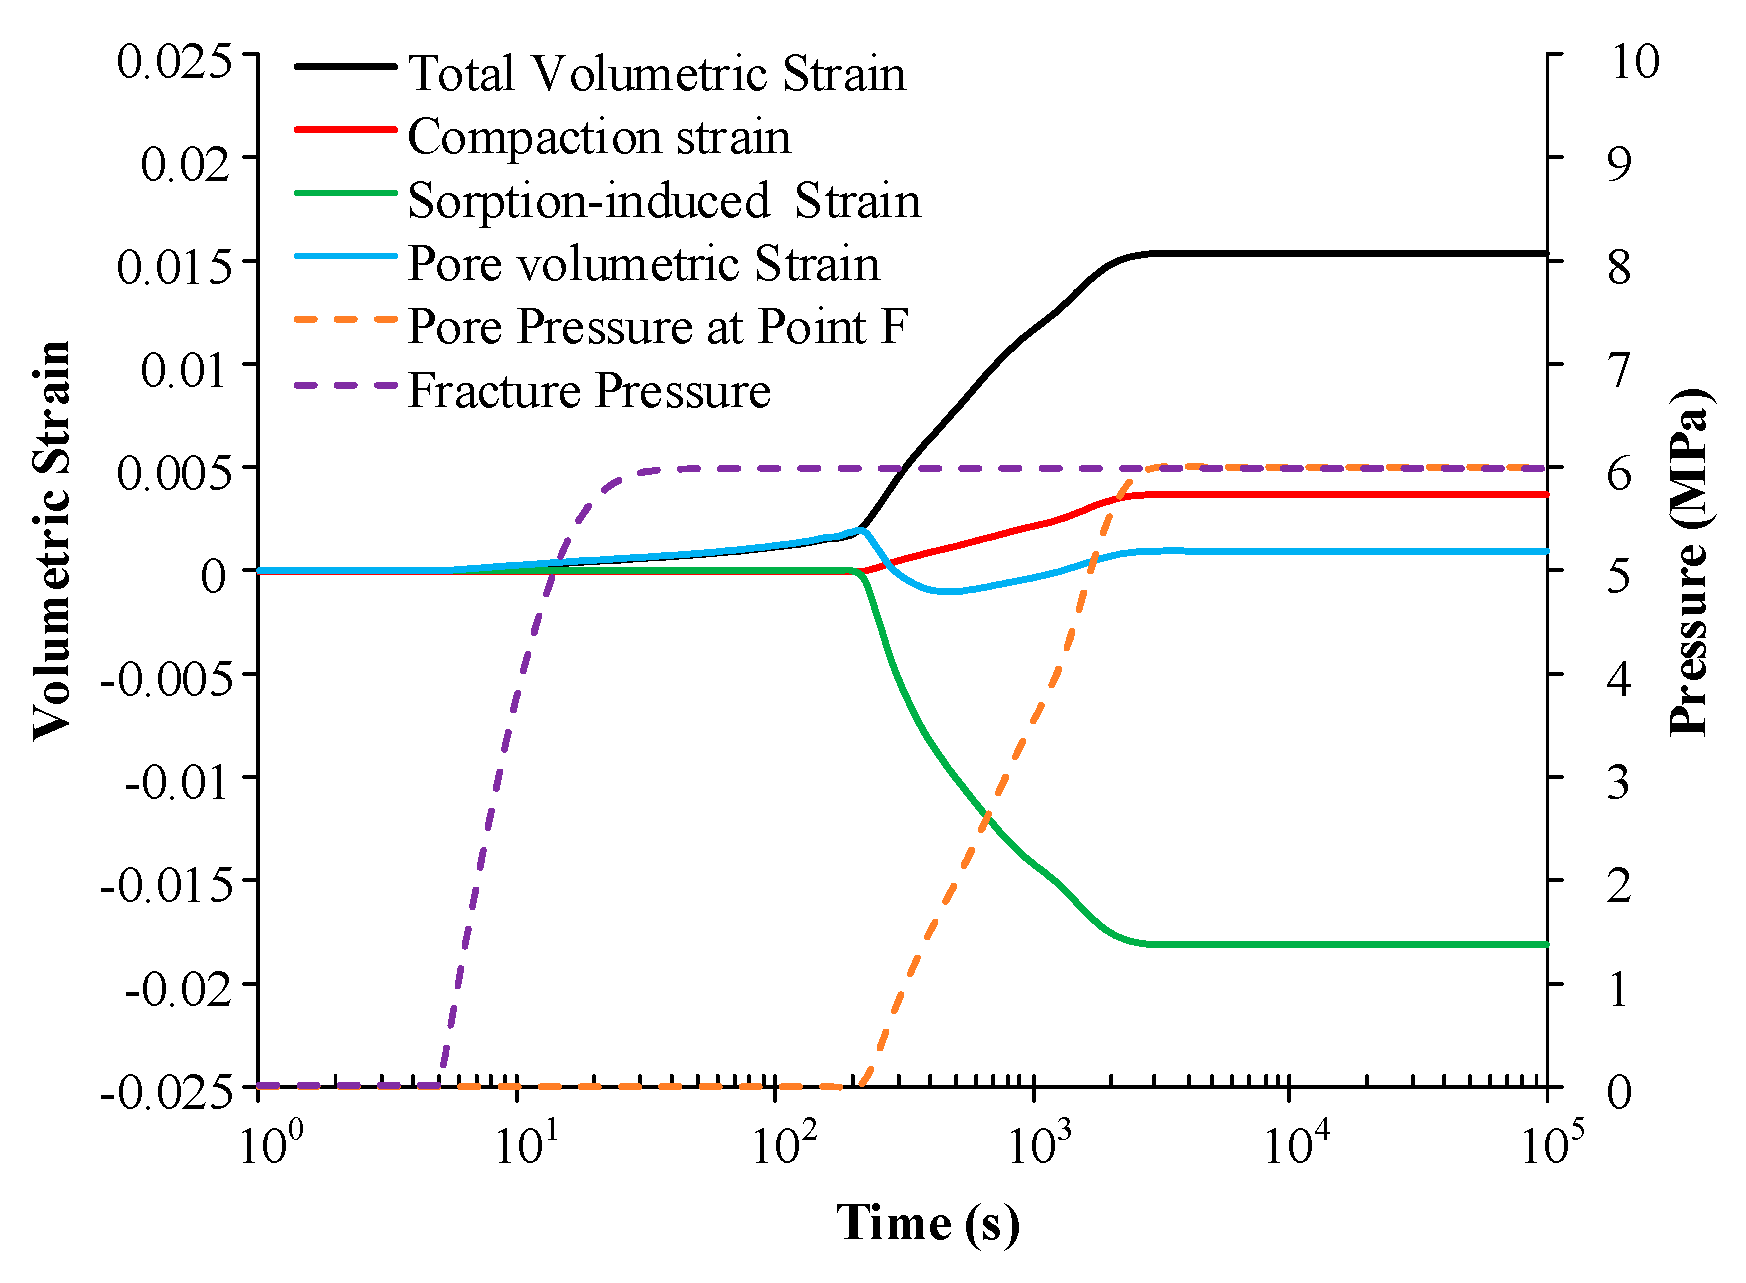
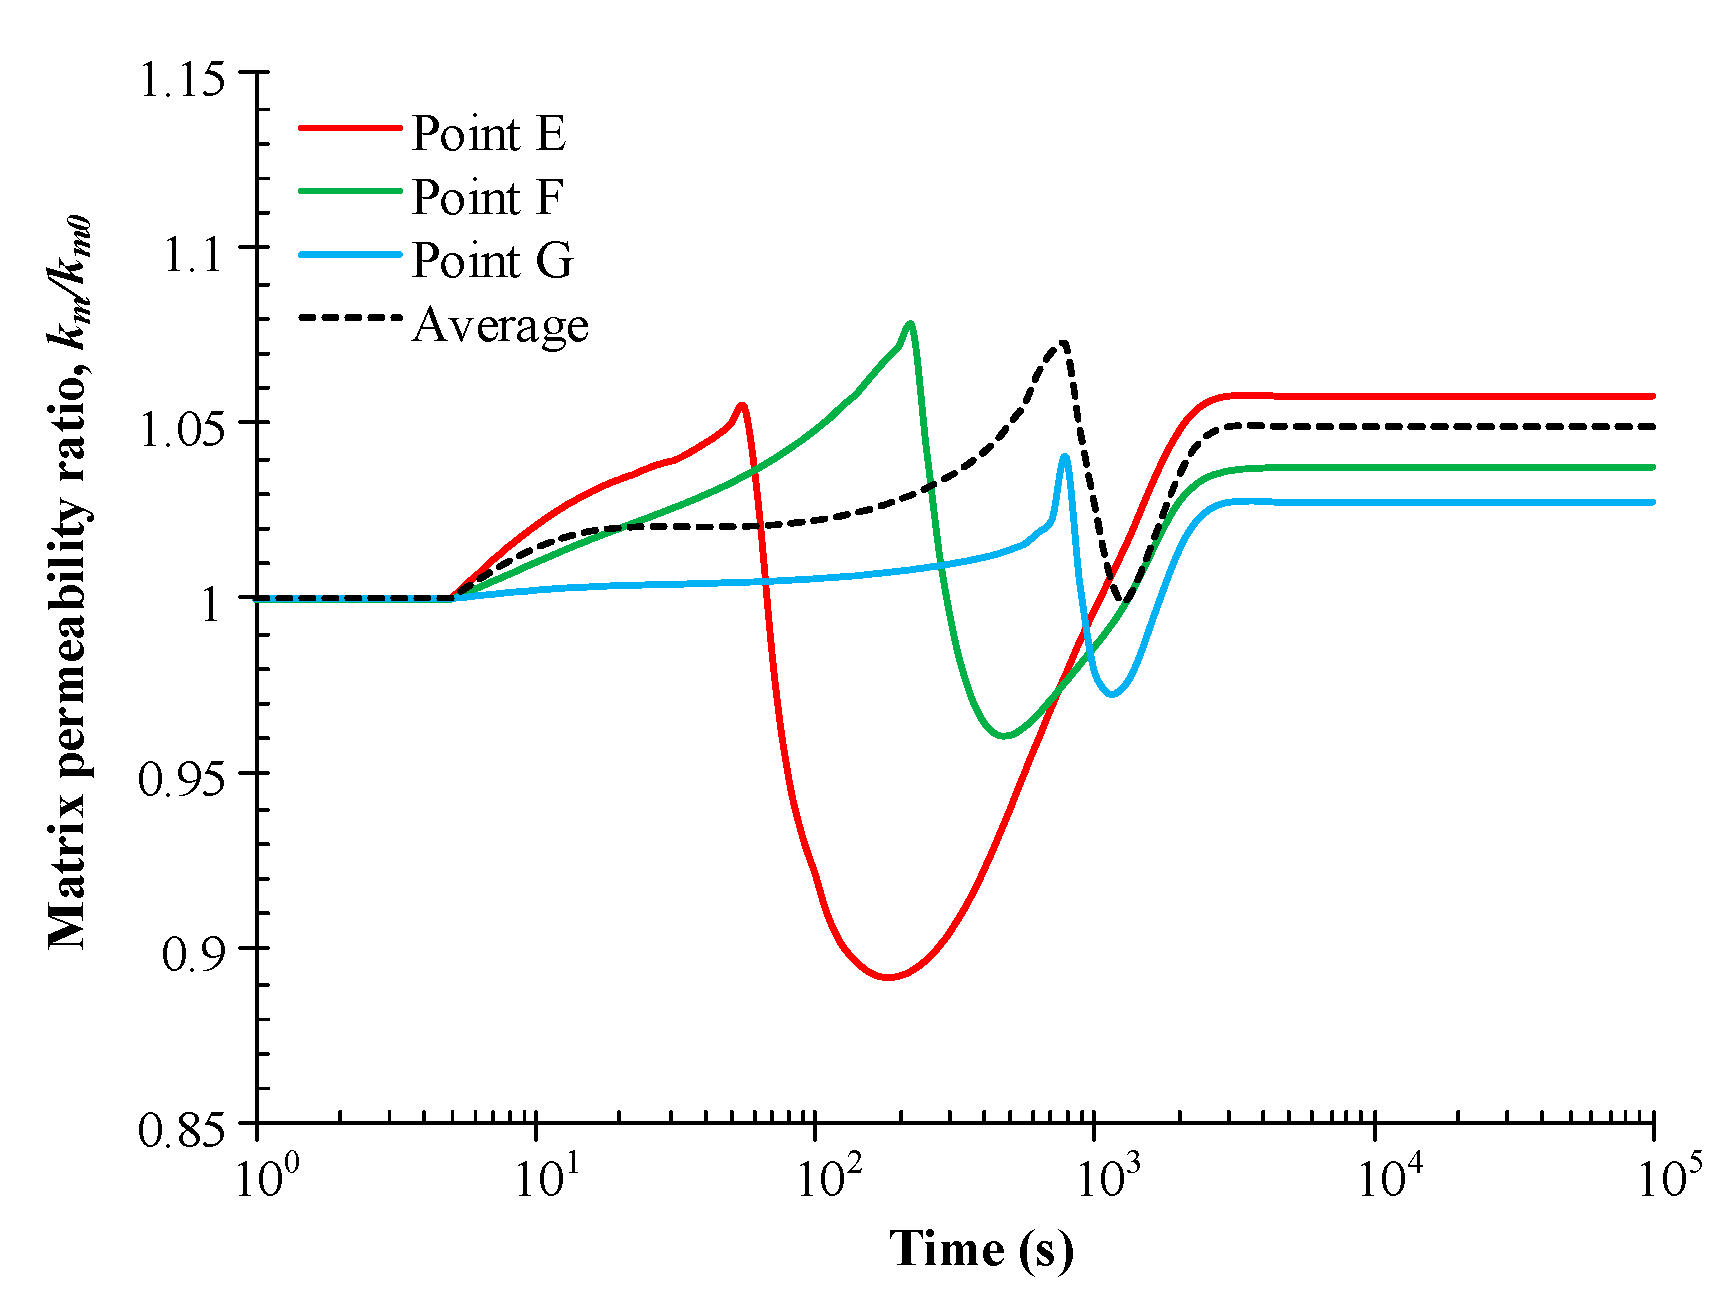
The matrix permeability is also significant in controlling the coupled process and its evolution controls the gas transport behavior during gas transport in the matrix. It is clear that the matrix permeability varies with the change in volume strain, grain compression strain and sorption-induced strain (see Equations (19) and (20)). Figure 9 shows typical volumetric strain and pressure evolution in the matrix domain at Point F, and Figure 10 presents the temporal evolution of permeability ratio for three domain points. As shown in Figure 9, the gas storage increases at Point E when t = 200 s, before which the matrix volumetric strain is influenced by the fracture pressure increase and the gas transport in the propagating zone. After 200 s, the volumetric strain is influenced by the pressure-based sorption-induced strain and grain compaction strain. As a result, the effective volumetric strain for the matrix pores also experiences an increasing-then-decreasing-then-increasing period, leading to the same trend in matrix permeability as shown in Figure 10. Moreover, the permeability evolution of three fiducial points within the domain all exhibit similar trends, despite different switch times and different peak values, troughs and final values of the permeability ratio due to different positions relative to the fracture. These demonstrate the distinct spatial and temporal characteristics within fracture and matrix during gas transport from the fracture to the matrix.
4.2. Impacts of Fracture Properties
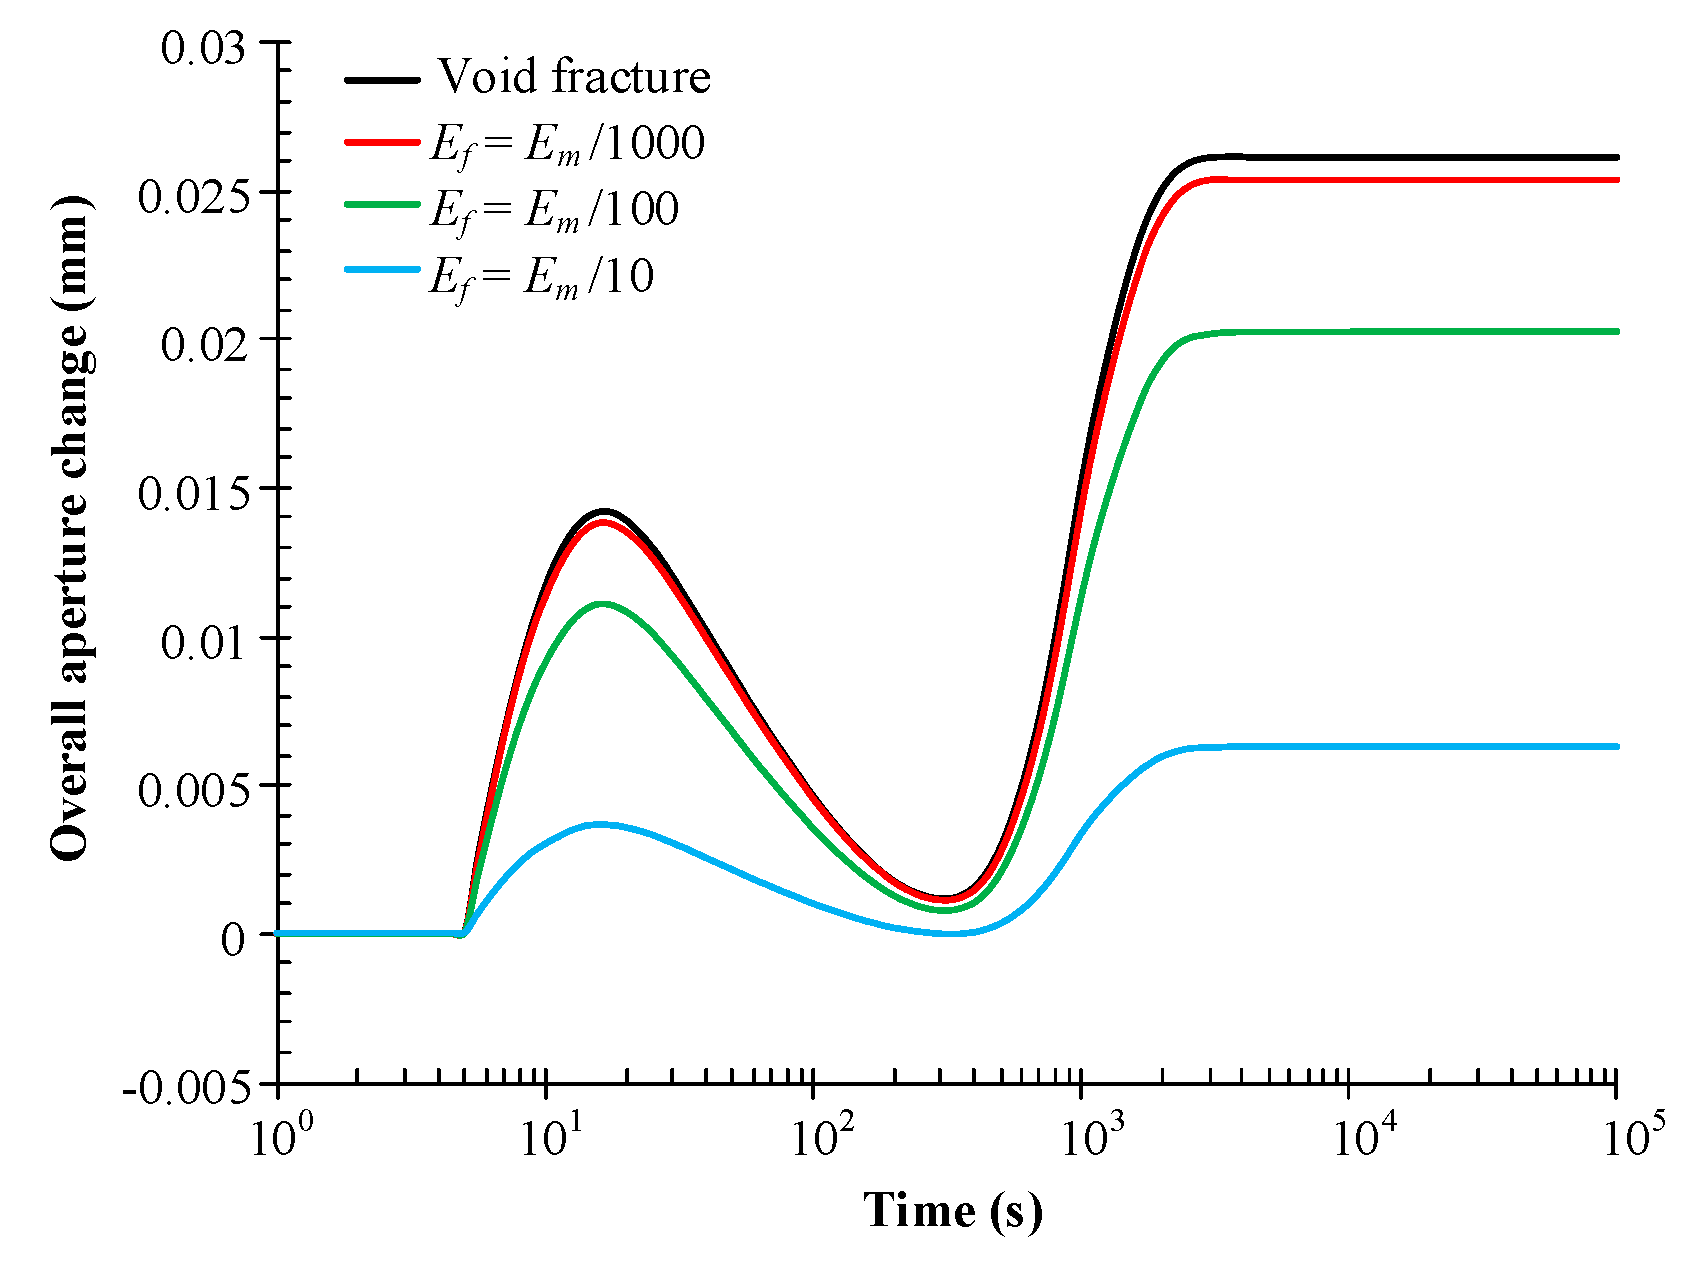
Two different treatments of the fracture are used in this section to investigate and compare the impacts of fracture properties on the fracture aperture change. Figure 11 illustrates the evolution of fracture aperture change due to different fracture properties. The Young’s modulus of the fracture is varied from 395 MPa to 3.95 MPa when the fracture is regarded as a soft inclusion. The results show that Young’s modulus has a significant effects on the evolution of fracture aperture change. Although the evolution of the fracture aperture change shows the same trend in all three cases, the magnitudes of the peak, the trough and the final fracture aperture vary in each case due to the different Young’s moduli of the fracture. As the Young’s modulus increases from 3.95 MPa to 395 MPa, the peak value increases from 0.0036 mm to 0.0138 mm, the value of the trough increases from −4 × 10⁻⁵ mm to 0.0011 mm and the final value increases from 0.0062 mm to 0.025 mm. It is notable that the evolution of the fracture aperture approaches that of the case with a fracture void when the Young’s modulus of the fracture is reduced to one thousandth of the matrix Young’s modulus. This suggests that a reduction factor for the stress induced by fracture pressure increase on the internal surfaces may be considered due to the presence of coal fragment or of proppant.
4.3. Impacts of Initial Matrix Permeability
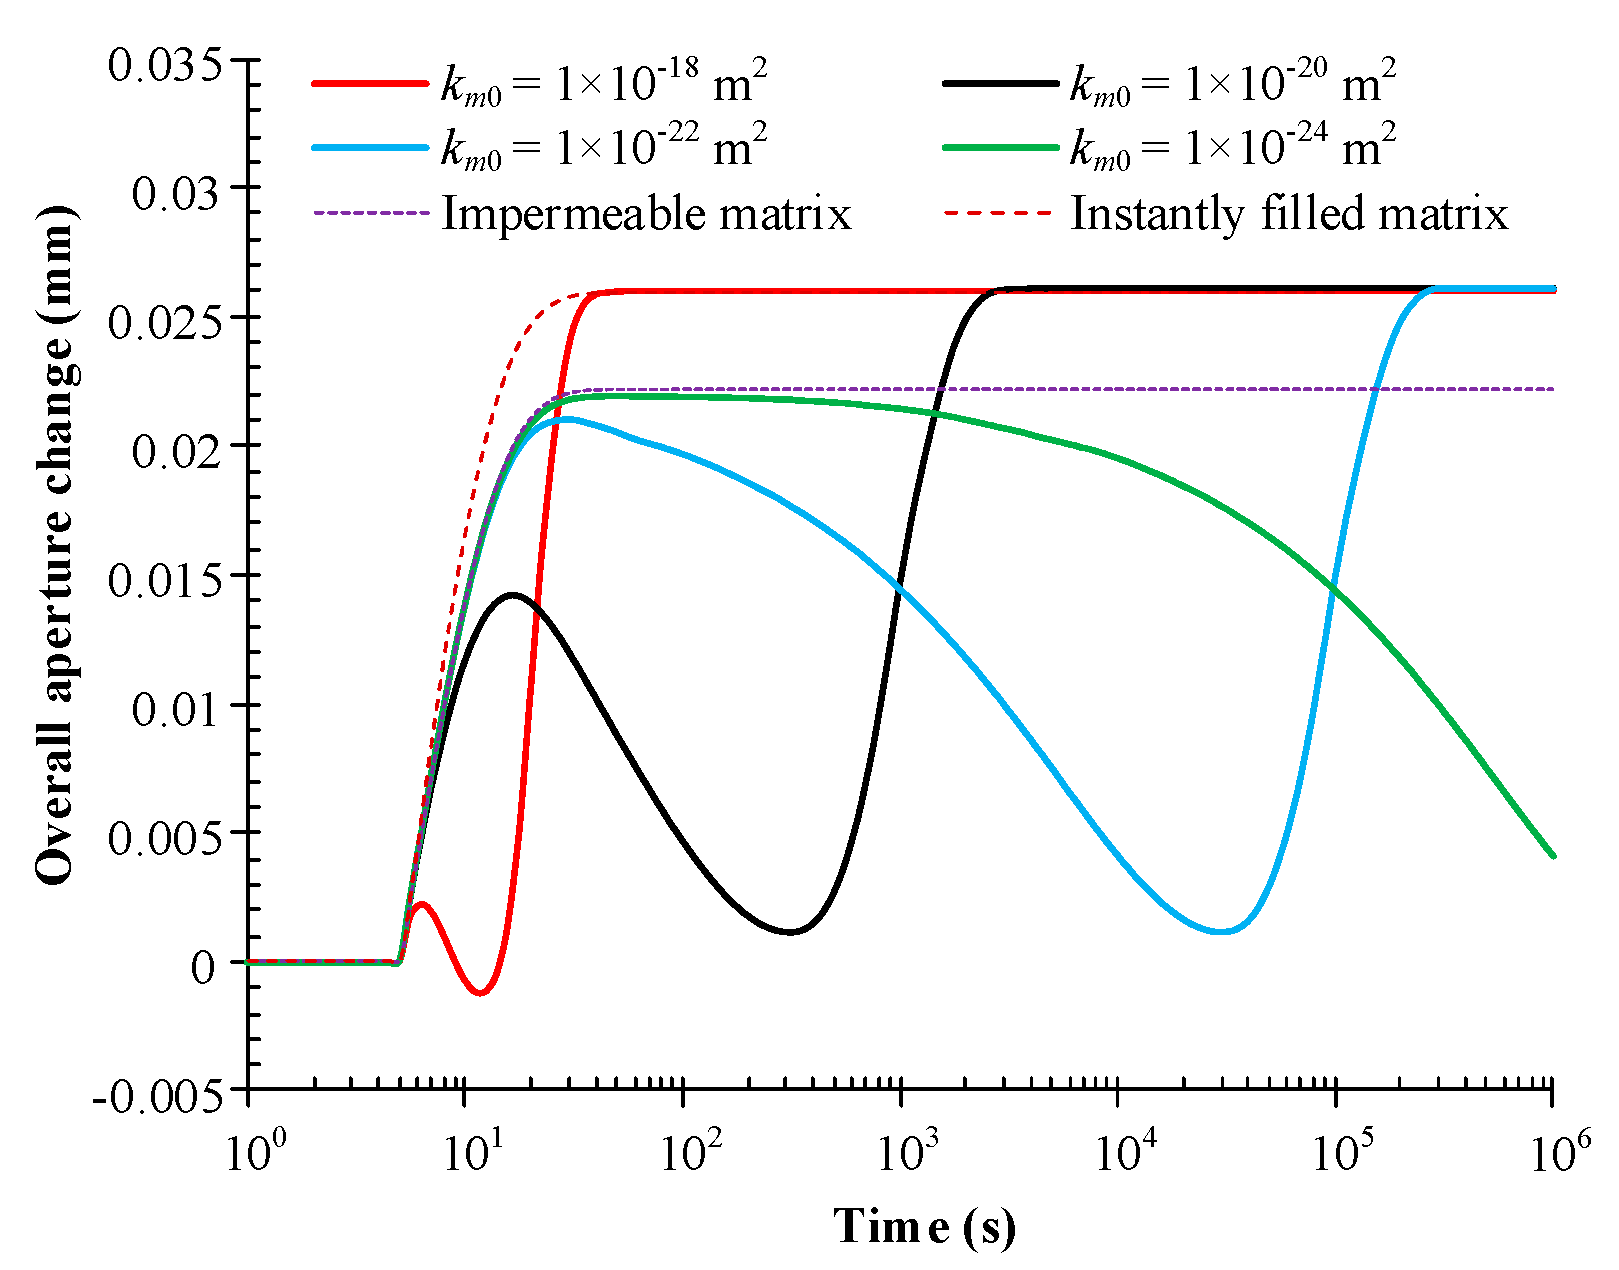
Gas transport in the matrix is not only determined by the pressure gradient but also affected by initial matrix permeability. Figure 12 illustrates the evolution of fracture aperture change for different initial matrix permeabilities. The initial matrix permeability is varied from 10−18 m2 to 10−24 m2 when the gas is injected. The results show that the initial matrix permeability has a significant effect on the evolution of fracture aperture change. A peak and trough of fracture aperture change is observed in the first three cases with all the aperture changes finally approaching the same value (about 0.026 mm). Because the matrix permeability of 10−24 m2 is very low, it requires a considerably longer time for the gas to transport into the matrix and fill the entire representative volume to the injection pressure. If the simulation time is sufficiently long, the evolution of aperture change would follow the same trend as the other three cases. As the initial matrix permeability decreases from 10−18 m2 to 10−22 m2, the time when the aperture change reaches the peak value varies from 7 s to 28 s while the time for aperture change to reach the trough increases from 12 s to 3 × 10⁴ s. The trough values of aperture change are close to 0.0011 mm, while the peak values differ greatly. The peak value of aperture change increases from 0.0022 mm to 0.022 mm with the initial matrix permeability decreasing from 10−18 m2 to 10−22 m2.
The initial matrix permeability affects the process of gas transport and adsorption in the matrix. With an increasing initial matrix permeability, the gas flow from fracture to matrix and the gas transport within the matrix become more rapid, which may cause the gas to transport to the external boundaries before the injection pressure reaches the maximum. Then the significant effect of gas transport in the matrix advances the switch from increase to decrease in overall aperture change. If the initial matrix permeability is sufficiently high to instantly fill the matrix at the injection pressure, the switching of gas transport vanishes and the overall fracture aperture would increase to the final value with increasing time or injection pressure. Conversely, if the initial matrix permeability decreases, the narrowing effect induced by gas transport weakens in the early period, leading to a dominant effect of fracture pressure and in increasing the peak value of overall fracture aperture change. When the matrix becomes impermeable, the peak value of the aperture reaches its maximum. The reason why the trough in the fracture aperture remains almost unchanged may be since the initial matrix permeability merely prolongs the time for gas transport to the external boundaries but exerts little impact on the gas pressure distribution. It is notable that there exists a constant difference between the maximum peak value and the final value of the fracture aperture change, or between the final values of fracture aperture change in the cases of an impermeable matrix and instantly-filled matrix, which is equivalent to the aperture change induced by matrix swelling when pressure equilibrium is achieved.
4.4. Impacts of Injection Processes
The injection process controls the fracture pressure and the rate of pressure increase on internal boundaries. This influences the fracture aperture change induced by the mechanical effects of fracture pressure and the swelling effect of gas transport in the matrix. The injection rate characteristic time and the injection pressure increment are two important factors controlling the injection processes. A higher characteristic time indicates a lower rate to get to the maximum injection pressure, while a higher increment means a larger magnitude of the maximum injection pressure.
4.4.1. Impacts of Injection Characteristic Time
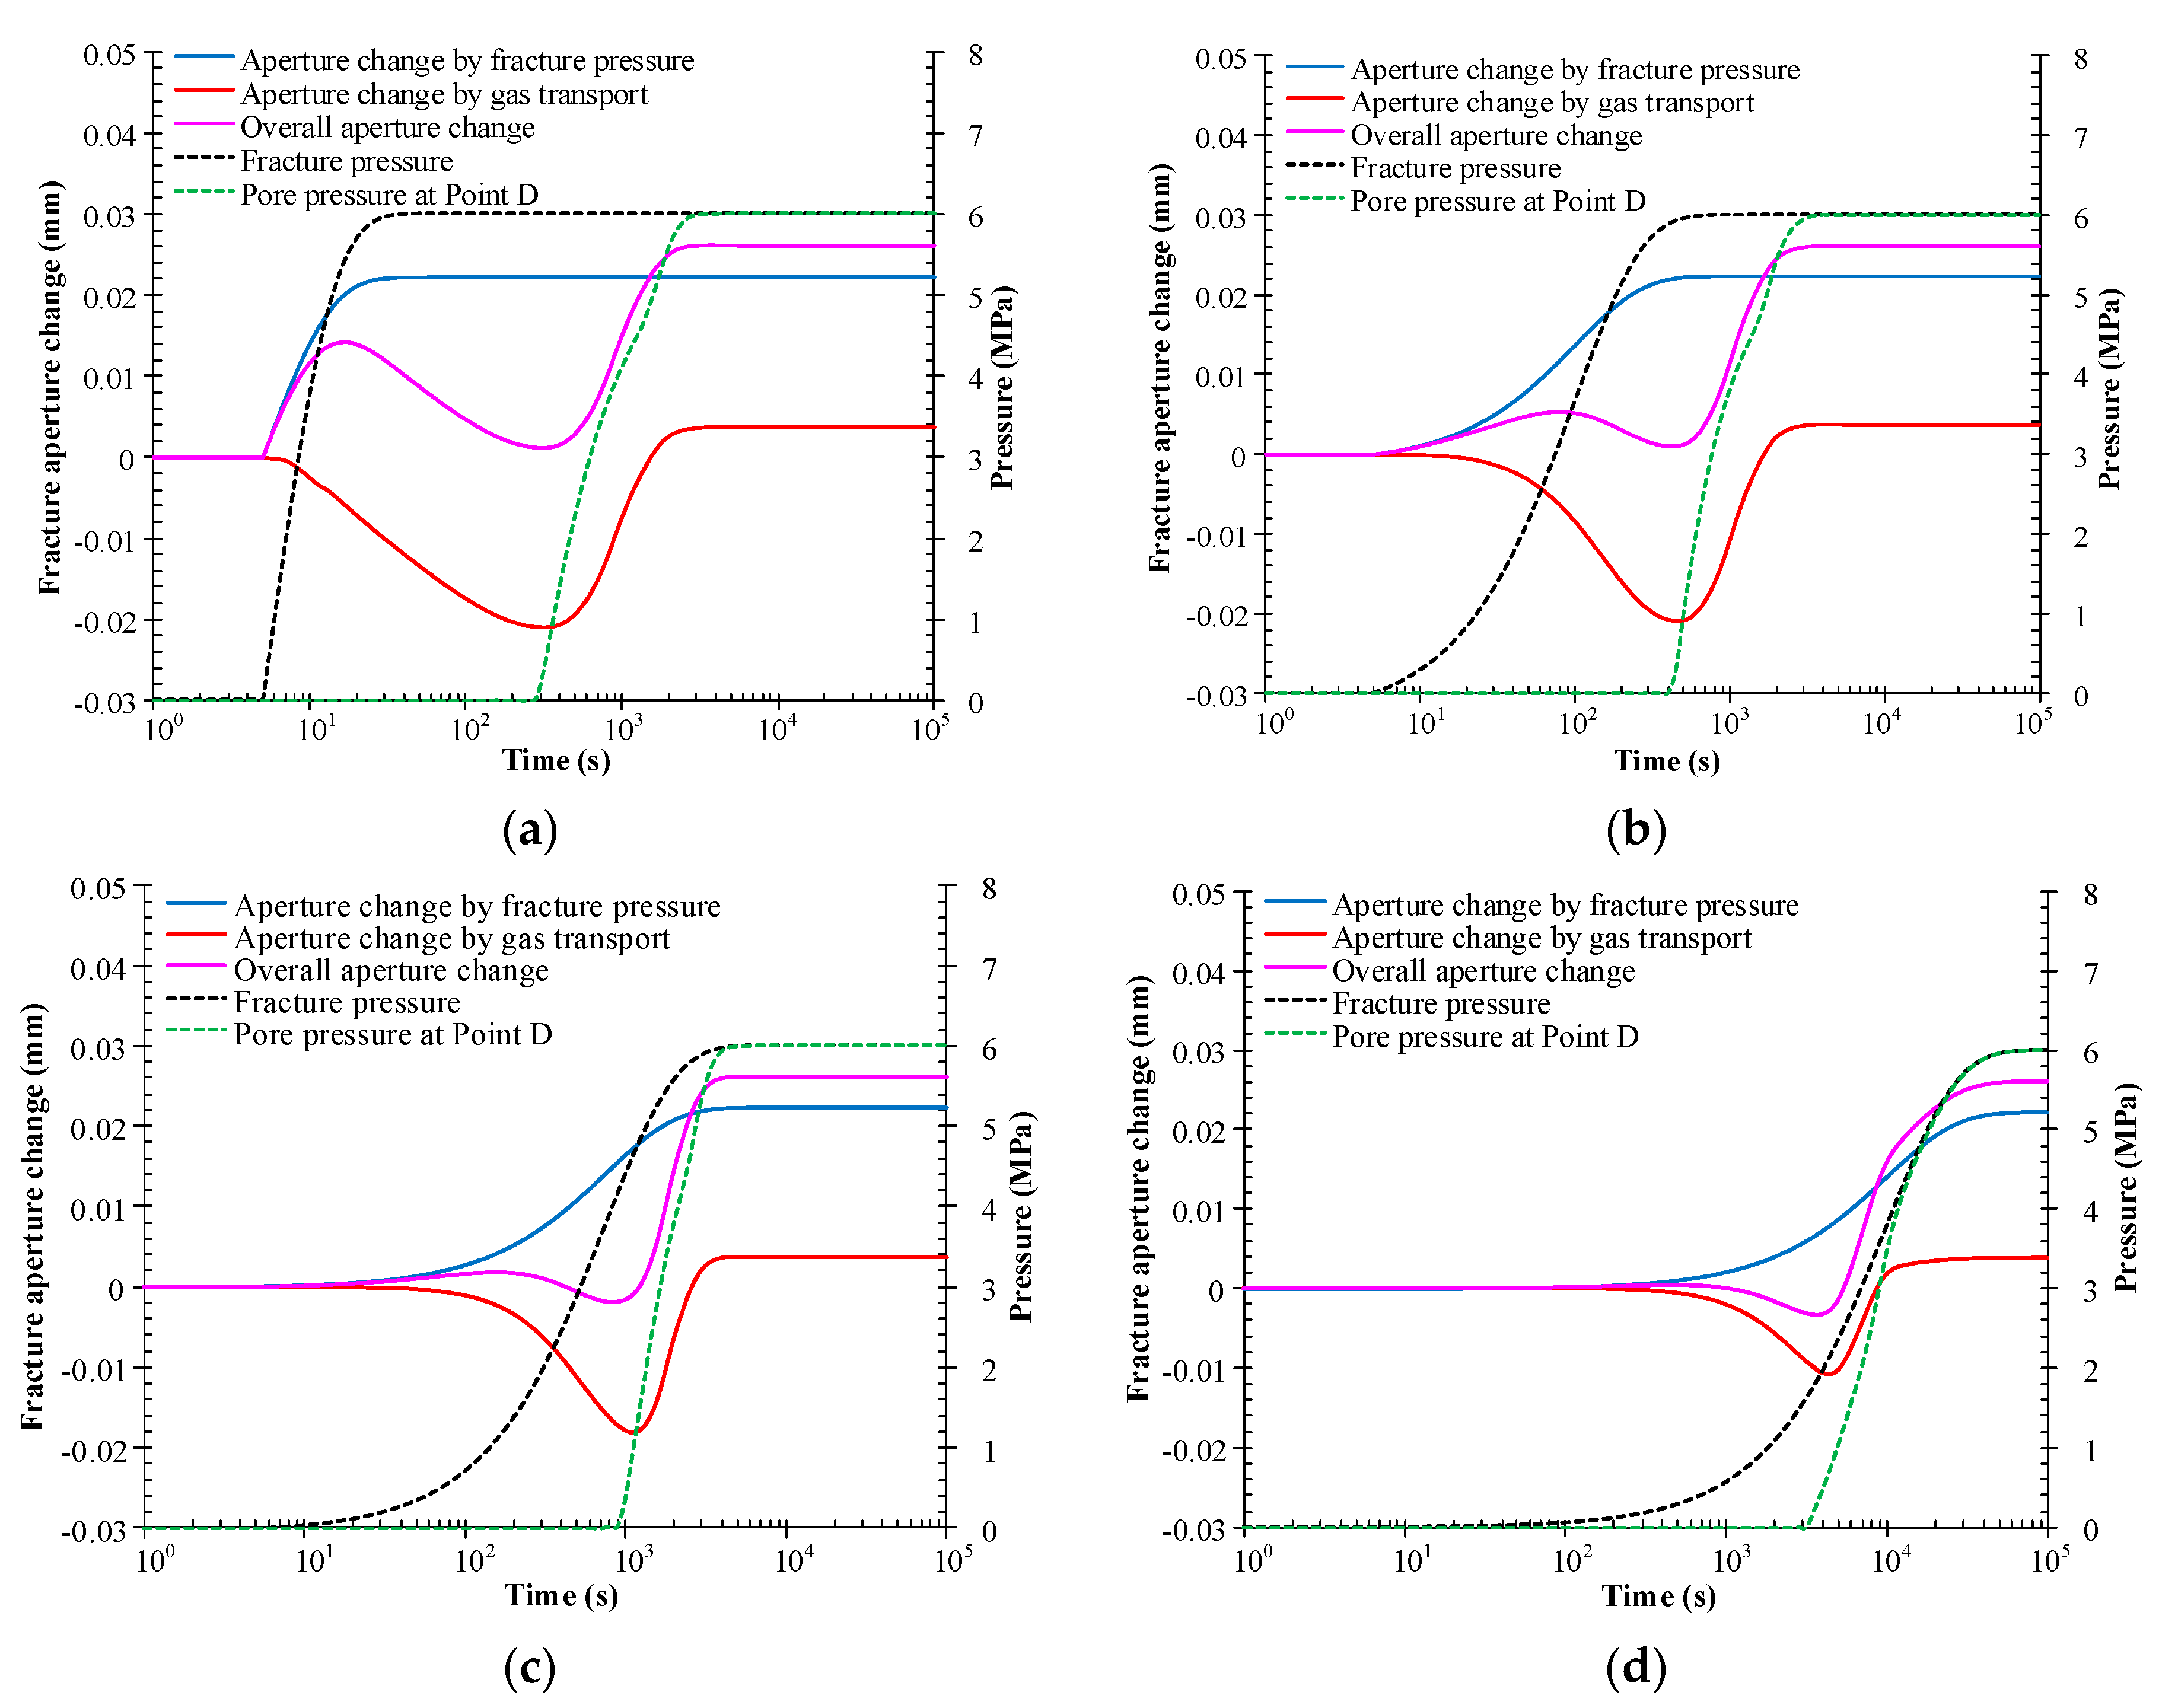
Figure 13 illustrates the evolution of each component in overall fracture aperture change, fracture pressure and pore pressure at Point D for different injection rate characteristic times. The injection characteristic time is varied from 5 s to 104 s and the results show that the injection characteristic time has a significant effect on the evolution of fracture aperture change. A peak and trough in the fracture aperture change is observed in all four cases; however, the magnitude of the peak and trough and the time when fracture aperture change switches vary in each case, due to the different injection characteristic times.
The maximum reduction in fracture aperture induced by gas transport is ~0.02 mm when the characteristic time is 100 s. This is almost as large as that for the case with a characteristic time of 5 s, while the maximum reduction is only 0.01 mm in the case with a characteristic time of 104 s. A comparison in the pressure evolution suggests that whether the maximum reduction of fracture aperture induced by gas transport in the matrix and the switch time vary depends on relationships between the required times for the fracture pressure to reach the maximum (denoted by t1) and for gas transport to Point D (denoted by t2): if t1 ≤ t2, the maximum reduction changes slightly and the switch time is equivalent to t2; if t1 > t2, the maximum reduction decreases with increasing injection characteristic time, and the switch time then gradually lags behind due to the increasing body force induced by the injection pressure increase.
The overall aperture change is the combination of the aperture change induced by gas transport in the matrix and the fracture pressure increase. When the characteristic time is 750 s, the peak value of the overall aperture change is only 4.6 × 10⁻⁴ mm, about 3% of that in the case with characteristic time is 5 s. The trough in the overall aperture change decreases from 1.1 × 10⁻³ mm to −3 × 10⁻³ mm as the characteristic time varies from 5 s to 104 s. With an increase in the characteristic time, the time for the occurrence of the peak value grows from 15 s to 500 s due to the slowdown in the fracture pressure increase while that of the valley grows from 300 s to 4500 s due to the decrease of the pressure gradient within the matrix.
These results indicate that if the injection speed characteristic time approaches infinity, the whole system is always in a state of equilibrium and the fracture aperture change gradually increases with the equilibrium pressure due to the decrease in effective stress and increase in fracture pressure. This is consistent with the results obtained from the assumption of local equilibrium.
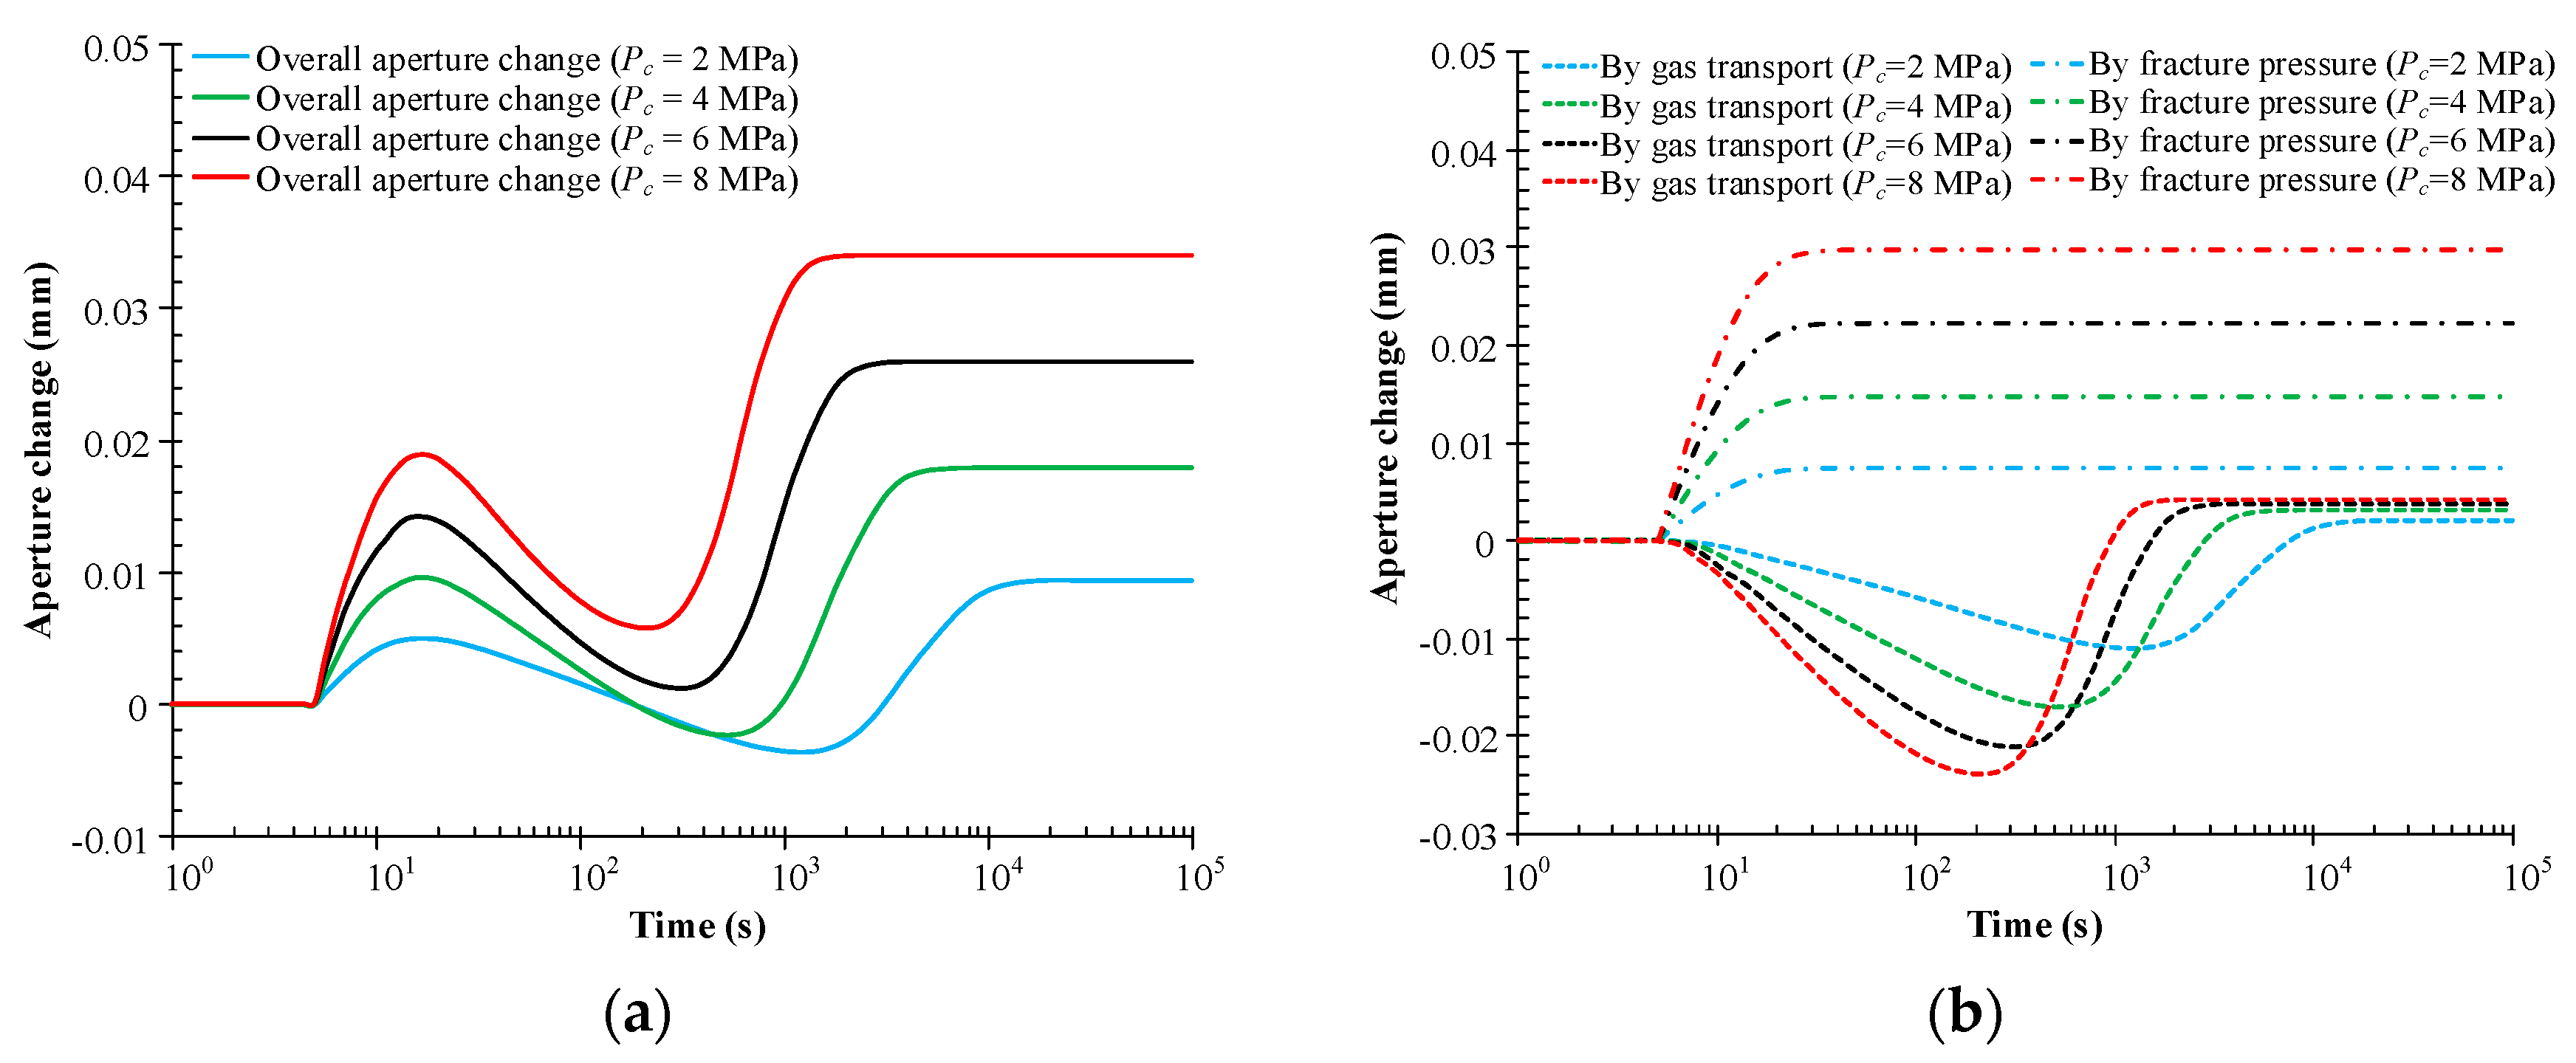
4.4.2. Impact of Injection Pressure Increment
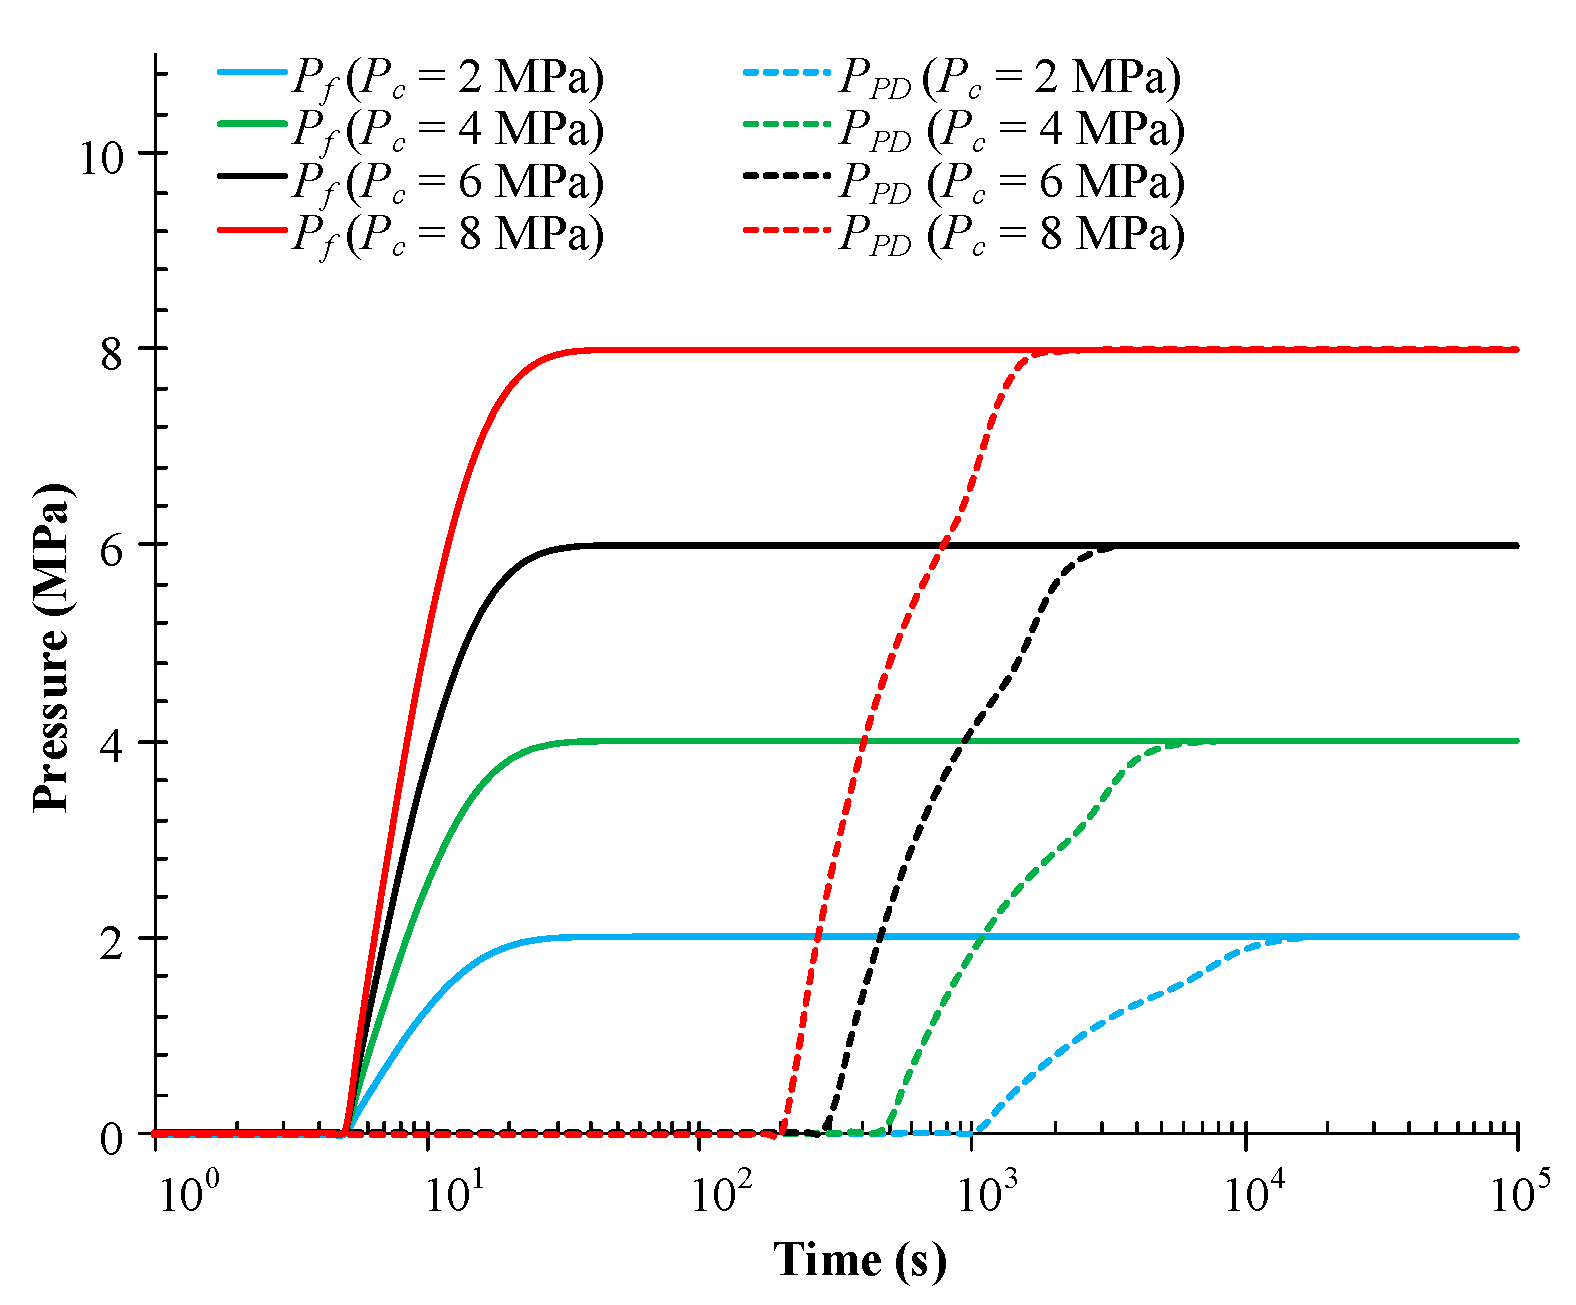
The evolution of fracture pressure and pore pressure at Point D at different pressure increments is shown in Figure 14. This indicates that the injection pressure increment only changes the amplification of the fracture pressure increase without impacting the time to reach the maximum. As the fracture pressure rapidly reaches the maximum, the aperture change induced by fracture pressure and gas transport in the matrix is proportional to the ratio of injection pressure increment soon after the injection initiates. The time for the peak fracture aperture change to occur remains unchanged as illustrated in Figure 15. However, the gas transport in the matrix accelerates due to the increase in pressure gradient during continuous injection, advancing the time of gas transport to Point D or the occurrence of the trough in fracture aperture change. The time for the trough is ~200 s when the pressure increment is 8 MPa, while it increases to 1500 s as the pressure increment drops to 2 MPa. Notably, the switch in aperture change is abrupt for the case with a pressure increment of 8 MPa, compared to the relatively smooth transition in the other three cases. Moreover, whether the trough of the aperture change is negative or positive depends on the relative magnitude of the maximum increase in aperture change induced by fracture pressure and the aperture maximum reduction induced by gas transport in matrix. For the simulation cases in this section, injection pressure increments of 2 MPa and 4 MPa can both cause the maximum reduction in aperture change induced by gas transport that are higher than the maximum increase of aperture change induced by fracture pressure. The maximum increase in fracture aperture change induced by fracture pressure is 0.015 mm in the case for an injection pressure increment of 4 MPa, less than the maximum reduction of aperture change induced by gas transport of 0.017 mm, leading to the trough in the fracture aperture change equivalent to −0.02 mm.
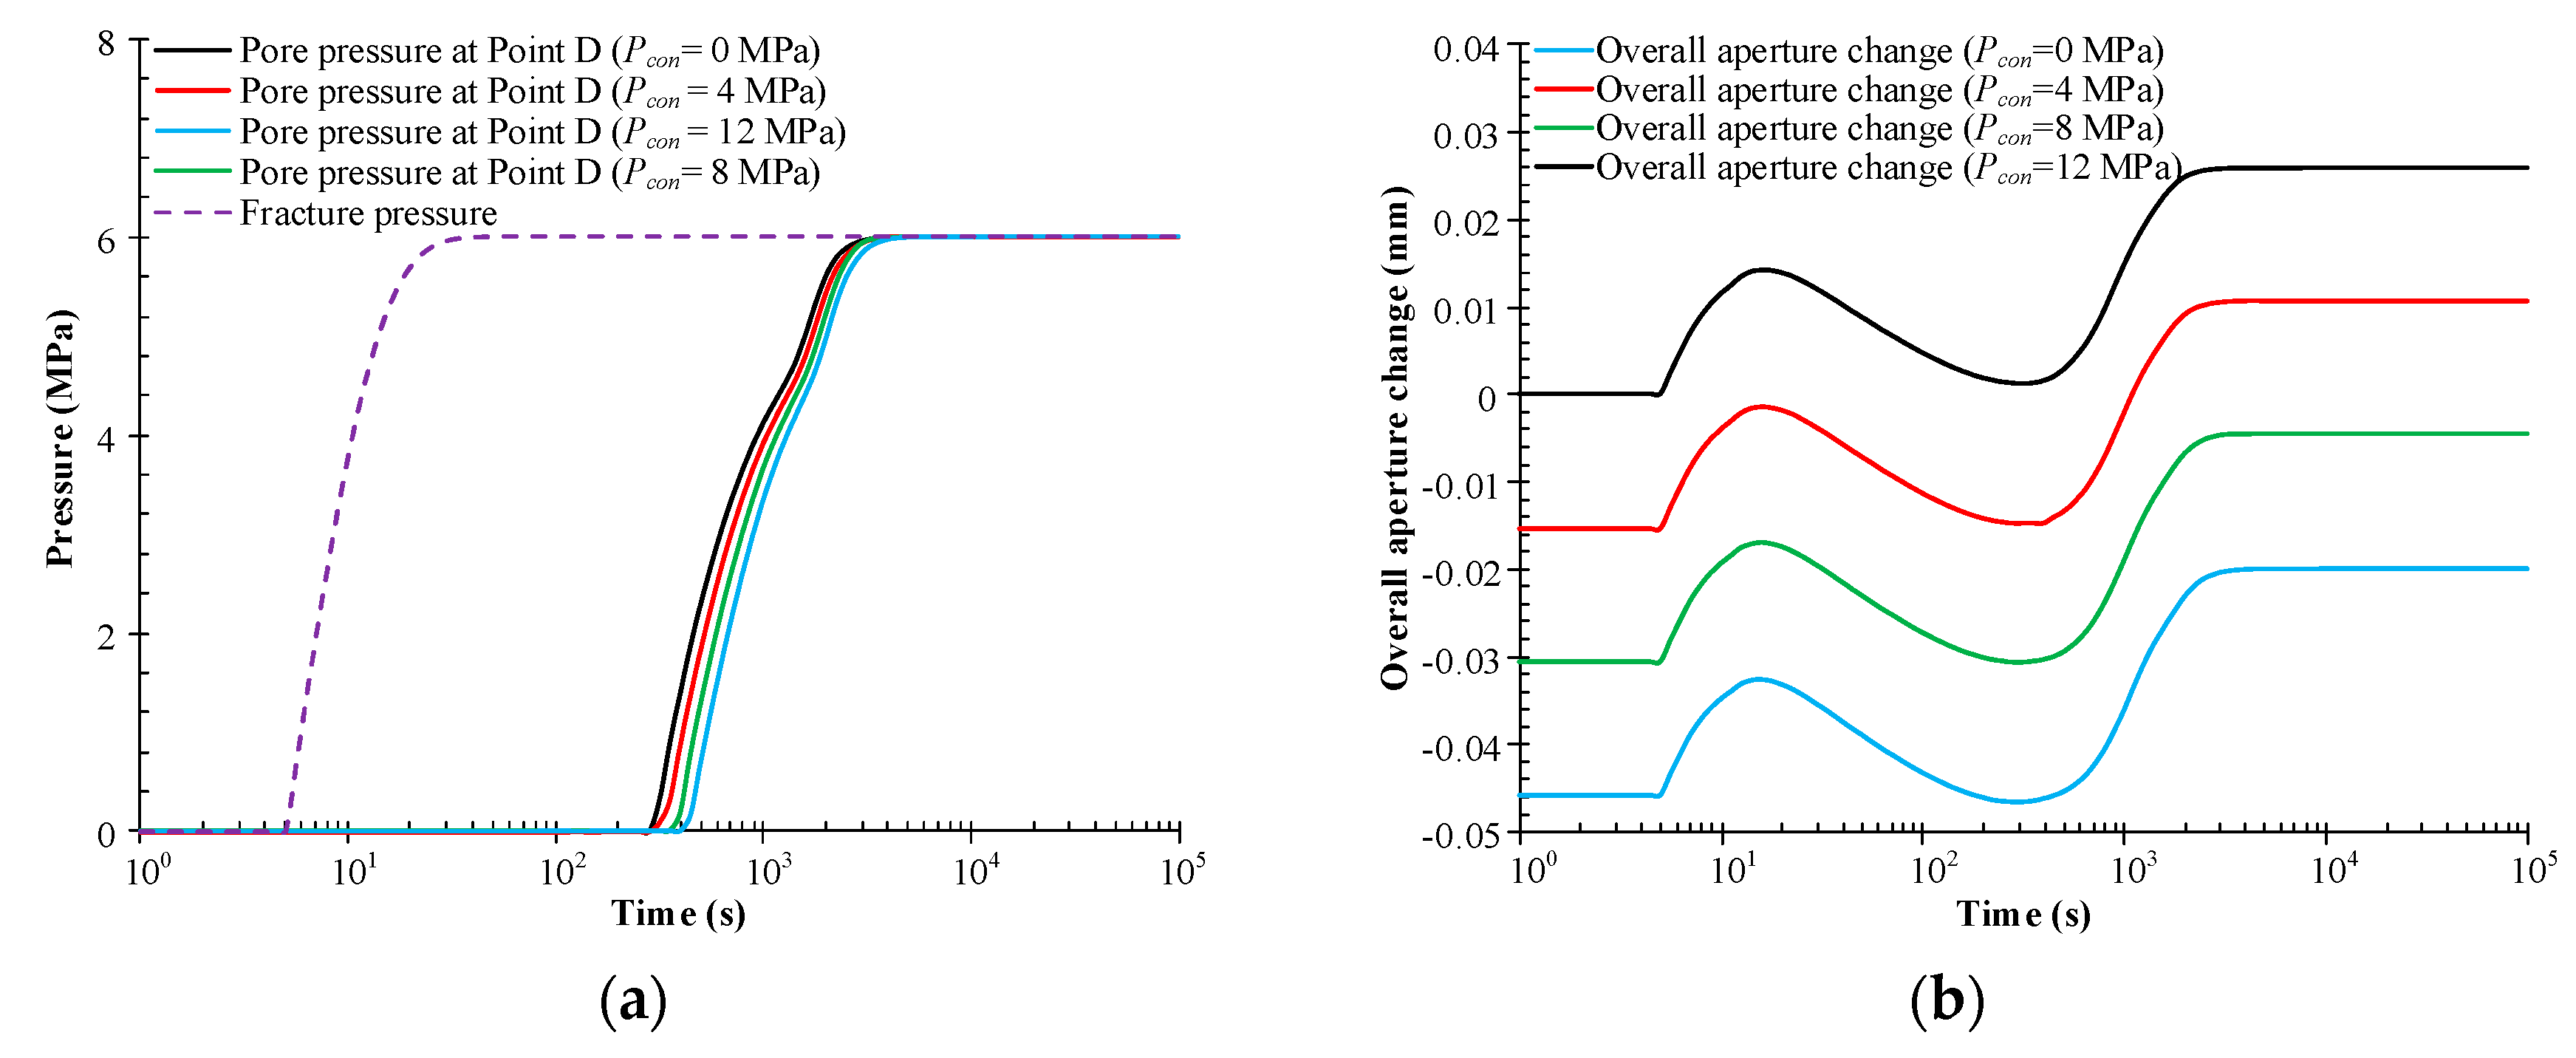
4.5. Impacts of Confining Pressure
Figure 16 illustrates the evolution of fracture pressure, the pore pressure at Point D and the fracture aperture change at different confining pressures. The results show that the confining pressure changes the initial and final fracture aperture and has little impact on the trend of fracture aperture change. As the confining pressure increases from 0 to 12 MPa, the initial fracture aperture reduces by 0.046 mm as well as the peak and troughs of fracture aperture. Simultaneously, the time for gas transport to Point D increases from 300 s to 400 s, slightly postponing the occurrence of the trough in the aperture. The confining pressure acts as an external stress and causes matrix shrinkage and fracture closure. However, the confining pressure is usually applied before the injection begins, which induces compressive deformation of the fracture and the matrix and thus forms a different initial fracture geometry and uneven distribution of initial matrix permeability, as illustrated in Figure 17. The permeability ratio of the transient value to the initial value is often used. However, the uneven deformation due to confining pressure presents a significant challenge in determining the initial permeability of both the matrix and fracture.
5. Verification with Experimental Data
Experimental data measured under stress-controlled conditions are now used to verify our model. The coal core sample contains an induced fracture to increase the initial permeability. This is completed by applying a compressive load to the cylindrical surface as in experiments conducted by Siriwardane et al. [15] to investigate the influence of CO2 exposure on coal permeability. In this study, the virtual core representing the sample is cylindrical with a throughgoing fracture. The fracture is located at the center of the circular section with a diameter of 0.0375 m, as illustrated in Figure 18a. The fracture length is 0.03 m to obtain a contact ratio of 20% and the fracture aperture calculated from the initial permeability is 7 × 10⁻⁷ m, based on equivalent mass flow. Due to the contact area, roughness and tortuosity, the hydraulic aperture is smaller than the mechanical aperture [44,45]. In the simulation, the initial equivalent mechanical aperture is set to 3.5 × 10⁻⁶ m. It is noted that the initial fracture aperture is the mean value after the confining pressure is applied around the sample and a fracture pressure of 10 MPa is applied on the fracture boundaries. One quarter of the typical section is chosen as the simulation model and the corresponding boundary conditions are illustrated in Figure 18b. In the simulation, the properties of the matrix for the fractured sample is required, which are missing from the experiments. Therefore, we may only assume their values based on the literature [8,34] as listed in Table 2.
5.1. Evolution of Fracture Permeability
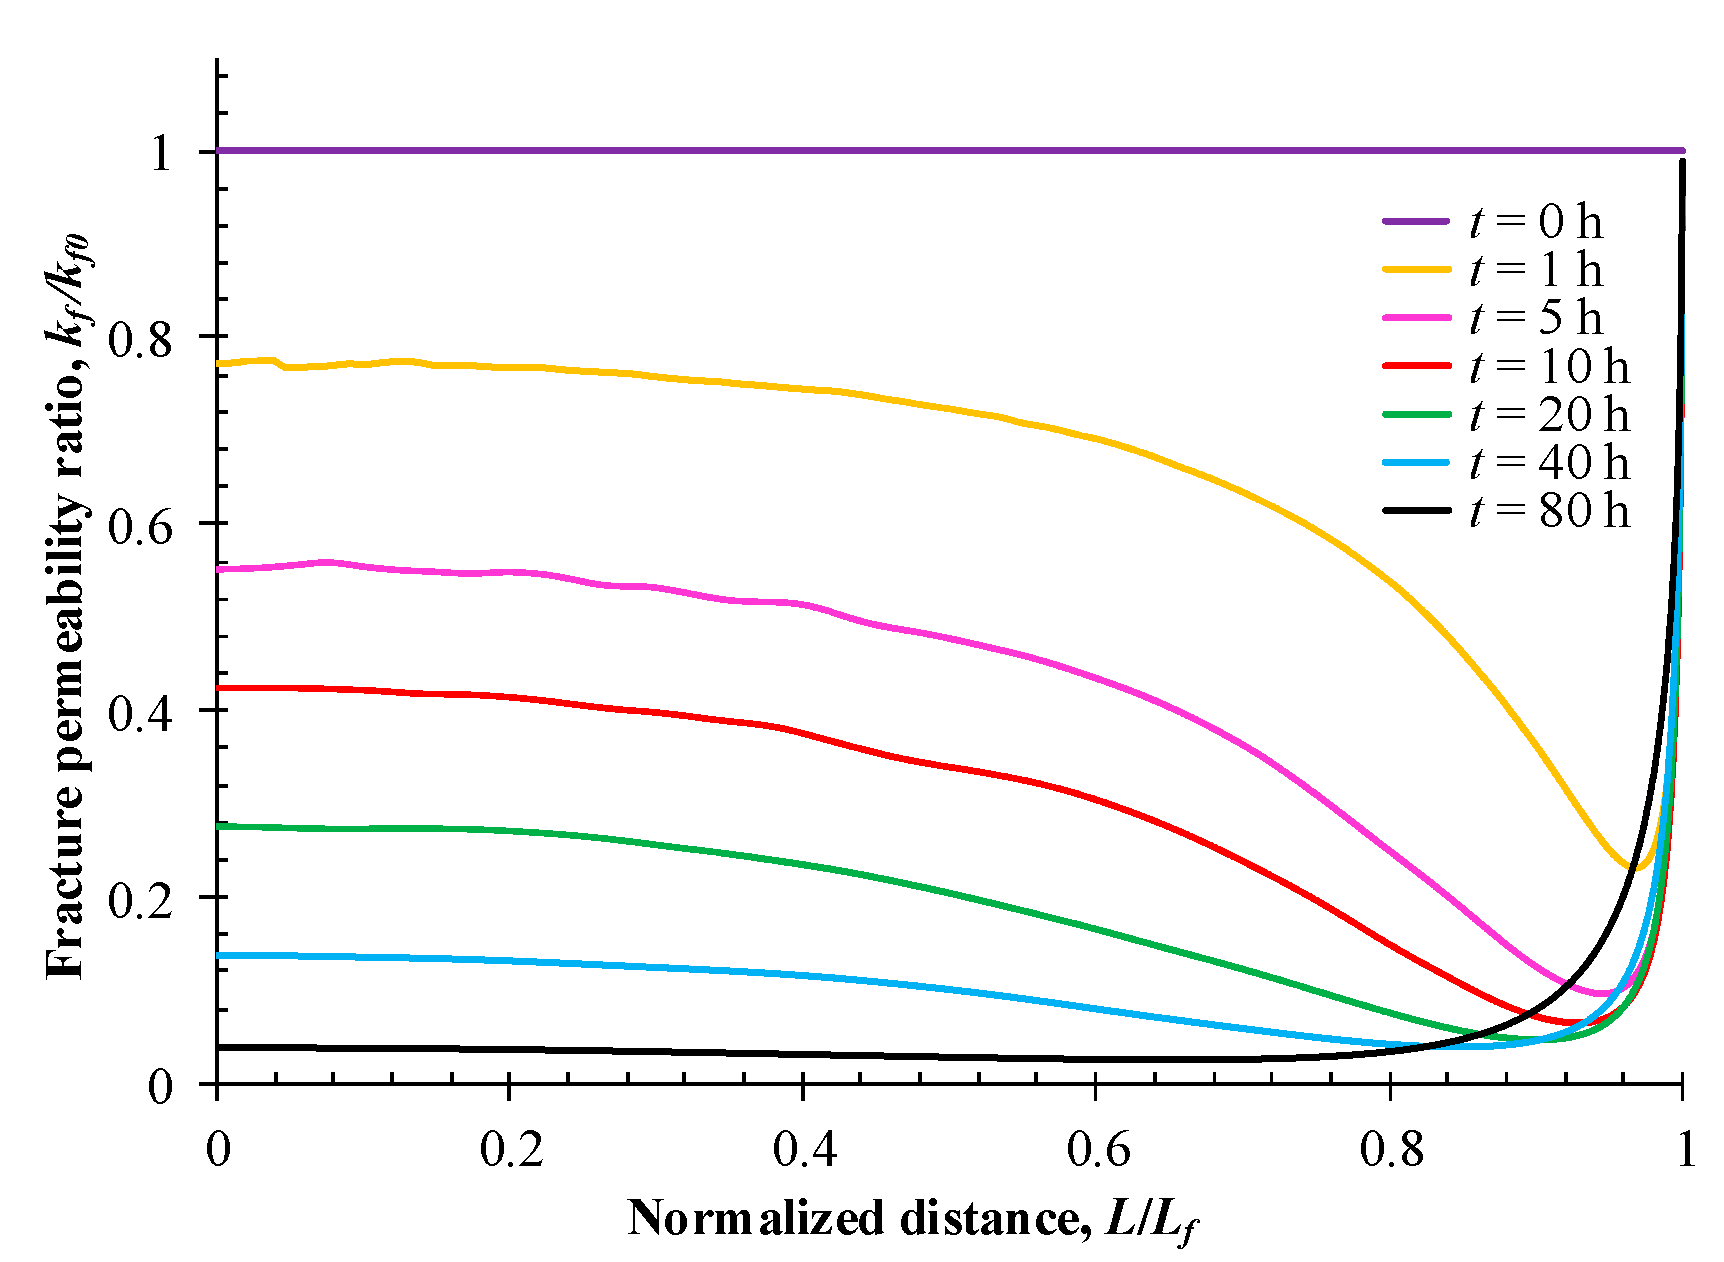
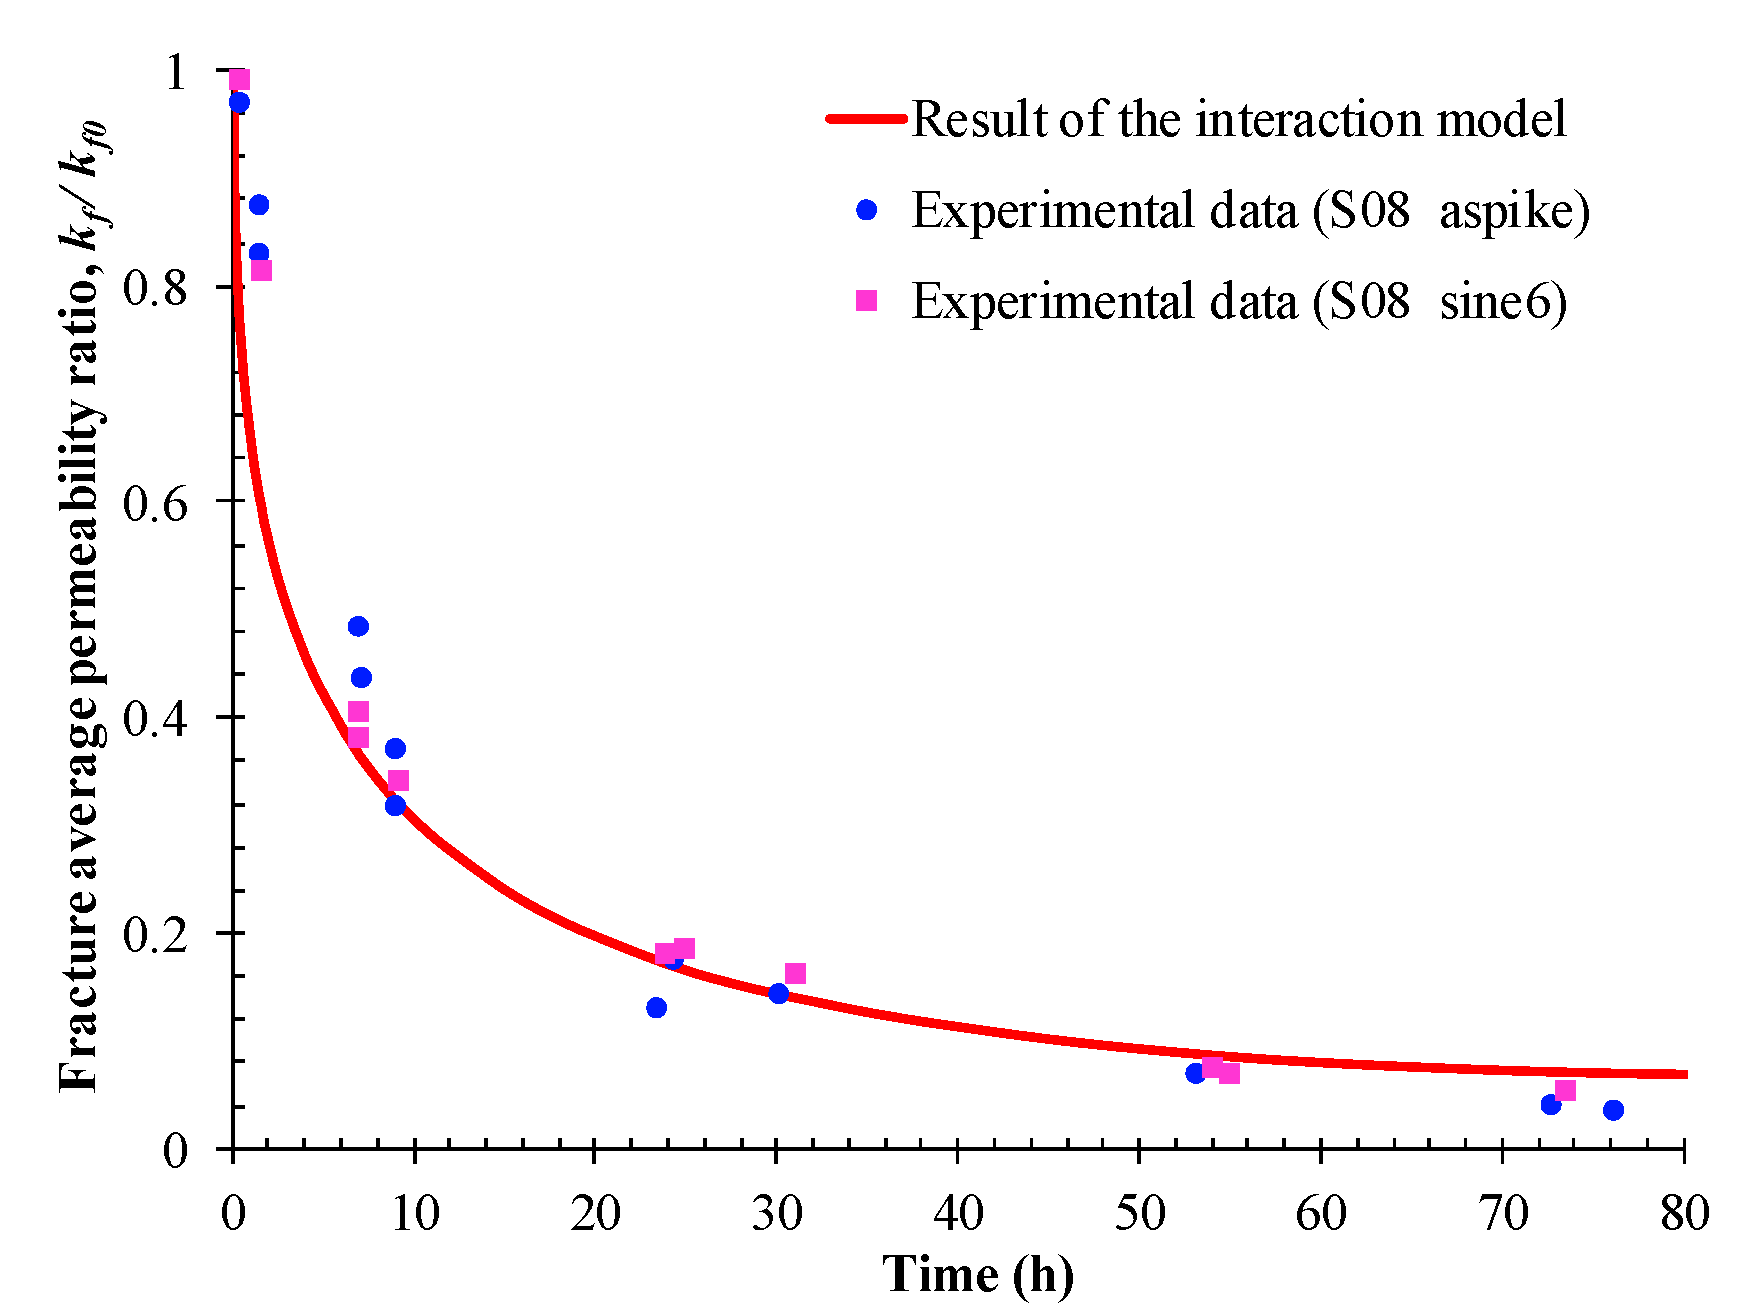
Figure 19 illustrates the distribution of the permeability ratio along the fracture at different times for the case of a fractured core sample exposed to CO2. The normalized distance represents the ratio of the distance from the fracture center (L) to half the fracture length (Lf). As apparent in Figure 19, fracture permeability at different locations experiences different evolutions over the simulation period. The part of the fracture with a normalized distance less than 0.8 continues to narrow, while that outside this normalized distance (greater than 0.8) rebounds after experiencing initial narrowing with a different reduction ratio. From the trend of the permeability ratio (Figure 19), the outer part of the fracture rebounds faster, indicating that the central part with a continuous permeability decrease also rebounds as the gas propagates to the distal matrix, if given sufficient time. The distance from the fracture to its perpendicular boundary increases from the end of the fracture to its center, and this may represent a constraint for fracture deformation induced by matrix swelling. At first, the CO2 propagates in the vicinity of the fracture surface, and the induced swelling stress perpendicular to the fracture surface resulting from gas adsorption is shared by the matrix in the perpendicular direction. This may explain why the permeability of the fracture center decreases and then rebounds slowest in the case of a circular matrix.
The permeability ratio recovered from the experimental results is shown in Figure 20, together with the evolution of average fracture permeability ratio. When the coal matrix is exposed to CO2 at a pressure of 10 MPa for 80 h, the local swelling induced by gas adsorption has an important impact on fracture permeability—the initial permeability is reduced by approximately one order of magnitude. Specifically, the average fracture permeability decreases dramatically with a reduction ratio of 70% over the initial period of 10 h. Then, the permeability decrease gradually slows with the sequential reduction ratio of 20% in the next 40 h and, finally, the permeability asymptotes to a constant magnitude. As apparent from Figure 19, all the fracture would compact rapidly. When t = 10 h, 85% of the fracture proximal to its center has a reduction ratio in the range 60%–90%. Subsequently, an increasing proportion of the outer part of the fracture begins to rebound and the central part of the fracture further narrows. The increase in the rebounding part, and its extent, slows the average permeability decrease, and the average permeability remains stable due to the equivalent effects of fracture narrowing and rebound. When t > 80 h, the rebounding effects may get stronger than the narrowing effect, leading to the recovery of average fracture permeability ratio.
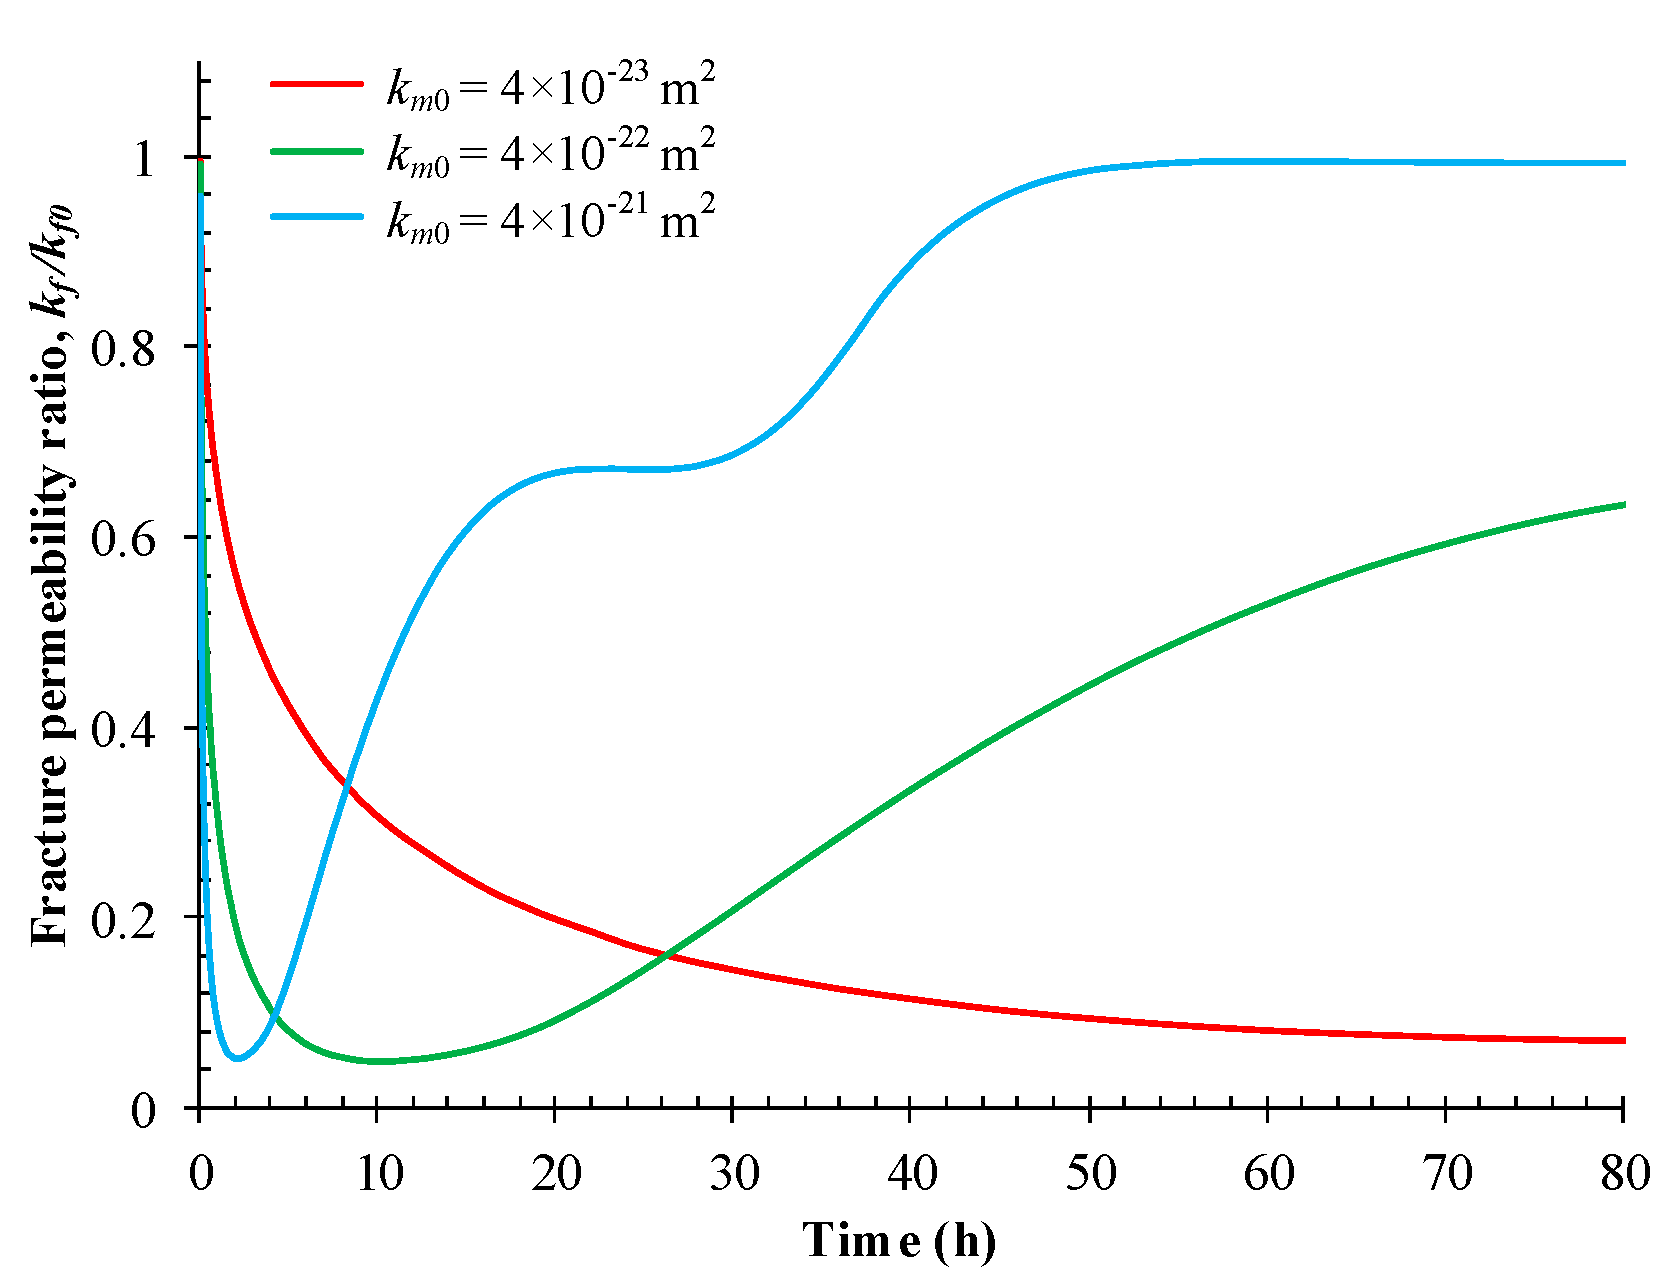
5.2. Sensitivity of Initial Matrix Permeability
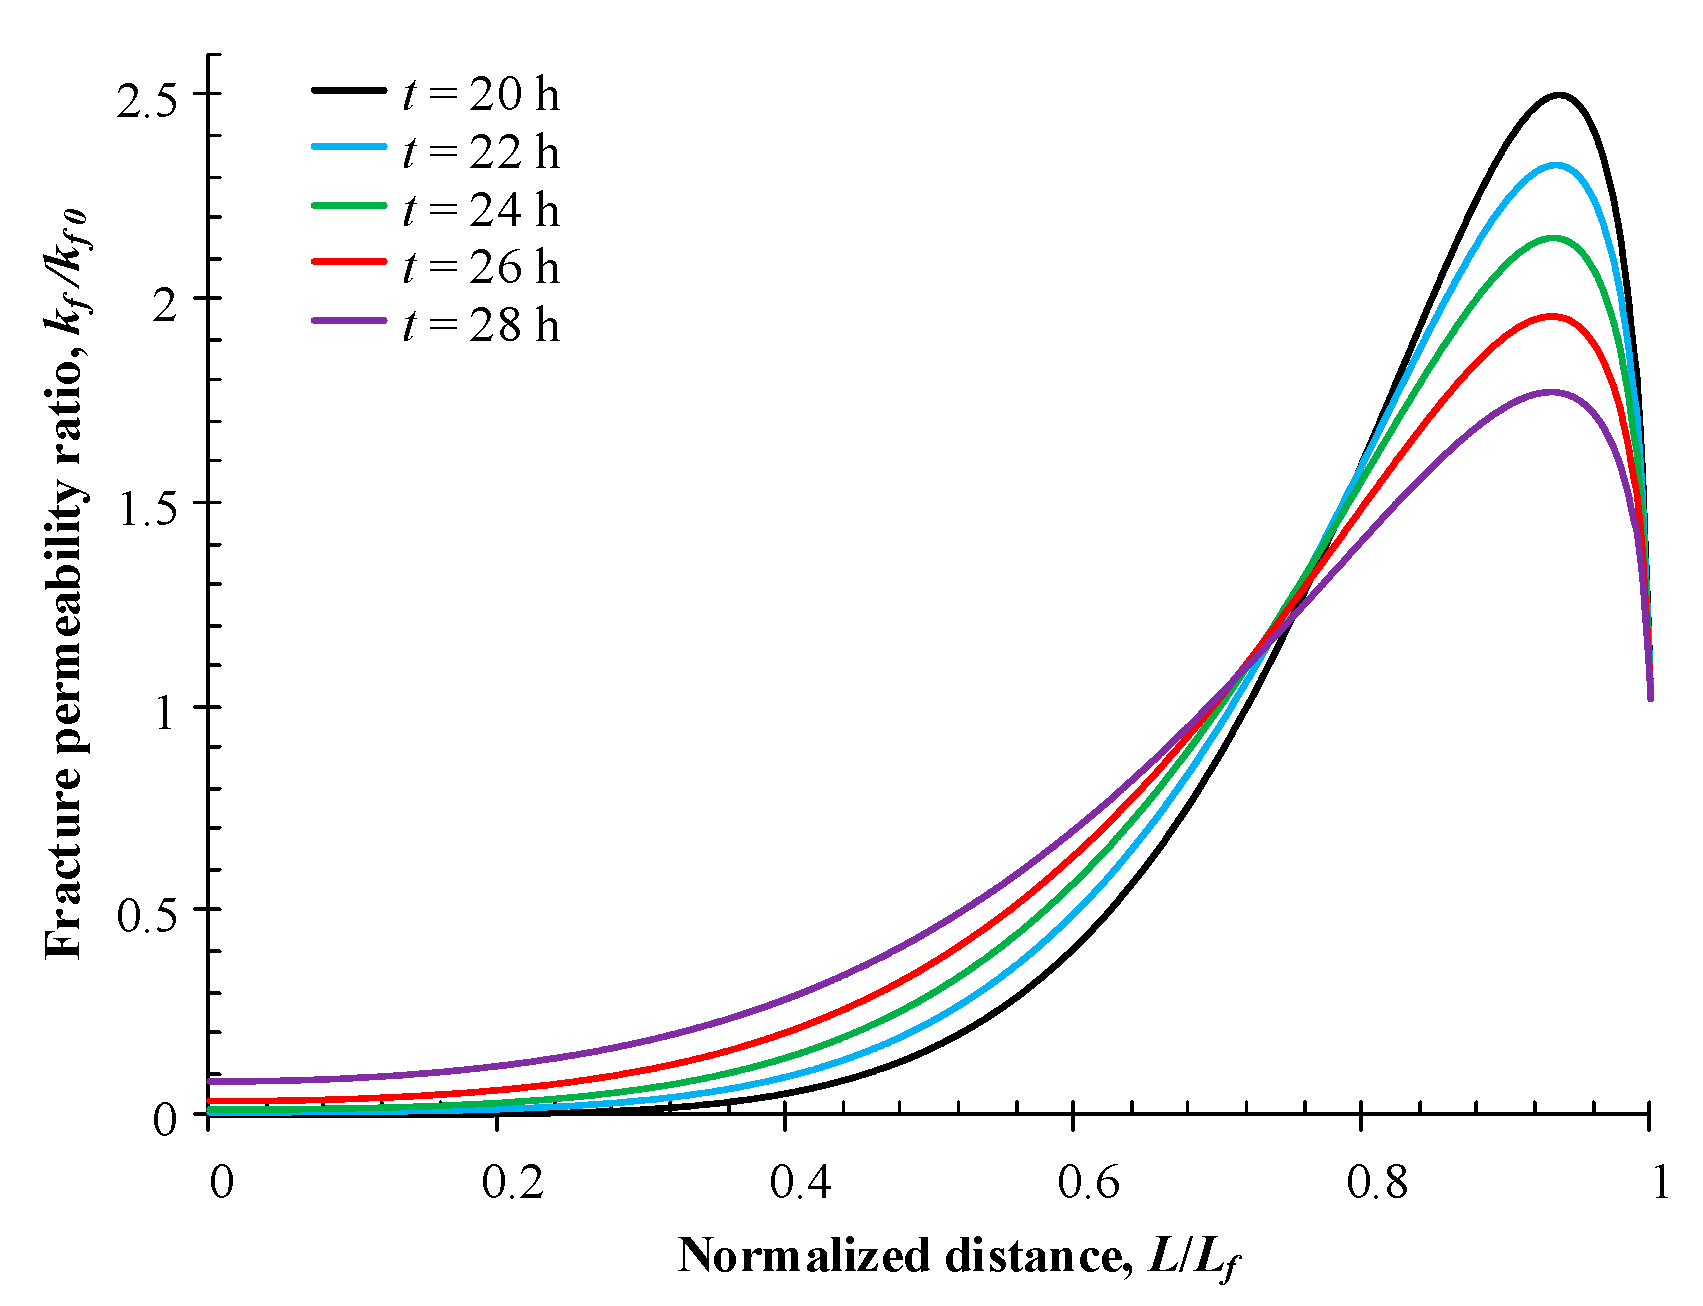
As discussed in the previous section, the initial matrix permeability plays an important role in the permeability evolution. In the experiment conducted by Siriwardane et al. [15], the average fracture permeability continues to decrease over 80 h, by contrast with other experimental observations of permeability recovery. This monotonic decrease results because the experiments were ended while the local swelling was still the dominant mechanism—resulting in permeability reduction, alone. This stability in permeability evolution results from the close competitive effects of fracture narrowing due to local swelling and fracture opening due to global swelling at some time stage [27], instead of the disappearance of matrix swelling due to gas pressure equilibrium [34]. In order to obtain different permeability evolution in fractured coal exposed to CO2, three different initial matrix permeabilities are adopted and the evolution of the average fracture permeability ratio is illustrated in Figure 21. When initial matrix permeability increases from 4 × 10⁻²³ m2 to 4 × 10⁻²¹ m2, gas propagation into the matrix accelerates and the time for gas transport to reach the external boundaries is shortened. As a result, the rebound in the permeability the entire fracture appears in advance, leading to a shortened period for the reduction of the average fracture permeability ratio. This is consistent with the previous view that the central part of the fracture would rebound after longer than 80 h, when initial matrix permeability is assumed to be 4 × 10⁻²³ m2. As apparent in Figure 21, the stage of stable fracture permeability is observed during the rebounding of average fracture permeability and this stable permeability lasts for ~8 h when the initial matrix permeability is 4 × 10⁻²¹ m2. The stability of the average fracture permeability during the rebound stage is the combined result of nearly-matched opposing effects of local swelling and global swelling. As illustrated in Figure 22, the fracture outer part, during this stage, is wider than its initial value. This is induced by the cumulative local swelling of the central part. With a gradual switch from local swelling to global swelling within the fracture, the outer part of the fracture narrows while the central part opens.
With continuous gas transport into the matrix, the matrix ultimately has a uniform equivalent pore pressure and consequently no swelling deformation induced by gas adsorption. As a consequence, the fracture permeability remains stable. The final fracture permeability is slightly greater than the initial value, and the increase in amplitude can reach a maximum of the swelling deformation of coal bridges induced by gas sorption and pore pressure increase.
6. Conclusions
In this study, a matrix–fracture interaction model is applied to investigate the transient response of coal deformation and permeability to the temporal and spatial variations of effective stresses under mechanically unconstrained conditions. The effect of the increase in fracture pressure on the change in fracture aperture and on bulk deformation is incorporated into the matrix–fracture interaction and the individual effects of different mechanisms are evaluated. The impact of fracture properties, initial matrix permeability, injection processes and confining pressure are separately evaluated. Based on the model results, the following major conclusions are drawn:
- The evolution of coal permeability under unconstrained conditions is primarily controlled by the fracture pressure and gas transport in the matrix. The evolution of the non-equilibrium permeability, from the initial equilibrium permeability (when the matrix pressure is equalized with the fracture pressure prior to injection) to the final equilibrium permeability (when the matrix pressure is equalized with the matrix pressure after the gas injection) exhibits three distinct stages. In the case of gas injection, these three stages are (1) an increase in permeability due to the increased injection pressure; (2) a reduction due to the localization of matrix pressure in the vicinity of the fracture wall; and (3) recovery due to the equilibration of matrix pressure throughout the matrix block.
- The duration of the transient period, from the initial equilibrium state to the ultimate equilibrium state, is determined both by matrix transport properties and by loading processes on external boundaries and within the internal boundaries (interfaces between matrixes and fractures). For coal, this transient period may be extremely long, due to its low matrix permeability. This suggests that the permeabilities measured in many laboratory experiments may not indeed be equilibrium permeabilities, as represented in publications, and that experiments of extended duration should be developed to measure the non-equilibrium permeability in the transient state.
Author Contributions
Conceptualization and methodology, J.L., X.L. and J.S.; validation and visualization, X.L. and Y.H.; writing—original draft preparation, X.L. and J.S., writing—review and editing, X.L. and J.L.
Funding
This research is funded by the National Natural Science Foundation of China (Nos. 51474204 and 51579078), the Fundamental Research Funds for the Central Universities (No. 2015B32114) and Collaborative Innovation Center for Prevention and Control of Mountain Geological Hazards of Zhejiang Province (No. PCMGH-2017-Z-02).
Conflicts of Interest
The authors declare no conflicts of interest.
References
- Connell, L.D.; Lu, M.; Pan, Z. An analytical coal permeability model for tri-axial strain and stress conditions. Int. J. Coal Geol. 2010, 84, 103–114. [Google Scholar] [CrossRef]
- Liu, J.; Chen, Z.; Elsworth, D.; Qu, H.; Chen, D. Interactions of multiple processes during CBM extraction: A critical review. Int. J. Coal Geol. 2011, 87, 175–189. [Google Scholar] [CrossRef]
- Durucan, S.; Edwards, J. The effects of stress and fracturing on permeability of coal. Min. Sci. Technol. 1986, 3, 205–216. [Google Scholar] [CrossRef]
- Somerton, W.H.; Söylemezoḡlu, I.; Dudley, R. Effect of stress on permeability of coal. In International Journal of Rock Mechanics and Mining Sciences & Geomechanics Abstracts; Elsevier: Pergamon, Turkey, 1975; pp. 129–145. [Google Scholar]
- Clarkson, C.; Bustin, R. The effect of pore structure and gas pressure upon the transport properties of coal: A laboratory and modeling study. 1. Isotherms and pore volume distributions. Fuel 1999, 78, 1333–1344. [Google Scholar] [CrossRef]
- Gray, I. Reservoir engineering in coal seams: Part 1-The physical process of gas storage and movement in coal seams. SPE Res. Eng. 1987, 2, 28–34. [Google Scholar] [CrossRef]
- Harpalani, S.; Schraufnagel, R.A. Shrinkage of coal matrix with release of gas and its impact on permeability of coal. Fuel 1990, 69, 551–556. [Google Scholar] [CrossRef]
- Robertson, E.P.; Christiansen, R.L. Modeling permeability in coal using sorption-induced strain data. In Proceedings of the SPE Annual Technical Conference and Exhibition, Dallas, Texas, TX, USA, 9–12 October 2005. [Google Scholar] [CrossRef]
- Seidle, J.R.; Huitt, L. Experimental measurement of coal matrix shrinkage due to gas desorption and implications for cleat permeability increases. In Proceedings of the International Meeting on Petroleum Engineering, Beijing, China, 14–17 November 1995. [Google Scholar] [CrossRef]
- Tan, Y.; Ning, J.; Li, H. In situ explorations on zonal disintegration of roof strata in deep coalmines. Int. J. Rock Mech. Min. Sci. 2012, 49, 113–124. [Google Scholar] [CrossRef]
- Pan, Z.; Connell, L.D.; Camilleri, M. Laboratory characterisation of coal reservoir permeability for primary and enhanced coalbed methane recovery. Int. J. Coal Geol. 2010, 82, 252–261. [Google Scholar] [CrossRef]
- Pini, R.; Ottiger, S.; Burlini, L.; Storti, G.; Mazzotti, M. Role of adsorption and swelling on the dynamics of gas injection in coal. J. Geophys. Res.-Solid Earth 2009, 114. [Google Scholar] [CrossRef] [Green Version]
- Han, F.; Busch, A.; van Wageningen, N.; Yang, J.; Liu, Z.; Krooss, B.M. Experimental study of gas and water transport processes in the inter-cleat (matrix) system of coal: Anthracite from Qinshui Basin, China. Int. J. Coal Geol. 2010, 81, 128–138. [Google Scholar] [CrossRef]
- Pan, Z.; Connell, L.D.; Camilleri, M.; Connelly, L. Effects of matrix moisture on gas diffusion and flow in coal. Fuel 2010, 89, 3207–3217. [Google Scholar] [CrossRef]
- Siriwardane, H.; Haljasmaa, I.; McLendon, R.; Irdi, G.; Soong, Y.; Bromhal, G. Influence of carbon dioxide on coal permeability determined by pressure transient methods. Int. J. Coal Geol. 2009, 77, 109–118. [Google Scholar] [CrossRef]
- Chen, Z.; Liu, J.; Elsworth, D.; Connell, L.D.; Pan, Z. Impact of CO2 injection and differential deformation on CO2 injectivity under in-situ stress conditions. Int. J. Coal Geol. 2010, 81, 97–108. [Google Scholar] [CrossRef]
- Connell, L. Coupled flow and geomechanical processes during gas production from coal seams. Int. J. Coal Geol. 2009, 79, 18–28. [Google Scholar] [CrossRef]
- Cui, X.; Bustin, R.M. Volumetric strain associated with methane desorption and its impact on coalbed gas production from deep coal seams. AAPG Bull. 2005, 89, 1181–1202. [Google Scholar] [CrossRef]
- Izadi, G.; Wang, S.; Elsworth, D.; Liu, J.; Wu, Y.; Pone, D. Permeability evolution of fluid-infiltrated coal containing discrete fractures. Int. J. Coal Geol. 2011, 85, 202–211. [Google Scholar] [CrossRef]
- Palmer, I.; Mansoori, J. How permeability depends on stress and pore pressure in coalbeds: A new model. In Proceedings of the SPE Annual Technical Conference and Exhibition, Denver, CO, USA, 6–9 October 1996. [Google Scholar] [CrossRef]
- Shi, J.Q.; Durucan, S. Drawdown Induced Changes in Permeability of Coalbeds: A New Interpretation of the Reservoir Response to Primary Recovery. Transp. Porous Media 2004, 56, 1–16. [Google Scholar] [CrossRef]
- Zhang, H.; Liu, J.; Elsworth, D. How sorption-induced matrix deformation affects gas flow in coal seams: A new FE model. Int. J. Rock Mech. Min. Sci. 2008, 45, 1226–1236. [Google Scholar] [CrossRef]
- Robertson, E.P.; Christiansen, R.L. A permeability model for coal and other fractured, sorptive-elastic media. In Proceedings of the SPE Eastern Regional Meeting, Canton, OH, USA, 11–13 October 2006. [Google Scholar] [CrossRef]
- Liu, H.H.; Rutqvist, J.; Oldenburg, C.M. A new coal-permeability model: Internal swelling stress and fracture-matrix interaction. Transp. Porous Media 2010, 82, 157–171. [Google Scholar] [CrossRef]
- Chen, Z.; Pan, Z.; Liu, J.; Connell, L.D.; Elsworth, D. Effect of the effective stress coefficient and sorption-induced strain on the evolution of coal permeability: Experimental observations. Int. J. Greenh. Gas Control 2011, 5, 1284–1293. [Google Scholar] [CrossRef]
- Chen, Z.; Liu, J.; Pan, Z.; Connell, L.D.; Elsworth, D. Influence of the effective stress coefficient and sorption-induced strain on the evolution of coal permeability: Model development and analysis. Int. J. Greenh. Gas Control 2012, 8, 101–110. [Google Scholar] [CrossRef]
- Liu, J.; Wang, J.; Chen, Z.; Wang, S.; Elsworth, D.; Jiang, Y. Impact of transition from local swelling to macro swelling on the evolution of coal permeability. Int. J. Coal Geol. 2011, 88, 31–40. [Google Scholar] [CrossRef]
- Peng, Y.; Liu, J.; Wei, M.; Pan, Z.; Connell, L.D. Why coal permeability changes under free swellings: New insights. Int. J. Coal Geol. 2014, 133, 35–46. [Google Scholar] [CrossRef]
- Peng, Y.; Liu, J.; Zhu, W.; Pan, Z.; Connell, L. Benchmark assessment of coal permeability models on the accuracy of permeability prediction. Fuel 2014, 132, 194–203. [Google Scholar] [CrossRef]
- Robertson, E.P. Measurement and Modeling of Sorption-Induced Strain and Permeability Changes in Coal. Ph.D. Thesis, Colorado School of Mines, Arthur Lakes Library, Golden, CO, USA, 2005. [Google Scholar] [Green Version]
- Bai, M.; Elsworth, D.; Roegiers, J.C. Multiporosity/multipermeability approach to the simulation of naturally fractured reservoirs. Water Resour. Res. 1993, 29, 1621–1634. [Google Scholar] [CrossRef]
- Berryman, J.G.; Wang, H.F. The elastic coefficients of double-porosity models for fluid transport in jointed rock. J. Geophys. Res.-Solid Earth 1995, 100, 24611–24627. [Google Scholar] [CrossRef] [Green Version]
- Wang, C.; Liu, J.; Feng, J.; Wei, M.; Wang, C.; Jiang, Y. Effects of gas diffusion from fractures to coal matrix on the evolution of coal strains: Experimental observations. Int. J. Coal Geol. 2016, 162, 74–84. [Google Scholar] [CrossRef]
- Wu, Y.; Liu, J.; Elsworth, D.; Miao, X.; Mao, X. Development of anisotropic permeability during coalbed methane production. J. Nat. Gas Sci. Eng. 2010, 2, 197–210. [Google Scholar] [CrossRef]
- Cai, M.; Horii, H. A constitutive model of highly jointed rock masses. Mech. Mater. 1992, 13, 217–246. [Google Scholar] [CrossRef]
- Warren, J.; Root, P.J. The behavior of naturally fractured reservoirs. Soc. Petrol. Eng. J. 1963, 3, 245–255. [Google Scholar] [CrossRef]
- Chen, Z.; Liu, J.; Elsworth, D.; Pan, Z.; Wang, S. Roles of coal heterogeneity on evolution of coal permeability under unconstrained boundary conditions. J. Nat. Gas Sci. Eng. 2013, 15, 38–52. [Google Scholar] [CrossRef]
- Chilingar, G.V. Relationship between porosity, permeability, and grain-size distribution of sands and sandstones. In Developments in Sedimentology; Straaten, L.M.J.U.V., Ed.; Elsevier Science Publishers: Amsterdam, The Netherlands, 1964; Volume 1, pp. 71–75. [Google Scholar]
- Witherspoon, P.A.; Wang, J.S.; Iwai, K.; Gale, J.E. Validity of cubic law for fluid flow in a deformable rock fracture. Water Resour. Res. 1980, 16, 1016–1024. [Google Scholar] [CrossRef]
- Saghafi, A.; Faiz, M.; Roberts, D. CO2 storage and gas diffusivity properties of coals from Sydney Basin, Australia. Int. J. Coal Geol. 2007, 70, 240–254. [Google Scholar] [CrossRef]
- Biot, M.A. General Theory of Three-Dimensional Consolidation. J. Appl. Phys. 1941, 12, 155–164. [Google Scholar] [CrossRef]
- Noorishad, J.; Tsang, C.-F. Coupled thermohydroelasticity phenomena in variably saturated fractured porous rocks--formulation and numerical solution. In Developments in Geotechnical Engineering; Stephansson, O., Ed.; Elsevier Science Publishers: Amsterdam, The Netherlands, 1996; Volume 79, pp. 93–134. [Google Scholar]
- Qu, H.; Liu, J.; Pan, Z.; Connell, L. Impact of matrix swelling area propagation on the evolution of coal permeability under coupled multiple processes. J. Nat. Gas Sci. Eng. 2014, 18, 451–466. [Google Scholar] [CrossRef]
- Renshaw, C.E. On the relationship between mechanical and hydraulic apertures in rough-walled fractures. J. Geophys. Res.-Solid Earth 1995, 100, 24629–24636. [Google Scholar] [CrossRef]
- Zimmerman, R.W.; Bodvarsson, G.S. Hydraulic conductivity of rock fractures. Transp. Porous Media 1996, 23, 1–30. [Google Scholar] [CrossRef]
Figure 1.
Numerical model under the unconstrained (constant total stress) boundary condition. (a) Multiple fracture compartment model; (b) single fracture compartment model as a representative element.
Figure 1.
Numerical model under the unconstrained (constant total stress) boundary condition. (a) Multiple fracture compartment model; (b) single fracture compartment model as a representative element.

Figure 2.
Schematic diagram of the compressive stress state.

Figure 3.
Comparison of simulation results with the analytical solution.

Figure 4.
Boundary conditions for different treatment of the fracture. (a) The fracture is regarded as a void; (b) the fracture is regarded as a soft inclusion.
Figure 4.
Boundary conditions for different treatment of the fracture. (a) The fracture is regarded as a void; (b) the fracture is regarded as a soft inclusion.

Figure 5.
Temporal evolution of pore pressure at four representative points in the matrix.

Figure 6.
Temporal effects of different mechanisms on fracture aperture change. (a) Individual effect; (b) combined effect.
Figure 6.
Temporal effects of different mechanisms on fracture aperture change. (a) Individual effect; (b) combined effect.

Figure 7.
Temporal evolution of the bulk deformation of the representative component geometry.

Figure 8.
Matrix volume strain distribution at different times.

Figure 9.
Evolution of volumetric strain and pore pressure at Point F, together with fracture pressure.
Figure 9.
Evolution of volumetric strain and pore pressure at Point F, together with fracture pressure.

Figure 10.
Temporal evolution of matrix permeability ratio.

Figure 11.
Evolution of fracture aperture change for different assumed fracture properties.

Figure 12.
Evolution of fracture aperture change for different initial matrix permeabilities.

Figure 13.
Evolution of each component in overall aperture change from fracture pressure and pore pressure at Point D at different injection characteristic times. (a) td = 5 s; (b) td = 100 s; (c) td = 750 s; (d) td = 10000 s.
Figure 13.
Evolution of each component in overall aperture change from fracture pressure and pore pressure at Point D at different injection characteristic times. (a) td = 5 s; (b) td = 100 s; (c) td = 750 s; (d) td = 10000 s.

Figure 14.
Evolution of fracture pressure and pore pressure at Point D for different injection pressure increments. Pf denotes the fracture pressure and PPD denotes the pore pressure at Point D.
Figure 14.
Evolution of fracture pressure and pore pressure at Point D for different injection pressure increments. Pf denotes the fracture pressure and PPD denotes the pore pressure at Point D.

Figure 15.
Evolution of fracture aperture change for different injection pressure increments. (a) Overall aperture change; (b) aperture change induced by fracture pressure and gas transport in matrix.
Figure 15.
Evolution of fracture aperture change for different injection pressure increments. (a) Overall aperture change; (b) aperture change induced by fracture pressure and gas transport in matrix.

Figure 16.
Evolution of pressure and aperture change for different confining pressures. (a) Fracture pressure and pore pressure at Point D; (b) overall facture aperture change.
Figure 16.
Evolution of pressure and aperture change for different confining pressures. (a) Fracture pressure and pore pressure at Point D; (b) overall facture aperture change.

Figure 17.
Uneven deformation and permeability ratio in the matrix induced by different confining pressures.
Figure 17.
Uneven deformation and permeability ratio in the matrix induced by different confining pressures.

Figure 18.
Verification model. (a) Typical section of coal sample; (b) Model implemented in the simulation.
Figure 18.
Verification model. (a) Typical section of coal sample; (b) Model implemented in the simulation.

Figure 19.
Distribution of permeability ratio along the fracture.

Figure 20.
Evolution of coal average permeability ratio.

Figure 21.
Evolution of fracture average permeability ratio at different initial matrix permeabilities.
Figure 21.
Evolution of fracture average permeability ratio at different initial matrix permeabilities.

Figure 22.
Distribution of permeability ratio along the fracture when km0 = 4 × 10⁻²¹ m2.


Table 1.
Input parameters used for validation.
| Parameter | Value |
|---|---|
| Young’s modulus, MPa | 6 × 10⁻³ |
| Poisson’s ratio | 0.4 |
| Matrix porosity | 0.2 |
| Matrix permeability, m2 | 4 × 10⁻⁶ |
| Biot’s coefficient | 1.0 |
| Water density, kg/m3 | 1000 |
| Dynamic viscosity, Pa·s | 1 × 10⁻³ |
| Thermal conductivity, kJ/(m·s·K) | 0.836 |
| Specific heat, kJ/(m3·K) | 167.0 |
| Linear thermal expansion coefficient, 1/K | 3 × 10⁻⁷ |
Table 2.
Material properties used in simulations.
| Parameter | Matrix-fracture Model CH4 | Verification Model CO2 |
|---|---|---|
| Matrix porosity, φm0 | 0.05 | 0.027 |
| Matrix permeability, km0 (m2) | 10−20 | 4 × 10⁻²³ |
| Matrix density, ρc (kg/m3) | 1500 | 1500 |
| Matrix Young’s modulus, Em (GPa) | 3.95 | 5.42 |
| Fracture Young’s modulus, Ef (GPa) | - | Em/2000 |
| Poisson ratio, v | 0.1 | 0.34 |
| Biot’s coefficient, α | 0.66 | 0.66 |
| Langmuir strain constant, εL | 0.03 | 0.0119 |
| Langmuir volume constant, VL (m3/kg) | 0.01316 | 0.0477 |
| Langmuir pressure constant, PL (MPa) | 3.96 | 2.76 |
| Gas density at standard condition, ρga (kg/m3) | 0.717 | 1.96 |
| Gas viscosity, μ (Pa·s) | 1.2278 × 10⁻⁵ | 1.84 × 10⁻⁵ |
| Temperature, T (K) | 298.15 | 298.15 |
| Confining pressure, Pcon (MPa) | 0 | 0 |
| Initial reservoir pressure, Pini (MPa) | 0 | 0 |
| Injection pressure increment, Pc (MPa) | 6 | - |
| Injection starting time, tp (s) | 5 | - |
| Injection speed characteristic time, td (s) | 750 | - |
Table 3.
Simulations for the investigation of dynamic fracture–matrix interaction.
| Parameter Investigated | Value |
|---|---|
| Fracture properties, Ef | Void, Em/1000, Em/100, Em/10 |
| Initial matrix permeability, km0 (m2) | 10−18, 10−20, 10−22, 10−24 |
| Injection speed characteristic time, td (s) | 5, 100, 750, 10,000 |
| Injection pressure increment, Pc (MPa) | 2, 4, 6, 8 |
| Confining pressure, Pcon (MPa) | 0, 4, 8, 12 |
© 2018 by the authors. Licensee MDPI, Basel, Switzerland. This article is an open access article distributed under the terms and conditions of the Creative Commons Attribution (CC BY) license (http://creativecommons.org/licenses/by/4.0/).
Share and Cite
MDPI and ACS Style
Liu, X.; Sheng, J.; Liu, J.; Hu, Y. Evolution of Coal Permeability during Gas Injection—From Initial to Ultimate Equilibrium. Energies 2018, 11, 2800. https://0-doi-org.brum.beds.ac.uk/10.3390/en11102800
AMA Style
Liu X, Sheng J, Liu J, Hu Y. Evolution of Coal Permeability during Gas Injection—From Initial to Ultimate Equilibrium. Energies. 2018; 11(10):2800. https://0-doi-org.brum.beds.ac.uk/10.3390/en11102800
Chicago/Turabian StyleLiu, Xingxing, Jinchang Sheng, Jishan Liu, and Yunjin Hu. 2018. "Evolution of Coal Permeability during Gas Injection—From Initial to Ultimate Equilibrium" Energies 11, no. 10: 2800. https://0-doi-org.brum.beds.ac.uk/10.3390/en11102800
Note that from the first issue of 2016, this journal uses article numbers instead of page numbers. See further details here.