Petrophysical Characterization and Fractal Analysis of Carbonate Reservoirs of the Eastern Margin of the Pre-Caspian Basin

1
State Key Laboratory of Petroleum Resources and Prospecting, China University of Petroleum, Beijing 102249, China
2
Beijing Key Laboratory of Earth Prospecting and Information Technology, China University of Petroleum, Beijing 102249, China
3
CNPC Greatwall Drilling Company, Beijing 100101, China
4
Research Institute of Exploration and Development, Dagang Oilfield Company, PetroChina, Tianjin 300280, China
*
Authors to whom correspondence should be addressed.
Energies 2019, 12(1), 78; https://0-doi-org.brum.beds.ac.uk/10.3390/en12010078
Submission received: 18 November 2018
/
Revised: 22 December 2018
/
Accepted: 24 December 2018
/
Published: 28 December 2018
(This article belongs to the Special Issue Flow and Transport Properties of Unconventional Reservoirs 2018)
Abstract
:Petrophysical properties including pore structure and permeability are essential for successful evaluation and development of reservoirs. In this paper, we use casting thin section and mercury intrusion capillary pressure (MICP) data to investigate the pore structure characterization, permeability estimation, and fractal characteristics of Carboniferous carbonate reservoirs in the middle blocks of the eastern margin of the Pre-Caspian Basin. Rock casting thin sections show that intergranular and intragranular dissolution pores are the main storage spaces. The pore throats greater than 1 μm and lower than 0.1 μm account for 47.98% and 22.85% respectively. A permeability prediction model was proposed by incorporating the porosity, Swanson, and R35 parameters. The prediction result agrees well with the core sample data. Fractal dimensions based on MICP curves range from 2.29 to 2.77 with an average of 2.61. The maximum mercury intrusion saturation is weakly correlated with the fractal dimension, while the pore structure parameters such as displacement pressure and median radii have no correlation with fractal dimension, indicating that single fractal dimension could not capture the pore structure characteristics. Finally, combined with the pore types, MICP shape, and petrophysical parameters, the studied reservoirs were classified into four types. The productivity shows a good correlation with the reservoir types.
1. Introduction
Carbonate reservoirs play an important role in the world’s oil and gas distribution. Its oil and gas account for about 50% of the world’s total oil and gas reserves and more than 60% of the world’s total oil and gas production [1,2]. The reservoirs of many important oil and gas producing areas in the world are mainly carbonate rocks. The Caspian Basin located at the north of the Caspian Sea is one of the largest oil and gas-bearing basins [3,4]. The Carboniferous carbonate reservoirs of the eastern part of the Pre-Caspian Basin are favorable petroleum reservoirs [5]. Carbonate reservoirs are commonly characterized by high heterogeneity due to a variety of storage space combinations [6]. Petrophysical properties including micro pore structure, macro porosity, and permeability are essential for successful evaluation and development of reservoirs [7,8]. Therefore, it is necessary to study the petrophysical characterization of the Carboniferous carbonate reservoirs in the eastern margin of the Pre-Caspian Basin.
Previous studies on the Carboniferous carbonate reservoirs in the Pre-Caspian Basin including sequence stratigraphic and depositional setting [9,10], geochemical properties [11], oil and gas accumulation model [12,13], reservoir property including pore types [14] have been reported. However, study on the petrophysical properties has not been enough to date. He et al. [6] studied the relationship between porosity and permeability of this area and analyzed the influence factors. Miao et al. [15] reported the pore development characteristics and well logging responses of porosity, fracture, and vugs. He [16] investigated the storage space types and their evaluation and estimation using well logs. Macroscopic parameters such as porosity and permeability are usually derived from microscopic pore structure parameters.
Rock casting thin section, scanning electron microscope (SEM) [17,18], and transmission electron microscope (TEM) [19] can provide the pore types and qualitative pore space. Mercury intrusion capillary pressure (MICP) data is an important means to quantitatively study the pore structure characteristics of the reservoirs [20,21]. It can directly reflect the pore structure and performance of the reservoir, and capture the ranges of pore throat radius from 3.6 nm to a few microns in rocks [22]. Commonly used microscopic pore structure parameters include displacement pressure, median capillary pressure, irreducible water saturation, and maximum pore throat radius, etc. The MICP data are also used to estimate the permeability based on some key parameters, such as Swanson and R35 parameters [23,24,25]. Although low temperature gas adsorption curves including N2 and CO2 adsorption can provide smaller pore size distributions, they may be applicable in unconventional reservoirs [22]. The nuclear magnetic resonance (NMR) method is important in clastic rock and unconventional shale [26,27], but it does not always work for carbonate reservoirs as the relaxativity of carbonate minerals is too low to satisfy the theory of NMR [28].
In addition, fractal analysis conducted based on rock pore size distributions provided by MICP or gas adsorption could be used to assistant in studying pore structure of rocks [29,30]. Fractal geometry was proposed by Mandelbrot [31] to study porous media including rocks and other materials. The fractal dimension (D) is one of the key parameters in fractal geometry theory, describing the complexity and heterogeneity of pore space and particles [31,32,33,34,35]. Krohn [36] determined the fractal dimensions of pore–rock interface for Smackover Formation carbonates in Arkansas using SEM pictures, which range from 2.27 to 2.75. Billi [37] reported the fractal dimensions of particle size distributions in carbonate cataclastic rocks, which are from the core of a regional strike–slip fault zone in the foreland of the Southern Apennines, Italy, and are in the range of 2.09–2.93. Based on SEM images, Xie et al. [38] investigated the fractal characteristics of a Jurassic marine carbonate reservoir sample in western Hubei and eastern Sichuan region, China. The fractal dimension of pore size varies from 0.77 to 1.36. Liu et al. [39] used fractal characteristics to study the quantitative evaluation for pore structure in the carbonate reservoirs of Mishrif Formation of W oilfield in Iraq based on MICP data. It is of note that Ghanbarian-Alavijeh and Hunt [40] theoretically showed that fractal dimension can vary between minus infinity and 3. Thus, even negative D values are acceptable as reported by Ghanbarian and Sahimi [41].
In this study, taking the Carboniferous carbonate reservoirs in the middle blocks of the eastern margin of the Pre-Caspian Basin as an example, we investigated the pore structure characterization, permeability estimation, and fractal characteristics. According to the observations, we could define the reservoir types and studied their correlation with productivity. Rock casting thin section images were used to study the pore spaces and types. Mercury intrusion capillary pressure data was used to study the pore-throat size distribution, petrophysical property, and permeability estimation. Based on the box counting method, the fractal dimension of the samples was calculated. The carbonate reservoir classification was studied combining with the pore types, MICP shape, and petrophysical parameters. Thus, we could use the classification to predict the productivity.
In this paper, Section 2 includes geological setting, experimental methods and determination of fractal dimension using MICP. Section 3 presents the results and discussion of pore types and space, petrophysical characteristics, permeability estimation, fractal dimension, and reservoir classifications. Section 4 defines the main conclusions.
2. Materials and Methods
2.1. Geological Setting
The Pre-Caspian Basin, which is located in the north of the Caspian Sea, and underlies parts of Russia and Kazakhstan [12,14], is one of the world’s largest oil and gas basins with an area of more than 500,000 km2. It extends in the east–west direction, with a length of one thousand km and a maximum width of 650 km. The contour is approximately elliptical. It is a basin rich in oil and gas, but with a low degree of exploration. In the tectonic division, the Pre-Caspian Basin belongs to the southeastern part of the Eastern European platform. The northern and western parts of the basin are adjacent to the Paleozoic carbonate rock platform in the Volga–Ural Basin in the southern part of Eastern Europe. The northern and western parts of the basin are adjacent to the Hercynian fold belt (including the Southern Ural, Nanba, and Karakul etc.). The east is bordered by the Ural Haixi fold belt, the southwest is bordered by the Enba uplift and the southwest is bordered by the Karpinsky Haixi fold belt.
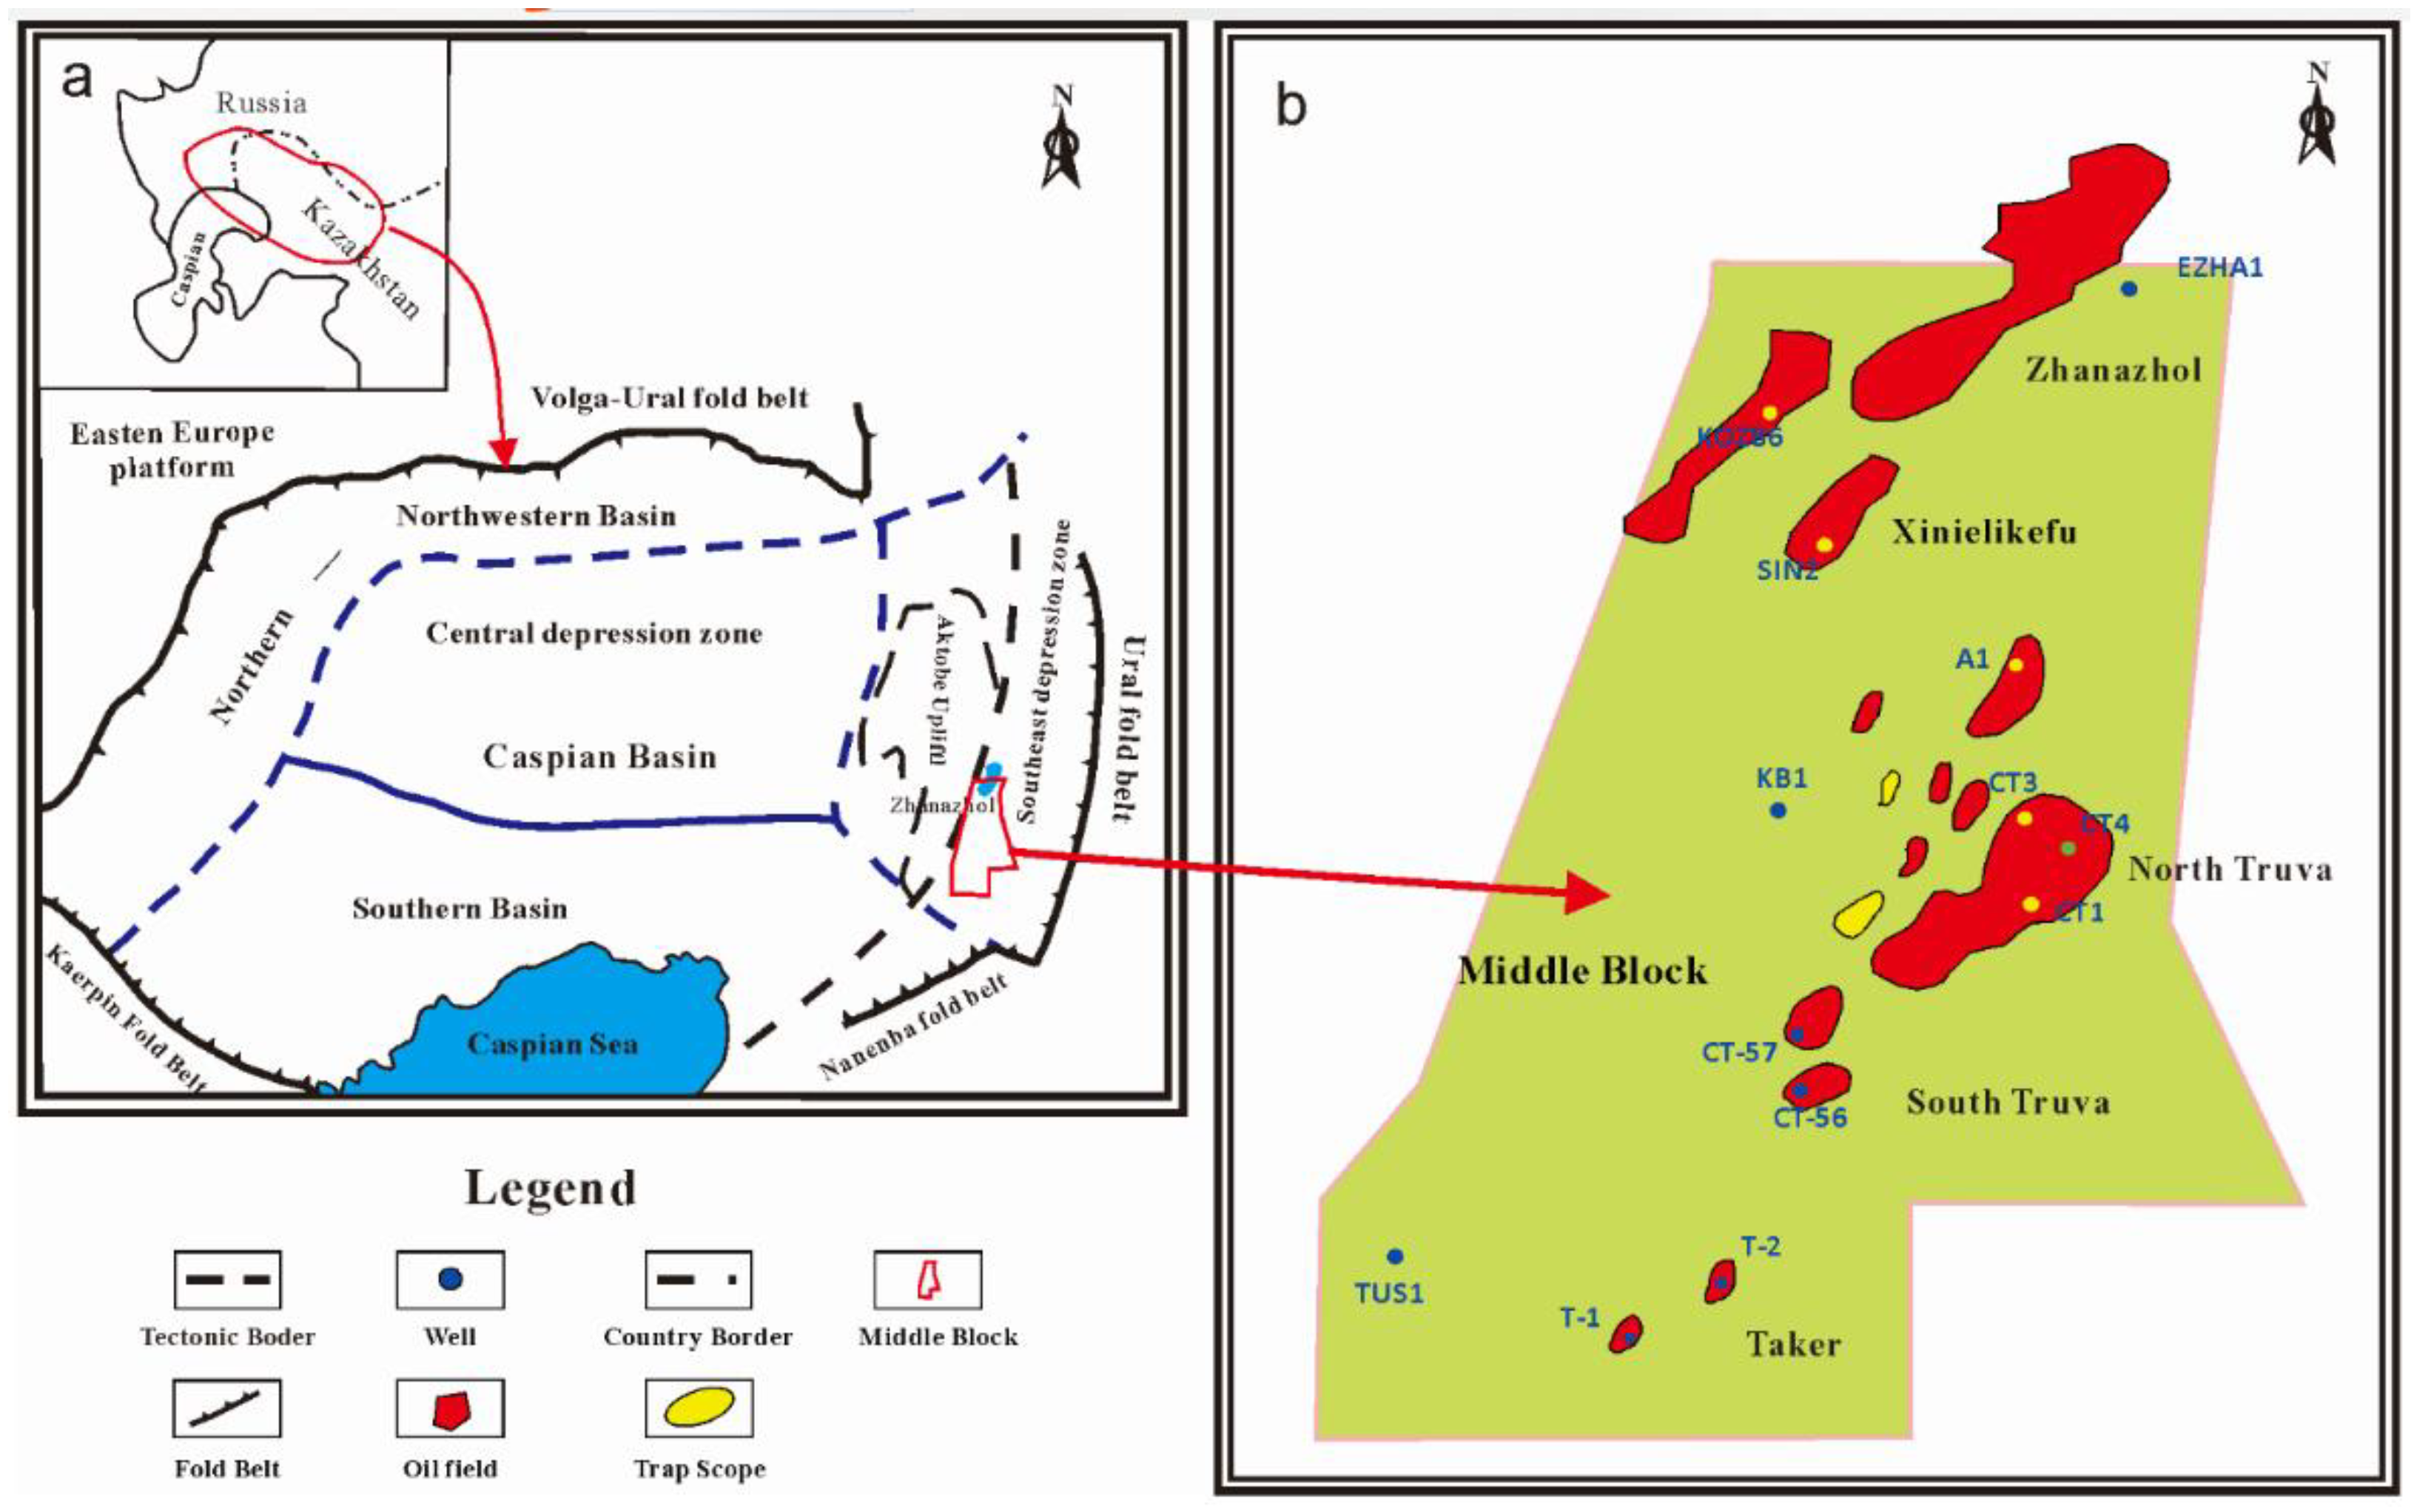
The Middle Block of the eastern margin of the basin is located in the Aktobe state. It is also located in the transitional zone between the Astrakhan–Akchubin central uplift and the Primm Gordgar ancient depression, which is the uplift of the Primm Gordgar Late Paleozoic. The Middle block is an important pointing zone for oil and gas migration, and the regional structural position is very favorable. Figure 1 shows the location of the study area.
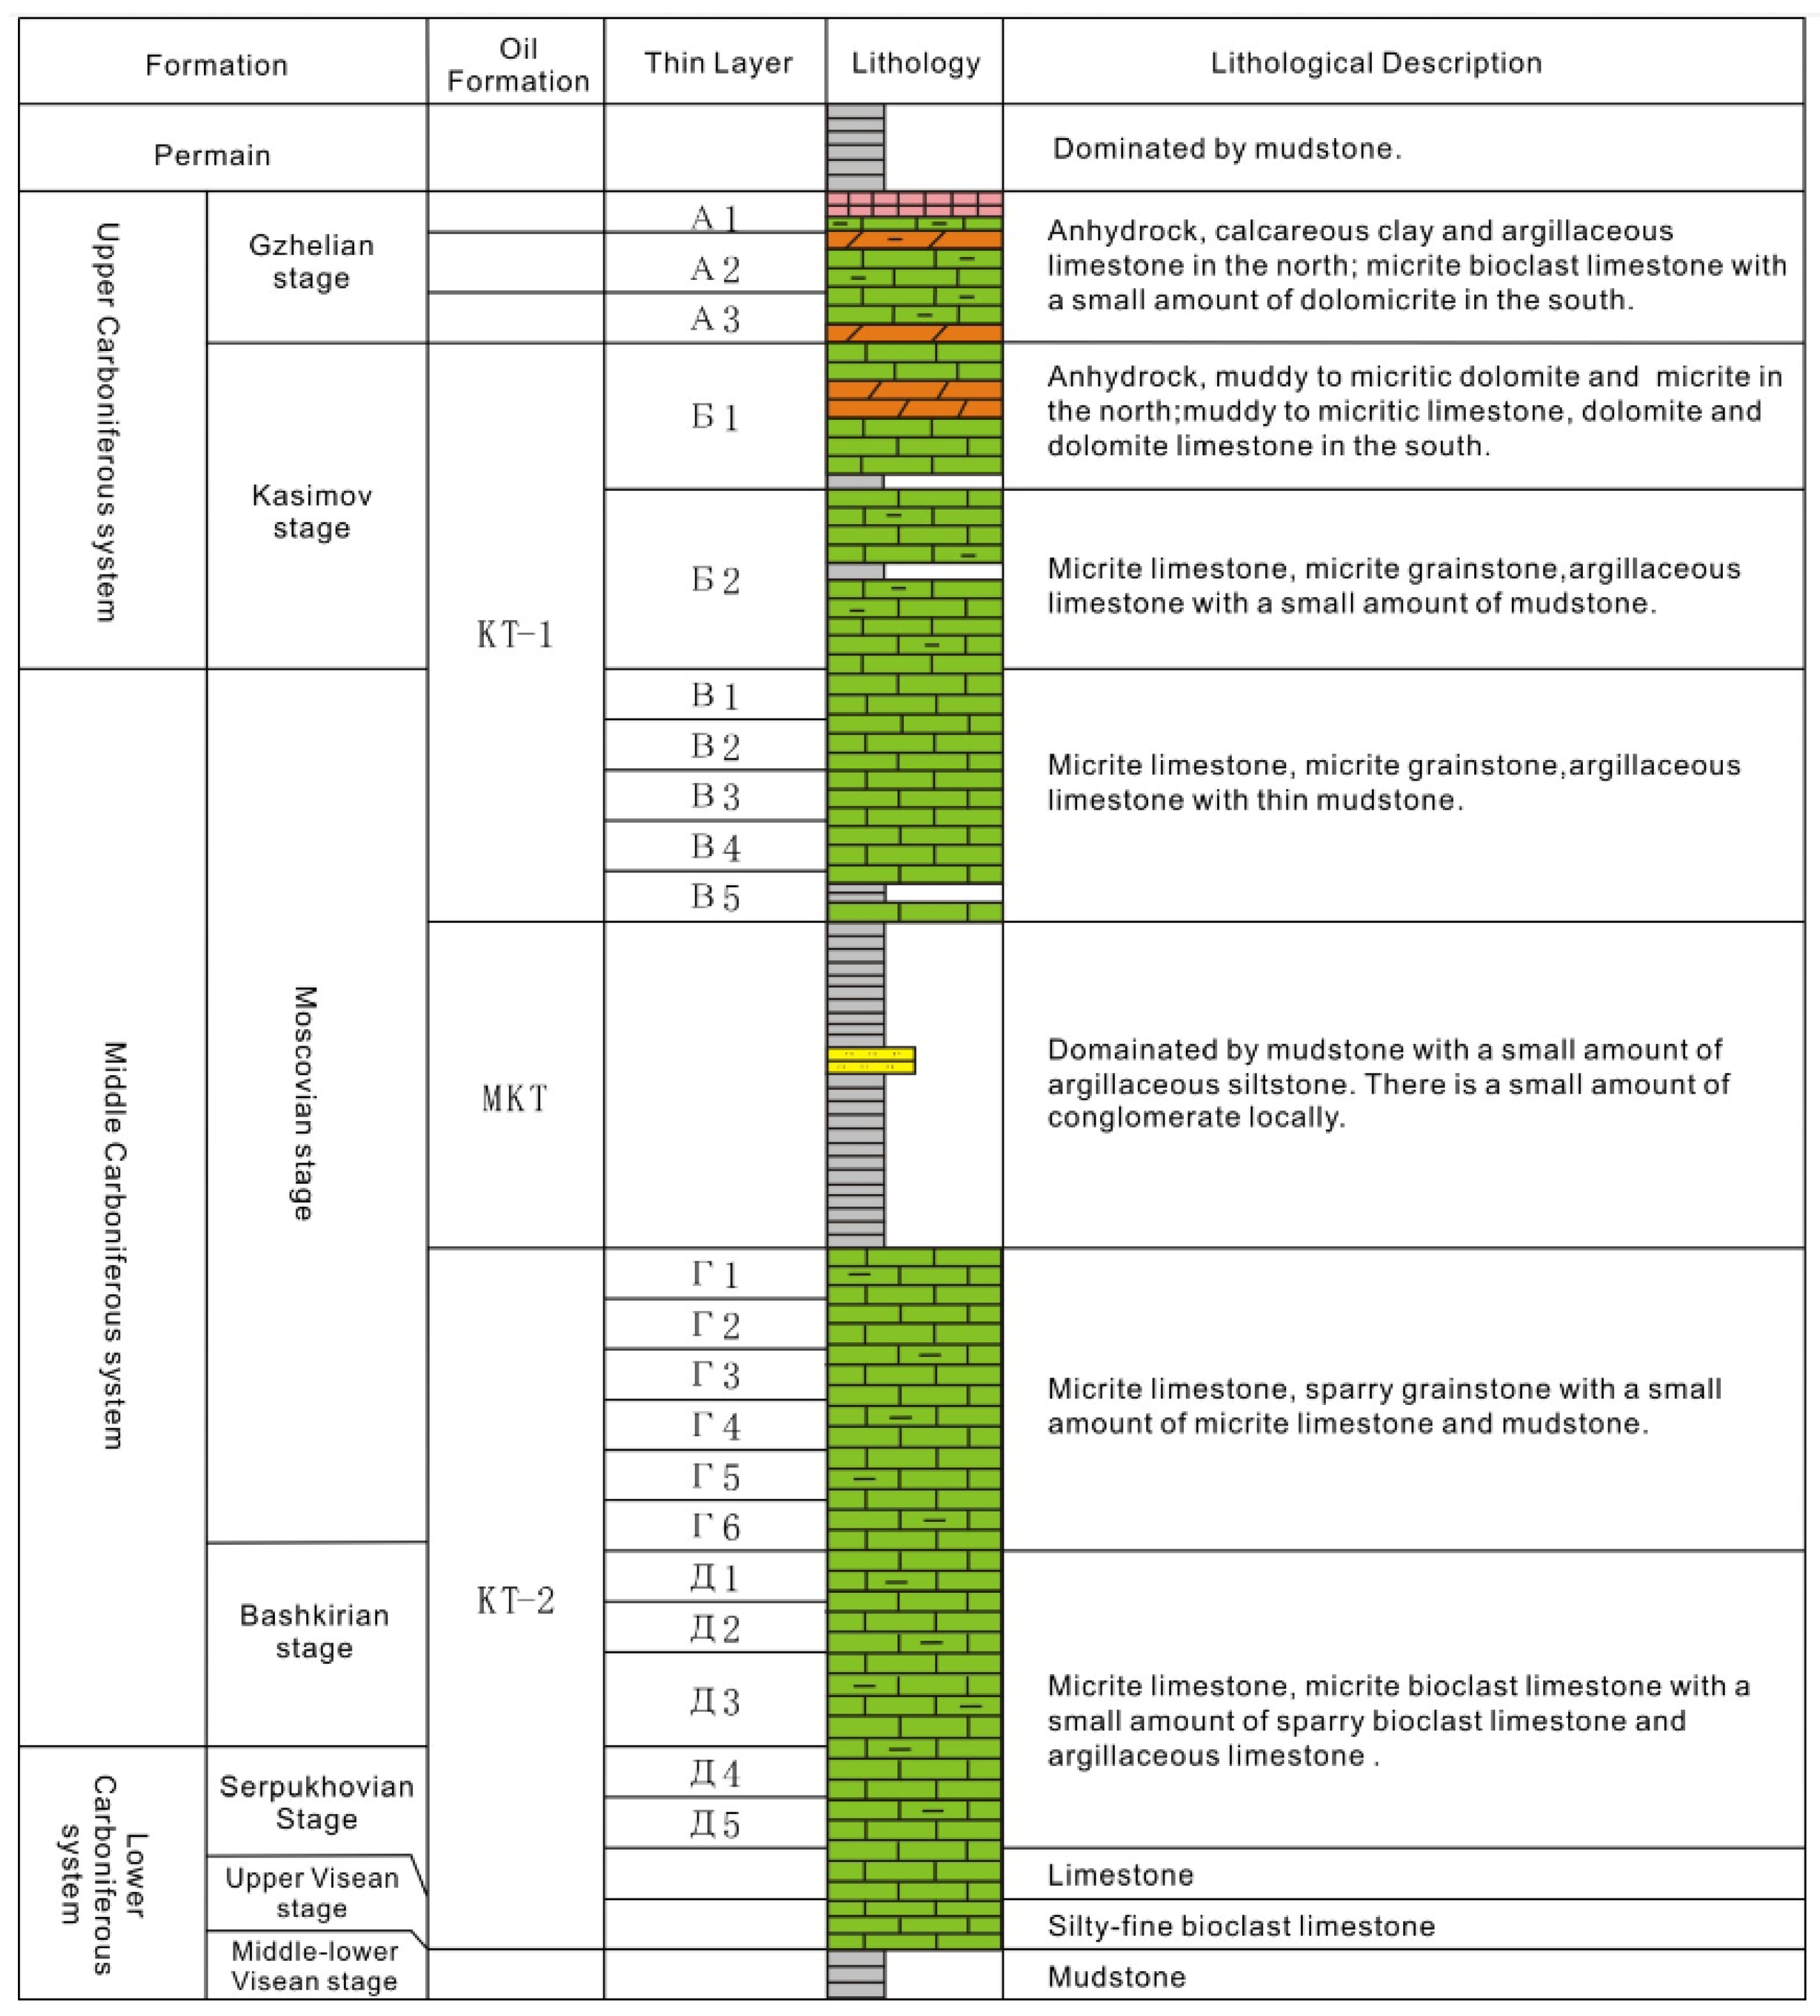
According to the drilling data of the block and surrounding oil and gas fields, the basin can be basically divided into the combination of carbonate and clastic rocks in the Lower Devonian-Carboniferous and Lower Permian, gypsum salt rock of Konggu Formation in the Lower Permian, and the Upper Permian-Triassic clastic rock deposit and the Jurassic-Cretaceous combination. The Mesozoic and the Upper Permian strata are clastic and dominated by sand and mudstone, and the Lower Permian pore-valley terrace is a set of salt rock strata, which was high-speed deposited. The distribution and thickness of salt rocks vary greatly. The Carboniferous in the Middle Block can be divided from top to bottom into carbonate and gypsum salt beds of KT-1 Formation, clastic rock of MKT Formation, carbonate rocks and a few mudstone of KT-2 Formation, as well as multi-Neixiqian sandstone and mudstone beds in the middle and lower part of the Uyxian Stage. The detailed information is depicted in Figure 2.
2.2. Experiment Methods
Thirty two plunger samples were carried out for porosity, permeability, and MICP measurements. The plunger has dimensions of diameter of 2.5 cm and length of 4 cm. The porosity and permeability are measured with a helium porosimeter. Before measurements, plugs were subjected to oil and salt washing and drying. After porosity and permeability measurements, the plunger samples were subjected to drying at 100 °C until the weight remained constant. Then, MICP data were determined with a mercury porosimeter. The minimum and the maximum intrusion pressure were denoted as 0.0035 MPa and 200 MPa, respectively. The 200 MPa of intrusion pressure guarantees the mercury can enter a small pore-throat, whose radius is low at roughly 3.7 nm. In addition, many samples for rock casting thin section analysis were drilled from four wells. These samples almost cover all the depths of KT-I and KT-II formation, which make this study more accurate.
2.3. Fractal Dimension
According to fractal geometry theory, if the pore space of a rock obeys the fractal structure, the pore radius r and the number of pores with a radius larger than r would follow a power-law function [31]:
where r and N(>r) are pore radius and the number of pores with radius larger than r and rmax is the maximum pore radius, P(r) is the distribution density function of the pore radius, α is a proportionality constant, D is the fractal dimension.
Based on some assumptions and transformation, the following equation was derived [31,42]:
where Sv is the cumulative volume fraction of pores with a radius smaller than r.
According to Washburn [20], mercury injection pressure and pore throat radius obey the following relationship:
where Pc is the capillary pressure, σ is the surface tension, and θ is the contact angle of mercury in air.
Combining Equations (2) and (3) and the basic principle of MICP, the follow equation is obtained:
where SHg is mercury saturation; Pcmin is the minimum of the capillary pressure.
By taking the logarithm on both sides on the above equation, the following relationship was obtained [43]:
For each sample, there is a series of (Pc, SHg) values. Thus, the fractal dimension can be determined by using MICP data.
3. Results and Discussion
3.1. Pore Spaces and Types
Similar to the carbonate reservoir in other study areas [44], the pore space of carbonate rocks in this study area is divided into three types: pores, fractures, and caves.
3.1.1. Pores
(1) Intergranular pores or intergranular dissolution pores
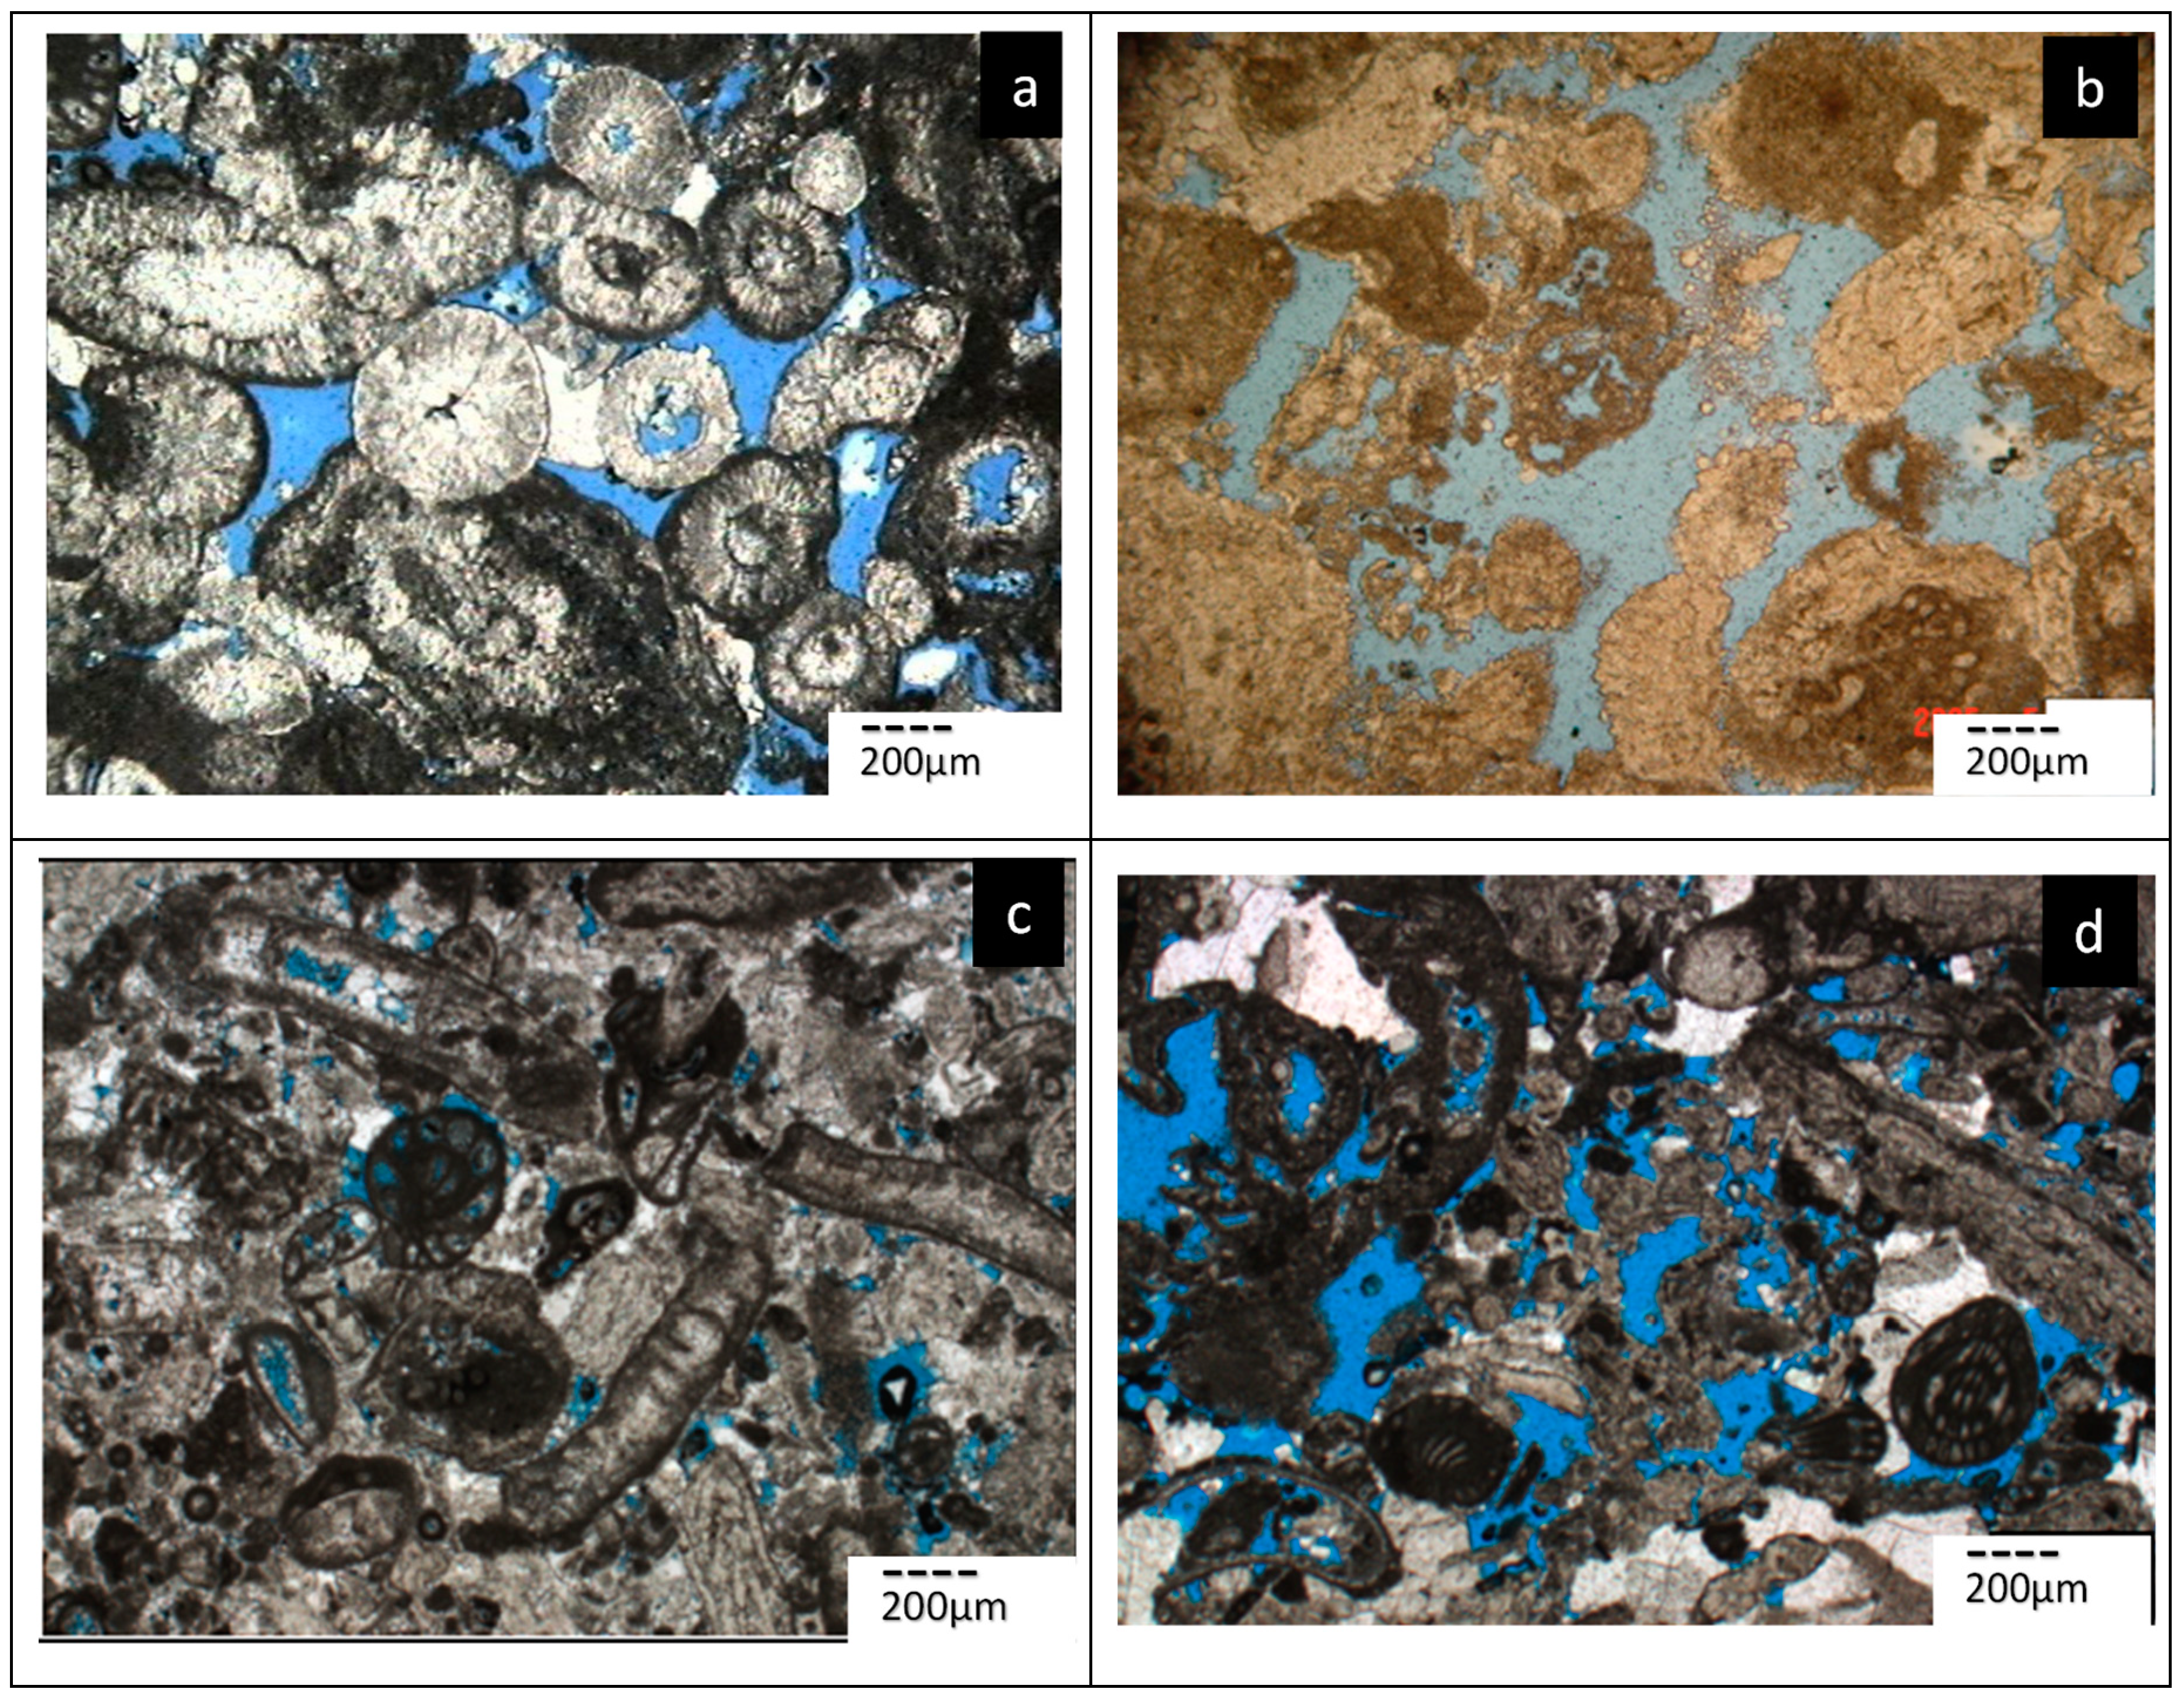
The Carboniferous carbonate granular rocks in the study area all have cements. Some of the rocks have intergranular residual pores due to insufficient cementation while some of the rocks have intergranular dissolution pores formed by later-stage dissolution of mud-crystal or columnar bright-crystal cement between the particles. The two types of pores mentioned above could be called intergranular pore. This is the main pore type in the Carboniferous reservoir, of which the visible porosity is between 0.2% and 18%. The intergranular dissolution pores are mainly distributed in the A3, Г layer, and the Д layer, which indicate good pore connectivity, and strong storage capacity of oil and gas (Figure 3). In the Г layer, granular limestone particles are coarse, the pore size is large in scale, and the connectivity is good. While particles in the Д layer are relatively fine, the size of the intergranular pores is relatively smaller, and the connectivity is relatively poorer.
(2) Intragranular dissolution pores
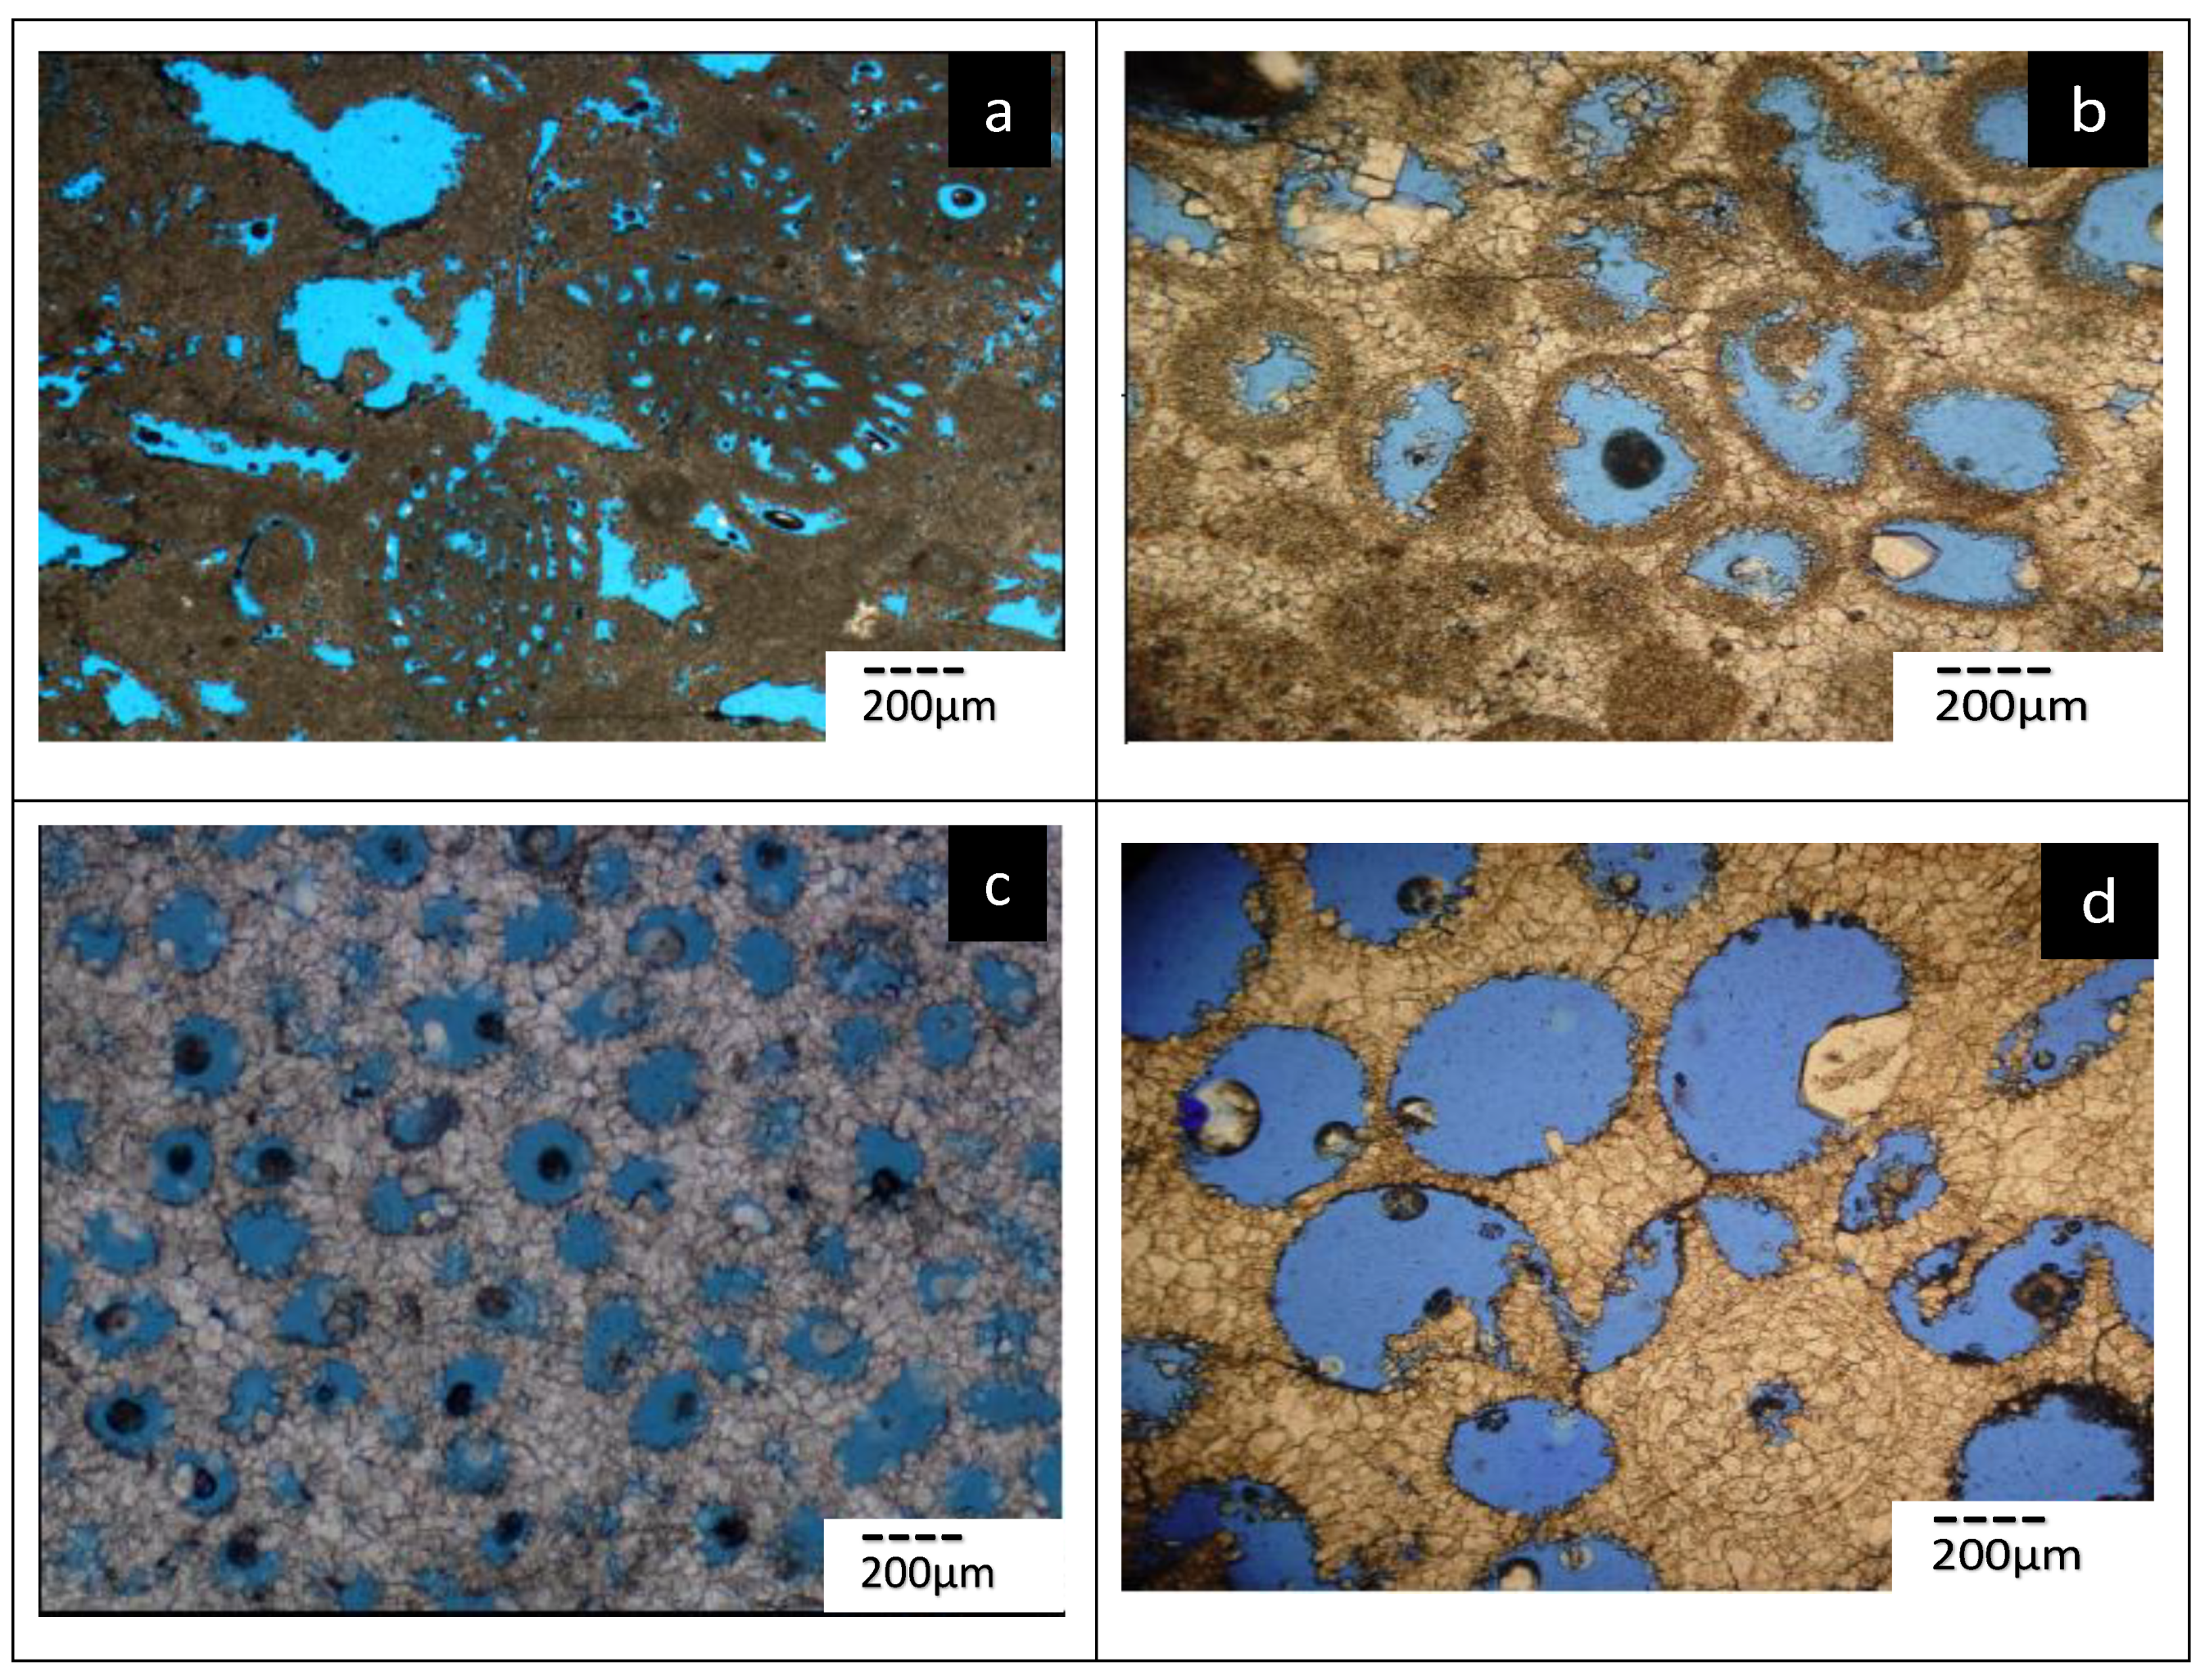
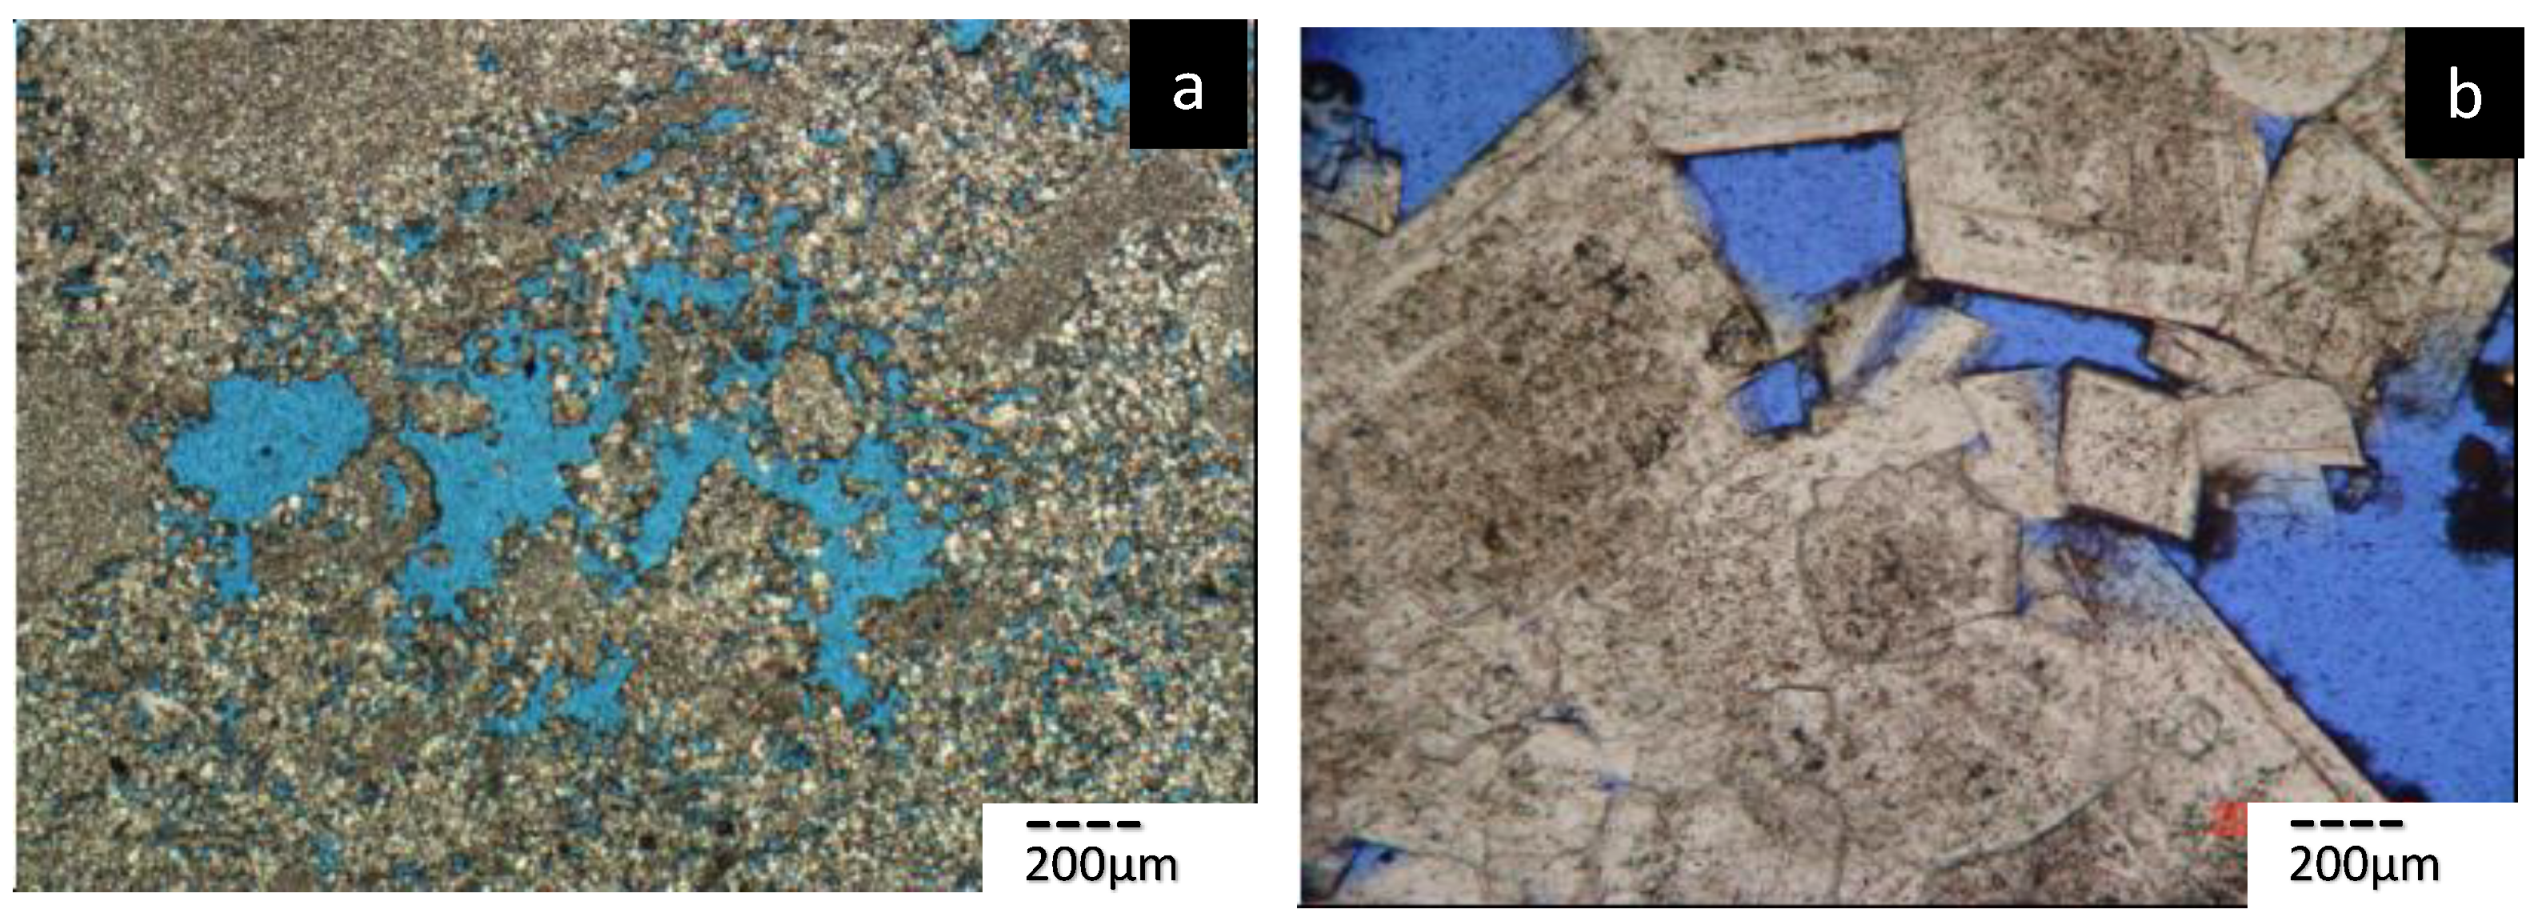
The intragranular dissolution pores are the pores that are formed by the later dissolution within the particles, such as ooids, biological debris, and sands (Figure 4). Pores in which the particles or grains are completely dissoluted but still retain the original particle or grain shape are called moldic pore. The pores formed in the body cavity of the biological granular which due to decay or erosion of the body are called intrafosill pores. In addition, there are a small number of intraskeletal pores. All of these pores are referred to as intragranular pores, which are also important pore types of the Carboniferous reservoirs in the North Truva.
The intrafosill, intragranular dissolution, and moldic pores are more developed in the carboniferous system of the North Truva structure. The visible porosity of the thinsection in which the intrafossil pores developed is between 0.1% and 15%, with an average of about 2%. The visible porosity of the thin section in which the intra-granular dissolution pores developed is between 0.2% and 15%, and with an average of about 2%. The visible porosity of the thin section in which moldic pores developed ranges from 0.1% to 35%, and the average value is about 5%. The larger the visible porosity is, the better the reservoir property.
(3) Intercrystalline and intercrystalline dissolution pores
The pores existing among the euhedral dolomite, subhedral dolomite or calcite grains are intercrystal (Figure 5). The void areas formed by the dissolution of the soluble components such as residual calcite or gypsum between the dolomite crystals are intercrystal dissolution pores. The visible porosity of the thin section, the intercrystal pore, is between 2% and 15%. They are mainly concentrated in the dolomite of the Carboniferous B1 layer. They can be also observed in the Д layer.
3.1.2. Fractures
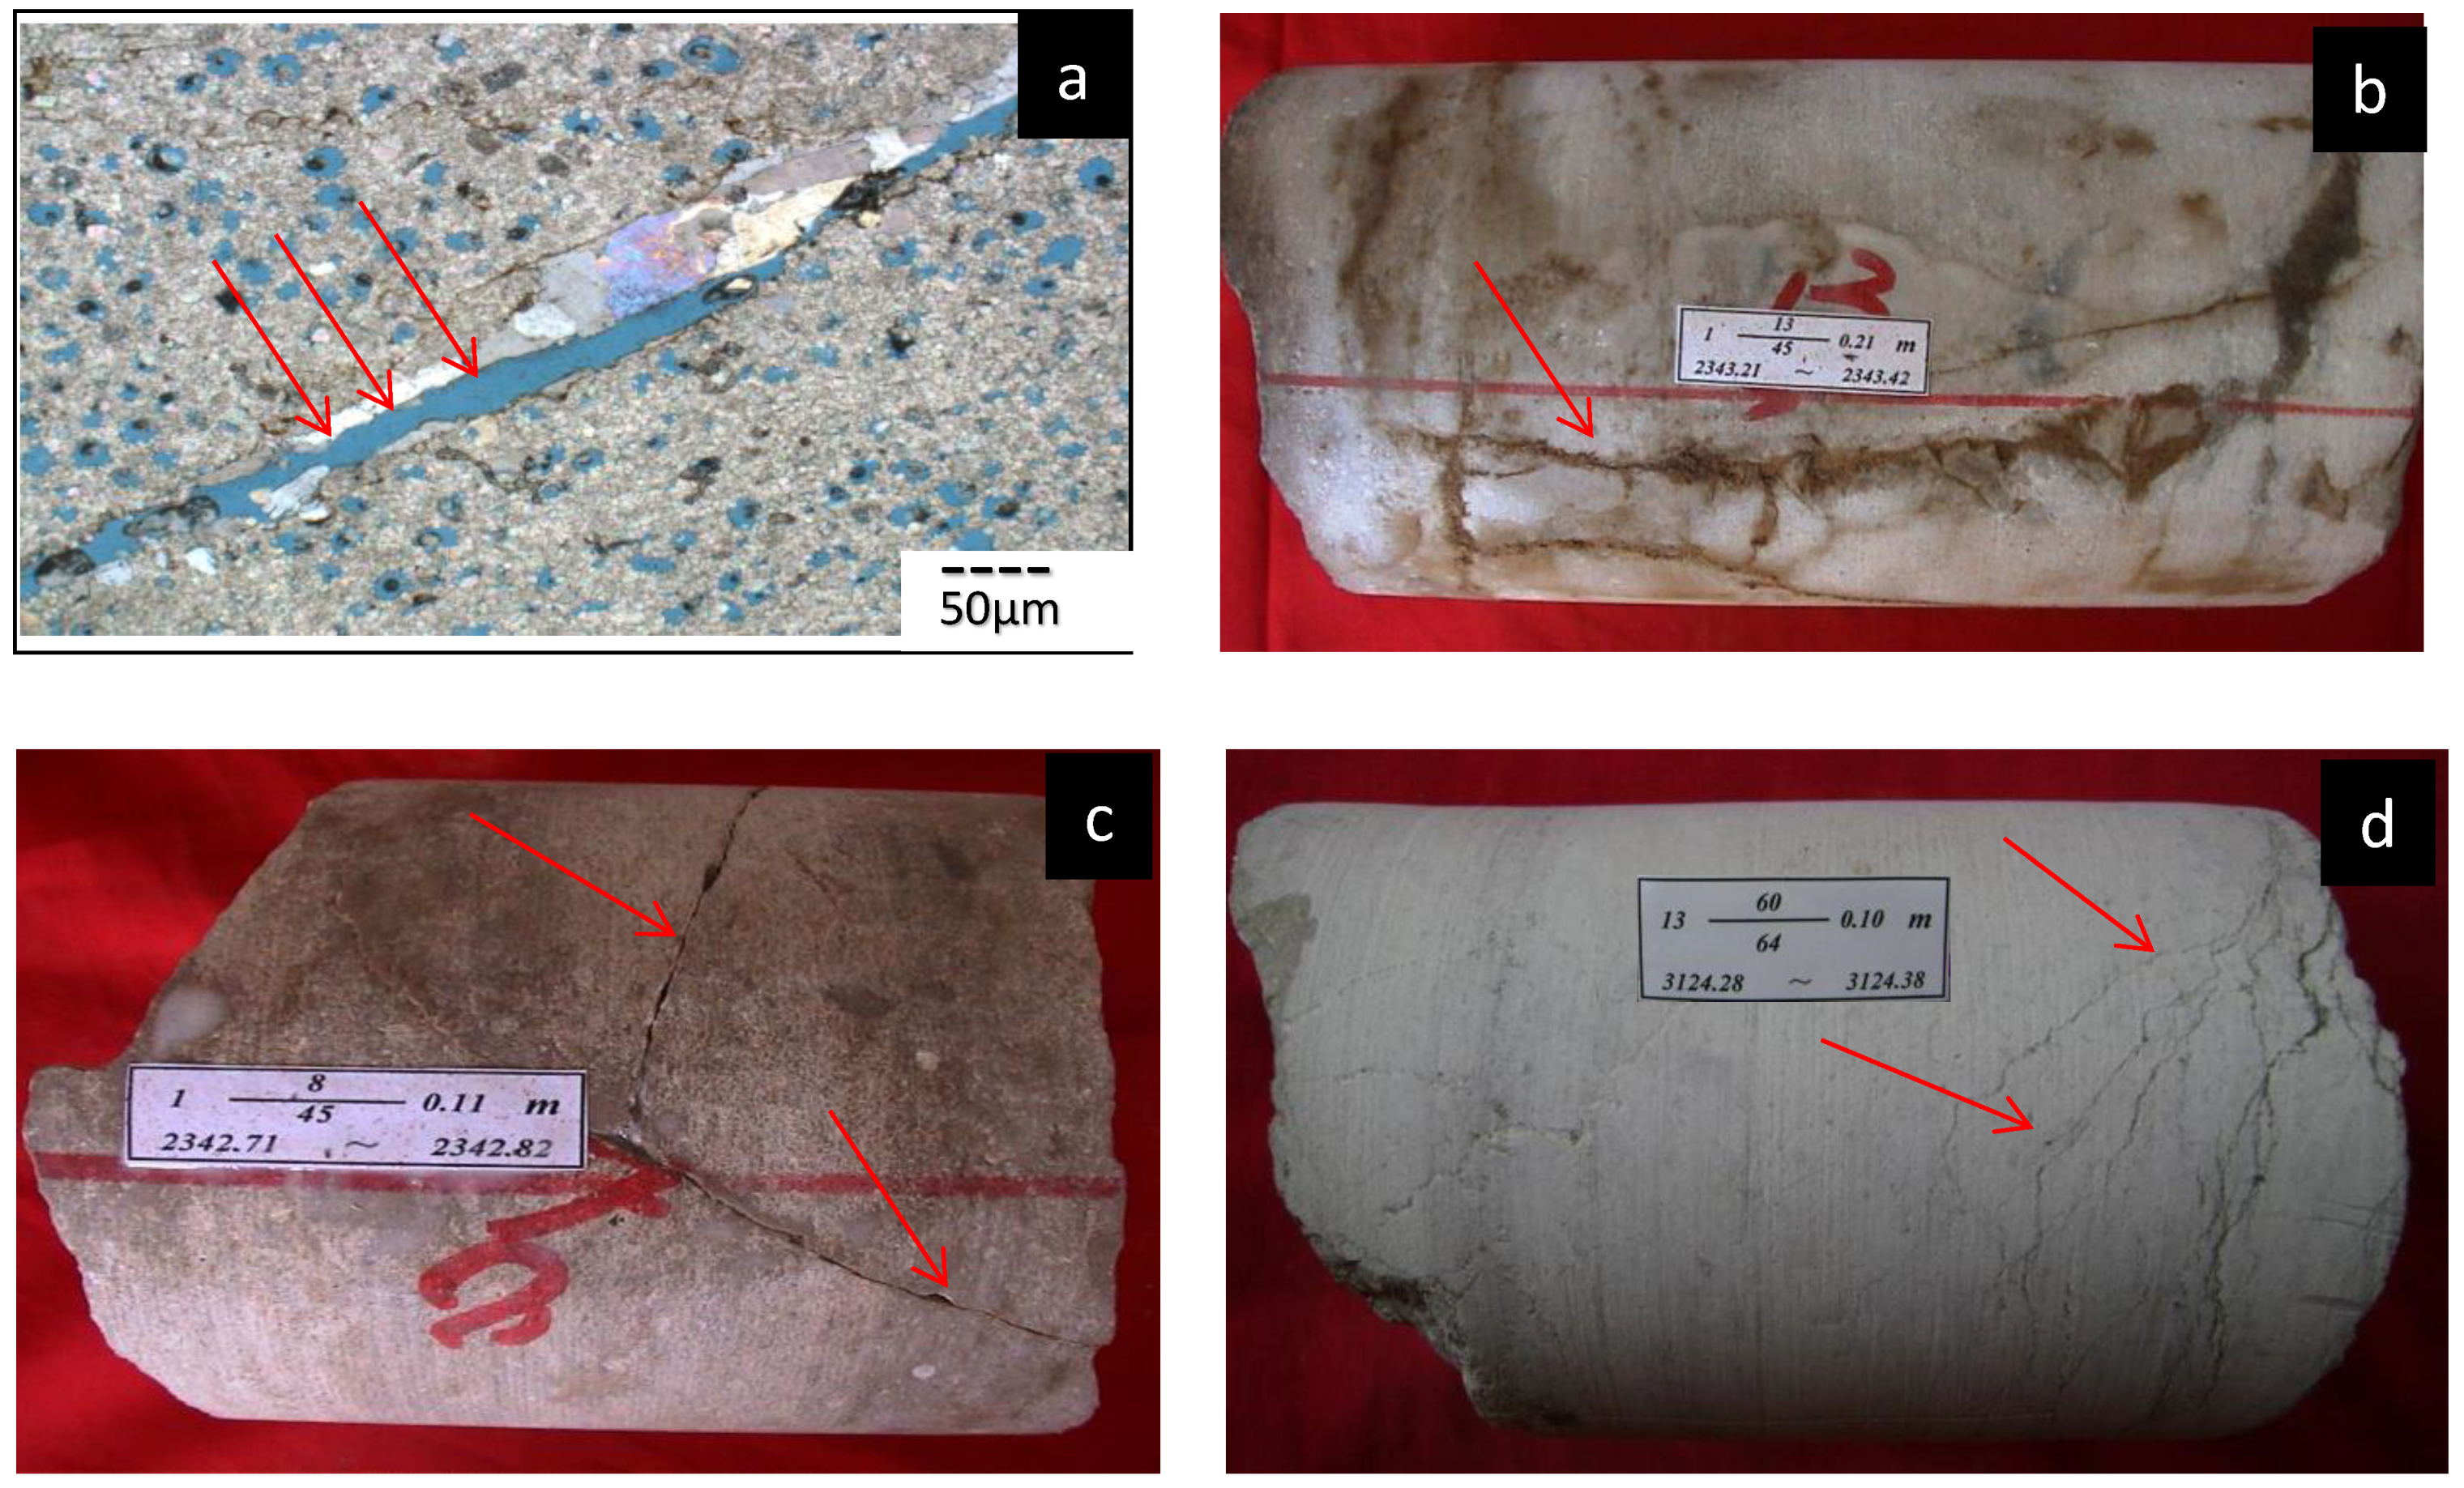
Fractures are important percolating channels for the reservoirs. According to the core observation and the casting thin section, the North Truva Carboniferous cracks mainly include four types: dissolution fracture, tectonic fracture, stylolite fracture, and grain cracks (Figure 6). These cracks not only have a certain impact on the reservoir storage, but also have a significant effect on connecting pores and improving reservoir permeability. They are also conducive to the development of dissolution holes, thus forming a unified pore, hole, and fracture system and further improving the reservoir permeability of the reservoir. Fractures in the upper part of the KT-1 layer develop more than other locations.
3.1.3. Dissolution Cavern
Dissolution pores with diameter larger than 2 mm are called caverns. The pores with diameters between 2 and 5 mm are called small caverns, while those with diameters of 5 to 10 mm are called middle size caverns, while those with diameters larger than 10 mm are called large caverns.
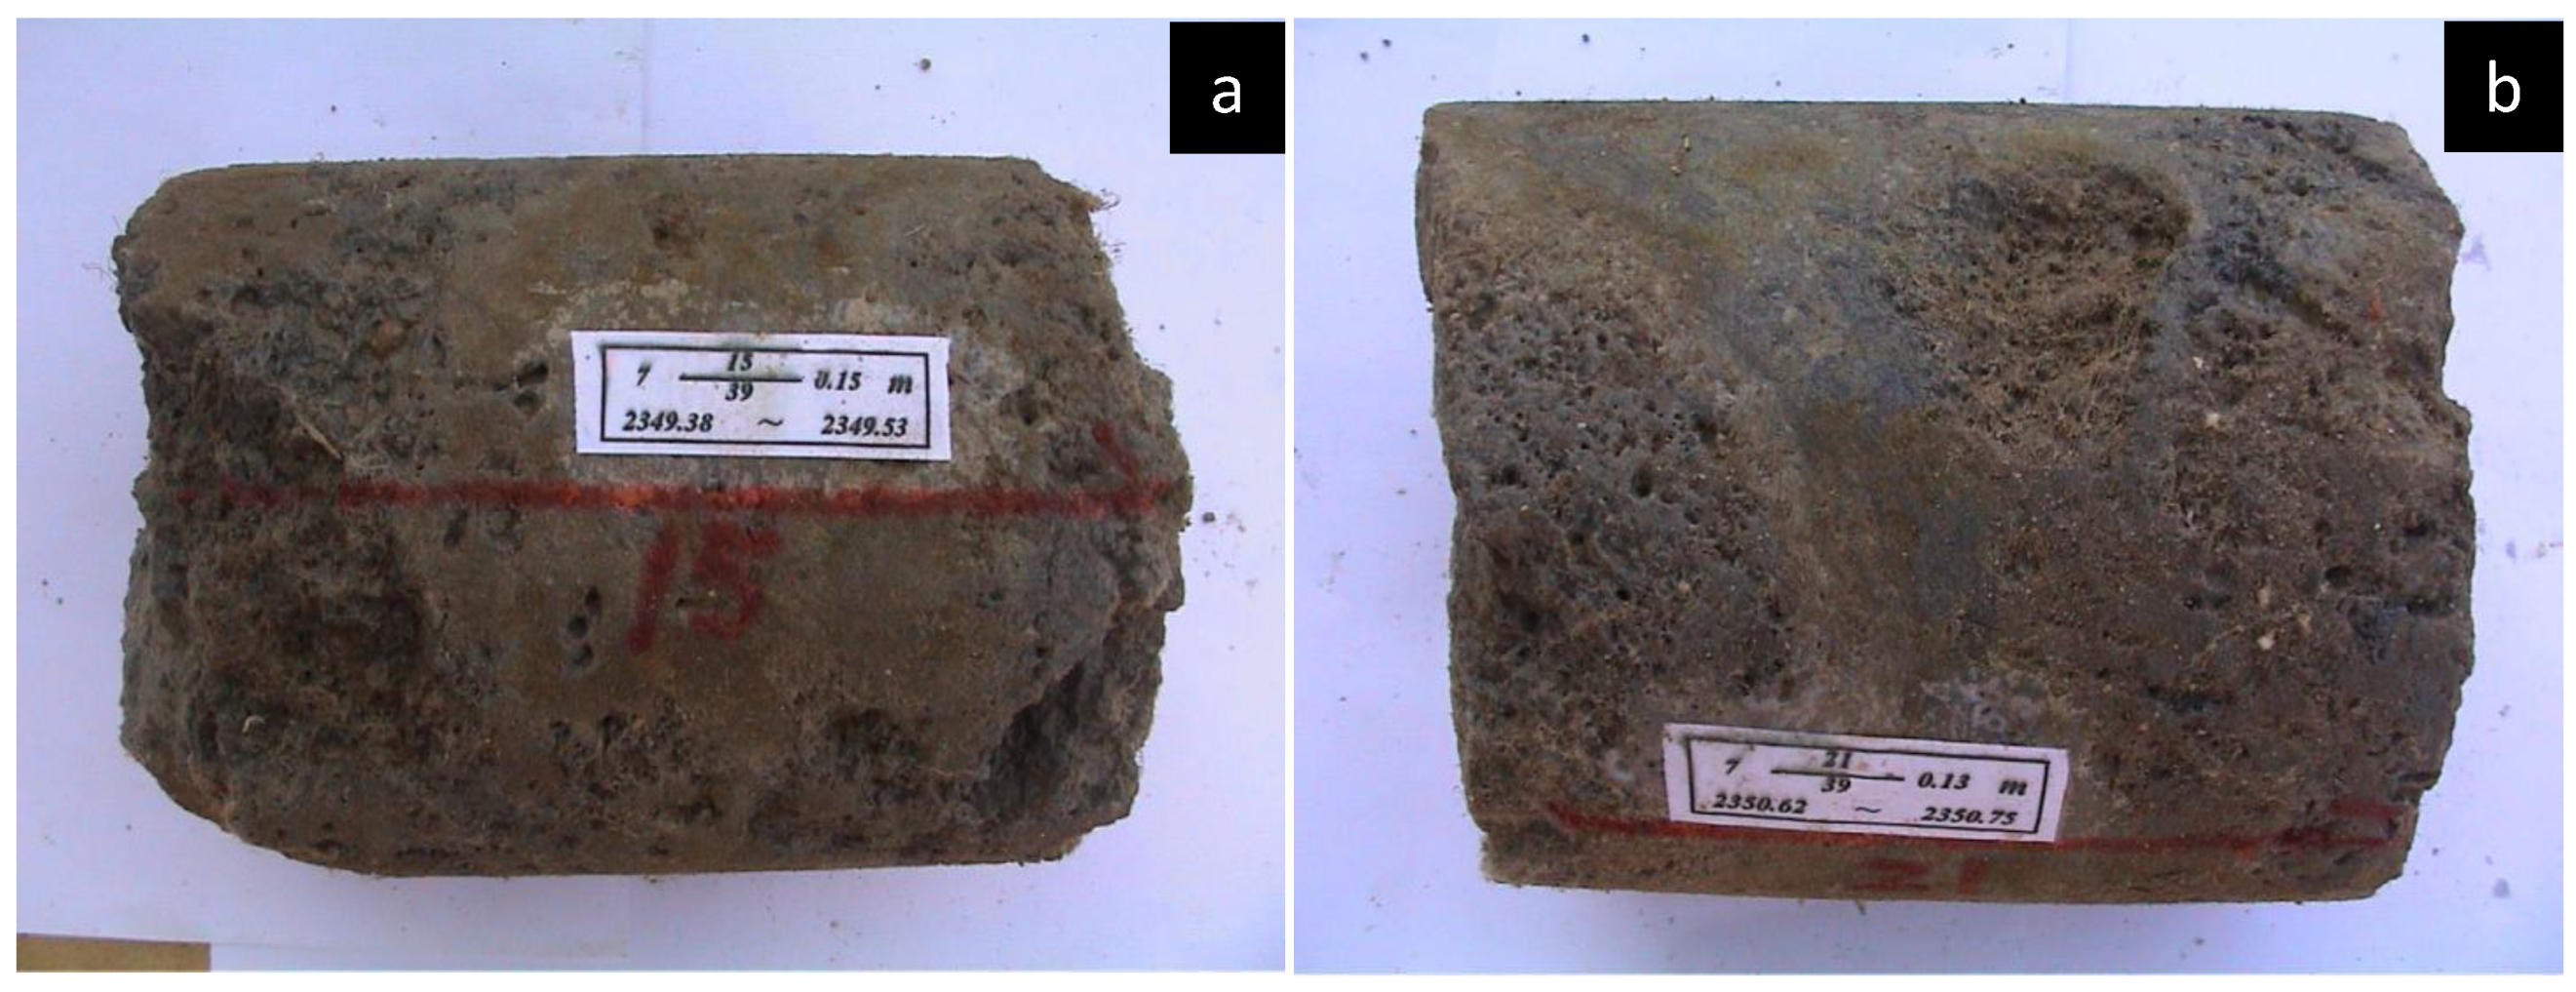
The core of the CT-4 well was found to have 1742 caves with an area of 272,583 mm2. They are mainly distributed in the dolomite section of the A3 and B1 layer (Figure 7). The cumulative number of caverns in this layer is 1712, indicating that the dissolution of this section is very developed.
3.2. Petrophysical Characteristics and MICP Data
Porosity, permeability, and related parameters derived from MICP curves of 32 samples are listed in Table 1. Porosity ranges from 4.67% to 32.4% with an average value of 13.71%. Permeability ranges from 0.002 mD to 349 mD. Among them, the permeabilities of 10 samples are lower than 1 mD. The geometric mean value of the permeability is 4.07 mD.
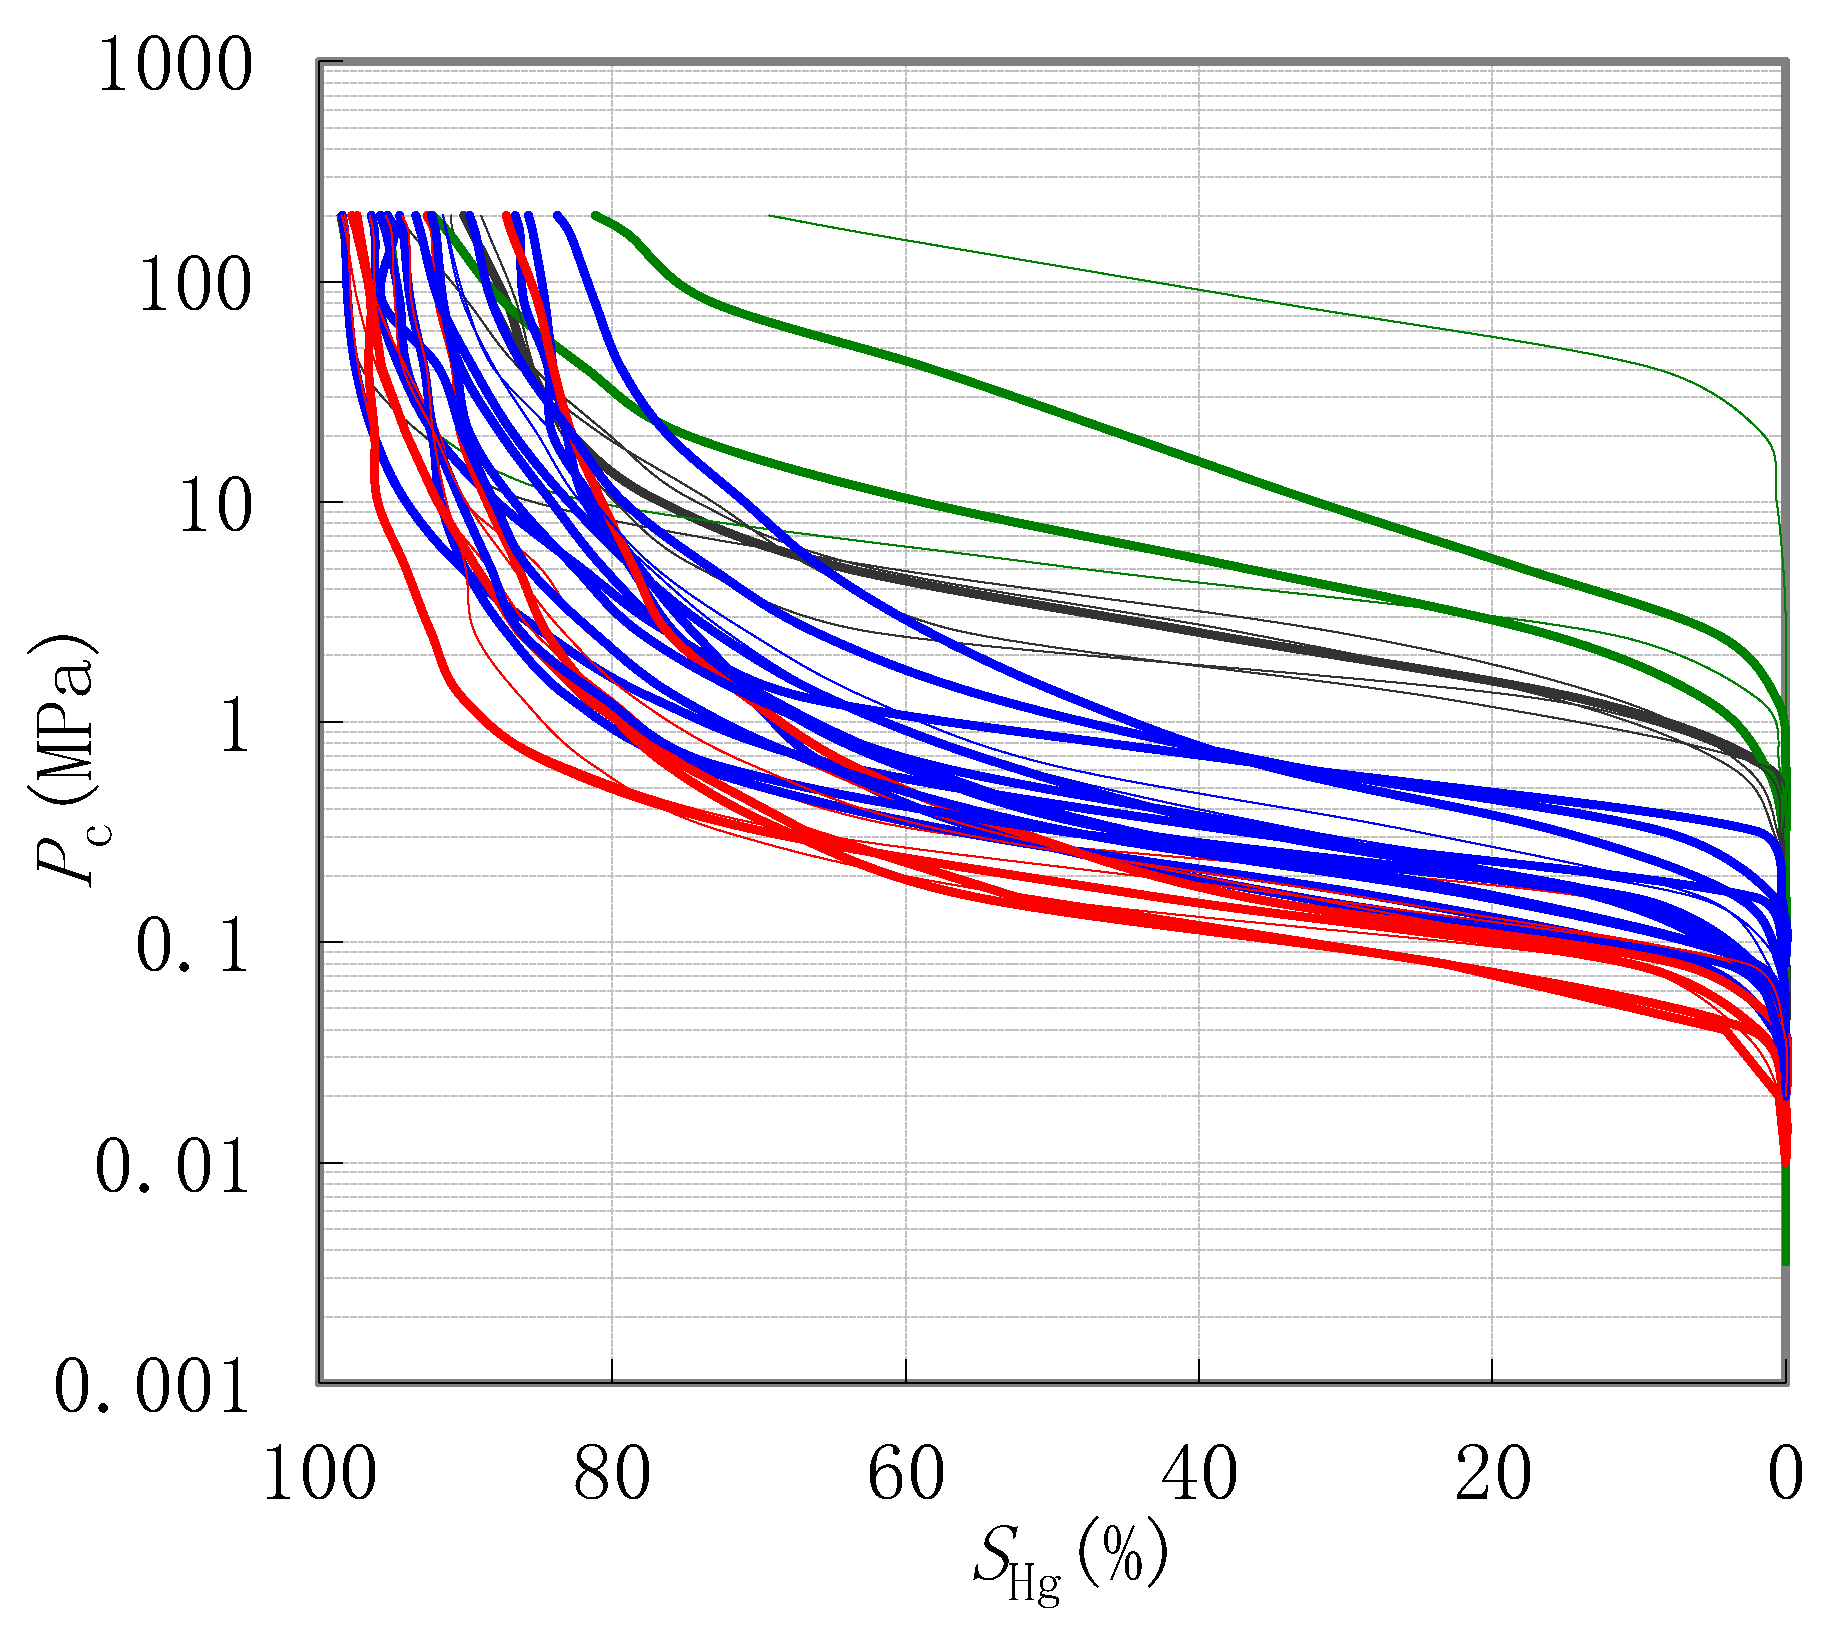
The MICP curves are shown in Figure 8. The red and blue curves in the lower position of this figure represent the samples with relatively good pore structure as the displacement pressure and saturation median pressure are smaller. The middle parts of these curves are concave. In contrast, the black and green curves in the upper position of this figure have much bigger displacement pressure and saturation median pressure. The middle parts of the black and green curves are straight instead of concave, demonstrating a relatively poor structure.
The pressure at which mercury first enters the sample (after the mercury has filled any surface irregularities on the sample) is termed the displacement pressure (Pd) [2,45]. It is commonly inferred from the injection pressure at 10% saturation [46]. The Pd can be calculated for the largest pore throat radius. According to Equation (1), the smaller the Pd value, the bigger the largest pore throat radius. The Pd values of the studied samples range from 0.05 MPa to 41.39 MPa with an average of 1.75 Mpa. Saturation median pressure (Pc50) refers to the intrusion pressure when the non-wet phase saturation is 50% [2,45]. It varies in the range of 0.14 to 120.64 MPa with an average of 5.81 MPa. Median radii (Rc50) are between 0.01 μm and 5.15 μm and with an average of 1.76 μm. The maximum mercury intrusion saturation (Smax) of the samples ranged from 69.32% to 98.76%, with an average of 92.11%. The maximum intrusion pressure is 200 Mpa, corresponding to 3.7 nm of pore throat radius. This indicates that 92.11% of the pore radius is greater than 3.7 nm.
According to Equation (2), we calculated the pore size distribution for each sample. We defined the pore with a pore-throat radius greater than 1 μm as large pore, the pore with a pore-throat radius in the 0.1–1 μm as medium pore, and the pore with a pore-radius less than 0.1 μm as small pore. As can be seen in Table 1, the three types of pores account for 47.98%, 29.17%, and 22.85%, respectively.
3.3. Estimation of Permeability
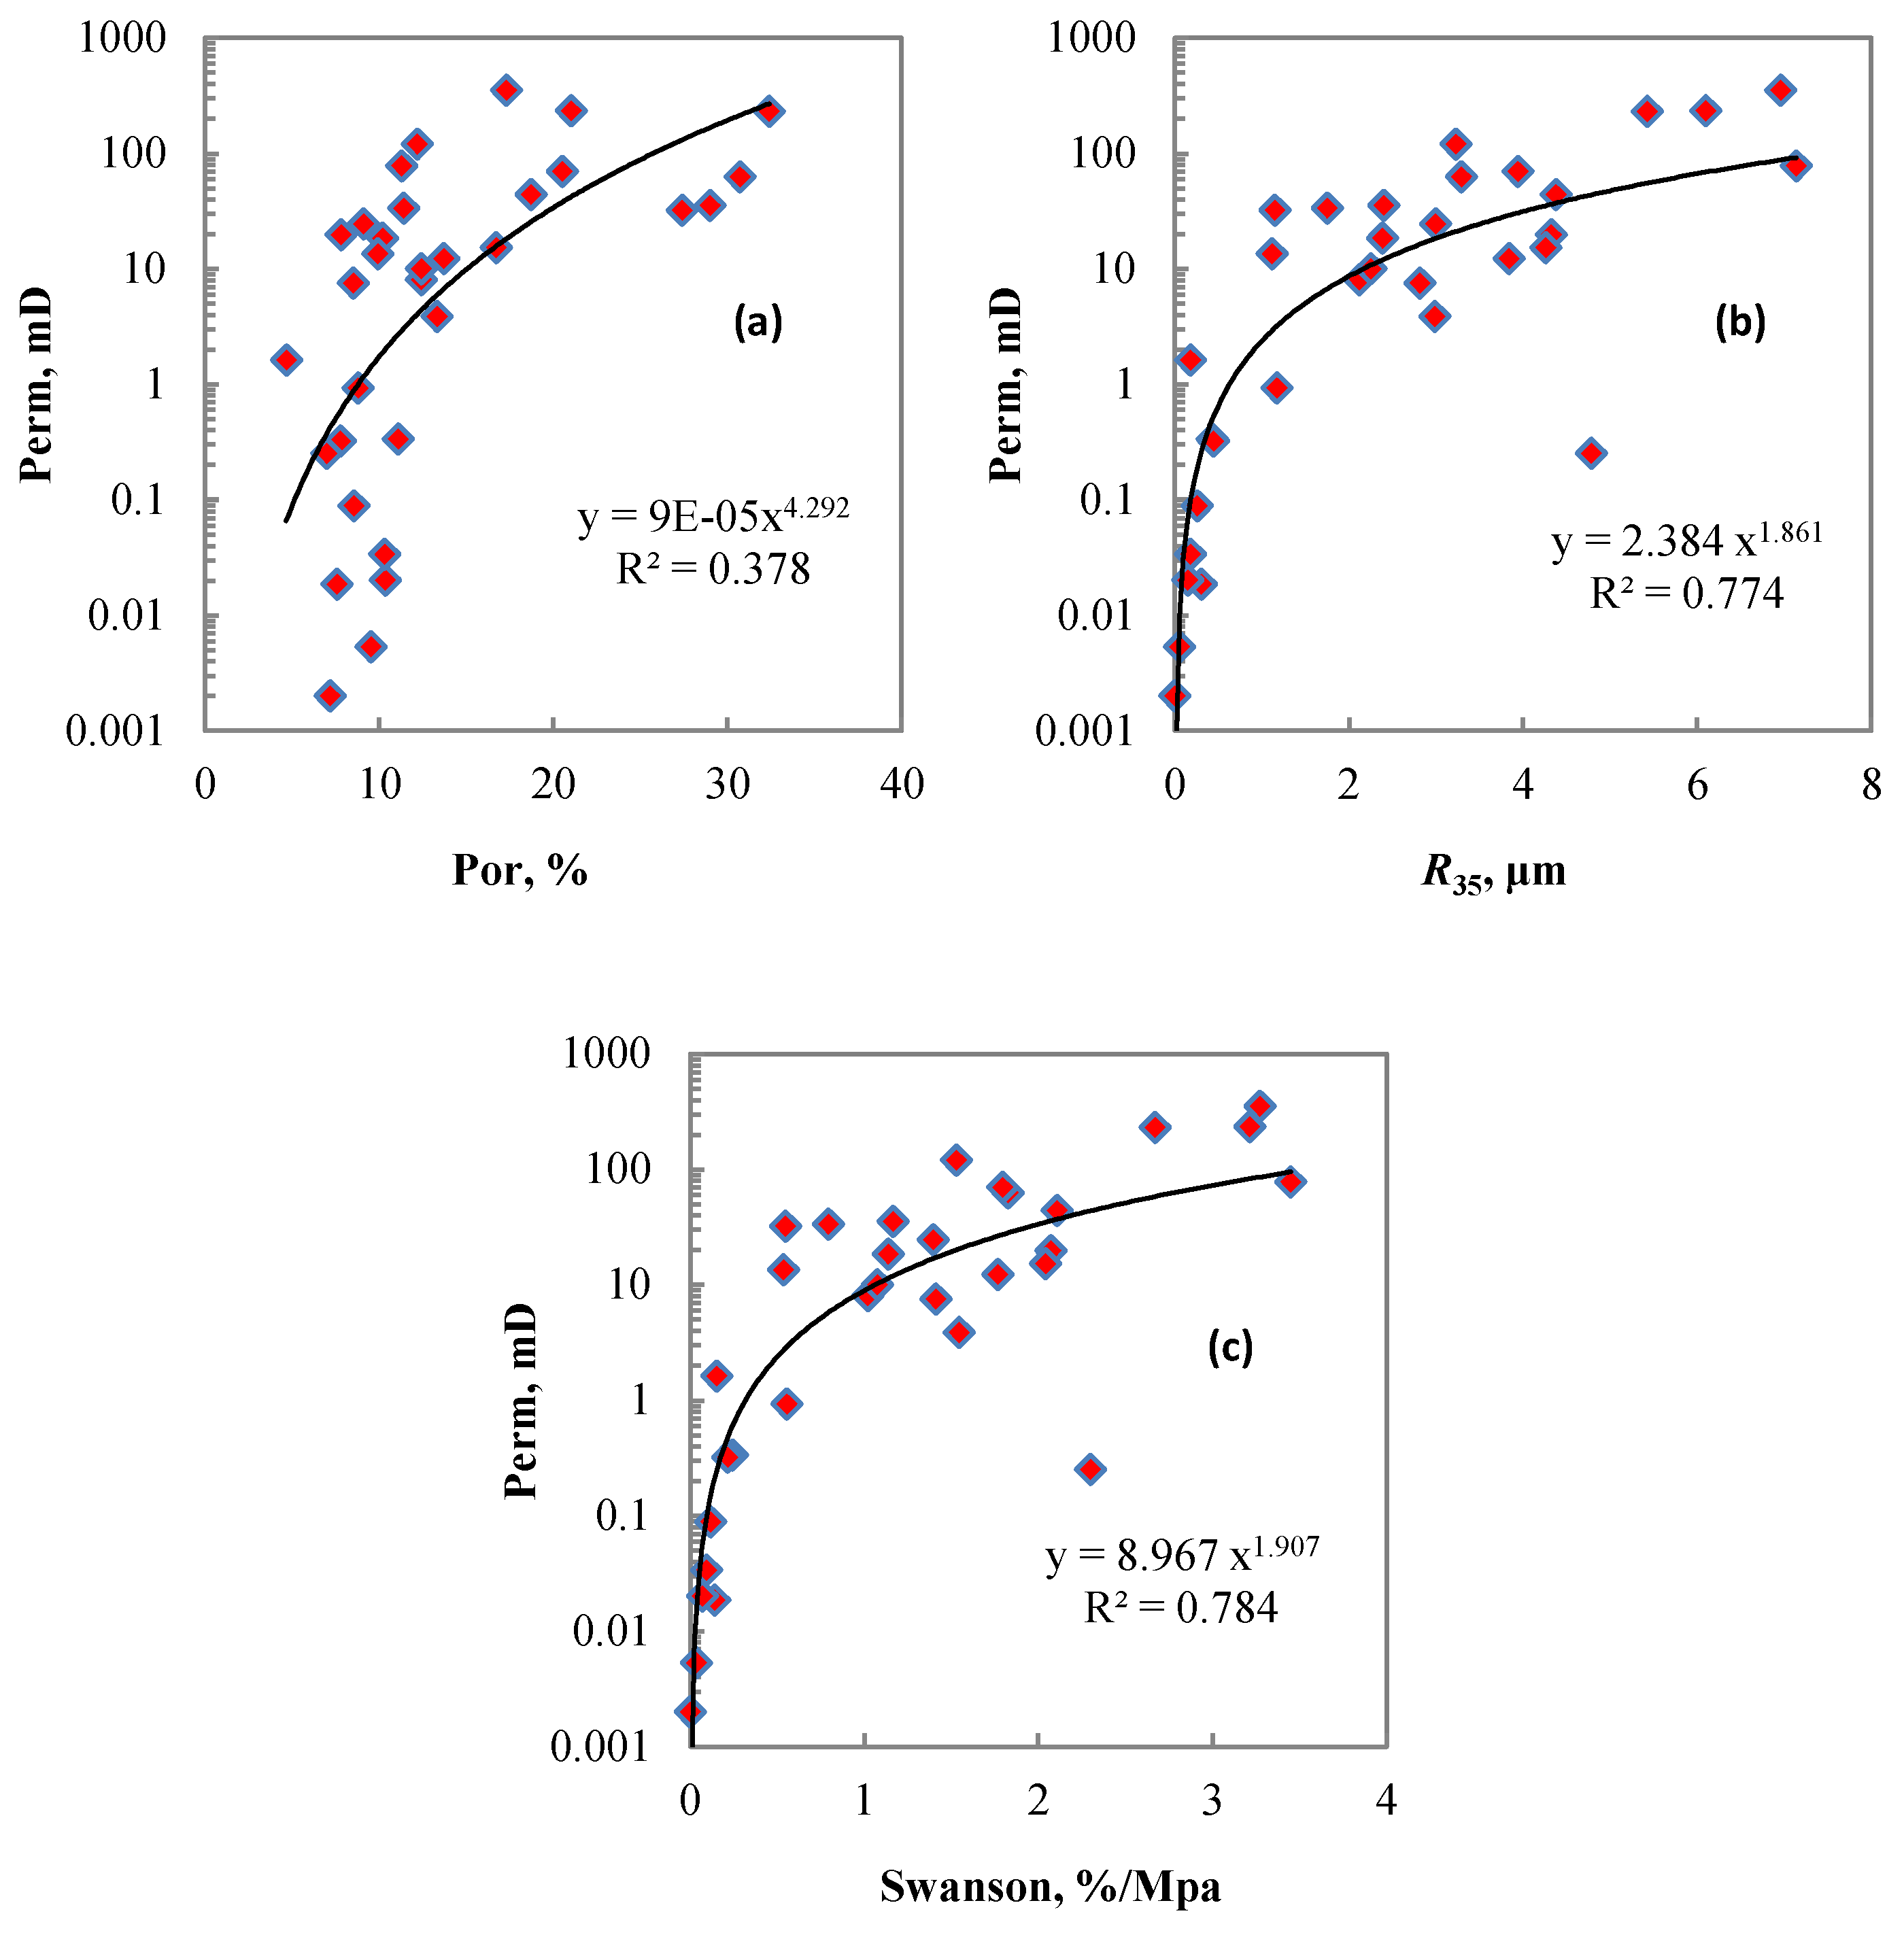
In order to predict permeability, we calculated the R35 and Swanson parameters (see Table 1) as they are commonly used in the permeability prediction. The R35 which is the calculated pore throat radius corresponding to a mercury saturation of 35% contributes greatly to the rock permeability [23,47]. An empirical relationship between porosity, permeability, and R35 published by Kolodzie [23], known as the Winland model, is expressed as:
The Swanson parameter defined by Swanson [24] is the maximum of the ratio of mercury saturation to the corresponding pressure, denoted as . The plot of and Shg resembles a downward opening parabola. The inflection point of the curve is known as the Swanson parameter. Before the inflection point occurs, the non-wetting phase occupies an effective interconnected pore space; after the inflection point, the non-wetting phase begins to enter a finer pore space or irregular pores, the flowability of the non-wetting phase is significantly reduced. The Swanson parameter is also correlated to the permeability of sandstone and carbonate samples. The Swanson permeability model is [24]
where a and b are regression coefficients, varying with study area and lithology.
The relations between the permeability and porosity, Swanson, R35 are shown in Figure 9. The coefficients of determination are lower than 0.8, which is not high enough to predict permeability.
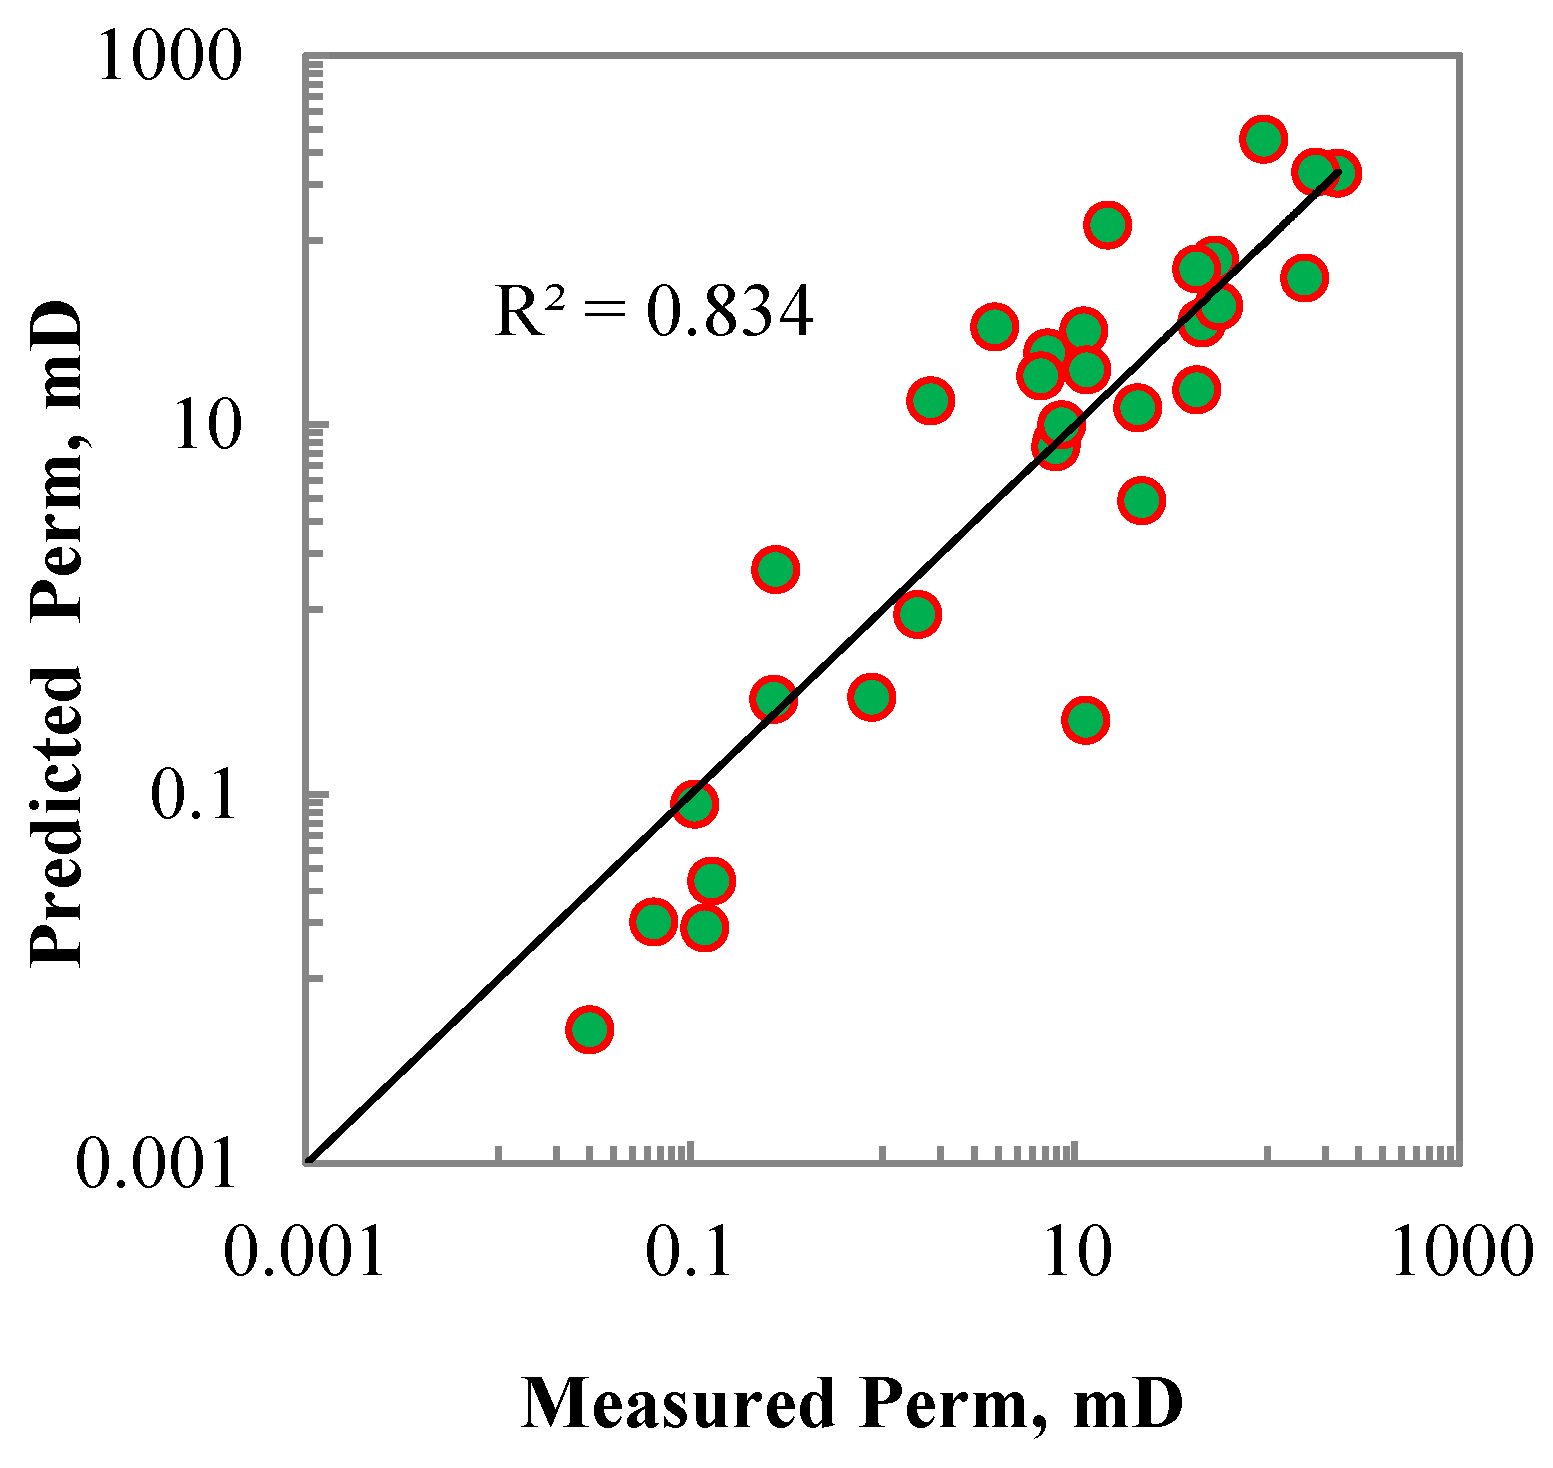
In this study, combined the porosity, R35 and Swanson parameters, we established a new model to accurately predict permeability as:
The cross plot of predicted and measured permeability are shown in Figure 10. As seen from this figure, the coefficient of determination is improved to 0.834 and the data dots are distributed near the 100% agreement lines.
3.4. Fractal Dimension
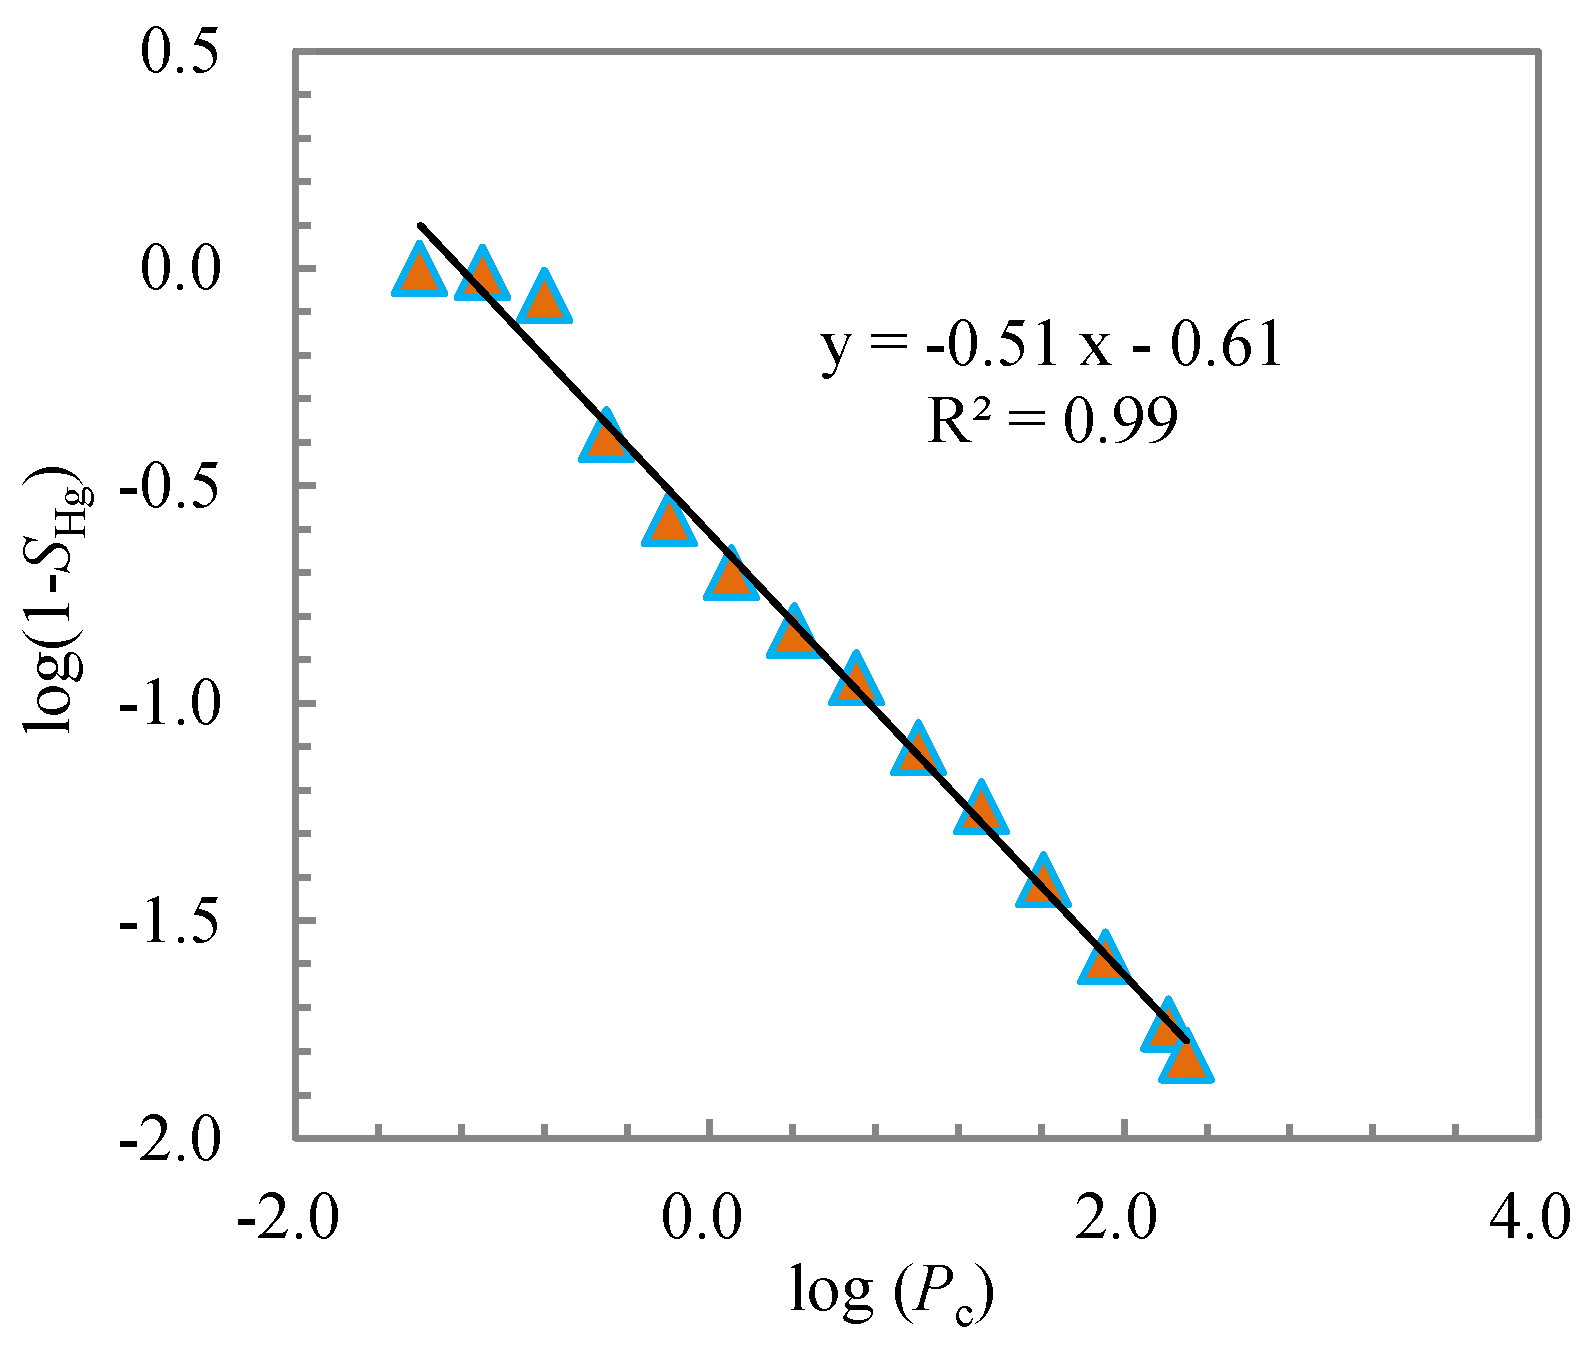
Figure 11 is an example of the determination of the fractal dimension of sample 12 by using the above method. As can be observed in this figure, the slope of the regression equation is −0.51, thus, D is determined as 2.49. In addition, the coefficient of determination is high at 0.99, indicating the fractal nature of the pore space of sample 12.
The fractal dimensions of the studied samples are listed in Table 1. D varies from 2.29 to 2.77, with an average of 2.61. Sample 17 has the largest fractal dimension, while sample 7 has the smallest value. However, the permeability of sample 17 is higher than that of sample 7. This is not consistent with previous knowledge that the fractal dimension is smaller if the pore structure is good [29,43]. In fact, maximum mercury intrusion saturation Smax is weakly correlated with the fractal dimension, the coefficient of determination is 0.359 (Figure 12a). Also, Figure 12b shows the logarithmic relationship of fractal dimension and wetting saturation, i.e., 1-Smax. This is consistent with the observation by Ghanbarian-Alavijeh and Millan [48]. The other petrophysical parameters are not correlated with fractal dimension, as is seen in Table 2. This may be attributed to the fact that the single fractal dimension could not capture pore structure characteristics. We will conduct multifractal analysis for the pore structure to further investigate the carbonate reservoir property in the future.
3.5. Reservoir Classifications
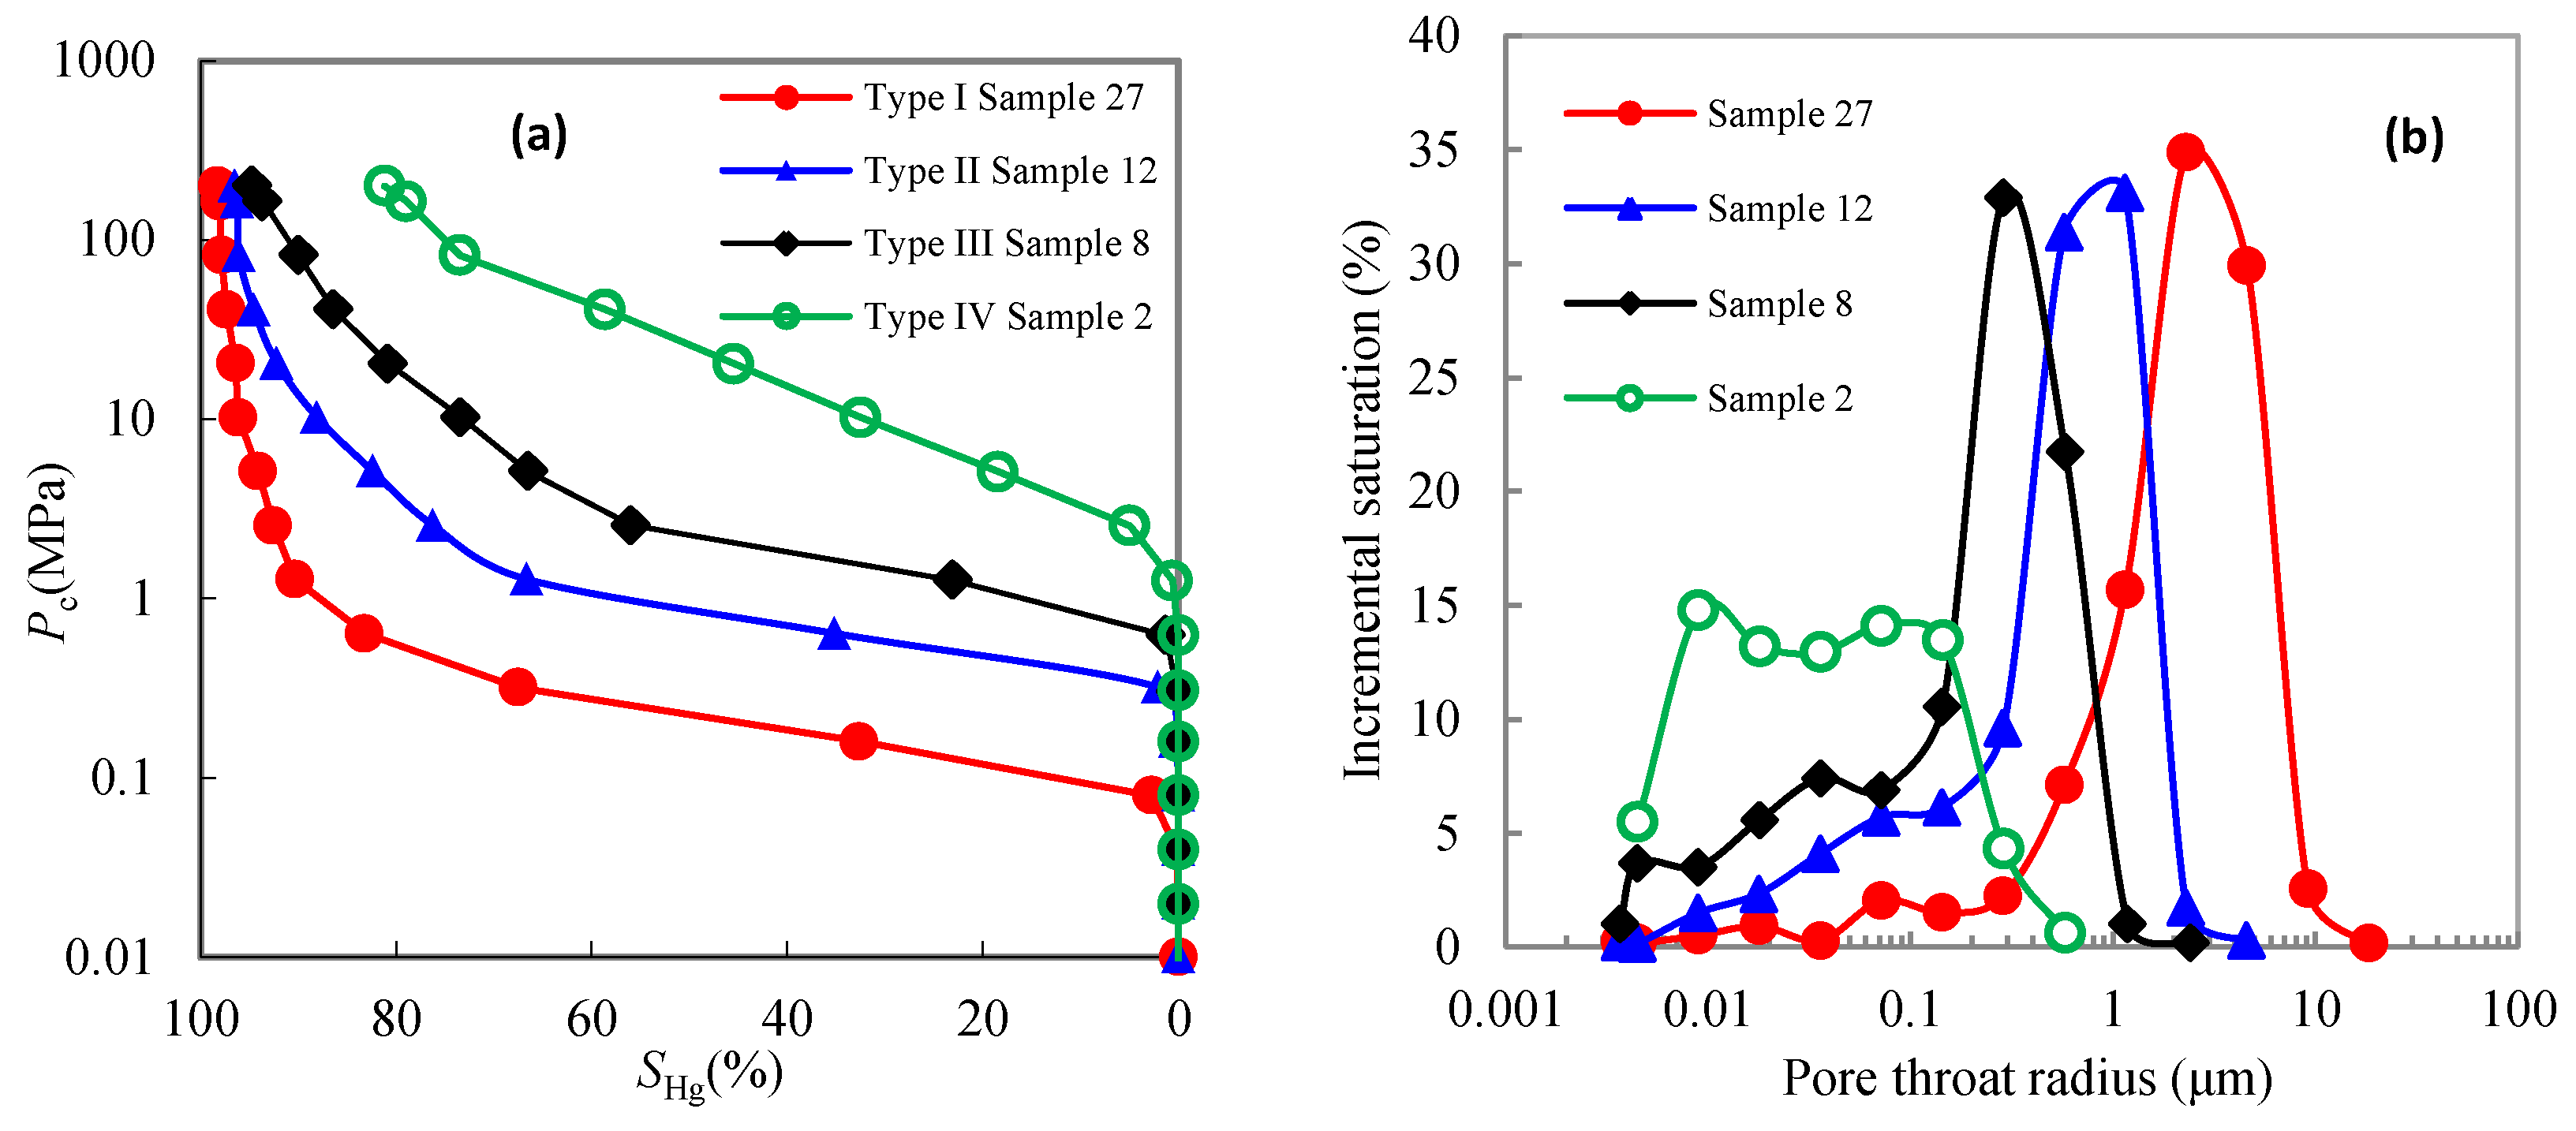
According to the above pore space types, porosity, permeability, and MICP curves, we divided the samples into four types: Types I, II, III, and IV. We did not take the fractal characteristics into consideration as they could not effectively capture the reservoir property. In Figure 8, the red, blue, black, and green curves represent Types I, II, III, and IV, respectively. The typical MICP curves and pore throat distribution for each type are shown in Figure 13. The pore space types and related petrophysical parameters for each type are listed in Table 3. The type I reservoir has the largest porosity, permeability, median radius, and smallest displacement pressure. It has the best pore structure characteristic, while Type IV reservoir holds the worst pore structure characteristic. However, the average porosity of Type IV is larger than that of Type III. This may be attributed to the sample number of the two types being less than that of Types I and II.
We carried out statistics on the oil production of different reservoir types. The reservoir type has a good correlation with productivity. For types I, the daily oil production is greater than 150 t. The daily oil production for types I and II are between 100 and 150 t, less than 100 t, respectively. Reservoir IV cannot produce oil. This proves the validity and reliability of reservoir classification.
4. Conclusions
In this study, taking the Carboniferous carbonate reservoirs in the middle blocks of the eastern margin of the Pre-Caspian Basin as an example, we investigated pore structure characterization, permeability estimation, and fractal characteristics. According to the observations, we made a classification for reservoirs. The following conclusions are obtained:
- (1)
- The storage space of carbonate rocks in this study area is divided into three types: pores, fractures, and caverns. The main pore types are the intergranular pore, intergranular dissolution pore, and intragranular dissolution pore. The fractures can be divided into dissolution fracture, tectonic fracture, stylolite fracture, and grain cracks.
- (2)
- The Pd values of the studied samples range from 0.05 MPa to 41.39 MPa, with an average of 1.75 Mpa. Median radii (Rc50) are between 0.01 μm and 5.15 μm, with an average of 1.76 μm. The pore throats greater than 1 μm and lower than 0.1 μm account for 47.98% and 22.85% respectively, which suggests that the pore structure in the study area is relatively good.
- (3)
- Permeability ranges from 0.002 mD to 349 mD, and with a logarithmic mean value of 4.07 mD. A permeability prediction model was established in a power-law form which incorporated porosity, Swanson parameter, and R35. The coefficient of determination between the predicted and core analysis permeability is 0.834, showing that the proposed model is effective and reliable. The proposed model could be applicable to other study areas.
- (4)
- Fractal dimension carried out based on MICP curves ranged from 2.29 to 2.77, with an average of 2.61. The pore structure parameters were not correlated with fractal dimension, indicating that the single fractal dimension could not characterize the pore structure characteristics. Multifractal analysis of the MICP data may be more suitable for pore structure investigation.
- (5)
- Combined with the pore types, MICP shape, and petrophysical parameters, the studied reservoirs were classified into four types: Types I, II, III, IV. Type I is the most favorable reservoir with daily oil production greater than 150 t, while Type IV is the worst reservoir and cannot produce oil. The good correlation between reservoir type and productivity demonstrates the effectiveness of the classification in this paper.
Author Contributions
Conceptualization, F.S.; Methodology, L.X. and Z.M.; Investigation, F.S. and Z.M.; Writing—Original Draft Preparation, F.S.; Writing—Review and Editing, F.S. and C.J.
Funding
This research was funded by the Major National Oil & Gas Specific Project of China (No. 2016ZX05050).
Acknowledgments
We thank anonymous reviewers and journal editor for constructive comments which improved the quality of the manuscript.
Conflicts of Interest
The authors declare no conflict of interest.
References
- Qiang, Z. Carbonate Reservoir Geology; China University of Petroleum Press: Dongying, China, 2007; pp. 32–78. [Google Scholar]
- He, G.; Tang, H. Petrophysics; Petroleum Industry Press: Beijing, China, 2011; pp. 1–382. [Google Scholar]
- Volozh, Y.A.; Antipov, M.P.; Brunet, M.F.; Garagash, I.A.; Lobkovskii, L.I.; Cadet, J.P. Pre-Mesozoic geodynamics of the Precaspian basin (Kazakhstan). Sediment. Geol. 2003, 156, 35–58. [Google Scholar] [CrossRef]
- Deng, X.; Wang, H.; Bao, Z.; Sun, N.; Zhang, X. Distribution law and exploration potential of oil and gas in Pre-Caspian Basin. China Pet. Explor. 2012, 17, 36–47, (In Chinese with English Abstract). [Google Scholar]
- Zempolich, W.G.; Negri, A.; Leo, C.; Ojik, K.V.; Verdel, A. The Kashagan discovery: An example of the successful use of a multi-disciplined approach in reducing geologic risk. In Proceedings of the AAPG Annual Meeting, Houston, TX, USA, 10–13 March 2002; p. A197. [Google Scholar]
- He, L.; Zhao, L.; Li, J.; Ma, J.; Liu, R.; Wang, S.; Zhao, W. Complex relationship between porosity and permeability of carbonate reservoirs and its controlling factors: A case study of platform facies in Pre-Caspian Basin. Pet. Explor. Dev. 2014, 41, 225–234. [Google Scholar] [CrossRef]
- Zhao, H.; Ning, Z.; Wang, Q.; Zhang, R.; Zhao, T.; Niu, T.; Zeng, Y. Petrophysical characterization of tight oil reservoirs using pressure-controlled porosimetry combined with rate-controlled porosimetry. Fuel 2015, 154, 233–242. [Google Scholar] [CrossRef]
- Rezaee, R.; Saeedi, A.; Clennell, B. Tight gas sands permeability estimation from mercury injection capillary pressure and nuclear magnetic resonance data. J. Pet. Sci. Eng. 2012, 88–89, 92–99. [Google Scholar] [CrossRef]
- Ronchi, P.; Ortenzi, A.; Borromeo, O.; Claps, M.; Zempolich, W.G. Depositional setting and diagenetic processes and their impact on the reservoir quality in the late Visean–Bashkirian Kashagan carbonate platform (Pre-Caspian Basin, Kazakhstan). AAPG Bull. 2010, 94, 1313–1348. [Google Scholar] [CrossRef]
- Yang, F. A Study on Carbonate Sequence Stratigraphy in Block X of the Pre-Caspian Basin. Master’s Thesis, Northeast Petroleum University, Daqing, China, 2016. [Google Scholar]
- Shi, X.; Chen, X.; Wang, J.; Li, Z.; Jin, S.; Guo, H.; Zhu, M. Geochemical characteristics of the Carboniferours KT-I interval dolostone in eastern margin of coastal Caspian Sea Basin. J. Palaeogeogr. 2012, 14, 777–785, (In Chinese with English Abstract). [Google Scholar]
- Liu, D.; Dou, L.; Hao, Y.; Zhang, Y.; Li, J. The origin of hydrocarbon accumulation below the Lower Permian Salt Bed and the prospecting in the East Part of PreCaspian Basin. Mar. Origin Pet. Geol. 2004, 9, 53–58, (In Chinese with English Abstract). [Google Scholar]
- Hu, Y.; Xia, B.; Wang, Y.; Wan, Z.; Cai, Z. Tectonic evolution and hydrocarbon accumulation model in eastern Precaspian Basin. Sediment. Geol. Tethyan Geol. 2014, 34, 78–81, (In Chinese with English Abstract). [Google Scholar]
- Guo, K.; Cheng, X.; Fan, L.; Yan, S.; Ni, G.; Fu, H. Characteristics and Development Mechanism of Dolomite Reservoirs in North Truva of Eastern Pre-Caspian Basin. Acta Sedimentol. Sin. 2016, 34, 747–757, (In Chinese with English Abstract). [Google Scholar]
- Miao, Q.; Zhu, X.; Guo, H.; Zhao, H.; Zhu, M. Log evaluation of complex carbonate reservoirs in Centre Block of the Eastern Margin of Pre-Caspian Basin. Well Logging Technol. 2014, 38, 196–200, (In Chinese with English Abstract). [Google Scholar]
- He, L. Petrophysical Evaluation on the Microfracture-Typed Complex Carboniferous Carbonate Reservoirs in the Eastern Margin of the Caspian Sea Basin. Ph.D. Thesis, Yangtze University, Wuhan, China, 2015. [Google Scholar]
- Sakhaee-Pour, A.; Bryant, S.L. Effect of pore structure on the producibility of tight-gas sandstone. AAPG Bull. 2014, 98, 663–694. [Google Scholar] [CrossRef]
- Klaver, J.; Desbois, G.; Littke, R.; Urai, J.L. BIB-SEM pore characterization of mature and post mature Posidonia Shale samples from the Hills area, Germany. Int. J. Coal Geol. 2016, 158, 78–89. [Google Scholar] [CrossRef]
- Chalmers, G.R.; Bustin, R.M.; Power, I.M. Characterization of gas shale pore systems by porosimetry, pycnometry, surface area, and field emission scanning electron microscopy/transmission electron microscopy image analyses: Examples from the Barnett, Woodford, Haynesville, Marcellus, and Doig units. AAPG Bull. 2012, 1099–1119. [Google Scholar] [CrossRef]
- Washburn, E.D. The dynamics of capillary flow. Phys. Rev. 1921, 17, 273–283. [Google Scholar] [CrossRef]
- Feng, C.; Shi, Y.; Li, J.; Chang, L.; Li, G.; Mao, Z. A new empirical method for constructing capillary pressure curves from conventional logs in low permeability sandstones. J. Earth Sci. 2017, 28, 516–522. [Google Scholar] [CrossRef]
- Kuila, U.; Prasad, M. Specific surface area and pore-size distribution in clays and shales. Geophys. Prospect. 2013, 61, 341–362. [Google Scholar] [CrossRef]
- Kolodzie, S.J. Analysis of pore throat size and use of the Waxman–Smits equation to determine OOIP in spindle field. In Proceedings of the SPE Annual Technical Conference and Exhibition, Dallas, TX, USA, 21–24 September 1980. SPE-9382-MS. [Google Scholar]
- Swanson, B.F. A simple correlation between permeabilities and mercury injection capillary pressures. J. Pet. Technol. 1981, 33, 2498–2504. [Google Scholar] [CrossRef]
- Lafage, S. An Alternative to the Winland R35 Method for Determining Carbonate Reservoir Quality. Master’s Thesis, Texas A&M University, College Station, TX, USA, 2008. [Google Scholar]
- Xiao, L.; Wang, H.; Zou, C.; Mao, Z.; Guo, H. Improvements on “Application of NMR logs in tight gas reservoirs for formation evaluation: A case study of Sichuan basin in China”. J. Pet. Sci. Eng. 2016, 138, 11–17. [Google Scholar] [CrossRef]
- Zhao, P.; Sun, Z.; Luo, X.; Wang, Z.; Mao, Z.; Wu, Y.; Xia, P. Study on the response mechanisms of nuclear magnetic resonance (NMR) log in tight oil reservoirs. Chin. J. Geophys. 2016, 29, 1927–1937. [Google Scholar] [CrossRef]
- Dunn, K.J.; Bergman, D.J.; Latorraca, G.A. Nuclear Magnetic Resonance Petrophysical and Logging Application; Elsevier: Amsterdam, The Netherlands, 2002. [Google Scholar]
- Li, K. Analytical derivation of Brooks–Corey type capillary pressure models using fractal geometry and evaluation of rock heterogeneity. J. Pet. Sci. Eng. 2010, 73, 20–26. [Google Scholar] [CrossRef]
- Yang, F.; Ning, Z.; Liu, H. Fractal characteristics of shales from a shale gas reservoir in the Sichuan Basin, China. Fuel 2014, 115, 378–384. [Google Scholar] [CrossRef]
- Mandelbrot, B.B. The Fractal Geometry of Nature; W.H. Freeman: New York, NY, USA, 1982. [Google Scholar]
- Cai, J.; Perfect, E.; Cheng, C.; Hu, X. Generalized modeling of spontaneous imbibition based on Hagen-Poiseuille flow in tortuous capillaries with variably shaped apertures. Langmuir 2014, 30, 5142–5151. [Google Scholar] [CrossRef] [PubMed]
- Lyu, C.; Cheng, Q.; Zuo, R.; Wang, X. Mapping spatial distribution characteristics of lineaments extracted from remote sensing image using fractal and multifractal models. J. Earth Sci. 2017, 28, 507–515. [Google Scholar] [CrossRef]
- Wei, W.; Cai, J.; Hu, X.; Han, Q. An electrical conductivity model for fractal porous media. Geophy. Res. Lett. 2015, 42, 4833–4840. [Google Scholar] [CrossRef] [Green Version]
- Cai, J.; Wei, W.; Hu, X.; Liu, R.; Wang, J. Fractal characterization of dynamic fracture network extension in porous media. Fractals 2017, 25, 1750023. [Google Scholar] [CrossRef]
- Krohn, C.E. Fractal measurements of sandstones, shales, and carbonates. J. Geophys. Res. Solid Earth. 1988, 93, 3297–3305. [Google Scholar] [CrossRef]
- Billi, A.; Storti, F. Fractal distribution of particle size in carbonate cataclastic rocks from the core of a regional strike-slip fault zone. Tectonophysics 2004, 384, 115–128. [Google Scholar] [CrossRef]
- Xie, S.; Cheng, Q.; Ling, Q.; Li, B.; Bao, Z.; Fan, P. Fractal and multifractal analysis of carbonate pore-scale digital images of petroleum reservoirs. Mar. Pet. Geol. 2010, 27, 476–485. [Google Scholar] [CrossRef]
- Liu, H.; Tian, Z.; Xu, Z. Quantitative evaluation of carbonate reservoir pore structure based on fractal characteristics. Lithol. Reserv. 2017, 29, 97–105. [Google Scholar] [CrossRef]
- Ghanbarian-Alavijeh, B.; Hunt, A.G. Comments on “More general capillary pressure and relative permeability models from fractal geometry” by Kewen Li. J. Contam. Hydrol. 2012, 140, 21–23. [Google Scholar] [CrossRef] [PubMed]
- Ghanbarian, B.; Sahimi, M. Electrical conductivity of partially saturated packings of particles. Transp. Porous Med. 2017, 118, 1–16. [Google Scholar] [CrossRef]
- Ge, X.; Fan, Y.; Deng, S.; Han, Y.; Liu, J. An improvement of the fractal theory and its application in pore structure evaluation and permeability estimation. J. Geophys. Res. Solid Earth 2016, 121, 6333–6345. [Google Scholar] [CrossRef]
- Zhang, Z.; Weller, A. Fractal dimension of pore-space geometry of an Eocene sandstone formation. Geophysics 2014, 79, D377–D387. [Google Scholar] [CrossRef]
- Moore, H.C. Carbonate Reservoirs: Porosity Evolution and Diagenesis in a Sequence Stratigraphic Framework; Elsevier: Amsterdam, The Netherlands, 2001. [Google Scholar]
- Xu, Z.; Zhao, P.; Wang, Z.; Ostadhassan, M.; Pan, Z. Characterization and consecutive prediction of pore structures in tight oil reservoirs. Energies 2018, 11, 2705. [Google Scholar] [CrossRef]
- Schowalter, T.T. Mechanics of secondary hydrocarbon migration and entrapment. AAPG Bull. 1979, 63, 723–760. [Google Scholar]
- Mao, Z.; Xiao, L.; Wang, Z.; Jin, Y.; Liu, X.; Xie, B. Estimation of permeability by integrating nuclear magnetic resonance (NMR) logs with mercury injection capillary pressure (MICP) data in tight gas sands. Appl. Magn. Reson. 2013, 44, 449–468. [Google Scholar] [CrossRef]
- Ghanbarian-Alavijeh, B.; Millán, H. The relationship between surface fractal dimension and soil water content at permanent wilting point. Geoderma 2009, 151, 224–232. [Google Scholar] [CrossRef]
Figure 1.
The location of the study area.

Figure 2.
Characteristics of Carboniferous strata the study area.

Figure 3.
Characteristics of intergranular pores of Г layer in the study area (a) Well CT-10, 3156.1 m, Sparry algal oolitic limeston, intergranular dissolution pores, visible porosity is 2.57%; (b) Well A-1, 3422.0 m, Sparry red algae foraminifera granules limestone, intergranular dissolution pores more, visible porosity is 17.2%;(c) Well CT-1, 3131.0 m, Sparry green algae foraminifera limestone, intergranular dissolution pores and intrafosill pores, visible porosity is 8%; (d)Well CT-4, 3131.0 m, Sparry foraminifera parasolitic limestone, intergranular pores, visible porosity is 15%.

Figure 4.
Intragranular dissolution pores (a) Well CT-4, 2341.41 m, Micrite bioclastic dolomite, more intrafosill pores and its dissolution, visible porosity is 18.3%; (b) Well A-1, 2846.0 m, Sparry oolitic limestone, oolites and negative oolites, ooids modic pores, visible porosity is 17.0%; (c) Well A-2, 3190.0 m, Sparry cast oolitic limestone, ooids modic pores, visible porosity is 23.7%; (d) Well A-1, 3621.0 m, Sparry oolitic limestone, intergranular pores, visible porosity is 35.0%.

Figure 5.
Intercrystal pore and intercrystal dissolution pore (a) Well CT-4, 2347.0 m, Residual clastic silt dolomite, intercrystal dissolution pores, visible porosity is 13.0%; (b) Well A-1, 3956.0 m, Sugar-like dolomite, intercrystal pores, visible porosity is 5.0%.
Figure 5.
Intercrystal pore and intercrystal dissolution pore (a) Well CT-4, 2347.0 m, Residual clastic silt dolomite, intercrystal dissolution pores, visible porosity is 13.0%; (b) Well A-1, 3956.0 m, Sugar-like dolomite, intercrystal pores, visible porosity is 5.0%.

Figure 6.
Fracture characteristics in the study area (a) Well A-1 2890.13 m, Spray oolitic limestone, dissolution fracture, semi-filled by gypsum; (b) Well CT-4 2343.21~2343.42 m, Vertical extension fracture; (c) Well CT-10 2342.71~2342.82 m, Oblique tectonic fracture; (d) Well CT-10 3142.28–3142.38 m, Stylolite.

Figure 7.
Cavern characteristics of the study area (a) Well CT-4, 2343.19~2343.29 m, Cinder-like dolomite (b) Well CT-4, 2344.77~2345.14 m, dissolution caverns in the dolomite rock.
Figure 7.
Cavern characteristics of the study area (a) Well CT-4, 2343.19~2343.29 m, Cinder-like dolomite (b) Well CT-4, 2344.77~2345.14 m, dissolution caverns in the dolomite rock.

Figure 8.
Mercury intrusion capillary pressure (MICP) curves of the studied samples.

Figure 9.
The relationships of permeability with parameters. (a) Porosity; (b) R35; (c) Swanson. The Swanson parameter is the maximum of the ratio of mercury saturation to the corresponding pressure.
Figure 9.
The relationships of permeability with parameters. (a) Porosity; (b) R35; (c) Swanson. The Swanson parameter is the maximum of the ratio of mercury saturation to the corresponding pressure.

Figure 10.
The comparison of predicted and measured permeability.

Figure 11.
Determination of the fractal dimension for sample 12.

Figure 12.
(a) Cross plot of fractal dimension with maximum mercury intrusion saturation; (b) Cross plot of fractal dimension with wetting saturation.
Figure 12.
(a) Cross plot of fractal dimension with maximum mercury intrusion saturation; (b) Cross plot of fractal dimension with wetting saturation.

Figure 13.
The MICP curves and pore throat radius distributions of different types of samples (a) MICP curves, (b) pore throat radius distributions.
Figure 13.
The MICP curves and pore throat radius distributions of different types of samples (a) MICP curves, (b) pore throat radius distributions.


Table 1.
Petrophysical parameters and fractal dimensions of the studied samples.
| Sample No. | Porosity | K | Pd | Pc50 | R50 | Swanson | R35 | Smax | D | Large Pore | Medium Pore | Small Pore |
|---|---|---|---|---|---|---|---|---|---|---|---|---|
| - | % | mD | MPa | MPa | μm | v/v/MPa | μm | % | / | % | % | % |
| 1 | 4.67 | 1.63 | 0.96 | 3.44 | 0.22 | 0.16 | 0.19 | 90.16 | 2.62 | 4.22 | 66.97 | 28.82 |
| 2 | 9.53 | 0.005 | 3.16 | 26.91 | 0.03 | 0.04 | 0.06 | 81.16 | 2.65 | 0.14 | 25.67 | 74.19 |
| 3 | 7.56 | 0.019 | 0.86 | 3.67 | 0.2 | 0.15 | 0.31 | 91.01 | 2.58 | 6.52 | 62.49 | 31.0 |
| 4 | 10.35 | 0.02 | 1.63 | 7.71 | 0.1 | 0.07 | 0.16 | 92.26 | 2.56 | 2.33 | 46.8 | 50.87 |
| 5 | 10.29 | 0.034 | 2.07 | 5.18 | 0.14 | 0.10 | 0.19 | 95.14 | 2.37 | 0.78 | 65.76 | 33.46 |
| 6 | 11.08 | 0.333 | 0.86 | 2.07 | 0.36 | 0.24 | 0.44 | 88.98 | 2.64 | 5.13 | 72.15 | 22.72 |
| 7 | 8.55 | 0.088 | 1.09 | 3.92 | 0.19 | 0.12 | 0.26 | 98.76 | 2.29 | 4.83 | 69.79 | 25.38 |
| 8 | 7.76 | 0.322 | 0.74 | 2.24 | 0.33 | 0.22 | 0.45 | 94.66 | 2.54 | 6.35 | 63.76 | 29.89 |
| 9 | 7.16 | 0.002 | 41.39 | 120.64 | 0.01 | 0.00 | 0.01 | 69.32 | 2.68 | 0.00 | 0.45 | 99.55 |
| 10 | 29.0 | 35.3 | 0.19 | 0.44 | 1.67 | 1.17 | 2.41 | 98.43 | 2.42 | 67.2 | 25.19 | 7.61 |
| 11 | 30.7 | 62.3 | 0.13 | 0.28 | 2.62 | 1.83 | 3.3 | 98.45 | 2.49 | 74.8 | 15.63 | 9.57 |
| 12 | 27.4 | 32 | 0.38 | 0.89 | 0.83 | 0.55 | 1.15 | 96.45 | 2.45 | 41.45 | 43.88 | 14.67 |
| 13 | 32.4 | 230 | 0.08 | 0.19 | 3.82 | 2.67 | 5.43 | 97.79 | 2.55 | 85.27 | 9.88 | 4.85 |
| 14 | 13.7 | 12.3 | 0.09 | 0.27 | 2.69 | 1.77 | 3.85 | 95.84 | 2.61 | 76.38 | 14.6. | 9.02 |
| 15 | 12.4 | 8.08 | 0.18 | 0.58 | 1.27 | 1.02 | 2.12 | 91.55 | 2.68 | 55.21 | 24.87 | 19.92 |
| 16 | 17.3 | 349 | 0.05 | 0.15 | 4.87 | 3.28 | 6.96 | 97.44 | 2.58 | 76.6 | 14.16 | 9.24 |
| 17 | 7.8 | 19.7 | 0.09 | 0.28 | 2.65 | 2.07 | 4.33 | 85.74 | 2.77 | 66.46 | 13.98 | 19.56 |
| 18 | 16.7 | 15.3 | 0.07 | 0.28 | 2.64 | 2.04 | 4.27 | 96.57 | 2.6 | 68.24 | 19.54 | 12.22 |
| 19 | 8.5 | 7.54 | 0.15 | 0.4 | 1.85 | 1.41 | 2.82 | 86.64 | 2.74 | 62.4 | 17.47 | 20.13 |
| 20 | 9.1 | 24.4 | 0.11 | 0.41 | 1.80 | 1.40 | 3 | 92.31 | 2.67 | 61.52 | 21.08 | 17.40 |
| 21 | 11.3 | 77.9 | 0.05 | 0.14 | 5.15 | 3.45 | 7.14 | 92.65 | 2.70 | 77.26 | 10.35 | 12.39 |
| 22 | 10.2 | 18.4 | 0.14 | 0.56 | 1.32 | 1.14 | 2.39 | 93.42 | 2.65 | 55.69 | 25.30 | 19.00 |
| 23 | 7.0 | 0.25 | 0.09 | 0.29 | 2.57 | 2.30 | 4.79 | 87.26 | 2.76 | 65.2 | 14.57 | 20.24 |
| 24 | 11.4 | 33.5 | 0.19 | 0.64 | 1.15 | 0.79 | 1.76 | 91.57 | 2.68 | 52.63 | 26.75 | 20.63 |
| 25 | 13.3 | 3.86 | 0.14 | 0.32 | 2.26 | 1.55 | 2.99 | 94.52 | 2.63 | 74.57 | 14.86 | 10.57 |
| 26 | 12.2 | 120 | 0.11 | 0.33 | 2.21 | 1.53 | 3.23 | 95.35 | 2.61 | 67.64 | 19.42 | 12.95 |
| 27 | 20.5 | 69.5 | 0.1 | 0.27 | 2.73 | 1.8 | 3.94 | 95.47 | 2.61 | 72.14 | 16.41 | 11.45 |
| 28 | 12.4 | 9.98 | 0.13 | 0.5 | 1.46 | 1.08 | 2.26 | 92.35 | 2.66 | 60.73 | 24.11 | 15.16 |
| 29 | 8.8 | 0.931 | 0.23 | 1.41 | 0.52 | 0.56 | 1.18 | 83.76 | 2.75 | 38.33 | 30.32 | 31.35 |
| 30 | 9.9 | 13.4 | 0.33 | 1.11 | 0.66 | 0.54 | 1.12 | 89.75 | 2.66 | 38.26 | 38.34 | 23.4 |
| 31 | 18.7 | 43.7 | 0.09 | 0.23 | 3.25 | 2.11 | 4.38 | 98.26 | 2.5 | 84.63 | 10.52 | 4.85 |
| 32 | 21.0 | 232 | 0.07 | 0.16 | 4.71 | 3.22 | 6.1 | 94.36 | 2.67 | 82.34 | 8.40 | 9.27 |
| Average | 13.71 | 44.43 | 1.75 | 5.81 | 1.76 | 1.26 | 2.59 | 92.11 | 2.61 | 47.98 | 29.17 | 22.85 |
Pd is inferred from the injection pressure at 10% saturation. Swanson is the maximum of the ratio of mercury saturation to corresponding pressure. R35 is the calculated pore throat radius corresponding to a mercury saturation of 35%. D is fractal dimension determined using mercury intrusion capillary pressure (MICP).
Table 2.
The coefficients of determination between fractal dimension and petrophysical parameters.
| Por | K | Pd | Pc50 | R50 | Swanson | R35 | Large Pore | Medium Pore | Small Pore |
|---|---|---|---|---|---|---|---|---|---|
| 0.174 | 0.001 | 0.009 | 0.011 | 0.035 | 0.061 | 0.064 | 0.053 | 0.207 | 0.015 |
Table 3.
The pore space types and related petrophysical parameters for each type of reservoir.
| Reservoir Types | Pore Space Types | Porosity (%) | K (mD) | R50 (μm) | Pd (MPa) |
|---|---|---|---|---|---|
| I | Dissolution caves; intergranular dissolution pore; fracture | 7.0–32.4 19.51 | 0.25–349.0 42.668 | 2.57–5.15 3.59 | 0.05–0.13 0.08 |
| II | Intergranular dissolution pore; intergranular pore | 7.8–29 13.29 | 0.931–120.0 14.266 | 0.52–2.69 1.6 | 0.09–0.38 0.18 |
| III | Intergranular pore; intragranular dissolution pores; intrafosill pore | 4.67–11.8 7.92 | 0.02–1.63 0.196 | 0.19–0.36 0.26 | 0.74–0.19 0.9 |
| IV | Intercrystal pore; or undeveloped pores | 7.16–10.35 9.33 | 0.002–0.034 0.009 | 0.01–0.14 0.07 | 1.63–41.39 12.06 |
© 2018 by the authors. Licensee MDPI, Basel, Switzerland. This article is an open access article distributed under the terms and conditions of the Creative Commons Attribution (CC BY) license (http://creativecommons.org/licenses/by/4.0/).
Share and Cite
MDPI and ACS Style
Sha, F.; Xiao, L.; Mao, Z.; Jia, C. Petrophysical Characterization and Fractal Analysis of Carbonate Reservoirs of the Eastern Margin of the Pre-Caspian Basin. Energies 2019, 12, 78. https://0-doi-org.brum.beds.ac.uk/10.3390/en12010078
AMA Style
Sha F, Xiao L, Mao Z, Jia C. Petrophysical Characterization and Fractal Analysis of Carbonate Reservoirs of the Eastern Margin of the Pre-Caspian Basin. Energies. 2019; 12(1):78. https://0-doi-org.brum.beds.ac.uk/10.3390/en12010078
Chicago/Turabian StyleSha, Feng, Lizhi Xiao, Zhiqiang Mao, and Chen Jia. 2019. "Petrophysical Characterization and Fractal Analysis of Carbonate Reservoirs of the Eastern Margin of the Pre-Caspian Basin" Energies 12, no. 1: 78. https://0-doi-org.brum.beds.ac.uk/10.3390/en12010078
Note that from the first issue of 2016, this journal uses article numbers instead of page numbers. See further details here.