Article

Life Cycle Assessment and Environmental Valuation of Biochar Production: Two Case Studies in Belgium

1
Department of Agriculture and Forest Sciences, Tuscia University, 01100 Viterbo, Italy
2
Environmental Economics Research Group, Centre for Environmental Sciences (CMK), Hasselt University, 3590 Diepenbeek, Belgium
3
Laboratory for Aviation and the Environment, Massachusetts Institute of Technology, 77 Massachusetts Avenue, Cambridge, MA 02139, USA
4
Department of Innovation and Information Engineering, Marconi University, 00193 Rome, Italy
*
Authors to whom correspondence should be addressed.
Submission received: 10 April 2019 / Revised: 23 May 2019 / Accepted: 3 June 2019 / Published: 6 June 2019

Abstract

:
It is unclear whether the production of biochar is economically feasible. As a consequence, firms do not often invest in biochar production plants. However, biochar production and application might be desirable from a societal perspective as it might entail net environmental benefits. Hence, the aim of this work has been to assess and monetize the environmental impacts of biochar production systems so that the environmental aspects can be integrated with the economic and social ones later on to quantify the total return for society. Therefore, a life cycle analysis (LCA) has been performed for two potential biochar production systems in Belgium based on two different feedstocks: (i) willow and (ii) pig manure. First, the environmental impacts of the two biochar production systems are assessed from a life cycle perspective, assuming one ton of biochar as the functional unit. Therefore, LCA using SimaPro software has been performed both on the midpoint and endpoint level. Biochar production from willow achieves better results compared to biochar from pig manure for all environmental impact categories considered. In a second step, monetary valuation has been applied to the LCA results in order to weigh environmental benefits against environmental costs using the Ecotax, Ecovalue, and Stepwise approach. Consequently, sensitivity analysis investigates the impact of variation in NPK savings and byproducts of the biochar production process on monetized life cycle assessment results. As a result, it is suggested that biochar production from willow is preferred to biochar production from pig manure from an environmental point of view. In future research, those monetized environmental impacts will be integrated within existing techno-economic models that calculate the financial viability from an investor’s point of view, so that the total return for society can be quantified and the preferred biochar production system from a societal point of view can be identified.

1. Introduction

Biochar is the stable, carbon-rich substance obtained from the pyrolysis of biomass materials such as wood, manure, or leaves [1]. The application of this pyrogenic black carbon can have substantial advantages from a social, economic, and environmental point of view, such as (1) job creation (social), (2) soil improvement for higher biomass yields and possible cost savings (economic), and (3) climate change mitigation and water or air pollutant absorption due to its porous form (environmental) [2,3,4,5,6,7]. Since sustainable biochar systems are essential to the future of biochar, these systems need to address a wide range of potential environmental, social, and economic impacts [8].
The economic features of biochar production have been reflected through many techno-economic assessments (TEA) [9,10,11,12,13,14,15], where the production cost is estimated based on the investment and operation costs of conversion technologies. In addition, life cycle assessment (LCA) has been applied several times to quantify the environmental impacts of biochar production systems. The majority of the research is focused on calculating potential savings in greenhouse gas (GHG) emissions, which is the most quoted benefit of biochar production and application [16,17,18,19,20,21,22]. It has also been illustrated that agricultural land occupation might become an issue when dedicated crops are grown specifically for biochar production [23]. However, in the sustainability framework, a comprehensive assessment involves not just the quantification of the financial impact of biochar technology and issues such as global warming, but also the broader, societal, cultural, political, and environmental impacts. While an understanding of societal impact is important for decision making and product project design, collecting and analyzing data on societal impacts is difficult and requires considerable time and interpersonal skills.
One way to solve this issue is to use the optional weighting approaches in LCA for converting and aggregating the results into a single indicator. Weights can be determined in a quantitative or qualitative way [24], or can be expressed in monetary units, both for midpoints and endpoints [25]. Biophysical impacts are then translated into monetary values by means of shadow prices reflecting the societal value of non-market goods, such as environmental quality, for which no prices exist. The advantage of using shadow prices is that they make environmental impacts comparable, so that all impacts can be aggregated and integrated in a techno-economic assessment containing private costs and benefits related to the production of market goods such as biochar. In fact, disregarding external costs imposed on society over the entire life cycle of biochar can lead to inefficient market pricing of this product, which results in non-sustainable biochar systems.
To the best of our knowledge, an assessment of biochar production systems that includes a wide range of environmental impact categories and that integrates the environmental aspects with the economic and social aspects is still missing.
The use of monetary valuation is recognized in LCA [26] and is easy to understand by communicating with a wide range of decision-makers [27,28].
However, the use of monetary values in LCA is controversial as the choice of valuation method is subjective and mirrors underlying social, ethical, and political values [29,30]. Therefore, we apply and compare three monetary valuation methods to LCA results for a case study in Belgium in order to answer the following research question: “What is the monetary value of the environmental impact of biochar production and application?”. In other words, the aim of this study is to perform an LCA of two biochar production systems in Belgium, and to monetize the environmental impacts via applying and comparing three environmental valuation methods.

2. Methodology

2.1. Life Cycle Assessment (LCA)

The life cycle assessment methodology was used for the evaluation of the environmental impacts associated with the production and application of biochar in soil. The impacts were calculated in SimaPro software (version 8.3.0), according to the ISO 14040:2006 [31] requirements.

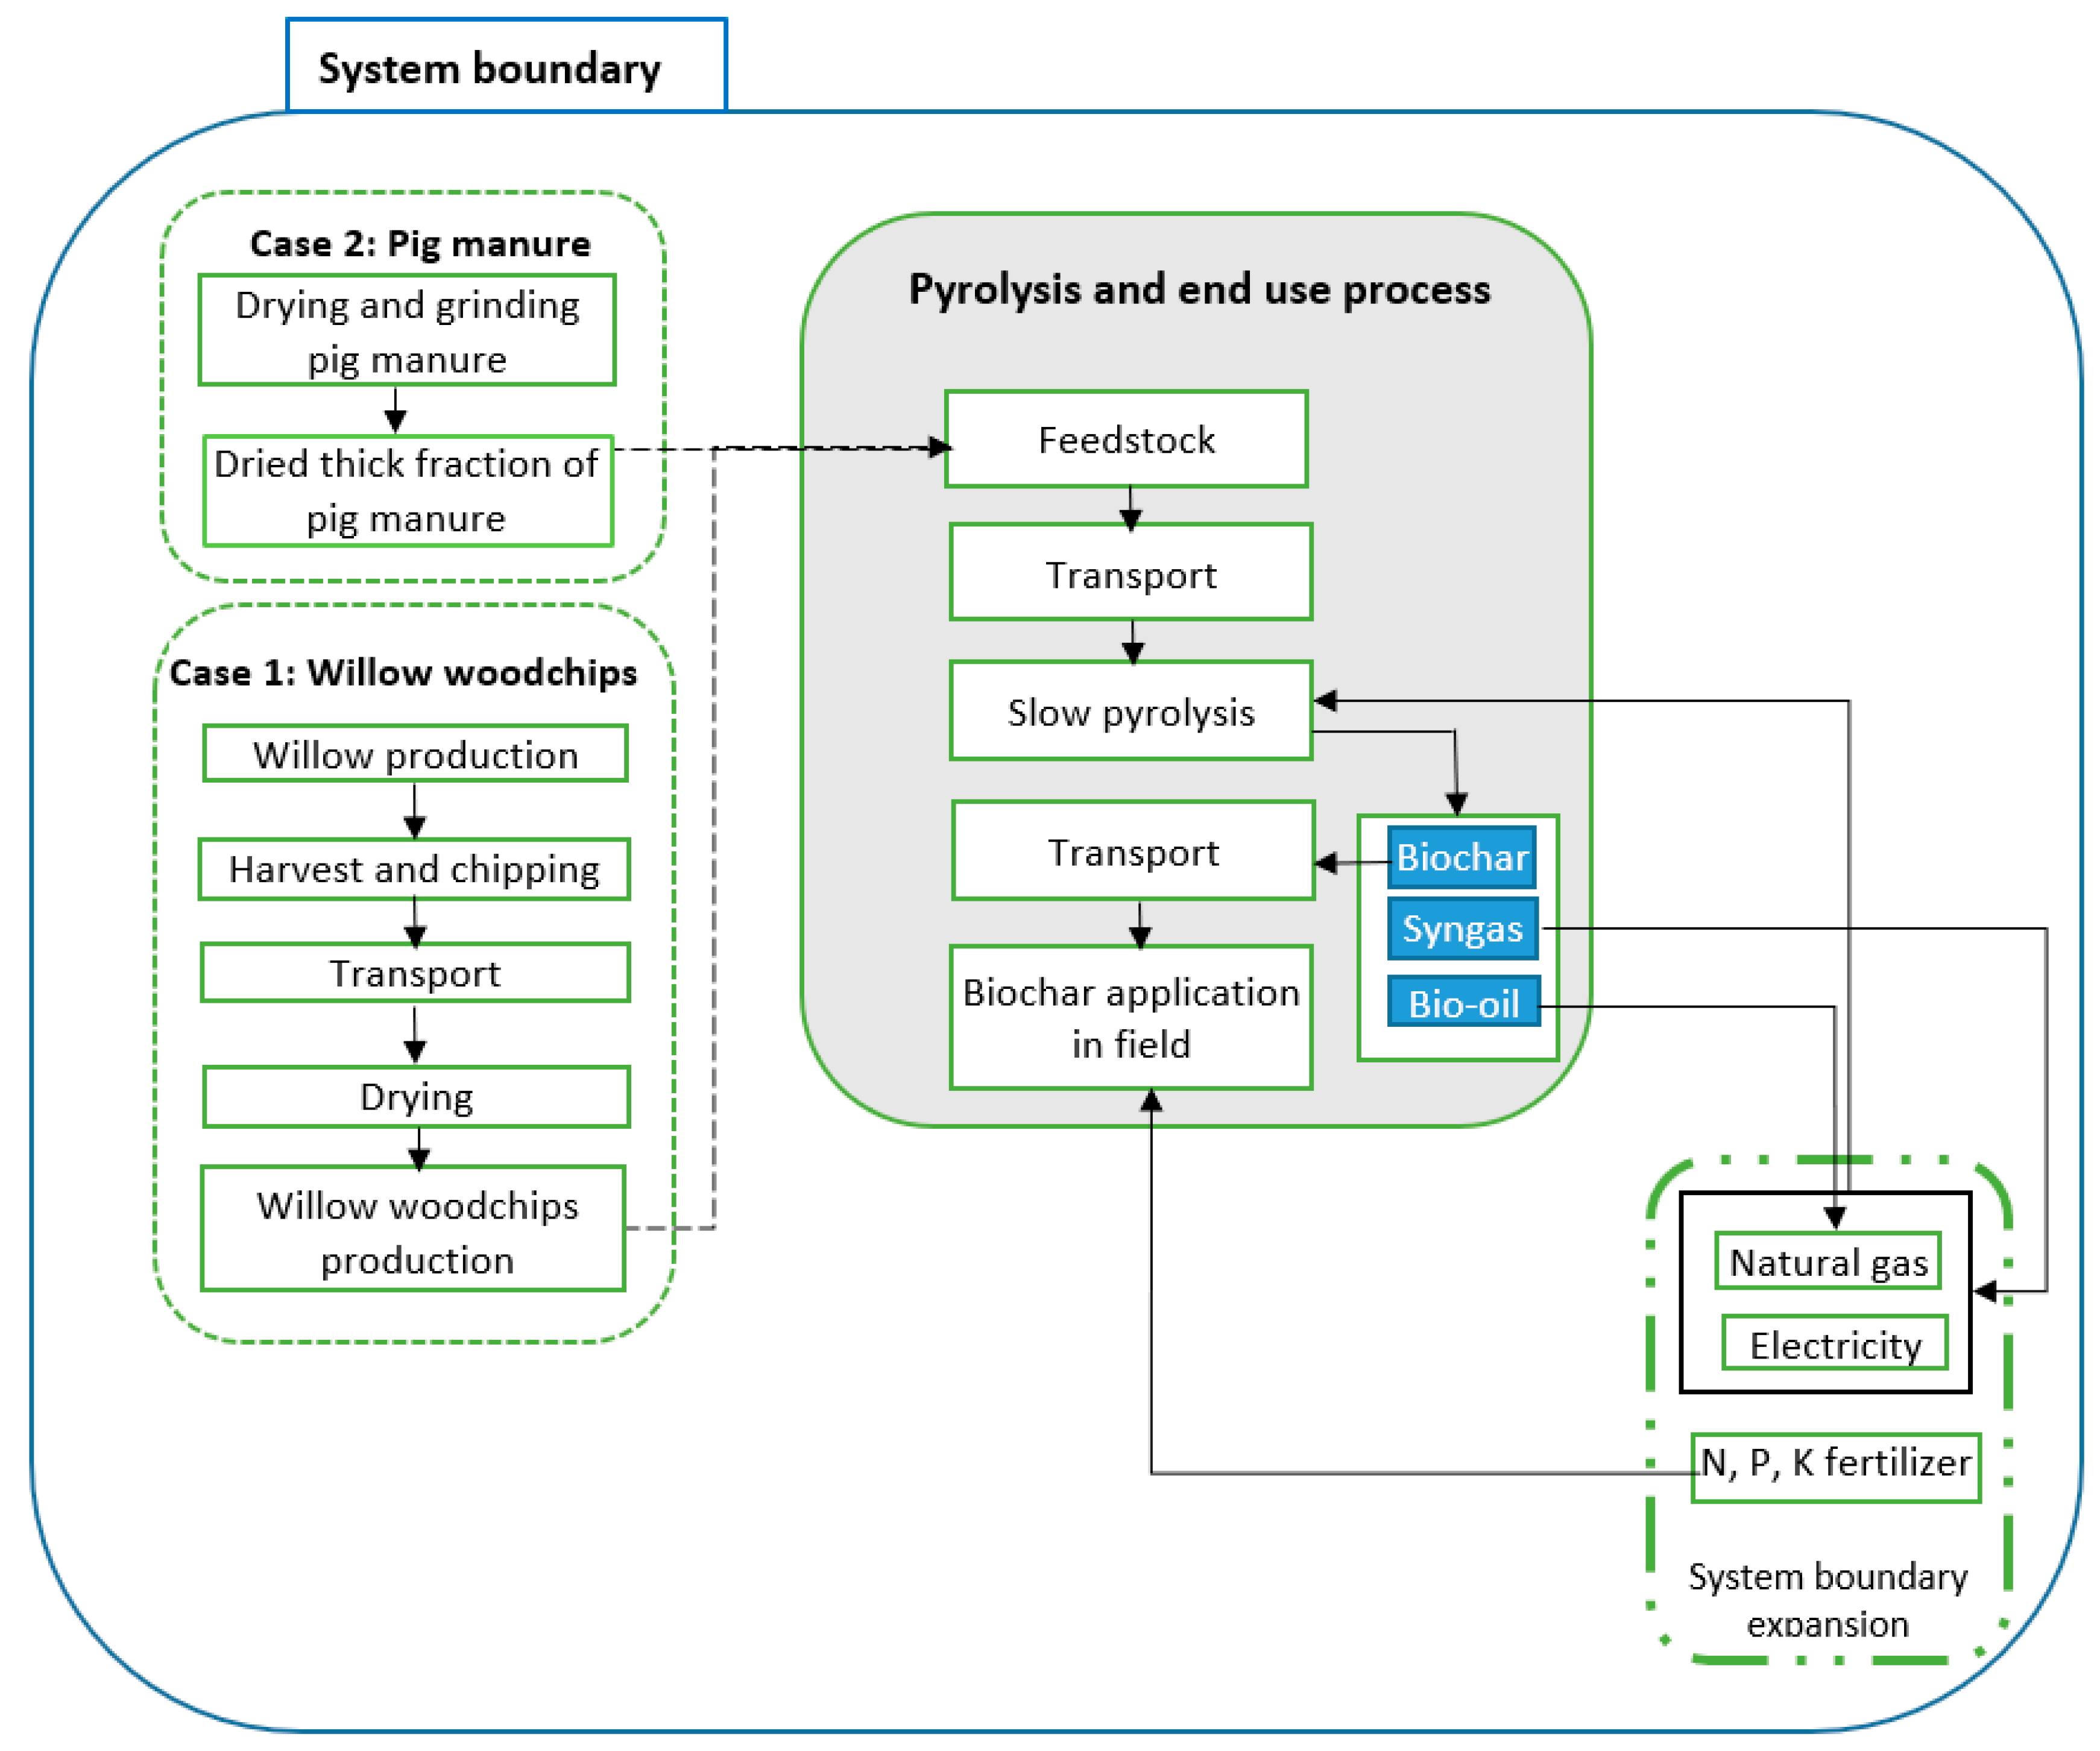
2.1.1. Goal Definition

The goal of this study was to compare the positive and negative environmental impacts of two potential cases in Belgium for biochar production and its use for soil amendment in drought-sensitive agricultural soils in the Campine region situated in the province of Limburg, Belgium. Some, but not all, of the soils in this vast region have been moderately polluted with cadmium (Cd) as a consequence of the pyrometallurgical processing of zinc until the seventies [12]. Hence, several opportunities for biochar application exist within the region as all soils are drought-sensitive and sandy, some of which are contaminated with heavy metals:
  • Metal-contaminated soils benefit from biochar application thanks to its capacity to immobilize the heavy metals;
  • Non-contaminated soils benefit from biochar application thanks to its capacity to better retain nutrients and water, especially within the context of climate change.
We propose the use of locally available feedstock to avoid the fact that biochar needs to be produced at distant locations, so that CO2 emissions from transport are prevented. Additionally, no (indirect) land use change will result from crop cultivation specifically for (unsustainable) biochar production from, e.g., tropical woods. Examples of local feedstock for biochar production include:
i.
Pig manure, which is abundantly available and needs to be processed anyhow to avoid a local oversupply of nutrients. Moreover, the processing of pig manure in three steps seems to result in a positive business case [32]. First, the pig manure is separated in water (44%), a thick fraction (17.5%), and a thin fraction (38.5%). The nutrients nitrogen (N) and potassium (K) end up in the thin fraction or concentrate, whereas phosphorus (P) is concentrated in the thick fraction. Second, the thick fraction is dried to a dry matter content of 95%. Third, the dried thick fraction is pyrolyzed for the production of biochar and energy. In full operation, it is expected that 60,000 tons of wet thick fraction can be processed annually;
ii.
Willow can be cultivated on marginal soils that remain largely unused for agricultural production as they are not fertile and might even be contaminated with heavy metals. Hence, willow can be cultivated in short rotation to either produce energy and biochar from marginal, non-contaminated soils or to extract the cadmium from 2400 ha [33] of contaminated soil to produce energy and “activated” biochar.
So far, those local opportunities for biochar production and application have been investigated at Hasselt University by conducting pyrolysis experiments for willow and pig manure feedstock within the research group Applied and Analytical Pyrolysis, and by building techno-economic models within the research group of Environmental Economics at Hasselt University [12,32]. However, the societal value of its environmental impact remains unknown.
As the application of biochar in metal-contaminated soils has not been tested yet within this region, the monetary value of the environmental impact of biochar production and application has been determined for the following two case studies:
  • Case 1: production and application of biochar from willow cultivated on non-contaminated marginal soils;
  • Case 2: production and application of biochar from the dried thick fraction of pig manure.
In the future, other feedstocks will also be investigated, but no experimental data or traditional techno-economic models are available yet. Hence, we calculated and compared the environmental benefit/cost of both feedstocks to augment the available techno-economic models. The paper is to be considered as a first iteration that needs to be refined in the future based on the questions raised by the results after the first iteration. The functional unit is defined as 1 t of produced biochar because the main function of the system is biochar production [19,21]. The system boundary is shown in Figure 1. Either pig manure (case study 1) or willow woodchips (case study 2) are used as a feedstock for the pyrolysis process. Two system boundary expansions are included to represent additional functions of biochar [21]: (i) the pyrolysis process generates excess energy as a co-product in the form of bio-oil and syngas, avoiding some consumption and production of electricity and natural gas; and (ii) the application of biochar for soil amendment reduces the use of NPK fertilizer.
The syngas is burnt to provide the internal energy requirements for heat and electricity of the pyrolysis process. Excess energy from burning syngas on top of internal energy requirements is offset to the market as a substitute for natural gas and electricity. Additionally, the bio-oil co-product is sold on the market as a replacement for natural gas.

2.2.2. Life Cycle Inventory (LCI)

Data were collected through laboratory tests, and scientific and technical literature. Some processes, such as willow woodchips production, transportation, electricity, and fuel production, were modeled using the available databases (Table A1) from the SimaPro 8.3 software. Fuel consumption emissions were estimated by IPCC guidelines [34]. Emissions released from burning syngas in combined heat and power (CHP) were estimated based on reported emission limits [35].
According to a unit process selected from the Ecoinvent 3.0 database (Table A1), activities for the production of willow woodchips comprise establishment, operation, and clearing of the plantation. The inputs of seed, mineral fertilizers, and pesticides are considered. It is assumed that no organic fertilizers are applied. In addition, the database includes all machine operations, namely soil cultivation, planting, fertilization, weed control, pest and pathogen control, harvest and chipping of willow stems, transport from the field to farm (2 km), drying of wood chips under a roof (air drying; no electricity input), and clearing of the plantation by a rotary tiller including the growing of oil radish (not harvested). Corresponding machine infrastructure and sheds are also covered in this database. Further, direct field emissions are included. This activity ends after mulching of the oil radish and with the provision of willow wood chips at the farm gate.
It is assumed that the pyrolysis plant will be operational for 20 years with 7000 working hours per year. The residence time of the feedstock is 60 min and the process temperature is set at 500 °C, allowing the volatile components to escape while a charred solid is left behind.
In the first case study (Table 1), wood chips were transported to the pyrolysis plant. According to pyrolysis experiments conducted at Hasselt University, the measured product yields for biochar, syngas, and bio-oil were 33.5%, 31.9%, and 34.6% of W dry feedstock, respectively. Moreover, the calorific values of the syngas and the bio-oil were calculated to be 11 and 16 MJ/kg, respectively. The carbon sequestration potential of biochar application to the soil was calculated based on the total carbon content of biochar as 75% of Wdry biochar for willow, of which a conservative share of 80% consists of stable carbon.
In the second case study (Table 2), first, the pig manure is separated in water (44%), a thick fraction (17.5%), and a thin fraction (38.5%). Second, the thick fraction is dried to a dry matter content of 95%, and this dried thick fraction, after grinding, is the feedstock of the pyrolysis plant. This implies that additional pretreatment (drying and grinding) is required after the reception of the separated thick fraction of pig manure at the farm. The management of pig farms itself is not included in the system, as it is not expected that choosing pyrolysis instead of anaerobic digestion as the preferred manure processing technology will influence the farm’s operations. According to the experimental results that have been obtained from the Cleantech business case for pig manure (second case study), pyrolysis of the dried thick fraction resulted in 48.8% (in terms of Wdry feedstock) biochar, 23.3% bio-oil, and 27.9% of syngas. Based on Cleantech estimation, one ton of biochar was produced by 2.9 tons of dried tick fraction. Furthermore, the calorific values of the syngas and the bio-oil were calculated to be 4 and 17.5 MJ/kg, respectively. The carbon content in the biochar from the dried thick fraction of pig manure that is used in calculating its carbon sequestration potential was estimated to be 33.7% of Wdry biochar.
Syngas in both cases was assumed to burn in a CHP with an electric efficiency of 25.6% and thermal efficiency of 54.4% [36]. In willow biochar, 12% of electricity generated entirely met the need of pyrolysis and the excess electricity (88%) was considered as an avoided product. However, heat from syngas burning covered only 73% of pyrolysis requirements. Comparatively, in the pig manure case, burning syngas could only provide 30% and 37% of heat and electricity demands of pyrolysis, respectively. Therefore, the avoided product in this case was only connected to bio-oil production.
As part of the application to soil, the biochar not only sequesters C, but also improves crop performance [37,38], which is a result of the enhancement in fertilizer use efficiency. This improvement can therefore reduce the amount of commercial chemical fertilizers applied. The dose of biochar applied to the soil as a main factor affects the results [39,40]. According to [17], 30 t ha−1 application of biochar for winter wheat crops can lead to a 10%, 5%, 5%, and 25% decrease in N, P, and K, fertilizers and N2O emissions, respectively. Therefore, the total amount of N, P, and K fertilizers avoided and reduction of N2O under normal management conditions of winter wheat [41] were calculated as 20, 3, 4, and 78 kg ha−1, respectively. Since these assumptions can be affected by the area’s climate, type of biochar, and agricultural plant, uncertainty of these assumptions is considered as a defined range for sensitivity analysis. The transportation distance of biomass feedstock to the pyrolysis facility and biochar to the field was also considered to be 40 km.

2.2.3. Impact Assessment

In LCA studies on biochar, impact methods such as ReCipe midpoint [21] and Eco indicator 99 [20] have been developed for biochar systems. In this study, the life cycle impact assessment was performed using IMPACT 2002+ and CML-baseline methods in SimaPro 8.3. The former was selected since the IMPACT 2002+ [42] model is one of the main applied models in LCA analysis [43,44] and it enables researchers to consider environmental impacts on both a midpoint and endpoint level. However, the latter was chosen as a basis for the quantification of monetary values.

Monetizing Environmental Impacts

Monetization of environmental impacts can be carried out by means of benefit transfer using shadow prices that represent the value of those environmental aspects [45]. So far, there is no consensus in the scientific community on the most appropriate monetization method for weighting environmental impacts in LCA [46]. Therefore, three monetary valuation methods were employed: Ecotax02 [47], Ecovalue08 [48], and Stepwise2006 [49]. The Ecotax method is based on taxes and fees that are paid in Sweden for emissions and resource use and hence are an expression of the revealed value society attributes to the environmental effects. Stepwise2006 is based on a relatively new method [37] that takes into account the budget constraint, i.e., the annual income an average person can pay for an additional life year [35]. The use of a budget constraint reduces the uncertainty or bias that is associated with stated preference methods for the economic valuation of environmental impacts as respondents may not adequately consider their real income when answering questions related to their willingness to pay for environmental goods and services. The Ecovalue08 method, on the other hand, is based on the value individuals (rather than society) place on environmental goods and services. The Ecovalue08 method has been specifically developed in order to have a consistent weighting set which is based on the same valuation principle for all environmental impact categories considered [34]. The three methods hence represent different approaches (revealed versus stated preference, whether or not taking into account budget constraints) that can be used for a monetary valuation of environmental impacts and thus give an indication of the range within which the true value of the environmental impact will fall. As the existing techno-economic models for the two case studies are expressed in Euro2012 terms, the monetary values from the weighting methods have been converted into Euro2012 using European inflation rates between 2002 and 2012 [50].
The three methods also differ in terms of the characterization method and impact category levels (midpoint versus endpoint) for which they have been designed. Ecotax02 and Ecovalue08 have been designed for weighting at the midpoint level using CML midpoint categories [47,48], whereas Stepwise2006 provides the option of expressing results in both midpoints and endpoints through combining monetarization values with midpoint impact categories of IMPACT2002+ and EDIP 2003 [49]. In the present study, the results of this method are expressed at the midpoint level. To compare these methods, Table 3 presents the relevant weighting factors connected to each method. Since these factors are defined for the CML method’s impact categories, first, the characterization of impact categories was conducted according to the CML life cycle impact assessment (LCIA) method. Next, the quantified environmental impacts were multiplied by the weighting factors presented in Table 3.

2.2.4. Uncertainty Analysis

Uncertainty issues are always relevant in LCA studies. However, they are deemed to be more critical when developing comparative models. Therefore, uncertainty analysis of the main assumptions is necessary to support the results of comparative studies [52].
In this study, data uncertainty is assessed and quantified for NPK savings, as well as by products of the process, namely, syngas and bio-oil. As we do not have access to empirically-based data related to those uncertainties, one can apply the same arbitrary variation to the uncertainties [53], e.g., a coefficient of 10% from the nominal value of the uncertain variable [54,55]. Therefore, there is no specific rational for using ±10% variation, except for applying a conventional way of conducting sensitivity analysis when true ranges are missing.

3. Results and Discussion

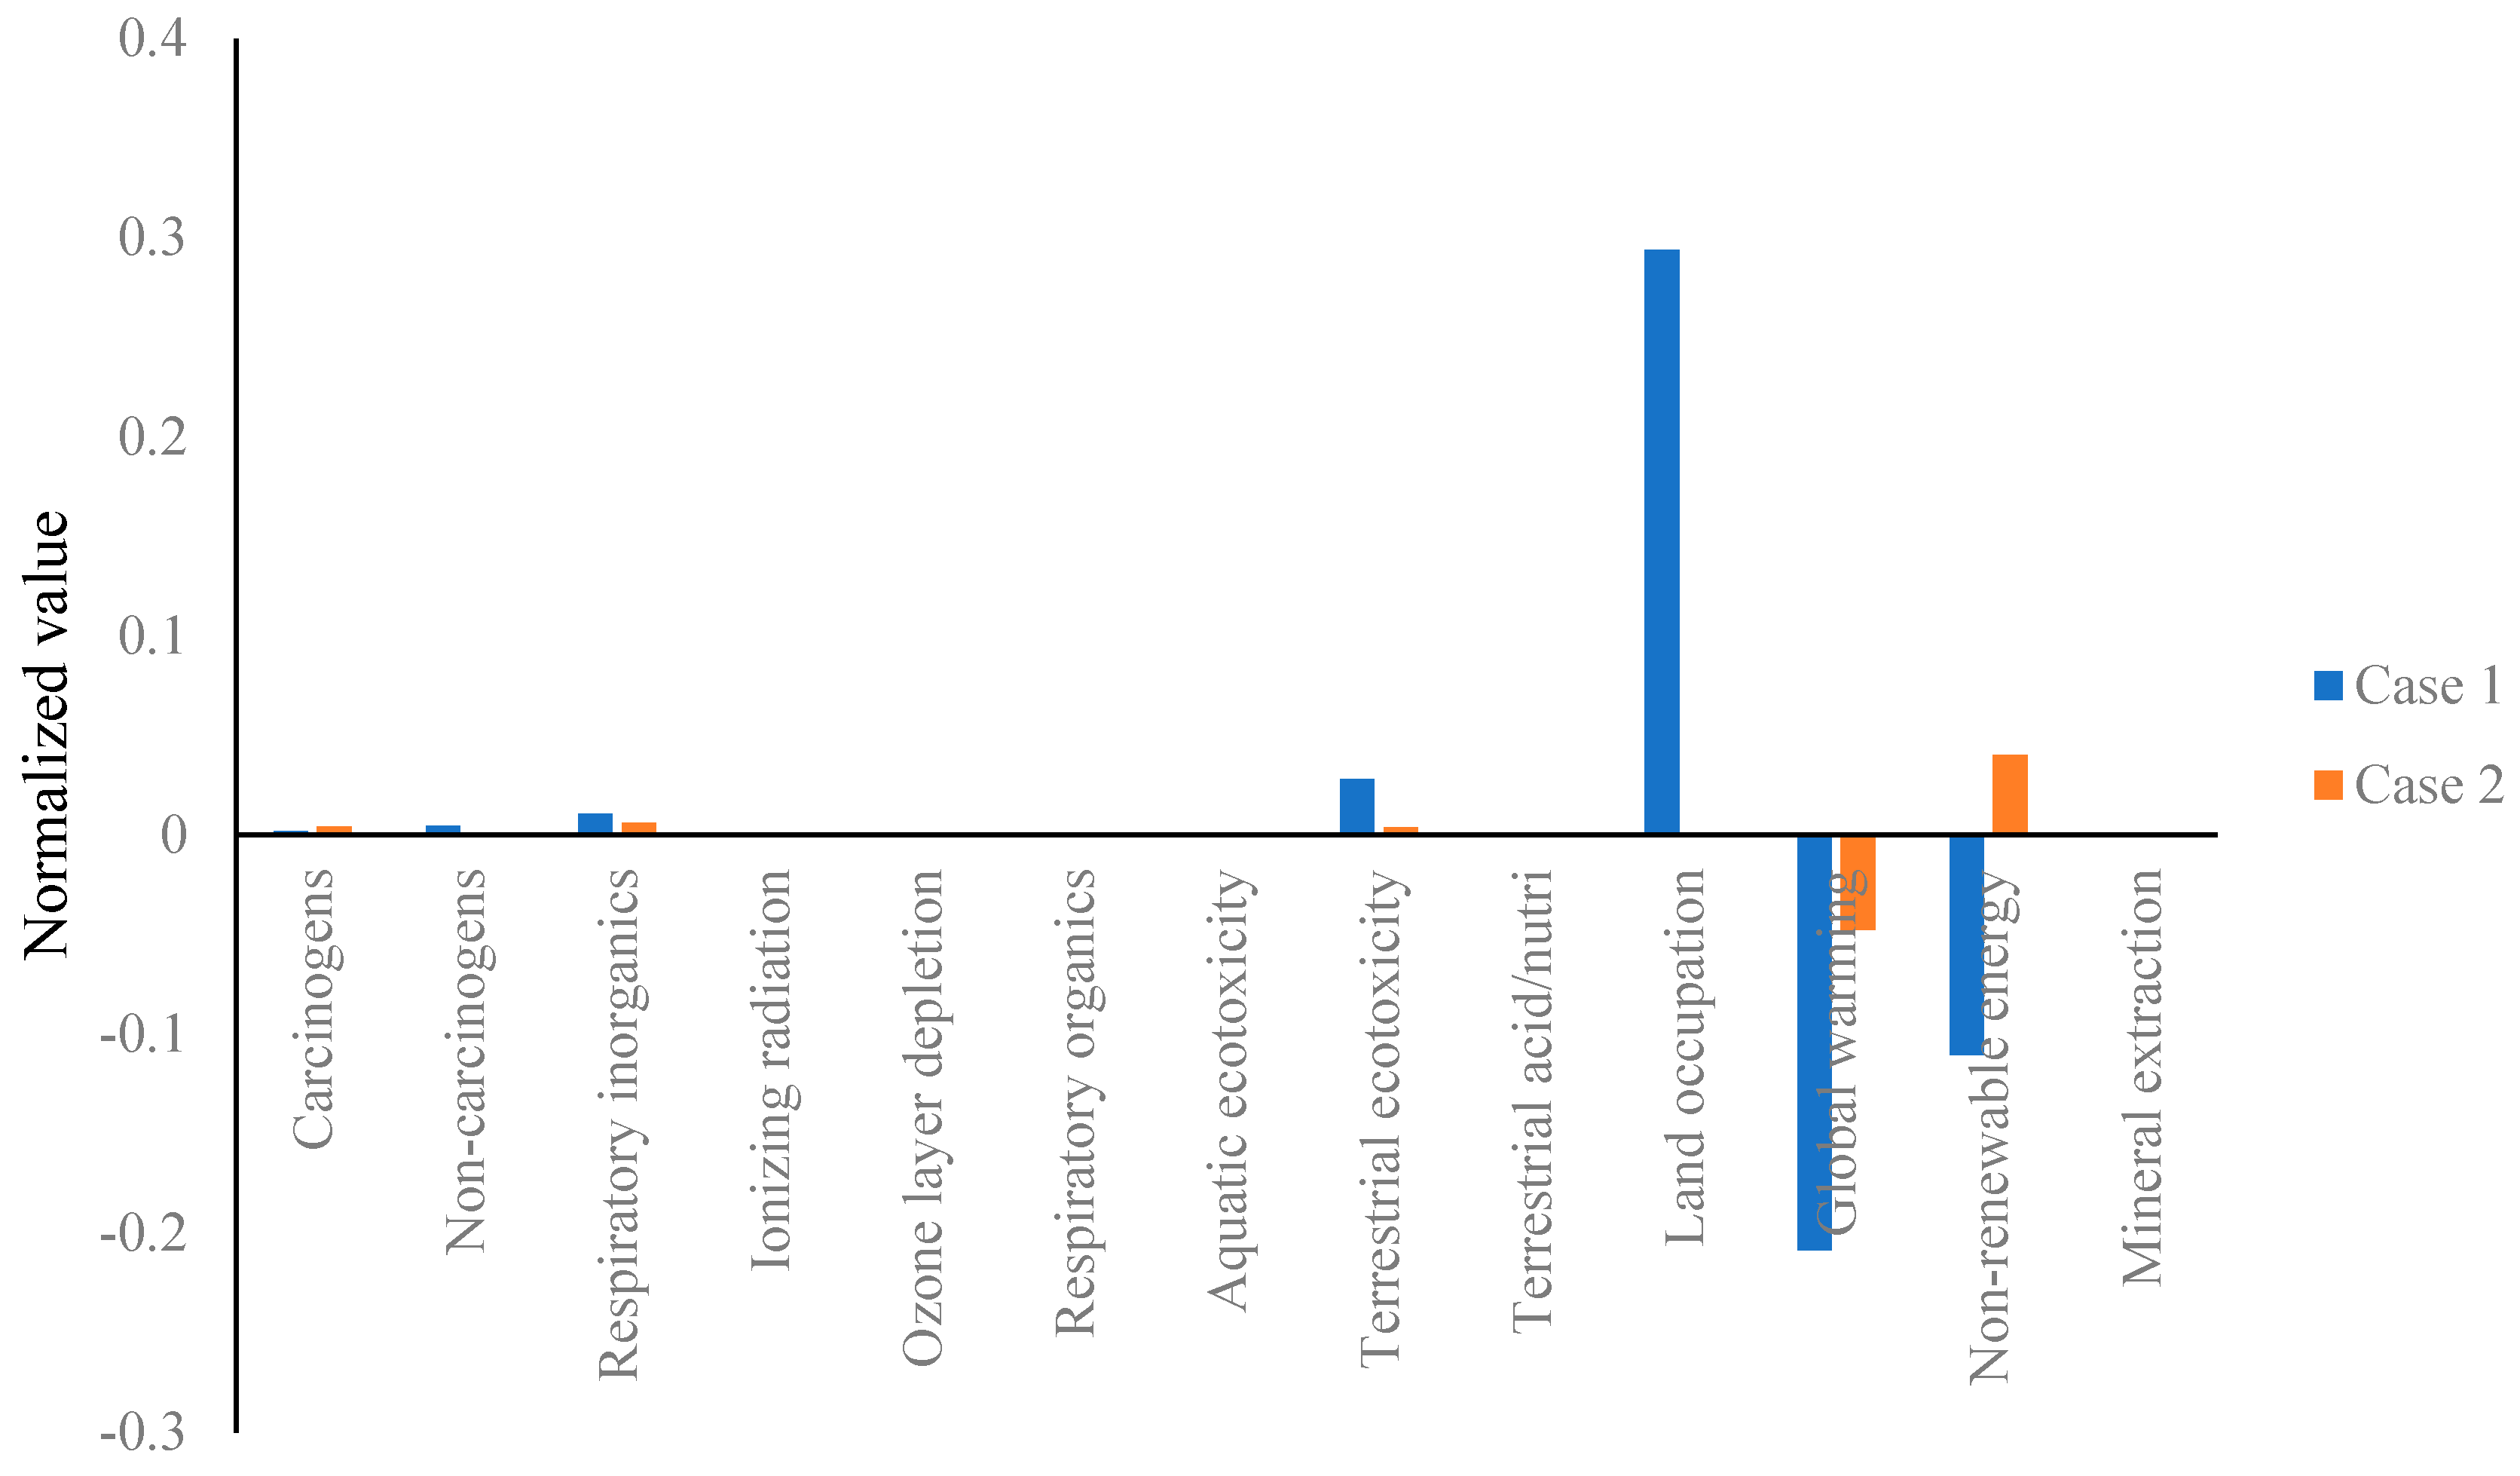
3.1. Interpretation of LCA Midpoints

The characterization results of the life cycle impact assessment for the two case studies are reported in Table 4 in terms of Impact 2002+ midpoint categories. Case 1 and 2 represent biochar production from willow and pig manure, respectively. Negative values mean that environmental savings are generated by avoiding the use of products during biochar production and its application in soil, while positive values represent a burden for the environment. The results show that ionizing radiation, non-renewable energy, and global warming impacts were reduced in willow biochar production compared with pig manure biochar production ((−9500 vs. 22,392 Bq C-14 eq t−1), (−16,830 vs. 6100 MJ t−1), and (−2063 vs. −472 kg CO2 eq t−1), respectively). This is explained by a high contribution from natural gas and electricity production processes to ionizing radiation and non-renewable energy categories. Since the willow biochar process results in a higher amount of natural gas and electricity being avoided, related impacts are greatly reduced compared with pig manure biochar. In terms of global warming, the difference mainly refers to the higher potential of willow biochar with regards to CO2 emission saving in soil compared with pig manure biochar.
On the contrary, pig manure biochar represents lower impacts than those of willow biochar in other impact categories. Particularly, differences are highlighted in terms of aquatic ecotoxicity, terrestrial ecotoxicity, and land use categories due to agricultural machinery, nitrogen fertilizer application, and land occupation in the cultivation and chipping phase of willow.
In the next step, normalization is used to solve the incompatibility of units and simplify the interpretation of the results. In fact, normalization shows the relevant share of each impact category to the overall impacts through the application of the normalization factor. The normalization factor is defined as the impacts of all substances in their specific categories per person per year. The normalized values are obtained through dividing the characterization results by normalization factors, so the unit of all normalized values is [pers year/unitemission], i.e., the number of equivalent persons affected during one year per unit of emission [42]. The Impact 2002+ normalization set defined for the European zone was employed.
According to the obtained results (Figure 2), it can be inferred that the most affected categories are terrestrial ecotoxicity, land occupation, global warming, and non-renewable energy. These categories are analyzed in detail below.

3.1.1. Land Occupation

Case 1 (willow) has the most adverse impact on land occupation. This is due to land use for the willow production process. Hence, if case study 1 is implemented, the willow should be cultivated on marginal land (though not polluted with Cd). Case 2 (pig manure) has the lowest impact as the dried thick fraction is considered as waste from a pig farm.

3.1.2. Global Warming

Both case studies result in net savings of CO2 emissions and thus can be considered as a measure to fight global warming. The expected savings in CO2 emissions can be explained by the substituted amount of heat and electricity production and reduced fertilizer production, amongst other factors, but the highest share in total CO2 savings is attributable to the application of biochar in soils. The difference in savings of CO2 emissions can be explained by the different stable carbon content of the produced biochars. The biochar produced from willow can reduce GHG emissions more than pig manure biochar (2.2 t CO2 vs 0.98 t CO2 t−1 of biochar) because the stable carbon content of willow biochar is higher than that of pig manure biochar. The value obtained for savings of CO2 emissions as a consequence of the application of willow biochar is close to those reported by Hammond et al. [17], being between 2.1 and 2.7 t CO2 t−1 biochar.

3.1.3. Non-Renewable Energy

Case 1 (willow) reduces the amount of primary energy consumed, whereas case 2 (pig manure) results in a net increase of primary energy consumption. The reduction of 18,109 MJ of primary energy per ton biochar in case 1 (willow) can be explained by the substitution of natural gas and electricity resulting from the use of the pyrolysis byproducts (syngas and bio-oil). The increase of 10,820 MJ primary energy per ton biochar in case 2 (pig manure) is the result of the energy needed during the pretreatment process (especially drying) for pig manure.

3.1.4. Terrestrial Ecotoxicity

Additionally, in the impact category of terrestrial ecotoxicity, case 1 (willow) results in a more intensive impact than case 2 (pig manure). The main contribution to emissions in case 1 comes from fertilizer and agricultural machinery application during the production of willow wood chips, whereas the main contribution to emissions in case 2 comes from high electricity and heat consumption in the pretreatment of pig manure.

3.2. Interpretation of LCA Endpoints

Table 5 shows the damage endpoint categories and total impact single scores for each case per ton of biochar production. Case 1 (willow) resulted in reduced impacts on all categories, except ecosystem quality, due to land occupation during willow production. Case 2 (pig manure), on the other hand, results in increased impacts on all categories except climate change.
Figure 3 can be used to analyze the contribution of the process steps to the total damage. For case 1 (willow), the net reduction of resource consumption is caused by the avoidance of electricity and fuel production during the biochar production process. In both cases, the use of heat in the biochar production process and additionally in case 2 (pig manure) for drying the feedstock is the hotspot in the human health impact category.
According to the single score in the last line of Table 5, which represents a weighted score of overall impact categories that is not based on monetization, one can conclude that biochar production from willow is preferred over biochar production from pig manure from a life cycle perspective based on the aforementioned assumptions. In addition, according to the single score, one can even say that the production and application of biochar from willow is beneficial for the environment. Another important take-home message from Figure 3 is that one should look for more sustainable solutions for the pretreatment of pig manure. If these can be found, another iteration of the life cycle analysis should provide better insight into the environmental balance for both biochar production pathways as a basis for selecting the preferred biochar production pathway.

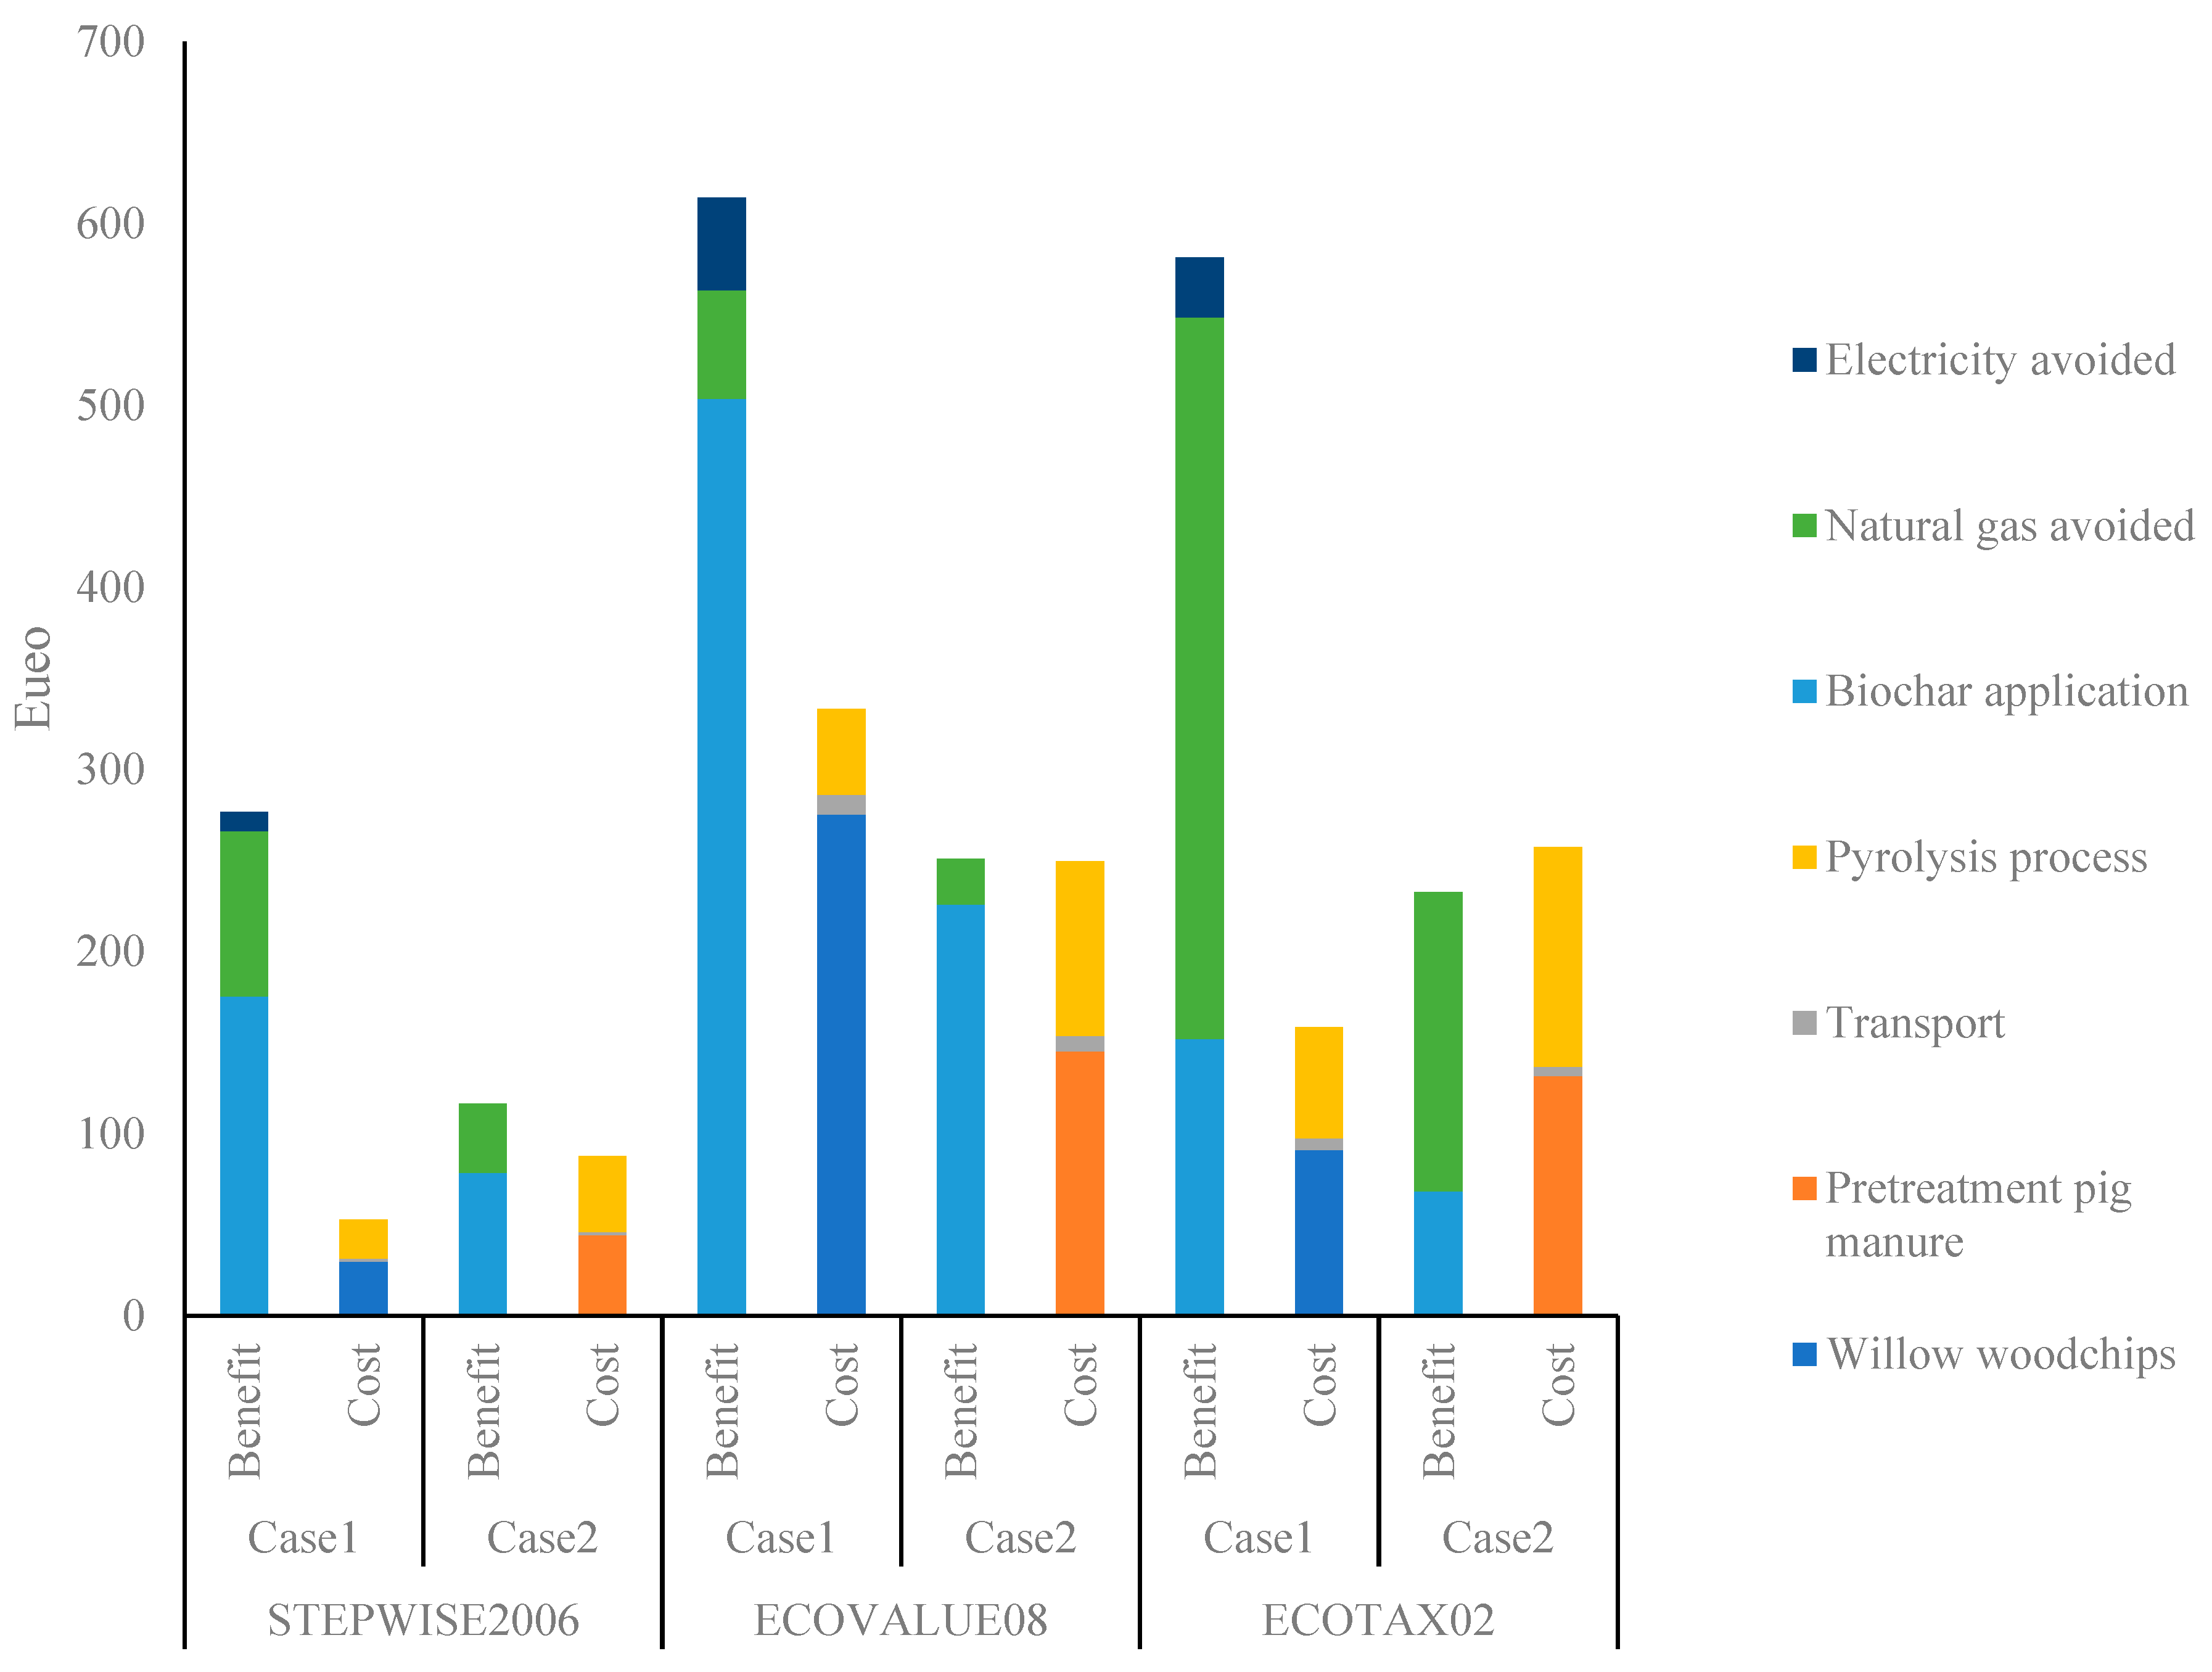
3.3. Interpretation of the Monetized Value of the Environmental Impacts

The characterization results via the CML method (Table 6) were multiplied by the weighting factors presented in Table 3. The summary of results for the environmental valuation of willow and pig manure biochar production are reported in Table 7 for each of the three monetary valuation methods (Stepwise2006, Ecotax02, and Ecovalue08). Table A2 and Table A3 present results in detail.
All values in Table 7 are aggregated and visually represented in Figure 4. As prices cannot be negative, the signs in Table 7 reflect the sign of the environmental impact, i.e., negative values reflect avoided environmental impacts, whereas positive values represent processes that release emissions and hence are an environmental burden. After multiplying the avoided or additional emissions by their shadow price, the negative values can be interpreted as a benefit for society, whereas the positive values represent the external cost for each impact category considered.
In terms of the net balance of external benefits and costs, all three valuation methods lead to the same conclusion for the first case on biochar production and application with willow feedstock. Using shadow prices as weights for the environmental impacts does not lead to a different conclusion compared to the single score of Table 5, in which non-monetized weights are used: all of the three methods indicate that the external benefits of biochar production and application with willow are higher than the external costs.
For the second case study, it was concluded from the single score (using non-monetized weights) in Table 5 that biochar production and application from pig manure was rather detrimental for the environment, which was mainly due to the high energy demand in the pretreatment step for drying the thick fraction. Applying the Ecotax02 method gives the same conclusion: biochar production and application from pig manure results in a net external cost and again, the pretreatment step is the largest contributor to the external cost. However, the distance between the external benefits and external costs, which corresponds to the value of the net external cost/benefit, is not as large as the distance or net benefit in the case study for willow. Moreover, according to the Ecovalue08 and Stepwise2006 methods, the external benefits are even higher than the external costs of the pig manure biochar system. Therefore, if sustainable solutions can be found for the pretreatment step of pig manure, the sign of the net result might be reversed. Hence it is important to investigate the effect of alternative pretreatment pathways on the net external cost/benefit in the pig manure case.
If we look at the results in more detail (see Figure 4), according to the Ecovalue08 method, in both cases, the application of biochar to soils is the main contributor to the external benefits from reduced global warming, which again can be traced back to the stable carbon content of the biochar. For either method and either case, it is also clear that the production of energy from the pyrolysis byproducts results in external benefits as a consequence of the avoided use of natural gas and electricity. However, the external benefits from avoided energy use are smaller for the pig manure case, because more biochar and less byproducts are produced in the latter case study.
When we compare the three methods, the Ecovalue08 and Ecotax02 methods indicate a different system component as the main contributor to the total external environmental benefit. For the Ecovalue08 method, it is concluded that the application of biochar contributes the most to the total external benefits. The Ecotax02 method, however, indicates that the reduced demand for primary energy or abiotic resources, i.e., the avoided energy use because of the valorization of the pyrolysis byproducts, is the most important contributor to external benefits. Another difference can be found in the relatively high value attached to human toxicity according to the Ecovalue08 method for both the production of willow woodchips and the pretreatment of pig manure. This can be partly explained by the relatively higher price the Ecovalue08 method attaches to this environmental impact category (see Table 3).
Comparing the willow and manure biochar system, it can be concluded that the external benefits for the willow biochar system are double the external benefits for the manure biochar system, which is explained by (i) the higher amount of saved energy consumption thanks to the pyrolysis byproducts in the willow biochar production system and (ii) the higher carbon content of the willow biochar (Figure 4).

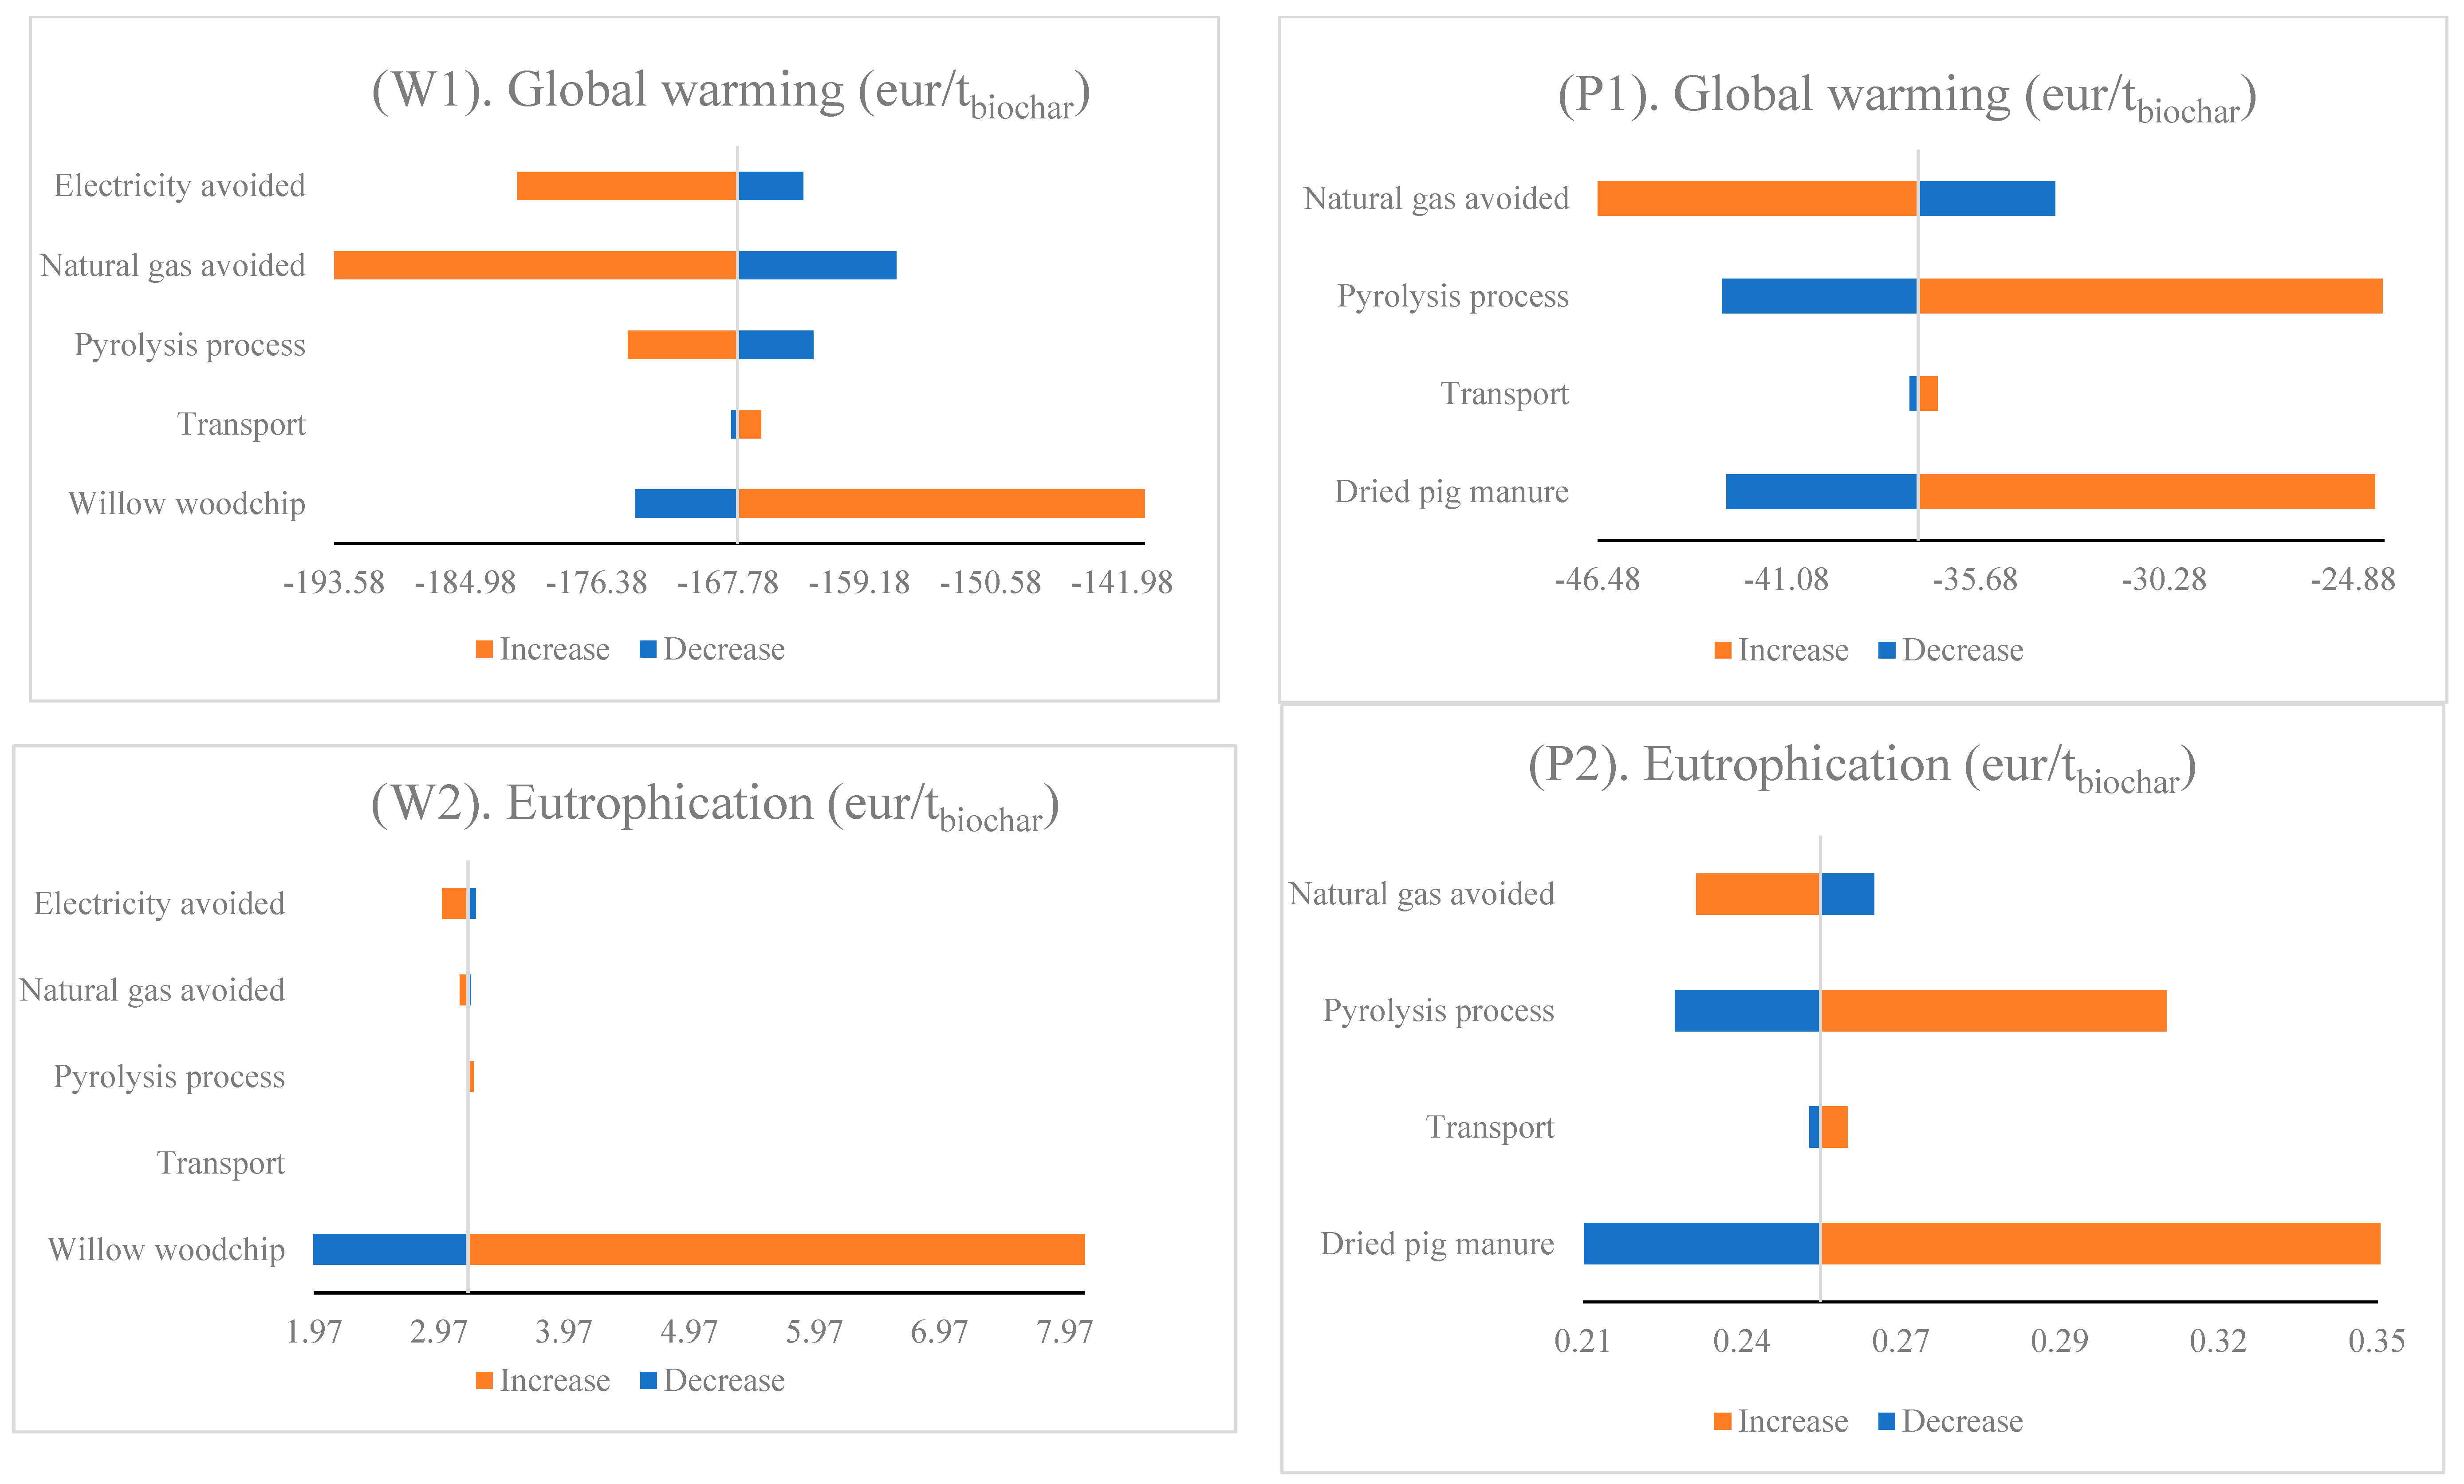
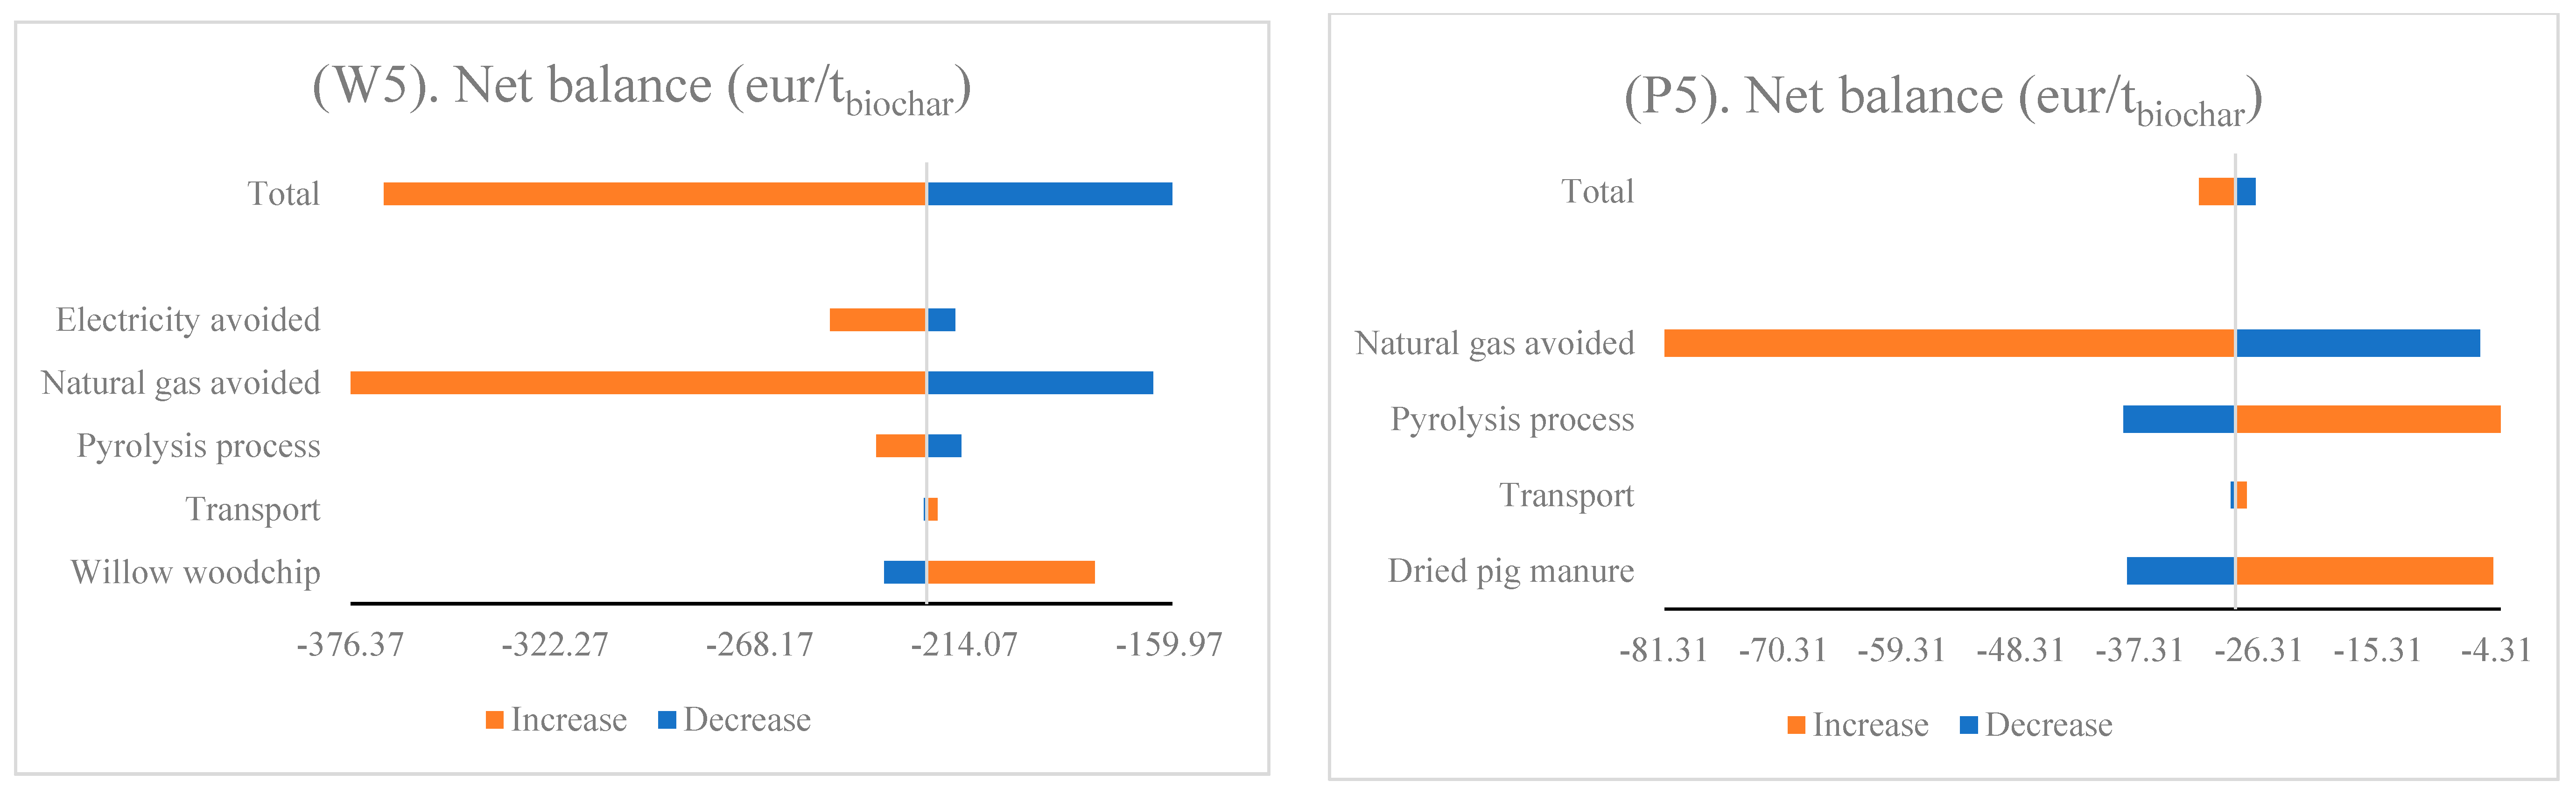
3.4. Sensitivity Analysis

This analysis assesses the impact of variation in NPK savings and byproducts of the process on monetized life cycle assessment results. Stepwise 2006 is selected as representative of valuation methods. Uncertainty analyses of the effect of different emission sources on the environmental value of impact categories for willow and pig manure biochar are presented as tornado diagrams in Figure 5. These diagrams show the variables which have the greatest effects on each of the impact categories and associated environmental values. The results present the impact of a 10% increase and 10% decrease in the average quantities of bio-oil and syngas and NPK savings on the outcome of the model. As it is seen, in willow biochar production, the most sensitive variable for human toxicity and eutrophication was willow woodchip production. However, human toxicity and eutrophication in pig manure biochar production showed the highest sensitivity for the pretreatment of pig manure. This is interpreted as a result of the high dependency of the pretreatment process of pig manure on heat and electricity consumption partly supplied by pyrolysis gas. Avoiding natural gas contributed the most to abiotic resources in both willow and pig manure biochar production. The results of the variation in NPK savings for all impact categories in both cases are negligible. Overall, the results of uncertainty analysis in W5 and P5 signified that feedstock provision and avoided products had high impacts on environmental values of biochar production in both cases. The total net balance in Figure 5. indicates that a ±10% variation in the quantity of byproducts produced can result in a range of environmental benefits from 159.9 euro to 367.6 euro and from 26.6 euro to 31.9 euro per 1 ton of biochar produced from willow and pig manure, respectively.

4. Conclusions

This study investigated the environmental impact of biochar production from two feedstocks and its use for soil amendment by means of LCA. The novelty of the work consists of a comprehensive assessment of biochar production systems comprising a wide range of environmental impact categories and quantifying the environmental aspects as monetary values. This can be done by a weighting step in which monetary and non-monetary weights can be used. The advantage of monetary weights is that they reflect the values society or individuals attach to environmental goods or impacts, and they can be integrated with private costs and benefits from a traditional techno-economic assessment (TEA). For this purpose of integration, in future research, social impacts will also be quantified and monetized, and those monetized environmental and social impacts will be complemented by existing techno-economic models in order to develop a new methodological framework, i.e., a “societal techno-economic assessment”, that takes into account both private and external costs and benefits and ultimately covers economic, social, and environmental aspects. This paper contributed to the calculation of the monetized value of the environmental aspects. Governments can use this information to devise policies for new technologies and to determine the right amount of taxes and subsidies to correct market failures.
The novel and main contribution of this paper, with respect to the literature, was the determination of the monetary value of the environmental impact of biochar production and its application for two case studies in Belgium using (i) willow and (ii) pig manure as a feedstock, for which techno-economic models were available. For the relevant (normalized) impact categories (global warming and non-renewable energy use), the willow biochar pathway outperforms the manure pathway. There are problems for land occupation and terrestrial ecotoxicity in the willow case, but these can be solved by restricting the growth of willow crops to marginal soils and the efficient application of fertilizers during willow growing. One of the main reasons why producing biochar from pig manure seems less beneficial is due to the high energy cost in the pretreatment step. Therefore, it is advised that researchers take a closer look at more sustainable ways of handling pig manure before it enters the pyrolysis reaction. If these can be found, another iteration of the life cycle analysis should provide better insight into the environmental balance for both biochar production pathways as a basis for selecting the preferred biochar production pathway.
In both cases, applying monetary weights resulted in the same conclusion as the one from using a single score environmental impact using non-monetary weights: under current assumptions, the willow biochar pathway appears to be better for the environment compared to the manure biochar pathway. Hence, a potential successful application of a willow-biochar system can consist of growing willow trees on non-contaminated marginal land for the production of biochar, and subsequently using the biochar for soil amendment within contaminated land to immobilize the metals.
However, the applied shadow prices differ and, as a next step, it should be investigated which method reflects the biochar production systems under investigation the best. For instance, the geographical scope might explain divergence: Ecotax2002 and Ecovalue08 are based on Swedish conditions, whereas Stepwise2006 has a more global scope. The annual income can be easily adjusted to the regional context when applying the Stepwise2006 approach, though Ecotax2002 and Ecovalue08 require more extensive adjustment steps that are beyond the scope of the current paper. Sensitivity analysis results also revealed that avoided products and feedstock provision had great impacts on the environmental values of biochar production in both cases.

Author Contributions

Conceptualization, S.R.H. and T.K.; methodology, S.R.H. and M.V.; software, S.R.H.; validation, E.B., A.C. and M.V.; formal analysis, S.R.H. and M.V.; investigation, S.R.H.; resources, R.M., M.V. and E.B.; data curation, S.R.H. and T.K.; writing—original draft preparation, S.R.H.; writing—review and editing, S.R.H., M.V. and E.B.; visualization, S.R.H.; supervision, M.V.; project administration, A.C. and M.V.; funding acquisition, A.C., E.B. and M.V.

Funding

The research was partially supported by MIUR (Ministry for education, University and Research), Law 232/2016, “Department of excellence” and partially supported by MISE (Italian Ministry of the Economic Development), “HBF2.0” Project, Grant number: CCSEB_00224. Additionally, the research was partially supported by the Italian SME company Enertecna.

Conflicts of Interest

The authors declare no conflict of interest.

Appendix A

Table A1. List of the processes extracted from SimaPro in this study.
InputProcessProject
Willow woodchipWood chips and particles, willow {RoW}| willow production, short rotation coppice | Alloc Def, UEcoinvent 3
Transport willow woodchip to pyrolysis plantTransport, freight, lorry >32 metric ton, EURO6 {GLO}| market for | Alloc Def, UEcoinvent 3
HeatHeat, district or industrial, natural gas {Europe without Switzerland}| heat production, natural gas, at boiler modulating >100 kW | Alloc Def, UEcoinvent 3
Transport Willow biochar to fieldTransport, freight, lorry 16–32 metric ton, EURO6 {GLO}| market for | Alloc Def, UEcoinvent 3
Natural gasNatural Gas Mix, technology mix, consumption mix, at consumer, onshore and offshore production incl. pipeline and LNG transport EU-27 SELCD
Electricity Electricity, medium voltage {BE}| market for | Alloc Def, UEcoinvent 3
N fertilizerNitrogen fertilizer, production mix, at plant/USUSLCI
K fertilizerPotassium chloride (NPK 0-0-60), at plant/RER EconomicAgri-footprint
P fertilizerPhosphorous fertilizer, production mix, at plant/USUSLCI
Transport pig manure to pyrolysis plantTransport, freight, lorry >32 metric ton, EURO6 {GLO}| market for | Alloc Def, UEcoinvent 3
Transport pig manure biochar to fieldTransport, freight, lorry 16–32 metric ton, EURO6 {GLO}| market for | Alloc Def, UEcoinvent 3
Table A2. Environmental valuation per 1 ton biochar produced from willow.
Impact CategoryWillow WoodchipsTransportPyrolysis PlantBiochar ApplicationNatural Gas AvoidedElectricity AvoidedTotal
Ecovalue08
Abiotic resources0.99 €0.10 €1.13 €0.03 €−8.82 €−0.53 €−7.09 €
Global warming 51.14 €2.98 €32.66 €−504.73 €−45.31 €−17.36 €-480.62 €
Ozone depletion 0000000
Human toxicity148.76 €7.31 €10.89 €2.10 €−2.44 €−30.25 €136.36 €
Photochemical oxidation0.28 €0.01 €0.06 €0−0.47 €−0.06 €−0.18 €
Acidification4.85 €0.12 €1.00 €−0.11 €−2.08 €−0.67 €3.11 €
Eutrophication69.40 €0.18 €1.52 €−0.83 €−0.80 €−1.83 €67.65 €
Net balance275.41 €10.71 €47.27 €−503.54 €−59.91 €−50.71 €−280.77
Stepwise2006
Abiotic resources8.42 €0.89 €9.65 €0.28 €−75.05 €−4.50 €−60.32 €
Global warming 17.79 €1.04 €11.36 €−175.56 €−15.76 €−6.04 €−167.17 €
Ozone depletion 0000000
Human toxicity0.16 €0.01 €0.01 €00−0.03 €0.15 €
Photochemical oxidation0 00 00 0 0
Acidification0 00 00 0 0
Eutrophication3.29 €0.01 €0.07 €−0.04 €−0.04 €−0.09 €3.20 €
Net balance29.65 €1.94 €21.10 €−175.32 €−90.85 €−10.66 €−224.14
Ecotax02
Abiotic resources42.08 €4.44 €48.27 €1.38 €−375.24 €−22.50 €−301.59 €
Global warming 15.56 €0.91 €9.94 €−153.61 €−13.79 €−5.28 €−146.28 €
Ozone depletion 0 00 000 0
Human toxicity18.06 €0.89 €1.32 €0.25 €−0.30 €−3.67 €16.56 €
Photochemical oxidation3.34 €0.12 €0.76 €−0.03 €−5.60 €−0.71 €−2.14 €
Acidification2.91 €0.07 €0.60 €−0.07 €−1.24 €−0.40 €1.86 €
Eutrophication9.09 €0.02 €0.20 €−0.11 €−0.10 €−0.24 €8.86 €
Net balance91.04 €6.44 €61.09 €−152.19 €−396.28 €−32.82 €−422.72 €
Table A3. Environmental valuation per 1 ton of biochar produced from pig manure.
Impact CategoryPig Manure PretreatmentTransportPyrolysis PlantBiochar ApplicationNatural Gas AvoidedTotal
Ecovalue08
Abiotic resources2.31 €0.08 €2.23 €0.02 €−3.66 €0.99 €
Global warming 70.35 €2.34 €65.24 €−226.44 €−18.80 €−107.31 €
Ozone depletion 000000
Human toxicity66.25 €5.73 €25.06 €1.45 €−1.01 €97.49 €
Photochemical oxidation0.18 €0.01 €0.12 €0−0.19 €0.11 €
Acidification1.91 €0.10 €1.30 €−0.13 €−0.86 €2.32 €
Eutrophication4.30 €0.14 €2.07 €−0.86 €−0.33 €5.32 €
Net balance145.31 €8.40 €96.03 €−225.97 €−24.86 €−1.08
Stepwise2006
Abiotic resources19.70 €0.70 €19.01 €0.15 €−31.14 €8.42 €
Global warming 24.47 €0.81 €22.69 €−78.76 €−6.54 €−37.33 €
Ozone depletion 0.01 €00000.01 €
Human toxicity0.07 €0.01 €0.03 €000.11 €
Photochemical oxidation0 00 00 0
Acidification0 00 00 0
Eutrophication0.20 €0.01 €0.10 €-0.04 €-0.02 €0.25 €
Net balance44.45 €1.52 €41.84 €−78.65 €−37.70 €−28.53
Ecotax02
Abiotic resources98.50 €3.48 €95.07 €0.77 €−155.71 €42.11 €
Global warming 21.41 €0.71 €19.86 €−68.92 €−5.72 €−32.66 €
Ozone depletion 0.01 €00.01 €000.02 €
Human toxicity8.05 €0.70 €3.04 €0.18 €−0.12 €11.84 €
Photochemical oxidation2.13 €0.09 €1.46 €−0.05 €−2.32 €1.30 €
Acidification1.15 €0.06 €0.78 €−0.08 €−0.52 €1.39 €
Eutrophication0.56 €0.02 €0.27 €−0.11 €−0.04 €0.70 €
Net balance131.81 €5.06 €120.48 €−68.21 €−164.44 €24.69

References

  1. Gaunt, J.L.; Lehmann, J. Energy balance and emissions associated with biochar sequestration and pyrolysis bioenergy production. Environ. Sci. Technol. 2008, 42, 4152–4158. [Google Scholar] [CrossRef] [PubMed]
  2. Lehmann, J.; Joseph, S. Biochar for Environmental Management: An Introduction, 1st ed.; Lehmann, J., Joseph, S., Eds.; Routledge: Abington, UK, 2009; ISBN 9781844076581. [Google Scholar]
  3. Verheijen, F.; Jeffery, S.; Bastos, A.C.; Van Der Velde, M.; Diafas, I. Biochar Application to Soils: A Critical Review of Effects on Soil Properties, Processes and Functions; European Commission: Brussel, Belgium, 2010; ISBN 9789279142932. [Google Scholar]
  4. Kauffman, N.; Dumortier, J.; Hayes, D.J.; Brown, R.C.; Laird, D.A. Producing energy while sequestering carbon? The relationship between biochar and agricultural productivity. Biomass Bioenergy 2014, 63, 167–176. [Google Scholar] [CrossRef] [Green Version]
  5. Houben, D.; Evrard, L.; Sonnet, P. Beneficial effects of biochar application to contaminated soils on the bioavailability of Cd, Pb and Zn and the biomass production of rapeseed (Brassica napus L.). Biomass Bioenergy 2013, 57, 196–204. [Google Scholar] [CrossRef]
  6. Hilioti, Z.; Michailof, C.M.; Valasiadis, D.; Iliopoulou, E.F.; Koidou, V.; Lappas, A.A. Characterization of castor plant-derived biochars and their effects as soil amendments on seedlings. Biomass Bioenergy 2017, 105, 96–106. [Google Scholar] [CrossRef]
  7. Mohammadi, A.; Cowie, A.L.; Kristiansen, P.; Cacho, O.; Lan, T.; Mai, A. Biochar can improve the sustainable use of rice residues in rice production systems. In Proceedings of the EGU General Assembly Conference, Vienna, Austria, 8–13 April 2018; Volume 20, p. 2652. [Google Scholar]
  8. Lehmann, J.; Joseph, S. (Eds.) Biochar for Environmental Management: Science, Technology and Implementation, 2nd ed.; Routledge: Abington, UK, 2015. [Google Scholar]
  9. Sahoo, K.; Bilek, E.; Bergman, R.; Mani, S. Techno-economic analysis of producing solid biofuels and biochar from forest residues using portable systems. Appl. Energy 2019, 235, 578–590. [Google Scholar] [CrossRef]
  10. Jaroenkhasemmeesuk, C.; Tippayawong, N. Technical and Economic Analysis of A Biomass Pyrolysis Plant. Energy Procedia 2015, 79, 950–955. [Google Scholar] [CrossRef] [Green Version]
  11. Brown, T.R.; Wright, M.M.; Brown, R.C. Estimating profitability of two biochar production scenarios: slow pyrolysis vs fast pyrolysis. Biofuels Bioprod. Biorefining 2011, 5, 54–68. [Google Scholar] [CrossRef]
  12. Kuppens, T.; Van Dael, M.; Vanreppelen, K.; Thewys, T.; Yperman, J.; Carleer, R.; Schreurs, S.; Van Passel, S. Techno-economic assessment of fast pyrolysis for the valorization of short rotation coppice cultivated for phytoextraction. J. Clean. Prod. 2015, 88, 336–344. [Google Scholar] [CrossRef] [Green Version]
  13. Homagain, K.; Shahi, C.; Luckai, N.; Sharma, M. Life cycle cost and economic assessment of biochar-based bioenergy production and biochar land application in Northwestern Ontario, Canada. Ecosystems 2016, 3, 1–10. [Google Scholar] [CrossRef]
  14. Huang, Y.; Anderson, M.; McIlveen-Wright, D.; Lyons, G.A.; McRoberts, W.C.; Wang, Y.D.; Roskilly, A.P.; Hewitt, N.J. Biochar and renewable energy generation from poultry litter waste: A technical and economic analysis based on computational simulations. Appl. Energy 2015, 160, 656–663. [Google Scholar] [CrossRef]
  15. Patel, M.; Zhang, X.; Kumar, A. Techno-economic and life cycle assessment on lignocellulosic biomass thermochemical conversion technologies: A review. Renew. Sustain. Energy Rev. 2016, 53, 1486–1499. [Google Scholar] [CrossRef]
  16. Roberts, K.G.; Gloy, B.A.; Joseph, S.; Scott, N.R.; Lehmann, J. Life Cycle Assessment of Biochar Systems: Estimating the Energetic, Economic, and Climate Change Potential. Environ. Sci. Technol. 2010, 44, 827–833. [Google Scholar] [CrossRef] [PubMed]
  17. Hammond, J.; Shackley, S.; Sohi, S.; Brownsort, P. Prospective life cycle carbon abatement for pyrolysis biochar systems in the UK. Energy Policy 2011, 39, 2646–2655. [Google Scholar] [CrossRef]
  18. Ibarrola, R.; Shackley, S.; Hammond, J. Pyrolysis biochar systems for recovering biodegradable materials: A life cycle carbon assessment. Waste Manag. 2012, 32, 859–868. [Google Scholar] [CrossRef] [PubMed]
  19. Harsono, S.S.; Grundman, P.; Lau, L.H.; Hansen, A.; Salleh, M.A.M.; Meyer-Aurich, A.; Idris, A.; Ghazi, T.I.M. Energy balances, greenhouse gas emissions and economics of biochar production from palm oil empty fruit bunches. Resour. Conserv. Recycl. 2013, 77, 108–115. [Google Scholar] [CrossRef]
  20. Homagain, K.; Shahi, C.; Luckai, N.; Sharma, M. Life cycle environmental impact assessment of biochar-based bioenergy production and utilization in Northwestern Ontario, Canada. J. For. Res. 2015, 26, 799–809. [Google Scholar] [CrossRef]
  21. Muñoz, E.; Curaqueo, G.; Cea, M.; Vera, L.; Navia, R. Environmental hotspots in the life cycle of a biochar-soil system. J. Clean. Prod. 2017, 158, 1–7. [Google Scholar] [CrossRef]
  22. Brassard, P.; Godbout, S.; Pelletier, F.; Raghavan, V.; Palacios, J.H. Pyrolysis of switchgrass in an auger reactor for biochar production: A greenhouse gas and energy impacts assessment. Biomass Bioenergy 2018, 116, 99–105. [Google Scholar] [CrossRef]
  23. Frazier, R.S.; Jin, E.; Kumar, A. Life cycle assessment of biochar versus metal catalysts used in syngas cleaning. Energies 2015, 8, 621–644. [Google Scholar] [CrossRef]
  24. Huppes, G.; Van Oers, L. Background Review of Existing Weighting Approaches in Life Cycle Impact Assessment (LCIA); European Union: Luxembourg, 2011. [Google Scholar]
  25. Weidema, B.; Brandão, M.; Pizzol, M. The Use of Monetary Valuation of Environmental Impacts in Life Cycle Assessment: State of the Art, Strengths and Weaknesses; 2.-0 LCA Consultant: Aalborg, Denmark, 2013; Volume 33. [Google Scholar]
  26. Itsubo, N.; Sakagami, M.; Kuriyama, K.; Inaba, A. Statistical analysis for the development of national average weighting factors-visualization of the variability between each individual’s environmental thought. Int. J. Life Cycle Assess. 2012, 17, 488–498. [Google Scholar] [CrossRef]
  27. Wu, X.; Zhang, Z.; Chen, Y. Study of the environmental impacts based on the “green tax”—Applied to several types of building materials. Build. Environ. 2005, 40, 227–237. [Google Scholar] [CrossRef]
  28. van Harmelen, T.; van Korenromp, R.; Deutekom, C.; Ligthart, T.N.; van Leeuwen, S.; van Gijlswijk, R. The Price of Toxicity. Methodology for the Assessment of Shadow Prices for Human Toxicity, Ecotoxicity and Abiotic Depletion; Springer: Dordrecht, The Netherlands, 2006. [Google Scholar]
  29. Johnsen, F.M.; Løkke, S. Review of criteria for evaluating LCA weighting methods. Int. J. Life Cycle Assess. 2013, 18, 840–849. [Google Scholar] [CrossRef]
  30. Finnveden, G. A Critical Review of Operational Valuation/Weighting Methods for Life Cycle Assessment; Swedish Environmental Protection Agency: Stockholm, Swedish, 1999. [Google Scholar]
  31. International Organization for Standardization. Environmental Management-Life Cycle Assessment-Principles and Framework; ISO: Geneva, Switzerland, 1947. [Google Scholar]
  32. Kuppens, T.; Maggen, J.; Carleer, R.; Yperman, J.; Van Dael, M.; Van Passel, S. Valorisatie van Varkensmest Door Pyrolyse—Cleantech Business Case in Limburg; University of Hasselt: Hasselt, Belgium, 2014. [Google Scholar]
  33. Kuppens, T.; Rafiaani, P.; Vanreppelen, K.; Yperman, J.; Carleer, R.; Schreurs, S.; Thewys, T.; Van Passel, S. Combining Monte Carlo simulations and experimental design for incorporating risk and uncertainty in investment decisions for cleantech: a fast pyrolysis case study. Clean Technol. Environ. Policy 2018, 20, 1195–1206. [Google Scholar] [CrossRef]
  34. IPCC. Guidelines for National Greenhouse Gas Inventories; IPCC: Geneva, Switzerland, 2006. [Google Scholar]
  35. European Union. PE-CONS 42/15 DGE 1 EB/vm; European Union: Brussels, Belgium, 2015; Volume 2015. [Google Scholar]
  36. Lee, U.; Balu, E.; Chung, J.N. An experimental evaluation of an integrated biomass gasification and power generation system for distributed power applications. Appl. Energy 2013, 101, 699–708. [Google Scholar] [CrossRef]
  37. Curaqueo, G.; Meier, S.; Khan, N.; Cea, M.C.; Navia, R. Use of biochar on two volcanic soils: effects on soil properties and barley yield. J. Soil Sci. Plant Nutr. 2014, 14, 911–924. [Google Scholar] [CrossRef] [Green Version]
  38. Kimetu, J.M.; Lehmann, J.; Ngoze, S.O.; Mugendi, D.N.; Kinyangi, J.M.; Riha, S.; Verchot, L.; Recha, J.W.; Pell, A.N. Reversibility of Soil Productivity Decline with Organic Matter of Differing Quality Along a Degradation Gradient. Ecosystems 2008, 11, 726–739. [Google Scholar] [CrossRef]
  39. Zhang, Q.; Dijkstra, F.A.; Liu, X.; Wang, Y.; Huang, J.; Lu, N. Effects of biochar on soil microbial biomass after four years of consecutive application in the north China plain. PLoS ONE 2014, 9, e102062. [Google Scholar] [CrossRef]
  40. Li, B.; Fan, C.H.; Zhang, H.; Chen, Z.Z.; Sun, L.Y.; Xiong, Z.Q. Combined effects of nitrogen fertilization and biochar on the net global warming potential, greenhouse gas intensity and net ecosystem economic budget in intensive vegetable agriculture in southeastern China. Atmos. Environ. 2015, 100, 10–19. [Google Scholar] [CrossRef]
  41. SAC. Scottish Agricultural College Farm Management Handbook; SAC: Penicuik, Scotland, 2016. [Google Scholar]
  42. Jolliet, O.; Margni, M.; Charles, R.; Humbert, S.; Payet, J.; Rebitzer, G.; Rosenbaum, R. IMPACT 2002+: A new life cycle impact assessment methodology. Int. J. Life Cycle Assess. 2003, 8, 324–330. [Google Scholar] [CrossRef] [Green Version]
  43. Hong, J.; Li, X.; Zhaojie, C. Life cycle assessment of four municipal solid waste management scenarios in China. Waste Manag. 2010, 30, 2362–2369. [Google Scholar] [CrossRef]
  44. Buratti, C.; Barbanera, M.; Testarmata, F.; Fantozzi, F. Life Cycle Assessment of organic waste management strategies: an Italian case study. J. Clean. Prod. 2014, 1–12. [Google Scholar] [CrossRef]
  45. Marques, R.C.; da Cruz, N.F.; Ferreira, S.F.; Simões, P.; Pereira, M.C. EIMPack—Economic Impact of the Packaging and Packaging Waste Directive-Environmental Valuation (Literature Review); Instituto Superior Técnico: Lisbon, Portugal, 2013. [Google Scholar]
  46. Thi, T.L.N.; Laratte, B.; Guillaume, B.; Hua, A. Quantifying environmental externalities with a view to internalizing them in the price of products, using different monetization models. Resour. Conserv. Recycl. 2016, 109, 13–23. [Google Scholar]
  47. Finnveden, G.; Eldh, P.; Johansson, J. Weighting in LCA based on ecotaxes: Development of a mid-point method and experiences from case studies. Int. J. Life Cycle Assess. 2006, 11, 81–88. [Google Scholar]
  48. Ahlorth, S.; Finnveden, G. Ecovalue08—A new valuation set for environmental systems analysis tools. J. Clean. Prod. 2011, 19, 1994–2003. [Google Scholar] [CrossRef]
  49. Weidema, B.P. Using the budget constraint to monetarise impact assessment results. Ecol. Econ. 2009, 68, 1591–1598. [Google Scholar] [CrossRef]
  50. Eurostat 2016 Inflation Rate. Annual Average Rate of Change 2016. Available online: https://ec.europa.eu/eurostat/tgm/table.do?tab=table&init=1&language=en&pcode=tec00118&plugin=1 (accessed on 5 June 2019).
  51. Pizzol, M.; Weidema, B.; Brandão, M.; Osset, P. Monetary valuation in Life Cycle Assessment: A review. J. Clean. Prod. 2015, 86, 170–179. [Google Scholar] [CrossRef]
  52. ISO. 14044 Environmental Management-Life Cycle Assessment-Requirements and Guidelines; ISO: Geneva, Switzerland, 2006. [Google Scholar]
  53. Igos, E.; Benetto, E.; Meyer, R.; Baustert, P.; Othoniel, B. How to treat uncertainties in life cycle assessment studies? Int. J. Life Cycle Assess. 2018, 24, 794–807. [Google Scholar] [CrossRef]
  54. Batouli, M.; Bienvenu, M.; Mostafavi, A. Putting sustainability theory into roadway design practice: Implementation of LCA and LCCA analysis for pavement type selection in real world decision making. Transp. Res. Part D Transp. Environ. 2017, 52, 289–302. [Google Scholar] [CrossRef]
  55. Guo, M.; Murphy, R.J. LCA data quality: Sensitivity and uncertainty analysis. Sci. Total Environ. 2012, 435–436, 230–243. [Google Scholar] [CrossRef]
Figure 1. System boundaries for life cycle assessment (LCA) of biochar (and bioenergy) production.
Energies 12 02166 g001
Figure 2. Normalized impact categories in each case.
Energies 12 02166 g002
Figure 3. Process contribution to the damage categories.
Energies 12 02166 g003
Figure 4. Environmental benefits and costs of two biochar production systems.
Energies 12 02166 g004
Figure 5. Sensitivity analysis of byproducts and NPK savings for each impact category-based environmental value for willow (W1W5) and pig manure (P1P5) biochar. (Note: vertical lines in the middle of the graph show the average environmental value of impact categories. Deviations from the average value show the changes in average environmental values by a 10% decrease or 10% increase in the average byproduct and NPK saving quantities).
Energies 12 02166 g005aEnergies 12 02166 g005bEnergies 12 02166 g005c
Table 1. Inventory data for 1 ton of biochar obtained via willow pyrolysis.
Inputs Outputs
Energy and transport Products
Willow woodchips3.73 tonBiochar1 ton
Transport feedstock to pyrolysis plant149.2 tkmAvoided products
Heat (pyrolysis)1.92 GJNatural gas0.37 ton
Transport biochar to filed40 tkmElectricity 1.01 GJ
N fertilizer0.66 kg
K fertilizer0.13 kg
P fertilizer0.1 kg
Emissions
Syngas combustion in CHP
SO20.015 kg
NOx0.2 kg
Biochar application in soil
CO2 avoided−2.2 ton
N2O avoided−2.6 kg
Table 2. The inventory data for 1 ton of biochar obtained via pig manure pyrolysis.
Inputs Outputs
Energy and transport Products
Heat (dried and ground pig manure production)3.28 GJBiochar1 ton
Electricity (dried and ground pig manure production)0.7 MWhAvoided products
Transport feedstock to pyrolysis plant116 tkmNatural gas0.14 ton
Heat (pyrolysis)3.63 GJN fertilizer0.66 kg
Electricity (pyrolysis)0.05 MWhK fertilizer0.13 kg
Transport biochar to field40 tkmP fertilizer0.1 kg
Emissions
Syngas combustion in CHP
SO20.003 kg
NOx0.04 kg
Biochar application in soil
CO2 avoided−0.98 ton
N2O avoided−2.6 kg
Table 3. Shadow prices used in different monetary valuation methods [51].
LCA Application EuryearSTEPWISE2006 EUR2003ECOTAX02 EUR2002ECOVALUE08 EUR2010
Global warming [eur/kgCO2eq]0.080.070.23
Ozone depletion [eur/kgCFC11eq]100139.56-
Acidification [eur/kgSO2eq]0.000152.093.49
Eutrophication [eur/kgPO4eq]1.23.3225.35
Photochemical oxidation [eur/kgC2H4eq]0.0005655.824.65
Abiotic resources [eur/MJ]0.0040.020.00047
Human toxicity [eur/kg1.4DBeq]0.001540.171.4
Table 4. IMPACT2002+ mid-point results (per ton of biochar).
Impact CategoryUnitsCase 1 (Willow)Case 2 (Pig Manure)
Carcinogenskg C2H3Cl eq4.4010.09
Non-carcinogenskg C2H3Cl eq113.08
Respiratory inorganicskg PM2.5 eq0.310.17
Ionizing radiationBq C-14 eq−950022,392
Ozone layer depletionkg CFC-11 eq2.14 × 10−51.12 × 10⁻⁴
Respiratory organicskg C2H4 eq0.010.06
Aquatic ecotoxicitykg TEG water31,00023,400
Terrestrial ecotoxicitykg TEG soil48,2006654
Terrestrial acid/nutrikg SO2 eq6.692.68
Land occupationm2org.arable36938.84
Aquatic acidificationkg SO2 eq0.910.68
Aquatic eutrophicationkg PO4 P-lim0.58−0.005
Global warmingkg CO2 eq−2063−472
Non-renewable energyMJ primary−16,8306100
Mineral extractionMJ surplus15.374.29
Table 5. IMPACT 2002+ endpoint results (per ton of biochar).
Damage CategoryUnitCase 1Case 2
Human healthDALY−8.68 × 10−81.65 × 10−7
Ecosystem qualityPDF·m2·yr2.630.06
Climate changekg CO2 eq−2.22−0.47
ResourcesMJ primary−23.596.11
Total pointsµPt−199.3820.65
Table 6. CML characterization results (per ton of biochar).
Impact CategoryUnitCase 1 (Willow)Case 2 (Pig Manure)
Global warming (GWP100a)kg CO2 eq−2089.65−466.56
Ozone layer depletion kg CFC-11 eq2.37 × 10−51 × 10−4
Human toxicitykg 1,4-DB eq97.4269.63
Abiotic depletion (fossil fuels)MJ−15,085.112106.38
Eutrophicationkg PO4 eq2.660.20
Photochemical oxidationkg C2H4 eq−0.030.02
Acidificationkg SO2 eq0.890.66
Table 7. Environmental valuation per 1 ton of biochar produced from willow woodchips and pig manure.
Impact CategoryCase 1Case 2
Ecovalue08Stepwise2006Ecotax02Ecovalue08Stepwise2006Ecotax02
Abiotic resources−7.09 €−60.32 €−301.59 €0.99 €8.42 €42.11 €
Global warming −480.62 €−167.17 €−146.28 €−107.31 €−37.33 €−32.66 €
Ozone depletion 00000.01 €0.02 €
Human toxicity136.36 €0.15 €16.56 €97.49 €0.11 €11.84 €
Photochemical oxidation−0.18 €0−2.14 €0.11 €01.30 €
Acidification3.11 €01.86 €2.32 €01.39 €
Eutrophication67.65 €3.20 €8.86 €5.32 €0.25 €0.70 €
Net balance−280.77−224.14−422.72 €−1.08−28.53 €24.69

