1. Introduction
The contemporary model of urban development led to the urban sprawl and all its adverse effects such as increased car-dependency for the sake of mobility, longer daily trips from home to work, and the depletion of agriculture areas, as well as the degradation of the landscape, the deterioration of air quality, and higher energy consumption [
1]. Since the mid-1950s, urbanized land in Europe has expanded by 78%, whereas the population has grown by just 33%, and this ratio continues to decrease [
1,
2,
3]. Estimated world primary energy demand will rise by almost 60% between 2002 and 2030 [
4]. Therefore, creating cities that are low-carbon, resilient, and livable is crucial. Sustainable and low-carbon energy technologies will play an essential role in the energy revolution required to prevent further climate degradation and global warming phenomena [
4,
5,
6]. Solar power is an integral part of the sustainability of cities and its implementation and execution, through urban planning practices, may play a significant role in improving the energy efficiency of cities [
1]. Growing deployment of PVs (photovoltaic panels) can result in social and environmental benefits [
7]. Moreover, photovoltaic energy is considered one of the most promising emerging technologies, thanks to its noiselessness, non-toxic emission and relatively simple operation and maintenance [
4,
5].
The widespread use of renewable energy sources in an urban space, such as PV, requires not only access to highly efficient solar panels, but also financial incentives from municipal authorities as well as, first and foremost, the social engagement of residents. In many agglomerations, the process of molding an information society and the cooperation of smart city residents within the local communities are of crucial importance to the reduction of the environmental impact of the urbanization process, the improvement of the quality of life in the setting itself and the implementation of any sustainable development scenario [
8].
This research was motivated by the desire to develop a gamification model, particularly of the so-called non-pecuniary type that uses a mechanism that increases social trust and, consequently, the use of renewable energy. The goal of the paper was to evaluate to what extent gamification could support the diffusion of urban renewable energy systems, especially photovoltaics installation. We proposed a model employing trust-based gamification, in which the municipal authorities propose developments that create a steady increase in social trust, e.g., the construction of playgrounds, parks, transport facilities, and so on, all while encouraging the citizens to install PV.
To meet the goal, a multi-parameter model was developed to stimulate diffusion in the number of PVs using the process of gamification and the methods of social interaction in the so-called smart city. There are several ways of implementing the modelling of this process. This article uses multi-agent system, digital topographic data, and spatially localized demographic information in modelling the process of installing PVs in a city. Thanks to the developed projection variants, the city authorities will be able to take an active role as a stimulator of sustainable development and in the promotion of renewable energy.
The article consists of five chapters. After a short introduction (
Section 1), we describe related works, where we describe the state of knowledge regarding the analyzed issue, and we motivate the choice of the methods used (
Section 2). Next, we describe the developed work methodology (
Section 3). The methodology was divided into the main scenario (
Section 3.1), description of the economic model (
Section 3.3), the description of the calibration method (
Section 3.4), and a description of how the simulations were carried out (
Section 3.5). Next, we describe the results obtained (
Section 4), where detailed descriptions of results for the city of Warsaw (
Section 4.1) and the district of Wawer (
Section 4.2) were posted. The work ends with discussion and conclusions (
Section 5).
2. Related Works
Concerning the use of different energy carriers, tapping into the distributed renewable energy network is an attractive way to maximize urban energy and development sustainability. Solar energy is well-suited to the built environment; in particular, PV is a highly promising urban energy alternative that requires hardly any new infrastructure and offers synergy with building components. The fast-growing PV market and resulting reduction in cost could significantly impact energy, also by reducing CO
2 emissions [
9,
10]. From similar historical observations of earlier energy technologies, Lund investigated the prospects of new energy technologies. A hypothetical fast-track case for PVs, assuming an expansion like that of nuclear energy and oil, would result in it having a 20–25% share of all electricity by 2050 [
10].
Investigating the literature regarding motivation for PV installations, one can find works dissolving only economic or technical factors. However, there are also analyses regarding social factors, as well as trust in society. Walker et al. [
8] analyzes how interpersonal and social trust is related to the different meanings given to the society in programs and schemes regarding renewable energy, and in the characteristics and consequences that are intended or assumed by taking a community approach.
Nissing and von Blottnitz provided a definition of the concept of sustainable energization, developed by systematically repeating three key elements: The target group, the concept of energy services, and sustainable development [
11]. High energy efficiency can be ensured if the urban planning process integrates solar energy in both new and existing urban environments [
12]. Amado and Poggi explored the concept of solar urban planning with the goal of developing an operative methodology to achieve the best conditions for zero-energy building [
12]. Rylatt et al. described the development of a solar energy planning system, based on the methodology for predicting the solar energy potential of the domestic housing stock with the use of geographical information systems (GIS) [
13]. Kammen and Sunter explored options for establishing sustainable energy systems by reducing energy consumption, particularly in the sectors of buildings and transportation [
6]. Thorsten et al. discussed innovative integrated building services engineering systems for energy, water, and organic waste, which could contribute to increased energy efficiency, resource productivity, and urban resilience [
14]. Baziliana et al. considered reductions in the underlying costs and market prices of PV systems and their implications for decision-makers [
15]. Borri et al. explored the problems, as well as the potential, in the layout and implementation of a multi-agent system supporting an environmental planning process, within the strategic planning perspective [
16]. Murakami described saturation phase of building-integrated PVs and coupled multi–agent simulations with electric power flow analysis. The presented agent-based model included two kinds of agents—customer and government agents [
17]. Massey et al. described an online map-based gaming platform, which simulates spatial scenarios as MAS (multi-agent system) using human participants as the decision agents [
18].
In Poland, the Renewable Energy Sources Act of 20 February 2015 [Ustawa o odnawialnych źródłach energii] has been crucial for the development of renewable energy source (RES) installations and is regarded as conducive to the sustainable use of energy resources meeting the criteria of sustainable development. This act transposes Directive 2009/28/EC into Polish law [
19].
The Polish PV market comprises three models of selling electricity to the network along with their corresponding business options: An auction system, a prosumer system, and the so-called “business auto-producer” system (a business prosumer). The auction (large RES investments) and prosumer systems (an energy consumer is also its producer) are official state instruments of support that aim to help satisfy the international commitment for Poland; that is, obtaining a 15% share of energy from renewable energy sources by 2020. On the other hand, market-based principles underlie the “business auto-producer” system (without selling surplus energy) [
20]. By the end of May 2018, the total installed capacity in PV was about 300 MW, meaning PVs had a 3.4% share of Polish renewable energy sources. It is estimated, however, that regarding installed capacity, by the end of 2020, solar energy may become one of the leading renewable energy technologies [
21].
According to data from the Innogy Polska S.A. press office, which operates the distribution network in Warsaw and the surrounding area, in 2017, the capital city gained 414 PV microgeneration installations (most of them in the final quarter of 2017) with a total capacity of 2317 MW. The number of all installations in Warsaw from September 2008 to 2010 totaled 908 (5.697 MW). According to the analysis of clients who use PV solutions, about 80% of installations are in single-family houses, 15% of clients are various types of enterprises, and 5% are condominiums.
In 2017, the number of subsidies granted to Warsaw residents by the Warsaw City Hall for home-made, renewable energy installations almost doubled, and in the city, the number of applications for projects in renewable energy sources (primarily solar farms but also heat pumps and solar collectors) increases every year [
22]. We believe that strengthening this process requires proposing a new approach. The approach proposed in this article establishes an important innovation in a smart city, both in terms of increasing the use of renewable energy and levels of social innovation.
Many papers [
23,
24,
25,
26,
27] support the idea that solar energy requires long-term policy support. Subsidized feed-in tariffs in PVs increased global demand and allowed for economies of scale - they lowered international PV module costs by 22% with every doubling of capacity. Moreover, due to rapid growth and strong market competition, the prospect for continued cost reductions are still promising [
23].
Around the world, various policy instruments and support schemes have been implemented with the aim of stimulating technology diffusion and increasing the deployment of residential and distributed PVs. Solar energy promotion in different countries includes a range of instruments. Chapman et al. [
28] review the Australian residential PV policies between 2001 and 2012, in particular the impact of net and gross feed-in-tariffs (FiTs) on electricity prices within the country. From their analysis, they conclude that FiTs have a significant impact on installation rates, being responsible for both a rise in 2008 and a decline post-2008 when they were removed. Similarly, in an empirical analysis focused on PV adoption in California, Schmidt-costa et al. [
29] and Drury et al. [
30] delve in detail into one of the most successful public policies aimed at PV technology diffusion in the US: The California Solar initiative program. They discuss the impact on PV adoption trends and the policy implications of third-party PV business models in the Los Angeles and Orange counties. Muhammad-Sukki et al. [
31] reviewed the financial impact of FiT schemes in Japan and provide a similar financial analysis for Germany, Italy, and the United Kingdom. An alternate policy framework that has been widely implemented around the world in order to promote the deployment of solar PV systems is incentivized self-consumption. In a recent study, Pacudan [
32] evaluated the possible options and assessed the impact of the possible implementation of a feed-in tariff and a net metering and billing scheme, including an upfront payment subsided for net metering and a premium payment for exported electricity in Brunei Darussalam. Tilman and Engelmeier highlighted how long-term rents for future energy technologies could be assured even in a developing country suffering severe energy deficits. India’s Nawaharlal Nehru National Solar Mission triggers solar investment and manages the necessary subsidies. These are preferential feed-in tariffs, renewable purchase obligations (RPO), the renewable energy certificate (REC), tax holidays, attractive options for the accelerated depreciation of investments, and soft loan schemes [
23,
24]. In Australia, different amenities are employed depending on the state. For example, the Queensland State Government runs a scheme that pays AUD0.44+ per kW for electricity generated from solar PVs and the states of Victoria and South Australia have introduced minimum five-star energy efficiency requirements for new residential buildings [
33]. Based on the examples of China, India, and South Africa, Becker and Fisher compared feed-in and auction-based tariffs and concluded that experiences with feed-in tariffs in Europe were not transferable to emerging countries [
25]. However, an approach that applies feed-in tariffs has been effective, for example, in Germany and Spain [
33]. The conducted analysis and literature studies indicate that there is a need to create multi-agent systems that take into account social, spatial, and solar data to create predictive models of the increase in the number of solar panels in cities. It should also be examined how different methods of social stimulation (e.g., gamification, direct subsidies, etc.) influence the obtained results.
3. Methodology
The conducted research presupposes that to develop a model defining the number of PVs installed in a smart city, one should use a broad spectrum of factors to explain the decision to invest in renewable energy rather than just a single, independent variable (e.g., panel price or the percentage of city subsidies). In addition to those factors that are strictly economic (such as unit price, roof area, subsidies, daylight, and so on), the conducted research assumed that specific characteristics would influence the willingness to install panels. These features would be spatial location, social trust, the development of local communities, relations concerning ownership, policies of the municipal authorities regarding urban residents and businesses, as well as residents’ inclination for new technological trends and environmental social responsibility, and the inclination for gamification. Using the studies [
3], the authors also chose four social characteristics (age, willingness, trust, wellbeing) that affect the willingness to install solar panels. The values attributed to the social identity parameters of the agents were assigned on the basis of sociological research for specific social groups and city districts.
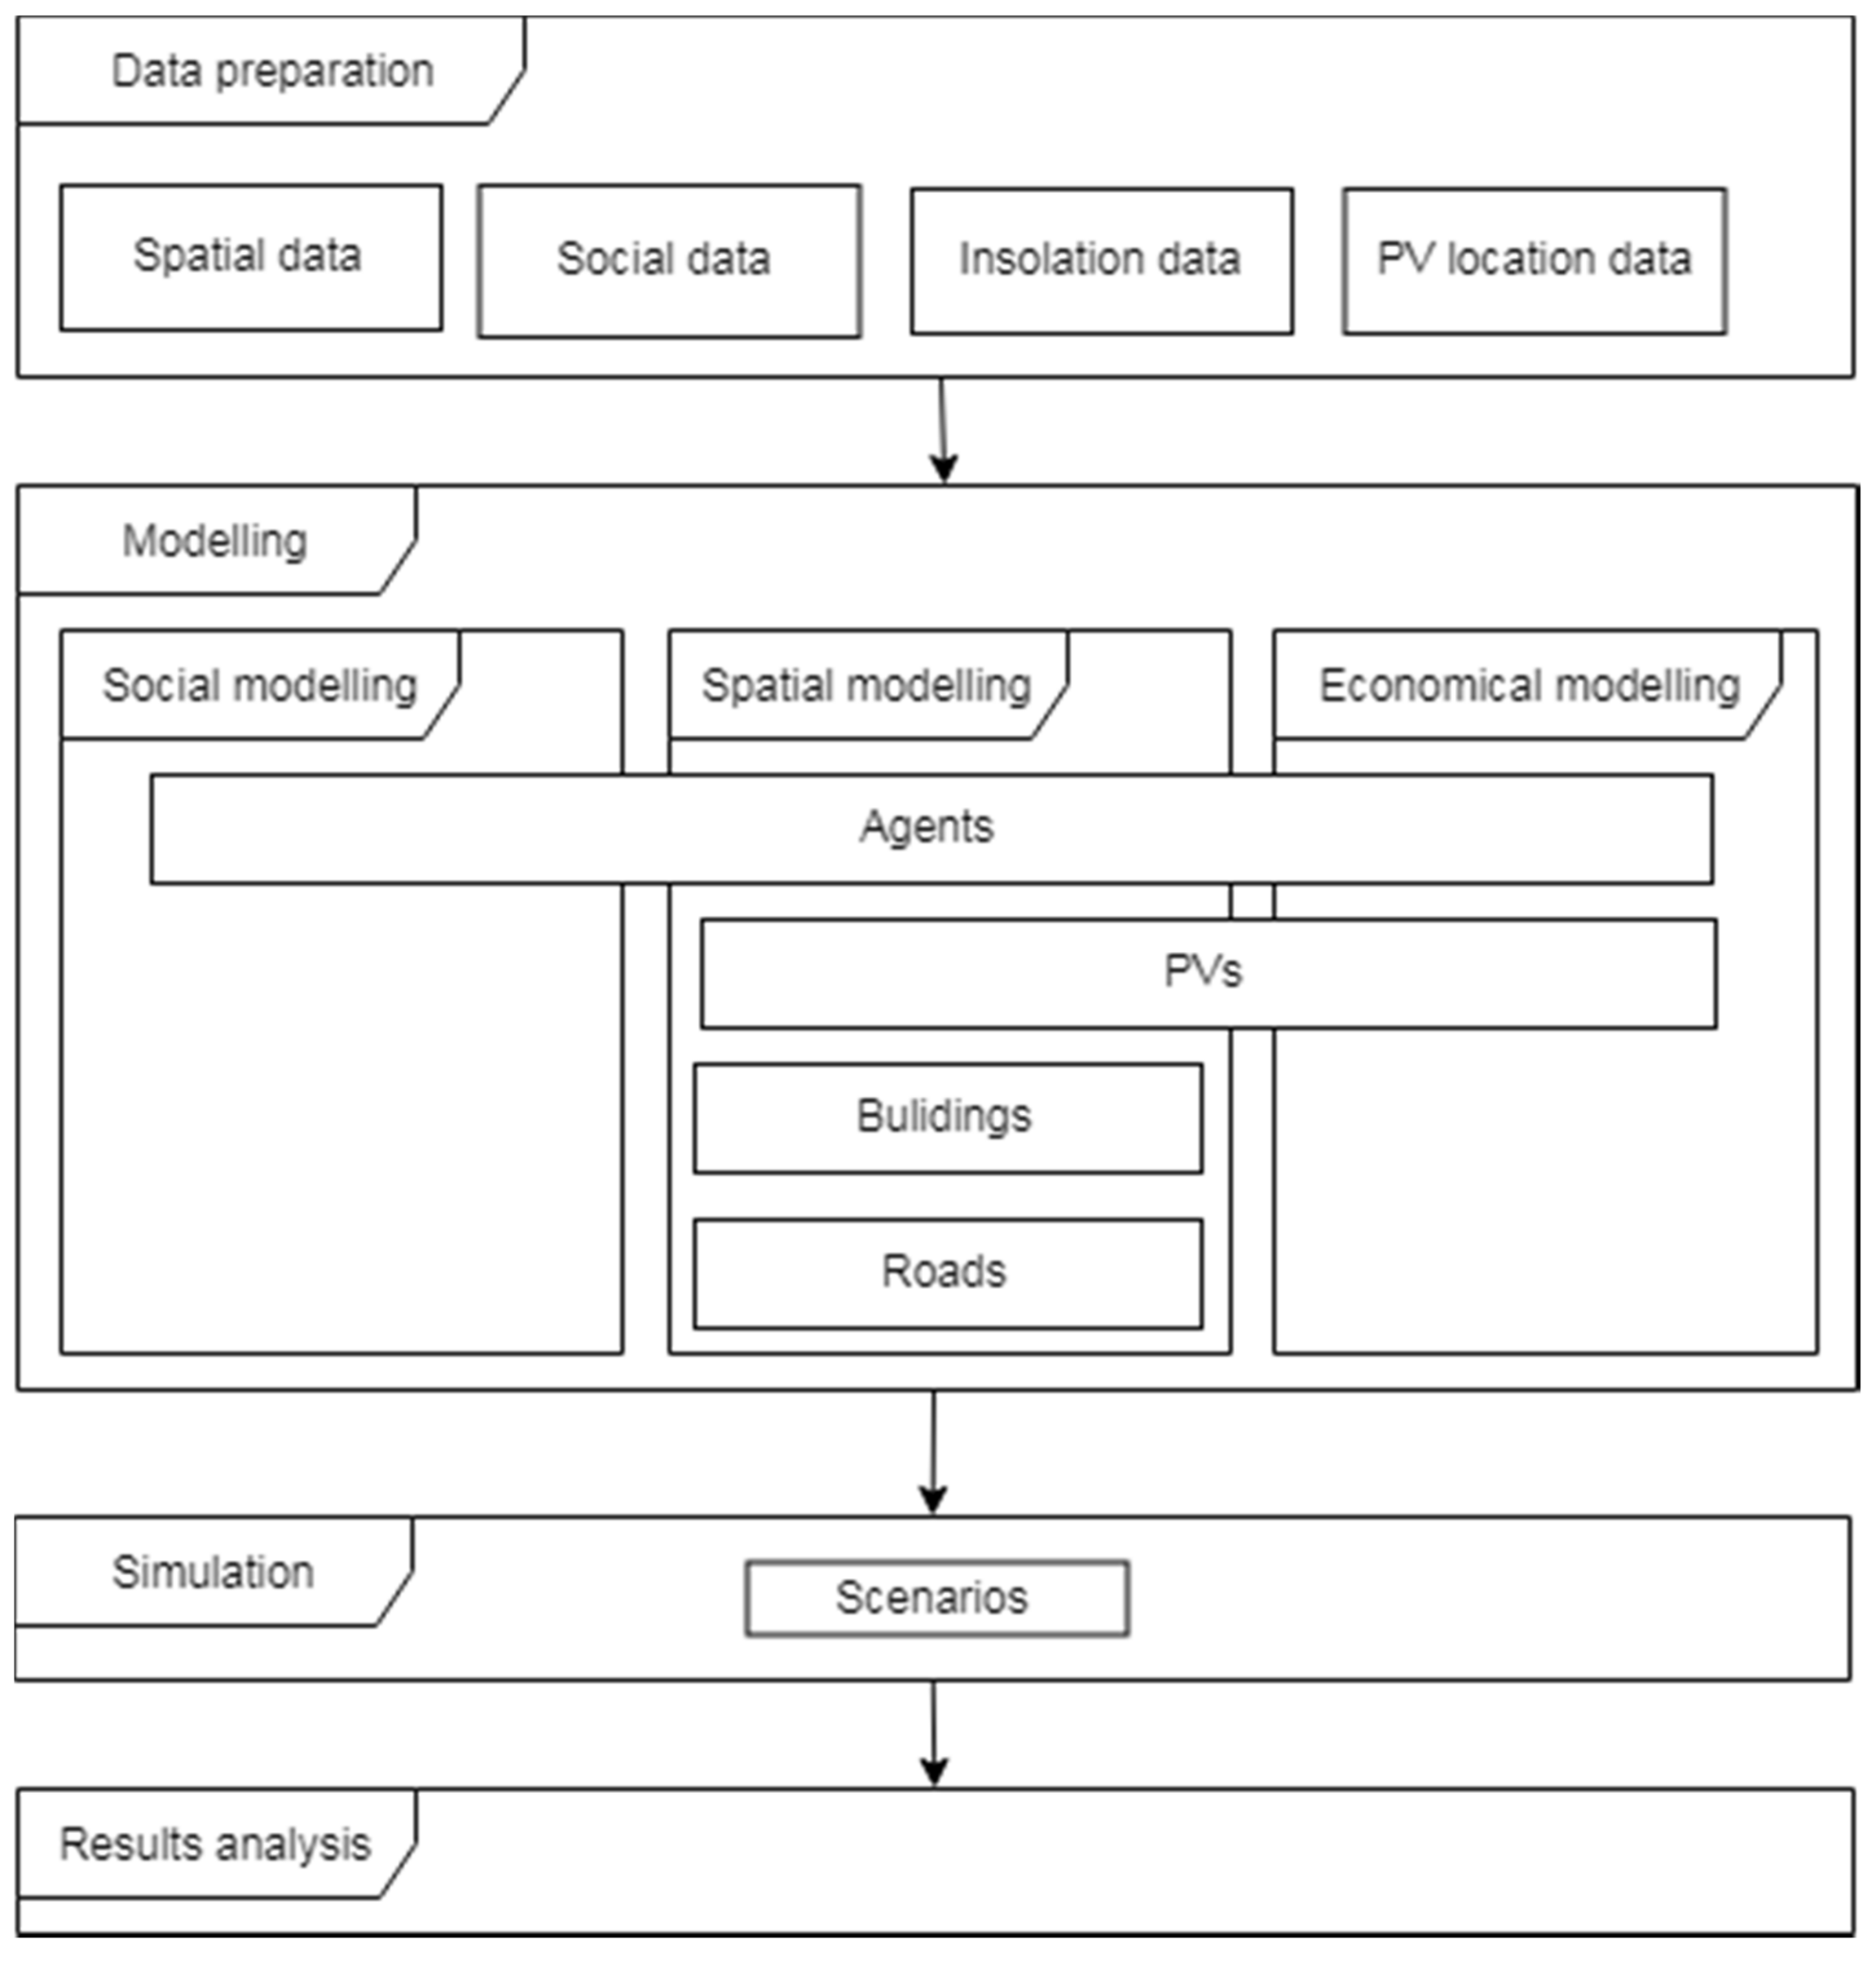
Figure 1 shows the flowchart of our research methodology. First, we prepared the required data, then we created a model, consisting of a social, economic, and spatial part. The developed model was enriched with specific data from the developed scenarios, and the results were analyzed. A more detailed description of the individual steps is described further.
3.1. Scenarios Setting
We considered 14 various scenarios to stimulate the residents of smart cities to the installation of PVs (
Table 1). According to each of the scenarios, the following factors influence the decision to install panels: The location of both residence and work, the manner of moving around the city and the consequent opportunity (or lack of) to view panels on municipal buildings, affluence levels, and the ownership arrangements of property. We assume that individual buildings might belong to the city, companies, or private institutions. Private property may be managed individually (where the owner decides on the possible installation of the panel), in a condominium, or in a housing co-operative. In condominiums, 80% of tenants must consent to install a panel yet in housing co-operatives, the figure is 95%. Adopted values stem from the Polish specificity, yet they have been saved as model parameters and can be easily modified.
3.2. Social Modelling
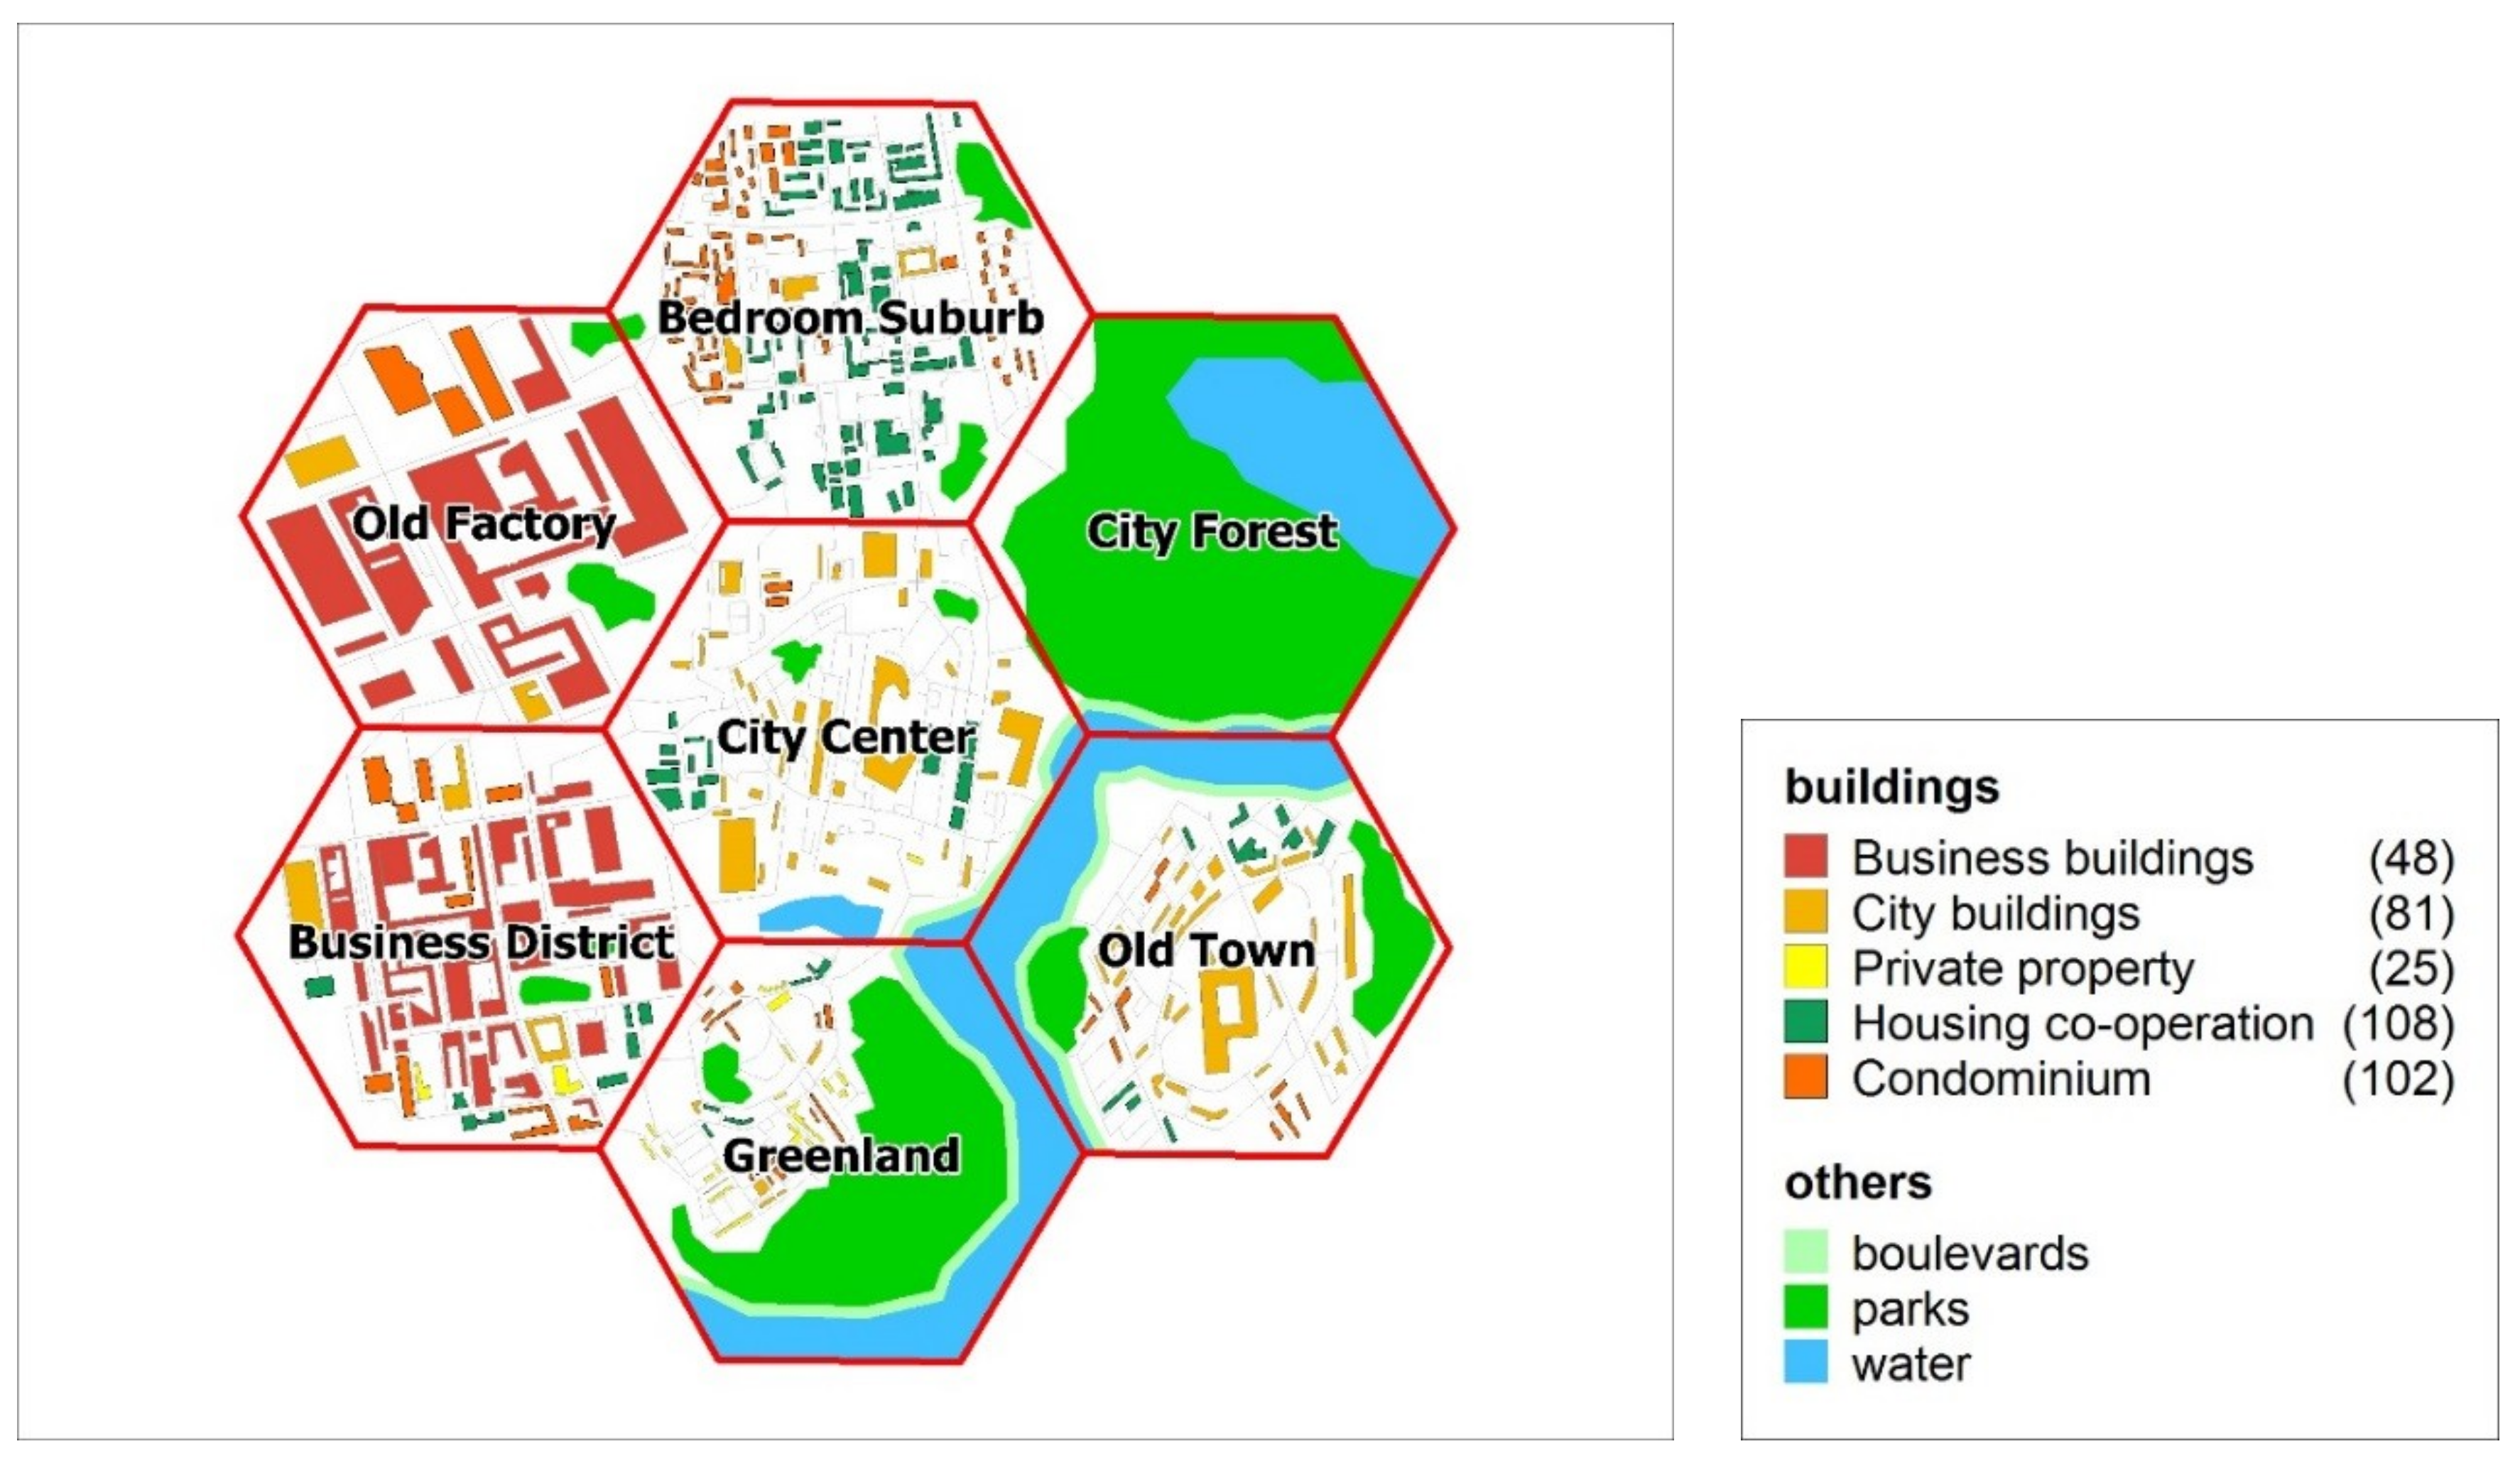
To validate the devised model, we developed a “model city” comprising seven hexagonal districts with a dominating type of function and structure (
Figure 2 and
Table 2). The residents inhabit the city, as illustrated by the so-called dot distribution map (
Figure 3) and each of 1000 dots, representing a group of residents, was implemented into the system as an agent with specific characteristics. The ArcGIS ESRI (13.0, Esri, Redlands, CA, USA) application was used to develop the source spatial database, enabling the preparation of a set of thematic layers (land cover, buildings, communication routes, districts borders, and the distribution of residents) as SHP (shape) files. These layers were then used to build a multi-agent system in the GAMA environment. GAMA is a modelling and simulation-development environment for building spatially explicit agent-based simulations [
35,
36]. It is a multiple-application domain platform that uses a high-level, intuitive agent-based language. With GAMA, users can undertake most of the activities that relate to modelling, visualizing, and exploring the simulations by using dedicated tools.
The “model city” (
Figure 2) includes a system of roads on which agents move, a set of buildings (including stand-alone and multi-occupancy residential buildings, factories, office buildings, health clinics, schools, and museums) and green areas, i.e., boulevards, parks, and water reservoirs. The city is also divided into districts that are distinguished by a set of features, which characterize both the district and the people in it, e.g., the office district includes a significant number of office buildings and the people in it are white-collar workers.
An agent models a city resident and has a set of traits that reflect his or her social identity:
Age, gender, marital status, and number of children.
The willingness to install PV: A number within the range <0,1>, which changes during an agent’s life and depends on both social trust and the number of PV installations that are observed in the environment.
Trust in other residents/ social trust: A number in the range <0,1>, which determines to what extent a citizen trusts other people. It is not considered to be a pejorative trait—it does not mean naivety, rather faith in the capabilities of others.
Wealth: A number in the range <0,1> determining the material status of a resident.
Besides the above features, each agent is assigned to a residential place (i.e., a residential building) and a workplace (an office building or a factory). During the simulation, the agents move around the city according to a normal daily rhythm, i.e., in the morning they go to work and return home in the evening. Thereafter, they may go to a museum or a park, visit governmental agencies, or see a doctor. Observing panels installed on other buildings (e.g., on public facilities, private homes, and so on) on the way to work or whilst walking influences the individual agents’ willingness to install PVs.
A multi-agent system was used to develop the model, and agents represented both city residents and objects, such as buildings, districts, parks, public utilities, and roads. Each agent possesses the average characteristics of residents, such as wealth, level of social trust, social engagement, the number of children, and so on, and for the model city, each of the 1000 agents represents 1000 residents.
In the model, four types of building complex management are considered:
Private property—single-family houses.
Private property—retail and office buildings.
Housing co-operatives.
Condominiums.
Public property that is managed by the city hall.
Various guidelines regarding the willingness to install PV characterize each management model, which—particularly for condominiums and housing co-operatives—are created from the aggregation of the preferences of their members.
The decision about whether to build PV in the private properties where there may be several single-family houses, in which it can be located up to several household agents, is made on the basis of voting. When the parameter indicating the willingness to install the panels reaches the threshold value, then an economic analysis is performed, analyzing both the long-term and initial costs of a PV installation. If the installation costs are acceptable (calculated from the wealth agent parameter and the average income parameter) and if the long-term costs after installation are lower than those without, the randomly selected number of household agents chose to install the PV on their buildings. The average income parameter depends on place of living of the agent: Residents of single-family houses have the average income parameter equal to 10,000 PLN (about 2500 EUR), and the residents of condominium and housing co-operatives have this parameter equal to 1000 PLN (about 250 EUR).
For a condominium and a housing co-operative, the total costs of PV installation and long-term costs of installation are considered. Subsequently, household agents belonging to these groups hold a vote, with an agent voting for the installation if the willingness to install panels is greater than the threshold. For condominiums, voting PV through requires more than 80% of votes being in favor, and for housing co-operatives, a proportion of over 95% is required. What differentiates those three types of complexes is a number of inhabitants.
For privately owned retail centers, office buildings, and factories, we assumed that to install panels, the following would be checked:
For the “eco-business”, only whether the investment threshold would not exceed the assumed investment cost threshold for business (10,000 PLN—about 2500 EUR).
The investment threshold (see above) and long-term analysis of energy costs would be performed.
Public property managed by the city hall includes official buildings, schools, and health clinics. We assumed that PV installation on these buildings would depend on a given scenario:
The base case.
The scenario “Small incentives from the City Hall”—with one panel installed in each district.
The scenario “Large incentives from the City Hall”—with panels installed on large buildings belonging to the city.
The scenario “High incentives from the City Hall”—with panels installed on 50% of the buildings belonging to the city.
These scenarios differ according to the number of installed panels on buildings managed by the city hall. The presence of PV acts as an incentive for the household agents to install them on their properties.
3.3. Economic Modeling
When distributed renewable energy sources, such as PVs, are installed in a given area, then this place may constitute the so-called microgrid and the owners of PV installations the prosumers. For an owner of the microgrid, the legal aspects regulating construction, installation, and cooperation, as well as the connection of the microgrid to the power grid are essential, and so are the aspects that specify payment for the energy transmitted to the network or used within the microgrid.
In Poland, the so-called energy tri-pack, meaning the amendment to the Energy Law and other acts (27 August 2013) contains regulations regarding small RES installations [Dz. U. 2013, item 984, 27 August 2013]. The so-called energy tri-pack promotes improved conditions for microgeneration installation to a network (RES with a joint capacity of up to 40 kW connected to a network of below 110 kV, or with a total thermal power of up to 120 kW). Under the Act, the connection fee is free. In addition, the procedures leading to the connection of the installation to the network have been simplified. As a result, there are now incentives to install RES. After Billewicz [
37], the owner of the microgeneration that generates electricity should consider the fees, which are included in Equations (1)–(4): Excise duty on the production of electricity, income tax on the sold energy, and value added tax (VAT) from resale of energy.
Under the current regulations, electricity generated by means of microgeneration connected to the distribution network must be purchased by the selling energy entity ex officio at the price of 80% of the average electricity sales price from the previous calendar year. Importantly, for an owner of a microgeneration who is a natural person (not an entrepreneur) under the Act on the Freedom of Business Activity, the generation and sale of electricity is not considered an economic activity [
38]. In this section, we use the concept of a household agent (representing a natural person) to underline its cognitive capacities.
In the conducted research, we use an economic model in which two variants are compared:
The installation of PVs on a building or a set of buildings. In this case, we assume that during the period of PV depreciation (20 years), the household agents of a building complex would use less energy from the grid but would have had to bear the costs of the PV installation. Additionally, they would resell the remaining energy produced back to the network.
No PV installation. In this case, we assume that during the period of PV depreciation (20 years) the household agents would pay for the total amount of energy but would receive interest from a long-term deposit from savings. The initial amount of savings is the costs of PV installation.
Equation (1) describes the annual energy costs with installed PV, it consists of a variable part of the fee and a fixed part of the fee. The variable part of the fee consists of (PG11) price of electricity according to tariff (most popular one: G11), (SVNR) network rate, and quality assurance component of the system fee rate (SFRQAC). The amount of consumed energy (AECPC) is decreased by annual energy production per panel per capita (AEPV), fractioned by energy consumed (HEC). The fixed part of the fee is: (CTR), the network standing charge, and (SF) subscription fee. The costs are increasing. Energy costs are taxed by a value-added tax (VAT). Equation (3) describes the annual energy costs without PV installed. It differs from Equation (1) only with the amount of consumed energy.
Equation (2) describes the annual profit from the resale of energy. The amount of resold energy consists of energy production per panel per capita (AEPV), reduced by (1 − HEC) part of the energy resold to the grid. The amount of energy produced is reduced annually by (DS) drop in cell performance. This energy is sold by the average price of energy on the competitive market (AVEP), reduced by coefficient of change in the energy resale price (ERPCC). In addition, we assume that the price of energy increases year by year (AIEP). Income from energy sales is taxed income tax rate (ITR).
Equation (4) shows annual value on the deposit assuming that the PV is not installed. It comprises the interest rate on the deposit (IRD); it also assumes that the income is taxed by capital gains tax (CGT).
Equations (5) and (6) represent the cost assuming a 20-year amortization. Therefore, Equation (5) shows total energy costs with installed PV, which consists of one-time PV installation costs (CIPV), annual energy costs with installed PV (AECIPV), decreased by annual profit from resale of energy (APER) and profits from gamification (PG). In turn, Equation (6) shows total energy costs without installed PV and consists of annual energy costs without PV installed (AECNPV), decreased by interests income (
−
).
The parameters for the applied economic model are in
Table 3. We also determined that
, where
is the unit cost of a PV installation per capita, meaning that if someone does not install the panels, he or she deposits the money he or she would have spent on the installation into an account with an average annual interest rate.
In the simulation, such an analysis is carried out each month, because it is assumed that condominium and housing co-operative meetings would occur on a monthly basis.
From Equations (1)–(6), two outputs are obtained:
3.4. Calibration
Due to the simulations carried out for the model city, it was possible to calibrate the multi-agent system properly, i.e., to determine the value of individual parameters, which then enabled the use of the devised model for a real urban area. In our example, 40,320 iterations correspond to a period of five years during which the municipal authorities, businesses, residents, and condominium and housing co-operatives make decisions, iteratively, regarding PV installation on buildings. The simulation assumes that the step of simulation equals to 15 min, one day equals to 96 simulation steps, and one week takes 672 steps. We use this time structure to reflect the frequency of agents’ meetings as they move around the city. However, we assumed that due to the weekly basis of simulation, the representation of the week is crucial, and because of the ease of simulation, we assumed that one week is treated as one month, because we adopted a monthly decision-making process for PV installations. One year lasts 12 months, so 8,064 steps of simulation. The simulation period that was selected was 5 years (40,320 steps of simulation), on one hand to provide enough time for introduce the changes and to assess the changes, and on the second hand to provide reasonable time of computations.
The sensitivity of the model in terms of duration of the simulation step is checked and it turned out that the number of meetings is inversely proportional to the length of the simulation step. On the other hand, the shorter the simulation step, the more time should be spent on simulation, as we wanted to keep the weekly simulation base and the five-year research period. Therefore, 15 min turned out to be a good compromise.
3.5. Simulations for the Model City
Using the methodology developed and the multi-agent system, as well as the scenarios presented in
Table 1, we conducted preliminary tests of the system on the model data (the so-called model city described in the previous paragraph). The studies made it possible to both adjust the model, that is select and determine critical parameters, and to analyze the influences of location, spatial objects, and demographic parameters on the model city residents. The selection of the most important (critical) parameters was made by using the sensitivity analysis of the method to change individual parameters and to assess the value of the partial correlation coefficient. The assumption was that each agent would represent 1000 residents with averaged characteristics typically seen in a given district of the city.
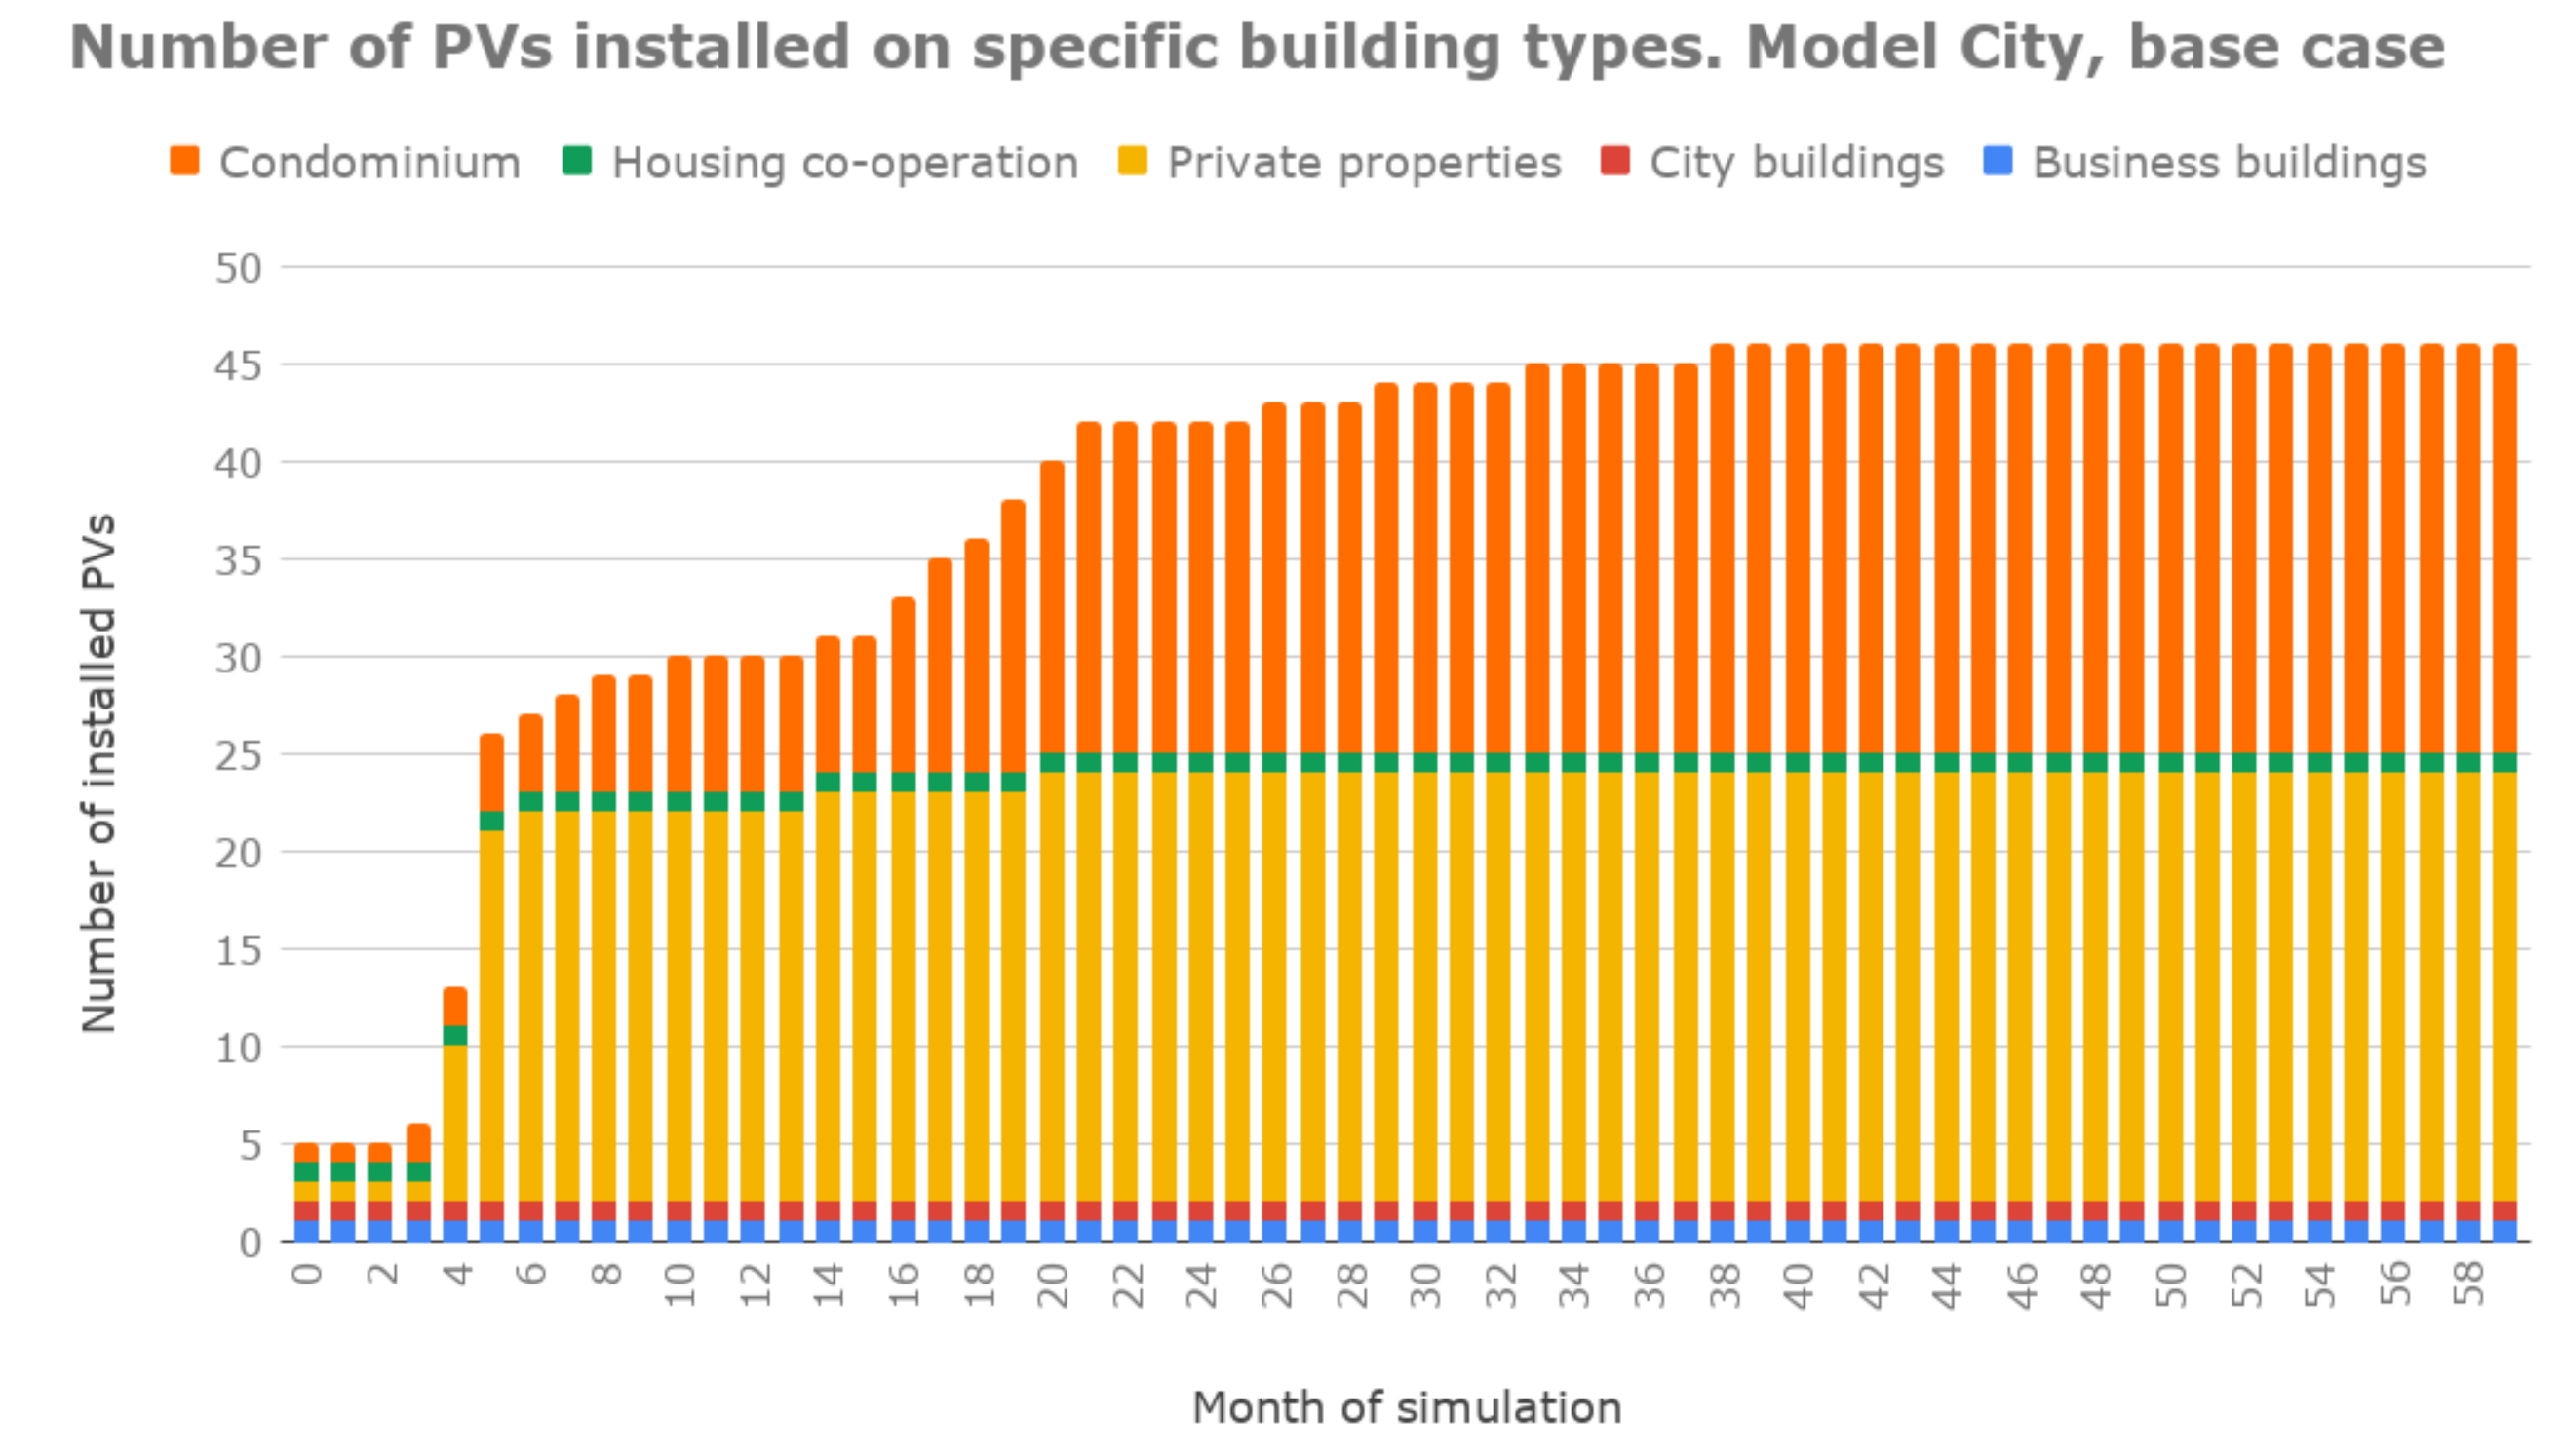
The results obtained (
Figure 4 and
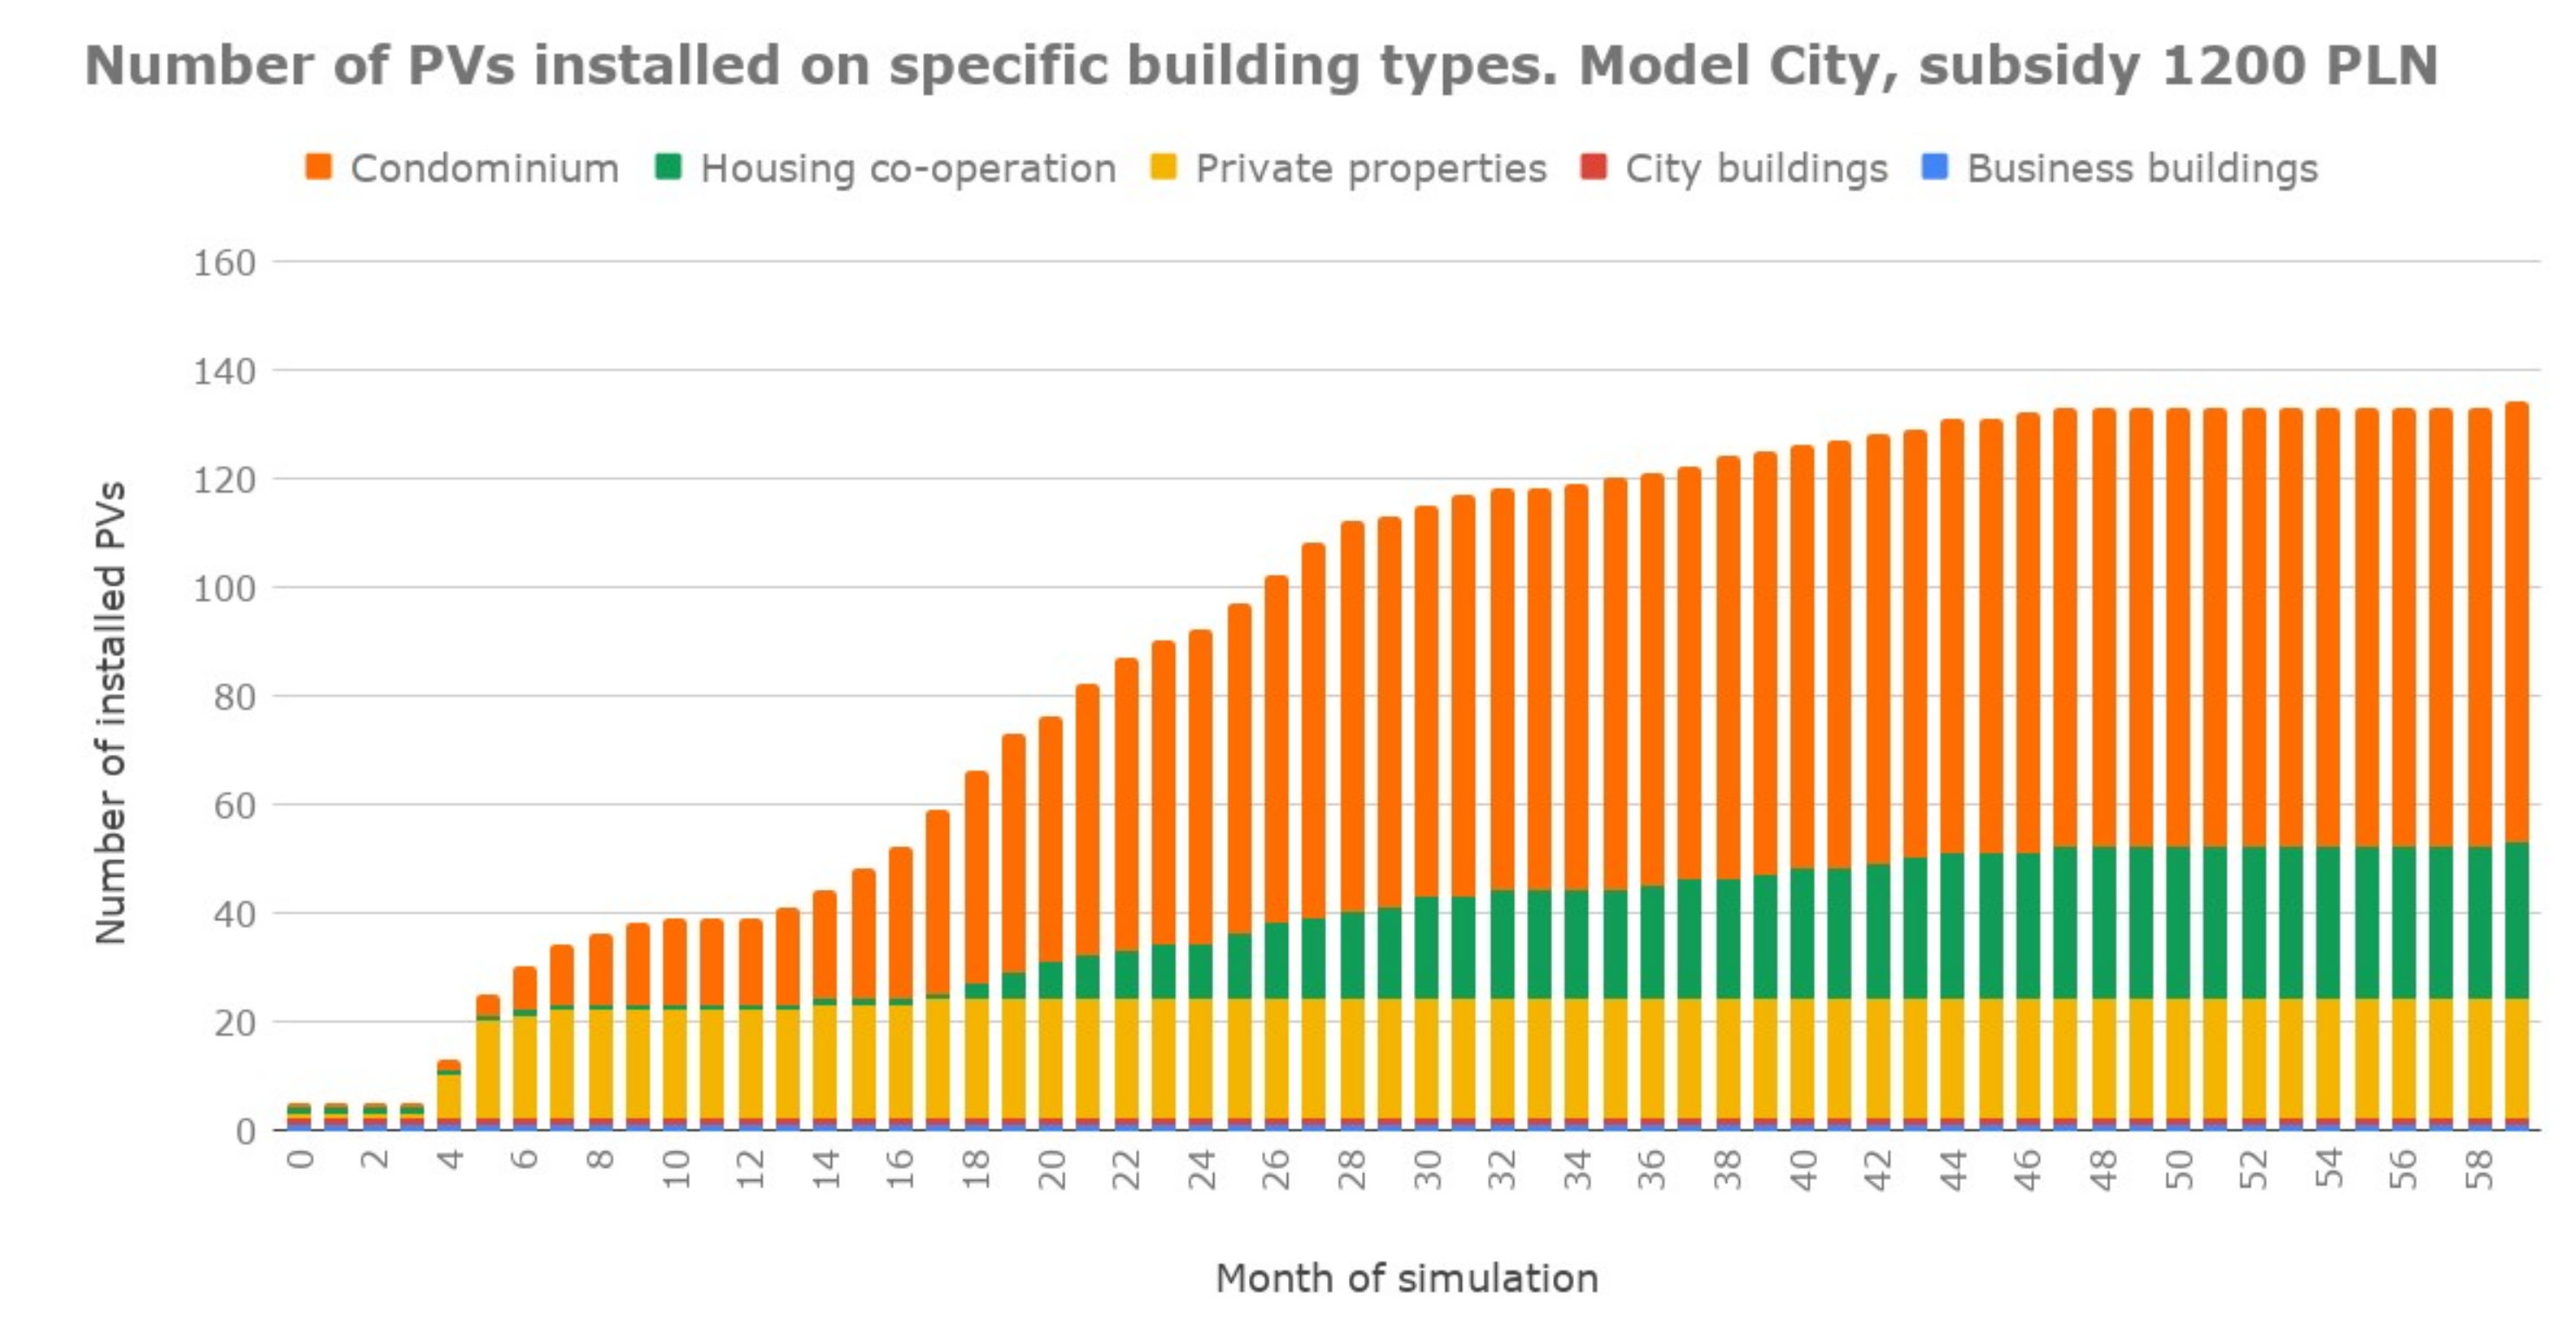
Figure 5) indicate that direct subsidies are the most effective form of stimulating the installation of PVs. Compared to the base case (blue color), this variant of stimulation brings about an almost threefold increase in the number of installed panels. It is worth noting that, compared to the base case in which the increase in the number of PVs is significantly affected by installations on private properties and housing communities, in the subsidy model (
Figure 4), panels are also installed on buildings managed by the housing co-operatives. The number of PVs installed does not increase for the private properties. This is due to the saturation of the market in the first period (for people who can afford the installation of PVs). Other groups see the positive effects of installing photovoltaic panels in private properties and are encouraged to use such solutions.
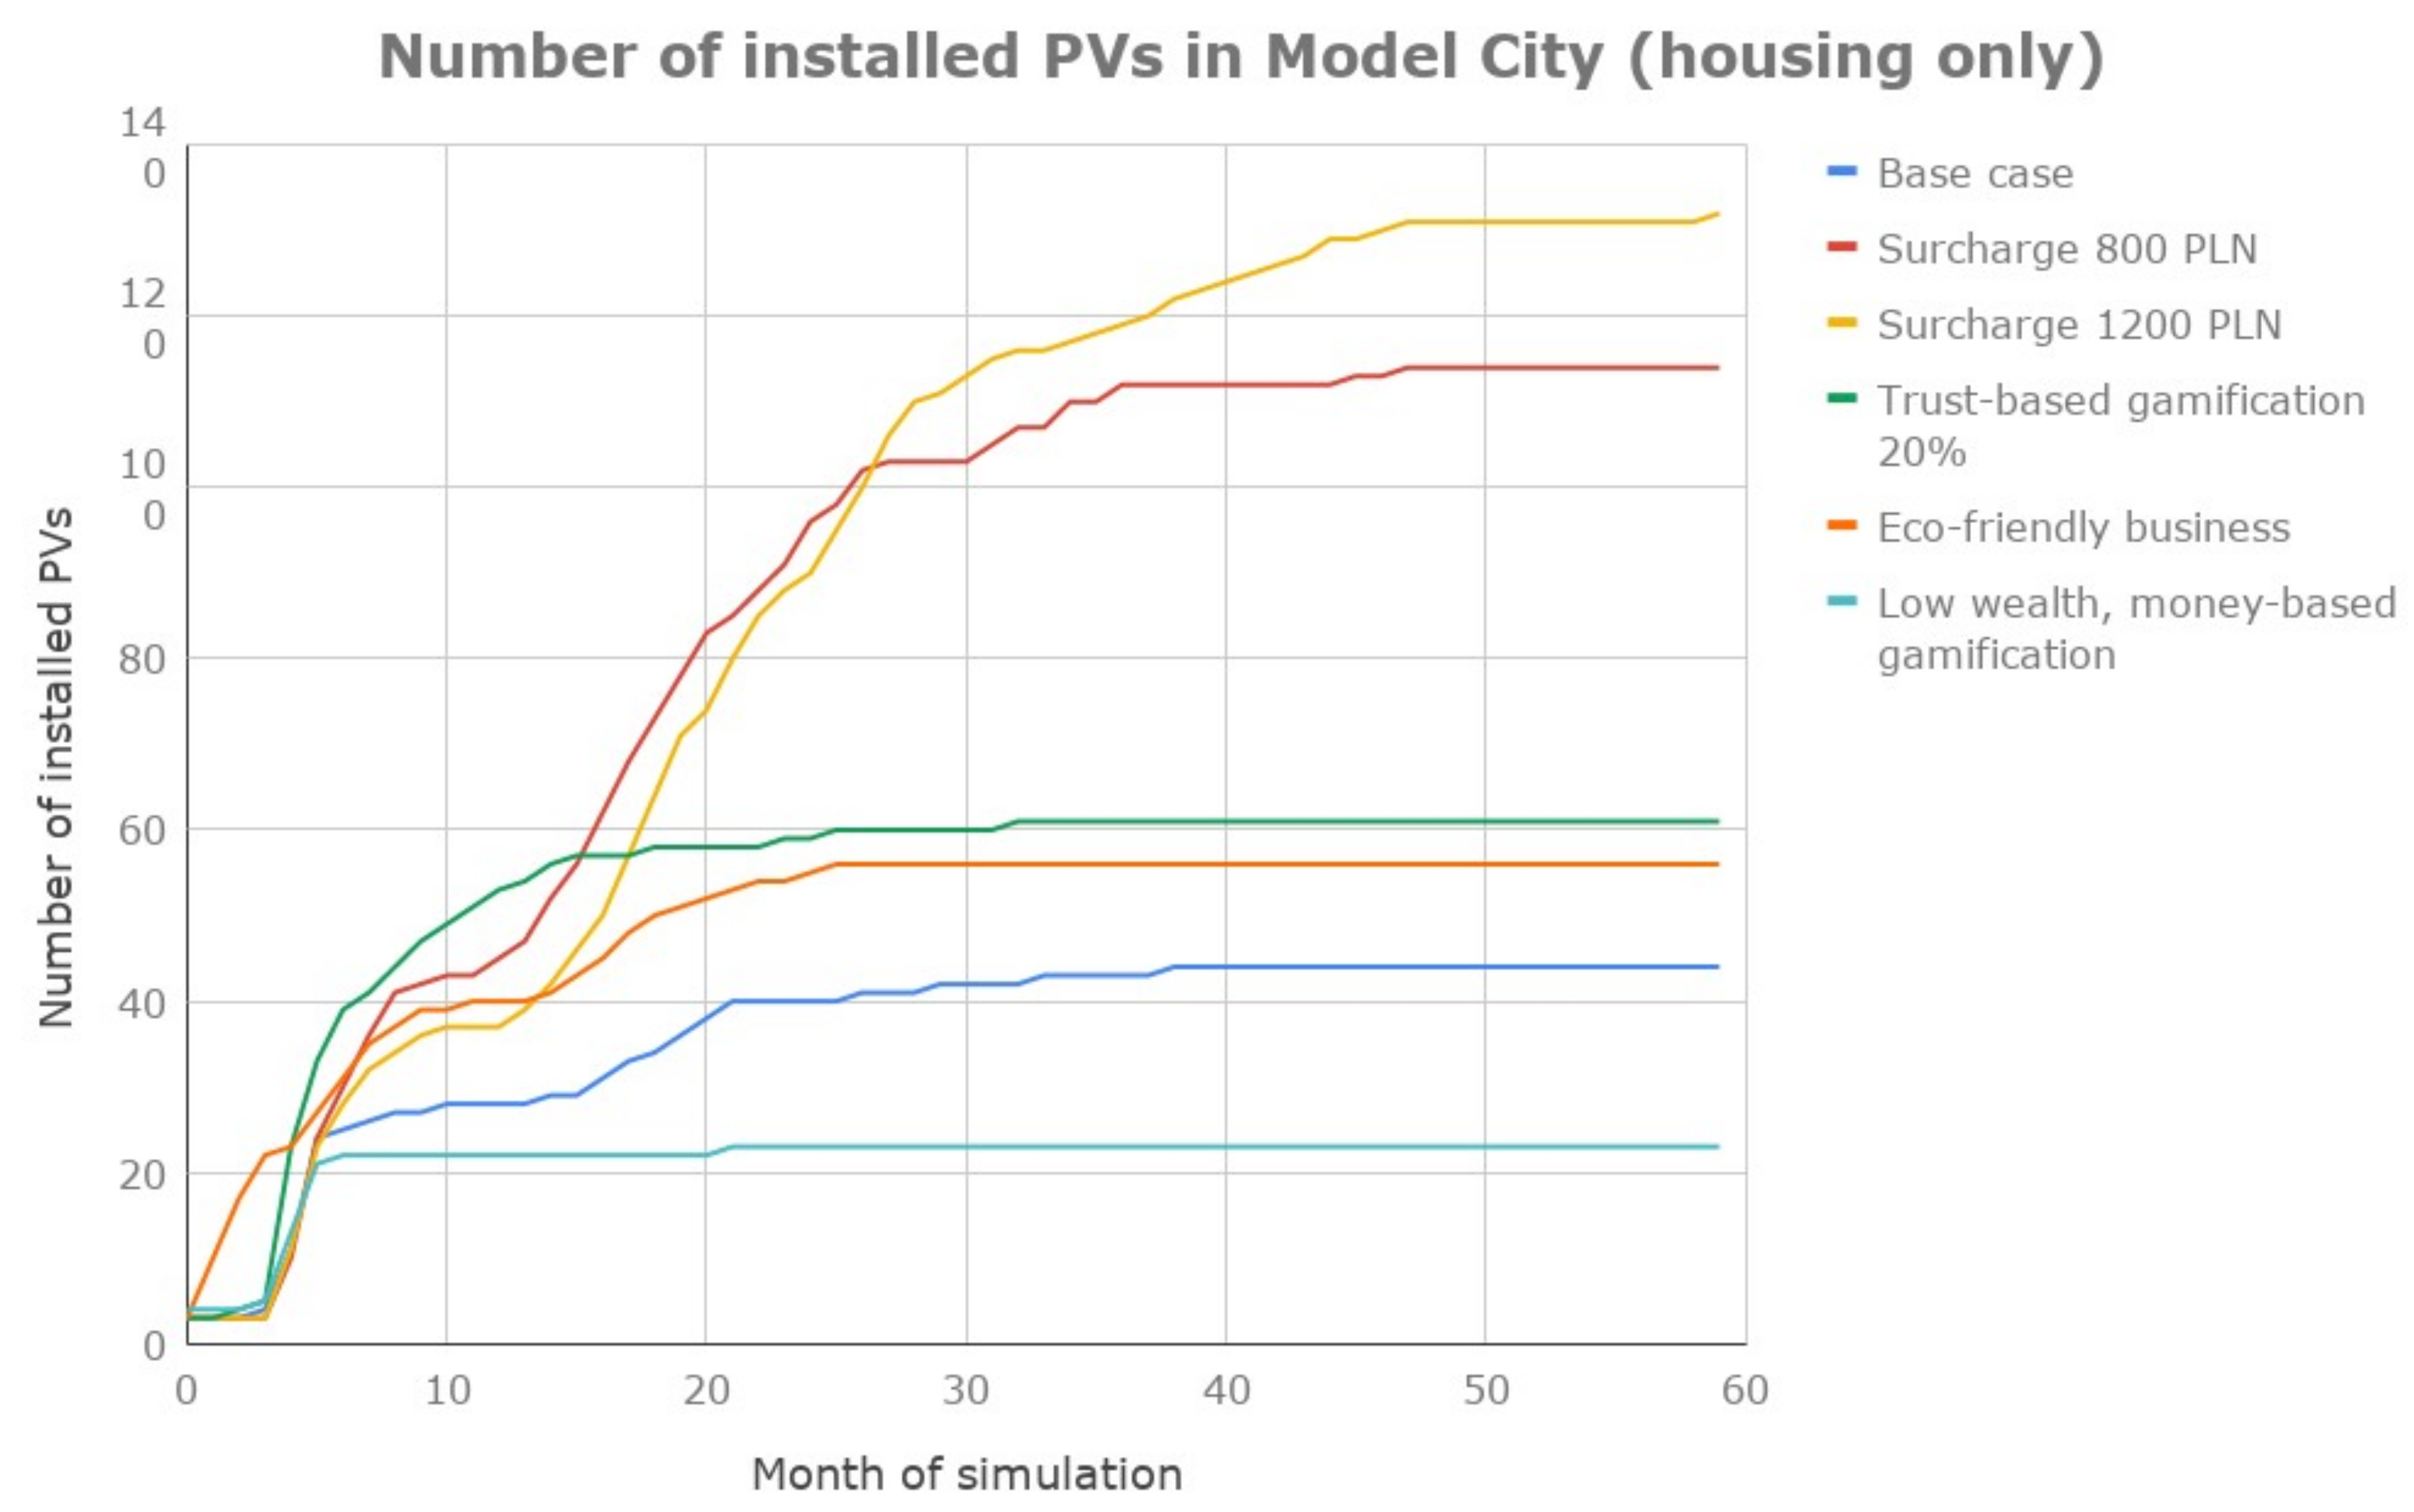
In the case of subsidies for PV installations, two interesting dependences have emerged (see
Figure 6). First, housing co-operatives start to engage: The number of PV systems installed by the housing co-operatives matches the number of those privately installed. However, there is a slower increase in PVs. What is important when analyzing the subsidies (in the amounts of 1,200 PLN and 800 PLN) is that the lower the subsidies, the smaller the share of housing cooperatives in the final number of PVs installed. However, regardless of the level of subsidies, there is a massive increase in PVs installed on buildings belonging to condominiums. The difference in the diffusion of PV in the different building types between the 800 and 1200 PLN surcharge is small—around 15%. A surcharge of 800 PLN is therefore already sufficient to install panels. Due to difficulties in today’s economy in Poland, a subsidy of 800 PLN (about 200 EUR) would act as a sufficient incentive for installation. What should be emphasized though is that this method of offering direct subsidies, while effective, does not provide a perfect solution to the problem, both in an economic and a social sense; that is to say, it does not give an incentive that is sufficient to develop a local community.
Among the other methods of stimulation, trust-based gamification has the highest increase in PV installations, as well as the highest in social trust (
Figure 6). In the scenario with a gradual increase in trust of up to 20% (in public institutions as well as mutual trust between residents), there is a rapid increase in the number of new installations during the first 15 months and then a gradual saturation in the subsequent forecasting period. Trust-based gamification is a process that enables the authorities of a smart city to support sustainable development through the installation of PVs. It also enables the development of a local community. In contrast to money-based gamification—a stimulation that generates material profits only to those involved in the installation process (i.e., anyone who installs PV will receive material profits, such as free parking, coupons, cinema tickets. and so on, worth 200 PLN—about 50 EUR)—trust-based gamification contributes to sustainable development.
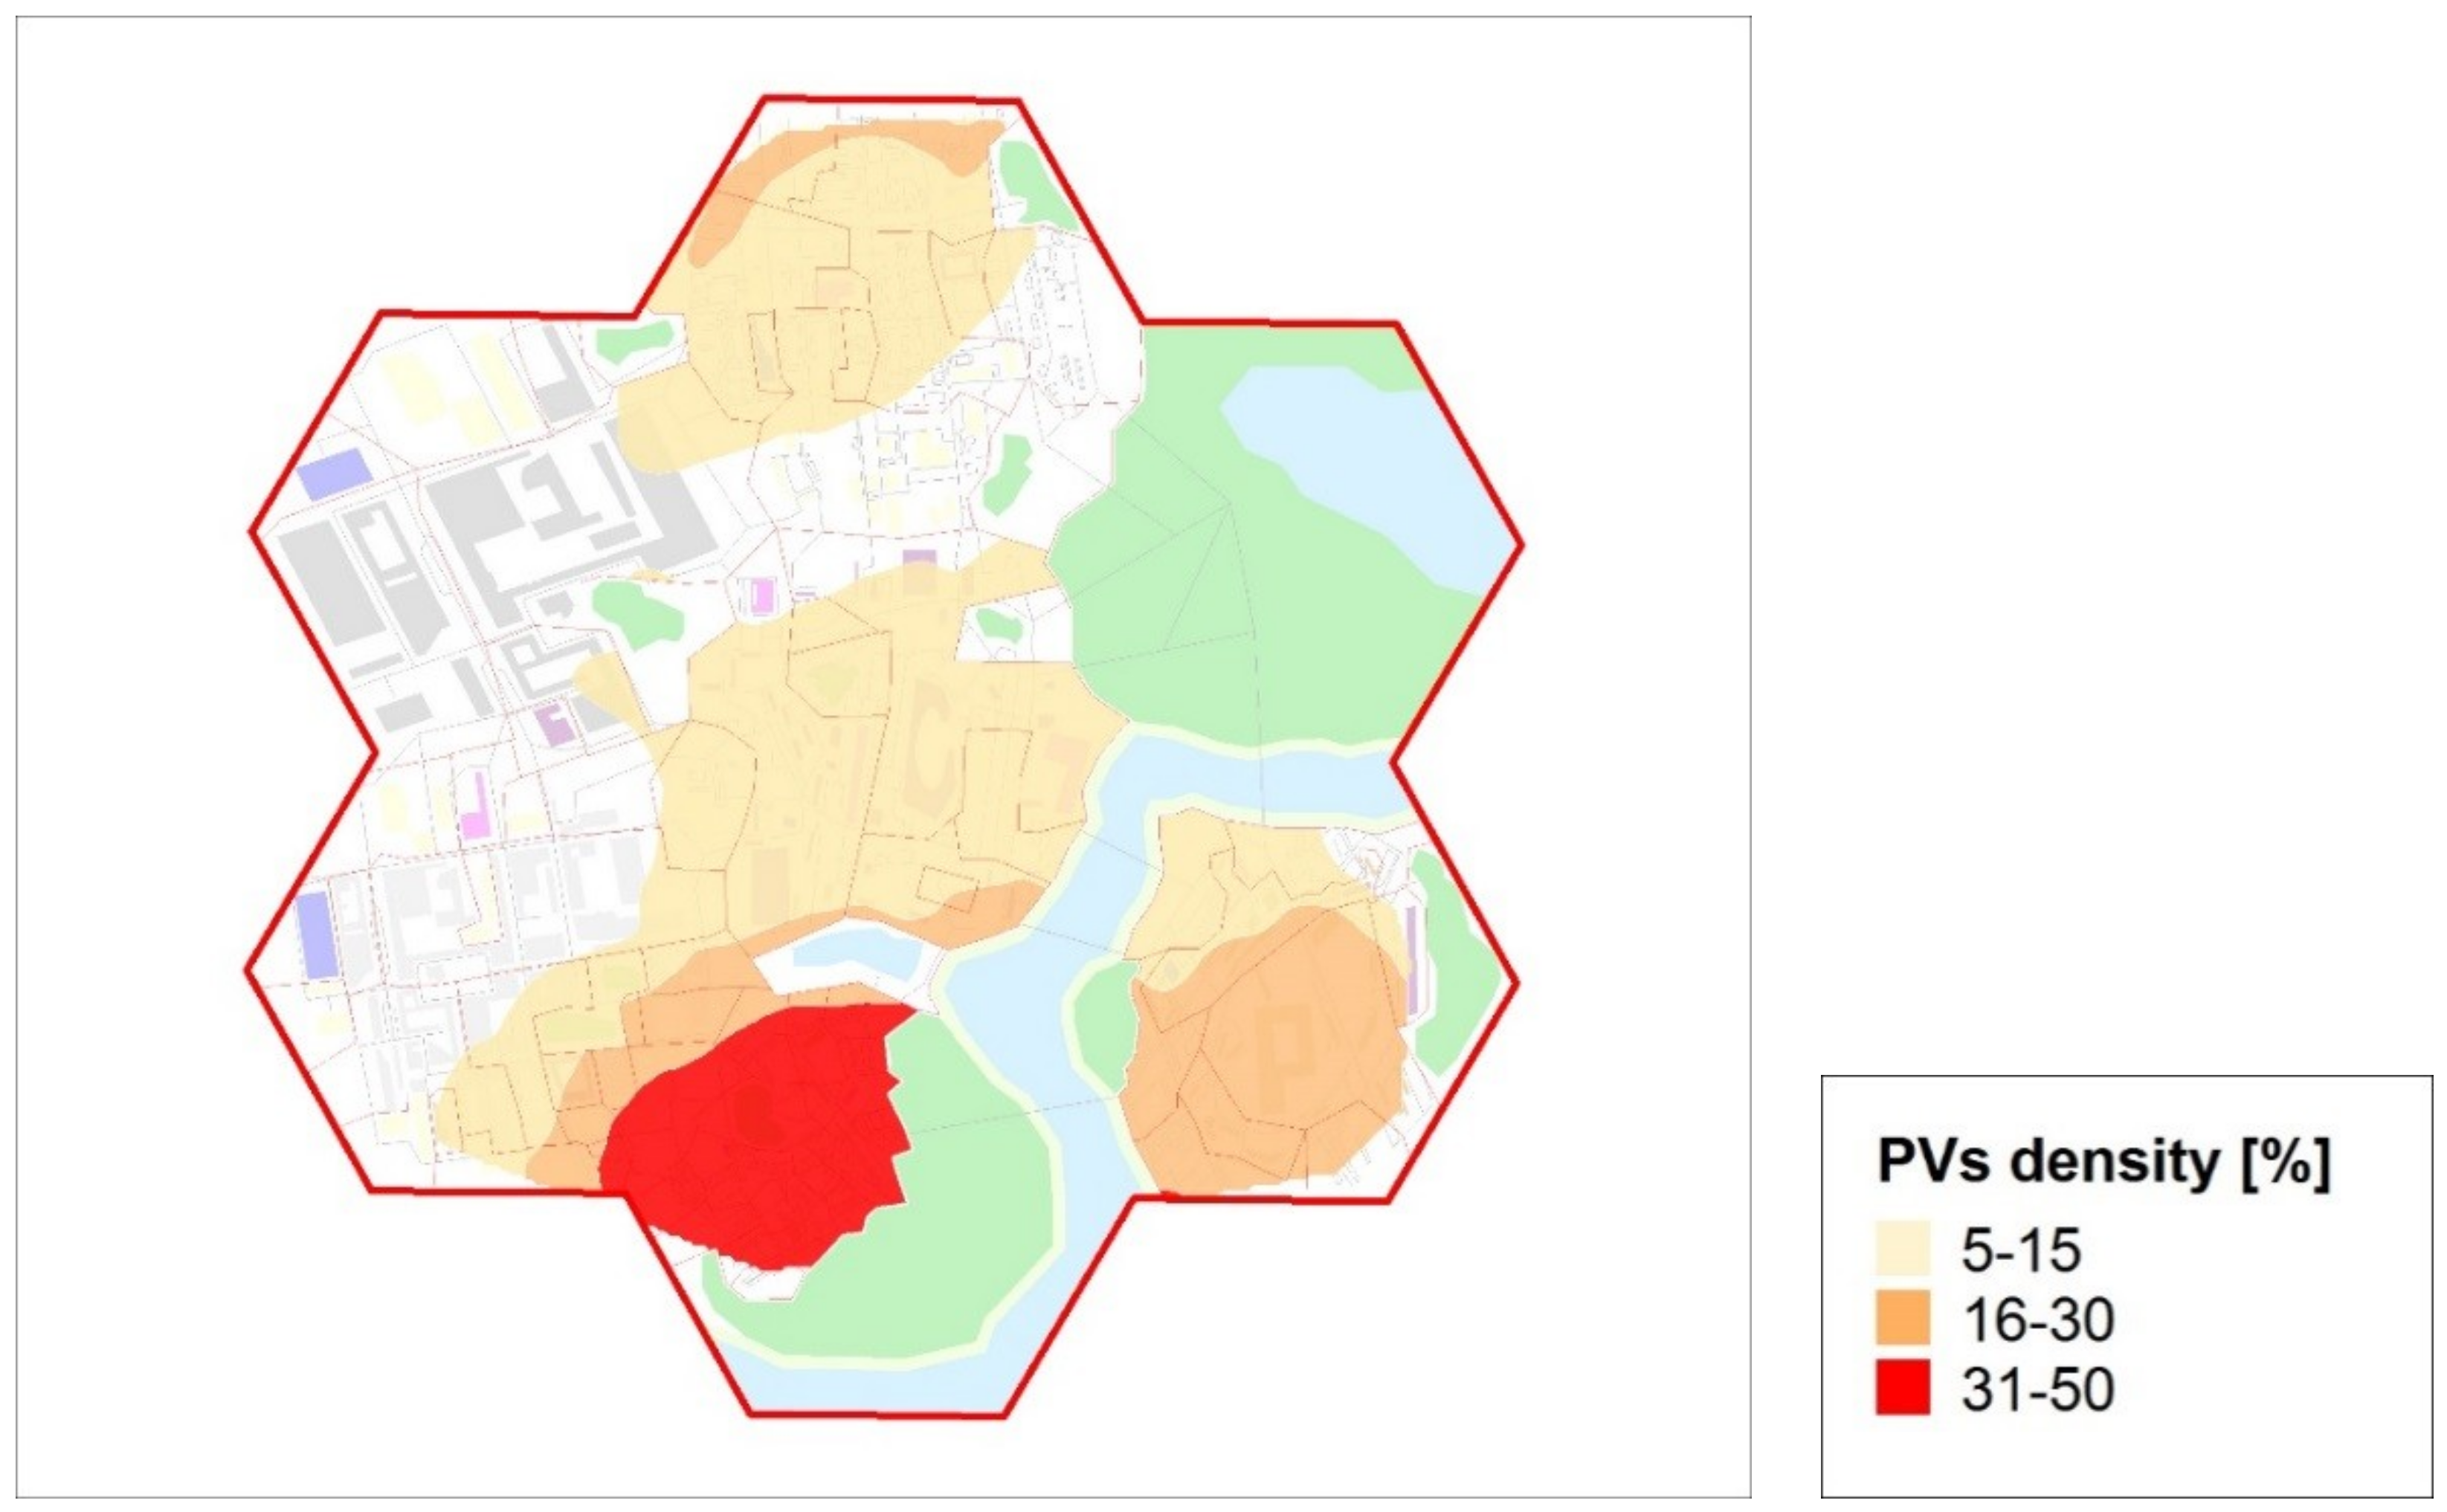
In the trust-based variant, the city authorities propose gamification mechanisms which create an ongoing increase in social trust, encouraging citizens to install PV. The growth of both interest and trust is achieved, e.g., through the construction of playgrounds, road signs being powered with PV, and so on. In this model, there is a significant increase in the number of panels, especially in those areas of the city where private properties and condominiums dominate. As indicated by the simulations carried out in the southern and eastern parts of the model city (the Greenland and Old Town districts) dominated by private houses, in 60 months, the saturation level achieves nearly 50%. In addition, in the trust-based gamification scenario, the number of installations is also significant in the northern part of the model city where condominiums are common (see
Figure 7).
It should be noted that this variant of stimulation is not sufficiently effectual in districts dominated by white- and blue-collar workers (i.e., the Business and Old Factory Districts). Using other simulation models, e.g., the “eco-business” or “small incentives from the City Hall and active business”, leads to a greater interest in PVs in the industrial districts as well. This indicates that the authorities of a smart city need to adopt a hybrid approach, i.e., trust-based gamification for the residents, along with a system of economic incentives and tax reliefs for businesses.
In the case of trust-based gamification, there is a marked increase in the number of installed PVs initially (from 5–20 months in the simulation). This stems from increased levels of social trust being created by these mechanisms. The incentive to install PVs by mounting them on buildings belonging to the city corresponds to this increase. However, the influence is disproportionate to the number of PVs installed to incentivize: The difference in the final number of PVs installed on residential buildings between the large and the small incentives scenarios is five. However, to achieve this, nine more PVs had to be installed on city buildings.
In contrast, when comparing the high-incentives with the large-incentives scenario, the difference in the number of installed PVs is 8, and 30 more PVs were installed on city buildings to achieve this. So that the results were not obscure, it was decided not to activate PV installation on business buildings. A business being active does not affect the number of panels installed on residential buildings. However, including an additional option in which the business is “eco-friendly”—which means that the decision-makers do not consider the long-term costs of the PV installation—increases the number of installed PVs by 12 (compared to the base case).
Simulation of the scenarios listed in
Table 1 was carried out for the model city over a period of five years (60 months) to predict an actual increase in the number of panels for the real data. This problem is the subject of the next chapter.
4. Results
A model city with defined features was selected as the research area, for which several research scenarios were prepared. We tested the developed methodology for the entire area of Warsaw and the selected district of the city, Wawer. In this area, the most significant development and the biggest number of PV installations in Warsaw can be observed, an initiative undertaken by the residents who install them to save money. At present, those residents who install PVs tend also to be choosing other forms of alternative environmentally friendly activities such as, for example, home wastewater treatment plants.
The base model developed for the model city was calibrated in time according to the number of Warsaw installations provided by the relevant institutions. The assumption for the model city was that each agent represents 1000 residents with averaged characteristics typical for a given district of the city. For the generalized digital geographic data (corresponding to a 1:250,000 scale map) that cover the entire area of Warsaw, we used a model in which a single agent also represented 1000 residents with averaged features. This required using 1750 agents—significantly extending the calculation process. The most complex and long-term calculations were made for the district of Wawer. The study used a topographic source database (equivalent to a 1:10,000 scale map) and detailed demographic data. Each of the 7500 agents represent only 10 residents of the district. Performing these calculations using the GAMA toolset environment that enables multi-agent simulations required about five days of calculation for each of the 10 analyzed models.
The result of choosing the number of agents was, in any case, a compromise between the reality of the model and its computability. The model is quite complex, as it models the everyday life of a citizen moving around the city with a resolution of 15 min, where the whole simulation lasts five years; residents move along the road network in the city according to the plan of the day and week. We analyzed the number of agents for each model and the assumption about the differentiation of the number of agents per simulated citizens (see
Table 4). Conclusively, we ensured that the number of agents for each model ranged from 1000 to 7500.
4.1. Simulations for the City of Warsaw
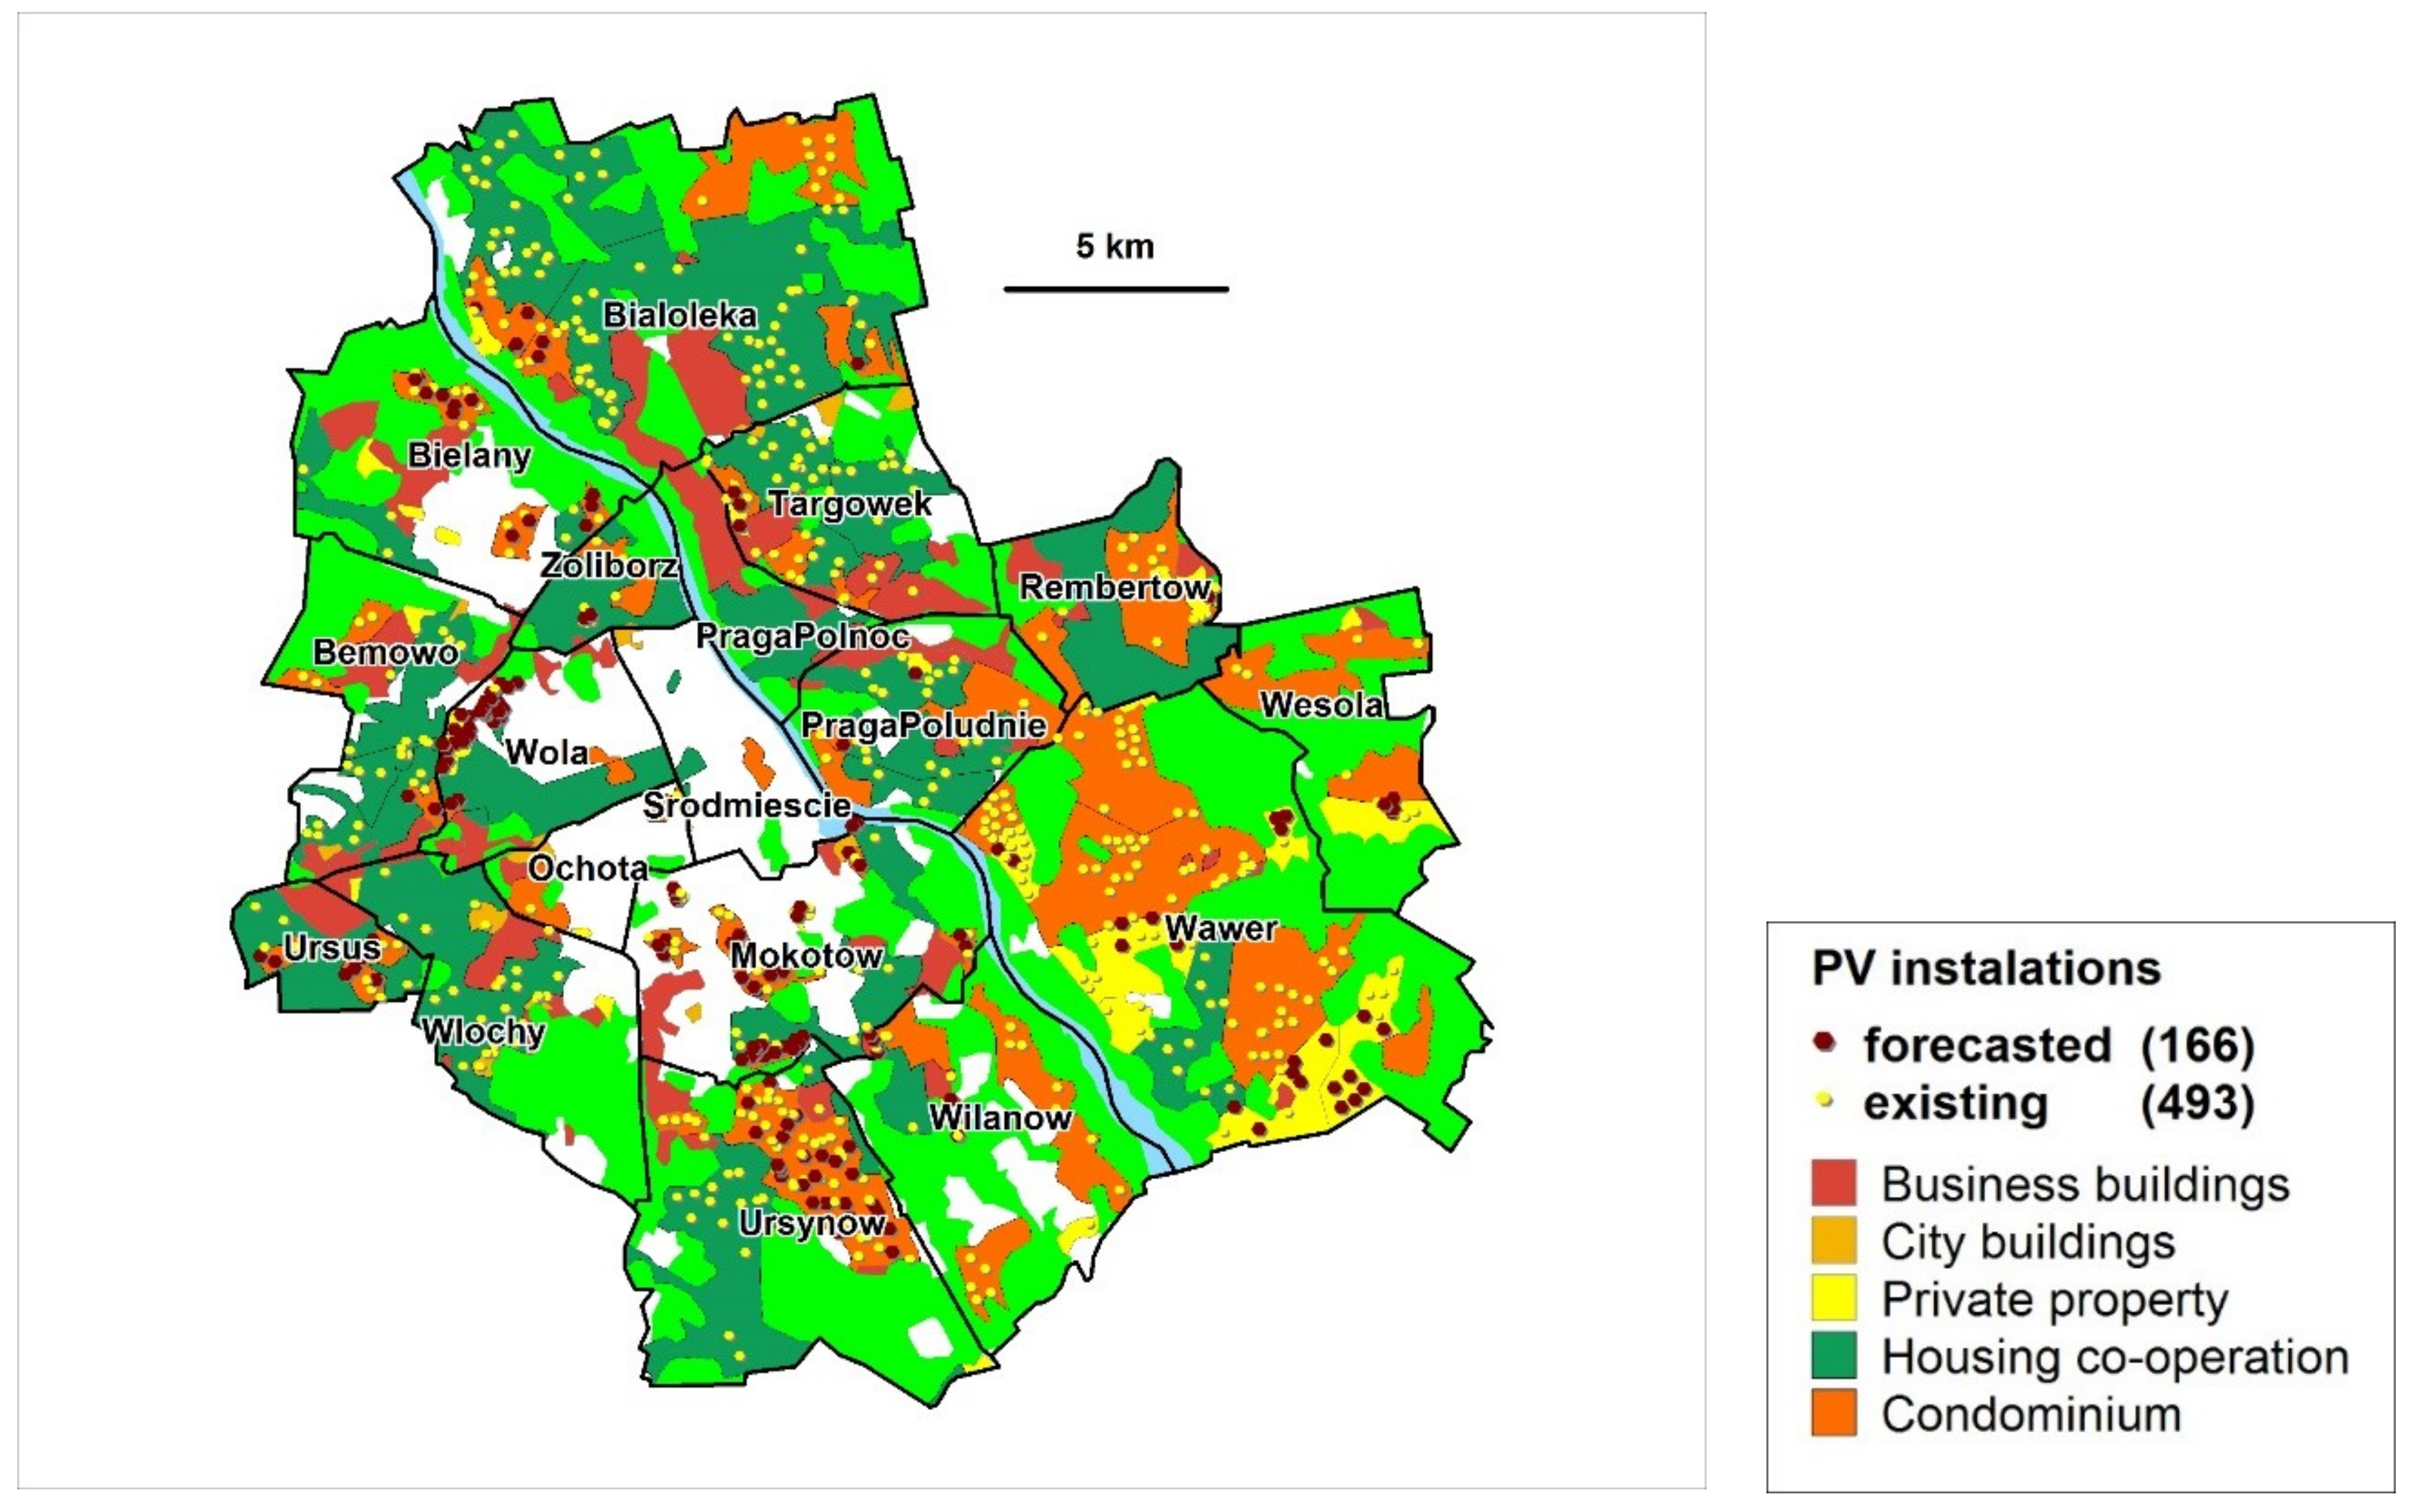
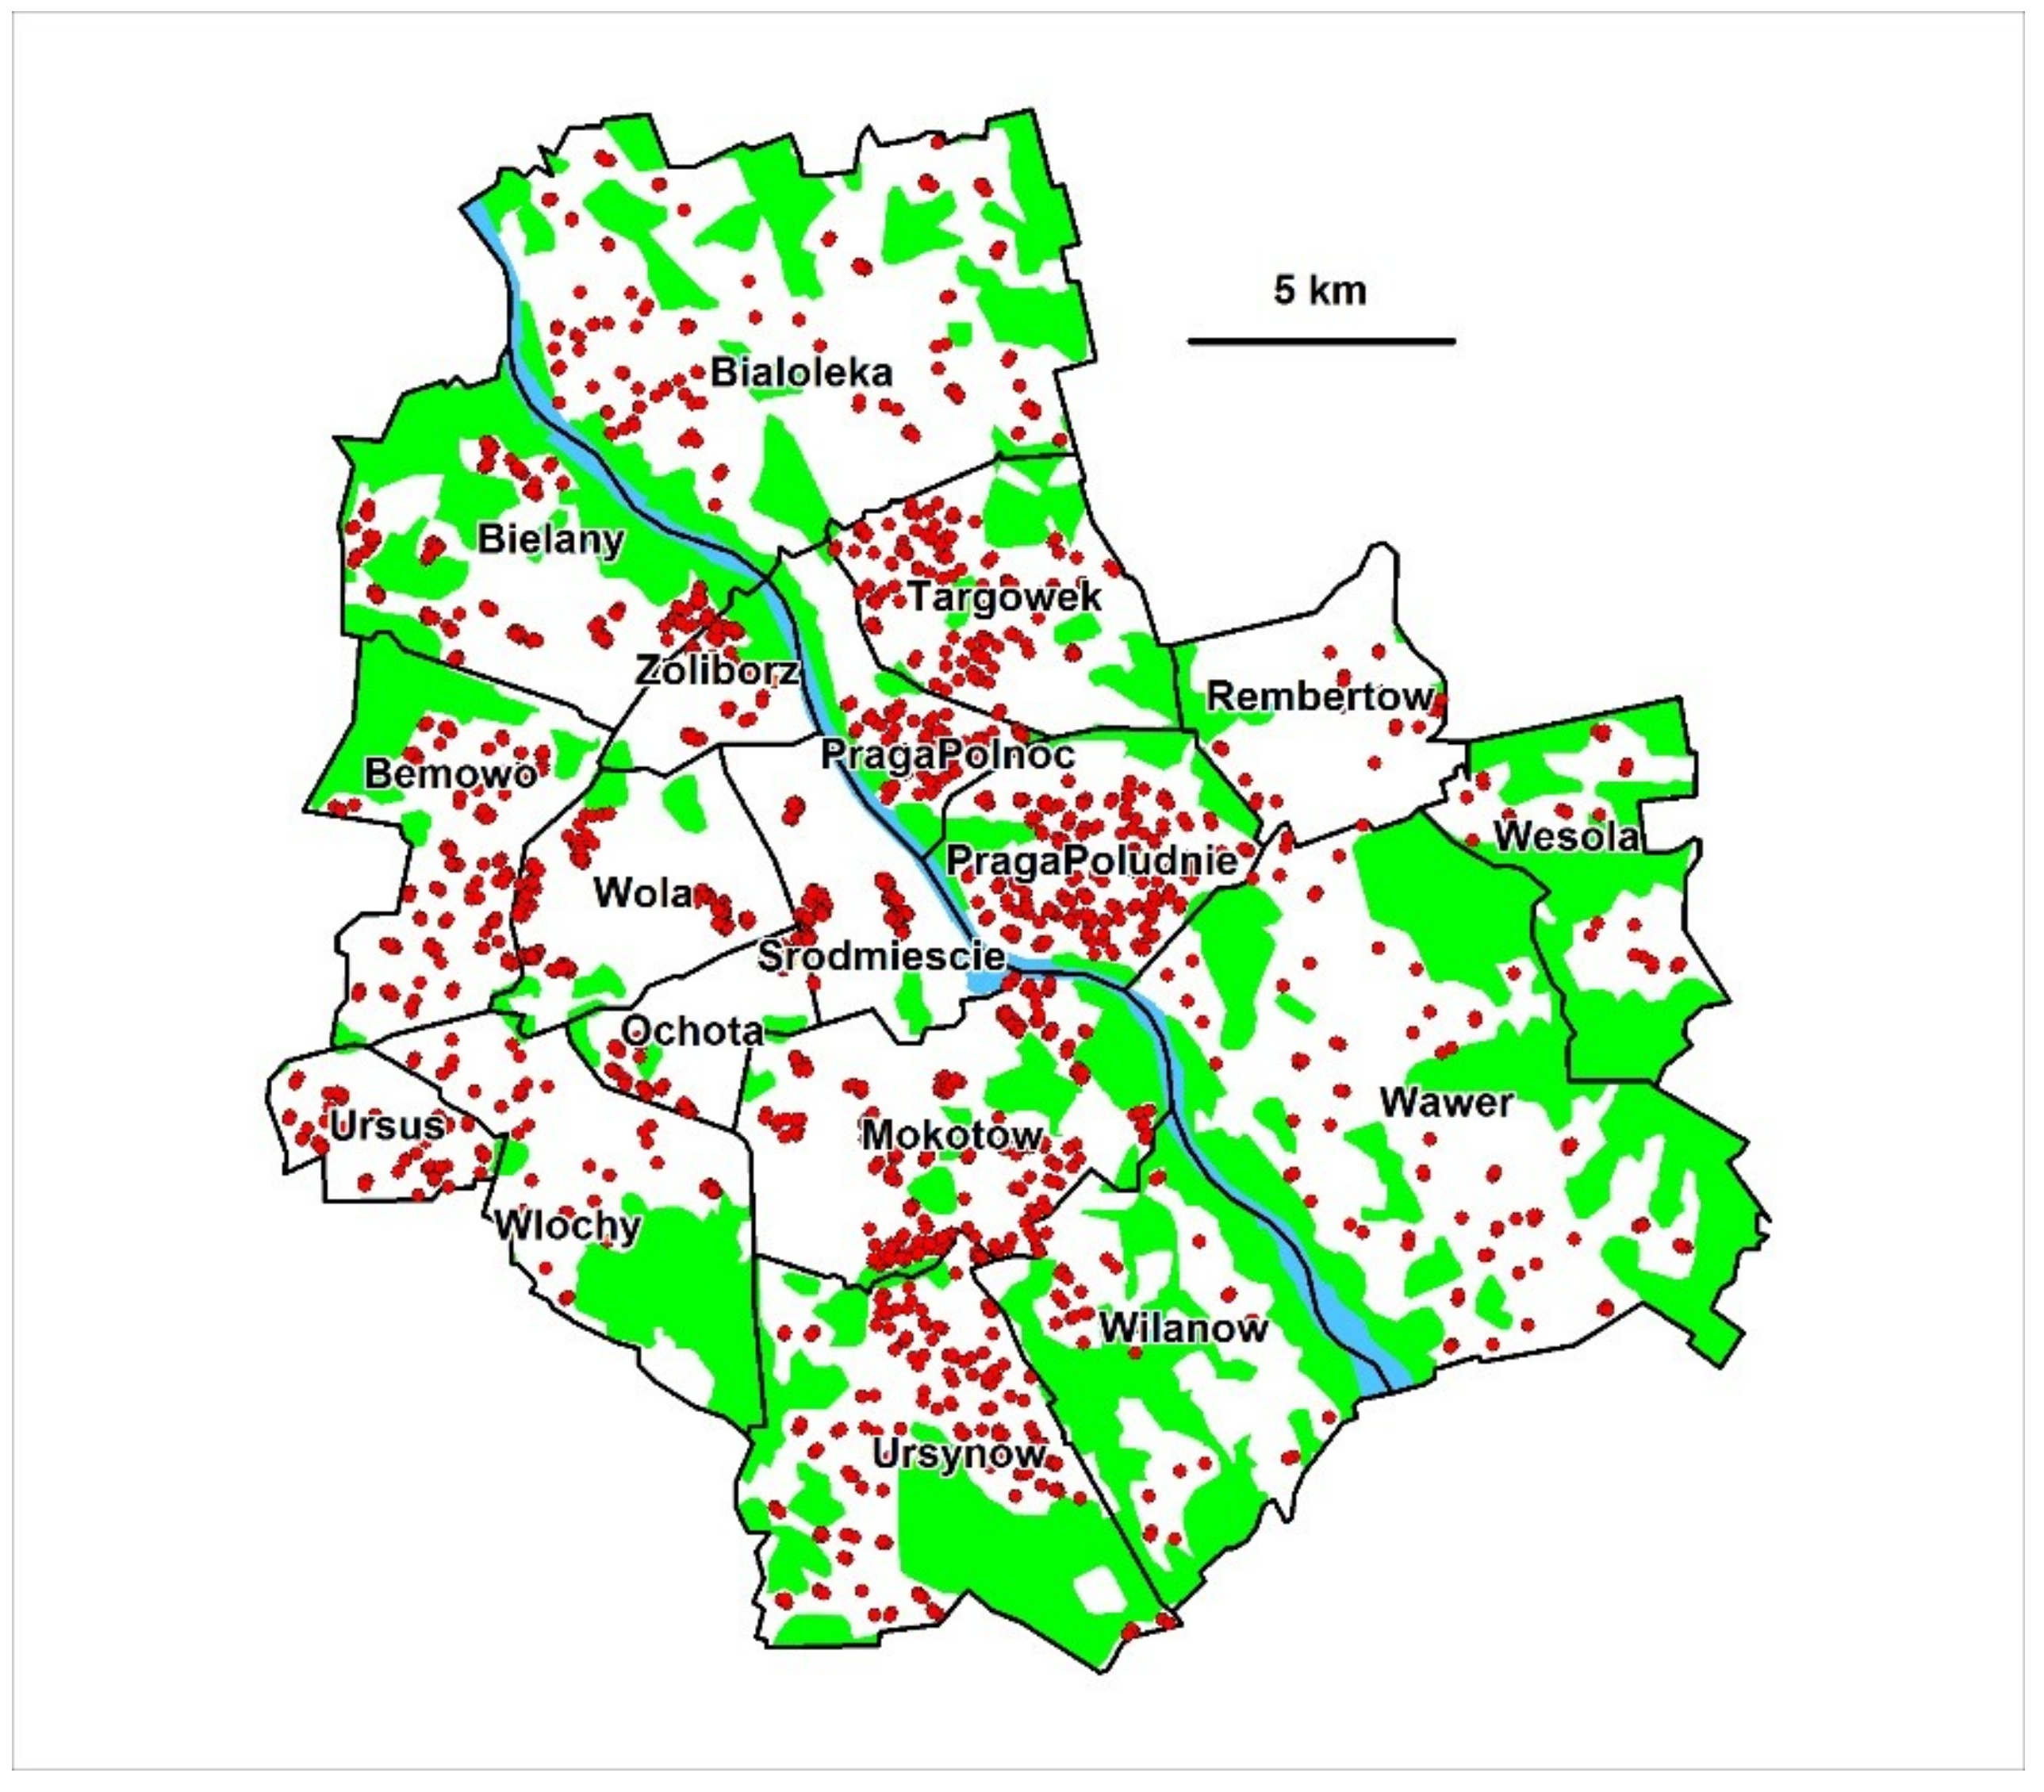
A research experiment on actual data, both spatial and demographic, was necessary to verify the developed methodology. A spatial database for the Warsaw area was developed (
Figure 8) using the digital general geographical data and demographic data from the census.
Data available on the City Hall of Warsaw’s geoportal (
http://mapa.um.warszawa.pl/mapaApp1/mapa?service=mapa_oze)—using the so-called RES layer (renewable energy sources) and its so-called solar map—provided information on the PV potential of individual buildings. Due to hardware-based limitations linked to the necessary use of significant computing power of the CPU as the number of agents increased, 1750 agents were employed for the city of Warsaw. Their distribution in individual districts is proportional to the number of residents of a given area (
Figure 9).
Using the principles of cartographic generalization [
44], spatial information on development, land cover, and road network was generalized. Averaged demographic characteristics of the population in a given location were assigned to the agents representing the residents of a given district. Information on the number of PVs and their location, in the form of their addresses, was obtained from the City Hall of Warsaw and ‘Innogy Polska S.A.’ (the electricity supplier). Using the geocoding mechanisms available among GIS tools, all currently installed PVs in Warsaw were added to the spatial database. Besides the spatial location, these data also contain information on the number of modules and the power of the installation, as well as the type of building on which the panel was installed (private, municipal, condominium, housing co-operative, business, etc.).
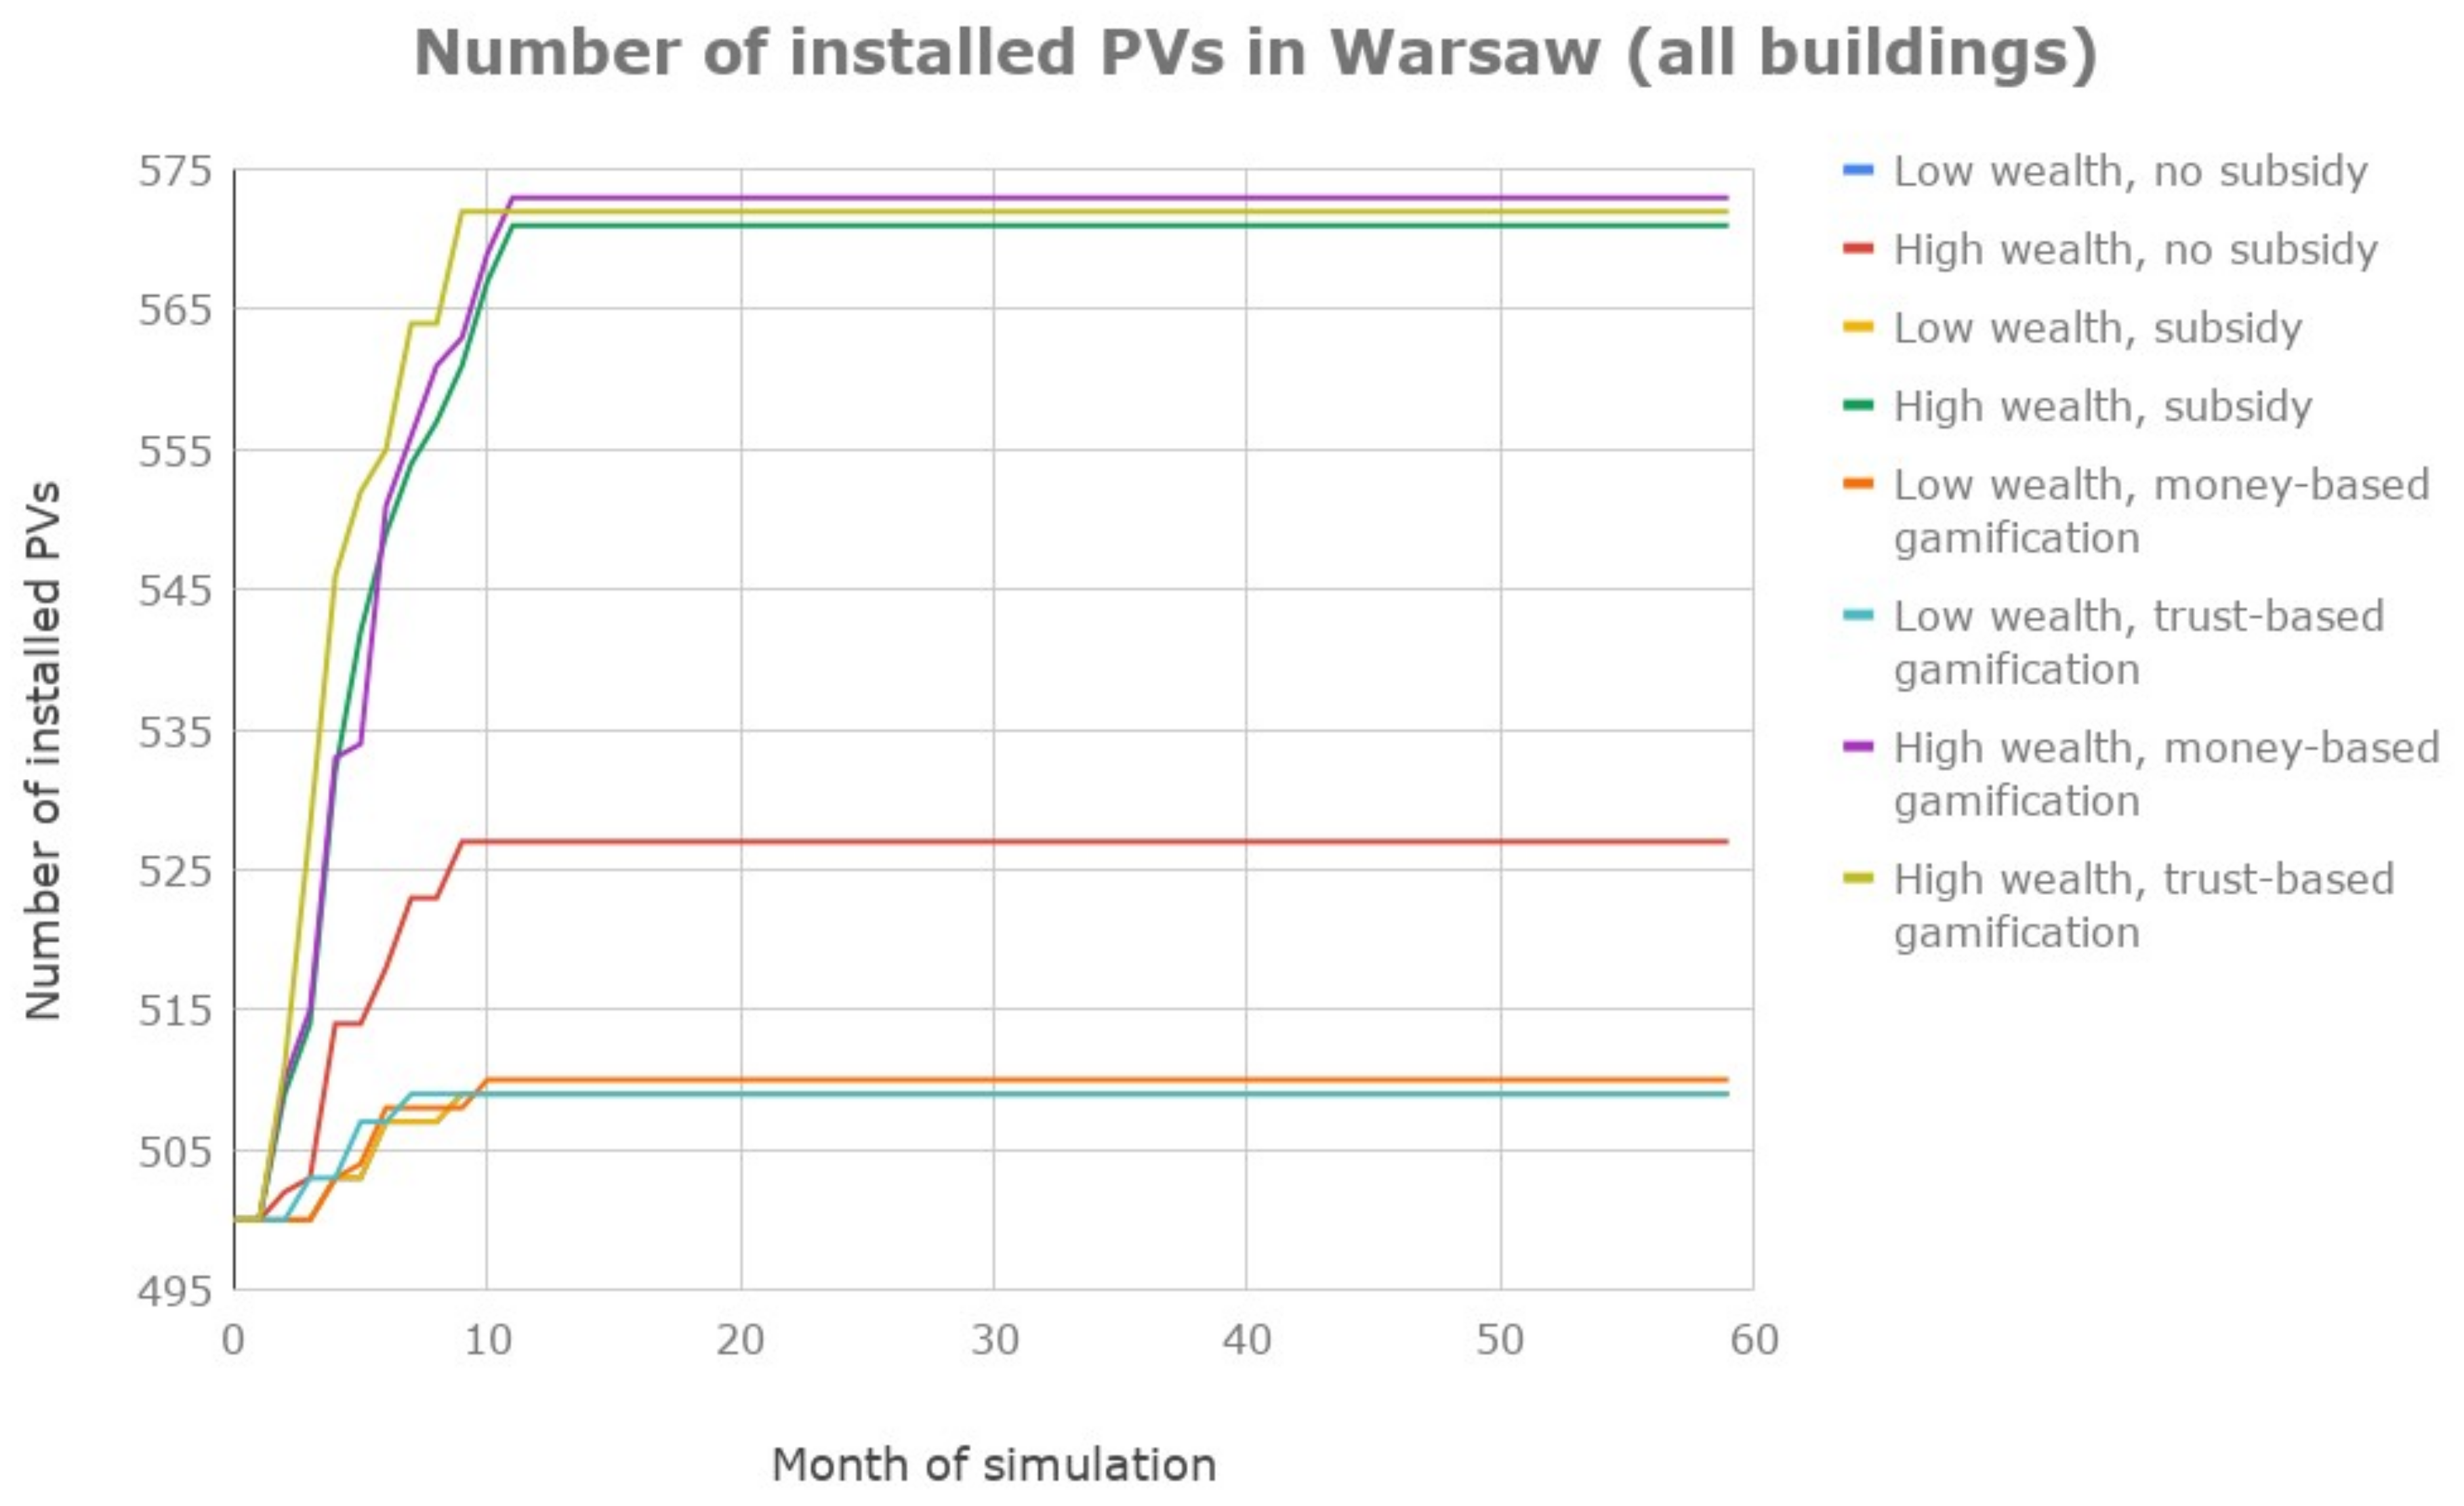
The methodological starting point, previously devised for the model data for the Warsaw area, proved useful when carrying out a series of development simulations for the PVs. Because of the specific character of Warsaw or, in fact, the specificity of demographic data and Polish economic boundary conditions, the models that had been used before were supplemented with variants in which the citizens’ wealth as well as PV installation costs were parameterized. The obtained results indicate (
Figure 10 and
Figure 11) that for less-wealthy residents, PV costs do not influence the number of installed panels. When residents are affluent, however, the number of installed PVs is significantly higher when the PV installation costs are reduced. However, the most advantageous variant is, again, linked to the trust-based gamification approach. Thus, it is possible to get the most significant number of installed panels with, similarly to the model city, a significant increase in the level of citizens’ trust and stimulation of the residents’ activity and social development. Spatial distribution (
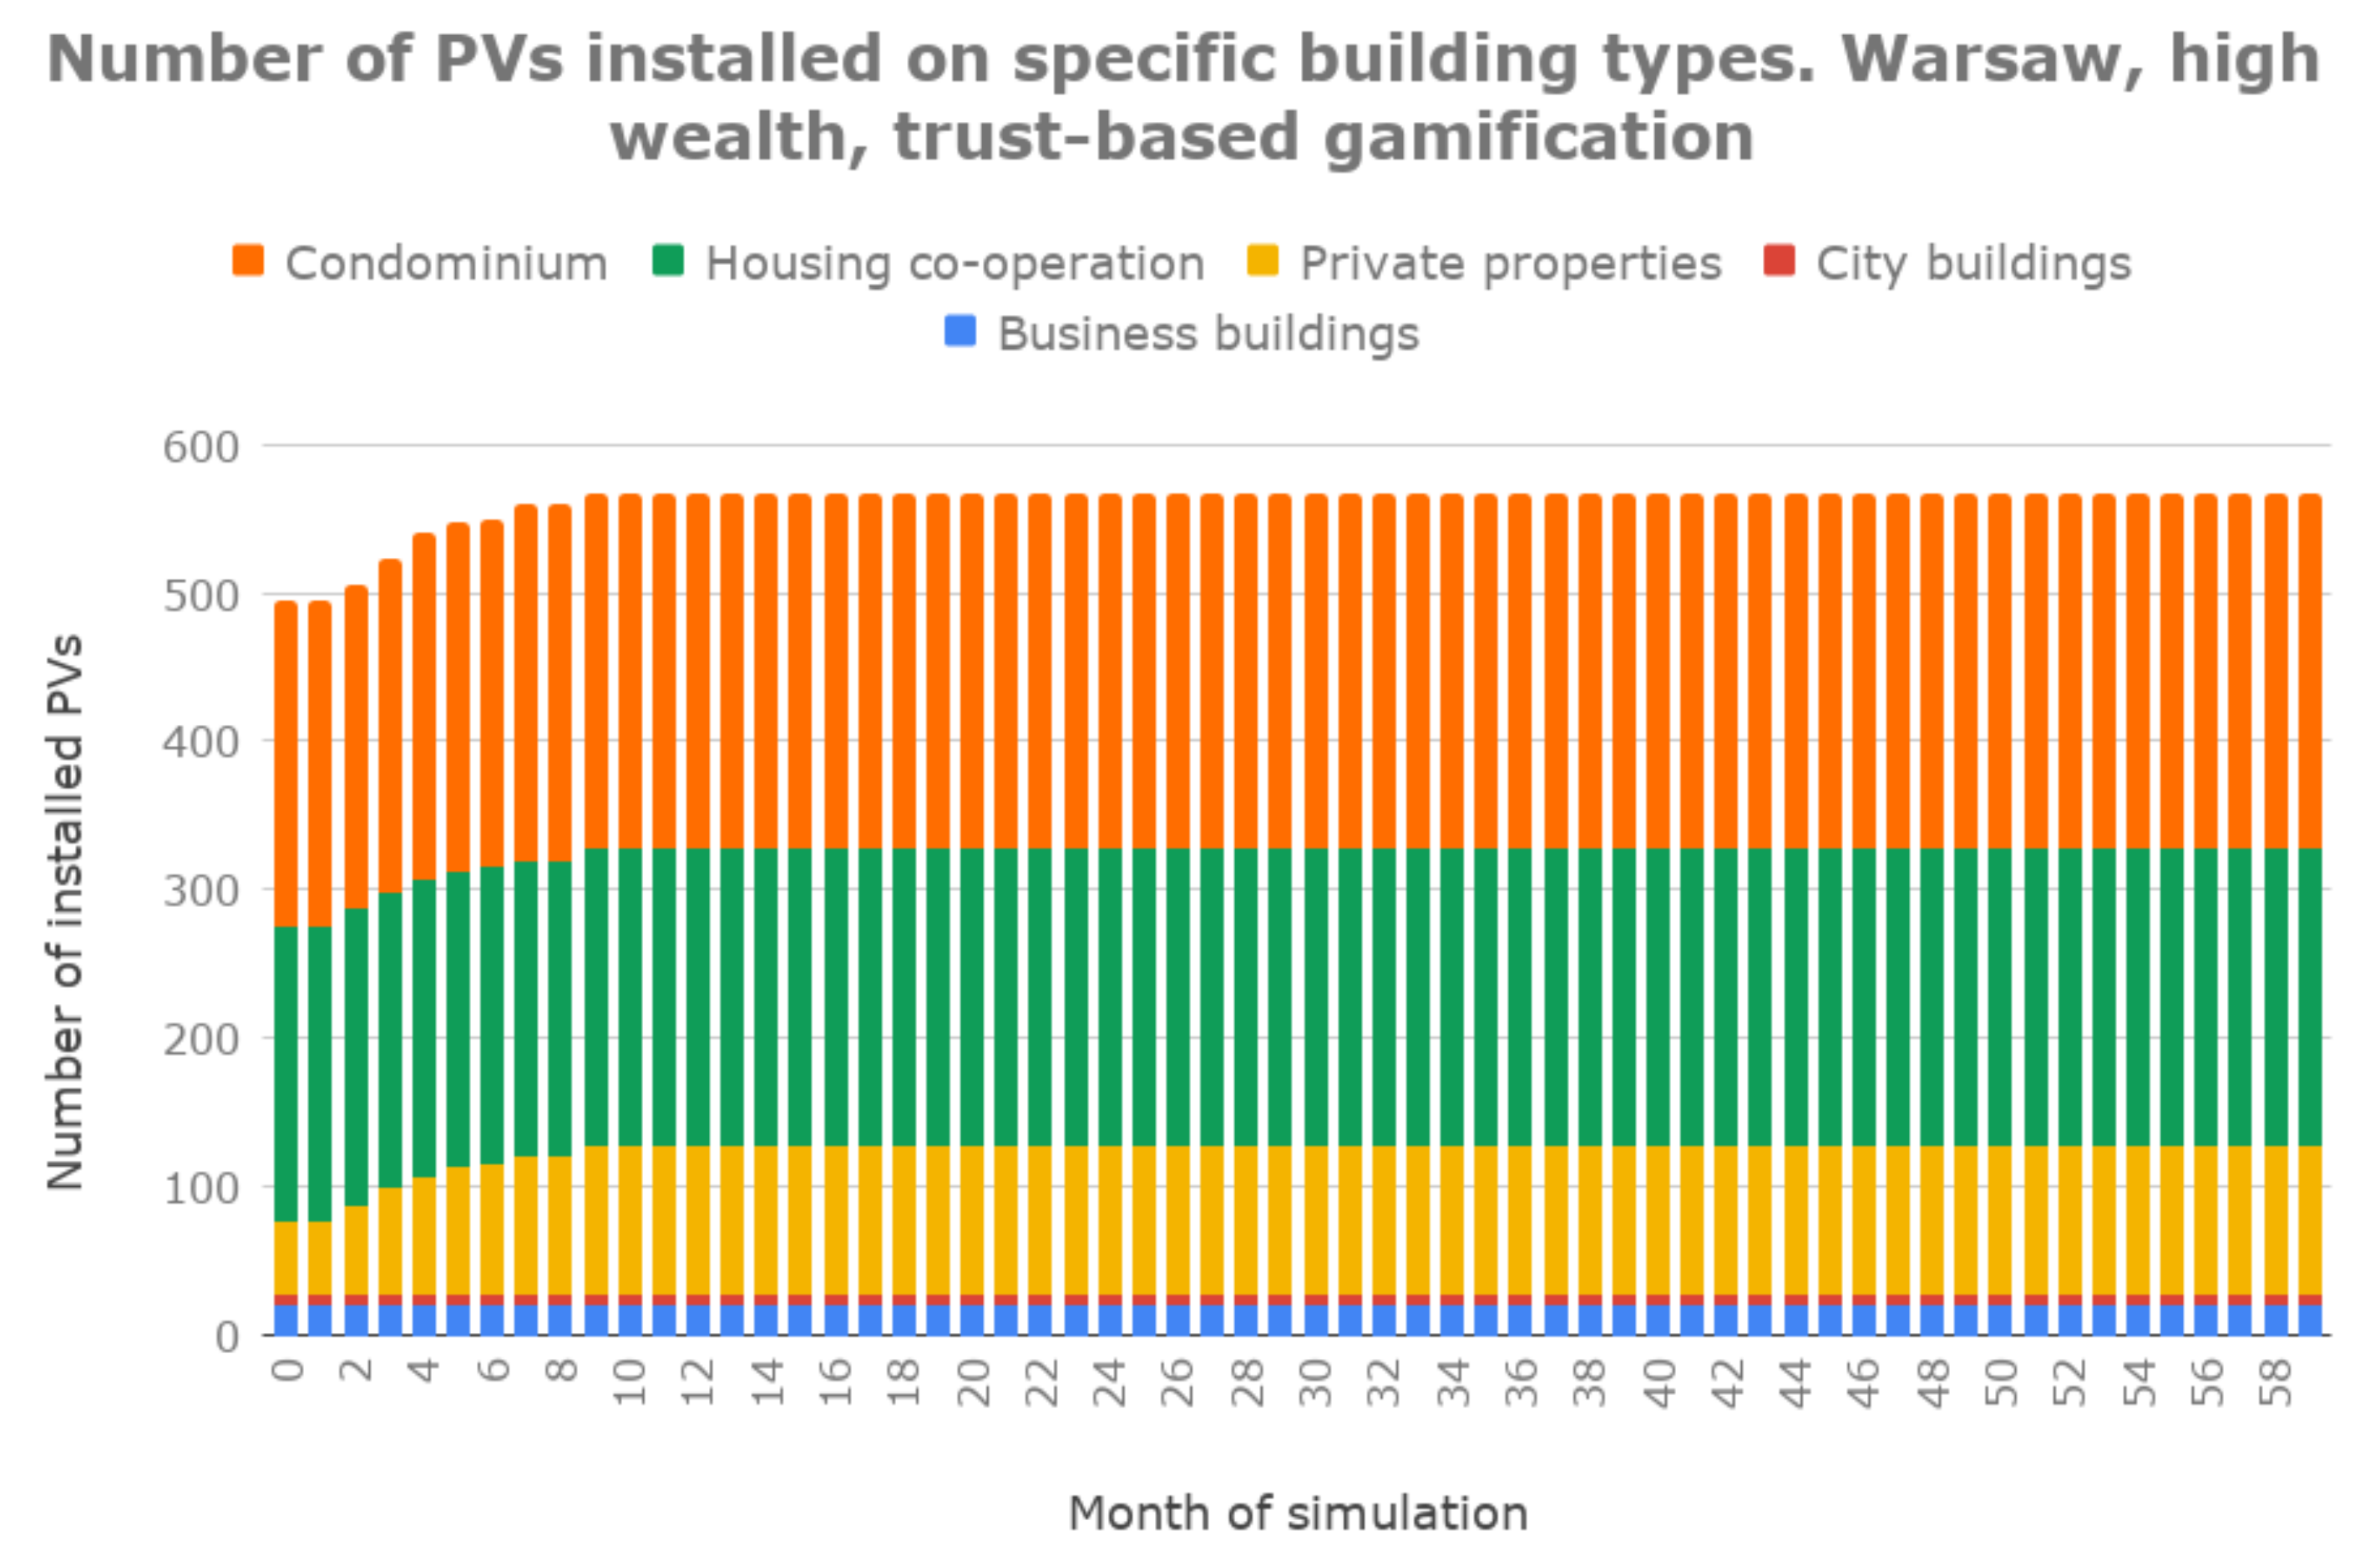
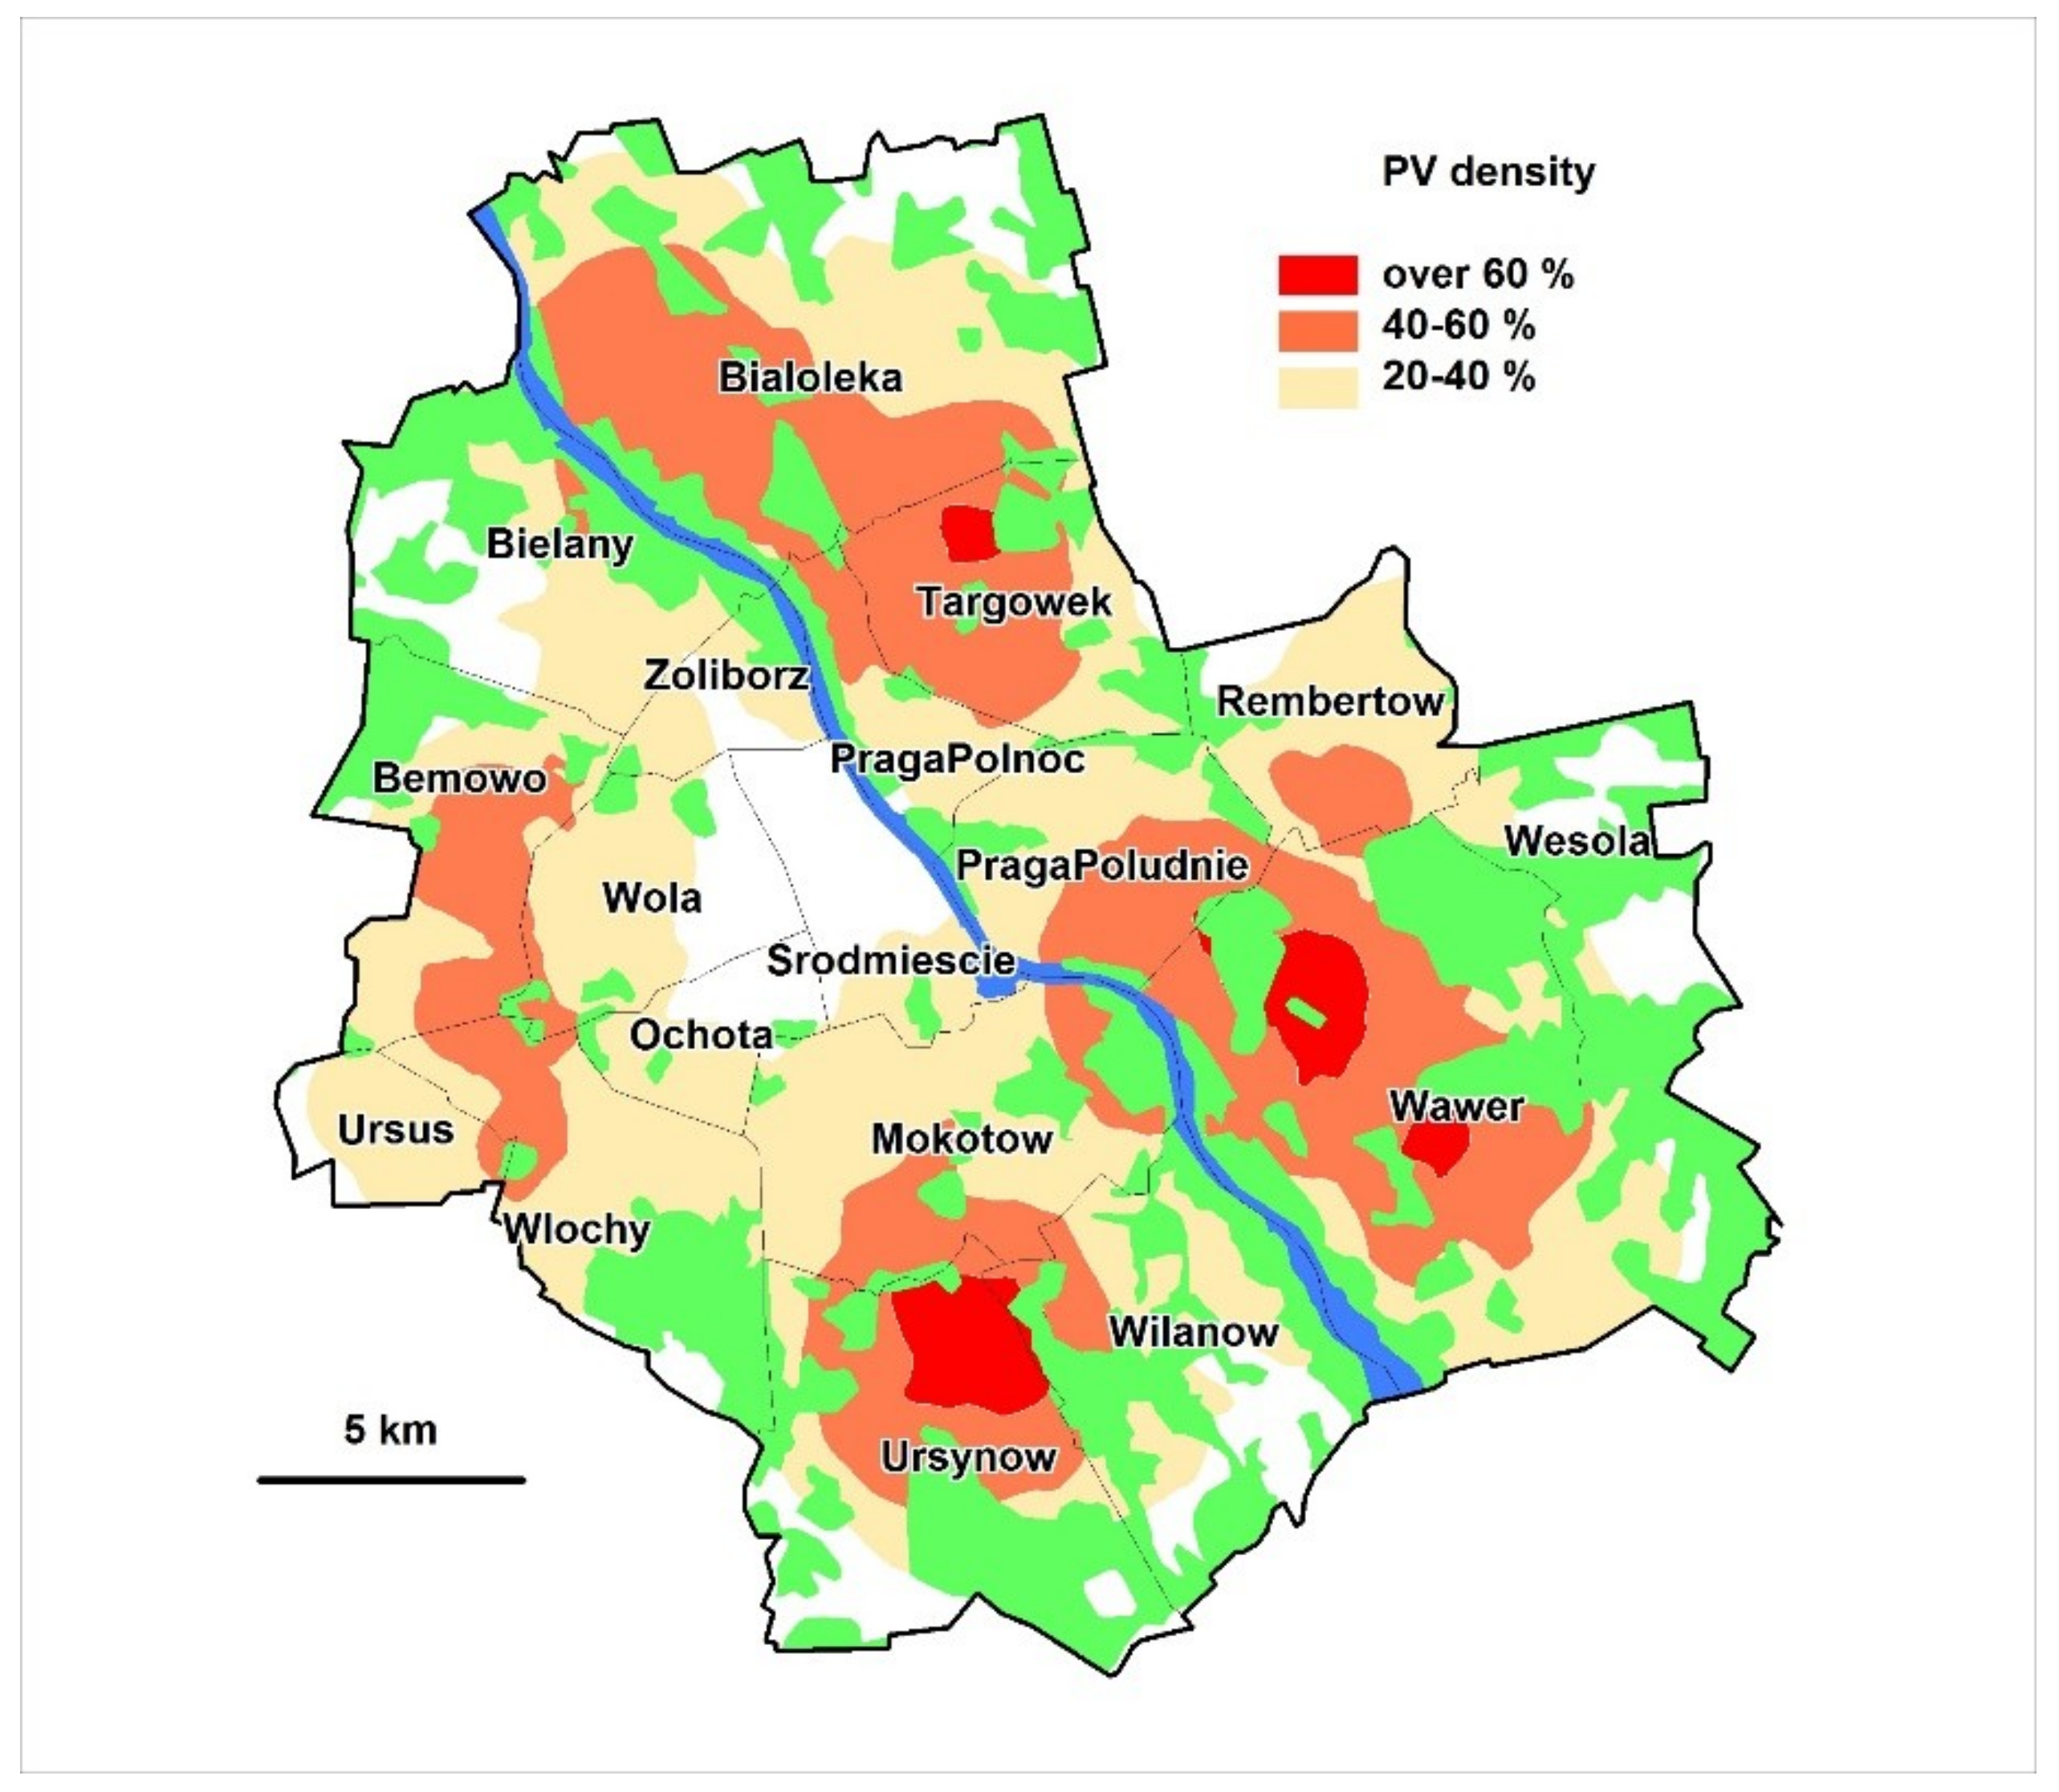
Figure 12 and
Figure 13) of the obtained results indicates that the projected increase in the number of panels affects privately owned properties, as well as housing co-operatives and condominiums. By applying this approach, it is also possible to increase installation of PVs on company-owned structures—both factories and office buildings.
However, when analyzing the results, one should consider that because of the generalization of source data (both topo- and demographic), the level of generalization of the conducted analysis is also very high. Because each agent represents 1000 residents, any numerical scaling of the obtained results is difficult; many factors considered in the analysis are nonlinear. Since simulation using data made more accurate by two orders of magnitude, was not, due to computation-related reasons, possible for the whole of Warsaw, we decided to carry out this analysis for a selected district of the city.
4.2. Simulations for Wawer District
A collection of source data with a much higher level of accuracy was necessary to conduct trial tests for the Wawer district. In the conducted research, the Topographic Objects Database [Baza Danych Obiektów Topograficznych, BDOT 10 k] was used, with 1:10,000 level of detail of the topographical map. In this database, every building is modelled along with precise information regarding the surface and shape of the roof, as well as a detailed road network. It is also possible to allocate the number of residents to individual structures, based on data from the census collected by Poland Statistics [Główny Urząd Statystyczny]. Utilizing the data obtained from the City Hall and the GIS tools, 138 objects with an installed panel located in the Wawer district were assigned a spatial location (
Figure 14). The so-called solar map, made available on the official geoportal of the City of Warsaw, provided information on the PVs potential of roofs for all the buildings in Wawer. This form of research made it possible to assign 7500 agents to 75,000 residents of the district. On the one hand, this approach requires considerable computing power (converting one model takes several days); yet on the other, it greatly facilitates the direct interpretation of results.
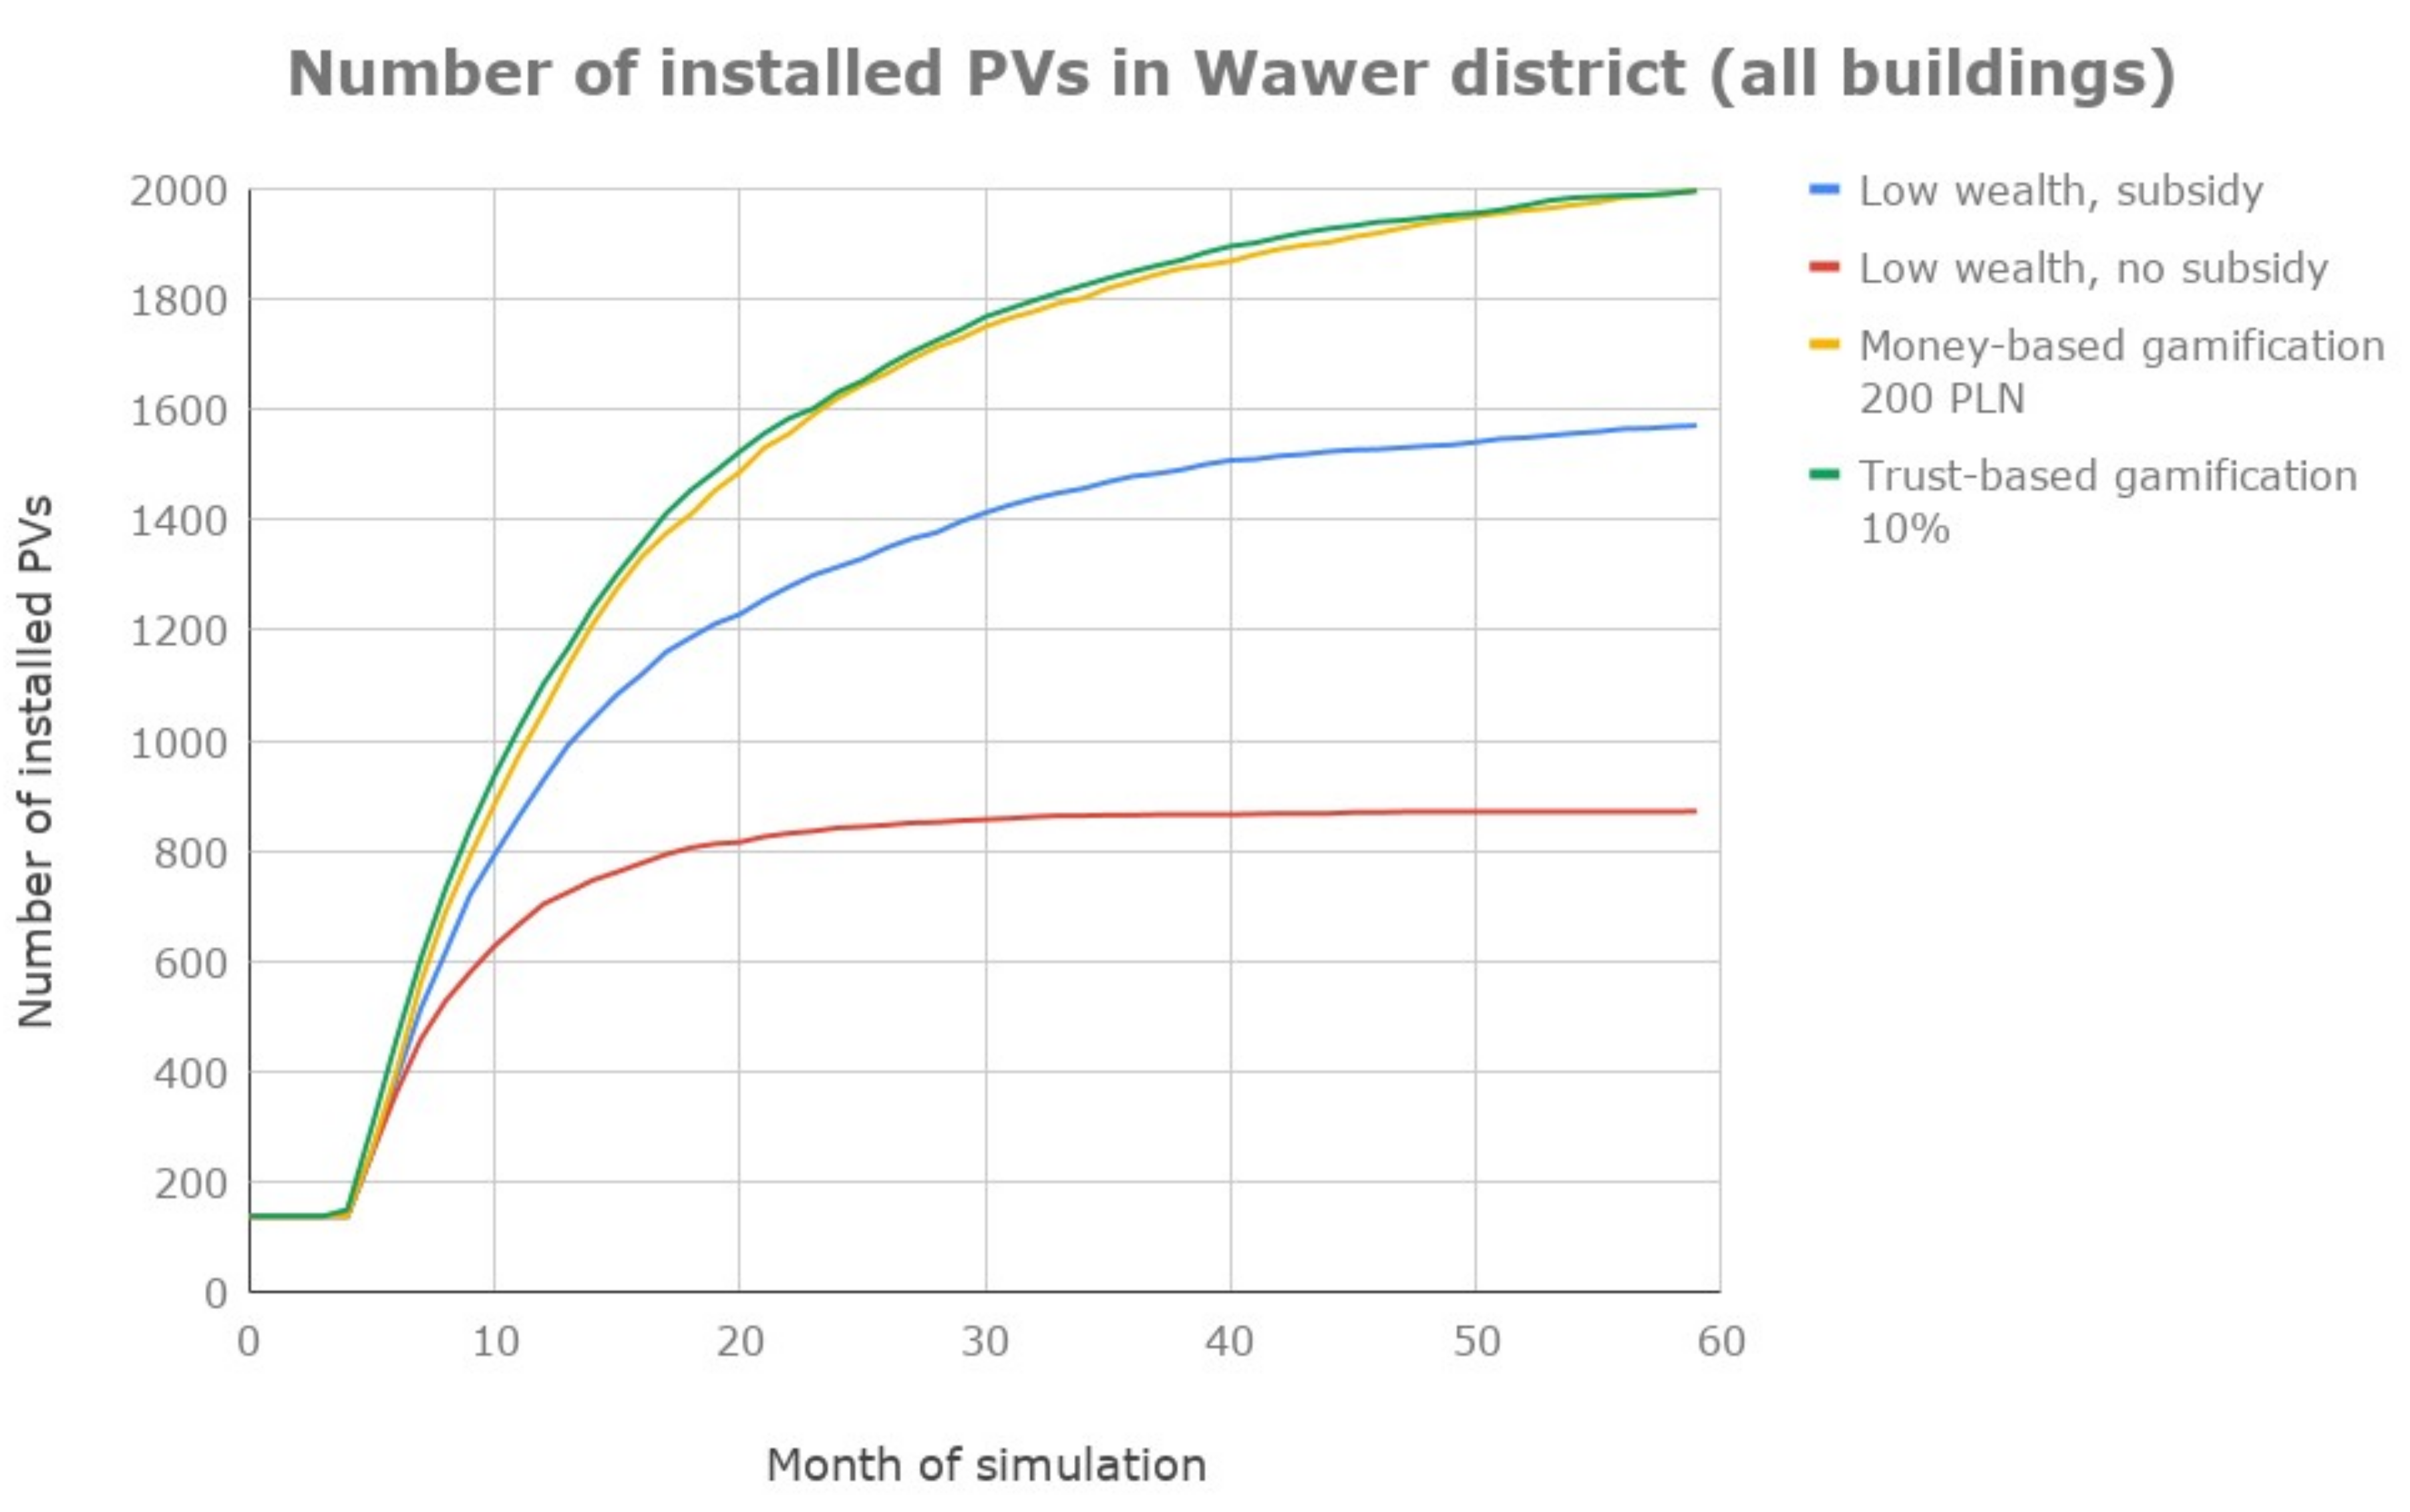
The conducted research has shown that applying the trust-based gamification approach would result in an almost 15-times higher number of PVs being installed in the Wawer district within five years (
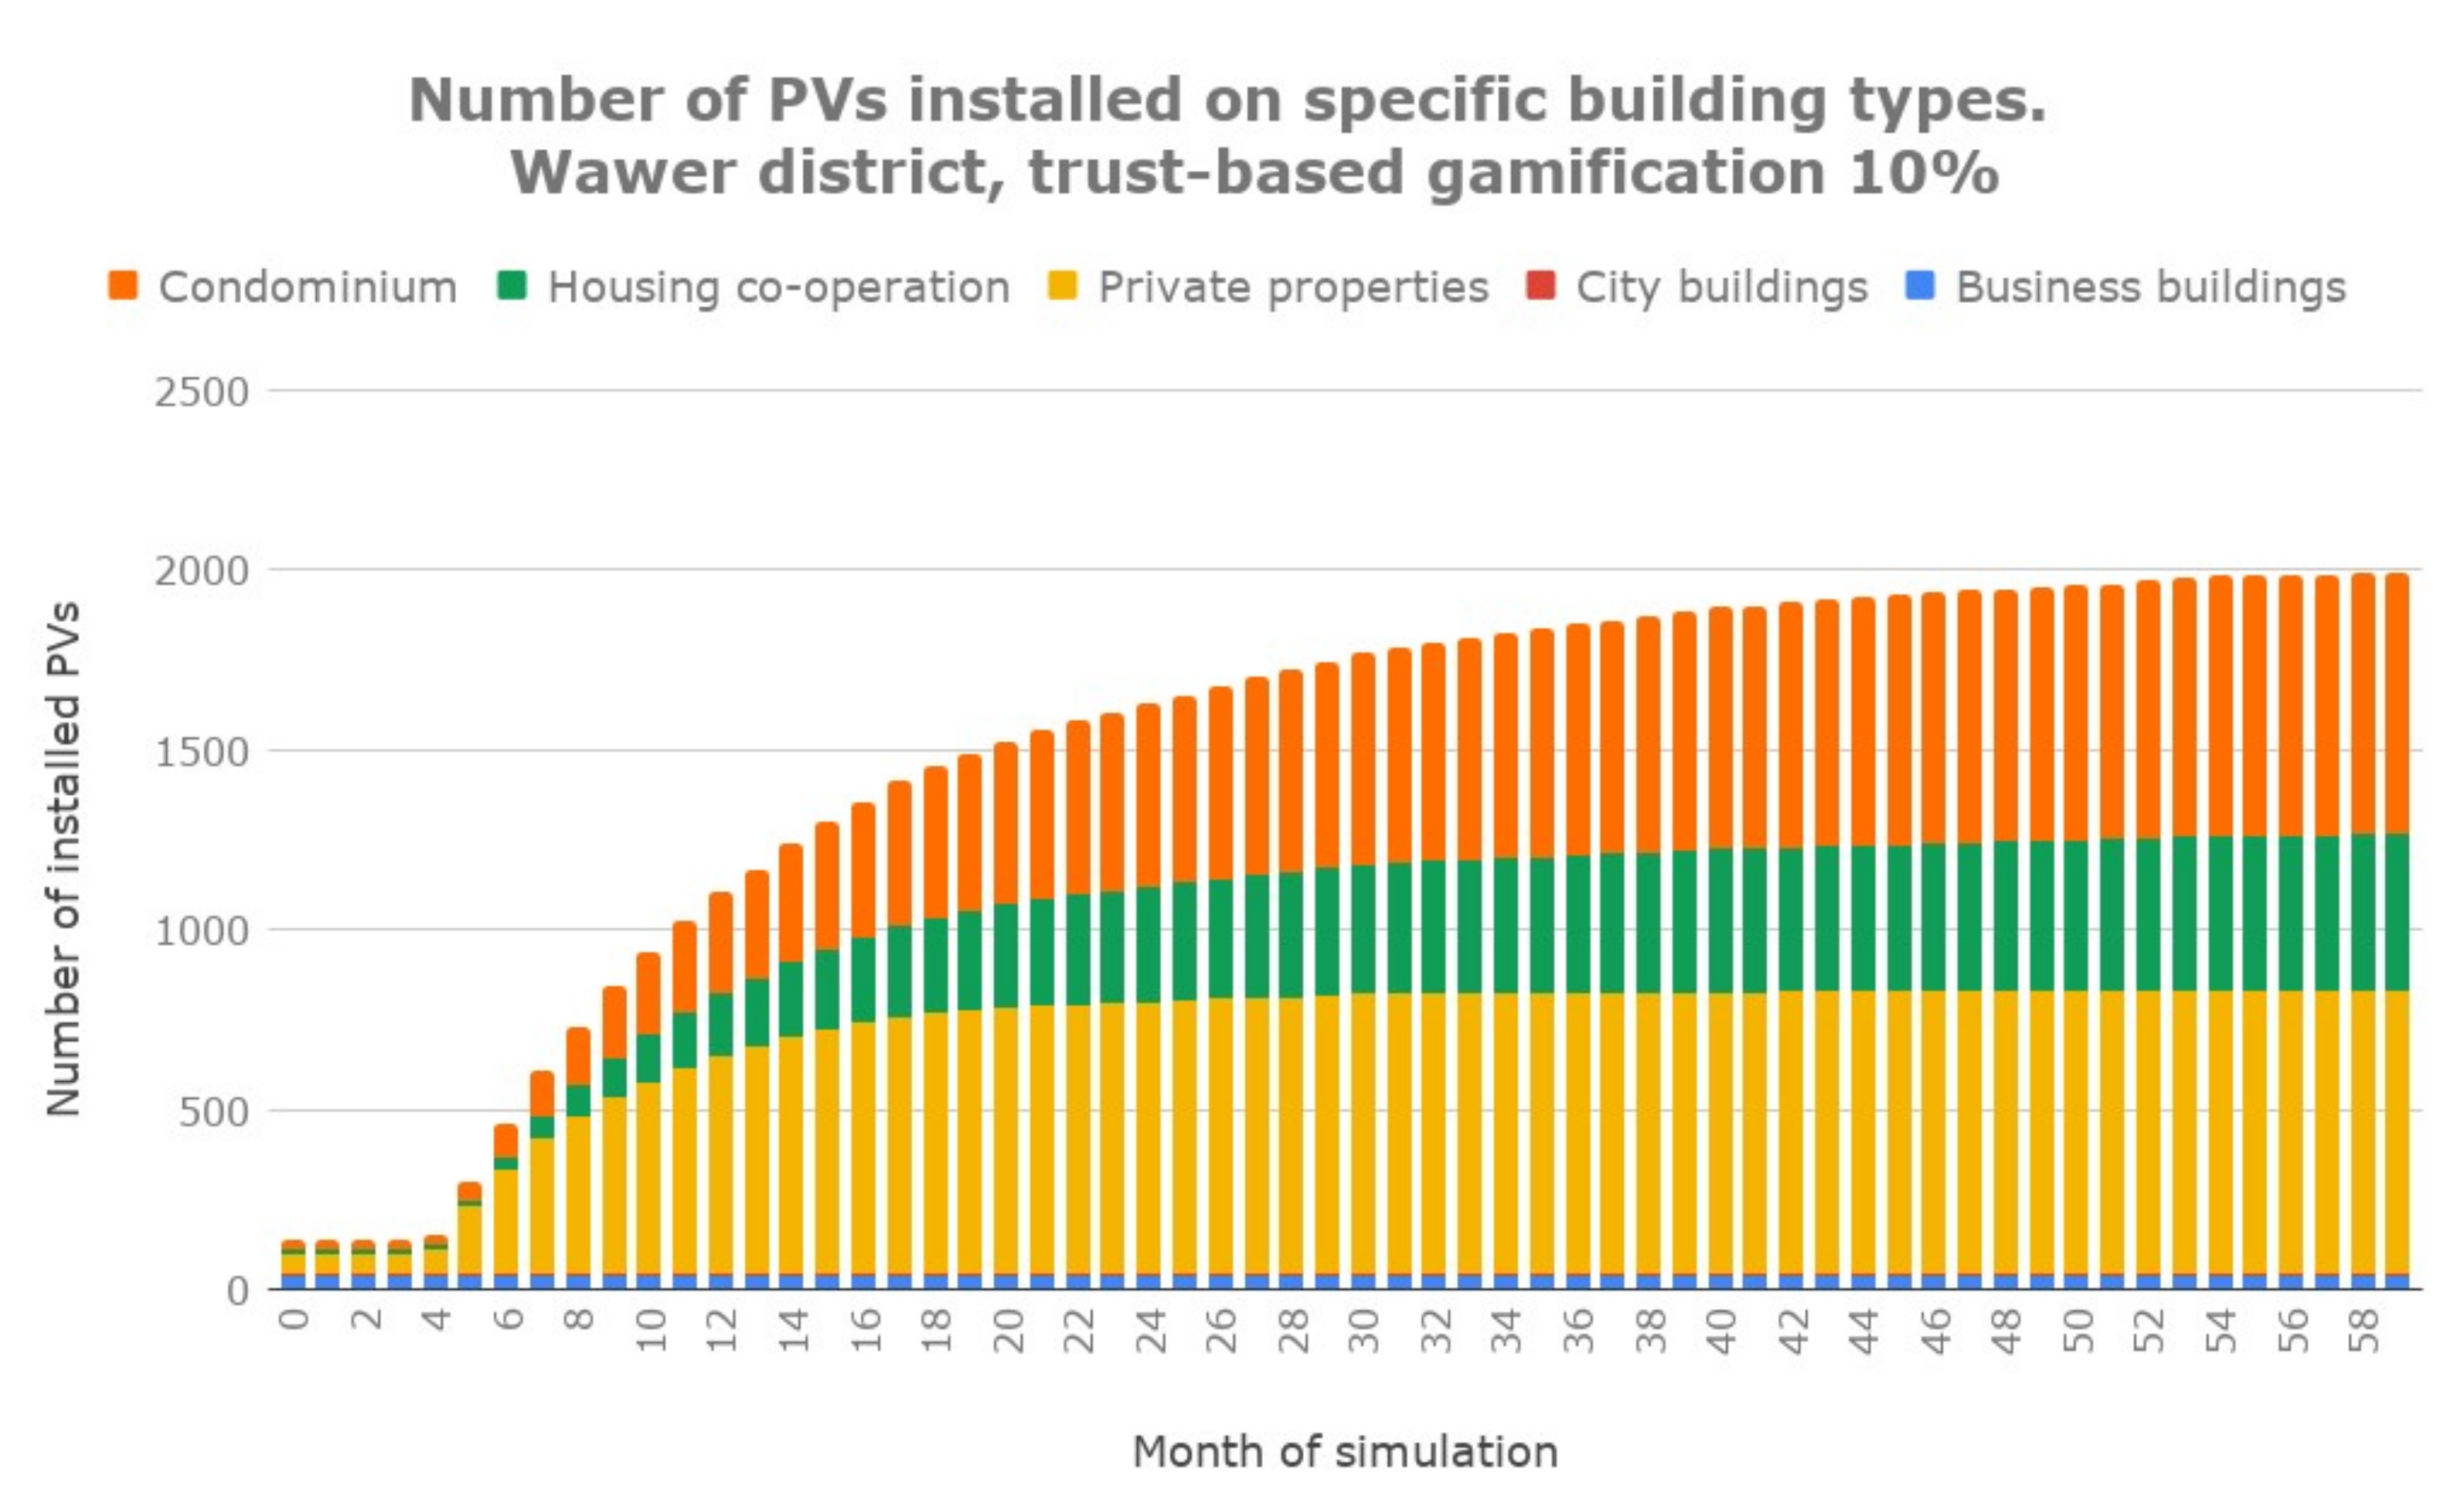
Figure 15). Moreover, this approach would encourage the engagement of the owners of private properties, as well as those living in condominiums and housing co-operatives (
Figure 16). As the spatial distribution of the obtained results indicates (
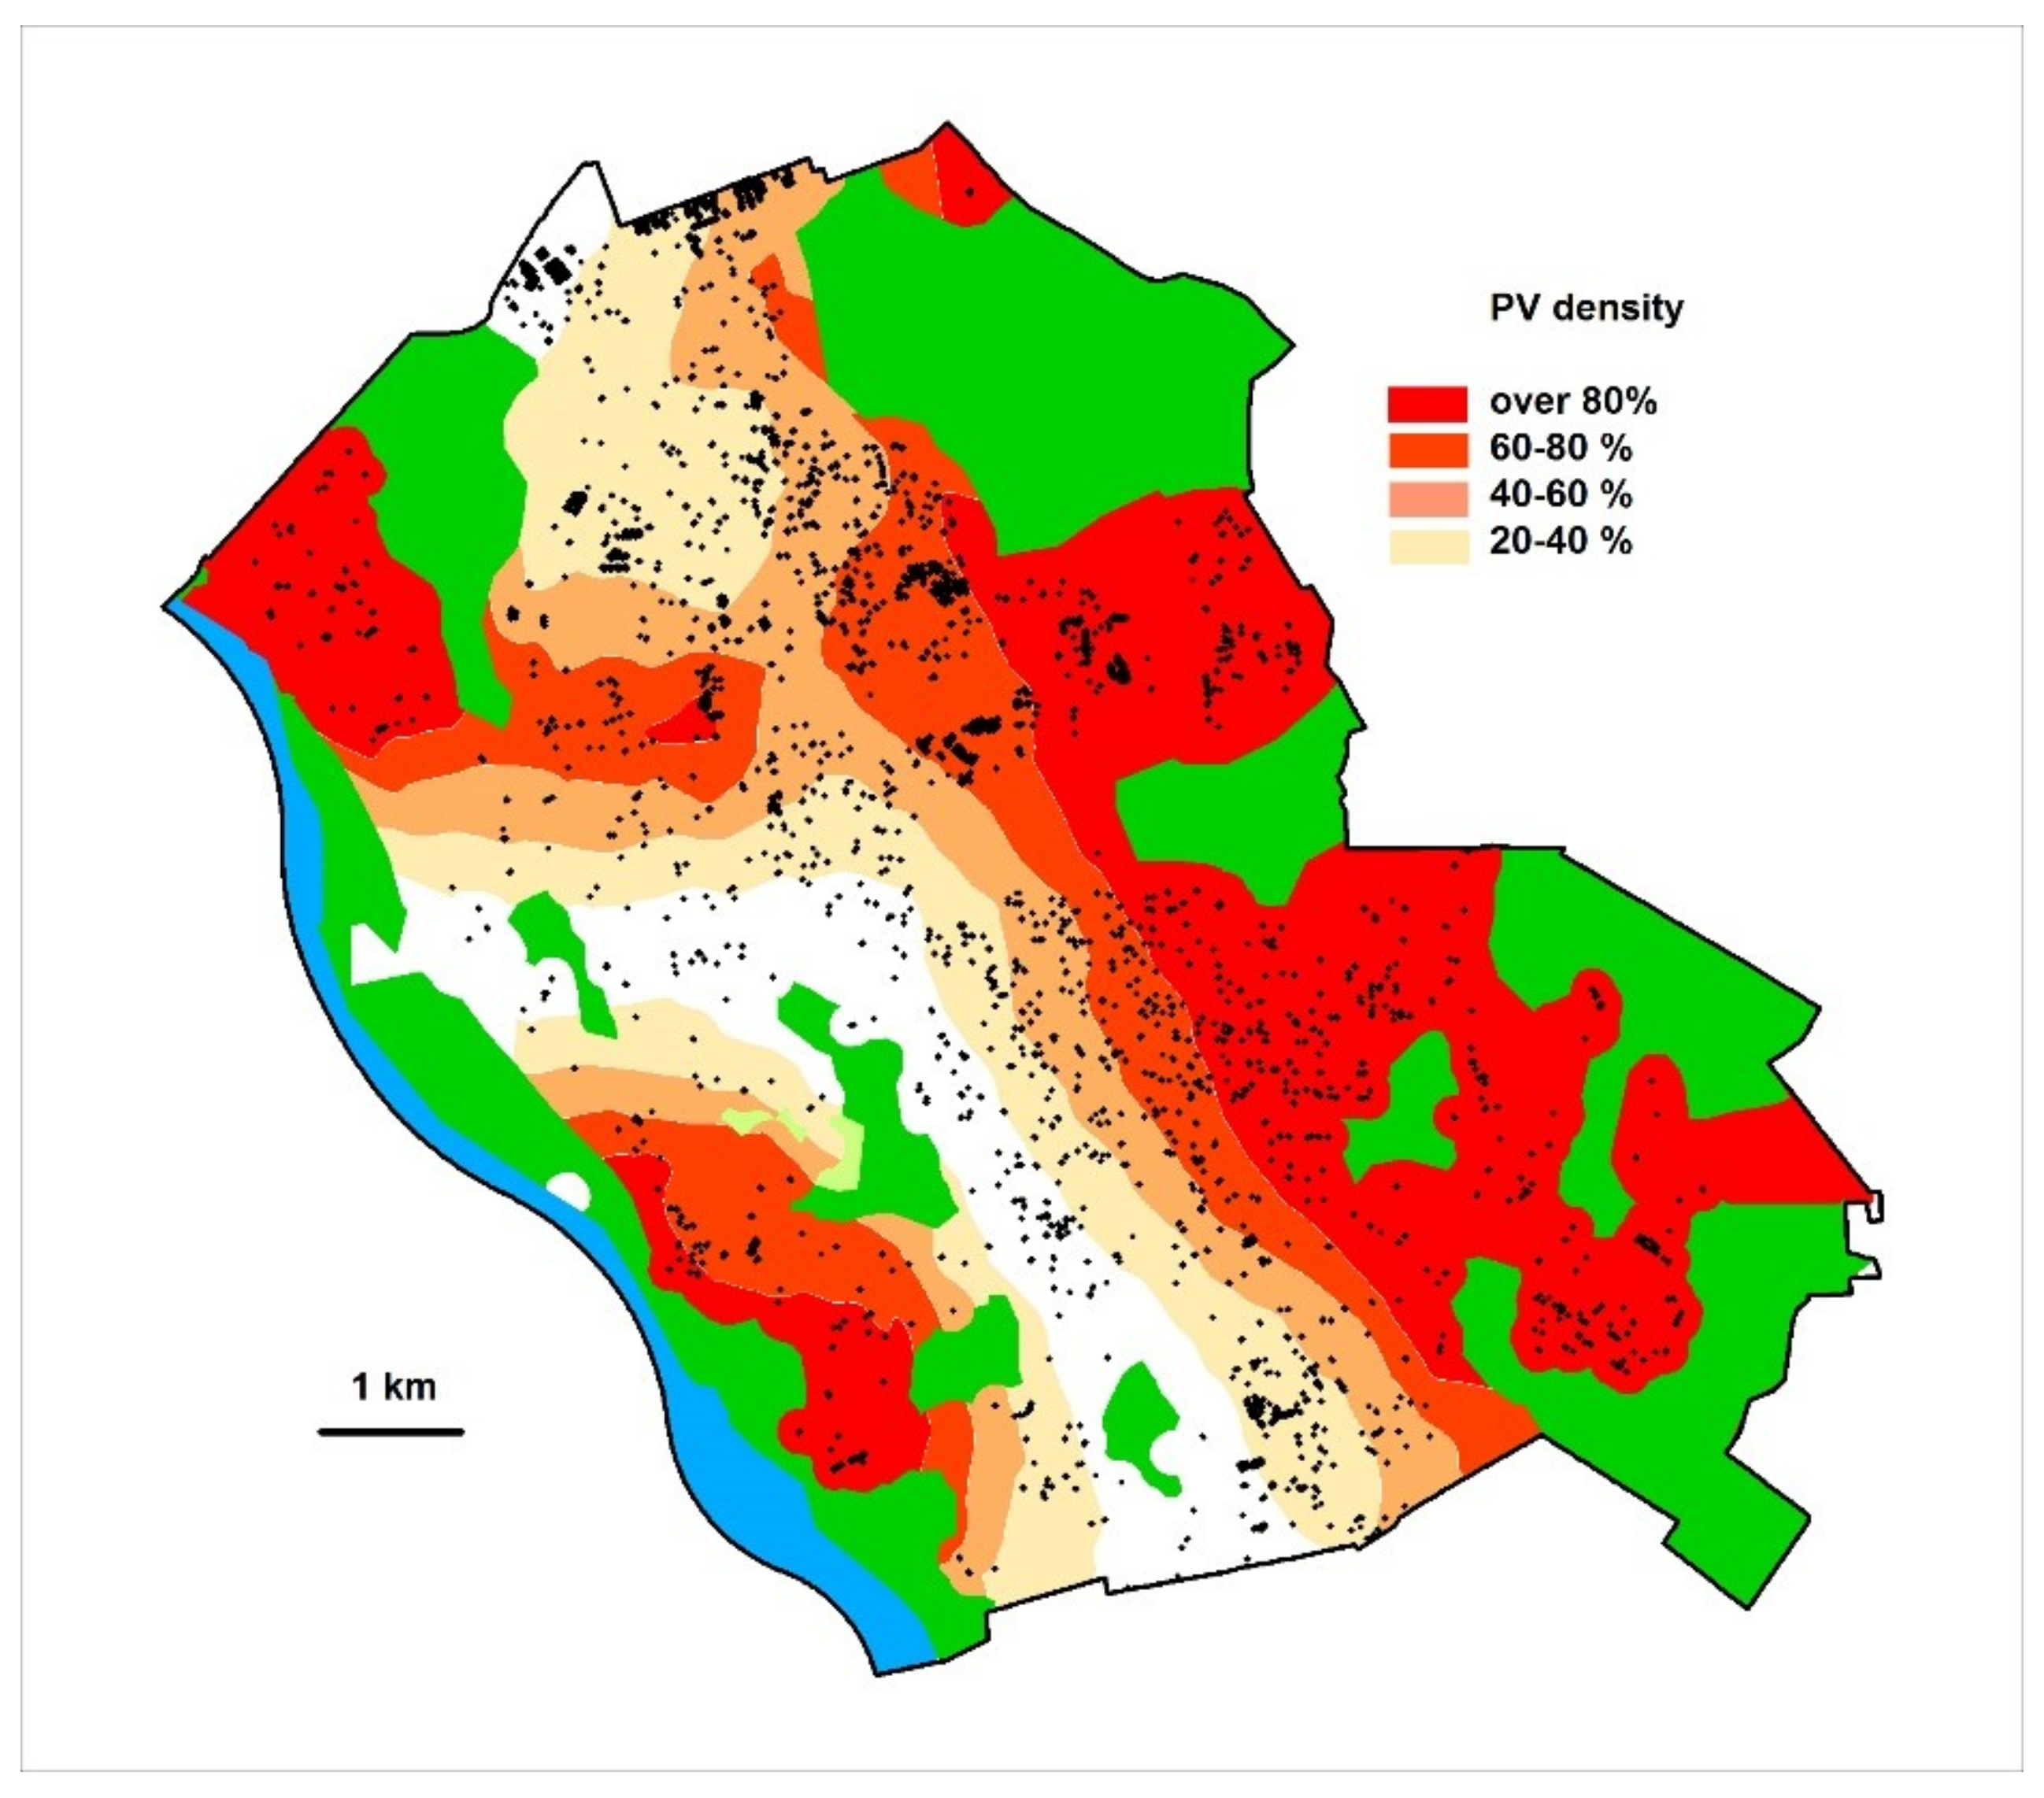
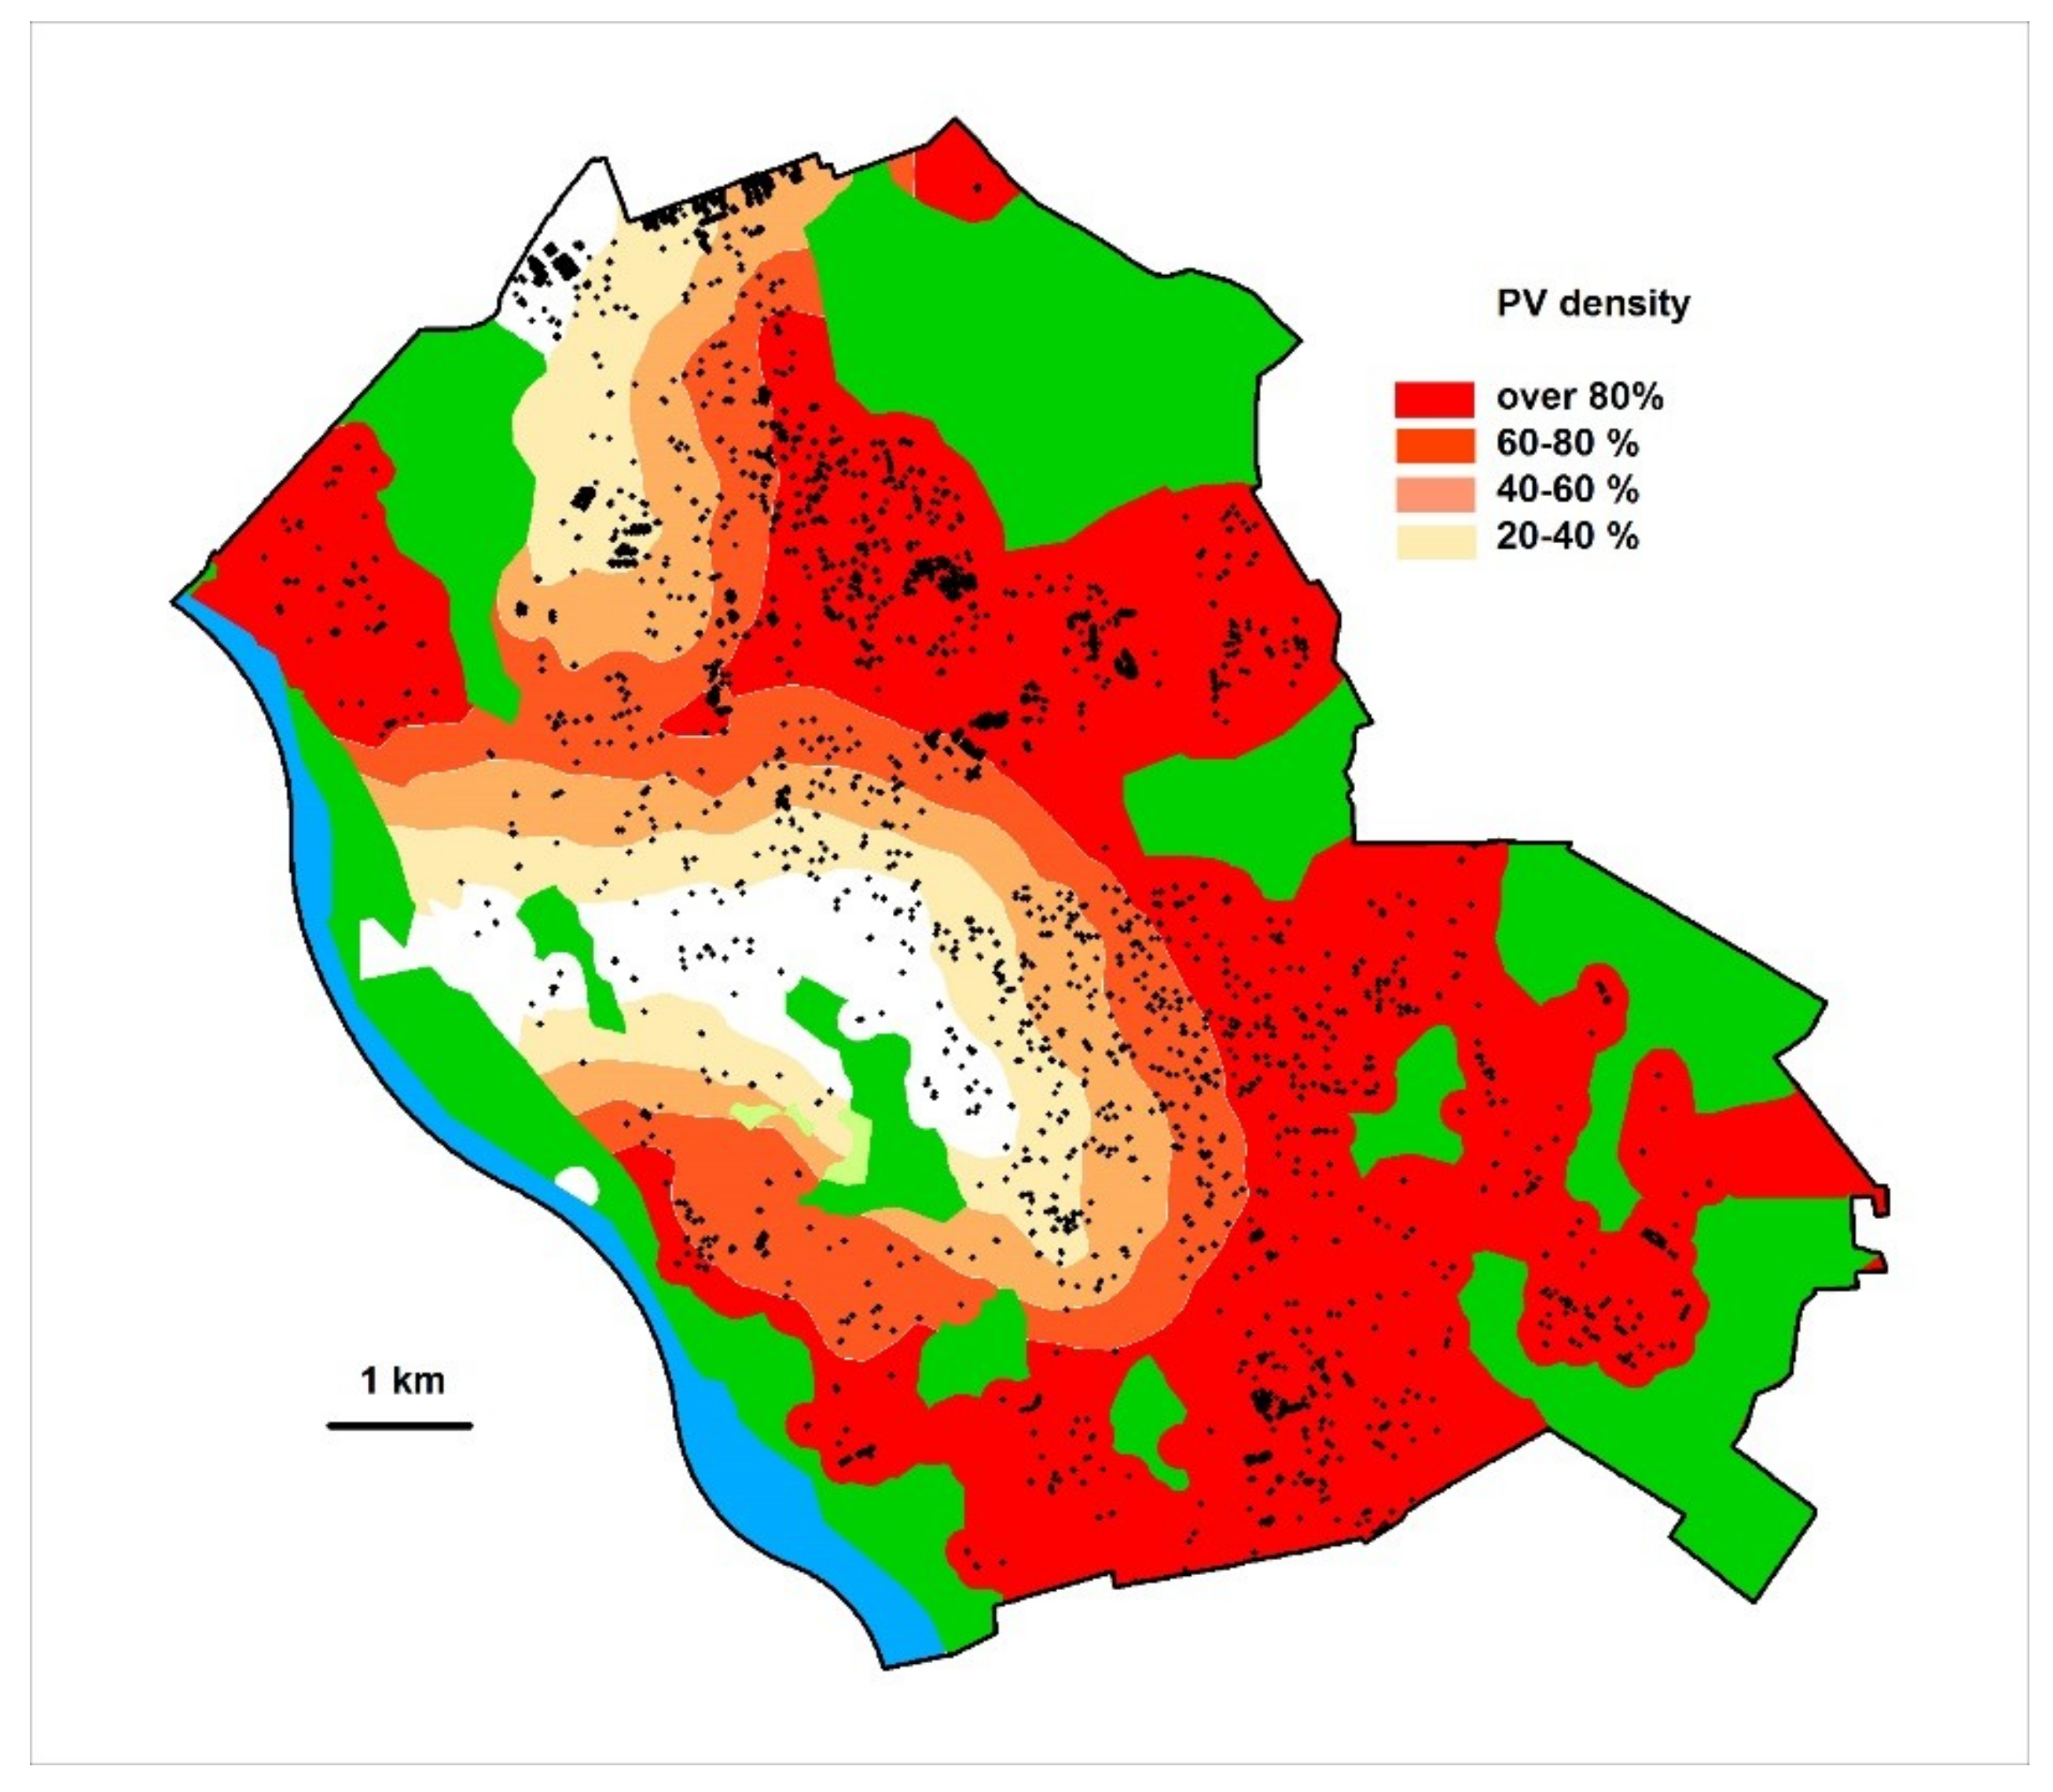
Figure 17 and
Figure 18), almost 80% of the Wawer district would be "saturated" with PV installations, far exceeding the 60% level. This is significantly more than using the base variant. What is also crucial is the potential of the generated extra electric energy and levels of avoided greenhouse gas emissions, especially carbon dioxide. The next paragraph deals with this issue in more detail.
The volume of produced electric energy obtained through PVs in a city and the reduction of CO2 emissions were estimated.
5. Discussion and Conclusions
The conducted research has shown that the use of gamification methods allows for much more effective stimulation in the field of PV installations than simple quota subsidies. It is important to compare the results of this methodology with analogous activities carried out in various countries around the world. Several attempts to predict solar PV installations in residential areas have been made. Kwan investigated the influence of different variables on the distribution of residential solar PV in the US with the use of ZIP code level data. Four groups of variables were studied: Environmental (average annual solar radiation data), social (race, age, education, housing density, and the urbanization of the ZIP code), economic (the cost of electricity, average state solar PV incentives, the median household income, and median home value), and political (registered voter party affiliation and city membership of the ICLEI—’Local Governments for Sustainability’ organization). We ran a zero-inflated negative binomial regression model to evaluate the influence of selected variables. This allowed us to select (using partial correlation coefficient) the most important parameters for the model. The results of the model indicate that solar insolation, the cost of electricity, and the amount of available financial incentives are important factors influencing the adoption of residential solar PV arrays. The model also shows that strategic government intervention can also be an effective method of promoting solar PV installations [
26]. The prediction methodology proposed in the article does not exhaust all analytical possibilities. It is possible to take into account more parameters (e.g., demographic, spatial, etc.), as well as other methods of predicting the increase in the number of solar panels in the city. However, the proposed approach is easy to parameterize and can be extended with additional elements.
With the use of regression analysis, Li and Yi evaluated the relative effectiveness of state and local policy tools in stimulating solar PV installations, with an emphasis on local solar policies. The results of analyzes showed that cities with local financial incentives deploy 69% more solar PV capacities than in cities where such polices do not exist [
27].
Cities are now undergoing a rapid and often uncontrolled process of urbanization. They contribute to global climate change by emitting the majority of anthropogenic greenhouse gases. Therefore, it is crucial to study the establishment of sustainable energy systems, which reduce consumption, providing reliable, decentralized, and renewable sources. It is widely acknowledged that access to modern energy plays an essential role in encouraging sustainable urban development, as well as reducing poverty and controlling environmental degradation. In Poland however, there are still no incentives to engage residents to use renewable energy sources (here: PVs), nor are there any incentives to innovate.
The developed methodology has made it possible to conduct a multifaceted simulation of social behaviors targeting the installation of PVs. This, in turn, contributes to sustainable development by limiting the adverse impacts of urbanization on the environment and improving, overall, residents’ quality of life. The social impact models and the methods of stimulation by local authorities that we propose indicate that using gamification methods is one of the most effective approaches. It should be said that trust-based gamification is much more valuable (both from an economic and social point of view) than money-based gamification. Not only does it not lead to a side effect, but it also ensures the expanded development of the open information society. According to the conducted research, trust-based gamification not only achieves a high growth rate in the number of panels (up to 15-fold over a five-year period), but also enables the development of social interactions, an increase of trust, and thus, contributes to social engagement in a smart city. Using the model proposed in this article will also mean it is possible to estimate both the power of energy generated from renewable sources and the amounts of CO2 emissions that have been curbed.
Spatial databases and quantitative models originating from applied social sciences made it possible to perform a multifaceted study of the methods of social stimulation aimed at implementing renewable energy sources to reduce the impact on the environment and to improve the quality of life in an urban environment. Taking a quantitative approach, this issue requires the development and analysis of the effectiveness of the computational applications connected to the utilization of the process of social gamification for the sustainable development of urban solutions, including the use of renewable energy sources. On the other hand, using a multi-agent system in which every agent represents a resident, characterized by a set of social attributes, makes it possible to simulate and analyze the social processes occurring in a city.
Based on the methodology developed, simulations were carried out for both Warsaw and the selected district of the city. The analyses performed for the Wawer district, resting on detailed topographical and demographic data, particularly enabled reliable estimation of the projected increase in the number of panels, energy production, and avoided CO2 emissions. This was possible due to the use of multi-agent systems, in which each agent represents only a few people and simulates their actions in a real urban environment, represented in the digital spatial database. Designed models and tested scenarios are critical to determine the real impact of adopting solutions to reduce the consumption of fossil primary energy carriers and, consequently, reduce the emission of atmospheric pollutants, especially CO2. The emission projections developed for “Polityka energetyczna Polski do 2040 roku” [The energy policy of Poland until 2040] were used to determine the amount of avoided CO2 emissions. The results of the calculations revealed that to reduce CO2 emissions, the trust-based gamification scenario was the most effective. Implementing the instruments of environmental policy proposed in this scenario would lead to a reduction in CO2 emissions for one of the districts of Warsaw.
In the research, the average values of the number of modules and the power of PVs were considered. However, actual roof surfaces, as well as real PV potential, and the number of residents were also considered. In further research, we plan to consider the different parameter sizes of PV installations, as well as a higher number of factors that could influence the decision-making of agents who represent the residents. The solution found is generic and parametrizable in many ways. Subsequent research will also aim to verify the developed methodology for other agglomerations with different urban, demographic, and economic conditions, as well as with a much more diversified PV potential.
Future work and further investigations will be focused on an in-depth analysis of various variants of stimulation of the panel installation process, with particular emphasis on trust-based gamification, as well as taking into account other demographic and social parameters of residents. The authors intend also to verify the model developed for Polish spatial, solar, demographic, cultural, and economic conditions on the example of other cities on different continents.


