Aligning Urban Policy with Climate Action in the Global South: Are Brazilian Cities Considering Climate Emergency in Local Planning Practice?


Abstract
:
1. Introduction
2. Materials and Methods
2.1. Case Study
2.2. Methodology and Data
3. Results
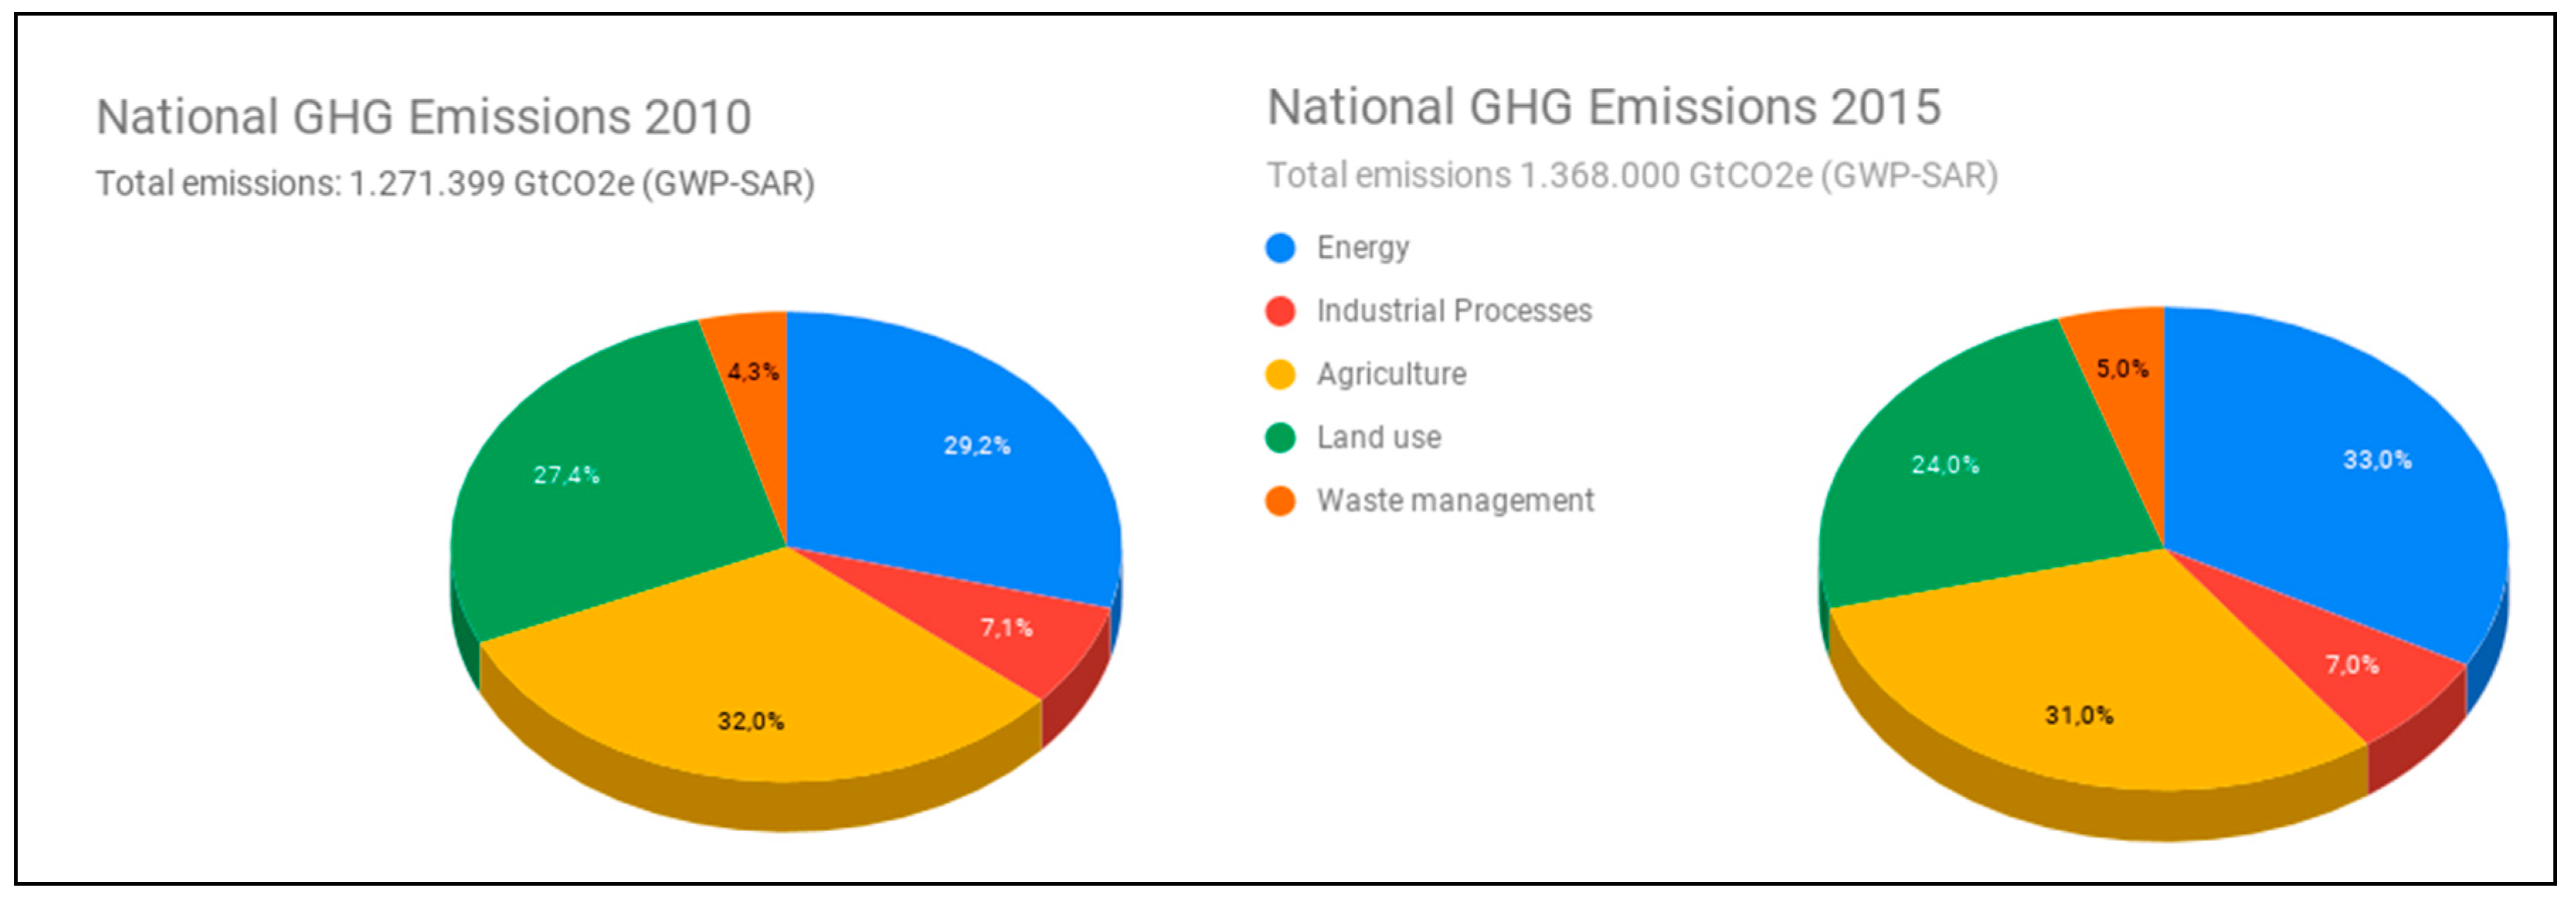
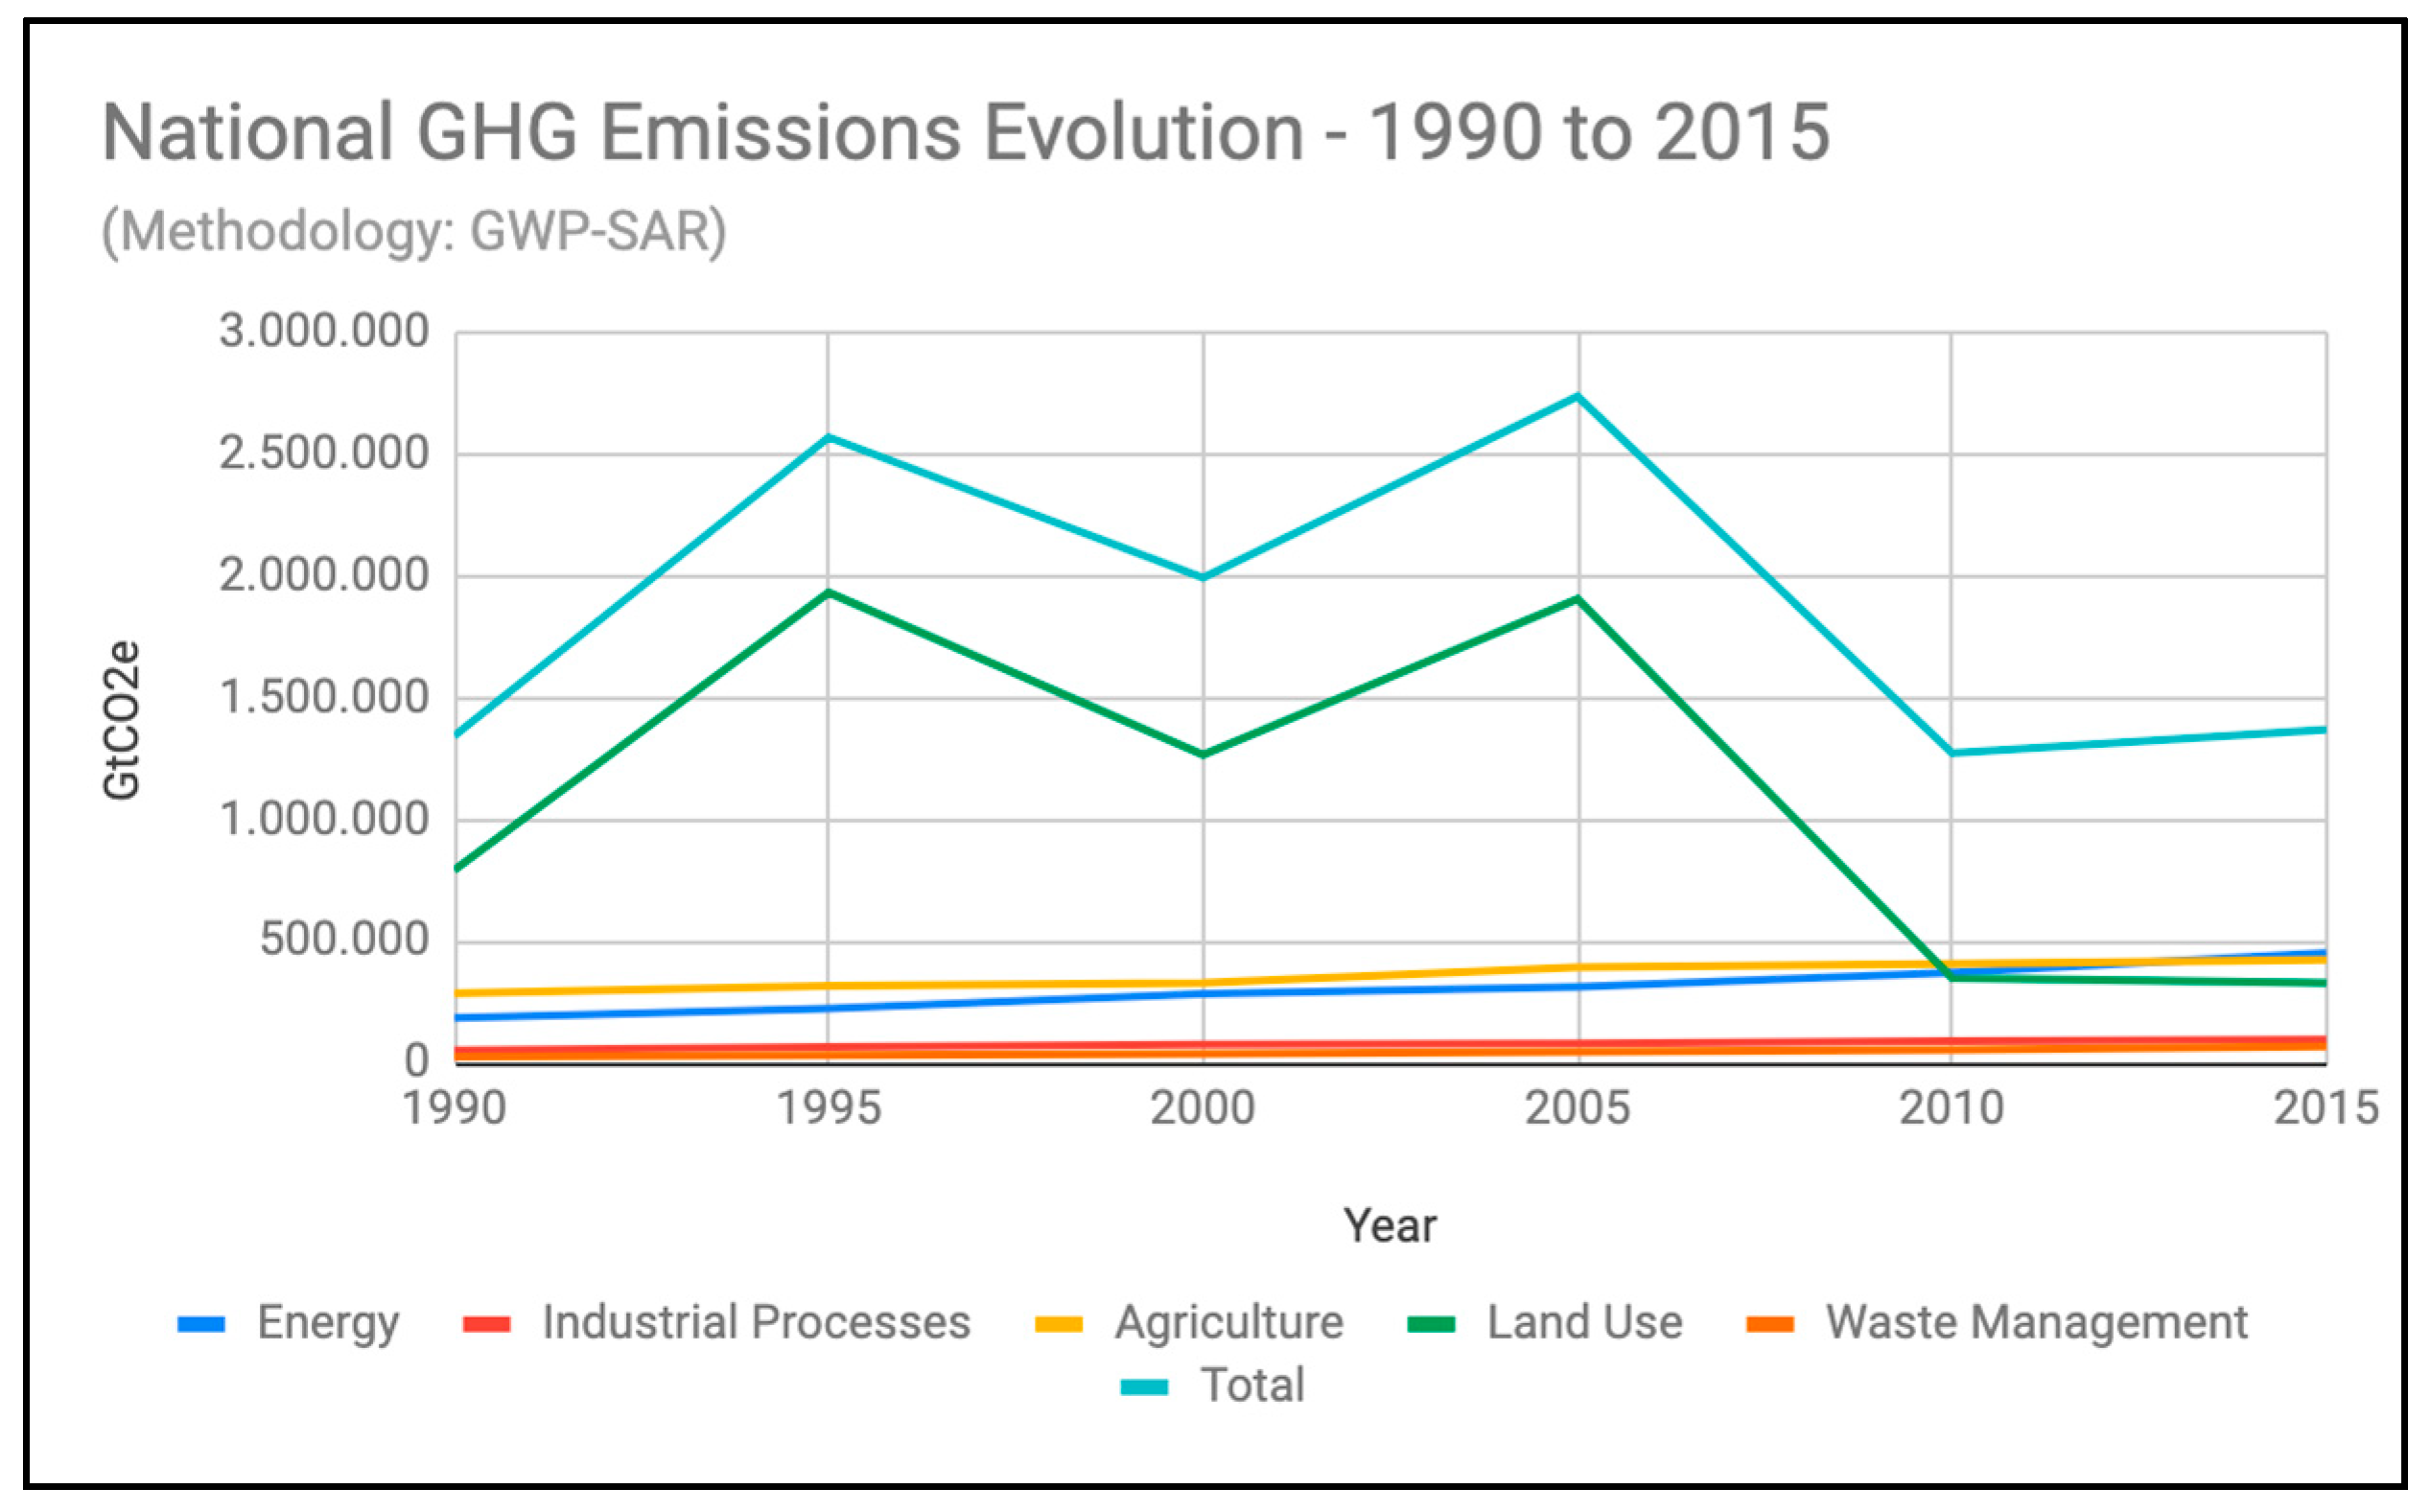
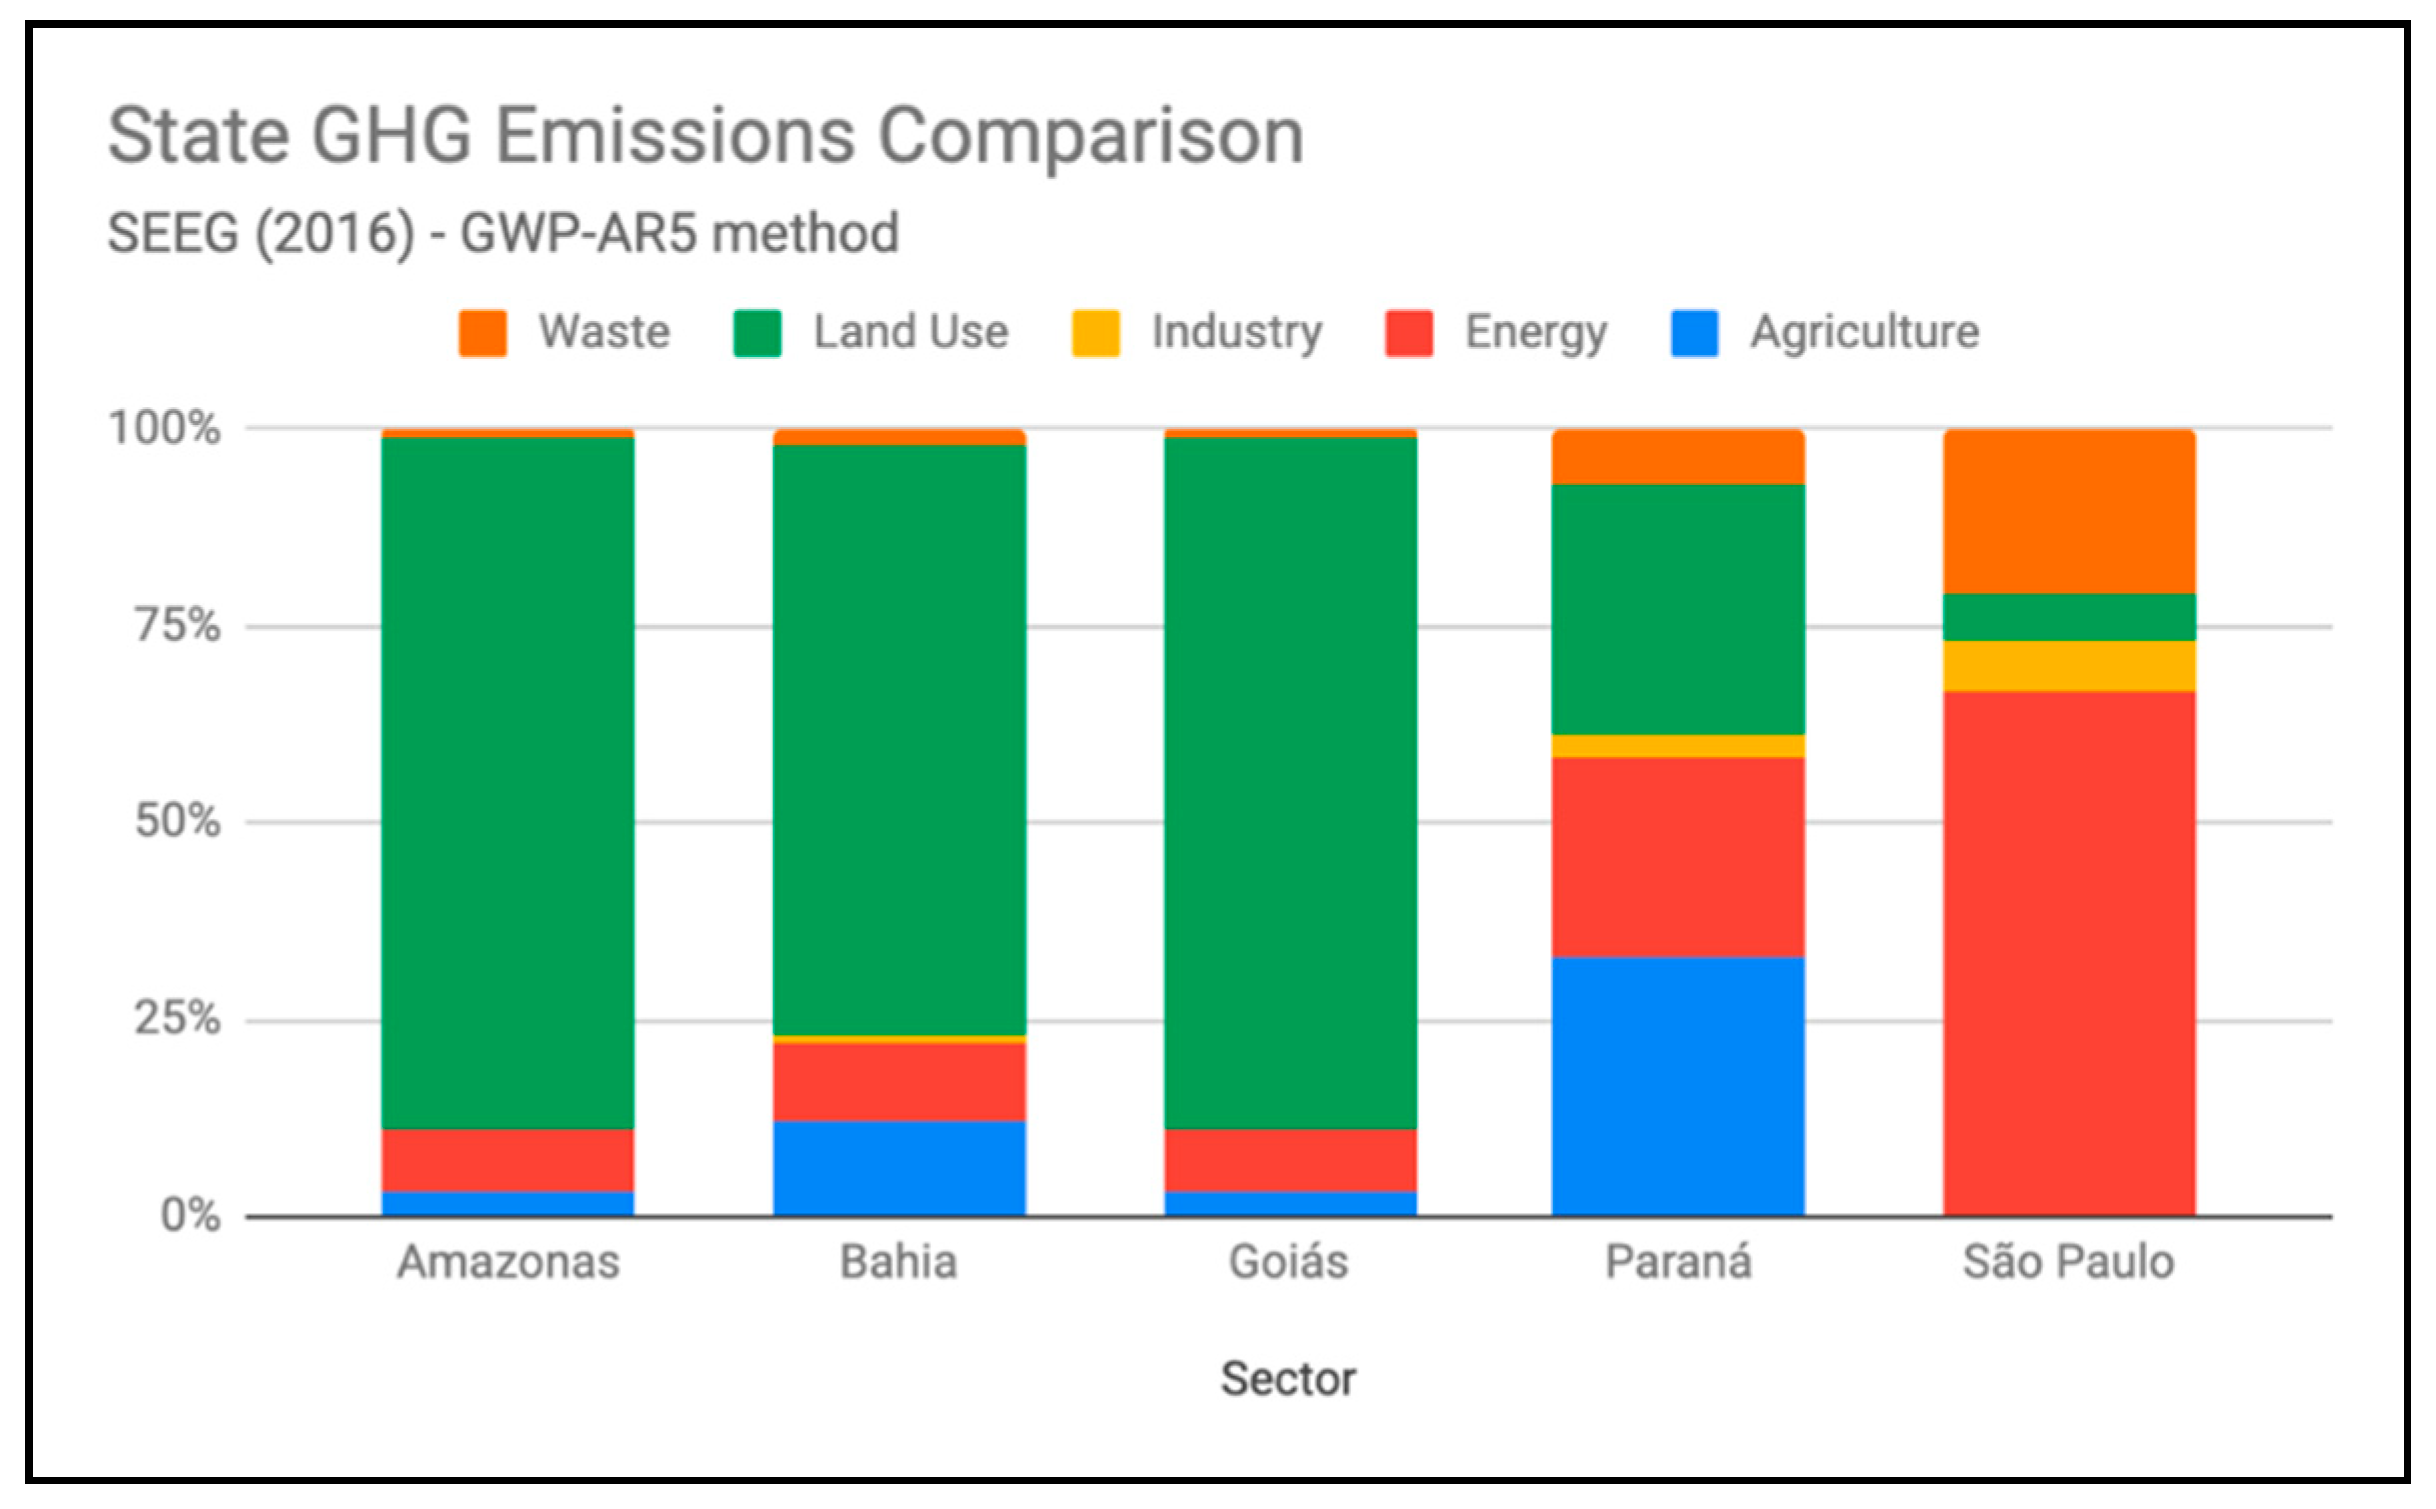
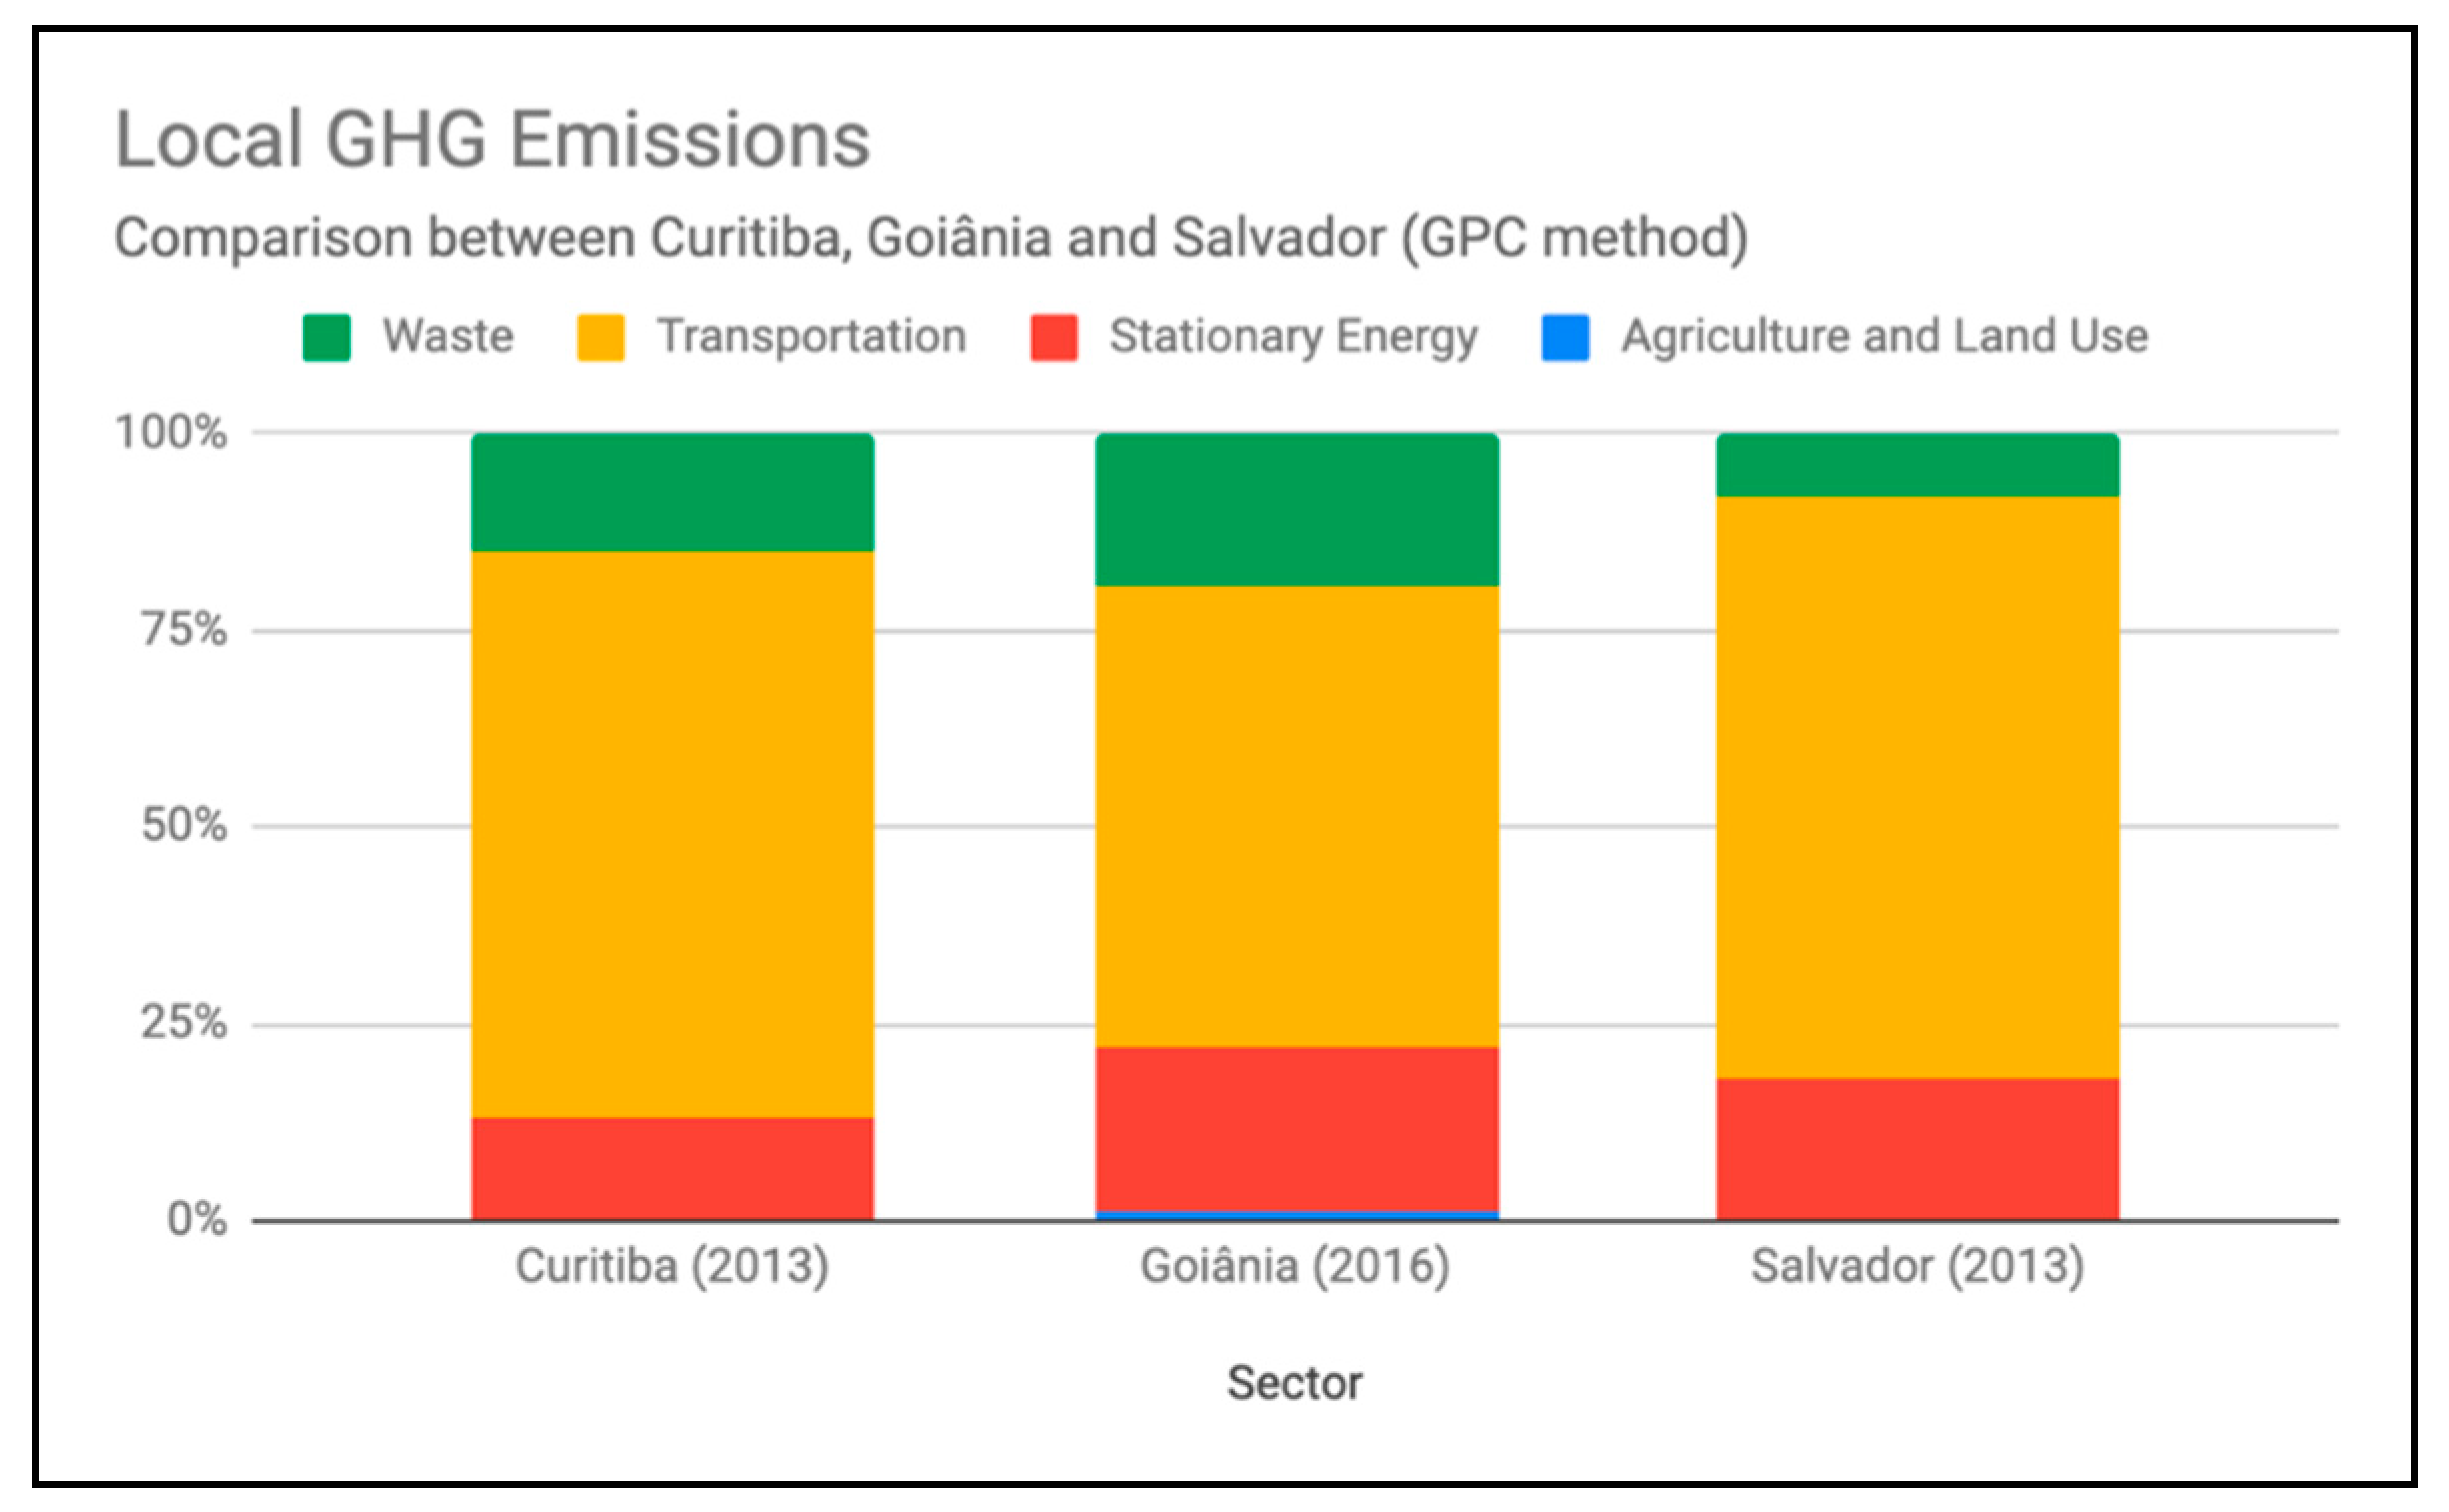
3.1. National, State, and Local GHG Emissions
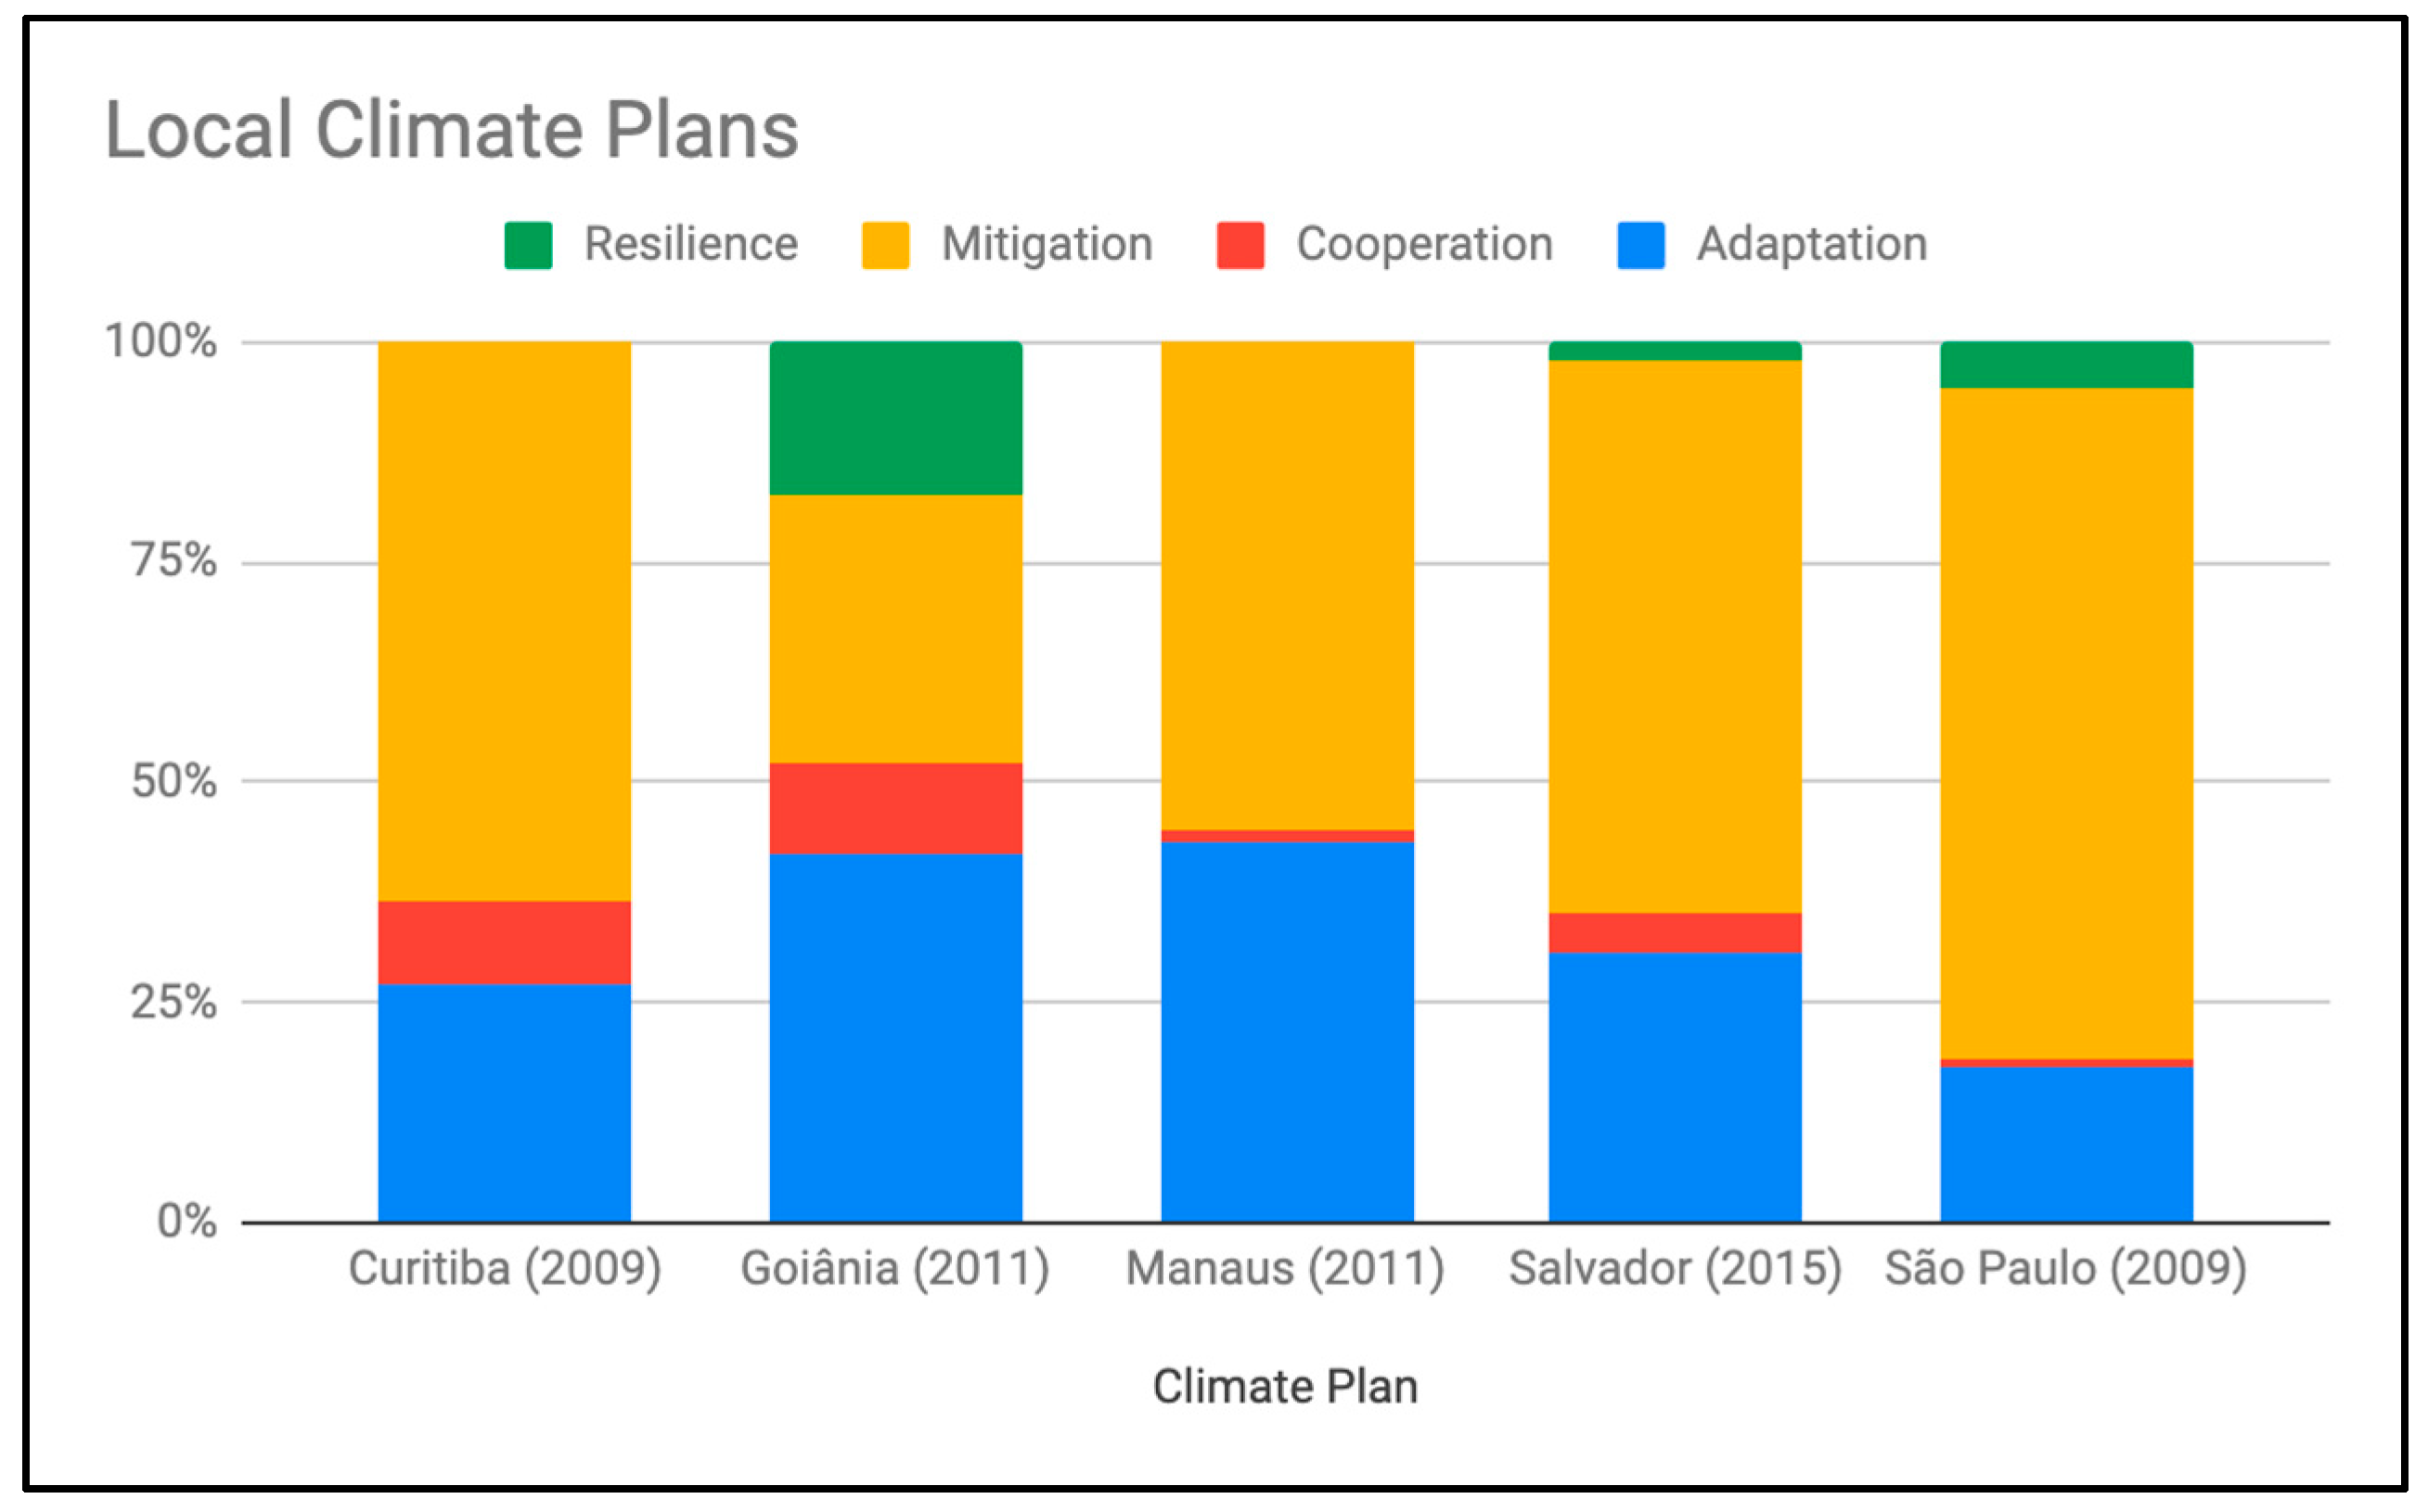
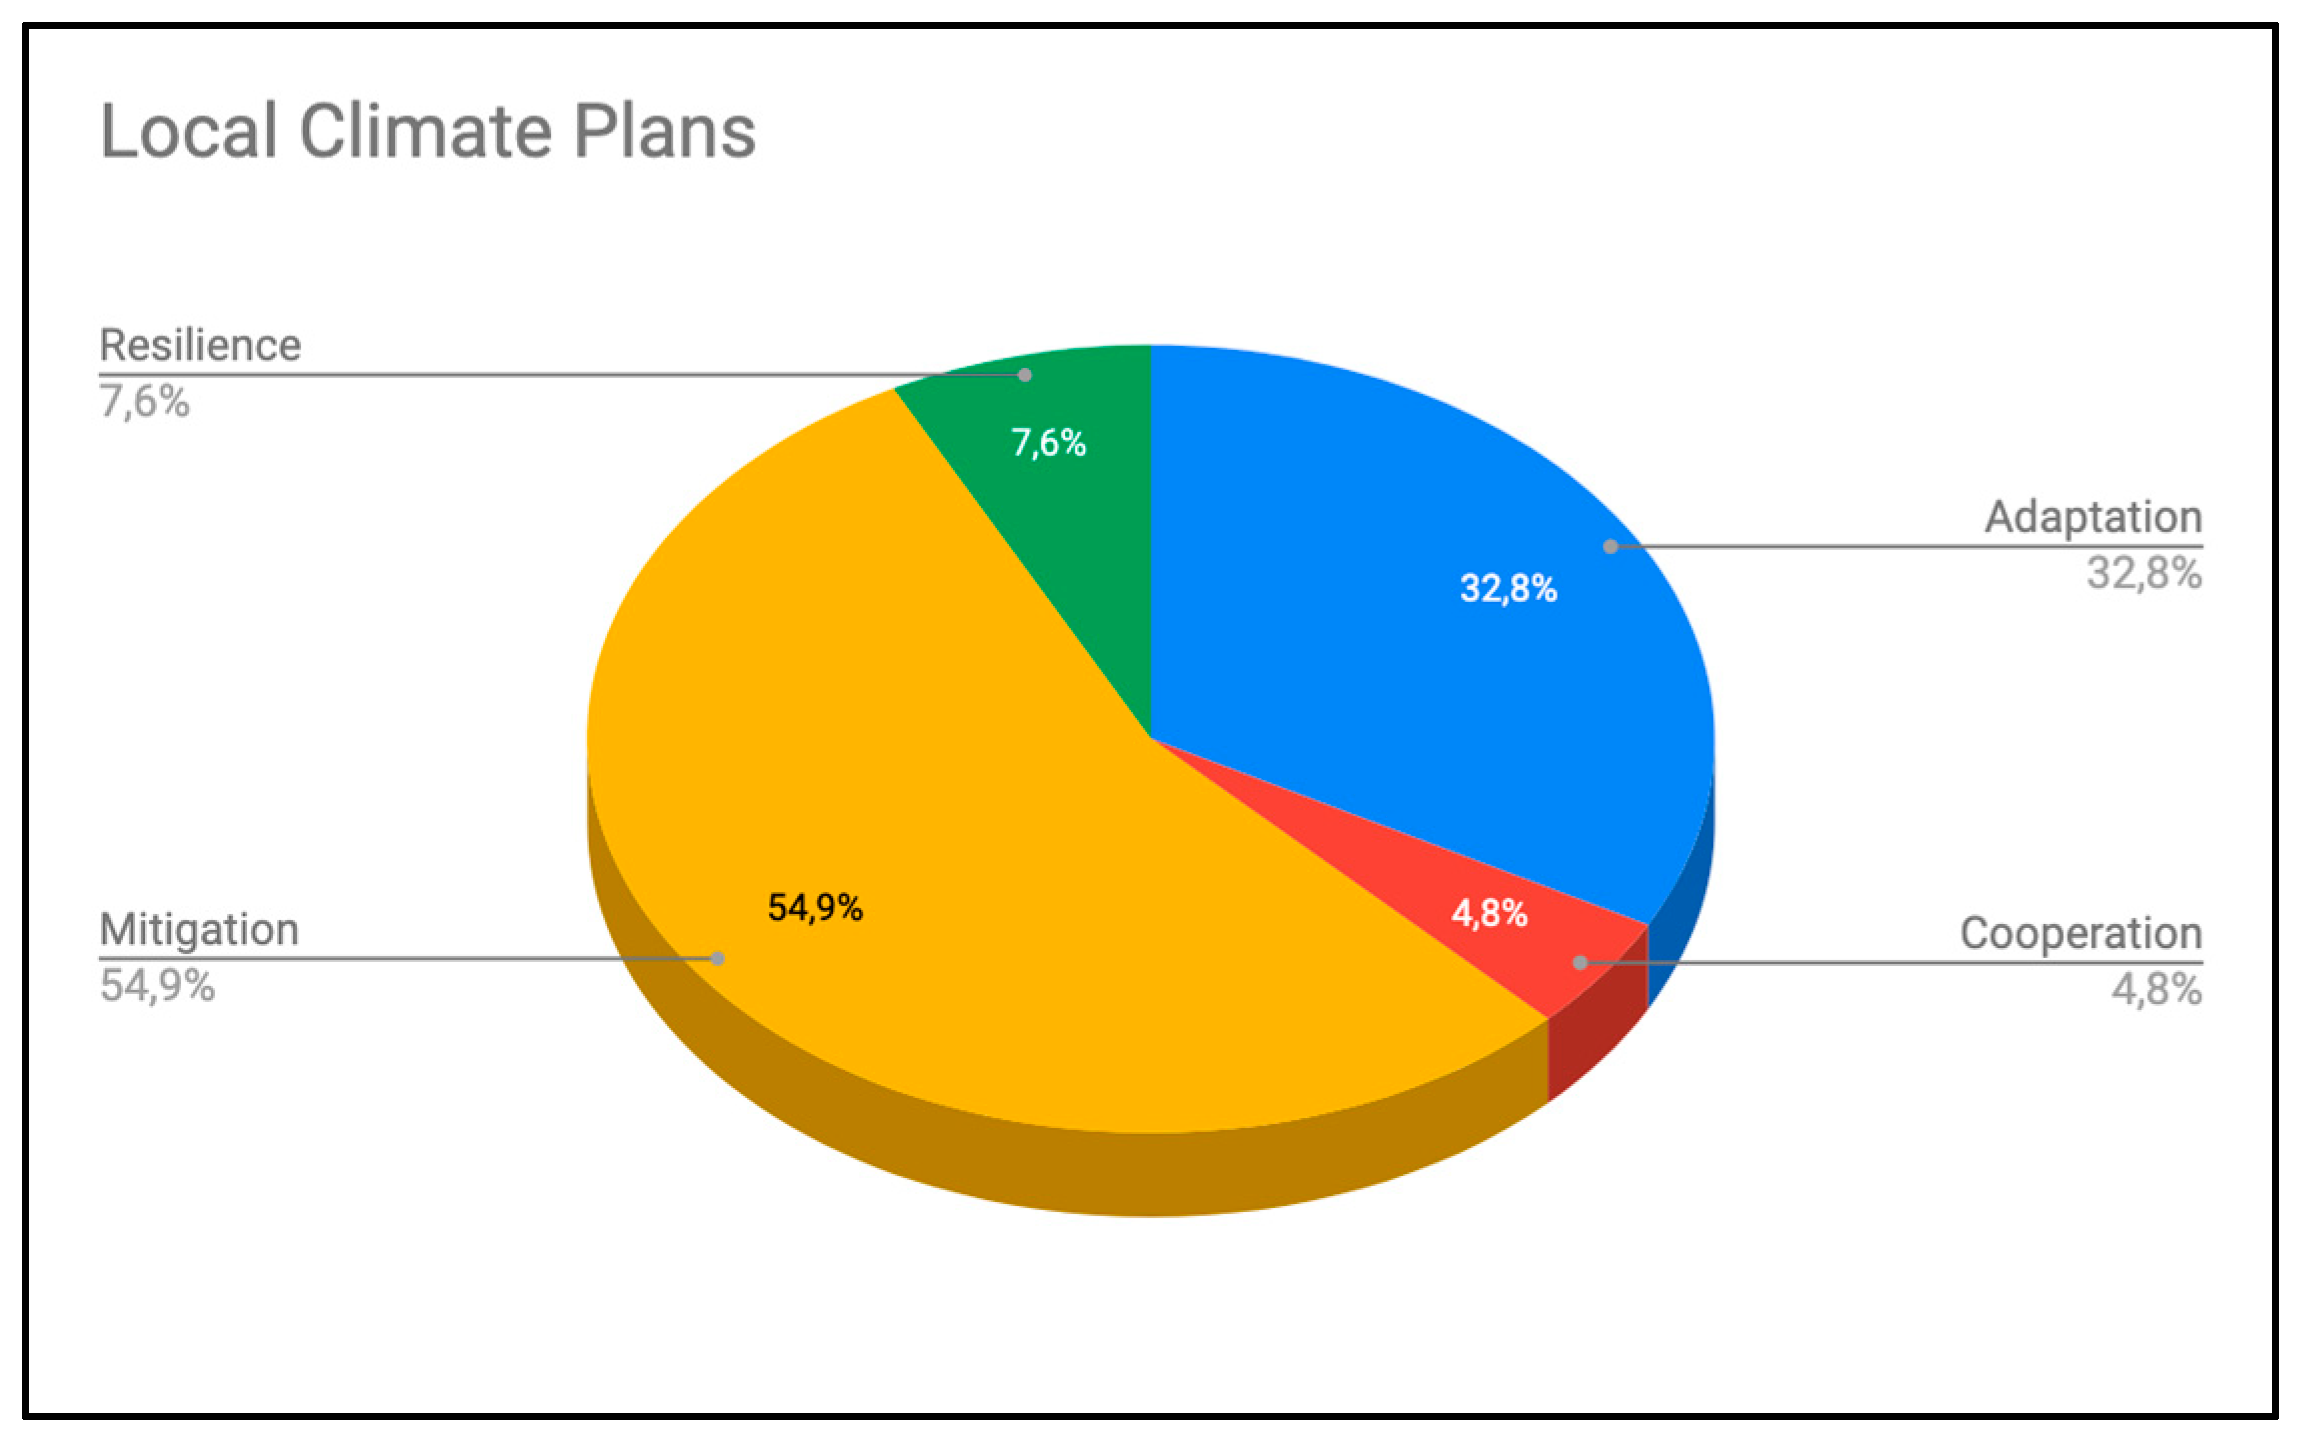
3.2. Local Climate Plans
3.3. City Master Plans
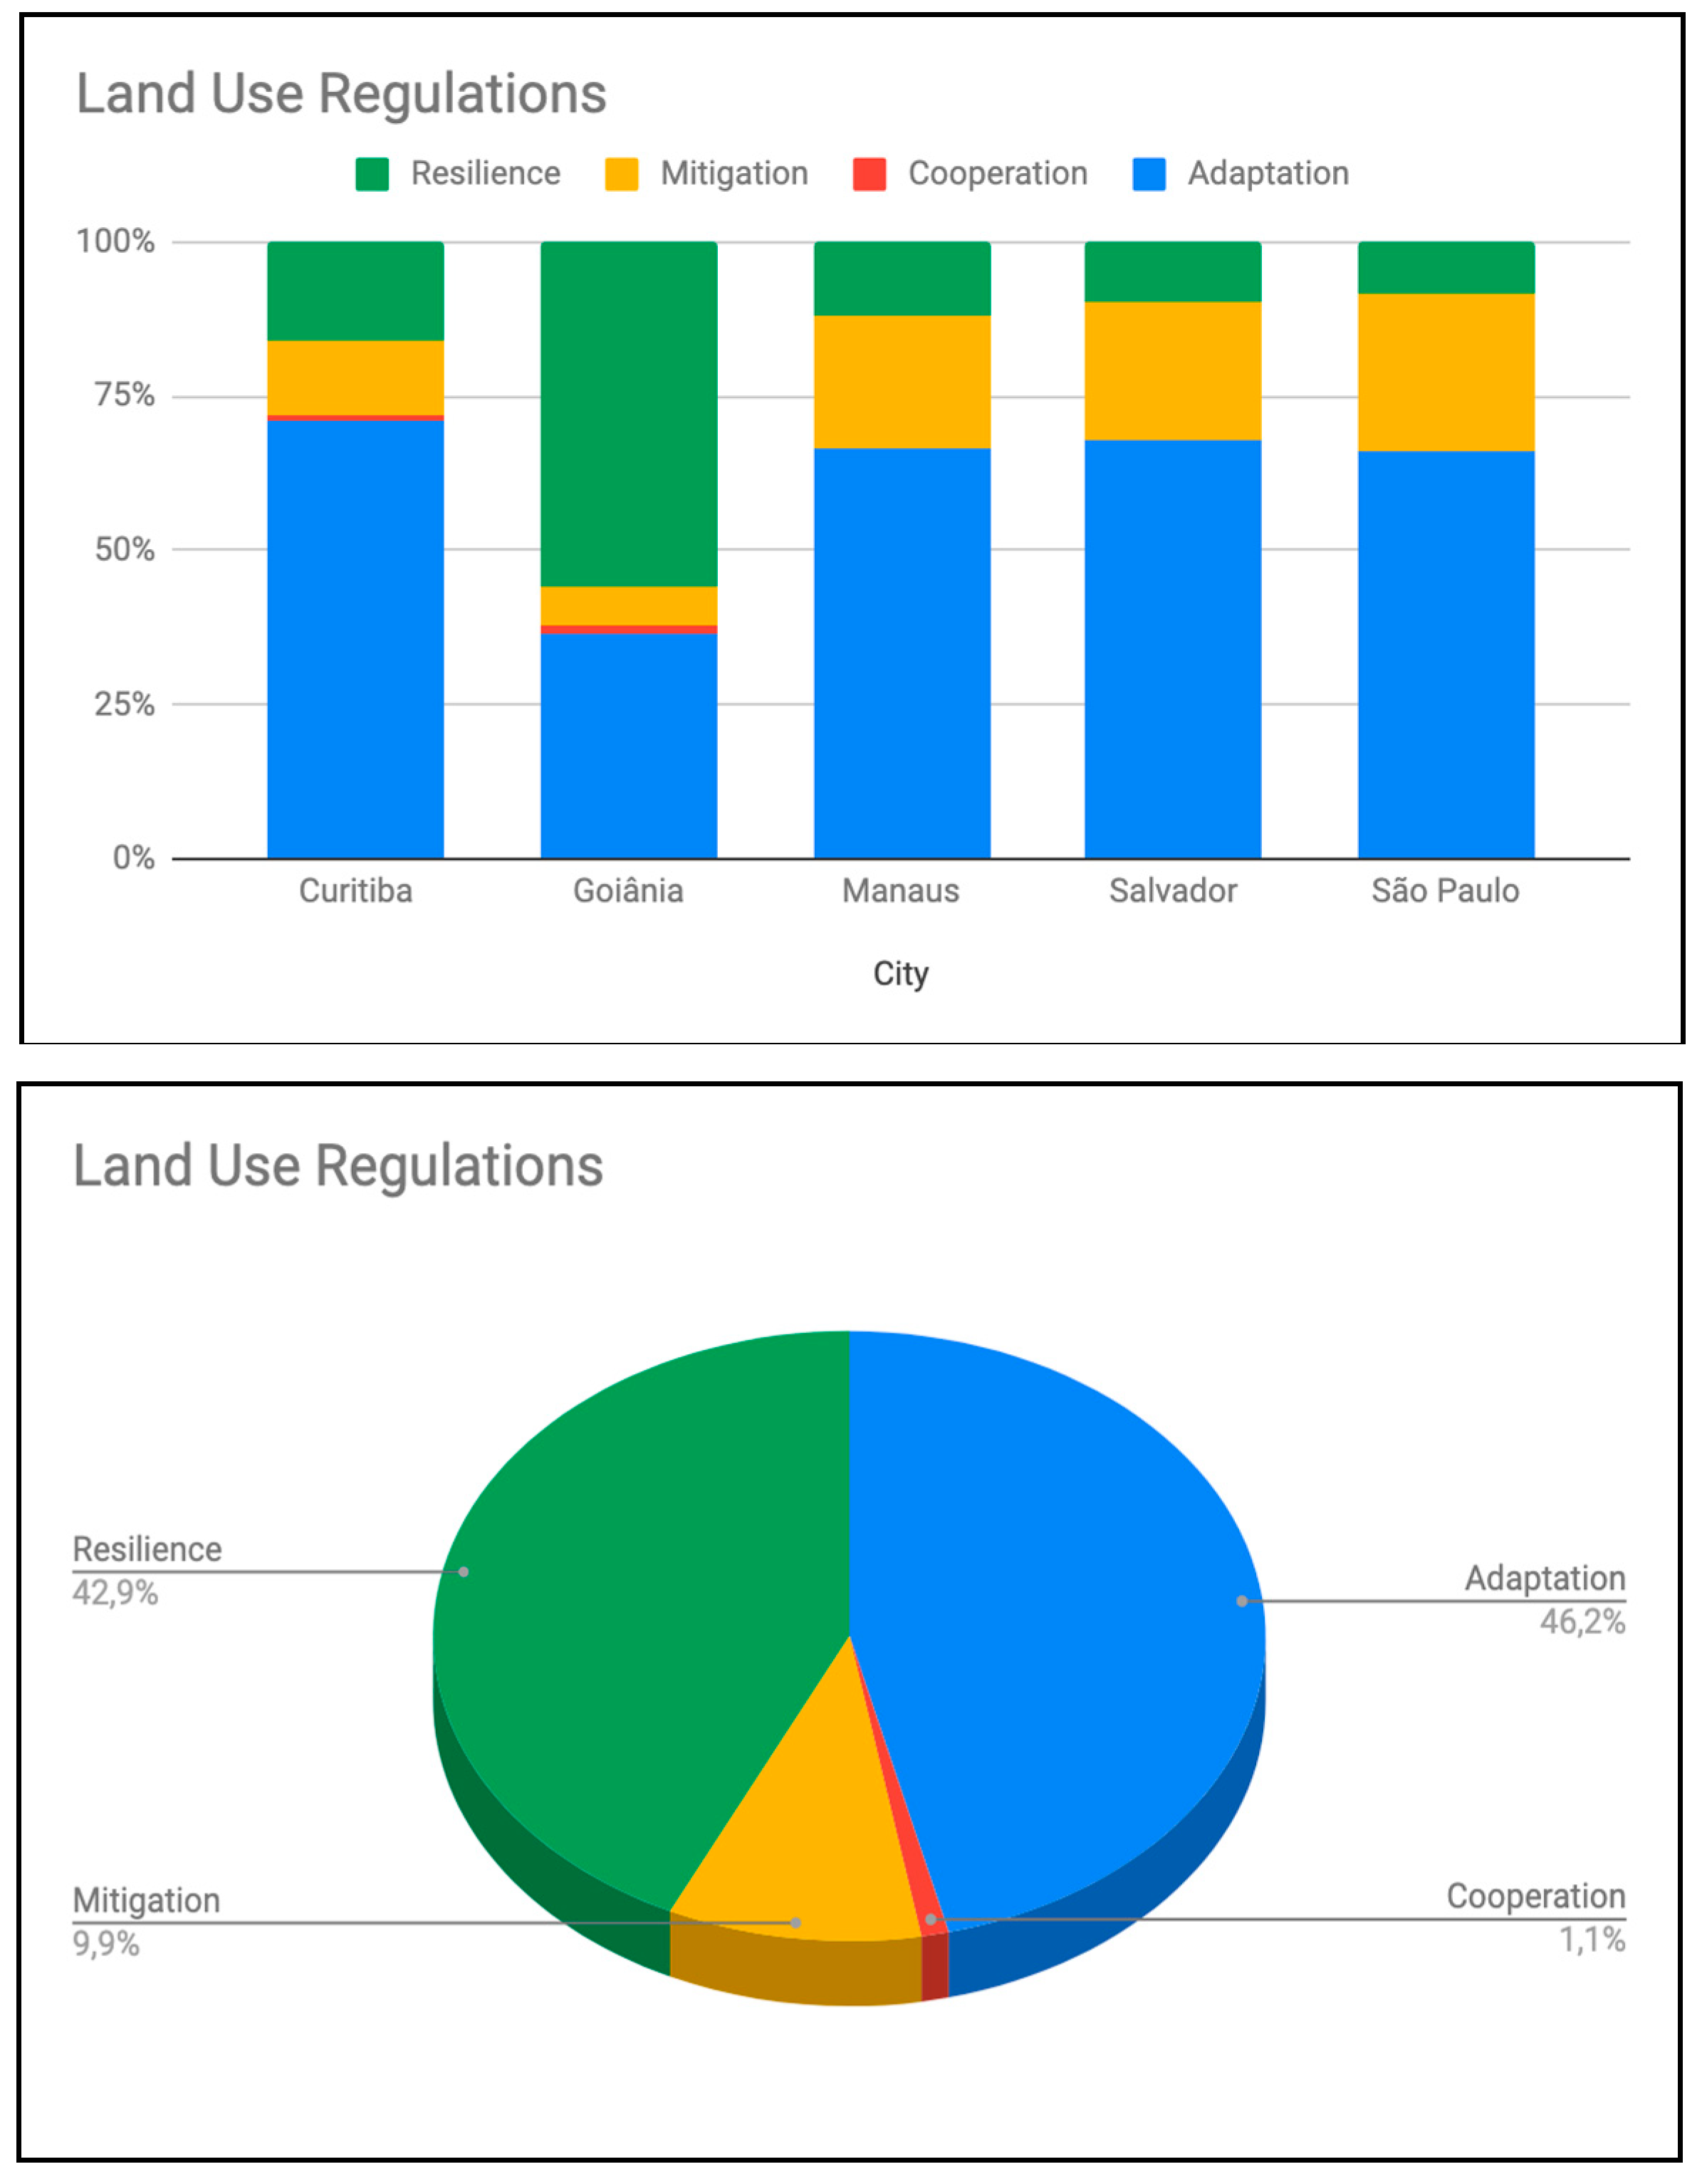
3.4. Land Use Regulations
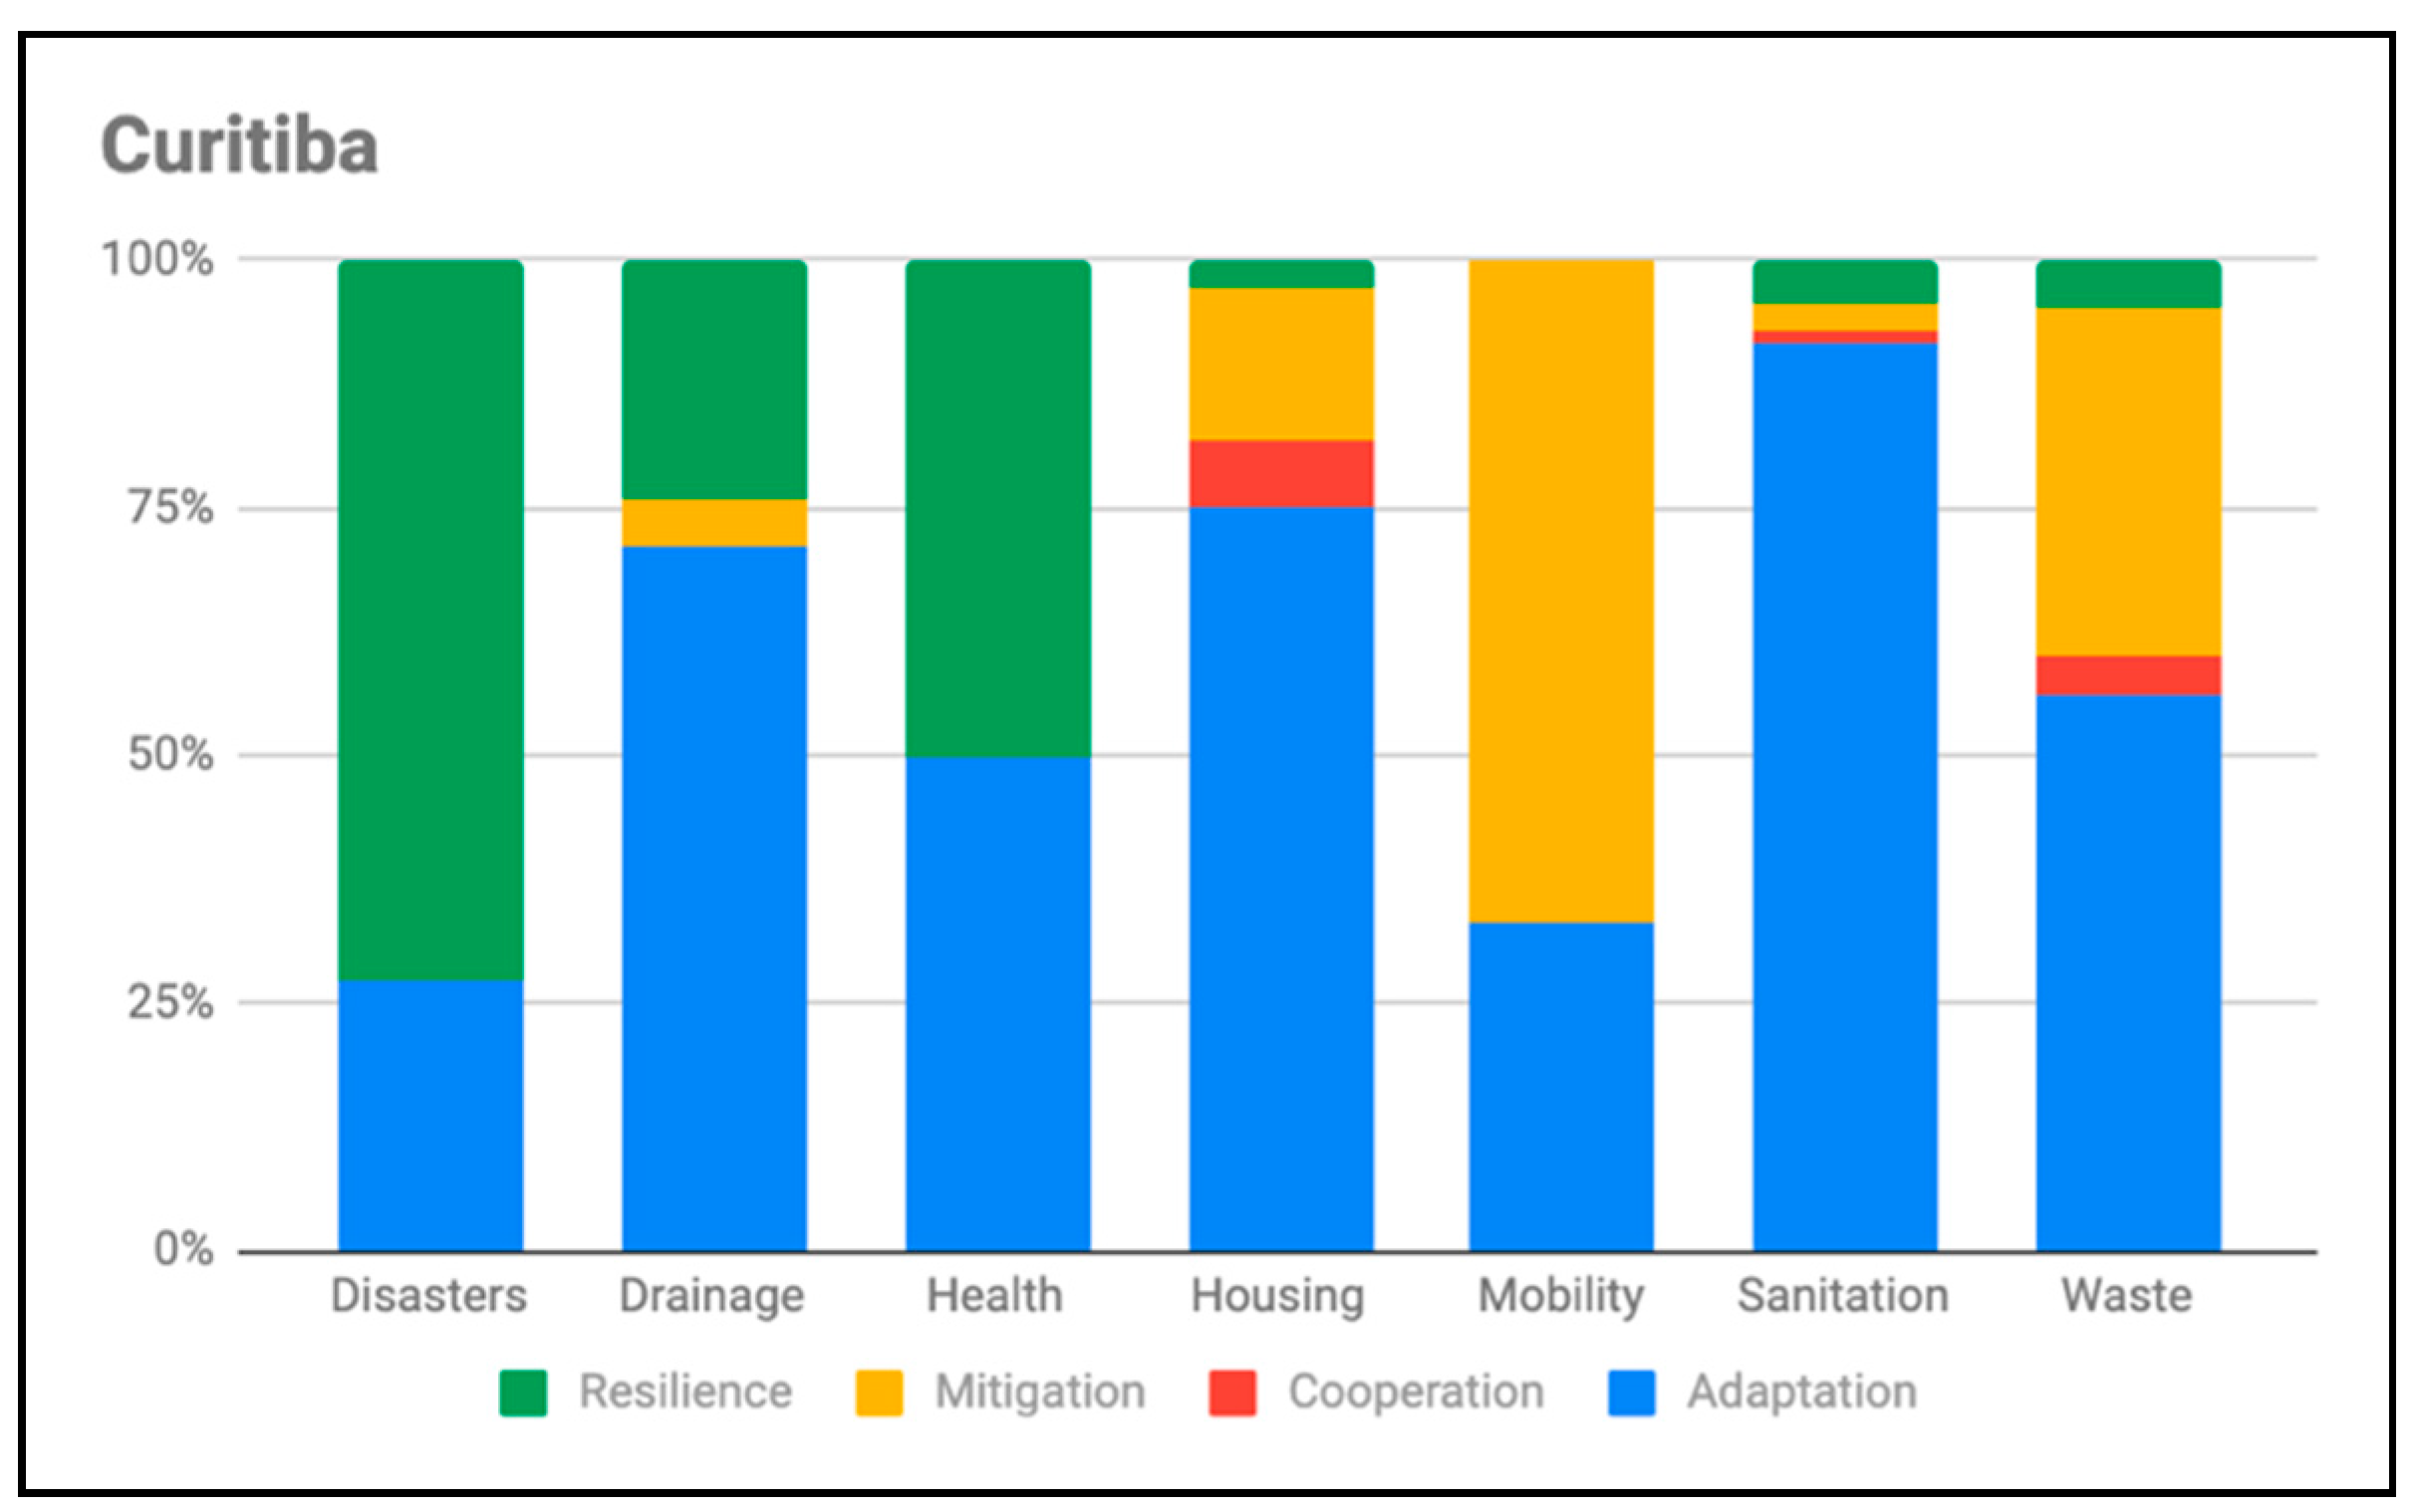
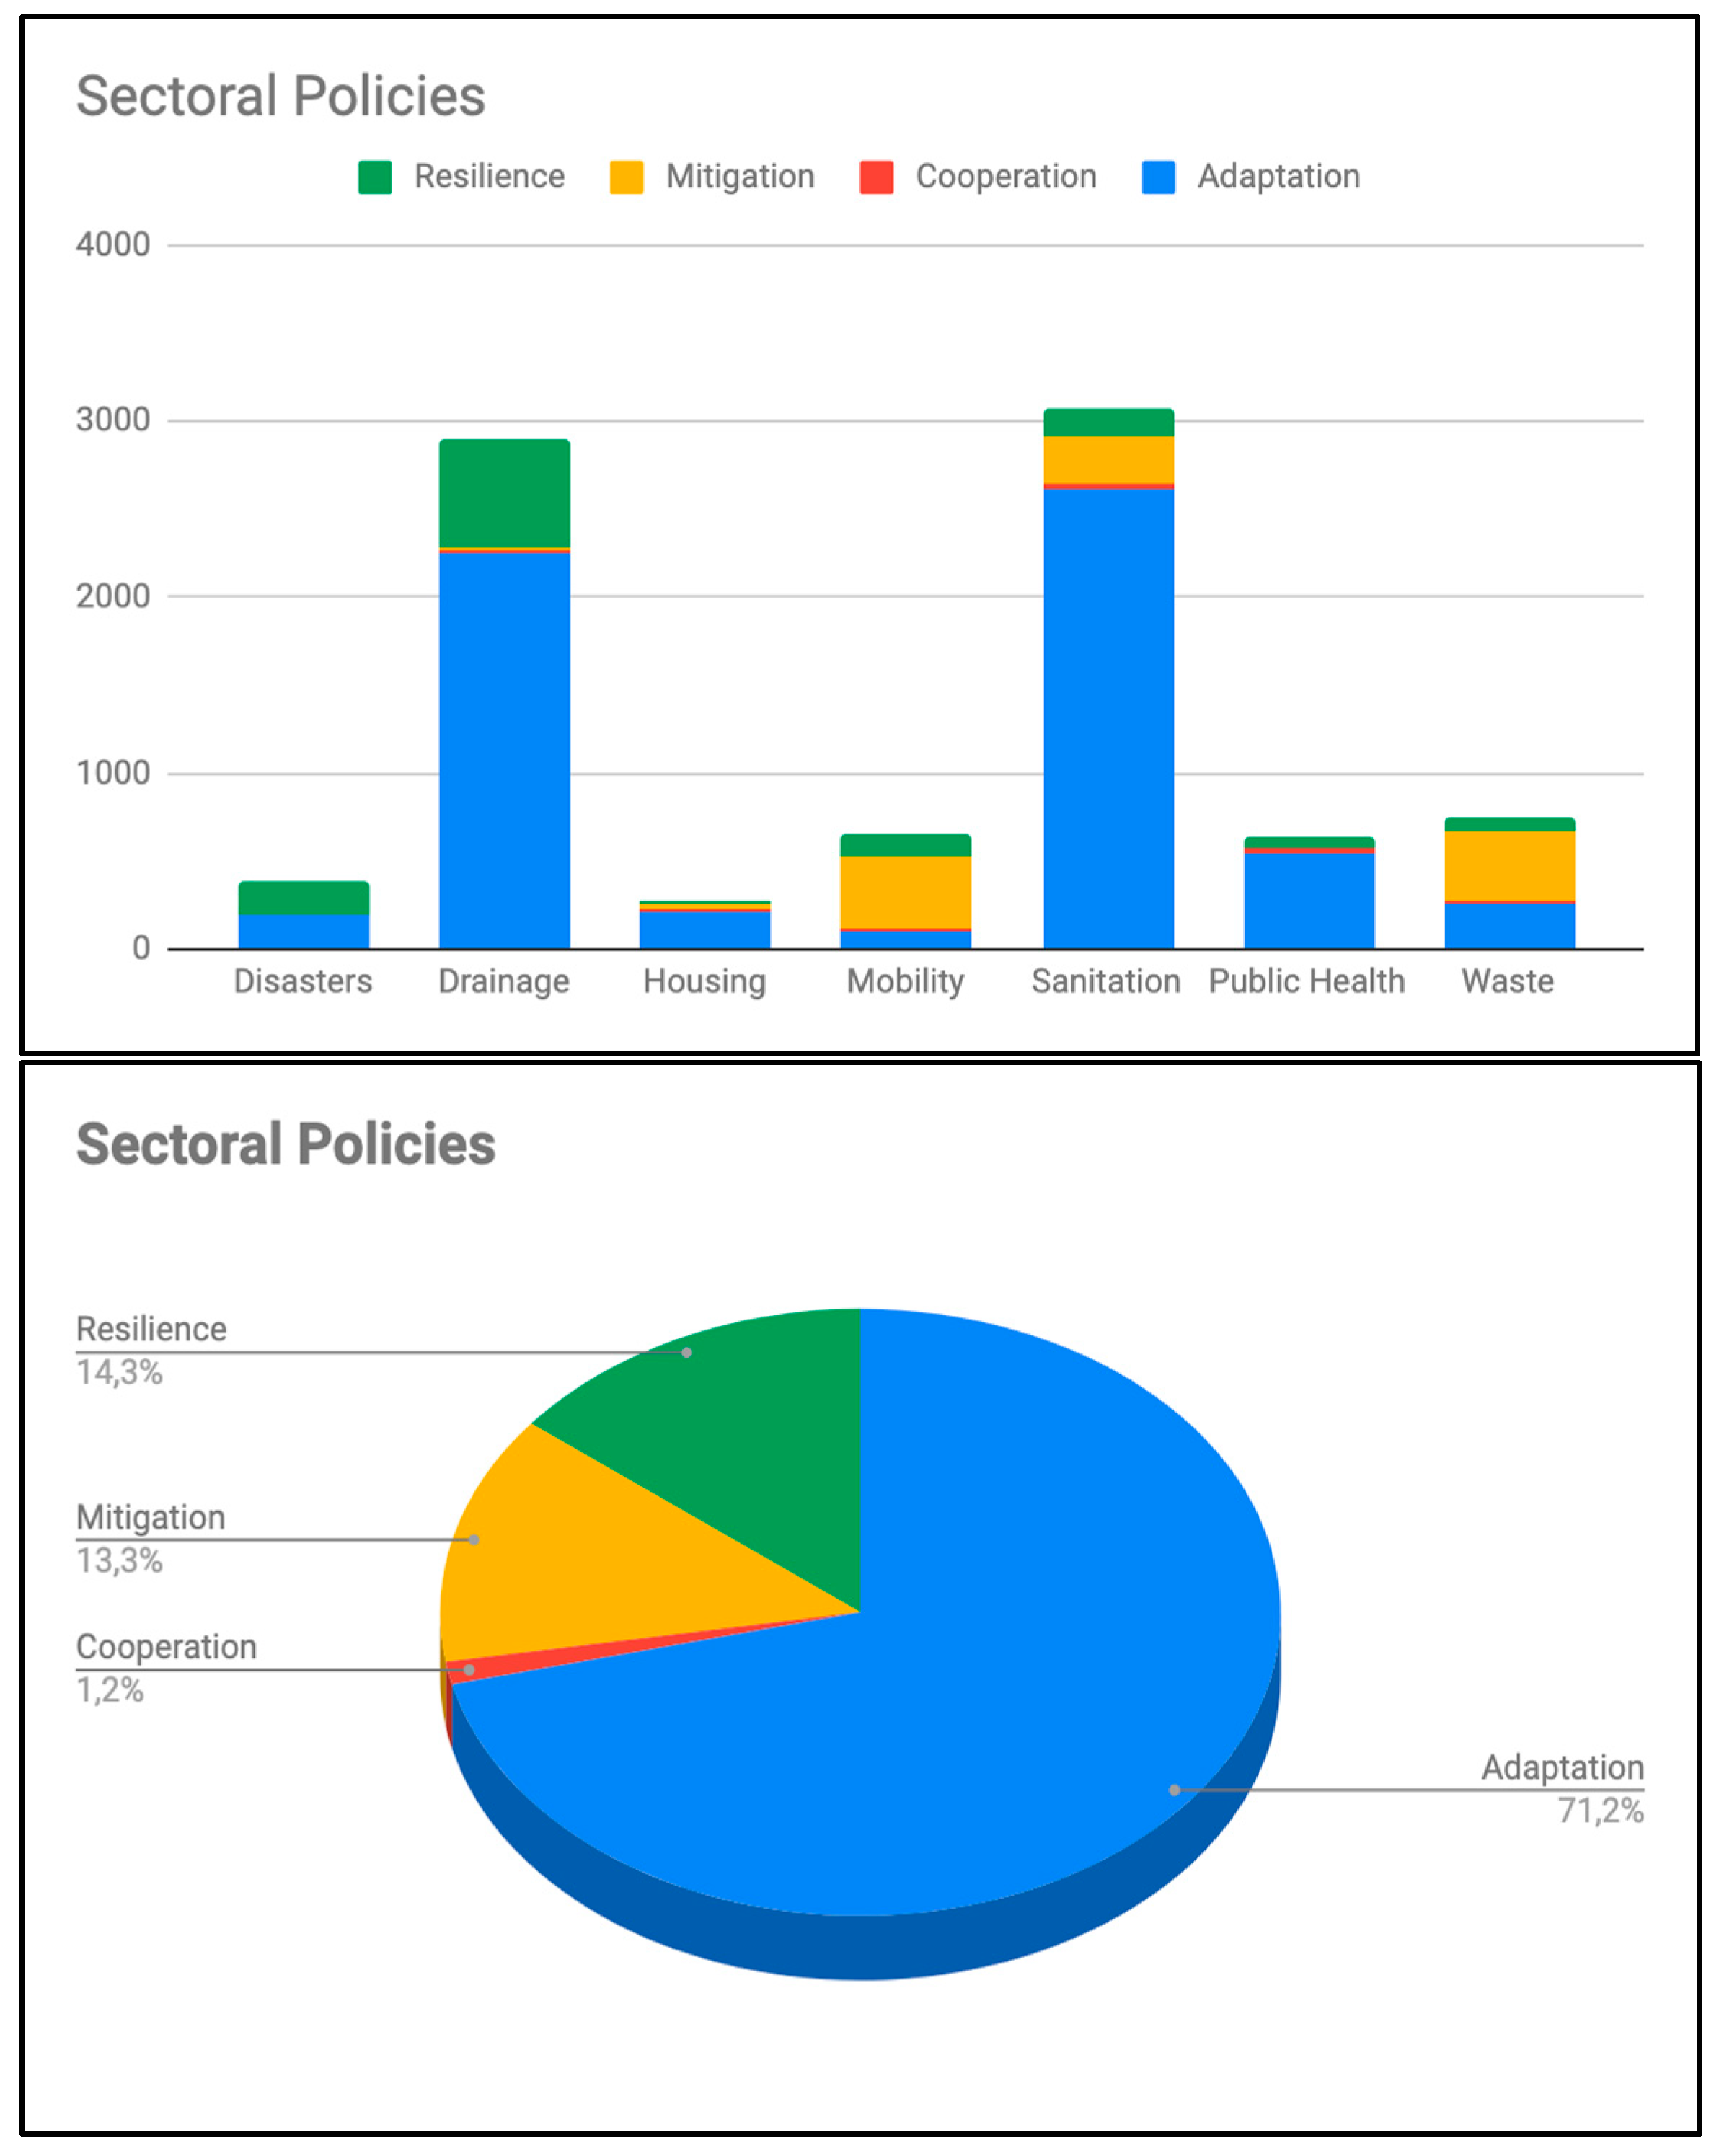
3.5. Sectoral Plans
4. Discussion
4.1. Institutional Frameworks and Climate Action in Brazil
4.2. Local Emissions Inventories and Climate Plans
4.3. Contribution to Greenhouse Gas Emission Reduction
4.4. Climate Action in Public Health and Disasters Management
4.5. Limitations of the Study
5. Conclusions
Author Contributions
Funding
Acknowledgments
Conflicts of Interest
References
- Van Loon, A.F.; Gleeson, T.; Clark, J.; Van Dijk, A.I.; Stahl, K.; Hannaford, J.; Hannah, D.M. Drought in the Anthropocene. Nat. Geosci. 2016, 9, 89–91. [Google Scholar] [CrossRef] [Green Version]
- Yigitcanlar, T.; Kamruzzaman, M.; Foth, M.; Sabatini-Marques, J.; Costa, E.; Ioppolo, G. Can cities become smart without being sustainable? A systematic review of the literature. Sustain. Cities Soc. 2019, 45, 348–365. [Google Scholar] [CrossRef]
- Scranton, R. Learning to Die in the Anthropocene: Reflections on the End of a Civilization; City Lights Publishers: San Francisco, CA, USA, 2015. [Google Scholar]
- Yigitcanlar, T.; Foth, M.; Kamruzzaman, M. Towards post-anthropocentric cities: Reconceptualising smart cities to evade urban ecocide. J. Urban Technol. 2019, 26, 147–152. [Google Scholar] [CrossRef]
- Parmesan, C.; Yohe, G. A globally coherent fingerprint of climate change impacts across natural systems. Nature 2003, 421, 37. [Google Scholar] [CrossRef] [PubMed]
- Burke, M.; Dykema, J.; Lobell, D.B.; Miguel, E.; Satyanath, S. Incorporating climate uncertainty into estimates of climate change impacts. Rev. Econ. Stat. 2015, 97, 461–471. [Google Scholar] [CrossRef]
- Pecl, G.T.; Araújo, M.B.; Bell, J.D.; Blanchard, J.; Bonebrake, T.C.; Chen, I.C.; Falconi, L. Biodiversity redistribution under climate change: Impacts on ecosystems and human well-being. Science 2017, 355, eaai9214. [Google Scholar] [CrossRef] [PubMed]
- Jakob, M.; Steckel, J.C. Implications of climate change mitigation for sustainable development. Environ. Res. Lett. 2016, 11, 104010. [Google Scholar] [CrossRef] [Green Version]
- Yigitcanlar, T. Planning for smart urban ecosystems: Information technology applications for capacity building in environmental decision making. Theor. Empir. Res. Urban Manag. 2009, 4, 5–21. [Google Scholar]
- Aldieri, L.; Carlucci, F.; Vinci, C.P.; Yigitcanlar, T. Environmental innovation, knowledge spillovers and policy implications: A systematic review of the economic effects literature. J. Clean. Prod. 2019, 239, 118051. [Google Scholar] [CrossRef]
- Yigitcanlar, T.; Kamruzzaman, M.; Buys, L.; Ioppolo, G.; Sabatini-Marques, J.; da Costa, E.; Yun, J. Understanding ‘smart cities’: Intertwining development drivers with desired outcomes in a multidimensional framework. Cities 2018, 81, 145–160. [Google Scholar] [CrossRef]
- Rottz, M.; Sell, D.; Pacheco, R.; Yigitcanlar, T. Digital commons and citizen coproduction in smart cities: Assessment of Brazilian municipal e-government platforms. Energies 2019, 12, 2813. [Google Scholar] [CrossRef]
- Arbolino, R.; Carlucci, F.; Cira, A.; Ioppolo, G.; Yigitcanlar, T. Efficiency of the EU regulation on greenhouse gas emissions in Italy: The hierarchical cluster analysis approach. Ecol. Indic. 2017, 81, 115–123. [Google Scholar] [CrossRef] [Green Version]
- Ingrao, C.; Messineo, A.; Beltramo, R.; Yigitcanlar, T.; Ioppolo, G. How can life cycle thinking support sustainability of buildings? Investigating life cycle assessment applications for energy efficiency and environmental performance. J. Clean. Prod. 2018, 201, 556–569. [Google Scholar] [CrossRef]
- Yigitcanlar, T.; Sabatini-Marques, J.; da-Costa, E.M.; Kamruzzaman, M.; Ioppolo, G. Stimulating technological innovation through incentives: Perceptions of Australian and Brazilian firms. Technol. Forecast. Soc. Chang. 2019, 146, 403–412. [Google Scholar] [CrossRef] [Green Version]
- Arbolino, R.; De Simone, L.; Carlucci, F.; Yigitcanlar, T.; Ioppolo, G. Towards a sustainable industrial ecology: Implementation of a novel approach in the performance evaluation of Italian regions. J. Clean. Prod. 2018, 178, 220–236. [Google Scholar] [CrossRef] [Green Version]
- Zapf, M.; Pengg, H.; Weindl, C. How to Comply with the Paris Agreement Temperature Goal: Global Carbon Pricing According to Carbon Budgets. Energies 2019, 12, 2983. [Google Scholar] [CrossRef]
- Yigitcanlar, T.; Kamruzzaman, M. Does smart city policy lead to sustainability of cities? Land Use Policy 2018, 73, 49–58. [Google Scholar] [CrossRef]
- Manowska, A.; Nowrot, A. The Importance of Heat Emission Caused by Global Energy Production in Terms of Climate Impact. Energies 2019, 12, 3069. [Google Scholar] [CrossRef]
- Brasil. Sumário Executivo. Documento-Base para Subsidiar os Diálogos Estruturados Sobre a Elaboração de uma Estratégia de Implementação e Financiamento da Contribuição Nacionalmente Determinada do Brasil ao Acordo de Paris; Ministério do Meio Ambiente: Brasília, Brazil, 2017. [Google Scholar]
- Octaviano, C.; Paltsev, S.; Gurgel, A.C. Climate change policy in Brazil and Mexico: Results from the MIT EPPA model. Energy Econ. 2016, 56, 600–614. [Google Scholar] [CrossRef] [Green Version]
- Broto, V.C. Urban governance and the politics of climate change. World Dev. 2017, 93, 1–15. [Google Scholar] [CrossRef]
- Hale, T. “All Hands-on Deck”: The Paris Agreement and Nonstate Climate Action. Glob. Environ. Politics 2016, 16, 12–22. [Google Scholar] [CrossRef]
- United Nations, General Assembly. Resolution Adopted by the General Assembly on 27 July 2012. 66/288. The Future We Want; United Nations: Washington, DC, USA, 2012. [Google Scholar]
- United Nations, General Assembly. Resolution Adopted by the General Assembly on 25 September 2015; United Nations: Washington, DC, USA, 2015. [Google Scholar]
- United Nations, General Assembly. Resolution Adopted by the General Assembly on 23 December 2016; 71/256. New Urban Agenda; United Nations: Washington, DC, USA, 2016. [Google Scholar]
- Jacobi, P.; Sulaiman, S. Governança ambiental urbana em face das mudanças climáticas. Rev. USP 2016, 109, 133–142. [Google Scholar] [CrossRef]
- Nobre, C. Mudanças climáticas globais: Possíveis impactos nos ecossistemas do país. Parcer. Estratégicas 2001, 6, 239–258. [Google Scholar]
- Pessini, L.; Sganzerla, A. As mudanças climáticas e seus impactos no reino a vida: Perspectivas para um futuro não apocalíptico. Revista Iberoamericana de Bioética 2016, 2, 1–13. [Google Scholar]
- Lahsen, M. A science–policy interface in the global south: The politics of carbon sinks and science in Brazil. Clim. Chang. 2009, 97, 339. [Google Scholar] [CrossRef]
- Engle, N.L.; Lemos, M.C. Unpacking governance: Building adaptive capacity to climate change of river basins in Brazil. Glob. Environ. Chang. 2010, 20, 4–13. [Google Scholar] [CrossRef]
- Yin, R.K. Case Study Research; Sage Publications: Thousand Oaks, CA, USA, 2003. [Google Scholar]
- Owen, G.T. Qualitative methods in higher education policy analysis: Using interviews and document analysis. Qual. Rep. 2014, 19, 1–19. [Google Scholar]
- Brasil. Lei 6.938 de 31 de Agosto de 1981. Available online: http://www.planalto.gov.br/ccivil_03/Leis/L6938.htm (accessed on 24 August 2019).
- Brasil. Lei 10.257 de 10 de Julho de 2001—Estatuto da Cidade. Available online: http://www.planalto.gov.br/ccivil_03/Leis/LEIS_2001/L10257.htm (accessed on 24 August 2019).
- Yigitcanlar, T.; Metaxiotis, K.; Carrillo, F.J. Building Prosperous Knowledge Cities: Policies, Plans and Metrics; Edward Elgar: Cheltenham, UK, 2012. [Google Scholar]
- Yigitcanlar, T. Position paper: Benchmarking the performance of global and emerging knowledge cities. Expert Syst. Appl. 2014, 41, 5549–5559. [Google Scholar] [CrossRef] [Green Version]
- Intergovernmental Panel on Climate Change—IPCC. Global Warming of 1.5 °C: An IPCC Special Report on the Impacts of Global Warming of 1.5 °C above Pre-industrial Levels and Related Global Greenhouse Gas Emission Pathways, in the Context of Strengthening the Global Response to the Threat of Climate Change, Sustainable Development, and Efforts to Eradicate Poverty; Intergovernmental Panel on Climate Change: Geneva, Switzerland, 2018. [Google Scholar]
- Pacheco, R.; Silva, C. Global Warming Potential of Biomass-to-Ethanol: Review and Sensitivity Analysis through a Case Study. Energies 2019, 12, 2535. [Google Scholar] [CrossRef]
- Ministério da Ciência, Tecnologia, Inovação e Comunicação—MCTIC. Terceira Comunicaçãeo Nacional do Brasil à Convenção-Quadro das Nações Unidas sobre Mudança do Clima; MCTIC: Brasília, Brazil, 2018. [Google Scholar]
- Azevedo, T. Emissões de GEE do Brasil e suas Implicações para Políticas Públicas e a Contribuição Brasileira para o Acordo de Paris; Documento síntese; Período 1970–2015; Observatório do Clima; SEEG: Brasilia, Brazil, 2017. [Google Scholar]
- Malhi, Y.; Roberts, J.T.; Betts, R.A.; Killeen, T.J.; Li, W.; Nobre, C.A. Climate change, deforestation, and the fate of the Amazon. Science 2008, 319, 169–172. [Google Scholar] [CrossRef]
- Caviglia-Harris, J.L. Agricultural innovation and climate change policy in the Brazilian Amazon: Intensification practices and the derived demand for pasture. J. Environ. Econ. Manag. 2018, 90, 232–248. [Google Scholar] [CrossRef]
- Farias, A.R.; Mingoti, R.; Valle, L.D.; Spadotto, C.A.; Lovisi Filho, E. Comunicado Técnico. Identificação, Mapeamento e Quantificação das Áreas Urbanas do Brasil; Embrapa: Brasilia, Brazil, 2017. [Google Scholar]
- SEEG. Plataforma SEEG Brasil. Available online: http://plataforma.seeg.eco.br/ (accessed on 24 August 2019).
- De Azevedo, T.R.; Junior, C.C.; Junior, A.B.; dos Santos Cremer, M.; Piatto, M.; Tsai, D.S.; Barreto, P.; Martins, H.; Sales, M.; Galuchi, T.; et al. SEEG initiative estimates of Brazilian greenhouse gas emissions from 1970 to 2015. Sci. Data 2018, 5, 180045. [Google Scholar] [CrossRef] [PubMed] [Green Version]
- Souza, S. Frota de Manaus em Circulação Supera Marca de 713 mil Veículos; A Crítica: Manaus, Brazil, 2017; Available online: https://www.acritica.com/channels/manaus/news/frota-de-manaus-superamarca-de-713-mil-veiculos (accessed on 24 August 2019).
- Suframa. O que é o Projeto ZFM? Available online: http://site.suframa.gov.br/assuntos/modelo-zona-franca-de-manaus/o-que-e-o- projeto-zfm (accessed on 24 August 2019).
- Nobre, C.A.; Sampaio, G.; Borma, L.S.; Castilla-Rubio, J.C.; Silva, J.S.; Cardoso, M. Land-use and climate change risks in the Amazon and the need of a novel sustainable development paradigm. Proc. Natl. Acad. Sci. USA 2016, 113, 10759–10768. [Google Scholar] [CrossRef] [PubMed] [Green Version]
- Liu, Y.; Brito, J.; Dorris, M.R.; Rivera-Rios, J.C.; Seco, R.; Bates, K.H.; Goldstein, A.H. Isoprene photochemistry over the Amazon rainforest. Proc. Natl. Acad. Sci. USA 2016, 113, 6125–6130. [Google Scholar] [CrossRef] [PubMed] [Green Version]
- Prefeitura de Curitiba. 2o e 3o Inventários de Gases de Efeito Estufa para a Cidade de Curitiba; Prefeitura Municipal de Curitiba: Curitiba, Brazil, 2016. [Google Scholar]
- Abreu, V. Produção de CO2 em Goiânia é 28.5% acima da média nacional; O Popular: Goiânia, Brazil, 2017. [Google Scholar]
- Prefeitura de Salvador. Inventário de Emissões dos Gases do Efeito Estufa de Salvador; Secretaria Cidade Sustentável: Salvador, Brazil, 2016. [Google Scholar]
- Instituto Ekos Brasil & Geolock Consultoria e Engenharia Ambiental. Inventário de Emissões e Remoções Antrópicas de Gases de Efeito Estufa do Município de São Paulo de 2003 a 2009 com Atualização para 2010 e 2011 nos Setores Energia e Resíduos; ANTP: São Paulo, Brazil, 2013. [Google Scholar]
- Governo do Estado da Bahia. Primeiro Inventário de Emissões Antrópicas de Gases de Efeito Estufa do Estado da Bahia; SEMA: Salvador, Brazil, 2010. Available online: http://www.consultaesic.cgu.gov.br/busca/dados/Lists/Pedido/Attachments/456145/RESPOSTA_PEDIDO_1%2020100915%20inventario%20emissoes%20BA.pdf (accessed on 24 August 2019).
- Governo do Estado de São Paulo. Comunicação Estadual. 1o Inventário de Emissões Antrópicas de Gases de Efeito Estufa Diretos e Indiretos do Estado de São Paulo; SMA; CETESB: São Paulo, Brazil, 2011. [Google Scholar]
- Governo do Estado do Paraná. Inventário de Emissões Antrópicas Diretas e Indiretas de Gases de Efeito Estufa 2005–2012. Resumo Executivo; SEMA: Curitiba, Brazil, 2015. [Google Scholar]
- World Health Organization—WHO. Ambient air Pollution: A Global Assessment of Exposure and Burden of Disease; World Health Organization: Geneva, Switzerland, 2016. [Google Scholar]
- Saldiva, P. Vida Urbana e Saúde. Os Desafios dos Habitantes das Metrópoles; Contexto: São Paulo, Brazil, 2018. [Google Scholar]
- Brasil. Constituição da Republica Federativa do Brasil de 1988. Available online: http://www.planalto.gov.br/ccivil_03/Constituicao/Constituicao.htm (accessed on 24 August 2019).
- Brasil. Lei 11.445 de 5 de Janeiro de 2007. Available online: http://www.planalto.gov.br/ccivil_03/_Ato2007-2010/2007/Lei/L11445.htm (accessed on 24 August 2019).
- Brasil. Lei 12.305 de 2 de Agosto de 2010. Available online: http://www2.mma.gov.br/port/conama/legiabre.cfm?codlegi=636 (accessed on 24 August 2019).
- Brasil. Lei 12.587 de 3 de Janeiro de 2012. Available online: http://www.planalto.gov.br/ccivil_03/_Ato2011-2014/2012/Lei/L12587.htm (accessed on 24 August 2019).
- Brasil. Lei 11.124 de 16 de Junho de 2005. Available online: http://www.planalto.gov.br/ccivil_03/_Ato2004-2006/2005/Lei/L11124.htm (accessed on 24 August 2019).
- Brasil. Lei 12.608 de 10 de Abril de 2012. Available online: http://www.planalto.gov.br/ccivil_03/_Ato2011-2014/2012/Lei/L12608.htm (accessed on 24 August 2019).
- Brasil. Lei 8.080 de 19 de Setembro de 1990. Available online: http://www.planalto.gov.br/ccivil_03/leis/L8080.htm (accessed on 24 August 2019).
- IBGE. População em Áreas de Risco no Brasil; IBGE: Rio de Janeiro, Brazil, 2018. [Google Scholar]
- Brasil. Lei 12.187 de 29 de Dezembro de 2009. Available online: http://www.planalto.gov.br/ccivil_03/_Ato2007-2010/2009/Lei/L12187.htm (accessed on 24 August 2019).
- Rei, F.; Gonçalves, A.F.; de Souza, L.P. Acordo de Paris: Reflexões e Desafios para o Regime Internacional de Mudanças Climáticas. Veredas Do Direito 2017, 14, 81–99. [Google Scholar] [CrossRef]
- Ministério do Meio Ambiente (MMA). Plano Nacional de Adaptação à Mudança do Clima—Sumário Executivo; Ministério do Meio Ambiente: Brasília, Brazil, 2016. [Google Scholar]
- Ministério da Saúde. Plano Setorial da Saúde para Mitigação e Adaptação à Mudança do Clima; Ministério da Saúde: Brasília, Brazil, 2013. [Google Scholar]
- Maglio, I.; Philippi, A., Jr. Sustentabilidade Ambiental e Mudanças Climáticas. In Gestão Urbana e Sustentabilidade; Philippi, A., Jr., e Bruna, G., Eds.; Manole: Barueri, Brazil, 2018; pp. 428–453. [Google Scholar]
- Yigitcanlar, T.; Sabatini-Marques, J.; Lorenzi, C.; Bernardinetti, N.; Schreiner, T.; Fachinelli, A.; Wittmann, T. Towards smart Florianópolis: What does it take to transform a tourist island into an innovation capital? Energies 2018, 11, 3265. [Google Scholar] [CrossRef]
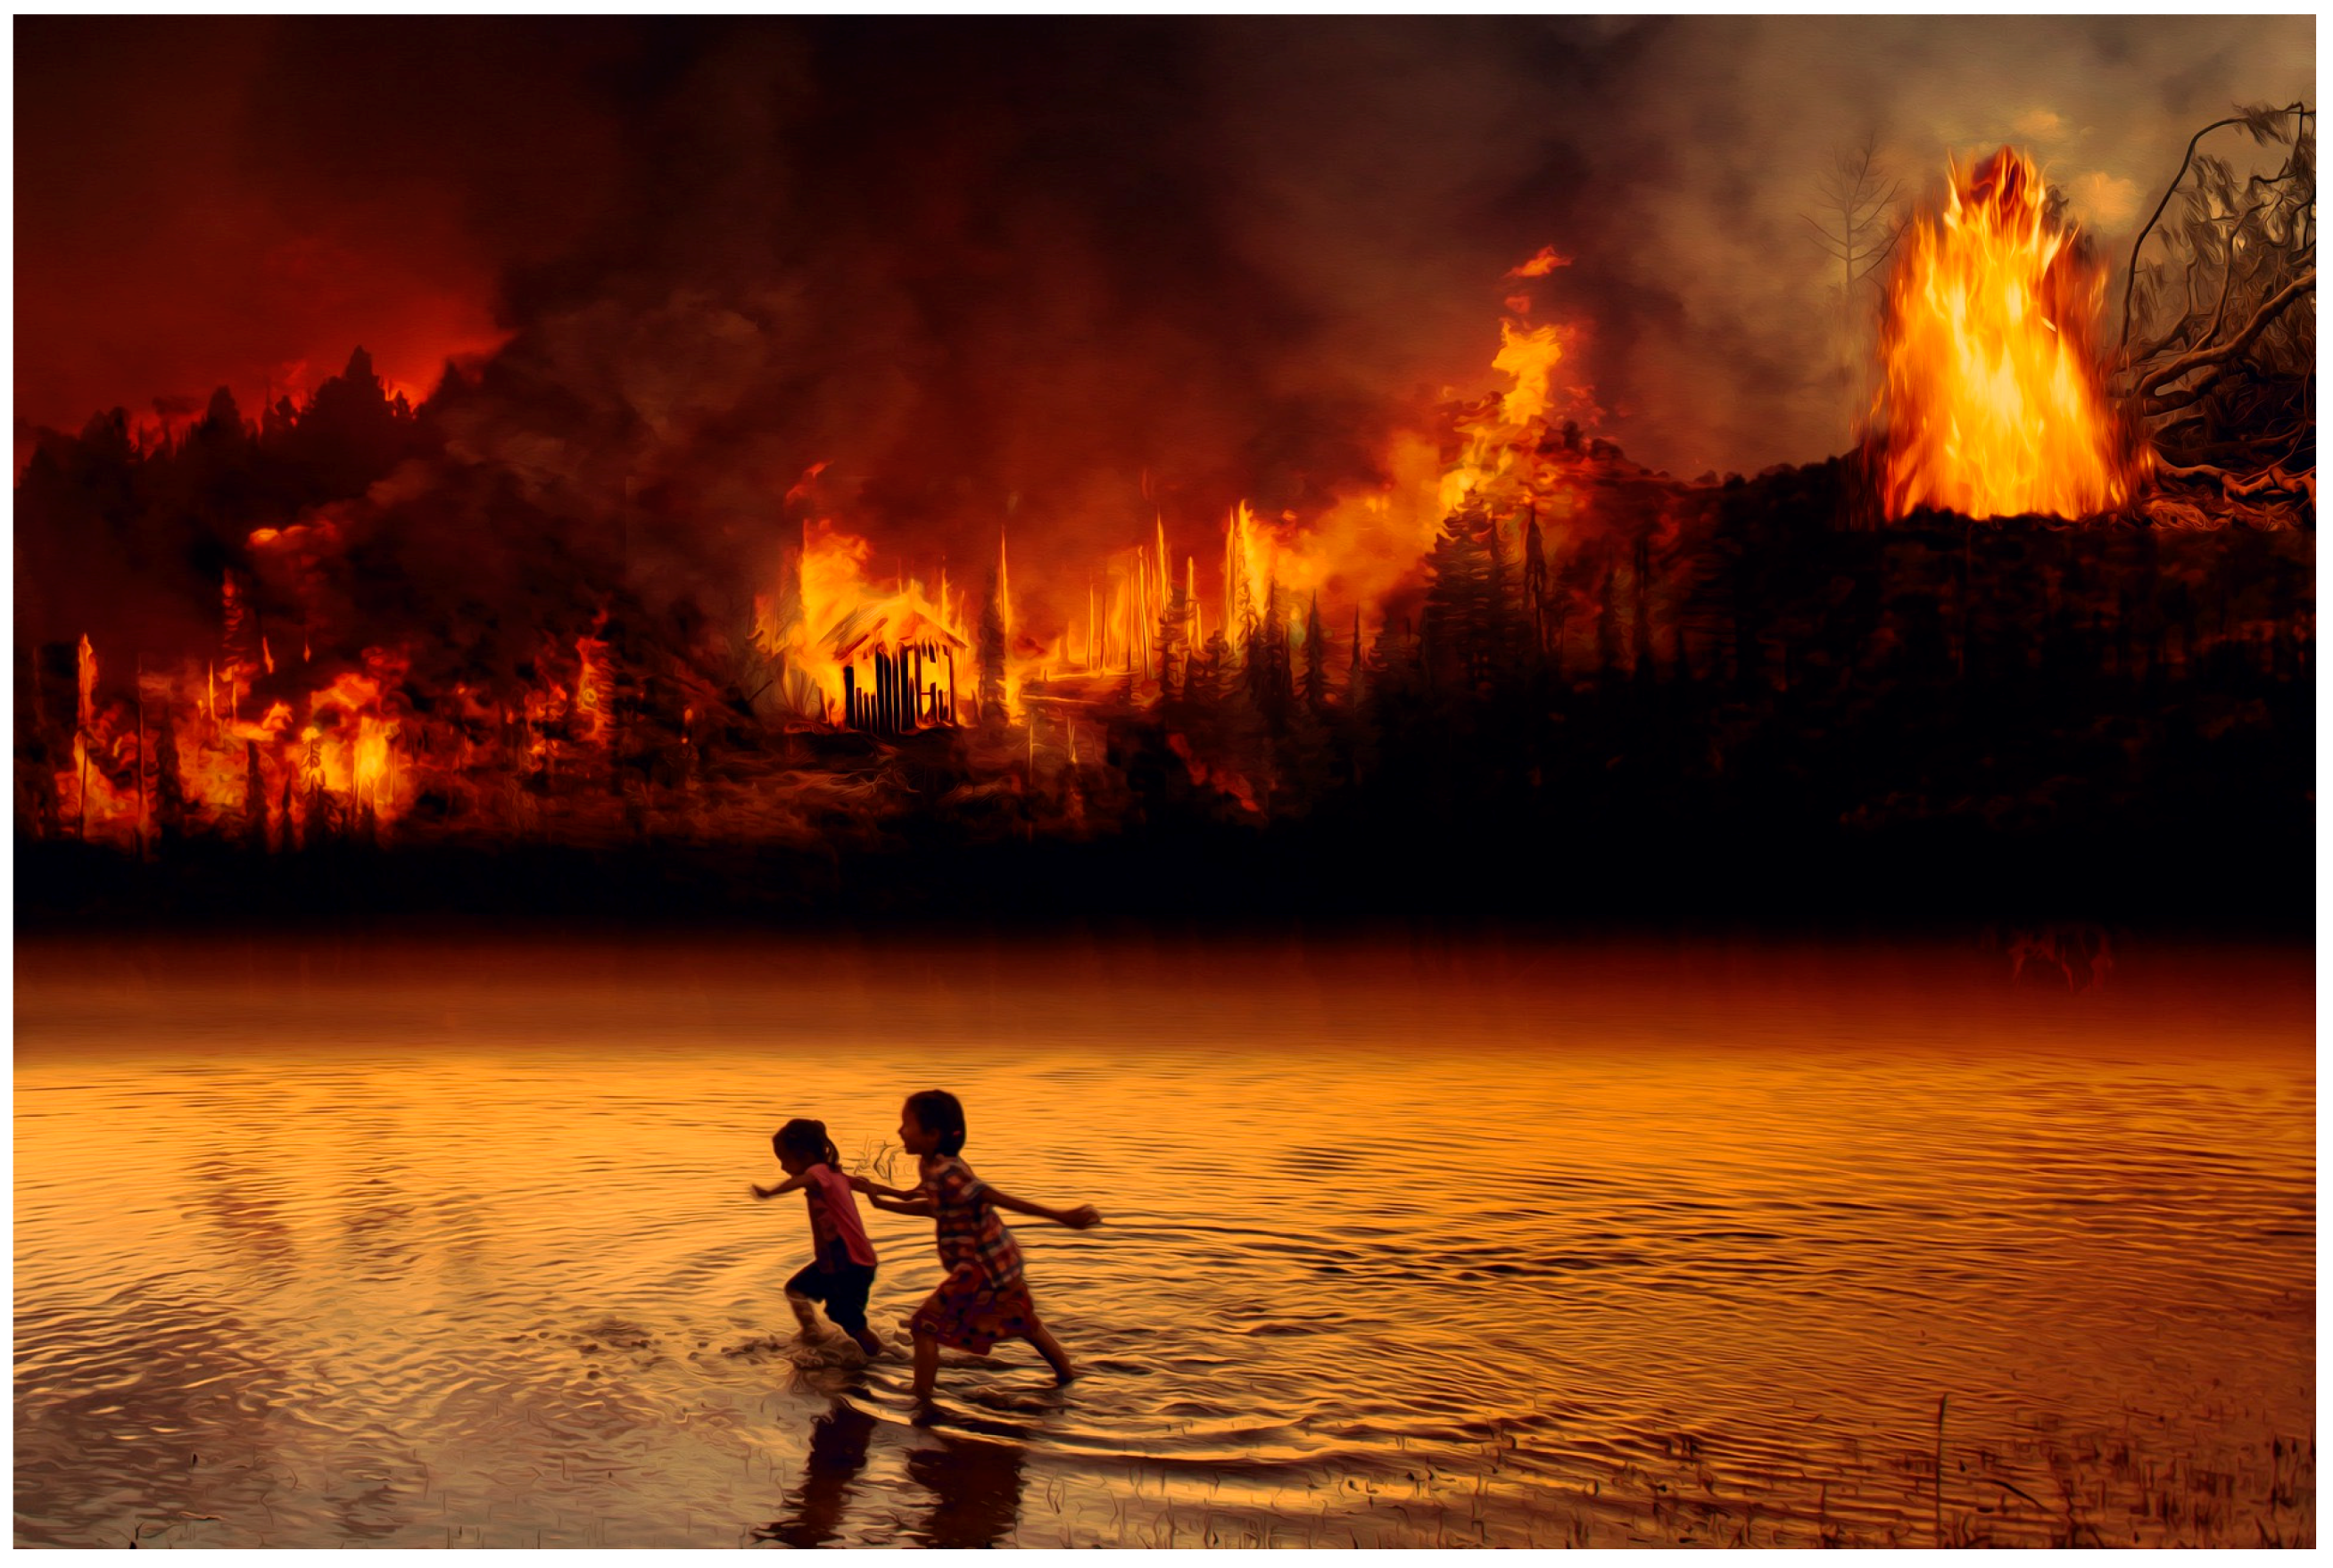
- Sopala, R. A copyright free image by of 2019 Amazon fires. Available online: https://pixabay.com/photos/fire-forest-fire-children-fear-4429478/ (accessed on 3 September 2019).
- Galán-Martín, A.; Pozo, C.; Azapagic, A.; Grossmann, I.E.; Mac Dowell, N.; Guillén-Gosálbez, G. Time for global action: An optimised cooperative approach towards effective climate change mitigation. Energy Environ. Sci. 2018, 11, 572–581. [Google Scholar] [CrossRef]
- Rochedo, P.R.; Soares-Filho, B.; Schaeffer, R.; Viola, E.; Szklo, A.; Lucena, A.F.; Rathmann, R. The threat of political bargaining to climate mitigation in Brazil. Nat. Clim. Chang. 2018, 8, 695–698. [Google Scholar] [CrossRef]
- Eduardo, V.; Franchini, M. Brazil and Climate Change: Beyond the Amazon; Routledge: Abingdon, UK, 2017. [Google Scholar]
- Giannini, T.C.; Costa, W.F.; Cordeiro, G.D.; Imperatriz-Fonseca, V.L.; Saraiva, A.M.; Biesmeijer, J.; Garibaldi, L.A. Projected climate change threatens pollinators and crop production in Brazil. PLoS ONE 2017, 12, e0182274. [Google Scholar] [CrossRef] [PubMed]
- Zheng, B.; Xu, Q.; Shen, Y. The relationship between climate change and quaternary glacial cycles on the Qinghai–Tibetan Plateau: Review and speculation. Quat. Int. 2002, 97, 93–101. [Google Scholar] [CrossRef]
- Hartmann, B. Rethinking climate refugees and climate conflict: Rhetoric, reality and the politics of policy discourse. J. Int. Dev. J. Dev. Stud. Assoc. 2010, 22, 233–246. [Google Scholar] [CrossRef]
- Spratt, D.; Sutton, P. Climate Code Red: The Case for Emergency Action; Scribe Publications: Sidney, Australia, 2008. [Google Scholar]
- Tang, Z.; Brody, S.D.; Quinn, C.; Chang, L.; Wei, T. Moving from agenda to action: Evaluating local climate change action plans. J. Environ. Plan. Manag. 2010, 53, 41–62. [Google Scholar] [CrossRef]
- Rosenzweig, C.; Solecki, W.; Hammer, S.A.; Mehrotra, S. Cities lead the way in climate–change action. Nature 2010, 467, 909–911. [Google Scholar] [CrossRef] [PubMed]
- Burch, S. Transforming barriers into enablers of action on climate change: Insights from three municipal case studies in British Columbia, Canada. Glob. Environ. Chang. 2010, 20, 287–297. [Google Scholar] [CrossRef]
- Yigitcanlar, T. Rethinking Sustainable Development: Urban Management, Engineering, and Design; IGI Global: Hershey, PA, USA, 2010. [Google Scholar]
- Yigitcanlar, T. Sustainable Urban and Regional Infrastructure Development: Technologies, Applications and Management: Technologies, Applications and Management; IGI Global: Hershey, PA, USA, 2010. [Google Scholar]
- Selin, H.; VanDeveer, S.D. Changing Climates in North American Politics: Institutions, Policymaking, and Multilevel Governance; MIT Press: Cambridge, MA, USA, 2009. [Google Scholar]
- Shove, E. Beyond the ABC: Climate change policy and theories of social change. Environ. Plan. A 2010, 42, 1273–1285. [Google Scholar] [CrossRef]


| City | Population | Environmental Body and Council | Master Plan in Accordance with the Statute of the City | City’s Networks | Data Available on the Internet |
|---|---|---|---|---|---|
| Goiânia State of Goiás Midwest Region | 1,466,105 | Yes | 2007 | ICLEI UCLG | Yes |
| Salvador State of Bahia Northeast Region | 2,953,986 | Yes | 2016 | C40 ICLEI UCLG | Yes |
| Manaus State of Amazonas North Region | 2,130,264 | Yes | 2014 | ICLEI | Yes |
| São Paulo State of São Paulo Southwest Region | 12,106,920 | Yes | 2014 | C40 ICLEI UCLG | Yes |
| Curitiba State of Paraná South Region | 1,908,359 | Yes | 2015 | C40 ICLEI UCLG | Yes |
| Mitigation | Adaptation | Resilience | Cooperation |
|---|---|---|---|
| GHG emissions inventories | GHG emissions inventories | GHG emissions inventories | City networks |
| Master plan | Master plan | Master plan | Master plan |
| Land use regulations | Land use regulations | Land use regulations | Decentralized cooperation |
| Housing local plan | Housing local plan | Housing local plan | Decentralized cooperation |
| Mobility local plan | Mobility local plan | Mobility local plan | Decentralized cooperation |
| Sanitation local plan | Sanitation local plan | Sanitation local plan | Decentralized cooperation |
| Waste management plan | Waste management plan | Waste management plan | Decentralized cooperation |
| Drainage local plan | Drainage local plan | Drainage local plan | Decentralized cooperation |
| Public health local plan | Public health local plan | Public health local plan | Decentralized cooperation |
| Climate mitigation plan | Climate adaptation plan | Disasters management plan | Decentralized cooperation |
| Topic | Type | City | ||||
|---|---|---|---|---|---|---|
| CURITIBA | GOIÂNIA | MANAUS | SALVADOR | SÃO PAULO | ||
| Climate | Emissions Inventory | 2013 Emissions Inventory—3rd Edition | 2016 Emissions Inventory—2nd Edition | 2013 Emissions Inventory—1st Edition | 2009 Emissions Inventory—2nd Edition | |
| Plan | 2009 Climate Action Plan | 2011 Sustainable Goiânia | The Card of Amazonia | Coastal Management Plan | 2009 Climate Change Municipal Policy | |
| Legislation/ Report | 2016 Curitiba Strategic Actions: Climate and Resilience | 2016 Local Policy on the Prevention, Reduction and Compensation of CO2 and Other Vehicular Emissions | 2011 Environmental Code (proxy to a local climate plan) | 2015 Sustainable Development and Innovation Incentives Municipal Program | ||
| Report | 2014 Curitiba’s Environmental and Socio-Economic Vulnerabilities Evaluation | 2015 Environmental and Sustainable Development Municipal Policy | ||||
| Urban Planning | Plan | 2015 Master Plan | 2007 Master Plan | 2014 Master Plan | 2016 Master Plan | 2014 Master Plan |
| Land Use Regulations | Legislation | 2000 Land Use Regulations | 1994 Urban Zoning | 2014 Land Use Legislation | 2016 Land Use Regulations | 2016 Zoning and Land Use Regulations |
| 2008 Environmental Zoning | 2014 Urban Perimeter Legislation | 2017 Building Code | 2017 Building Code | |||
| 2008 Building Code | 2014 Building Code | |||||
| Housing | Plan | Social Housing Municipal Plan | Provisions on Social Housing | 2008–2015 Municipal Housing Plan | Municipal Housing Plan | |
| Mobility | Legislation/ Plan | 2014–2017 Urban Mobility Plan | Urban Mobility Plan | 2015 Urban Mobility Plan | 2018 Sustainable Urban Mobility Municipal Plan | 2015 Urban Mobility Plan |
| 2001 Municipal Transportation System | ||||||
| Sanitation | Plan | 2017 Sanitation Municipal Plan | Municipal Sanitation Plan | 2014 Municipal Sanitation Plan | 2010–2011 Municipal Sanitation Plan | 2010–2030 Municipal Sanitation Plan |
| 2017 Water Distribution Municipal Plan | ||||||
| 2017 Sewage Municipal Plan | ||||||
| Waste Management | Plan | 2017 Waste Management Municipal Plan | 2014 Waste Management Local Plan | 2010 Waste Management Municipal Plan | 2012 Waste Management Municipal Plan | 2014 Waste Management Municipal Plan |
| Drainage | Plan | 2017 Urban Drainage Plan | 2014 Drainage Regulations | 2012 Drainage and Rainwater Management Manual | ||
| Disasters Management | Legislation/ Plan | Municipal Civil Defense System | 1998/2010 Municipal Civil Defense System | 2014–2017 Municipal Public Health Plan | 2015 Rain Contingency Plan | 2006 Municipal Civil Defense System |
| 2017 Urban Arborization Plan | ||||||
| 2013 Civil Defense System | ||||||
| Public Health | Plan | 2018–2021 Municipal Public Health Plan | 2014/2017 Municipal Public Health Plan | 2014–2017 Municipal Public Health Plan | 2018–2021 Municipal Public Health Plan | 2014–2017 Municipal Public Health Plan |
| International Cooperation | Legislation/ Platform/ Agreement | Participation in city’s networks: ICLEI, CGLU, C40; International Affairs Secretariat reports; Nazca platform | Participation in Cities Networks: ICLEI, CGLU, UBERLAC, Sustainable and Emergent Cities Initiative; International Affairs Municipal Advisory reports; Nazca Platform; Vulnerability Assessment (UNFCCC Adaptation Platform) | Participation in City’s Networks: ICLEI; Nazca Platform; Municipality’s reports | Participation in City’s Networks: ICLEI, CGLU, C40; Nazca Platform; Decentralized cooperation agreements | Participation in City’s Networks: ICLEI, CGLU, C40; International Affairs Secretariat Reports |
| Twin-Cities Agreement Regulations | ||||||
| Node | Expressions |
|---|---|
| Climate change | “mudança climática” OR “mudanças climáticas” OR “mudança do clima” OR “mudanças do clima” OR “alteração do clima” OR “alterações do clima” OR “alteração climática” OR “alterações climáticas” |
| Adaptation | Adaptaç* |
| Risk | Risco* |
| Vulnerability | Vulnerabilidade OR vulnerave* |
| Water | Água OR “recursos hídricos” OR permeabilidade OR drenagem |
| International agreements | “acordo internacional” OR “acordos internacionais” OR “cooperação internacional” OR “cooperação descentralizada”OR “relações internacionais” OR “internacionalização” |
| International financing | “financiamento internacional” OR “financiamentos internacionais” |
| International organizations | “organização internacional” OR “organizações internacionais” Or “agência internacional” OR “agências internacionais” OR “ONU” OR “HABITAT” OR “Banco Mundial” Or “Banco Interamericano de Desenvolvimento” OR “BID” OR “World Bank” OR “Organização Mundial da Saúde” |
| International networks | “rede internacional“ OR “redes internacionais” Or “ICLEI” OR “CGLU” OR “C40” |
| NDC | Ndc OR indc |
| PNA | PNA OR “Plano Nacional de Adaptação” OR “Plano Nacional de Adaptação à Mudança do Clima” |
| PNMC | “política nacional sobre mudanças do clima” OR “política nacional sobre mudança do clima”OR “política nacional de mudanças climáticas” OR “política nacional de mudança do clima” OR “PNMC” |
| Global warming | “aquecimento global” |
| Greenhouse effect | “efeito estufa” |
| Carbon emissions | “emissão de carbono” OR “emissão de gases” OR “emissões” |
| Energy | energia |
| Mitigation | Mitig* |
| Pollution | poluição |
| Resilience | Resiliência OR resiliente* |
| PNPDEC | “política nacional de proteção e defesa civil” OR PNPDEC OR “Sistema Nacional de Proteção e Defesa Civil” OR SINPDEC OR “Conselho Nacional de Proteção e Defesa Civil” OR CONPDEC |
| Disaster | Desastre* OR enchente* OR escorregamento* OR seca* OR INCÊNDIO* |
| Extreme events | “evento extremo” OR “eventos extremos” OR “evento climático extremo” OR “eventos climáticos extremos” OR evento*+extremo* |
| Resilience | Resiliência OR resiliente* |
| Sectoral public health plan for climate change mitigation and adaptation | “plano sectorial da saúde para mitigação e adaptação à mudança do clima” OR “PSMC-Saúde” OR “plano setorial da saúde para mitigação adaptação às mudanças climáticas” OR “plano sectorial da saúde para mitigação e adaptação à mudança climática” |
| Health | saúde |
| Entity | Edition | Year | Method | Source | Technical Support |
|---|---|---|---|---|---|
| Manaus | No official emissions inventory | ||||
| Amazonas | No official emissions inventory | ||||
| Salvador | 1st | 2013 | GPC | Prefeitura De Salvador (2016) | ICLEI WRI Brazil |
| Bahia | 1st | 2008 | IPCC 2006 | Governo Do Estado Da Bahia (2010) | None |
| Goiânia | 2nd | 2016 | GPC | Abreu (2017) | Inter-American Development Bank |
| Goiás | No official emissions inventory | ||||
| São Paulo | 2nd | 2009 | IPCC 2006 | Instituto Ekos Brasil, Geoklock Consultoria e Engenharia Ambiental (2013) | World Bank |
| Estado de São Paulo | 1st | 2008 | IPCC 2006 | Governo Do Estado De São Paulo (2011) | British Embassy |
| Curitiba | 3rd | 2013 | GPC | Prefeitura De Curitiba (2016) | ICLEI |
| Paraná | 1st | 2012 | IPCC 2006 | Governo Do Estado Do Paraná (2015) | None |
| Climate Plan | Adaptation | Cooperation | Mitigation | Resilience |
|---|---|---|---|---|
| Curitiba (2009) | 3 | 1 | 7 | 0 |
| Goiânia (2011) | 63 | 15 | 46 | 26 |
| Manaus (2011) | 35 | 1 | 45 | 0 |
| Salvador (2015) | 28 | 4 | 57 | 2 |
| São Paulo (2009) | 23 | 1 | 99 | 7 |
| Total | 152 | 22 | 254 | 35 |
| Master Plan | Adaptation | Cooperation | Mitigation | Resilience |
|---|---|---|---|---|
| Curitiba (2015) | 44 | 1 | 22 | 9 |
| Goiânia (2007) | 59 | 0 | 10 | 7 |
| Manaus (2014) | 42 | 0 | 3 | 0 |
| Salvador (2016) | 143 | 0 | 63 | 45 |
| São Paulo (2014) | 253 | 0 | 62 | 42 |
| Total | 541 | 1 | 160 | 253 |
| City | Adaptation | Cooperation | Mitigation | Resilience |
|---|---|---|---|---|
| Curitiba | 137 | 2 | 23 | 31 |
| Goiânia | 358 | 13 | 61 | 552 |
| Manaus | 22 | 0 | 7 | 4 |
| Salvador | 70 | 0 | 23 | 10 |
| São Paulo | 64 | 0 | 25 | 8 |
| Total | 651 | 15 | 139 | 605 |
| CURITIBA | Adaptation | Cooperation | Mitigation | Resilience |
|---|---|---|---|---|
| Disasters | 9 | 0 | 0 | 24 |
| Drainage | 531 | 1 | 35 | 179 |
| Health | 2 | 0 | 0 | 2 |
| Housing | 112 | 10 | 23 | 4 |
| Mobility | 1 | 0 | 2 | 0 |
| Sanitation | 1318 | 18 | 37 | 64 |
| Waste | 59 | 4 | 37 | 5 |
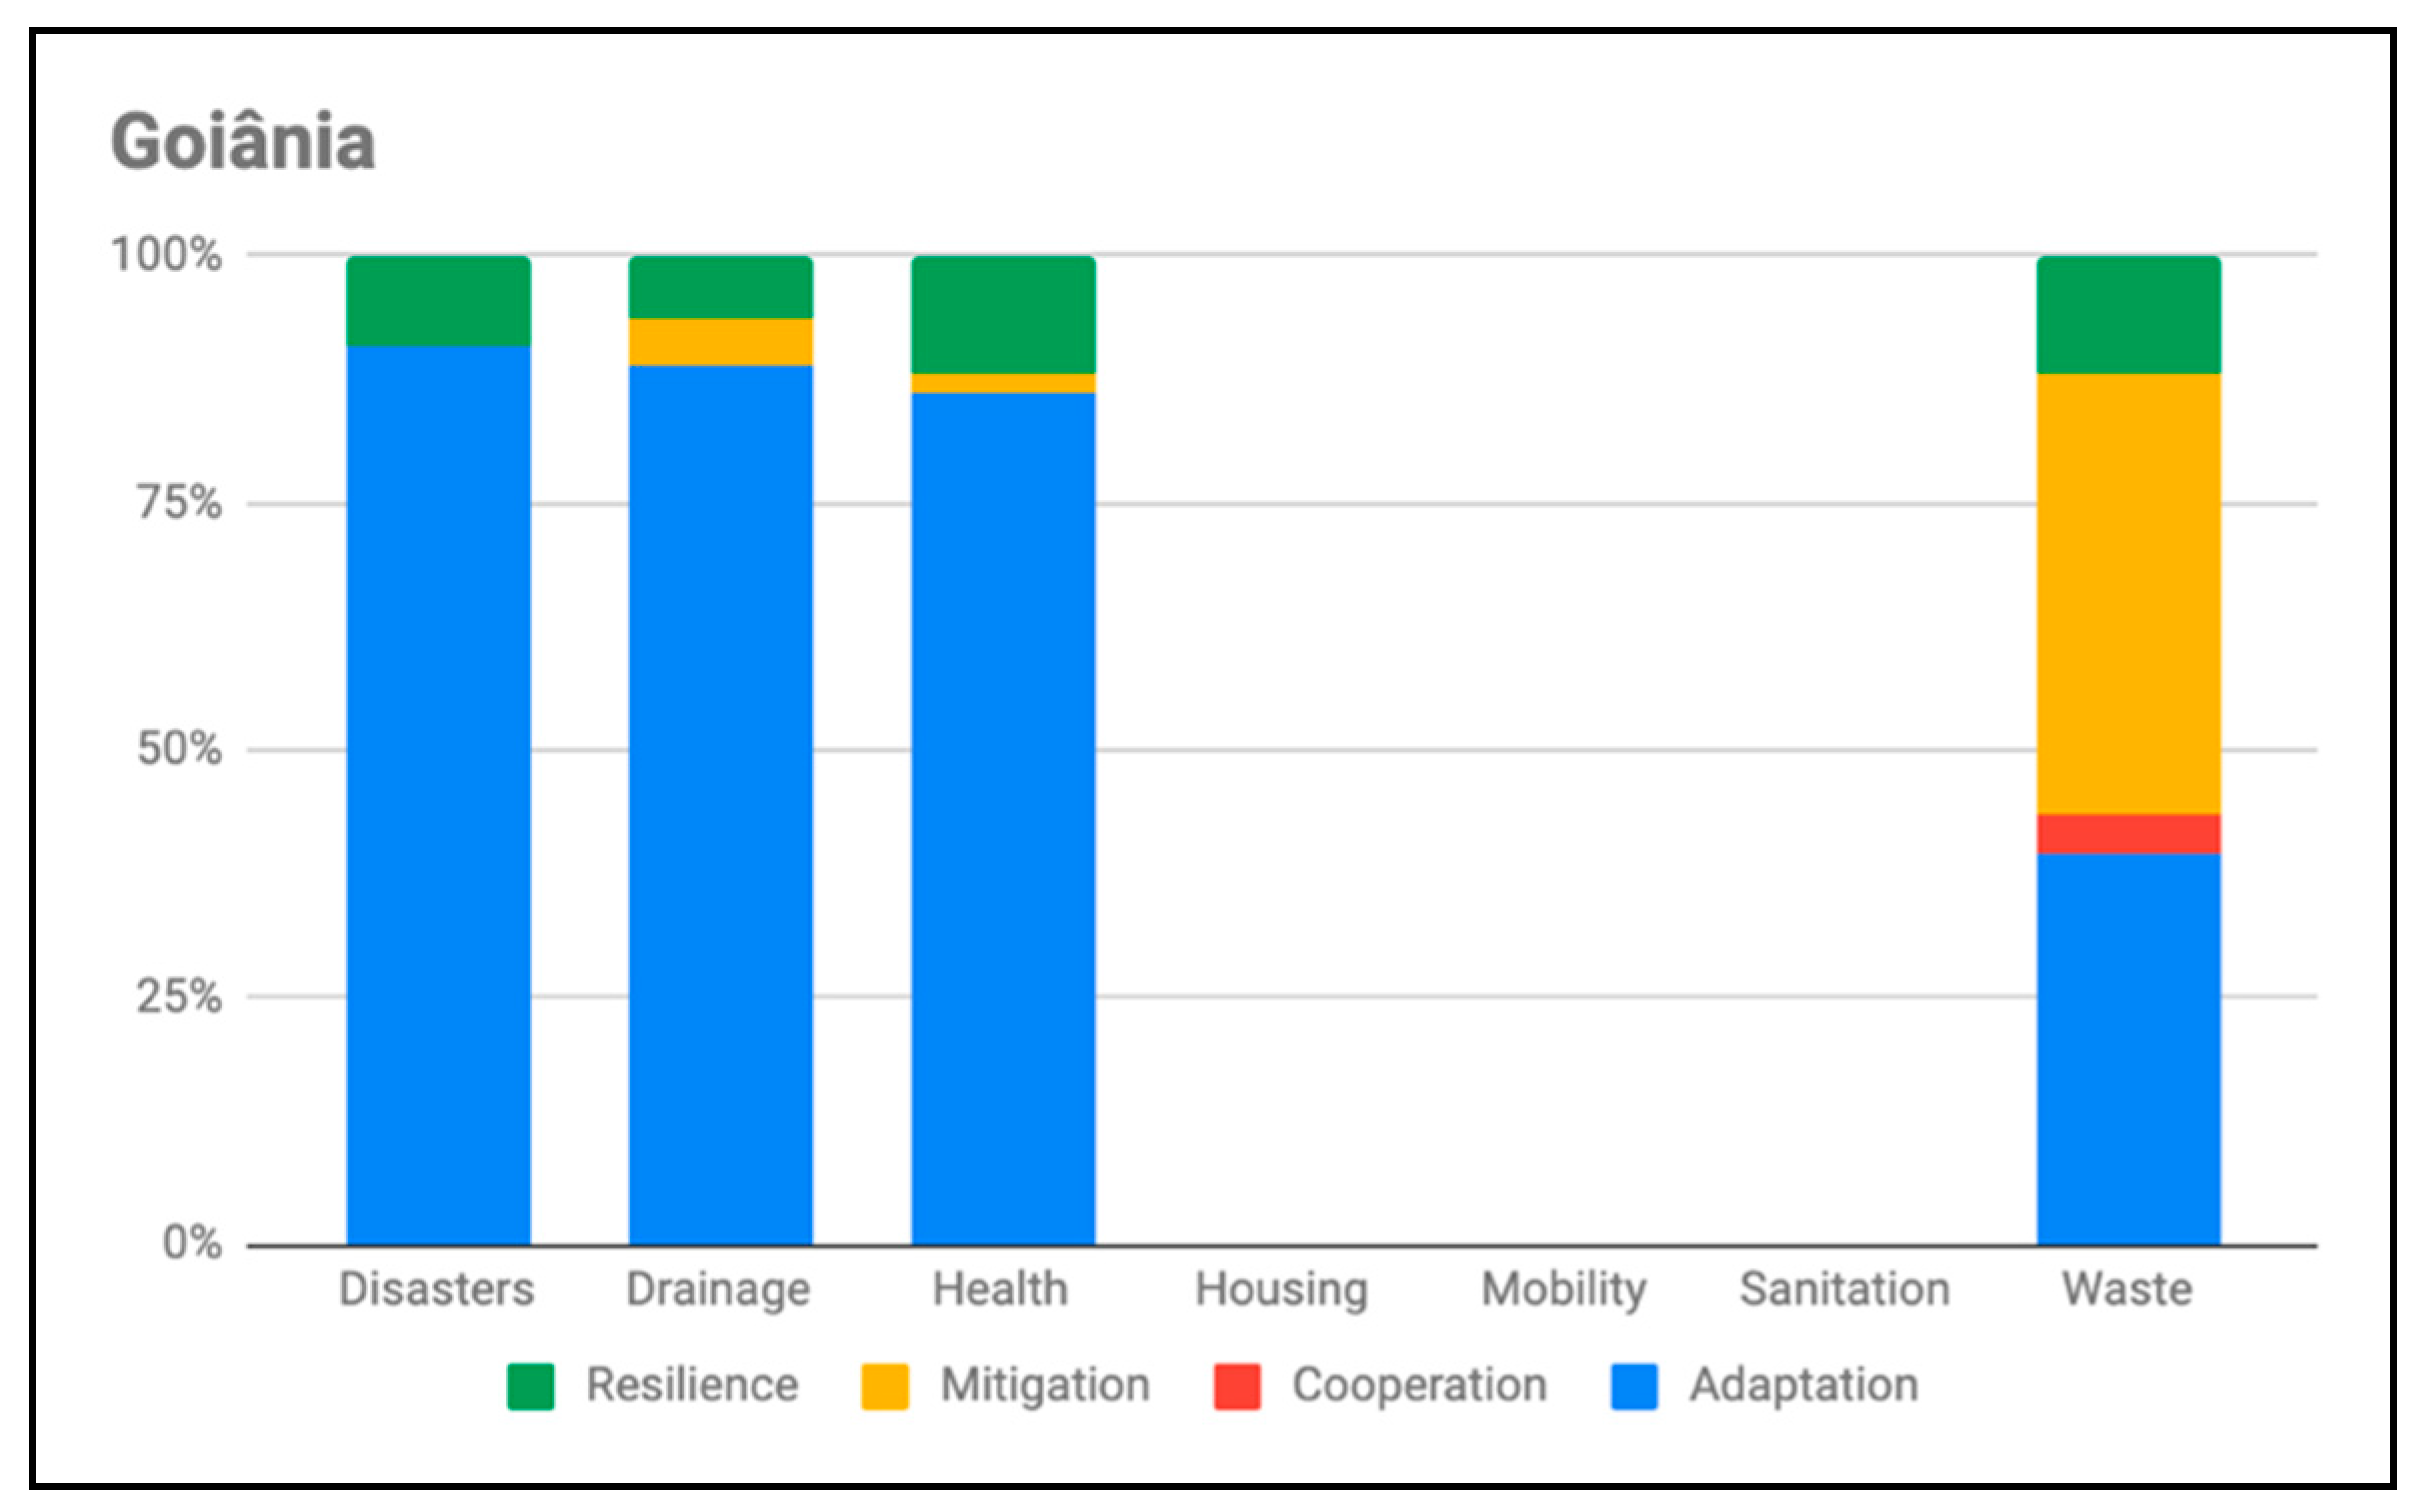
| GOIÂNIA | Adaptation | Cooperation | Mitigation | Resilience |
|---|---|---|---|---|
| Disasters | 20 | 0 | 0 | 2 |
| Drainage | 57 | 0 | 3 | 4 |
| Health | 44 | 0 | 1 | 6 |
| Housing | 0 | 0 | 0 | 0 |
| Mobility | 0 | 0 | 0 | 0 |
| Sanitation | 0 | 0 | 0 | 0 |
| Waste | 76 | 8 | 86 | 23 |
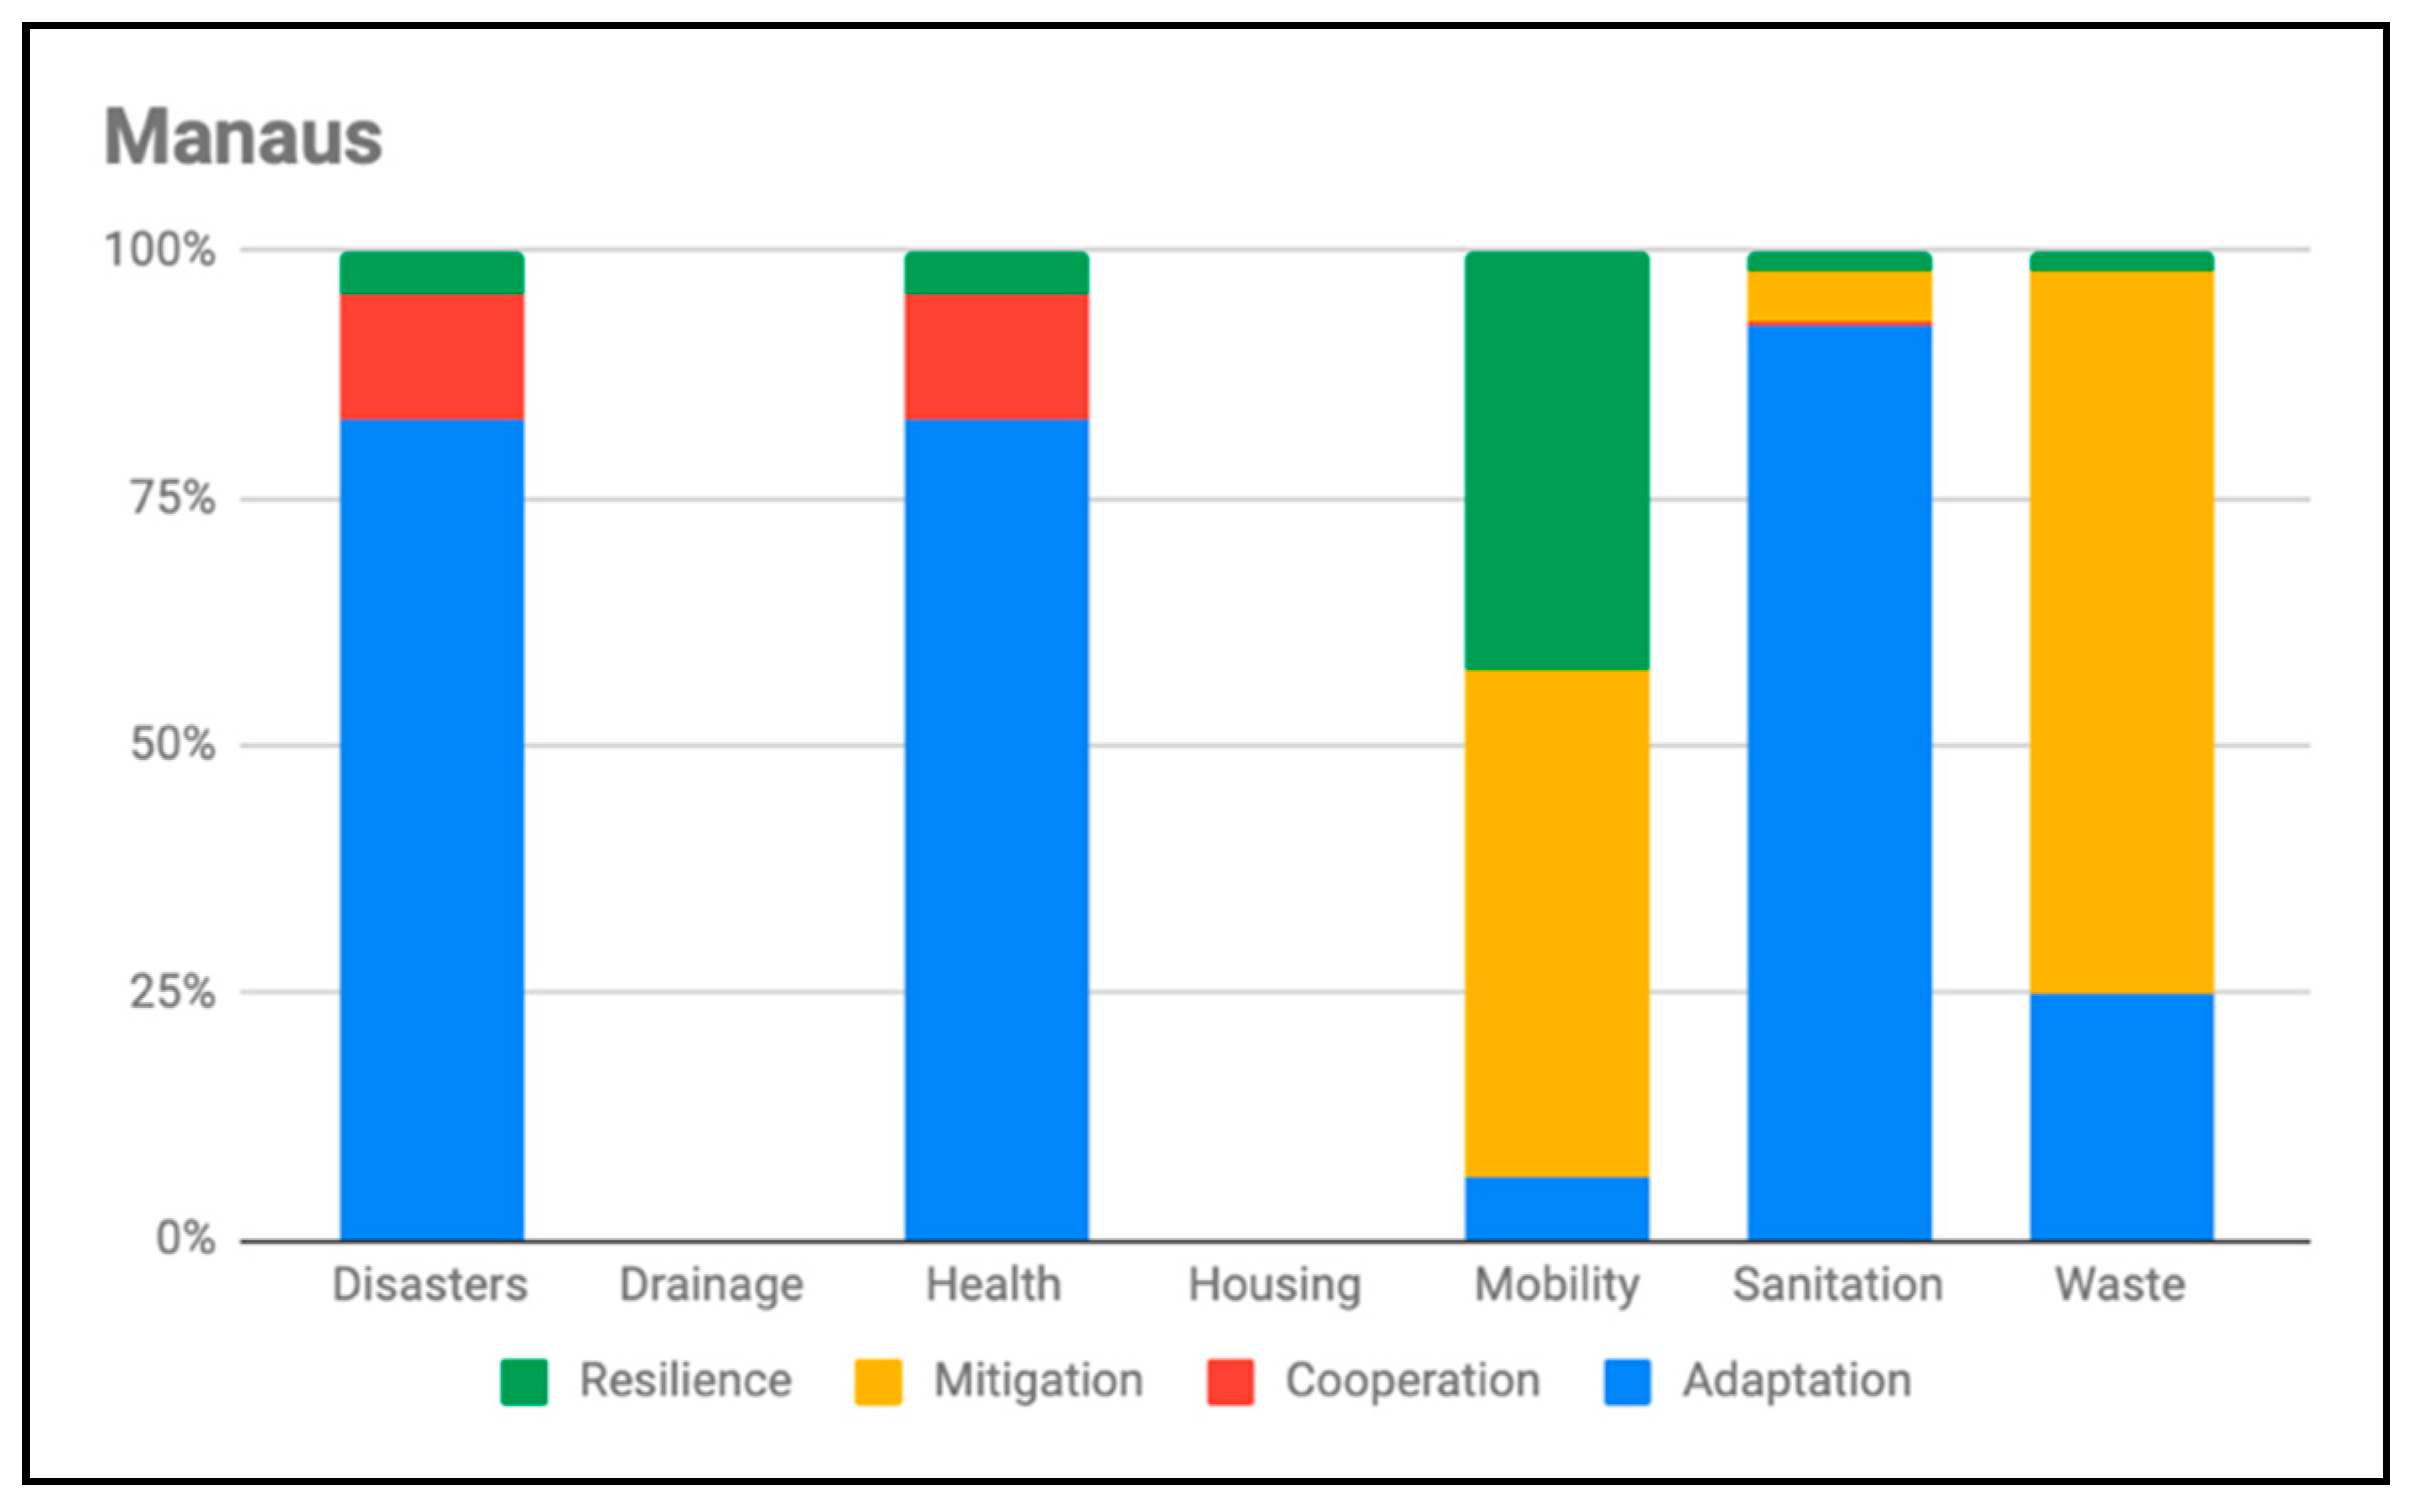
| MANAUS | Adaptation | Cooperation | Mitigation | Resilience |
|---|---|---|---|---|
| Disasters | 39 | 6 | 0 | 2 |
| Drainage | 0 | 0 | 0 | 0 |
| Health | 39 | 6 | 0 | 2 |
| Housing | 0 | 0 | 0 | 0 |
| Mobility | 16 | 0 | 131 | 107 |
| Sanitation | 553 | 3 | 30 | 12 |
| Waste | 40 | 0 | 117 | 3 |
| SALVADOR | Adaptation | Cooperation | Mitigation | Resilience |
|---|---|---|---|---|
| Disasters | 99 | 0 | 2 | 118 |
| Drainage | 0 | 0 | 0 | 0 |
| Health | 195 | 13 | 6 | 52 |
| Housing | 0 | 0 | 0 | 0 |
| Mobility | 36 | 9 | 62 | 11 |
| Sanitation | 18 | 0 | 1 | 0 |
| Waste | 1 | 0 | 0 | 0 |
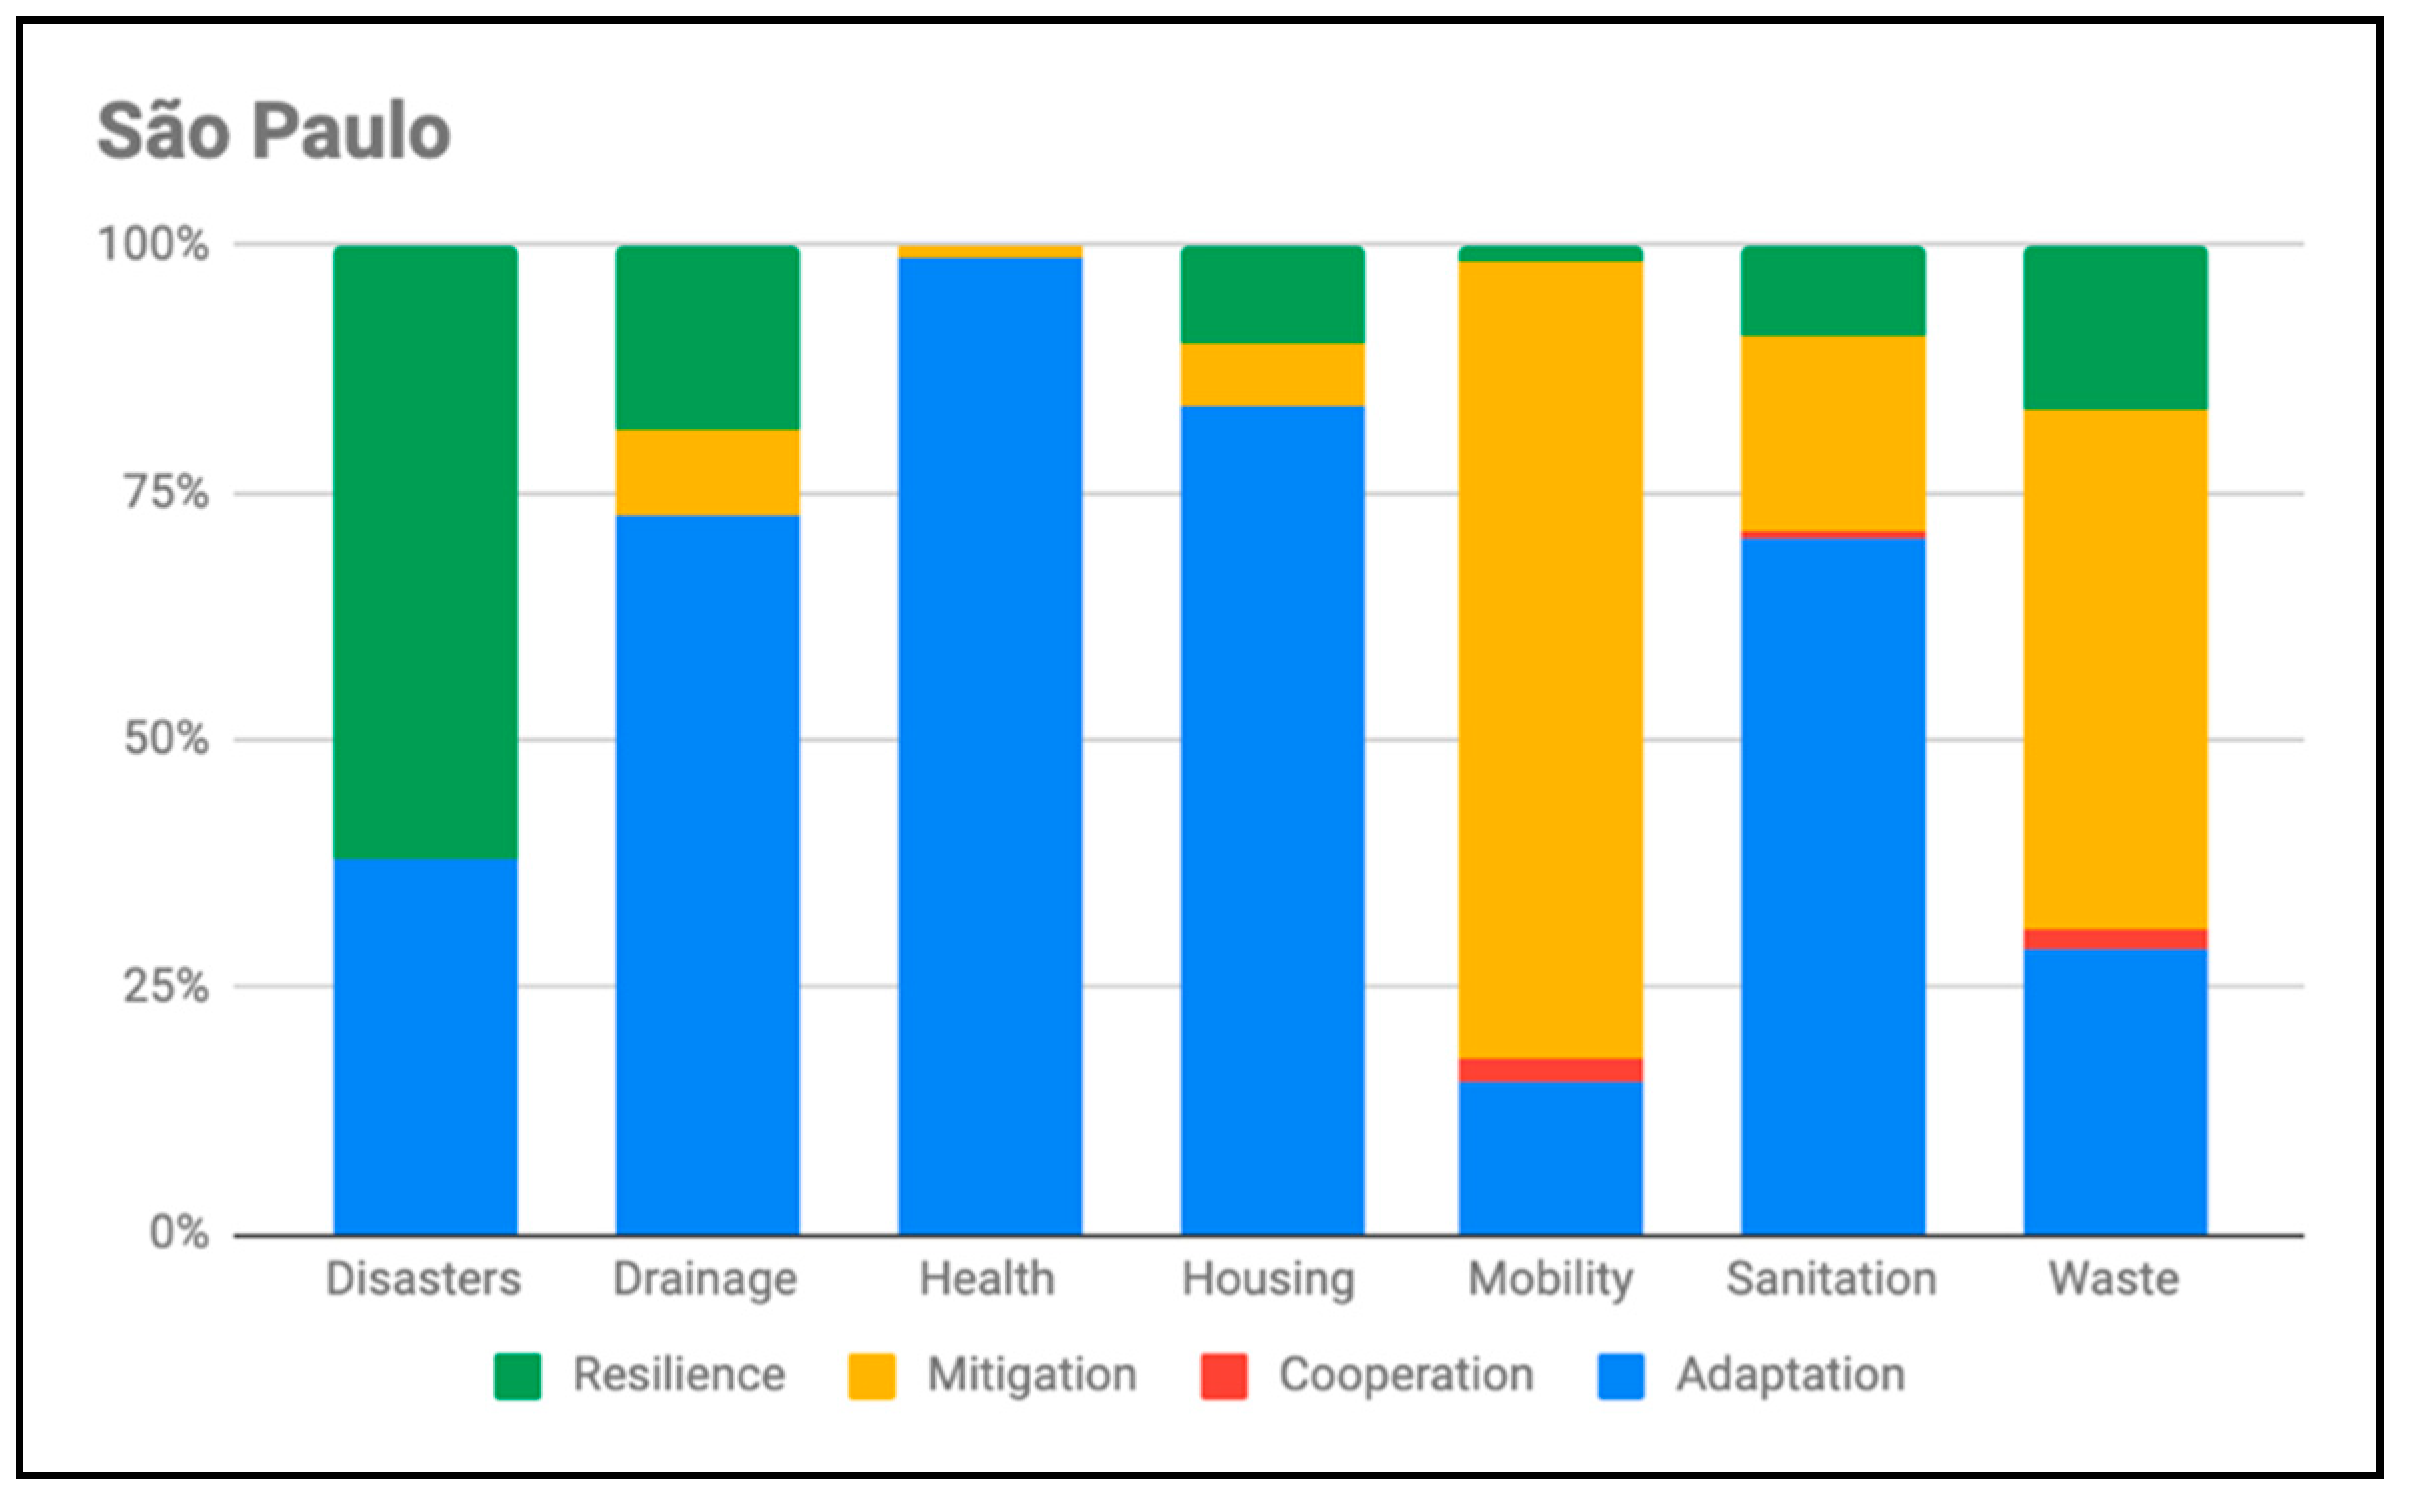
| SÃO PAULO | Adaptation | Cooperation | Mitigation | Resilience |
|---|---|---|---|---|
| Disasters | 25 | 0 | 0 | 41 |
| Drainage | 1666 | 4 | 202 | 425 |
| Health | 271 | 0 | 3 | 0 |
| Housing | 103 | 0 | 8 | 12 |
| Mobility | 43 | 7 | 228 | 4 |
| Sanitation | 721 | 10 | 202 | 93 |
| Waste | 84 | 6 | 153 | 48 |
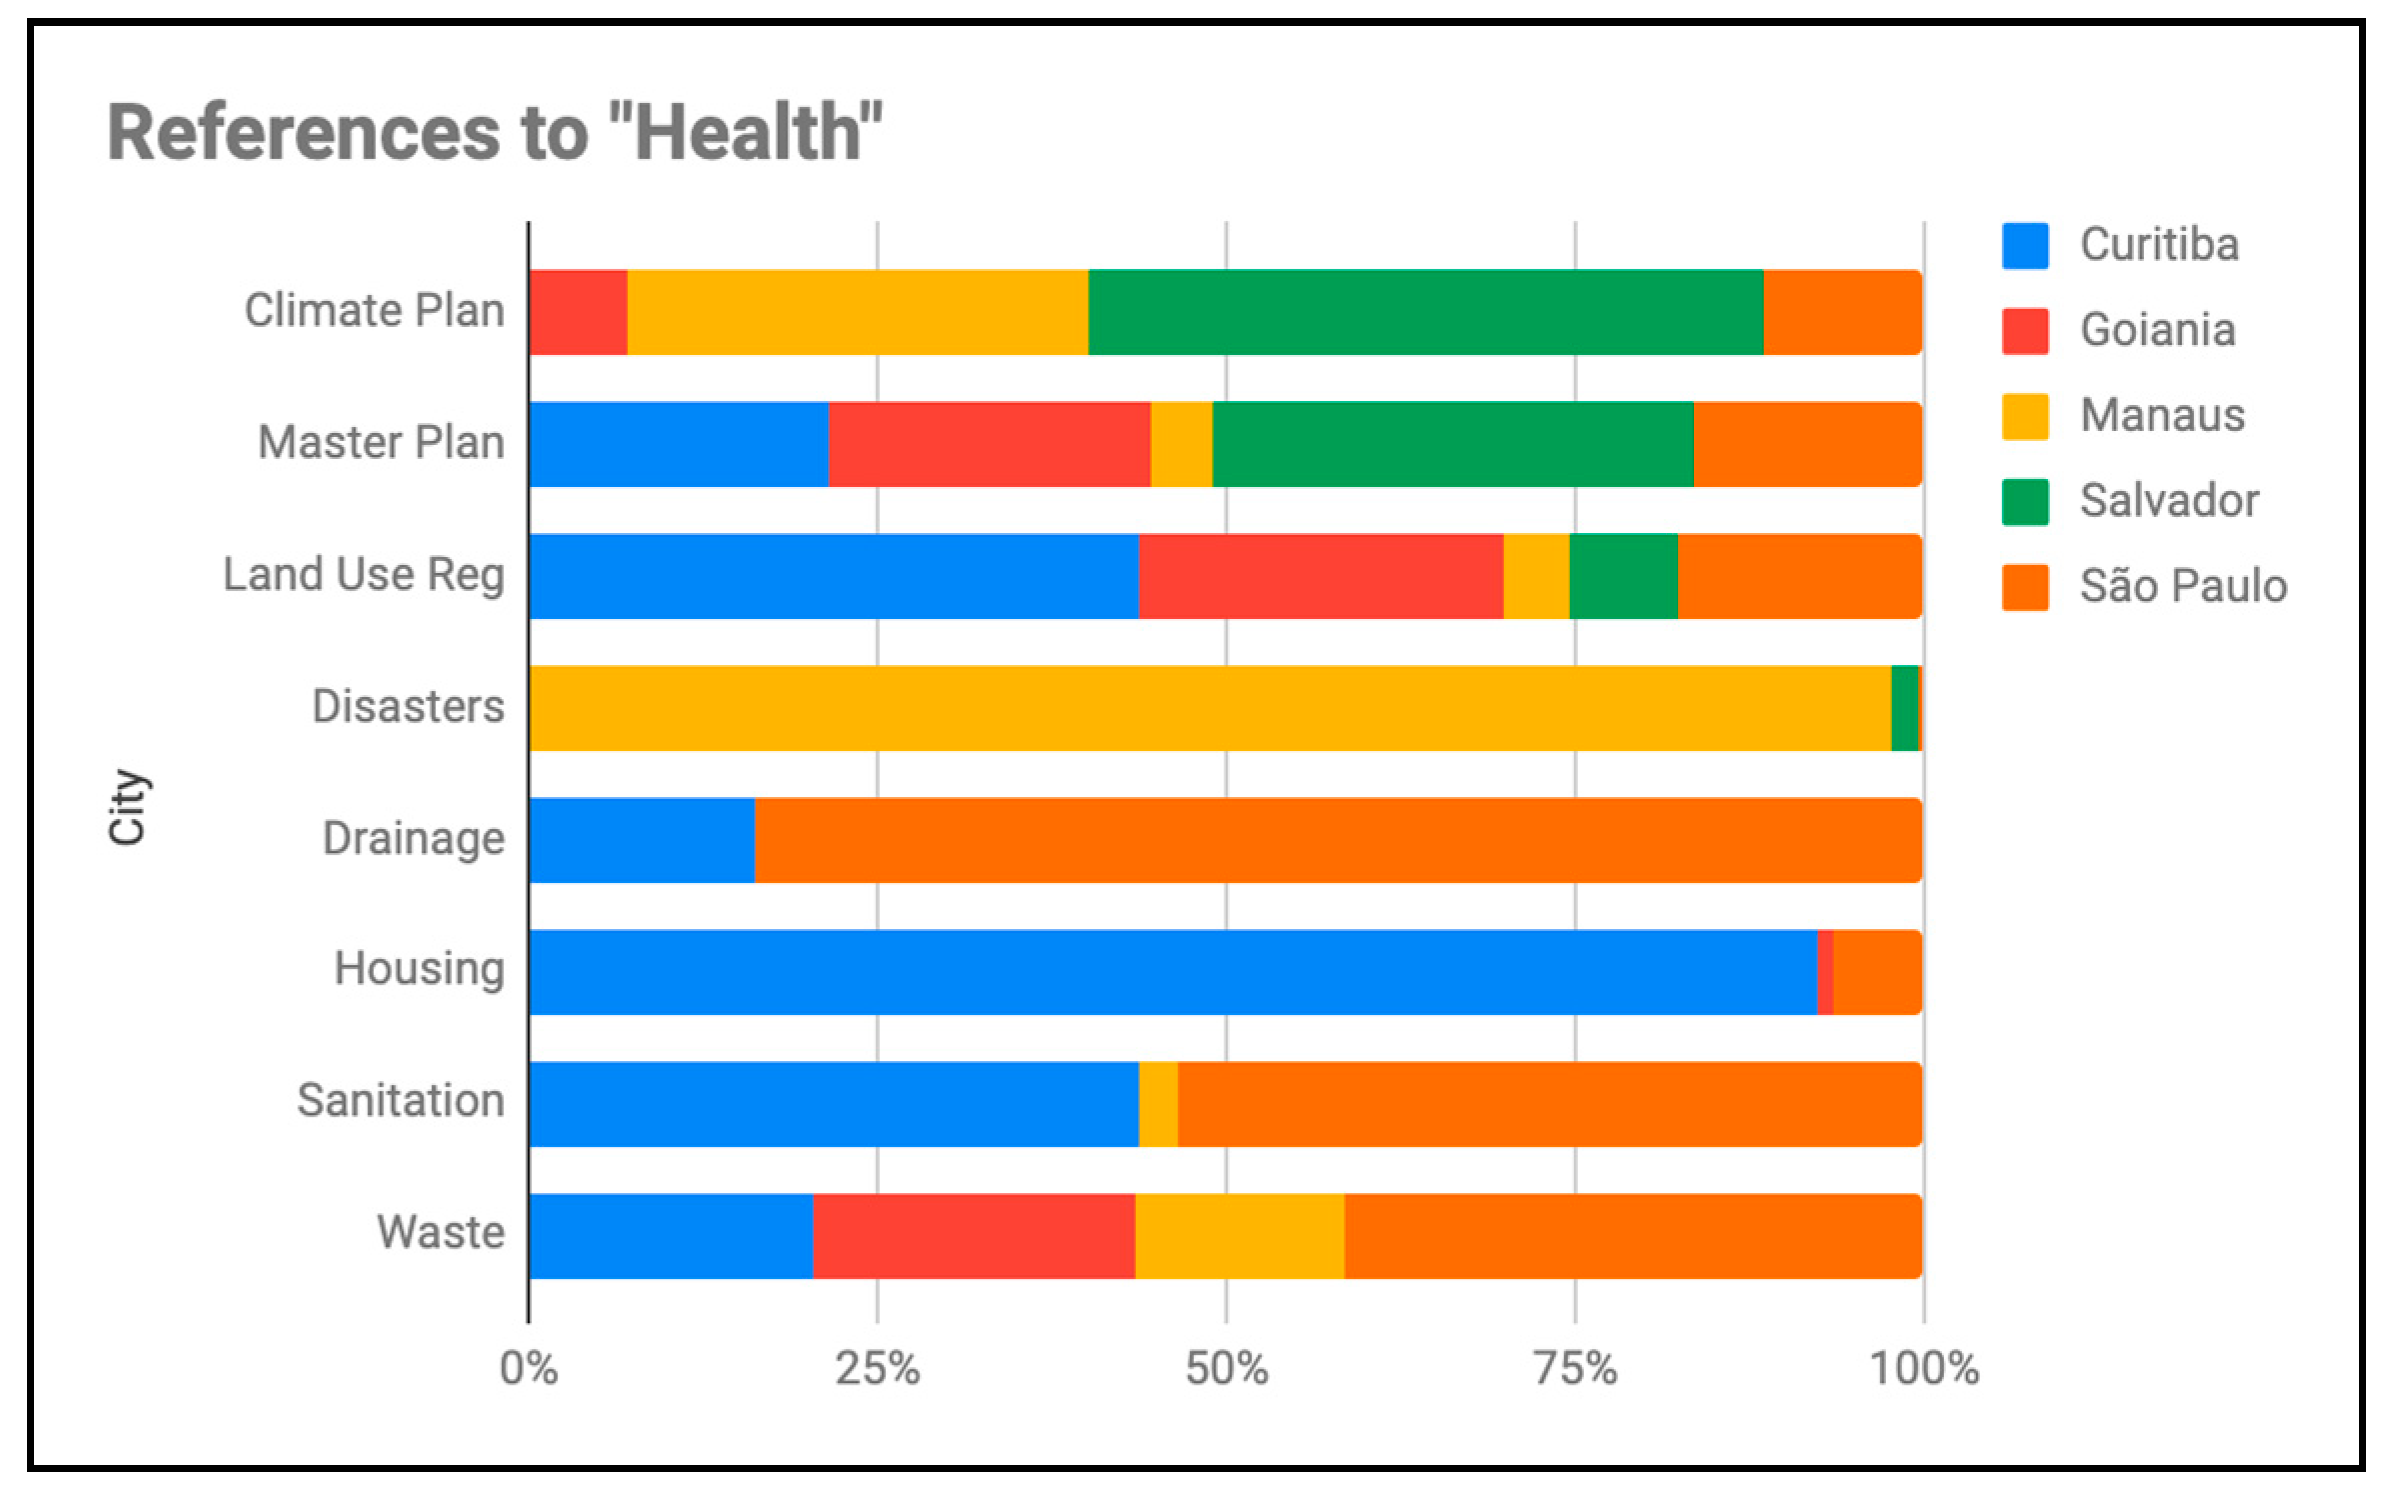
| Documents | Curitiba | Goiania | Manaus | Salvador | São Paulo |
|---|---|---|---|---|---|
| Climate Plan | 0 | 5 | 23 | 34 | 8 |
| Master Plan | 43 | 46 | 9 | 69 | 33 |
| Land Use Regulations | 62 | 37 | 7 | 11 | 25 |
| Disasters | 1 | 0 | 948* | 21 | 3 |
| Drainage | 6 | 0 | 0 | 0 | 31 |
| Housing | 84 | 1 | 0 | 0 | 6 |
| Sanitation | 279 | 0 | 18 | 0 | 343 |
| Waste | 110 | 124 | 82 | 0 | 224 |
| Sectoral Policy | Adaptation | Cooperation | Mitigation | Resilience |
|---|---|---|---|---|
| Disasters | 192 | 6 | 2 | 187 |
| Drainage | 2254 | 5 | 24 | 608 |
| Housing | 215 | 10 | 31 | 16 |
| Mobility | 96 | 16 | 423 | 122 |
| Sanitation | 1437 | 31 | 270 | 169 |
| Public Health | 561 | 19 | 10 | 62 |
| Waste | 260 | 18 | 394 | 79 |
| Total | 5015 | 105 | 1370 | 1243 |
© 2019 by the authors. Licensee MDPI, Basel, Switzerland. This article is an open access article distributed under the terms and conditions of the Creative Commons Attribution (CC BY) license (http://creativecommons.org/licenses/by/4.0/).
Share and Cite
Sotto, D.; Philippi, A., Jr.; Yigitcanlar, T.; Kamruzzaman, M. Aligning Urban Policy with Climate Action in the Global South: Are Brazilian Cities Considering Climate Emergency in Local Planning Practice? Energies 2019, 12, 3418. https://0-doi-org.brum.beds.ac.uk/10.3390/en12183418
Sotto D, Philippi A Jr., Yigitcanlar T, Kamruzzaman M. Aligning Urban Policy with Climate Action in the Global South: Are Brazilian Cities Considering Climate Emergency in Local Planning Practice? Energies. 2019; 12(18):3418. https://0-doi-org.brum.beds.ac.uk/10.3390/en12183418
Chicago/Turabian StyleSotto, Debora, Arlindo Philippi, Jr., Tan Yigitcanlar, and Md Kamruzzaman. 2019. "Aligning Urban Policy with Climate Action in the Global South: Are Brazilian Cities Considering Climate Emergency in Local Planning Practice?" Energies 12, no. 18: 3418. https://0-doi-org.brum.beds.ac.uk/10.3390/en12183418