Comprehensive Quality Assessment Algorithm for Smart Meters
by
 ,
,
Shengyuan Liu
1 ,
,
Fangbin Ye
2,
Zhenzhi Lin
1,*,
Jia Yang
3,
Haigang Liu
2,
Yinghe Lin
4 and
Haiwei Xie
5 1
College of Electrical Engineering, Zhejiang University, Hangzhou 310027, China
2
State Grid Zhejiang Electric Power Research Institute, Hangzhou 310014, China
3
State Gird Zhejiang Ningbo Power Supply Company, Ningbo 315000, China
4
Zhejiang Huayun Information Technology Co., Ltd., Hangzhou 310012, China
5
Department of Electrical and Electronic Engineering, Imperial College London, London SW7 2AZ, UK
*
Author to whom correspondence should be addressed.
Energies 2019, 12(19), 3690; https://0-doi-org.brum.beds.ac.uk/10.3390/en12193690
Submission received: 24 August 2019
/
Revised: 13 September 2019
/
Accepted: 23 September 2019
/
Published: 26 September 2019
(This article belongs to the Special Issue Data Analytics in Energy Systems)
Abstract
:With the improvement of operation monitoring and data acquisition levels of smart meters, mining data associated with smart meters becomes possible. Besides, precisely assessing the operation quality of smart meters plays an important role in purchasing metering equipment and improving the economic benefits of power utilities. First, seven indexes for assessing operation quality of smart meters are defined based on the metering data and the Gaussian mixture model (GMM) clustering algorithm is applied to extract the typical index data from the massive data of smart meters. Then, the combination optimization model of index’s weight is presented with the subject experience of experts and object difference of data considered; and the comprehensive assessment algorithm based on the revised technique for order preference by similarity to an ideal solution (TOPSIS) is proposed to evaluate the operation quality of smart meters. Finally, the proposed data-driven assessment algorithm is illustrated by the actual metering data from Zhejiang Ningbo power supply company of China and practical application is briefly introduced. The results show that the proposed algorithm is effective for assessing the operation quality of smart meters and could be helpful for energy measurement and asset management.
1. Introduction
With the increase of customers’ requirements on power quality, power marketing has received more and more attention from power companies [1,2]. As a foundation of power marketing, energy metering provides basic data for accurate accounting of energy usage and energy revenue. Hence, the operation quality of the smart meters will have an important impact on the data quality, the application of electricity information acquisition system and the efficiency of power enterprises [3,4]. Therefore, it is of practical significance to study the assessment algorithm of operation quality for smart meters [5,6].
At present, there are several models and algorithms for comprehensively assessing the operation quality of smart meters produced by suppliers. These models and algorithms can be mainly divided into three types: The first is to evaluate the smart meters and the suppliers based on a certain index. The second is to propose multiple indexes of the smart meters from different aspects and then process data with the simple additive weighting (SAW) [7] method to evaluate the equipment. However, different indexes have different impacts on the operation quality of smart meters, so the assessment results of such algorithms are inaccurate if the importance of indexes is not considered. The third is to apply the expert scoring algorithm [8], analytic hierarchy process (AHP) [9] and some other subjective weighting methods to determine the weight of each index directly, which considers the difference of indexes’ impacts on smart meters. However, the results are quite subjective due to the limitation of experts’ knowledge and experience [10], which might lead to a large difference in the results of operation quality assessment of smart meters by different experts. Moreover, the quality assessment indexes of terminal meters for pre-operation quality, operation quality and maintenance are proposed and the quality assessment model for whole-life-cycle is presented based on entropy weight method and improved AHP in Reference [11]. In Reference [12], the hierarchical model and method of quality assessment for the whole-life-cycle of smart meters is proposed based on triangular fuzzy AHP and defect deduction method. In Reference [8], the whole-life-cycle quality assessment model of smart meters is constructed and the quality assessment from the perspectives of different suppliers, models, batches and single ones are realized. In Reference [13], an operation assessment method of electric energy metering device is proposed based on health index. In Reference [14], the status assessment indexes and models for electricity gateway meters are studied. In Reference [15], the demand analysis, technical architecture and development platform of the reliability prediction system of electricity meters based on cloud platform are introduced. In Reference [16], quality assessment indexes such as positive difference rate, negative difference rate and zero difference rate of smart meters are presented, the measurement assessment system of smart meters is constructed and the real-time monitoring platform for smart meters are developed. The strengths and weaknesses of the aforementioned methods are summarized in Table 1.
In summary, the current research on the quality assessment of smart meters is insufficient and there are fewer studies on the ranking of the suppliers from the operation quality of smart meters. Moreover, the current research is based on the hypothesis that the basic characteristics of smart meters can be acquired but actually, how to extract these basic characteristics is still an issue.
In order to monitor the states of power-consuming in time and accurately, a large number of smart meters have been installed at the user-side terminal, sending the metering and fault alarm data periodically to the metering control center. Because the production batch and installation area of the equipment are different and they have various models and interfaces, massive metering and fault alarm information would be continuously generated by smart meters [11]. In addition, non-quality factors such as environmental noise and electromagnetic interference may also lead to problems such as bad data and null data. Therefore, using data analysis technology to cluster the collected raw data first will help improve the data quality of smart meters [17,18]. Data analysis technology has gradually been applied to the field of power systems, which mainly includes data processing and data analysis algorithms. So far, data analysis technology has been gradually utilized to evaluate the operation quality of smart meters comprehensively [19]. Therefore, based on the statistical characteristics of the quality data of smart meters, this paper attempts to consider the probability of various fault alarm events produced by smart meters as the superposition of multiple Gaussian distributions. The Gaussian mixture model (GMM) [20,21] clustering algorithm is applied to discover the internal correlation among the fault alarm data and to extract the typical indexes that characterize the operation quality of the smart meters, thereby to reduce the storage scale and calculation complexity of the comprehensive assessment model of smart meters.
The motivations of this work are summarized as follows:
- The operation quality of the smart meters will influence the metering accuracy greatly, so it is of significant to assess the quality of smart meters comprehensively.
- Although there is some research about the assessment of smart meters, they have disadvantages such as one-sidedness and subjective. Therefore, it is required to present a comprehensive assessment algorithm including multiply indexes and combined weight methods to assess the quality of smart meters.
- There are massive data to be processed, therefore, it is necessary to utilize suitable clustering method (i.e., GMM clustering method in this work) to reduce the scale of data for further assessment.
Given this background, a GMM, combination weight model and revised TOPSIS (GCT)-based algorithm is proposed in this paper. First, seven indexes are defined to indicate the operation quality of the smart meters. The GMM clustering algorithm is used to extract the typical index data from the massive data of the smart meters. In order to determine the weights of the seven indexes more accurately, the combined optimization model is proposed based on AHP, the entropy weight method, the correlation coefficient method and the variation coefficient method. Then, with the revised TOPSIS, the operation quality of smart meters can be assessed comprehensively and sorted. Finally, the data of smart meters from the power utility company of a district in Ningbo city, Zhejiang Province, China, are adopted to verify the proposed algorithm. The application of the proposed algorithm in the actual system of Zhejiang Province is also introduced briefly.
2. Index Mining of Operation Quality Assessment of Smart Meters Based on GMM Clustering Algorithm
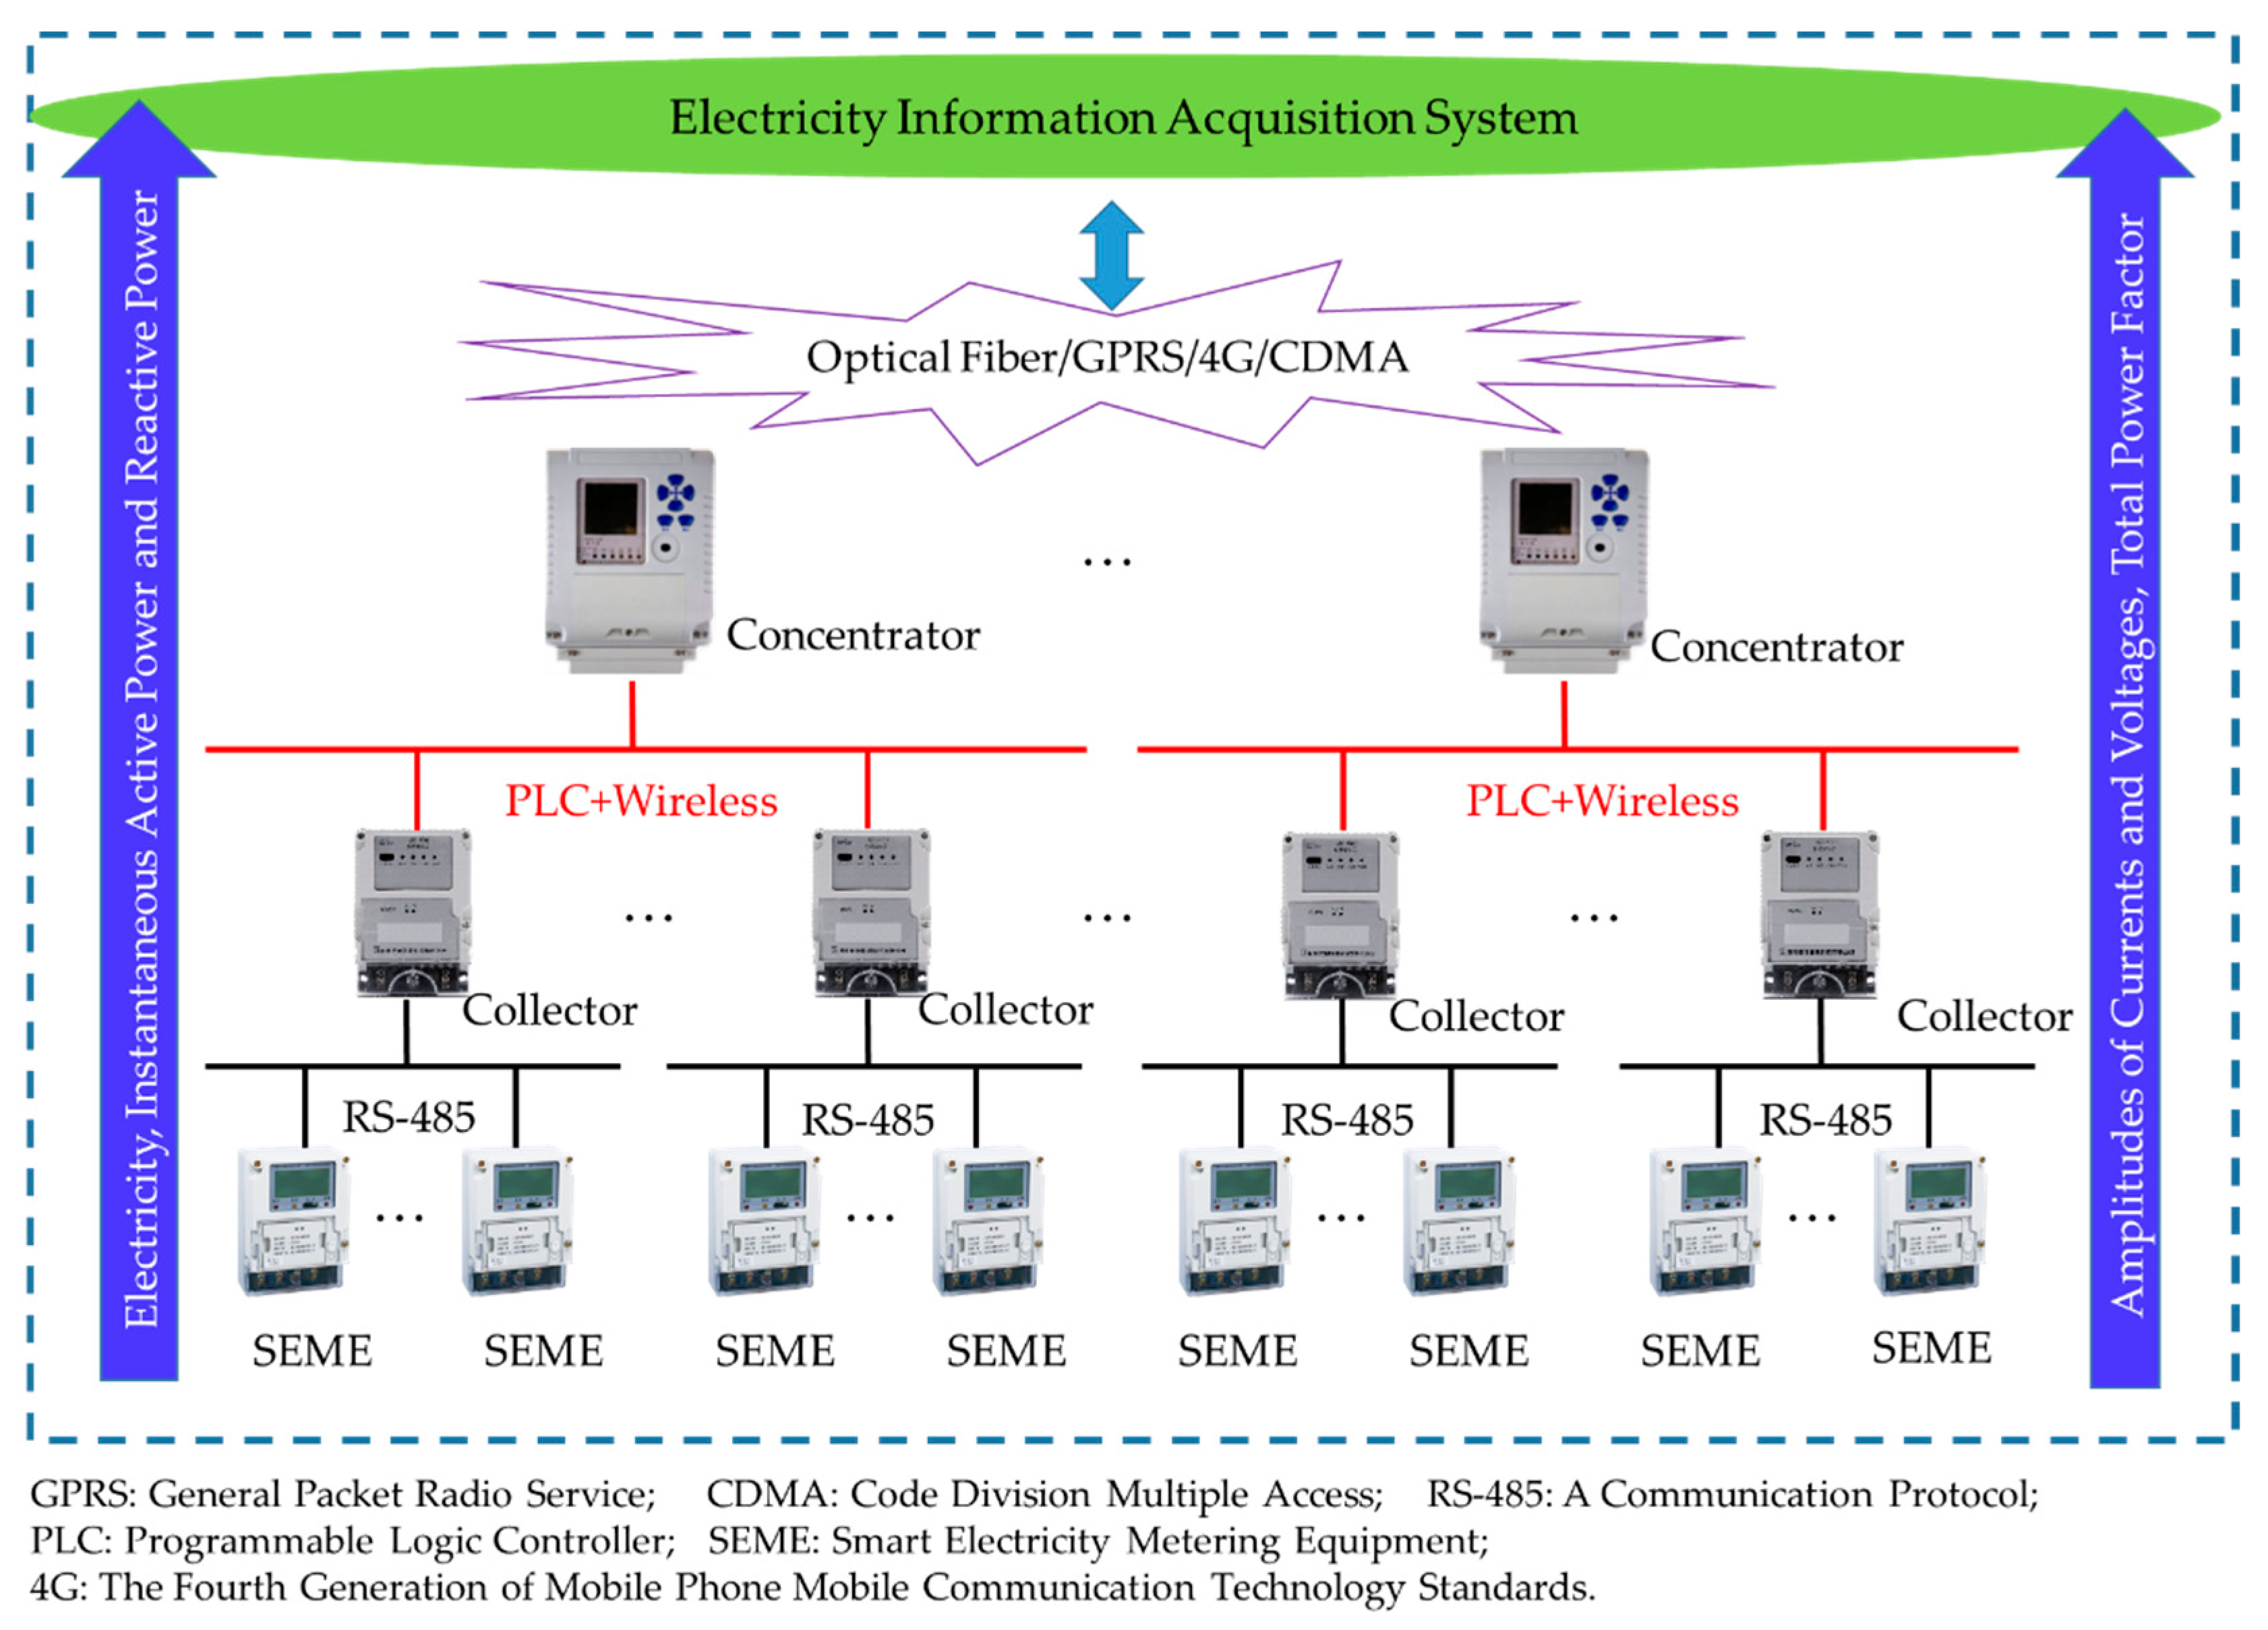
The electricity information acquisition system, which is shown in Figure 1, is deployed in most of power utilities in China. It can be seen from Figure 1 that data of energy, instantaneous active power and reactive power, amplitude of three-phase or two-phase currents and voltages and total power factor are recorded by smart meters produced by various suppliers. Then, these data are transmitted to collectors with RS-485 protocol. Next, the collected data would be further concentrated into concentrators by programmable logic controller (PLC) with wireless network. Finally, all data would be transmitted to electricity information acquisition system through optical fiber, general packet radio service (GPRS), the 4th generation of mobile phone mobile communication technology standards (4G) and code division multiple access (CMDA) techniques.
With the enhancement of information technology, these data can be employed to improve the accuracy of analysis for operation state of smart meters. Therefore, these data are gradually utilized to evaluate the operation quality of smart meters. Hence, seven indexes, which can represent the operation quality of smart meters from different aspects, are respectively defined as follows.
When data are collected from the user-side by smart meters, bad data are generated due to factors such as abrupt change of current or voltage and electromagnetic interference. Therefore, before the data collected being delivered into the assessment system, the unavailable data should be eliminated first, leaving the available ones to perform the quality assessment. In fact, smart meters can only measure the power consumption accurately under normal conditions. If the change rates of current and voltage were too fast, then the data measured would be not accurate. Besides, smart meters are electronic device and the transmission process from meters to concentrator is based on wireless network, so the data measured would also be influenced if there were electrometric interference. All these phenomena would influence the accuracy of data measured by smart meters and the ability to defense this influence can be regarded as an index for assessing the quality of smart meters. The more the available data are, the better the quality of the smart meters will be. Therefore, the availability rate of data collection (ARDC) is defined as
where Nsamp is the total number of sampling points, Tsamp,i is the window length of the ith sampling; and are respectively the total number of metering load data and the number of non-null load data. {E, P, Q, V, I, } denotes the data of energy, active power, reactive power, amplitude of voltage and current and power factor, respectively.
In actual operation, data may not be collected in a time period, which means that the data collection is incomplete. It will cause corresponding measurement errors generated by the metering system. The more completed the data collection is, the more accurate the measurement results of the smart meters will be. Therefore, the collection rate of power data (CRPD) is defined as
where and are respectively the number of data that should be collected theoretically and the number of data actually collected during the ith sampling point.
Abnormal information is recorded by smart meters during operation. In fact, there are many abnormalities w.r.t. smart meters and they can be divided into three categories according to experts’ experiences—serious abnormalities (e.g., energy meter breakdown); general abnormalities (e.g., abnormal power fluctuations, current imbalance, etc.); minor abnormalities (e.g., constant magnetic field interference, load overcapacity, etc.). Therefore, the serious, general and minor abnormalities (SAs, GAs and MAs) are respectively defined as
where Fser,i, Fgen,i and Fmin,i are, respectively, the number of SAs, GAs and MAs of the metering equipment during the ith sampling point.
The time between failures of smart meters refers to the time that can run before the first fault occurs. It is an important index, which reflects the reliability of the smart meters. The longer the time between failures is, the higher the operational reliability of the smart meters will be. Therefore, the time between failures (TBF) is defined as
where Nsamp,F is the first sampling point when Fser,i + Fgen,i + Fmin,i0.
In actual operation, the smart meter may continue to operate after self-reset or overhaul after a fault occurs. However, during the time of failures, the smart meter stops working. The longer the time of failures is, the greater the measurement deviation is and the worse the quality in the comprehensive assessment will be. Therefore, the operating failure rate (OFR) is defined as
where Trate and TF are the rated running time and fault outage time of the metering equipment, respectively.
Because there are a large number of smart meters and their types are different [18], the data of smart meters derived from the electricity information collection system cannot be applied to the operation quality assessment directly. Hence, the data clustering method is used to explore the typical characteristics of the operation quality of each supplier’s smart meters, so as to achieve a comprehensive assessment. In fact, the operation quality of smart meters is affected by many independent factors, such as the proficiency of workers in the production of the same batch, random errors in processing operations and the temperature, humidity and pollution levels of operating environment for the equipment. However, the impacts of these factors on the operation quality of the smart meters are not critical. According to the central limit theorem [22], the sum of distribution of a large number of independent random variables approximates the Gaussian distribution, so it can be considered that the quality data of smart meters collected in the same batch conform to the Gaussian distribution.
For GMM, the Gaussian distribution probability density function is utilized to describe data. By this data analysis technology, data are projected onto multiple Gaussian models and the probability of the data on each Gaussian model is obtained. Then, the model with the highest probability is selected to decompose a large data set into several small data sets that conform to the Gaussian distribution [20,21]. Therefore, the Gaussian mixture model can be used for data clustering to extract typical features from a data set. As mentioned before, for K batches of equipment under a smart meter supplier, the index data can be considered as a superposition of K Gaussian distribution data sets. Therefore, the Gaussian mixture model clustering algorithm is more suitable for mining the index data of the operation quality of smart meters than other clustering algorithms that do not consider the data distribution characteristics.
Assuming that the GMM is a mixture of K Gaussian distributions, each Gaussian distribution is called a “component.” The linear addition of these “components” is the probability density function of the GMM and is represented by
where represents the weight of the kth multidimensional single Gaussian distribution and represents the probability density function of the kth multidimensional single Gaussian distribution. is an auxiliary vector where xi represents a point for smart meter i in the 7-dimensional coordinate system with its coordinates are the indexes ARDC, CRPD, SAs, GAs, MAs and OFR defined in Equations (1)–(7). The practical meaning of xi can be regarded as the representation for the quality of smart meter i. N is the total number of smart meters to be clustered; is the expected vector of the kth Gaussian model and is the variance of the kth Gaussian model, respectively.
In the GMM clustering process, the parameters of each Gaussian distribution model need to be estimated and the estimation is performed by the expectation maximum (EM) algorithm [23]. Therefore, the steps of the GMM clustering algorithm for operation quality of smart meters’ data are as follows.
- (1)
- Let l = 0, and . Initiate the values of and randomly and find the initial posterior probability of the ith sample point xi belonging to the kth Gaussian model, which is represented by
- (2)
- Substitute the initial posterior probability obtained in step (1) into the maximum likelihood formula to obtain the GMM clustering parameters of the (l + 1)th iteration and as follows.
- (3)
- If < 10−5, terminate the iteration, determine as the estimated GMM clustering parameter and continue to the next step. Otherwise, return to step (2);
- (4)
- Obtain the probability of the ith sample point xi belonging to the kth Gaussian model by using the following Bayesian probability formula.
According to the maximum Bayesian probability criterion, the ith sample point xi is assigned into the Gaussian model of which the probability is maximized. When all the sample points of one supplier are assigned into their respective Gaussian models following the above steps, the GMM clustering is completed and the corresponding K cluster centers are obtained, that is, K typical points that reflect the operation quality of the suppliers’ smart meters. The coordinates of these typical points are typical values of the seven indexes. By obtaining the geometric center of the typical points under the same supplier, a row of decision matrix for the operation quality assessment of smart meters can be formed. A complete decision matrix of operation quality for smart meters, which will be discussed in Section 3, can be formed by determining the geometric centers of all suppliers.
Thus, the redundant and unimportant information in the original metric data of the operation quality assessment is discarded by the GMM clustering algorithm and the important data and typical characteristics of the original data are retained. Therefore, the GMM clustering algorithm greatly reduces the scale of the data and the calculation complexity of the comprehensive assessment of smart meters but brings about little influence on accuracy.
3. Combined Weight Optimization Model for Smart Meters
After the employment of the GMM clustering algorithm, seven typical operation quality indexes of the smart meters for each supplier can be obtained. These seven indexes characterize the operation quality of the smart meters from various aspects. In order to consider the impact of each index comprehensively on operation quality assessment, it is necessary to select an appropriate method to determine the importance (i.e., the weight) of each index. Weight determination methods commonly used include AHP which considers the subjective experience of experts [24], the entropy weight method which considers the degree of data dispersion [25,26], the correlation coefficient method which considers the degree of data correlation [27] and the variation coefficient method which considers the contrast strength of data [28]. In order to consider the degree of data dispersion, correlation, contrast strength and subjective will of experts comprehensively, the combined indexes’ weights for operation quality of smart meters are proposed. In this section, the normalization processing that needs to be performed before weight determination is introduced first; then the above four weight determination methods are introduced; finally, the combined optimization model of the operation quality index of the smart meters is presented. In fact, the seven indexes defined in Section 2 would not only be influenced by the quality of smart meters but also by many other factors such as quality of power distribution, failure or poor quality of other equipment and external environment. It is hard to completely discriminate among these factors to extract considerations regarding the quality of the smart meters only. This problem is an inherent defect of data-driven algorithms and this paper try to relive this problem by the combined weight optimization model. For instance, some indexes might be largely influenced by factors unrelated with the quality of smart meters, then these indexes can be given small weighs by experts in AHP weight method with their experiences.
Let D = (dij)B × L be the decision matrix of the operation quality assessment problem for smart meters, where B denotes the number of the suppliers of smart meters, L denotes the number of the indexes and dij denotes the jth index value of the ith smart meter supplier. Because different indexes have different units and the indexes can be divided into two types: Benefit type and cost type, it is not possible to directly compare the importance of each index. Therefore, they should be normalized by using Equations (15) and (16) to get a normalized decision matrix.
where and represent the minimum and maximum values of all smart meter suppliers on the index j, respectively; and represent the sets of benefit indexes and cost indexes, respectively. In this paper, = {1, 2, 6} and = {3, 4, 5, 7}.
The AHP, which is a subjective weighting method, obtains the weight of each index by comparing the importance of two pairs of indexes [24]. Let L indexes be U = {u1, u2, …, uL} and use aij from 1 to 9 to denote the ratio of importance between indexes ui and uj on the operation quality of smart meters. The larger the value is, the more important ui compared with uj is. In this way, a judgment matrix A = (aij)L×L of the operation quality assessment problem of the smart meters can be obtained and the judgment matrix has the following properties: aij > 0, aji = 1/aij, (i = 1, 2, …, L; j = 1, 2, …, L). Before determining the weight of each index, the consistency test is performed on the judgment matrix A. If the consistency test fails, the values of aij are contradictory and need to be re-assigned. If the test is passed, the values of aij are consistent and the judgment matrix A can be used for determining the indexes’ weights [24] as
where and .
In informatics, entropy is used to characterize the degree of disorder of the system and the degree of dispersion of the data [25,26]. The larger the information entropy of the index is, the less information it provides in the comprehensive assessment and the smaller the corresponding weight should be. Conversely, the smaller the information entropy is, the larger the weight should be. Therefore, the entropy of the operation quality index of the smart meters is defined as
where , and if . Therefore, the entropy weight of the jth operation quality index of smart meters is defined as
where and .
In statistics, the correlation coefficient is used to measure the correlation between two variables, including the Pearson correlation coefficient, Spearman correlation coefficient and Kendall correlation coefficient. The Pearson correlation coefficient is more suitable for data with Gaussian distribution. [27], so Pearson correlation coefficient [28] is utilized in this paper to detect the intrinsic correlation between indexes. The greater the degree of correlation is, the greater the repeatability of the information between the indexes is and the smaller the weight of the corresponding indexes should be; conversely, the smaller the correlation is, the greater the weight should be. Assuming that = and = respectively represent the xth and yth column vectors of the normalized decision matrix, the Pearson correlation coefficient between the xth and yth indexes is defined as
where and are the average values of and , respectively. Therefore, the weight based on correlation coefficients is defined as
where and .
The variation coefficient method is an objective weighting method that determines the weight of an index based on the strength of contrast among data [29]. The greater the variation of an index is, the greater the contrast strength relative to other indexes is, the higher the importance of the assessment object in the comprehensive assessment is and thus the greater its weight should be. Conversely, the smaller the variation is, the smaller the weight should be. The variation coefficient of the index uj is defined as
where denotes the average value of the vector . Therefore, the weight based on variation coefficient is defined as
where and .
Although the four subjective and objective methods are simple and easy to implement, they all have some deficiencies. Only the experiences of experts are considered by the subjective weighting method, which can easily lead to large subjective preferences. Only the actual data are employed in objective weighting method and there are inevitable errors in actual data, which may lead to the inconsistent assessment results in actual situation. In order to fully consider the subjective scoring based on expert experience and modify the weights according to the characteristics of the data themselves, a combined optimization model of index weight of operation quality for smart meters based on the weight membership degree is presented as
where represents the combined weight of the jth operation quality index to be optimized, represents the weight of the jth index obtained by the kth method and G represents the number of weight determination methods; is the membership function of the representation and is represented by
It can be seen that the larger the is, the closer the and will be.
4. Comprehensive Operation Quality Assessment Algorithm of Smart Meters Based on Revised TOPSIS
Once the combined weight of each operation quality index is determined, the comprehensive operation quality assessment of the smart meters can be transformed into a multi-attribute decision making (MADM) problem [30]. The revised TOPSIS, one of the MADM methods, measures the distance between the variables by their included angle. Besides, the assessed smart meters are sorted according to the closeness between them and the idealized target [31]. Therefore, the process of comprehensive operation quality assessment of smart meters based on the revised TOPSIS is as follows.
Form the assessment matrix of Q operation quality indexes corresponding to B suppliers of smart meters
where .
Determine the ideal point and negative ideal point in the operation quality assessment of the smart meters, which are respectively represented as
where , and j = 1, 2, …, L.
Obtain the angular distance between the operation quality indexes of each supplier and the ideal point/negative ideal point respectively, which are denoted as
where = denotes the ith row vector of assessment matrix R.
Determine the assessment values of the operation quality of smart meters as
It can be seen from Equations (30)–(32) that the better the operation quality of the smart meters produced by the ith supplier is, the closer the to 1 will be; conversely, the worse the operation quality is, the closer the to 0 will be. Therefore, the assessment result of the operation quality of the smart meters can be obtained according to the value of .
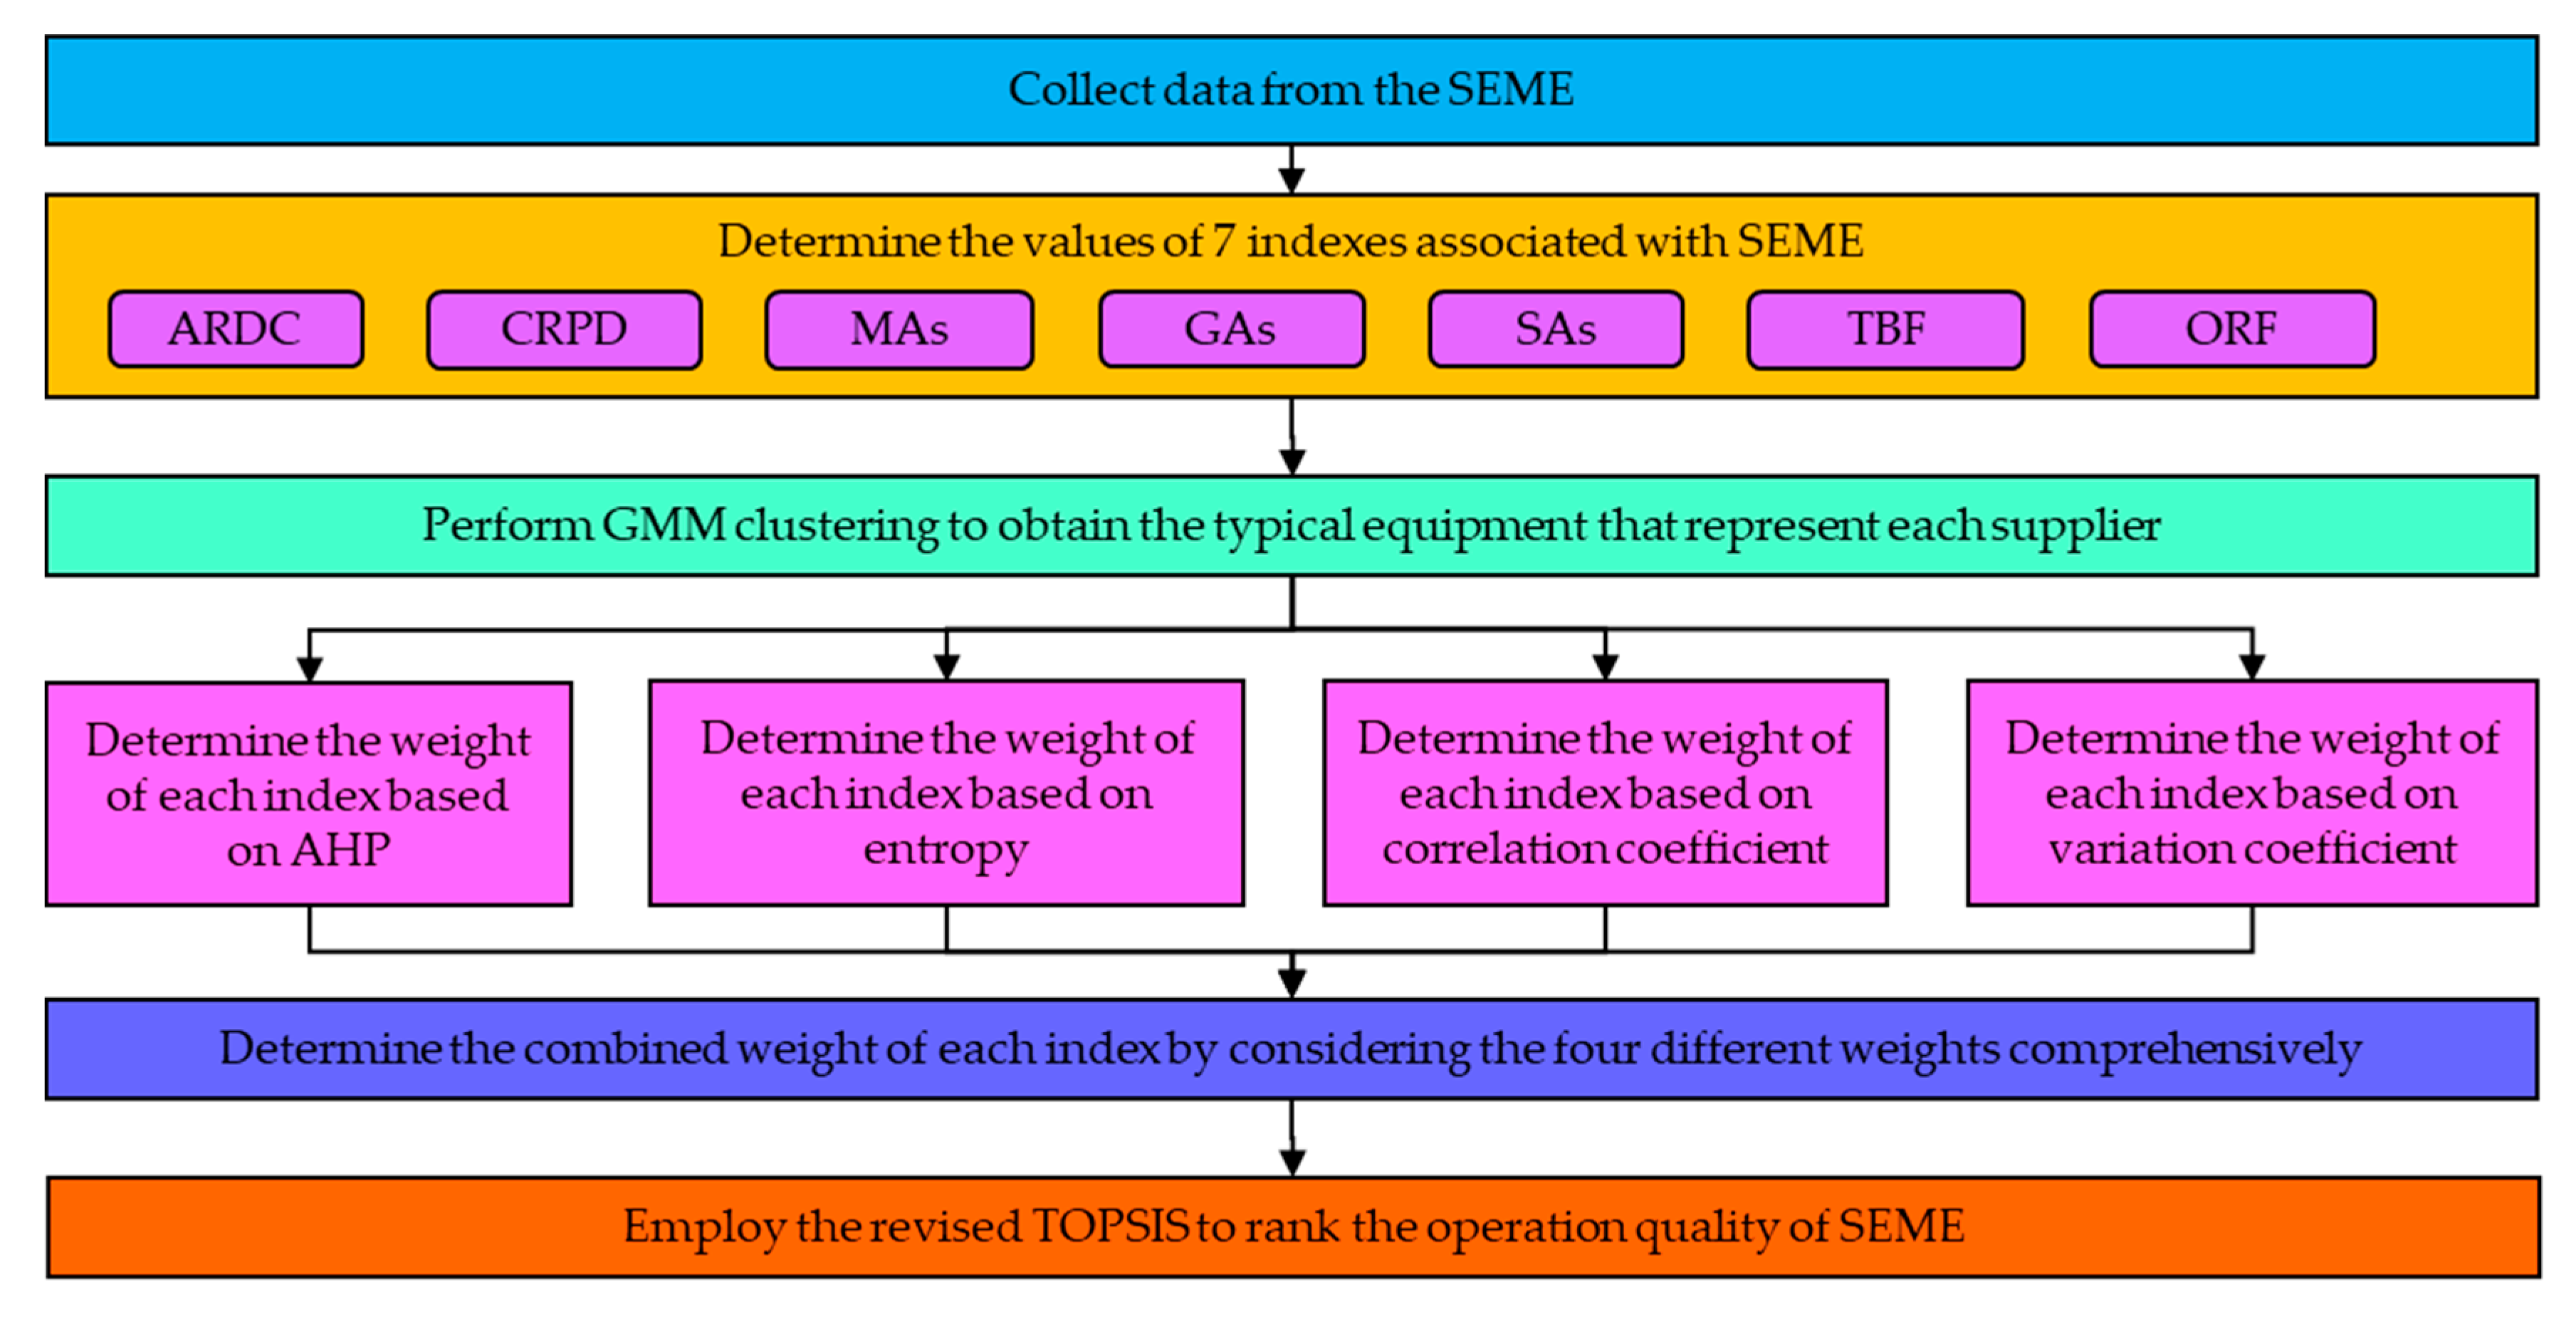
The overall process of the proposed GCT-based algorithm is shown in Figure 2.
5. Case Studies
In order to verify the effectiveness of the proposed GCT-based algorithm, the data of smart meters from part of Ningbo power distribution systems, Zhejiang Province, China, are involved in this section for assessment. There are total 11,565 records in the original data set and 11,312 available records are retained after data pre-processing. The data are collected from smart meters produced by 17 suppliers (i.e., NB_1, NB_2, …, NB_17) that located in Ningbo city and these suppliers are to be assessed. There are several equipment batches for each supplier and 58 batches in total. In this section, the data analysis of the operation quality of smart meters based on GMM clustering algorithm is performed first. Then, the effectiveness of the operation quality assessment algorithm based on the combined weight optimization model and the revised TOPSIS is demonstrated. Next, the comparisons among the proposed GCT-based algorithm and the algorithms based on SAW and AHP are given. Finally, the application of the algorithm in the actual system is briefly introduced.
5.1. Comprehensive Assessment of the Operation Quality of Smart Meters Based on GCT Algorithm
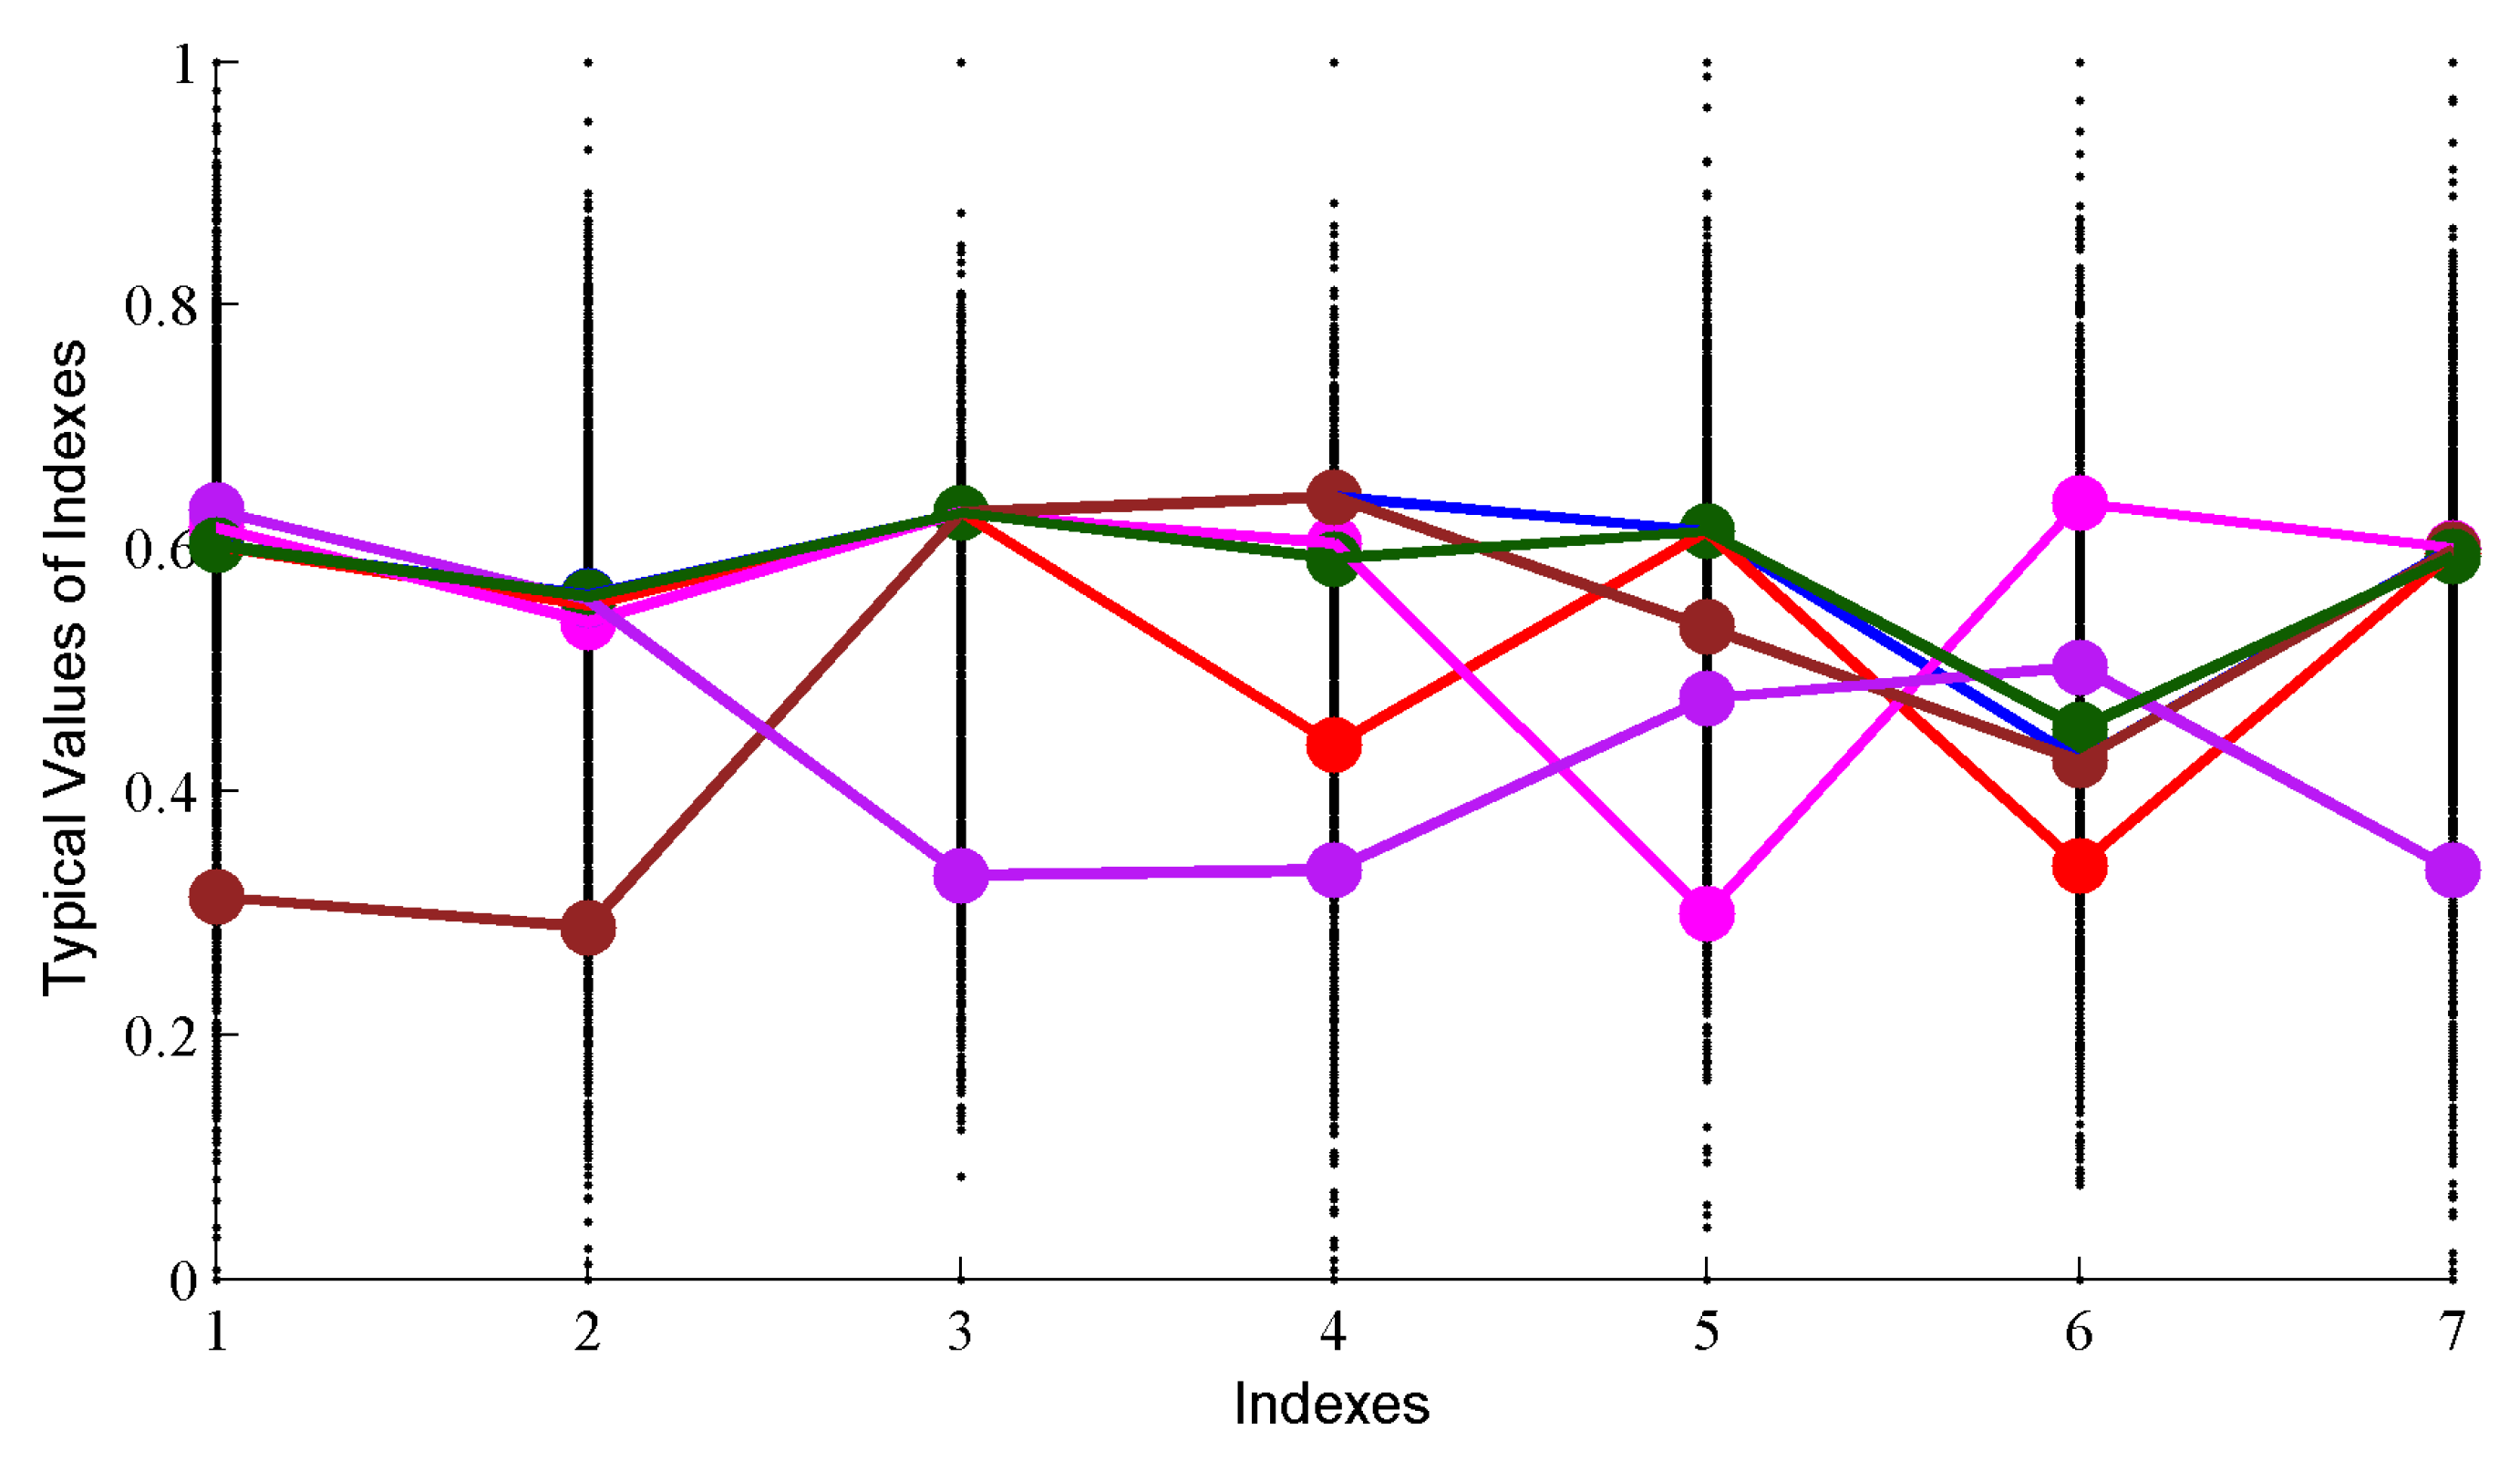
The data of 17 suppliers and their 58 batches are renumbered sequentially and the effectiveness of data processing by using the GMM clustering algorithm is analyzed by taking the supplier NB_12 as an example. There are 6 batches under the supplier NB_12 with a total of 1514 smart meters, respectively. There are seven indexes for each smart meter and the standardized scatter diagram and GMM clustering result of the operation quality indexes from the supplier NB_12 are shown in Figure 3. In Figure 3, the x-axes denotes the seven clusters (i.e., indexes , , … and ); and the y-axes denotes the typical values of , , …, for NB_12. Each line denotes a typical smart meter that represents this supplier. It can be seen from Figure 3 that the operation quality data of the 1514 smart meters under the supplier NB_12 conform to the superposition of 6 multi-dimensional Gaussian distribution models. In other word, the quality of smart meters produced by supplier NB_12 can be represented by six typical smart meters. The typical values reflecting their seven indexes are shown in Table 2.
By applying GMM clustering to each supplier, typical smart meters of the corresponding supplier can be obtained. As a result, the massive raw data of smart meters for operation quality assessment have been compressed and typical features retained. Then, the decision matrix D′ can be determined and its entries standardized are shown in Table 3 by gaining the geometric centers of the typical points.
The weights determined by the AHP algorithm are shown in Table 4. In addition, the index weights based on the entropy weight, the correlation coefficient, the variation coefficient and the combined weight optimization model are also presented in Table 4. It can be seen from Table 4 that the objective weight plays a certain role in correcting the subjective weight. According to the expert’s experience, the SAs (i.e., ) should be assigned with a large weight but the weights from the three other objective weighting methods are much smaller since the values of from different suppliers in the original data are relatively close. Therefore, compared with other indexes, this index cannot significantly distinguish the operation quality of the smart meters from each supplier. Thus, it should be given a small weight.
Based on the combined weights, the assessment matrix R of the operation quality is formed by using Equation (27). Then the operation quality of the smart meters is comprehensively assessed by the revised TOPSIS. Finally, the results of the comprehensive assessment for operation quality of smart meters are shown in Table 5.
It can be seen from Table 5 that the top 9 suppliers are as follows: NB_10, NB_9, NB_5, NB_7, NB_6, NB_13, NB_11, NB_16 and NB_4, of which the supplier NB_10 gets the highest score whereas the supplier NB_15 gets the lowest one. It can be seen from Table 3 that TBF index and the SAs index of the supplier NB_10 are the largest ones among all the suppliers and the other five indexes of the supplier NB_10 are all ranked in top 3 among the 17 suppliers, so the equipment operation quality of the supplier NB_10 is the best. Although the supplier NB_15 has a relatively large value in the CRPD index, all the values of the remaining 6 indexes are small, especially the value of TBF index, which is 0.070 only. In the meantime, the combined weight of TBF index reaches 0.558, which is far more important than the other indexes. Therefore, it is reasonable to judge the equipment operation quality from the supplier NB_15 as the worst.
5.2. Comparisons with Existing Algorithms
In order to demonstrate the effectiveness of the proposed GCT-based algorithm, the results of the equipment operation quality assessment based on SAW, AHP and the proposed GCT-based algorithm are shown in Table 6, respectively.
It can be seen from Table 6 that the top 3 suppliers determined by the three algorithms are the same and the top 9 suppliers are nearly the same. Hence, the rationality of this GCT-based algorithm for assessing the comprehensive operation quality of smart meters is verified. In addition, it can be seen from Table 5 that the worst two suppliers are NB_15 and NB_14 based on the proposed GCT-based algorithm. It can be seen from Table 3 that the indexes’ values of supplier NB_14 are all small but relatively higher than supplier NB_15, so it is reasonable that supplier NB_14 ranks the last but one. The worst two suppliers of SAW-based and AHP-based algorithms are the suppliers NB_1 and NB_3. As can be seen from Table 3, although the indexes of supplier NB_1 are all around or below the median, there are 5 indexes’ values of supplier NB_1 obviously higher than those of supplier NB_3, so it is unreasonable to judge the supplier NB_1 as the worst. As can be seen from Table 5, the supplier NB_6 is ranked in the 4th, 10th and 5th position by the SAW-based, the AHP-based and the GCT-based algorithm, respectively. It can be seen from Table 3 that the supplier NB_6 is superior to the supplier NB_12 in most indexes and supplier NB_12 is in the top 10 among the three algorithms, so the result obtained by the AHP-based is unreasonable.
In summary, the subjective and objective weights are comprehensively considered in the GCT-based algorithm proposed in this paper and the revised TOPSIS is utilized to perform assessments. Compared with the equipment operation quality assessment of SAW-based algorithm and the AHP-based algorithm, the top-ranked suppliers obtained by GCT-based algorithm is consistent with the results of the other two algorithms, which indicates the effectiveness of this algorithm. By analyzing the lower-ranked suppliers, the results of the proposed GCT-based algorithm are more reasonable than the results based on the other two algorithms. Therefore, the GCT-based algorithm proposed in this paper is more suitable for the operation quality assessment of smart meters.
5.3. Practical Application in Zhejiang Power Distribution Systems
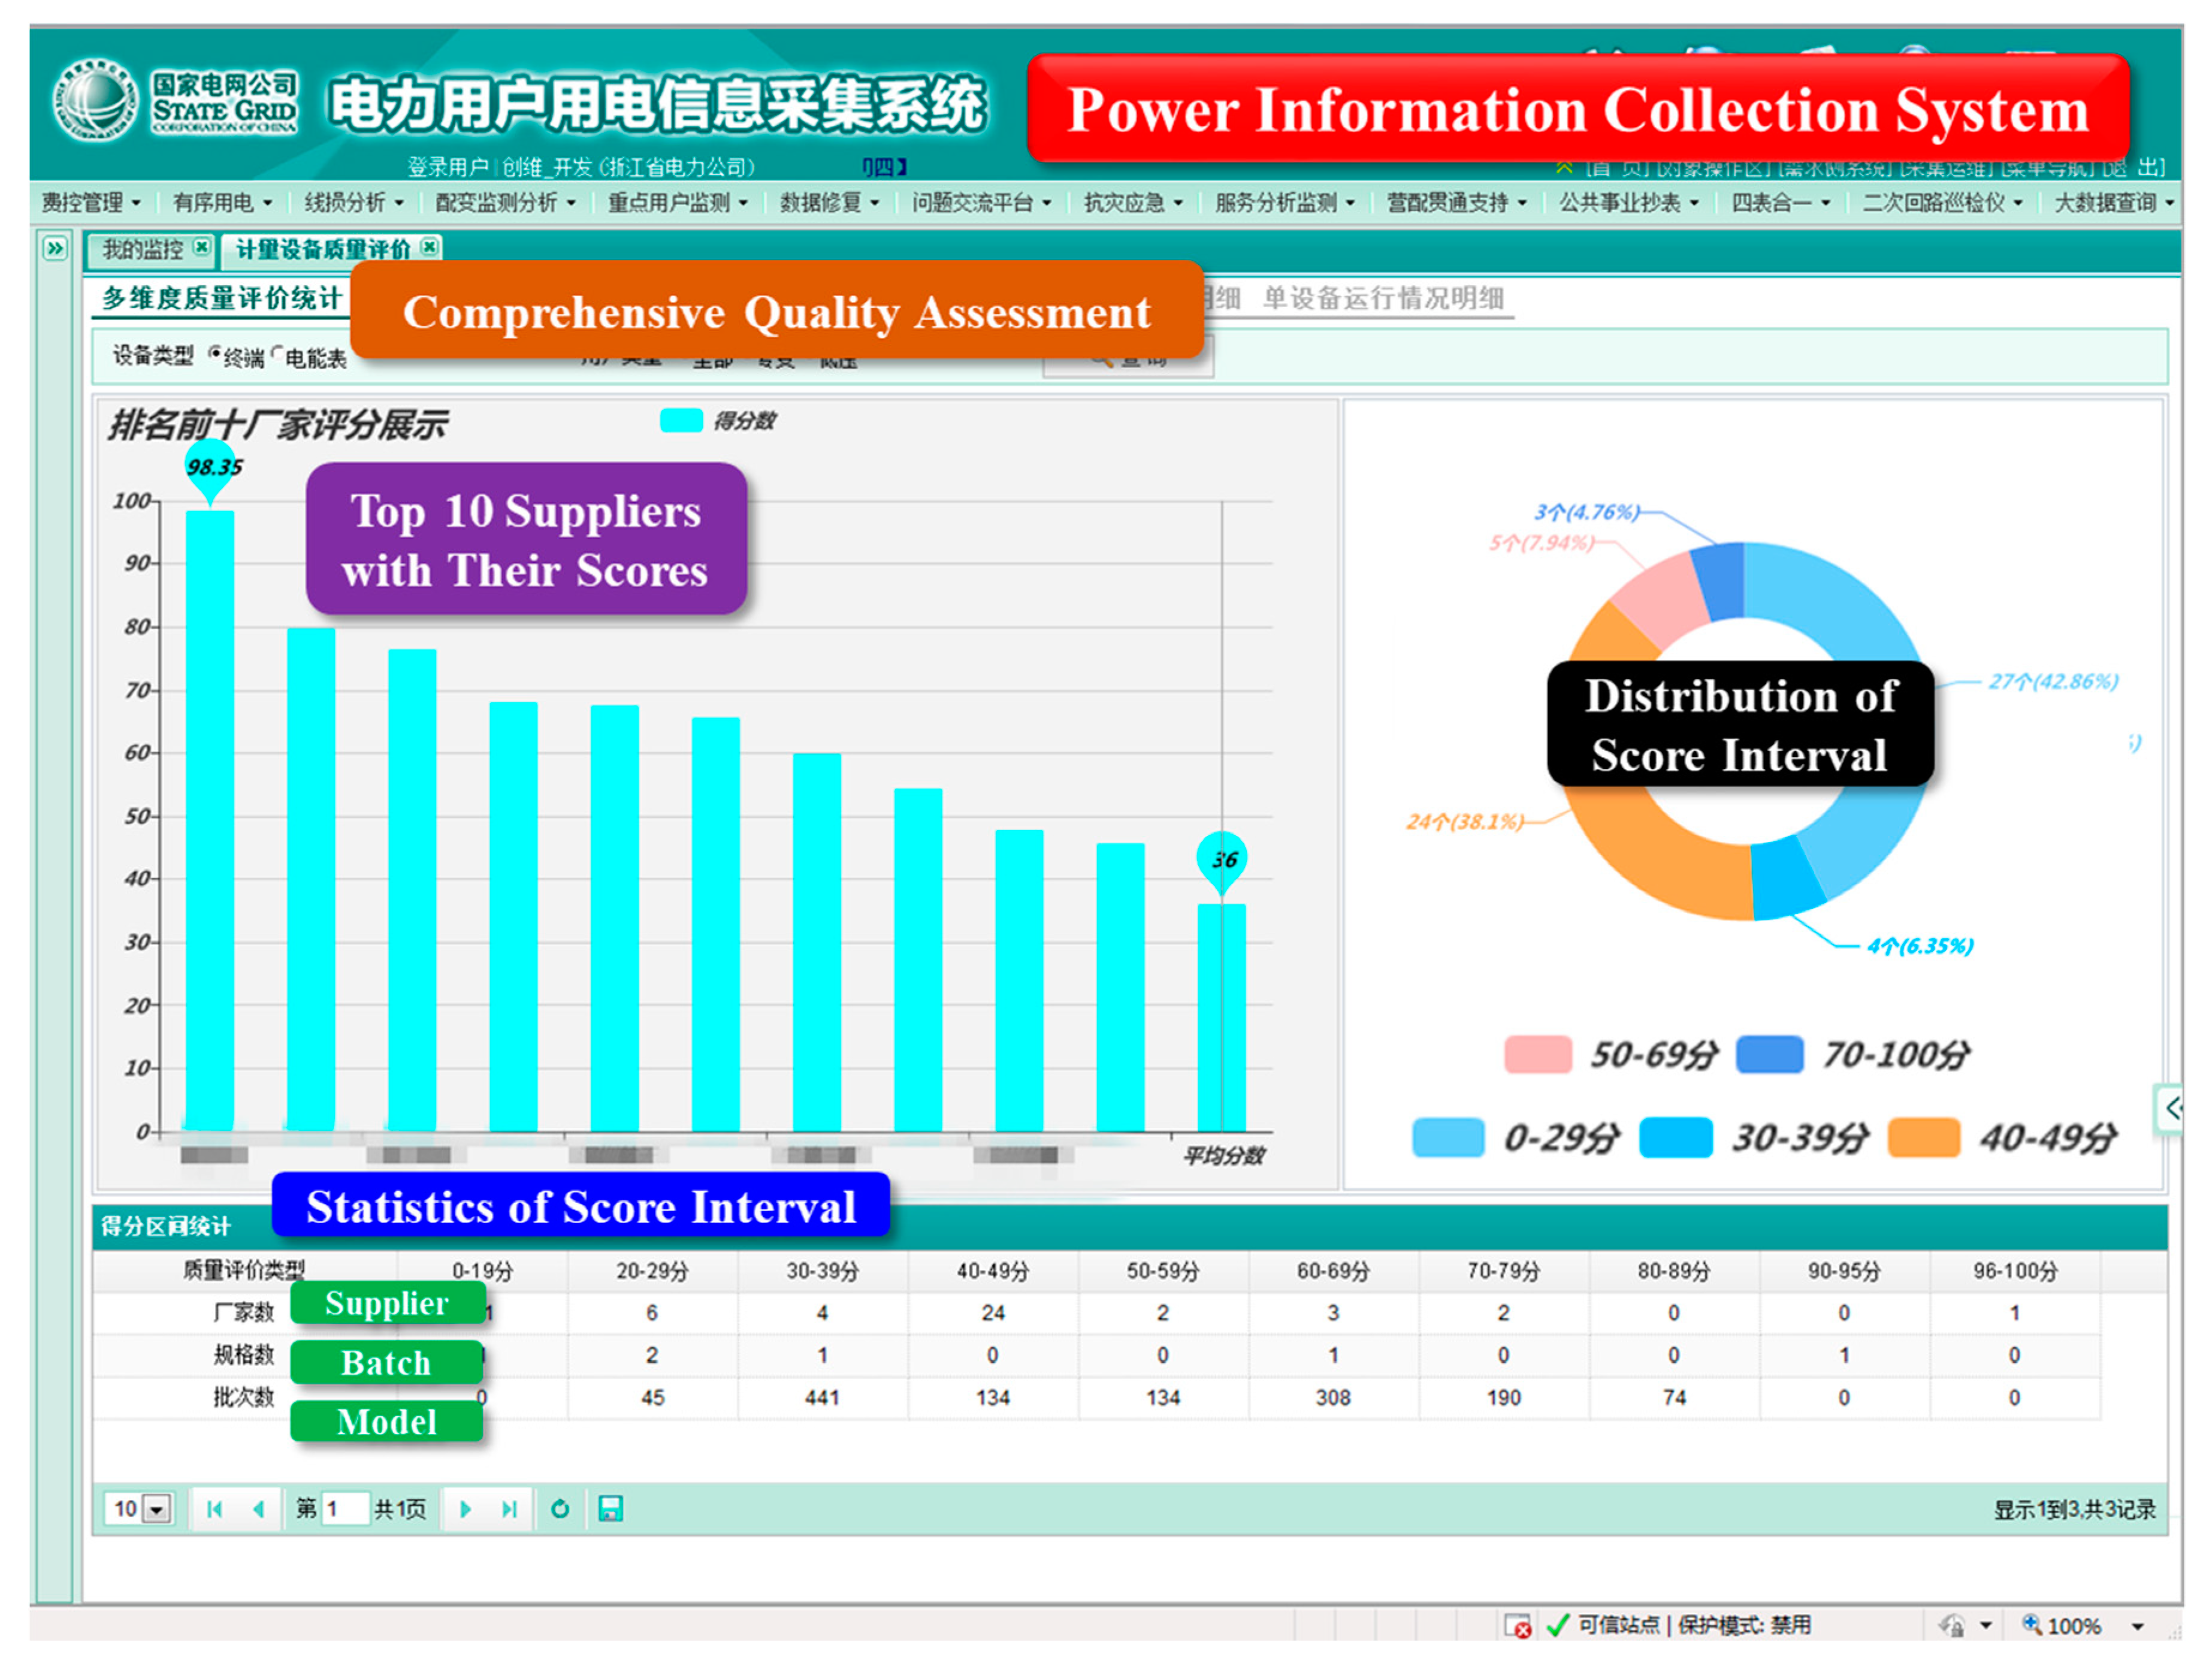
After several tests in small-scale data sets, this assessment algorithm of equipment operation quality has been embedded in the electricity information acquisition system of State Grid Zhejiang Electric Power Company as a core algorithm and it has been in the trial operation since December 2017. In the system, the Ambari unified management tools and Hadoop cluster technology of the big data acquisition and computing platform are also utilized for comprehensive assessment. So far, there are more than 27.6 million records of smart meters (including 85 suppliers and 5684 batches) and 3.46 million records of collecting terminal (including 63 suppliers and 1324 batches) in Zhejiang power distribution systems. Based on these data, the suppliers are assessed and the results are also shown in Figure 4. It can be seen from Figure 4 that the top 10 supplier are listed as bar graph and the distribution of score intervals are shown with pie graph, respectively. During several months of trial operation of the system, the assessment results for operation quality of smart meters were accredited by experts and engineers from power utilities.
The novelties of the application of the proposed algorithm in Zhejiang power distribution systems are two-fold: (a) The proposed algorithm is relied on measured data rather than the one by one examination by maintenance personnel, which takes a step toward unmanned management. (b) In the past, the function of quality assessment for smart meters is always developed individually and it is the first time to embed this function into electricity information acquisition system. Therefore, it also takes a step toward unified system and unified management.
6. Conclusions
Based on the GMM clustering algorithm and the combined weight optimization model considering the subjective and objective weights, a data-driven comprehensive assessment algorithm for operation quality of smart meters based on the revised TOPSIS is proposed in this paper and the actual data are employed to perform case studies. The conclusions are as follows.
- The massive data collected by the smart meters can be processed and the typical data can be extracted by the GMM clustering algorithm. This data analysis technology can greatly compress the data scale and speed up the calculation process.
- The experts’ experiences, the dispersion, correlation and contrast intensity of the data are taken into account by the combined weight optimization model together for determining the comprehensive importance of each index more reasonably.
- The algorithm based on the revised TOPSIS is suitable for the comprehensive operation quality assessment of smart meters. The results of case studies show that the algorithm is effective and can provide scientific and reasonable support for energy measurement and assets management.
- The proposed GCT-based comprehensive assessment algorithm is only relied on measured data and do not need many personnel to examine the smart meters one by one. Therefore, the proposed algorithm can save lots of labor force. Besides, with the deployment of big data platform, the calculation time for 27.6 million records of smart meters and 3.46 million records of collecting terminal are reduced to 6 h, which is 1/30 of the original one.
- The proposed GCT-based algorithm could be helpful for the energy measurement and assets management since the results in case studies show that it can give quantitative assessment for smart meters. It is estimated that it helps save millions dollars for the State Grid Zhejiang Electric Power Company.
Overall, by applying the proposed GCT-based comprehensive assessment algorithm, the typical smart meters with their values of indexes are shown in Figure 3 and Table 2 and Table 3 first, which represent the quality of smart meters produced by each supplier. Then, the determined weights of indexes are given in Table 4, which describe the importance of each index in the comprehensive assessment. Finally, the assessment values and corresponding ranks are given in Table 5, which can support the reasonable and economical purchase of smart meters for power utilities. To demonstrate the merits of proposed algorithm, different algorithms are compared and the results are given in Table 6, analysis in Section 5.2 shows that the proposed algorithm is more reasonable. To illustrate the effectiveness and applicability of the proposed algorithm for big database, a practical application in Zhejiang power distribution systems is introduced in Section 5 for demonstration.
Author Contributions
Z.L. and S.L. conceptualized the study; S.L. performed the analyses; F.Y., J.Y. and H.L. acquired funding; S.L. and Z.L. performed investigations and wrote the original draft; F.Y., J.Y., H.L and Y.L. acquired resources; And H.X. reviewed and edited the manuscript.
Funding
This research was funded by the National Natural Science Foundation of China, grant number 51777185; the Fundamental Research Funds for the Central Universities, grant number 2019QNA4023; and the Science and Technology Program of State Grid, grant number JL71-17-003.
Conflicts of Interest
The authors declare no conflict of interest.
Abbreviations
| GMM | Gaussian mixture model |
| TOPSIS | Technique for order preference by similarity to an ideal solution |
| SAW | Simple additive weighting |
| AHP | Analytic hierarchy process |
| GCT | GMM, combination weight model and revised TOPSIS |
| ARDC | Availability rate of data collection |
| CRPD | Collection rate of power data |
| SAs | Serious abnormalities |
| GAs | General abnormalities |
| MAs | Minor abnormalities |
| TBF | Time between failures |
| OFR | Operating failure rate |
| EM | Expectation maximum |
| MADM | Multi-attribute decision making |
| PLC | Programmable logic controller |
| GPRS | General packet radio service |
| 4G | The 4th generation of mobile phone mobile communication technology standards |
| CMDA | Code division multiple access |
| Notations | |
| , , , , , , | Indexes: ARDC, CRPD, SAs, GAs, MAs, TBF, OFR |
| Nsamp | Total number of sampling points |
| Tsamp,i | Window length of the ith sampling |
| and | Total number of metering load data and number of non-null load data during the ith sampling point |
| and | Number of data that should be collected theoretically and number of data actually collected during the ith sampling point |
| Fser,i, Fgen,i and Fmin,i | Number of SAs, GAs and MAs of the metering equipment during the ith sampling point |
| Nsamp,F | The first sampling point when Fser,i + Fgen,i + Fmin,i0 |
| Trate and TF | Rated running time and fault outage time of the metering equipment |
| Weight of the kth multidimensional single Gaussian distribution | |
| Probability density function of the kth multidimensional single Gaussian distribution. | |
| An auxiliary vector | |
| xi | Representation for the quality of smart meter i |
| N | Total number of smart meters to be clustered |
| Expected vector of the kth Gaussian model | |
| Variance of the kth Gaussian model | |
| p(·) | Possibility density function |
| D | Decision matrix of the operation quality assessment problem for smart meters |
| dij | Elements of D |
| Normalized dij | |
| B | Number of the suppliers of smart meters |
| L | Number of the indexes |
| and | Sets of benefit indexes and cost indexes |
| A | Judgment matrix |
| aij | Elements of A |
| Weight of index j based on AHP | |
| Weight of index j based on entropy | |
| Weight of index j based on correlation coefficients | |
| Weight of index j based on variation coefficient | |
| Entropy of the operation quality index of the smart meters j | |
| Pearson correlation coefficient between the xth and yth indexes | |
| Variation coefficient of the index uj | |
| Combined weight of the jth operation quality index to be optimized | |
| Weight of the jth index obtained by the kth method | |
| G | Number of weight determination methods |
| Membership function of the representation | |
| R | Assessment matrix of quality indexes |
| The ith row vector of R | |
| and | Ideal point and negative ideal point in the operation quality assessment of the smart meters |
| and | Angular distance between the operation quality indexes of each supplier and the ideal point/negative ideal point |
| Assessment values of the operation quality for smart meter i | |
References
- Talapur, G.G.; Suryawanshi, H.M. A modified control scheme for power management in an AC microgrid with integration of multiple nanogrids. Electronics 2019, 8, 49. [Google Scholar] [CrossRef]
- Pezzutto, S.; Grilli, G.; Zambotti, S.; Dunjic, S. Forecasting electricity market price for end users in EU28 until 2020—Main factors of influence. Energies 2018, 11, 1460. [Google Scholar] [CrossRef]
- Sharma, K.; Mohan Saini, L. Performance analysis of smart metering for smart grid: An overview. Renew. Sustain. Energy Rev. 2015, 49, 720–735. [Google Scholar] [CrossRef]
- Benzi, F.; Anglani, N.; Bassi, E.; Frosini, L. Electricity smart meters interfacing the households. IEEE Trans. Ind. Electron. 2011, 58, 4487–4494. [Google Scholar] [CrossRef]
- Ma, Q.; Meng, F.; Zeng, X. Optimal dynamic pricing for smart grid having mixed customers with and without smart meters. J. Mod. Power Syst. Clean Energy 2018, 6, 1244–1254. [Google Scholar] [CrossRef] [Green Version]
- Chen, H.; Wang, X.; Li, Z.; Chen, W.; Cai, Y. Distributed sensing and cooperative estimation/detection of ubiquitous power internet of things. Prot. Control Mod. Power Syst. 2019, 4, 13. [Google Scholar] [CrossRef]
- Xu, Z.; Zhao, S.; Huang, Y.; Lin, G. Research and practice of electric energy metering device comprehensive quality evaluation based on quantitative model. Electr. Meas. Instrum. 2016, 53, 170–173. [Google Scholar]
- Ju, H.; Yuan, R.; Ding, H.; Tian, H.; Zhong, K.; Pang, F.; Xu, S.; Li, S. Research on smart meter full lifecycle quality evaluation method. Electr. Meas. Instrum. 2015, 52, 55–58. [Google Scholar]
- Xu, G. Modeling and Implementation of Quality Evaluation of Electrical Equipment. Master’s Thesis, South China University of Technology, Guangzhou, China, 2014. [Google Scholar]
- Lin, Z.; Wen, F.; Ding, Y.; Xue, Y. Data-driven coherency identification for generators based on spectral clustering. IEEE Trans. Ind. Inform. 2018, 14, 1275–1285. [Google Scholar] [CrossRef]
- He, Y.; Qin, L. Research on comprehensive assessment of metering automation terminal quality based on the improved AHP and entropy method. Electr. Meas. Instrum. 2015, 52, 58–62. [Google Scholar]
- Meng, M.; Shu, Z. Full quality evaluation on smart meters based on the defect deduction method and the AHP of triangular fuzzy number. Power Syst. Prot. Control 2012, 40, 88–93. [Google Scholar]
- Huang, L.; Wang, H.; Du, W. Operation evaluation methods for energy metering devices. East China Electr. Power 2014, 42, 2322–2326. [Google Scholar]
- Luo, Q.; Ge, C.; Sun, H.; Wang, W.; Du, Q. Study on the state evaluation technology of gateway electric energy meter. Electron. Test 2017, 1, 34–35. [Google Scholar]
- Yi, P.; Xu, R.; Zhang, M.; Li, Z.; Yu, X. Design and implementation of the watt-hour meter reliability prediction system based on Cloud platform. Electr. Meas. Instrum. 2017, 54, 96–100. [Google Scholar]
- Wu, X.; Huang, Y.; Wang, H.; Bao, X.; Zhao, Z. Research on smart meter measurement evaluation system and establish real-time monitoring platform. Electr. Meas. Instrum. 2014, 51, 57–60. [Google Scholar]
- Chu, L.; Qiu, R.; He, X.; Ling, Z.; Liu, Y. Massive streaming PMU data modelling and analytics in smart grid state evaluation based on multiple high-dimensional covariance test. IEEE Trans. Big Data 2018, 4, 55–64. [Google Scholar] [CrossRef]
- De Caro, F.; Vaccaro, A.; Villacci, D. Adaptive wind generation modeling by fuzzy clustering of experimental data. Electronics 2018, 7, 47. [Google Scholar] [CrossRef]
- He, X.; Ai, Q.; Qiu, R.C.; Huang, W.; Piao, L.; Liu, H. A big data architecture design for smart grids based on random matrix theory. IEEE Trans. Smart Grid 2017, 8, 674–686. [Google Scholar] [CrossRef]
- Pérez-del-Pulgar, C.J.; Smisek, J.; Rivas-Blanco, I.; Schiele, A.; Muñoz, V.F. Using Gaussian mixture models for gesture recognition during haptically guided telemanipulation. Electronics 2019, 8, 772. [Google Scholar] [CrossRef]
- Chan, L.L.T.; Chen, J. Melt index prediction with a mixture of Gaussian process regression with embedded clustering and variable selections. J. Appl. Polym. Sci. 2017, 134, 45237. [Google Scholar] [CrossRef]
- Hajiabadi, M.E.; Mashhadi, H.R. Analysis of the probability distribution of LMP by central limit theorem. IEEE Trans. Power Syst. 2013, 28, 2862–2871. [Google Scholar] [CrossRef]
- Evangelidis, G.D.; Horaud, R. Joint alignment of multiple point sets with batch and incremental expectation-maximization. IEEE Trans. Pattern Anal. Mach. Intell. 2018, 40, 1397–1410. [Google Scholar] [CrossRef] [PubMed]
- Forman, E.H. The analytical hierarchy process: An exposition. Oper. Res. 2001, 49, 469–487. [Google Scholar] [CrossRef]
- Kapoor, R.; Tripathi, M.M. Detection and classification of multiple power signal patterns with Volterra series and interval type-2 fuzzy logic system. Prot. Control Mod. Power Syst. 2017, 2, 92–101. [Google Scholar]
- Wang, S.; Ge, L.; Cai, S.; Wu, L. Hybrid interval AHP-entropy method for electricity user evaluation in smart electricity utilization. J. Mod. Power Syst. Clean Energy 2018, 6, 701–711. [Google Scholar] [CrossRef]
- De Winter, J.C.F.; Gosling, S.D.; Potter, J. Comparing the Pearson and Spearman correlation coefficients across distributions and sample sizes: A tutorial using simulations and empirical data. Psychol. Methods 2016, 21, 273–290. [Google Scholar] [CrossRef]
- Su, S.; Sun, A.; Gao, X.; Qiu, J.; Tian, Z. A correlation-change based feature selection method for IoT equipment anomaly detection. Appl. Sci. 2019, 9, 437. [Google Scholar] [CrossRef]
- Zhao, H.; Xu, D.; Gao, B. Uncertainty assessment of measurement in variation coefficient of drip irrigation emitters flow rate. IEEE Trans. Instrum. Meas. 2014, 63, 805–812. [Google Scholar] [CrossRef]
- Lin, Z.; Wen, F.; Ding, Y.; Xue, Y.; Liu, S.; Zhao, Y.; Yi, S. WAMS-based coherency detection for situational awareness in power systems with renewables. IEEE Trans. Power Syst. 2018, 33, 5410–5426. [Google Scholar] [CrossRef]
- Zhang, Q.; Wang, H.; Chen, Y. An improved effectiveness evaluation method of radar signal recognition. Modern Radar 2016, 38, 1–6. [Google Scholar]
Figure 1.
Framework of the electricity information acquisition system.

Figure 2.
Flowchart of the proposed GMM, combination weight model and revised TOPSIS (GCT)-based algorithm.
Figure 2.
Flowchart of the proposed GMM, combination weight model and revised TOPSIS (GCT)-based algorithm.

Figure 3.
Scatter diagram and Gaussian mixture model (GMM) clustering results of the supplier NB_12.
Figure 3.
Scatter diagram and Gaussian mixture model (GMM) clustering results of the supplier NB_12.

Figure 4.
Interface of metering equipment operation quality assessment in electricity information acquisition system.
Figure 4.
Interface of metering equipment operation quality assessment in electricity information acquisition system.


Table 1.
Strengths and weaknesses of existing research about quality assessment of smart meters.
| Research | How Many Indexes? | How to Determine the Weights of Indexes? | Strength | Weakness |
|---|---|---|---|---|
| [7] | Multiply | SAW | Very Simplest | Difference importance of indexes is not considered |
| [8] | Multiply | Expert scoring | Simple | Result are subjective, experience of experts is required |
| [9] | Multiply | AHP | Simple and better than direct expert scoring | Result are subjective, experience of experts is required |
| [11] | Multiply | Entropy weight method and improved AHP | Consider the subjective and objective weight together | Variations of data are not considered |
| [12] | Multiply | Triangular fuzzy AHP and defect deduction method | Consider the fuzzy information | Objective weight is not considered |
| [13] | Single | N/A | Vivid | Single index cannot do assessment comprehensively |
| [14] | Single | N/A | Simplest | Single index cannot do assessment comprehensively |
| [15] | Single | N/A | Simplest | Single index cannot do assessment comprehensively |
| [16] | Multiply | SAW | Very Simplest | Difference importance of indexes is not considered |
Table 2.
Typical values of the metering equipment’ supplier NB_12.
| Supplier No. | Typical Values | ||||||
|---|---|---|---|---|---|---|---|
| NB_12 | 0.602 | 0.561 | 0.629 | 0.642 | 0.614 | 0.425 | 0.600 |
| 0.602 | 0.553 | 0.629 | 0.438 | 0.614 | 0.339 | 0.595 | |
| 0.617 | 0.539 | 0.629 | 0.604 | 0.299 | 0.637 | 0.600 | |
| 0.313 | 0.288 | 0.629 | 0.642 | 0.535 | 0.425 | 0.599 | |
| 0.631 | 0.557 | 0.331 | 0.335 | 0.476 | 0.502 | 0.335 | |
| 0.602 | 0.560 | 0.629 | 0.591 | 0.614 | 0.451 | 0.593 | |
Table 3.
Entries of the normalized decision making matrix for operation quality assessment of smart meters.
Table 3.
Entries of the normalized decision making matrix for operation quality assessment of smart meters.
| Supplier No. | |||||||
|---|---|---|---|---|---|---|---|
| NB_1 | 0.974 | 0.970 | 0.993 | 0.986 | 0.998 | 0.204 | 0.500 |
| NB_2 | 0.980 | 0.995 | 1.000 | 1.000 | 1.000 | 0.026 | 0.992 |
| NB_3 | 0.744 | 0.739 | 0.853 | 0.988 | 0.999 | 0.117 | 0.250 |
| NB_4 | 0.809 | 0.784 | 0.970 | 0.987 | 1.000 | 0.400 | 0.455 |
| NB_5 | 0.981 | 0.757 | 0.998 | 0.999 | 1.000 | 0.432 | 0.916 |
| NB_6 | 0.985 | 0.936 | 0.999 | 0.994 | 1.000 | 0.502 | 0.750 |
| NB_7 | 0.981 | 0.971 | 0.998 | 0.998 | 1.000 | 0.312 | 0.894 |
| NB_8 | 0.825 | 0.830 | 0.918 | 0.827 | 1.000 | 0.122 | 0.500 |
| NB_9 | 0.986 | 0.939 | 0.847 | 0.996 | 1.000 | 0.567 | 0.500 |
| NB_10 | 0.981 | 0.918 | 1.000 | 1.000 | 1.000 | 0.791 | 0.977 |
| NB_11 | 0.771 | 0.754 | 0.962 | 0.951 | 0.907 | 0.336 | 0.444 |
| NB_12 | 0.970 | 0.738 | 0.989 | 0.992 | 0.998 | 0.207 | 0.667 |
| NB_13 | 0.981 | 0.976 | 0.995 | 0.999 | 1.000 | 0.227 | 0.907 |
| NB_14 | 0.981 | 0.702 | 0.957 | 0.998 | 0.988 | 0.159 | 0.667 |
| NB_15 | 0.981 | 0.992 | 0.936 | 0.995 | 1.000 | 0.070 | 0.500 |
| NB_16 | 0.981 | 0.961 | 1.000 | 0.999 | 0.997 | 0.165 | 0.967 |
| NB_17 | 0.981 | 0.988 | 0.994 | 0.996 | 1.000 | 0.163 | 0.667 |
Table 4.
Indexes’ weights determined by different methods.
| Methods | Weight | ||||||
|---|---|---|---|---|---|---|---|
| 0.090 | 0.099 | 0.384 | 0.110 | 0.033 | 0.162 | 0.122 | |
| 0.003 | 0.018 | 0.001 | 0.004 | 0.000 | 0.744 | 0.230 | |
| 0.133 | 0.199 | 0.100 | 0.123 | 0.137 | 0.214 | 0.094 | |
| 0.031 | 0.082 | 0.021 | 0.039 | 0.003 | 0.547 | 0.279 | |
| 0.041 | 0.067 | 0.065 | 0.040 | 0.033 | 0.558 | 0.196 | |
Table 5.
Results of comprehensive assessment for operation quality of smart meters.
| Supplier No. | Assessment Value | Rank | Supplier No. | Assessment Value | Rank |
|---|---|---|---|---|---|
| NB_1 | 0.363 | 14 | NB_10 | 0.974 | 1 |
| NB_2 | 0.411 | 11 | NB_11 | 0.479 | 7 |
| NB_3 | 0.360 | 15 | NB_12 | 0.451 | 10 |
| NB_4 | 0.476 | 9 | NB_13 | 0.510 | 6 |
| NB_5 | 0.705 | 3 | NB_14 | 0.293 | 16 |
| NB_6 | 0.555 | 5 | NB_15 | 0.254 | 17 |
| NB_7 | 0.581 | 4 | NB_16 | 0.477 | 8 |
| NB_8 | 0.370 | 13 | NB_17 | 0.387 | 12 |
| NB_9 | 0.813 | 2 |
Table 6.
Comparison of the proposed GCT-based algorithm with simple additive weighting and analytic hierarchy process (AHP) based algorithms.
Table 6.
Comparison of the proposed GCT-based algorithm with simple additive weighting and analytic hierarchy process (AHP) based algorithms.
| Supplier No. | Rank | ||
|---|---|---|---|
| SAW | AHP | GCT | |
| NB_1 | 17 | 17 | 14 |
| NB_2 | 9 | 9 | 11 |
| NB_3 | 16 | 16 | 15 |
| NB_4 | 14 | 14 | 9 |
| NB_5 | 3 | 3 | 3 |
| NB_6 | 4 | 10 | 5 |
| NB_7 | 5 | 4 | 4 |
| NB_8 | 12 | 15 | 13 |
| NB_9 | 2 | 2 | 2 |
| NB_10 | 1 | 1 | 1 |
| NB_11 | 15 | 7 | 7 |
| NB_12 | 8 | 8 | 10 |
| NB_13 | 6 | 5 | 6 |
| NB_14 | 11 | 12 | 16 |
| NB_15 | 13 | 13 | 17 |
| NB_16 | 7 | 6 | 8 |
| NB_17 | 10 | 11 | 12 |
© 2019 by the authors. Licensee MDPI, Basel, Switzerland. This article is an open access article distributed under the terms and conditions of the Creative Commons Attribution (CC BY) license (http://creativecommons.org/licenses/by/4.0/).
Share and Cite
MDPI and ACS Style
Liu, S.; Ye, F.; Lin, Z.; Yang, J.; Liu, H.; Lin, Y.; Xie, H. Comprehensive Quality Assessment Algorithm for Smart Meters. Energies 2019, 12, 3690. https://0-doi-org.brum.beds.ac.uk/10.3390/en12193690
AMA Style
Liu S, Ye F, Lin Z, Yang J, Liu H, Lin Y, Xie H. Comprehensive Quality Assessment Algorithm for Smart Meters. Energies. 2019; 12(19):3690. https://0-doi-org.brum.beds.ac.uk/10.3390/en12193690
Chicago/Turabian StyleLiu, Shengyuan, Fangbin Ye, Zhenzhi Lin, Jia Yang, Haigang Liu, Yinghe Lin, and Haiwei Xie. 2019. "Comprehensive Quality Assessment Algorithm for Smart Meters" Energies 12, no. 19: 3690. https://0-doi-org.brum.beds.ac.uk/10.3390/en12193690
Note that from the first issue of 2016, this journal uses article numbers instead of page numbers. See further details here.