Impact of Local Effects on the Evolution of Unconventional Rock Permeability


1
Oil & Gas Technology Research Institute of Changqing Oilfield Company, Xi’an 710018, China
2
Guangzhou Urban Planning & Design Survey Research Institute, Guangzhou 510060, China
3
Beijing Key Laboratory for Precise Mining of Intergrown Energy and Resources, China University of Mining and Technology, Beijing 100083, China
4
Department of Chemical Engineering, School of Engineering, The University of Western Australia, WA 6009, Australia
*
Author to whom correspondence should be addressed.
Energies 2019, 12(3), 478; https://0-doi-org.brum.beds.ac.uk/10.3390/en12030478
Submission received: 20 December 2018
/
Revised: 20 January 2019
/
Accepted: 29 January 2019
/
Published: 1 February 2019
(This article belongs to the Special Issue Flow and Transport Properties of Unconventional Reservoirs 2018)
Abstract
:When gas is extracted from unconventional rock, local equilibrium conditions between matrixes and fractures are destroyed and significant local effects are introduced. Although the interactions between the matrix and fracture have a strong influence on the permeability evolution, they are not understood well. This may be the reason why permeability models in commercial codes do not include the matrix-fracture interactions. In this study, we introduced the local force to define the interactions between the matrix and the fracture and derived a set of partial differential equations to define the full coupling of rock deformation and gas flow both in the matrix and in the fracture systems. The full set of cross-coupling formulations were solved to generate permeability evolution profiles during unconventional gas extraction. The results of this study demonstrate that the contrast between the matrix and fracture properties controls the processes and their evolutions. The primary reason is the gas diffusion from fractures to matrixes. The diffusion changes the force balance, mass exchange and deformation.
1. Introduction
The eastern Ordos basin of China, where shale and coal are rich in organic matter and favorable for gas accumulations, has become one of the most important gas development areas for PetroChina. Unconventional reservoirs within this area have an extremely low intrinsic permeability and low porosities. For most low permeability reservoirs, hydraulic fracturing and horizontal drilling are the key techniques to extract natural gas. Gas production in shale reservoirs is attributed to the conductivity of the matrix and fracture systems [1,2]. However, the long-term gas production from these reservoirs is known to be a function of fluid transport in the shale matrix and strongly influenced by the fluid transport process in the inorganic matrix, kerogen and fractures [3,4,5,6]. Therefore, a better understanding of effective permeability evolution in matrixes and fractures and interactions between them is important to guide the industrial production.
Gas transport in shale reservoirs is a combination of desorption and diffusion within the micropores, and Darcy flow (pressure driven volume flow) within the macro-pores, micro-fractures and fractured network system [7]. Because of the high contrasts of matrix properties and fracture ones, they have different mechanical behaviors that directly affect the permeability evolution. Many scholars established models to investigate the evolution of the permeability of different parts over the past few decades. The models were developed from a single porosity/permeability model [8] to dual porosity/permeability model [9,10,11,12]. For a single porosity model, the effects of effective stress variation and the matrix shrinkage/swelling were taken into consideration [13,14], which ignored the interactions between different range radius pores. Then researchers paid attention to the effects of adsorption-induced strain [15,16]. Based on the poroelasticity theory, Zhang et al. [15] developed a strain-based porosity model and a permeability model under variable stress conditions. These models include the coupling interaction between gas flow/diffusion and rock mechanic behavior.
In previous studies, many scholars ignored the dynamic behaviors of matrix and fracture properties, especially the interactions between them. When gas is extracted from the reservoir, the gas pressure in the inorganic matrix, kerogen and microfracture will decrease to a lower magnitude. The effective stress within them will change. The variation of effective stress will affect the pore radius of the matrix and kerogen/micro-fracture, which means that the intrinsic permeability is a variable [17,18]. Chen et al. [19] and Masoudian [20] studied the impact of effective stress and/or strain on permeability in shale fractures. However, the impact of shale matrix effective stress and/or strain on fracture permeability was not considered. Some models considered the variation of stress and just focused on gas flow principles. Cao et al. [2] and Peng et al. [21] developed a model considering the deformation induced by the changes in effective stress. In these studies, only the matrix mechanical deformation is taken into account and the mechanical interactions between the matrix and kerogen/micro-fracture induced by the differential pressure are ignored. However, matrix and micro-fracture properties are different, and their mechanical behaviors are also different under the same loading conditions. In this study, we defined mechanical equilibrium equations for the inorganic matrix and the kerogen/micro-fracture, respectively, to control the shale deformation based on our previous study [18]. Through the full coupling of two solid deformation systems and two gas flow systems in them, we studied the impact of local transient behaviors on the evolution of rock permeability.
2. Conceptual Model
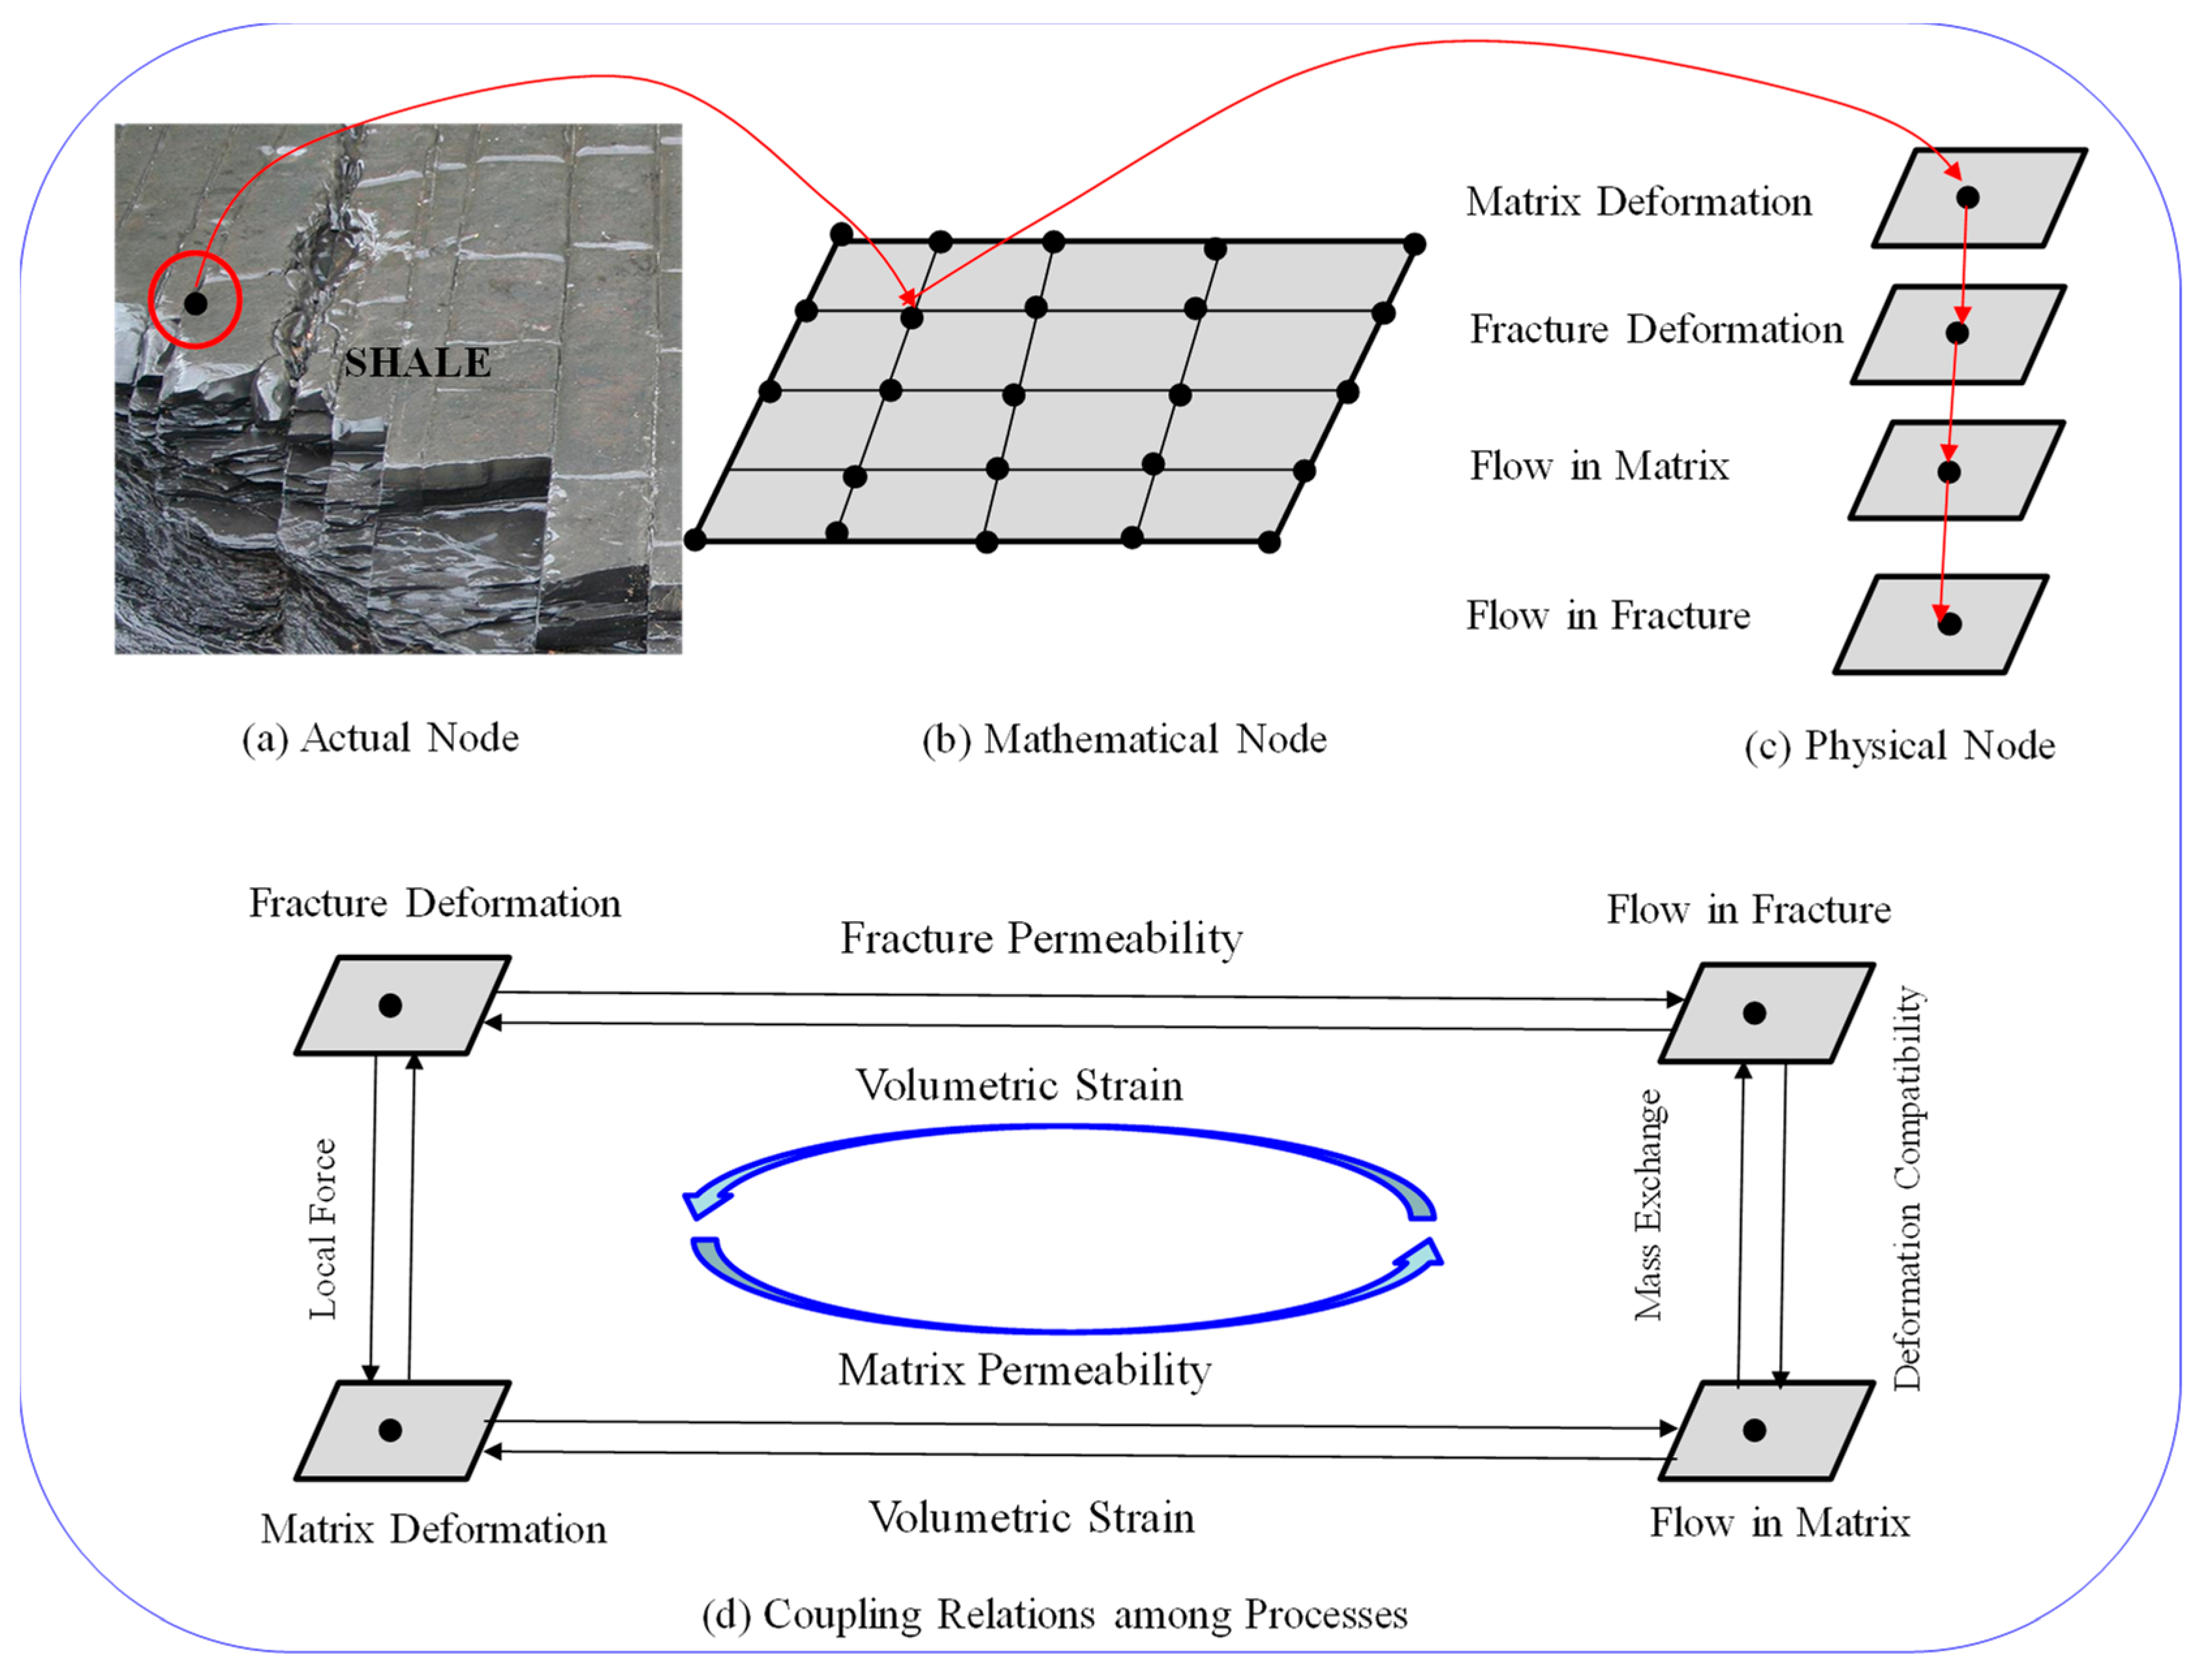
In this section, an overlapping approach is introduced to analyze the full shale-gas interactions. Shale is multi-pore media including micropores, macro-pores, micro-fractures and fractured network systems. When gas is extracted from or injected into shale, local equilibrium conditions between matrixes and fractures are disturbed and significant local effects are introduced into the porous medium. Because of the high contrasts of matrix properties and fracture ones, it may take a much longer time to reach a new state of equilibrium. A schematic diagram of the conceptual overlapping approach is shown as Figure 1. For a specific domain, as shown in Figure 1a, it was meshed, generating many nodes, as shown in Figure 1b and each mathematical node can be overlapped by four physical nodes corresponding to four different physical fields representing the solid deformation in the fracture, solid deformation in the matrix, gas flow in the fracture and gas flow in the matrix, respectively, shown as Figure 1c. The physical behaviors of four physical points are not isolated but connected to each other by a set of coupling relations as shown in Figure 1d.
To explain the interactions between the matrix and fracture, we use gas injection as an example. When gas is injected into the shale as shown in Figure 1a, gas flows into micropores and fractures quickly while there is no gas in the matrix. Subsequently, the pressure in the matrix increases gradually as the gas diffuses from the fractures into the matrixes. The non-synchronization of the pressure change between the matrix and fracture generates a local force which can cause interactions. Specifically, because of the increase of the pressure in the fracture, the effective stress in the fractures firstly decrease, which results in the swelling of the fracture. At the same time, the matrix localized in the vicinity of the fracture compartment shrinks under an extra local force applied by the fracture. The swelling and shrinkage, especially induced by a local force, directly affects the permeability evolution of the matrix and fracture. When the pressure in the fracture reaches a specific magnitude, the gas diffuses into the matrix. The differential pressure starts to decline slowly to zero at a final equilibrium state. In the same way, the matrix swells because of the decrease in effective stress. Finally, the fracture and matrix both swell and the matrix changes from local swelling to macro swelling [22]. Additionally, the permeability of the matrix and fracture will have a net increase.
3. Governing Equations
In this section, a set of partial differential equations are defined. These equations govern the deformation of the matrix and fracture deformation, and control the transport of gas flow. Originally, we develop the governing equations of single pore media based on previous studies [15] which describe the interactions in the two kinds of solid media. These derivations are based on the following assumptions:
- Shale is a homogeneous, isotropic, dual poroelastic continuum.
- Strains are much smaller than the length scale.
- Gas contained within the pores is ideal, and its viscosity is constant under isothermal conditions.
- Gas flow through the shale fracture is defined by Darcy’s law and defined by Knudsen diffusion in the matrix.
Shale contains a matrix and fracture which have different mechanical properties and interact with each other. Therefore, we derived mechanical equations for the matrix and fracture, respectively. They are fully coupled with local force. Darcy’s law is used for both the flow in the matrix and the flow in the fracture.
3.1. Formulation of Solid Deformation
The linear constitutive relations can be obtained by extending the known poroelasticity [23]. In previous studies, the gas sorption-induced strain is assumed to result in volumetric strain only [2,15]. However, in our new model, the volumetric strain includes both the gas sorption strain and local strain. Additionally, their effects on all three normal components of strain are the same. By making an analogy between thermal contraction and matrix shrinkage, the constitutive relations for the deformed shale matrix and fracture can be defined as
where is the shear modulus of matrix, and are the Young’s modulus values of shale matrix and the Poisson’s ratio of the matrix, respectively; is the shear modulus of the fracture, and are the Young’s modulus values of the shale fracture and the Poisson’s ratio of fracture, respectively; is the bulk modulus of matrix, is the bulk modulus of fracture; and are the Biot coefficients; Pm is the fluid pressure in the matrix, Pf is the fluid pressure in the fracture; is the gas sorption-induced strain in the matrix, is the gas sorption-induced strain in the fracture; is the total stress; is the Kronecker delta; is the differential pressure between the fracture and the matrix. In addition, for the constitutive relation of the matrix while for the constitutive relation of the fracture.
Applying Langmuir isotherm, the sorption-induced volumetric strains of matrix and fracture can be defined as [15,18]
where is the Langmuir strain constant and PL is the Langmuir pressure. When gas flows from the matrix into the fracture, the local deformations of the matrix and fracture are controlled by [18]
where , are local forces induced by differential pressures between the fracture and matrix systems; and are the dynamic effective stress values. and are the effective stress component of the matrix and the fracture, respectively; and are the Biot coefficients of the matrix and the fracture. From Equations (1)–(6), the volumetric strains of matrix and fracture can be expressed as
where is the mean compressive stress. Combining Equations (1), (2), (7) and (8) yields the general Navier-type equations for the matrix and fracture, respectively
Equation (9) and Equation (10) are the governing equations for the shale matrix and fracture deformation. They are cross-coupled by the local force, , which reflects the mechanical interaction between the matrix and the fracture.
3.2. Formulation of Gas Flow in the Fracture
The gas flow within the natural fractures obeys Darcy’s law. The equation for the mass balance of the gas is defined as
where is the gas dynamic viscosity, is the gas content in the fracture including the free-phase gas and adsorbed gas, is fracture porosity, is the gas density at standard conditions, is the gas density, is the permeability of the fractures and is mass the transfer from the matrix to the fractures.
3.3. Formulation of Gas Flow in the Matrix
Gas flow in the matrix follows Darcy’s law, so the equation for the mass transfer of the gas in the matrix is defined as
where is the gas content in the matrix including free-phase gas and adsorbed gas, is the permeability of the matrix, is the dynamic viscosity of the gas, is the gas density at standard conditions, is the gas density in the matrix ( is the molecular mass of the gas, R is the universal gas constant, T is the absolute gas temperature), and is the gas mass transfer from the fracture to the matrix.
3.4. Formulation of Cross-Couplings
The mechanisms of mass transfer for a dual porosity media are fluid expansion and viscous displacement. The final form of the transfer function for a single-phase flow from the matrix to the fracture is given as [24]
where is the density of the gas, is the permeability of the matrix, is the viscosity, a is called the matrix-fracture transfer shape factor and has dimensions of L−2 that equal 1, is the matrix pressure, and is the fracture pressure.
We derived the general permeability model of the shale matrix and fracture. Shale rock contains a fracture system with well-connecting macropores and a matrix system with micropores. For each system, considering it contains a solid volume and pore volume , the shale bulk volume can be defined as and the porosity can be defined as . According to Equation (5) and (6), the volumetric evolution of the porous medium loaded by , or and can be described in terms of and , the volumetric strain of the shale matrix/fracture and the volumetric strain of the pore space, respectively [23]. The relations are
where subscript i = 1 and 2 represent the shale fracture and matrix, respectively. If we apply and , then the above equations can be expressed as
where and are the bulk moduli of the pore and the bulk modulus of the solid. We assume that the sorption-induced strain for shale is the same as for the pore space. Applying the definition of porosity, the following expressions can be defined as [15]
By solving Equations (16)–(20), we can obtain the relationship as
Substituting [25] into the above equation yields
Rearranging Equation (22) gives
Because generally , the above equation can be simplified into
where is defined as the total effective volumetric compressive strain, and is defined as the local strain induced by differential pressures between the two systems.
The typical relationship between porosity and permeability follows the cubic law [26]
By substituting Equation (24) into Equation (25) we obtain shale permeability model
The total effective volumetric strain can be written as
where is the volumetric strain, is the volumetric strain induced by sorption, cl is the local strain coefficient.
By substituting Equation (27) into Equation (26), we can obtain the permeability model for the shale matrix and fracture.
where subscript i = 1 and 2 represent the shale fracture and matrix, respectively. cl is the local strain coefficient which is in proportion to differential pressures and , is a constant.
Shale has many nanopores. The flow regimes of the gas also strongly affect the apparent permeability [26,27]. The relation between apparent permeability, , and intrinsic permeability of matrix, , is
Kn is the Knudsen number and can be expressed as
is a dimensionless rarefaction coefficient. Its value varies: for . is an empirical parameter and the dimensionless rarefaction correlation is presented by Civan et al. [28]
where A = 0.17, B = 0.4348, and = 1.358.
is defined as the ratio of the molecular mean free path, and pore radius .
The mean-free-path of molecules is given by [24]
where is Boltzmann constant, T is the temperature of shale reservoir, is the collision diameter for molecules. Based on the research of Wei et al. [29], The nanopore radius can be obtained as
where r is the average nanopore radius, r0 is the initial nanopore radius, is the thickness of the adsorbed layer. The average thickness of the adsorbed layer can be expressed as [29]
where D is a constant and equals to 0.07 [29,30], and ta is the thickness of the adsorbed layer at extremely high pressures, is the density of the gas at the specific temperature and pressure, is the gas density of the adsorbed phase (generally assumed to be the van der Waals density of the gas) and is 370 kg/m3. Substituting Equation (37) into Equation (36) yields
Therefore, the Knudsen number becomes
Therefore, the final formulation of apparent permeability of inorganic matrix can be expressed as
4. Evolution of Shale Permeability under Stress-Controlled Conditions
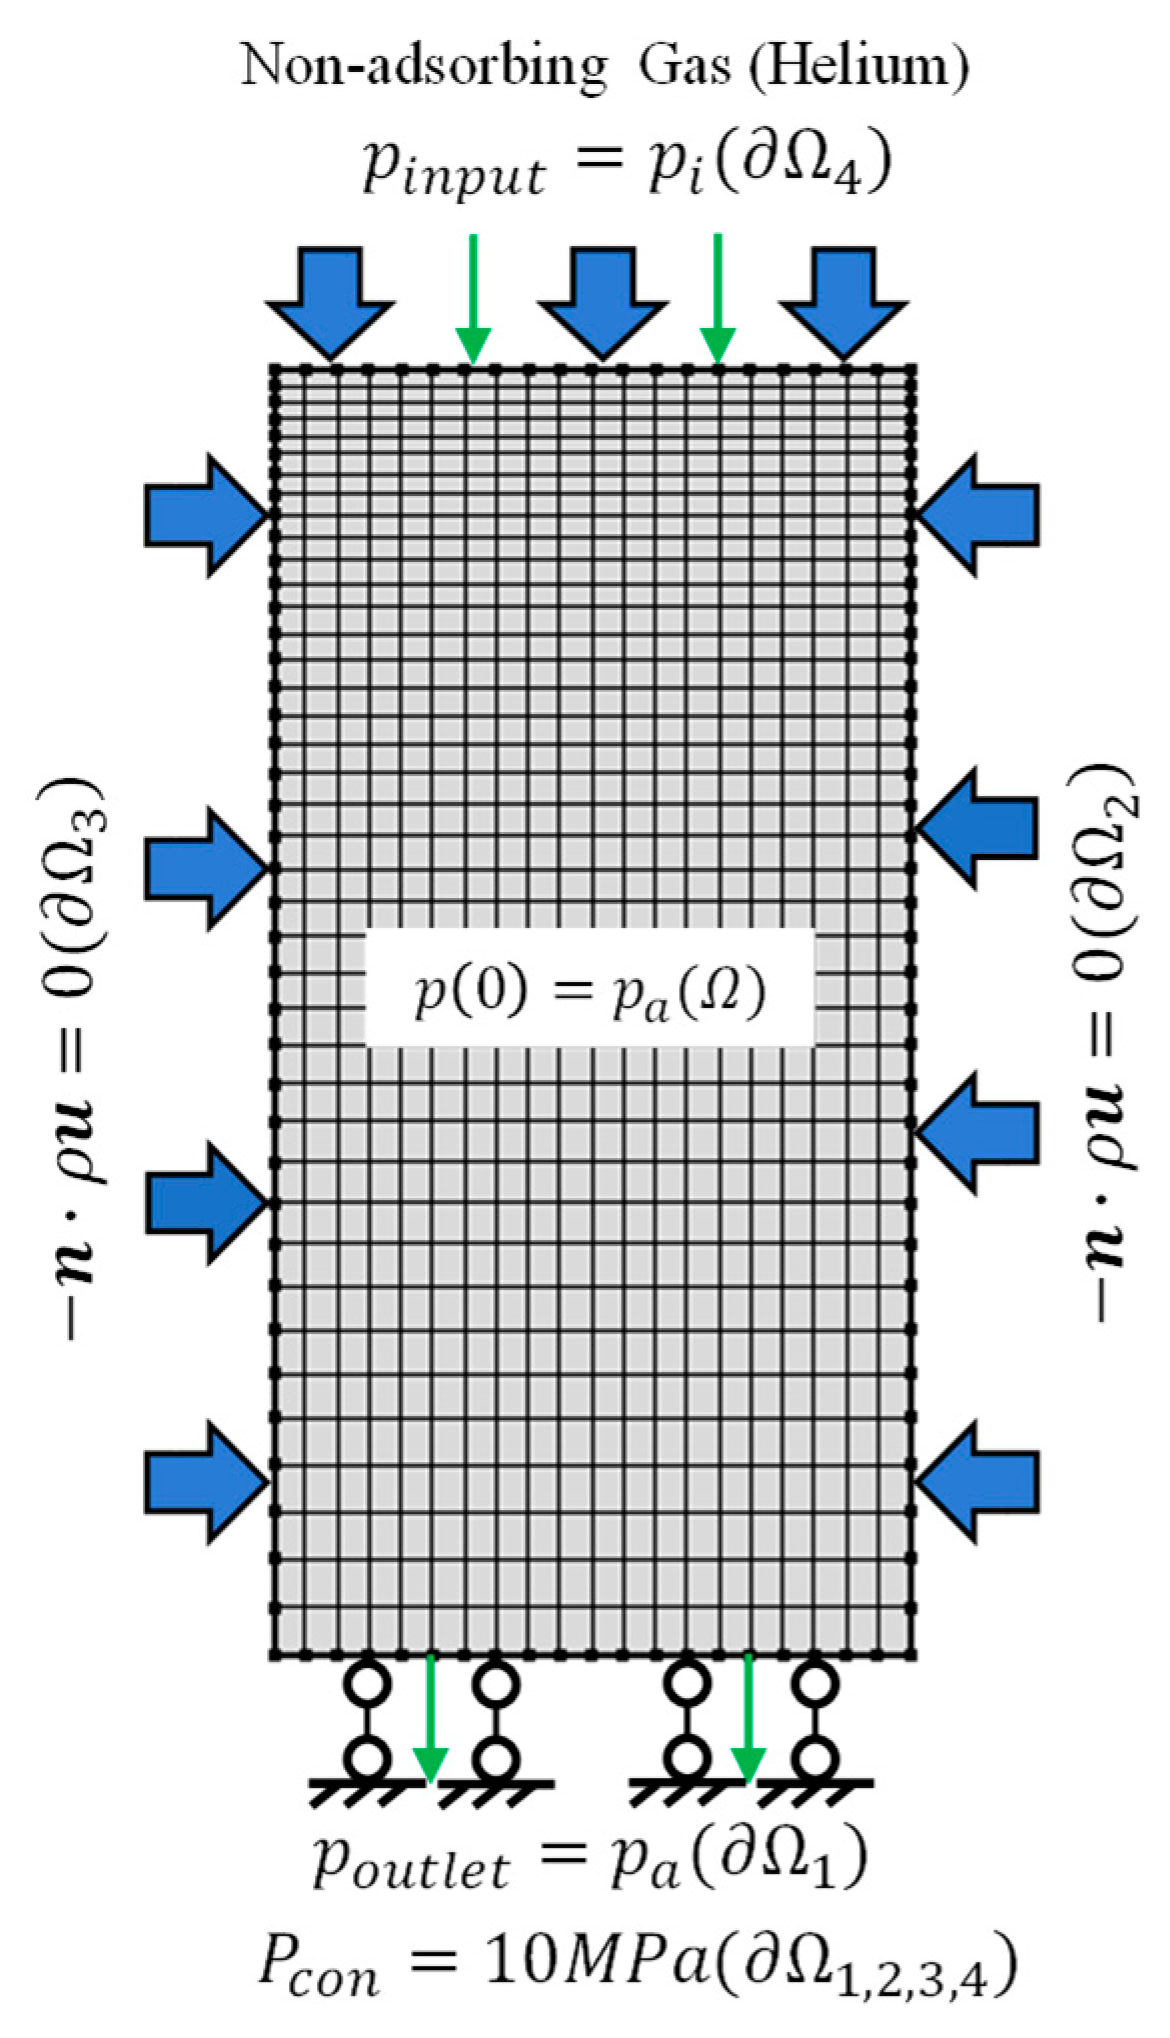
The above complete set of formulations, four field equations (Equations (9)–(12)) and two permeability models (Equation (28-a)–(28-c), Equation (38)), are implemented into COMSOL MULTIPHYSICS, a commercial PDE solver. The model geometry of 5 cm × 10 cm is shown in Figure 2. The new model considers mechanical deformations, sorption-induced volumetric strain, local strain induced by local force and interactions between two systems. The simulations were conducted under the constant confining stress condition, 15 MPa. Methane gas (absorbing gas) was used in the simulation and the pore pressure increased from 4 MPa to 8 MPa. The extended material properties are shown in Table 1.
From Figure 3, it can be seen that the different mechanical properties of the shale matrix and fracture play an important role in controlling the gas flow process. Pore pressure in the fracture equals that in the matrix at the initial equilibrium station. When the gas is injected into the subject, the pore pressure in the fracture increases firstly because of the higher intrinsic permeability while the pore pressure in the matrix keeps stable because of extremely low intrinsic permeability. More interestingly, the asynchronization of gas flow in the matrix and fracture generates a differential pressure which will induce local strain that has an effect on permeability. When the gas diffuses into the matrix, the pore pressure in the matrix starts to increase gradually. Until the gas diffuses into the whole shale, the subject reaches the equilibrium station again and the differential pressure becomes zero again too.
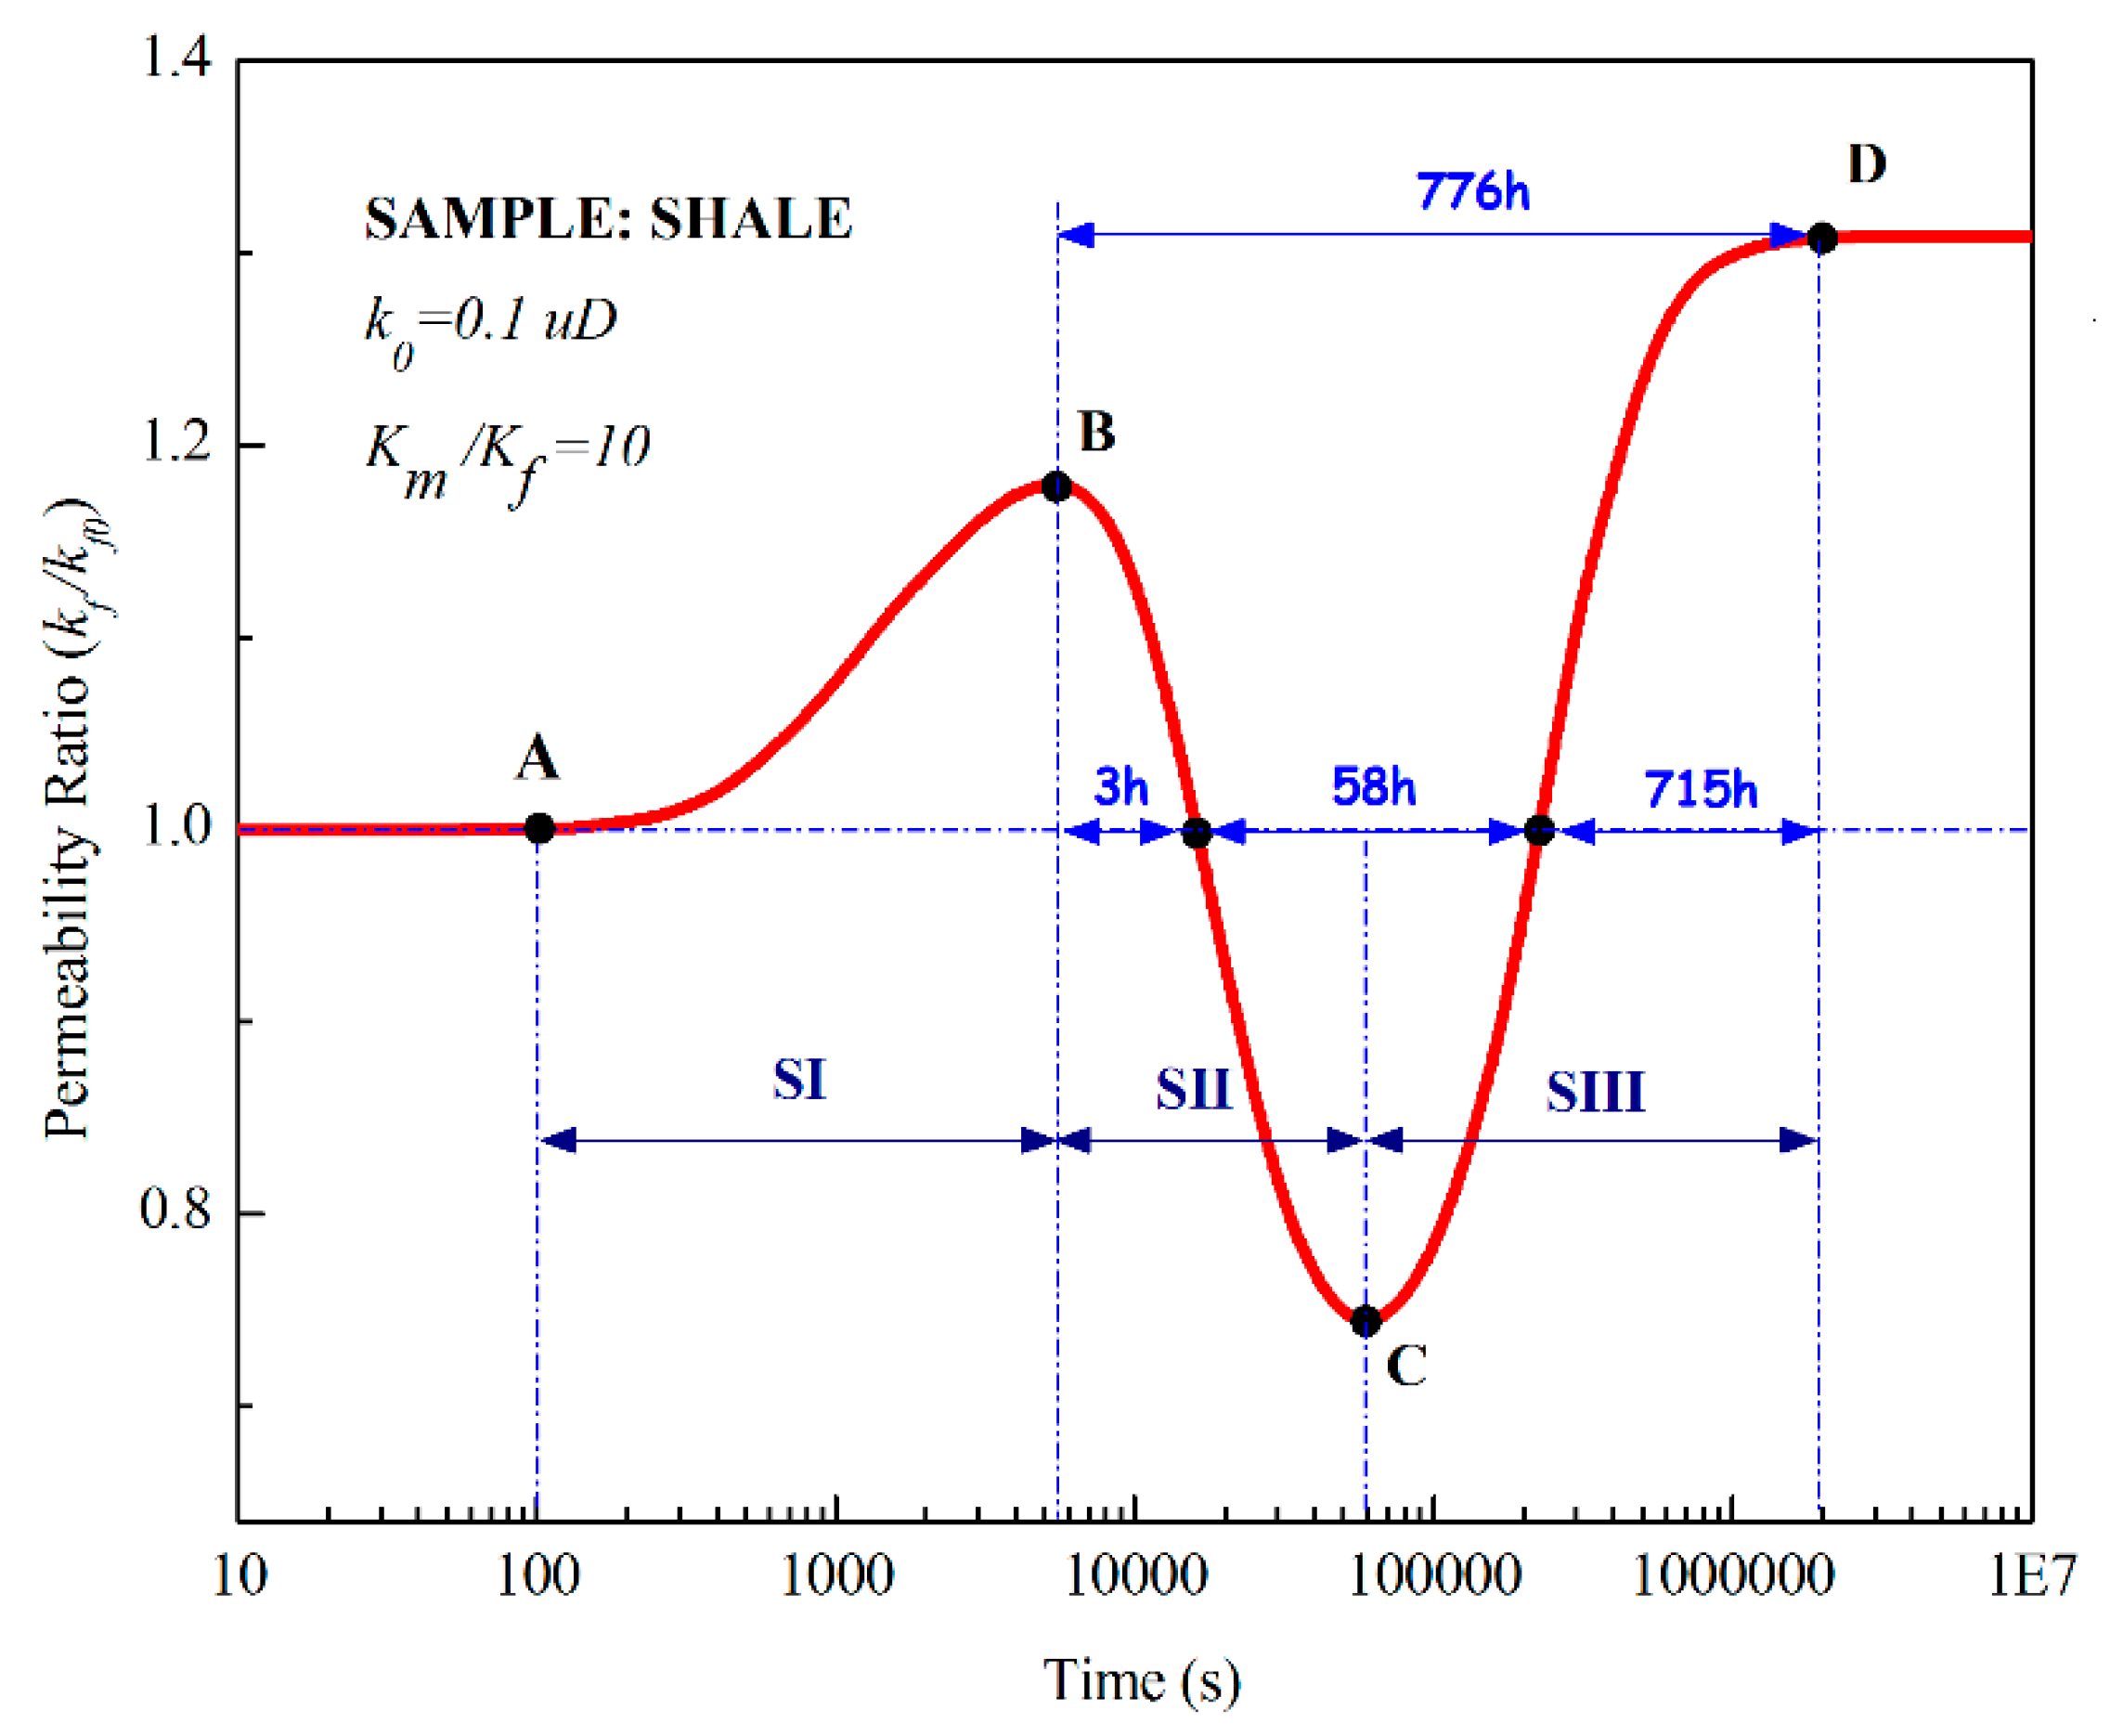
A typical permeability evolution during gas injection is illustrated in Figure 4. It consists of two main features: the permeability ratio at point D is higher than it at the initial station; there is a wave crest B and a trough of wave C. During gas injection, the shale permeability ratio evolution can be divided into three stages. At the first stage (SI), the shale permeability ratio increases by around 20% in the short term. This is because the pore pressure in the fracture increases dramatically while that in the matrix is still the initial value. Therefore, the differential pressure will generate a local compress strain on the matrix located in the vicinity of the fracture which causes the swell of the fracture. In addition, the gas-sorption induced strain also results in the improvement of the permeability. Prior to the diffusion in the matrix, the strain induced by differential pressures and sorption both reach the maximum and the permeability reaches a crest as well. At the second stage (SII), the shale permeability ratio switches from an increase to a decrease to the initial value and then continues to decline to the minimum at point C. The pore pressure in the matrix starts to increase as the gas diffuses into the matrix. The differential pressure declines gradually. The sorption-induced swelling strain has a negative impact on the fracture and this effect will be accumulated with the expanding of the local strain region. Because the porosity of the matrix is higher than the fracture’s, the accumulated sorption-induced strain of the matrix has a significant influence on the fracture permeability and this process lasts for a relatively long time. At the third stage (SIII), the permeability ratio recovered and increases and after 30 days, it finally increased by 30%. This phenomenon is contributed by two reasons: (1) the effective strain of shale changed from a local strain to a global strain when the gas spreads uniformly within the shale; (2) the effective stress decreases due to the increase of the pore pressure under the constant confining stress condition. Therefore, the permeability ratio has a net growth at the end equilibrium station.
4.1. Impact of Local Strain on Permeability
In this study, the local strain includes two components: a local strain induced by differential pressure; the local strain induced by an interaction of the sorption strain. In order to investigate the impacts of local strain on permeability, we conducted four scenarios by considering the mechanism of local strains induced by the differential pressure and the interaction of the sorption-induced strain, both of them and none of them, respectively. The results of the resultant permeability ratio of shale are shown in Figure 5.
From Figure 5, it can be seen that the local strains play an extremely important role in the shale permeability evolution. The first scenario represents the permeability ratio profile without the local strain effects. In this case, the permeability increases monotonically and is controlled by the effective strain which follows the principle of effective stress. The second scenario represents the permeability profile with the impact of local strain induced by differential pressure only. Based on the above analysis in Section 2, the local strain increases the fracture aperture. The reason is that the differential pressure generated a compress strain in the matrix located in the vicinity of the fracture. At the end equilibrium station, the local strain transforms into a global strain with the disappears of differential pressure. Therefore, the permeability declines by a small portion. The third scenario represents the permeability profile with the impacts of local strain induced by an interaction of the sorption strain. The fourth scenario represents the permeability profile with the impact of local strain induced by differential pressure and the interaction of sorption strain. From the third and fourth scenarios, we can know that with the impact of the local strain, the resultant permeability ratio increases over 1 at the initial stage and then declines dramatically under 1. With the transformation of the local strain to the global strain, the local effect finally disappears. Therefore, the resultant permeability ratio rebounds to a value over 1.
4.2. Impact of Modulus Ratios on Permeability
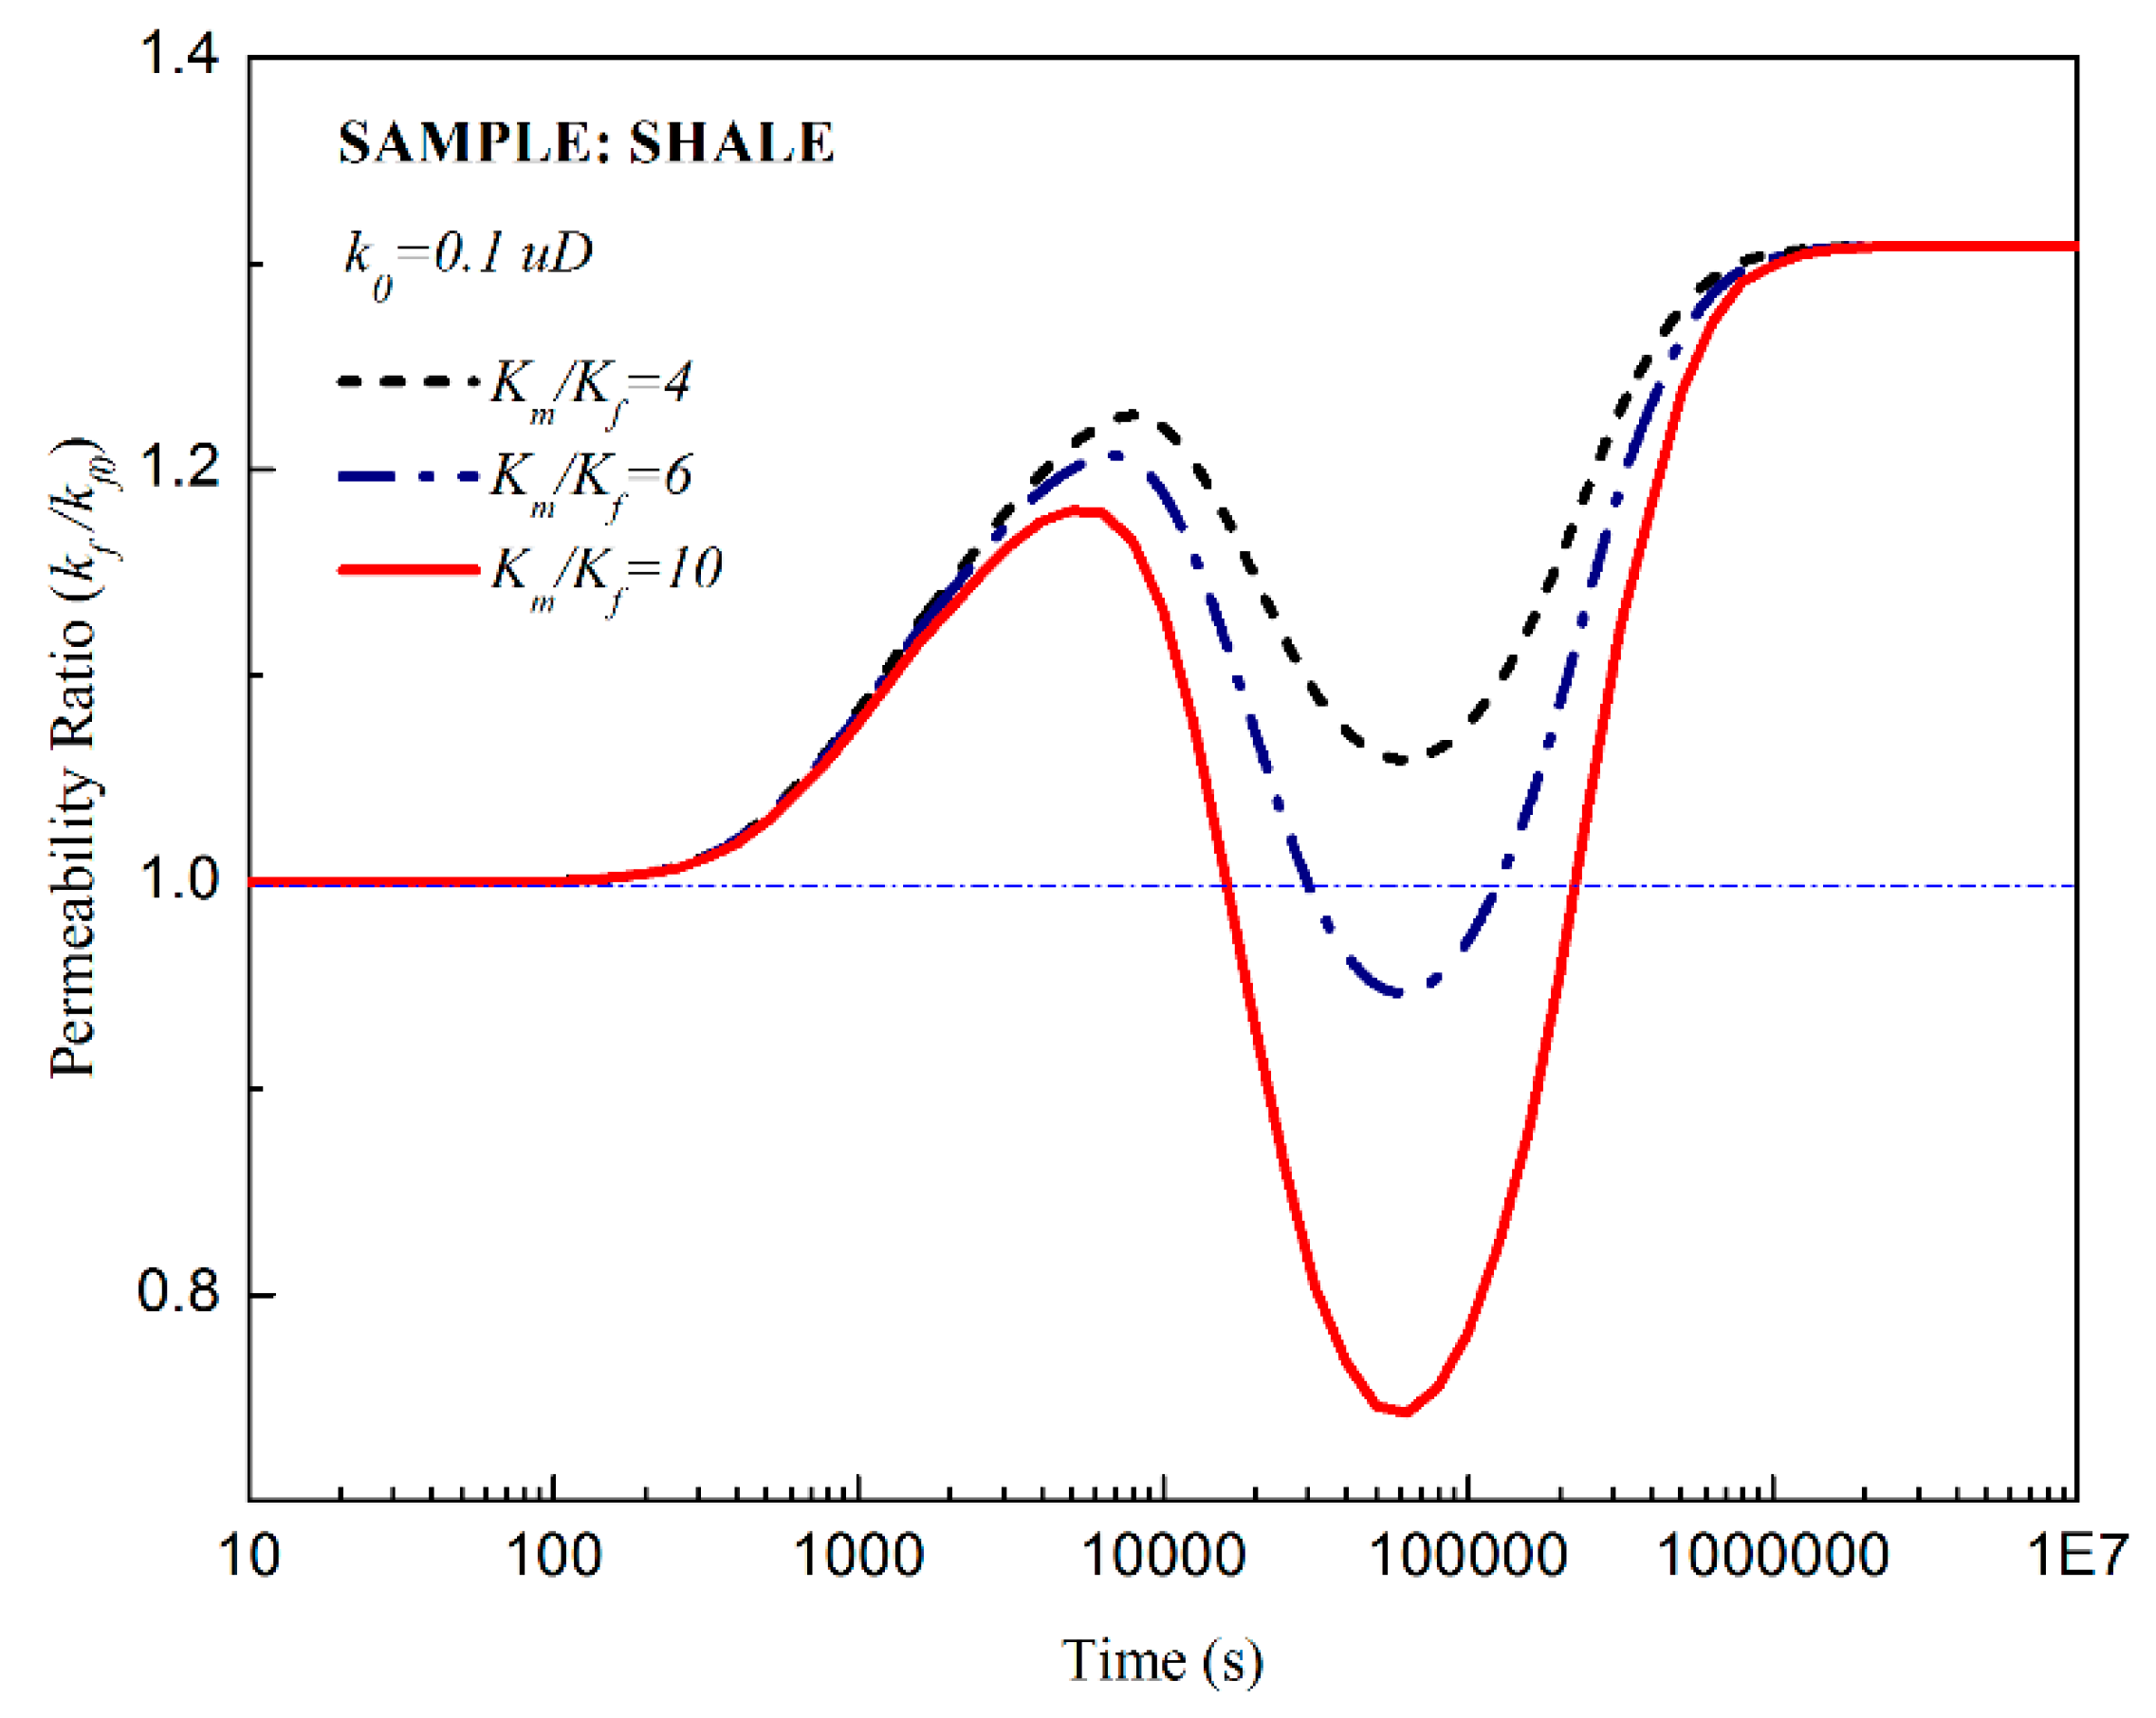
In order to investigate the influence of shale mechanical properties on permeability, a simulation case was conducted with different bulk modulus ratios (Km/Kf) and the same injection pressure and confining pressure. Results corresponding to three cases (Km/Kf = 4, 6 and 10) are shown in Figure 6. Permeability ratios for all the cases follow the same pattern. However, when the difference of the matrix and the fracture modulus are small like Km/Kf = 4, there is a net increase of the permeability. When the modulus ratio is large enough such as Km/Kf = 6 and 10, there is a significant decrease in the permeability ratio. Additionally, the higher the bulk modulus ratio is, the more the permeability ratio generated decreases. These results show that the difference of the mechanical properties between the matrix and the fracture is positively related to the impact of the local strain on permeability. These phenomena may reveal that there are more fracture or macropores in the shale with large different bulk modulus ratios and the more fractures or macropores, the more significant the local strain effects.
4.3. Impact of Pore Pressure on Permeability
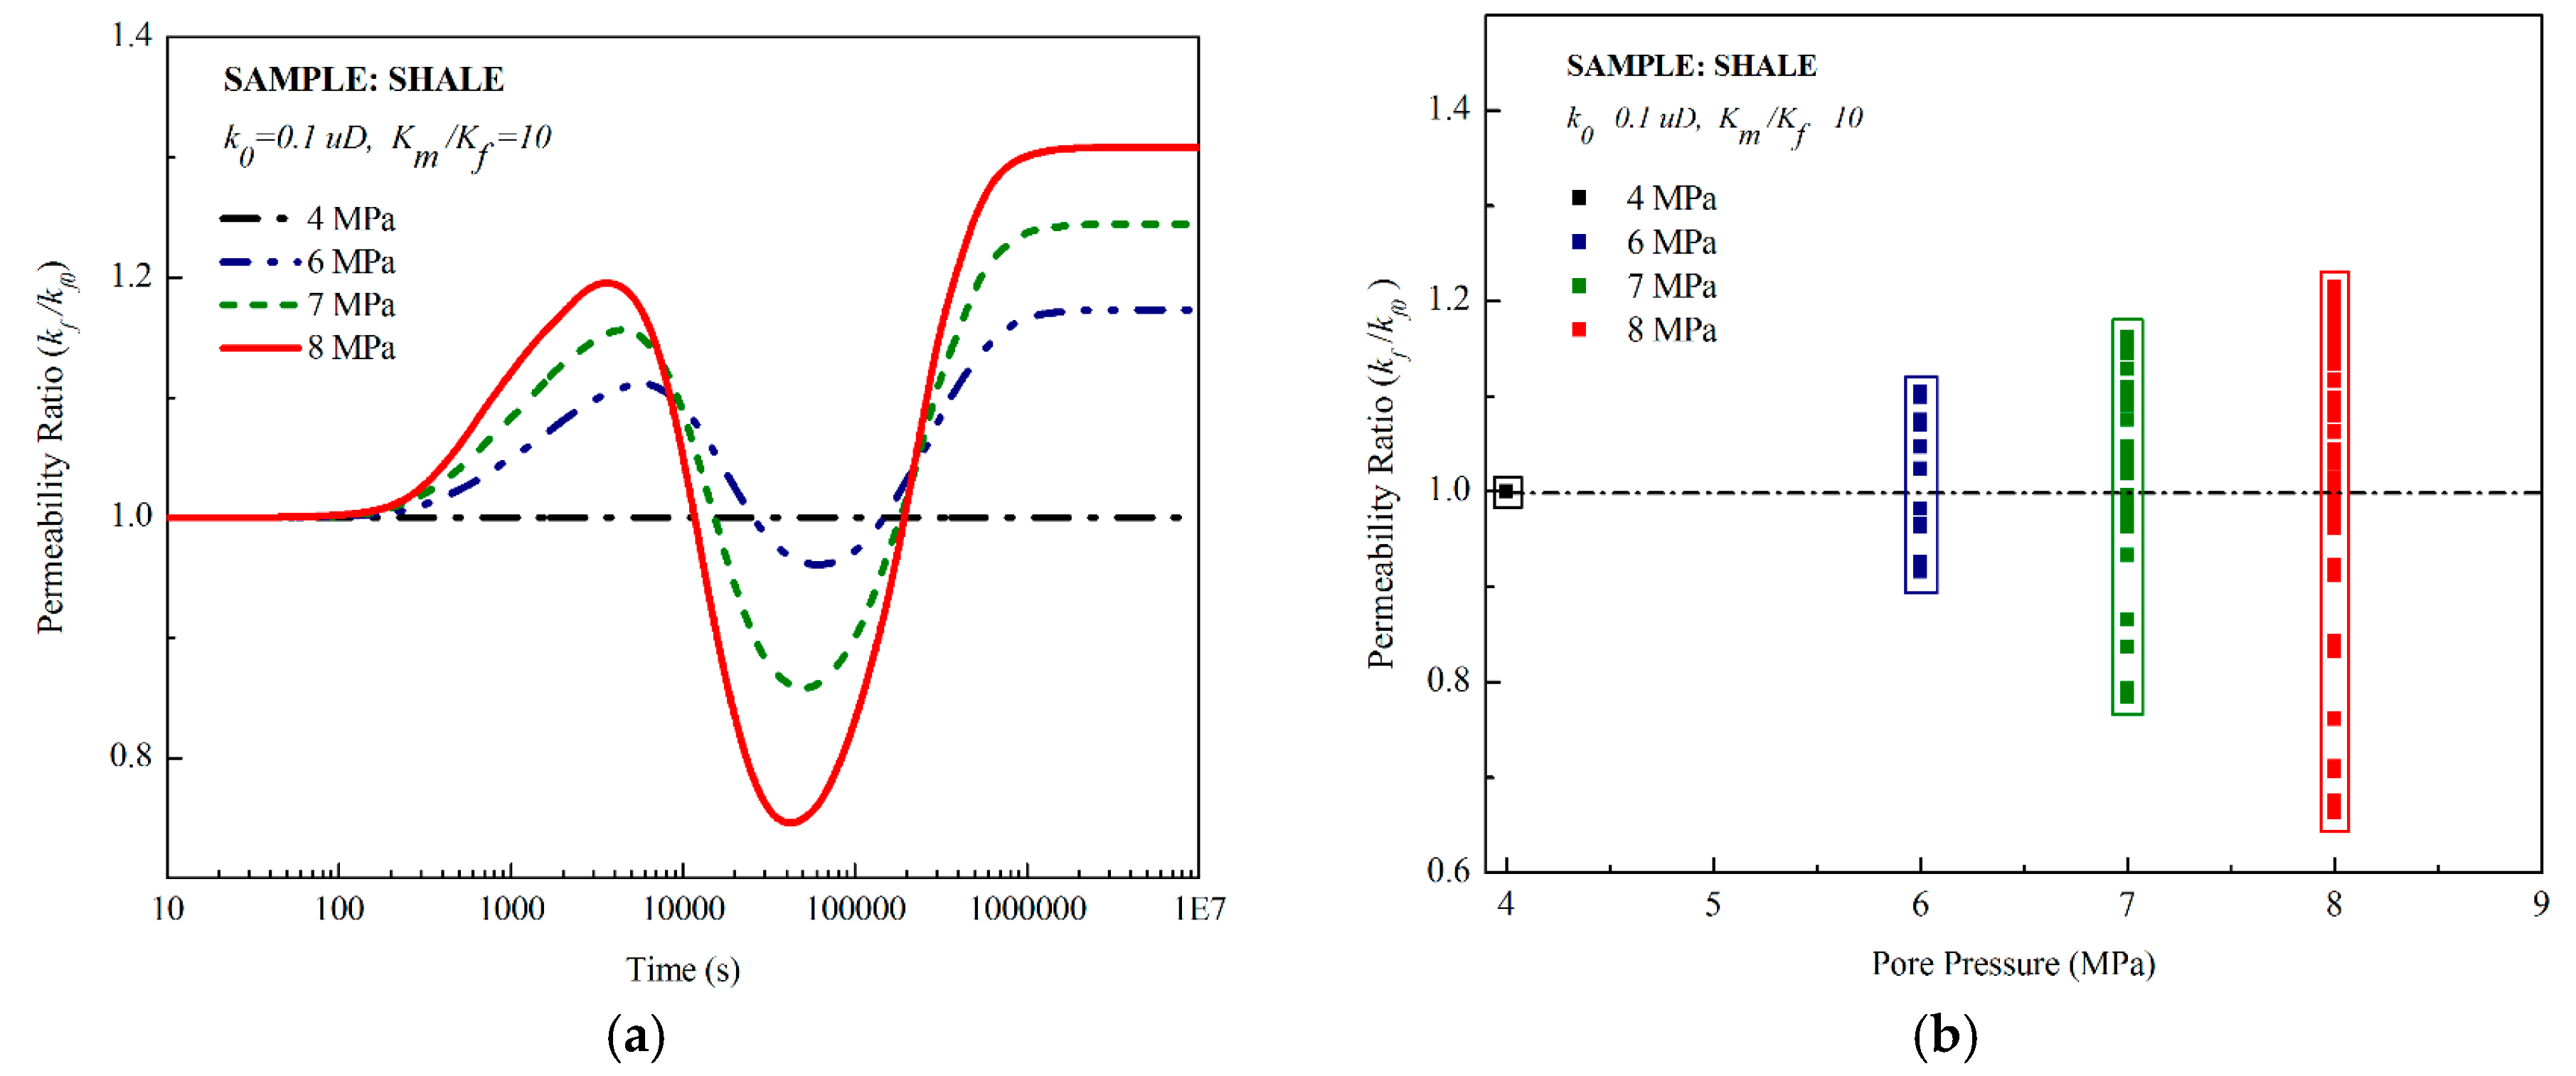
Figure 7 presents the evolution of shale permeability with different injection pressures. The crest and trough of the permeability ratio are higher and lower when the injection pressure is higher. Figure 7b is shale permeability ratio with pore pressure and time. It is a three dimensions graph. From this figure, we can know that the permeability ratio profile is not only related to the pore pressure but also to the time the value is obtained at.
4.4. Impact of Klinkenberg Effects on Permeability
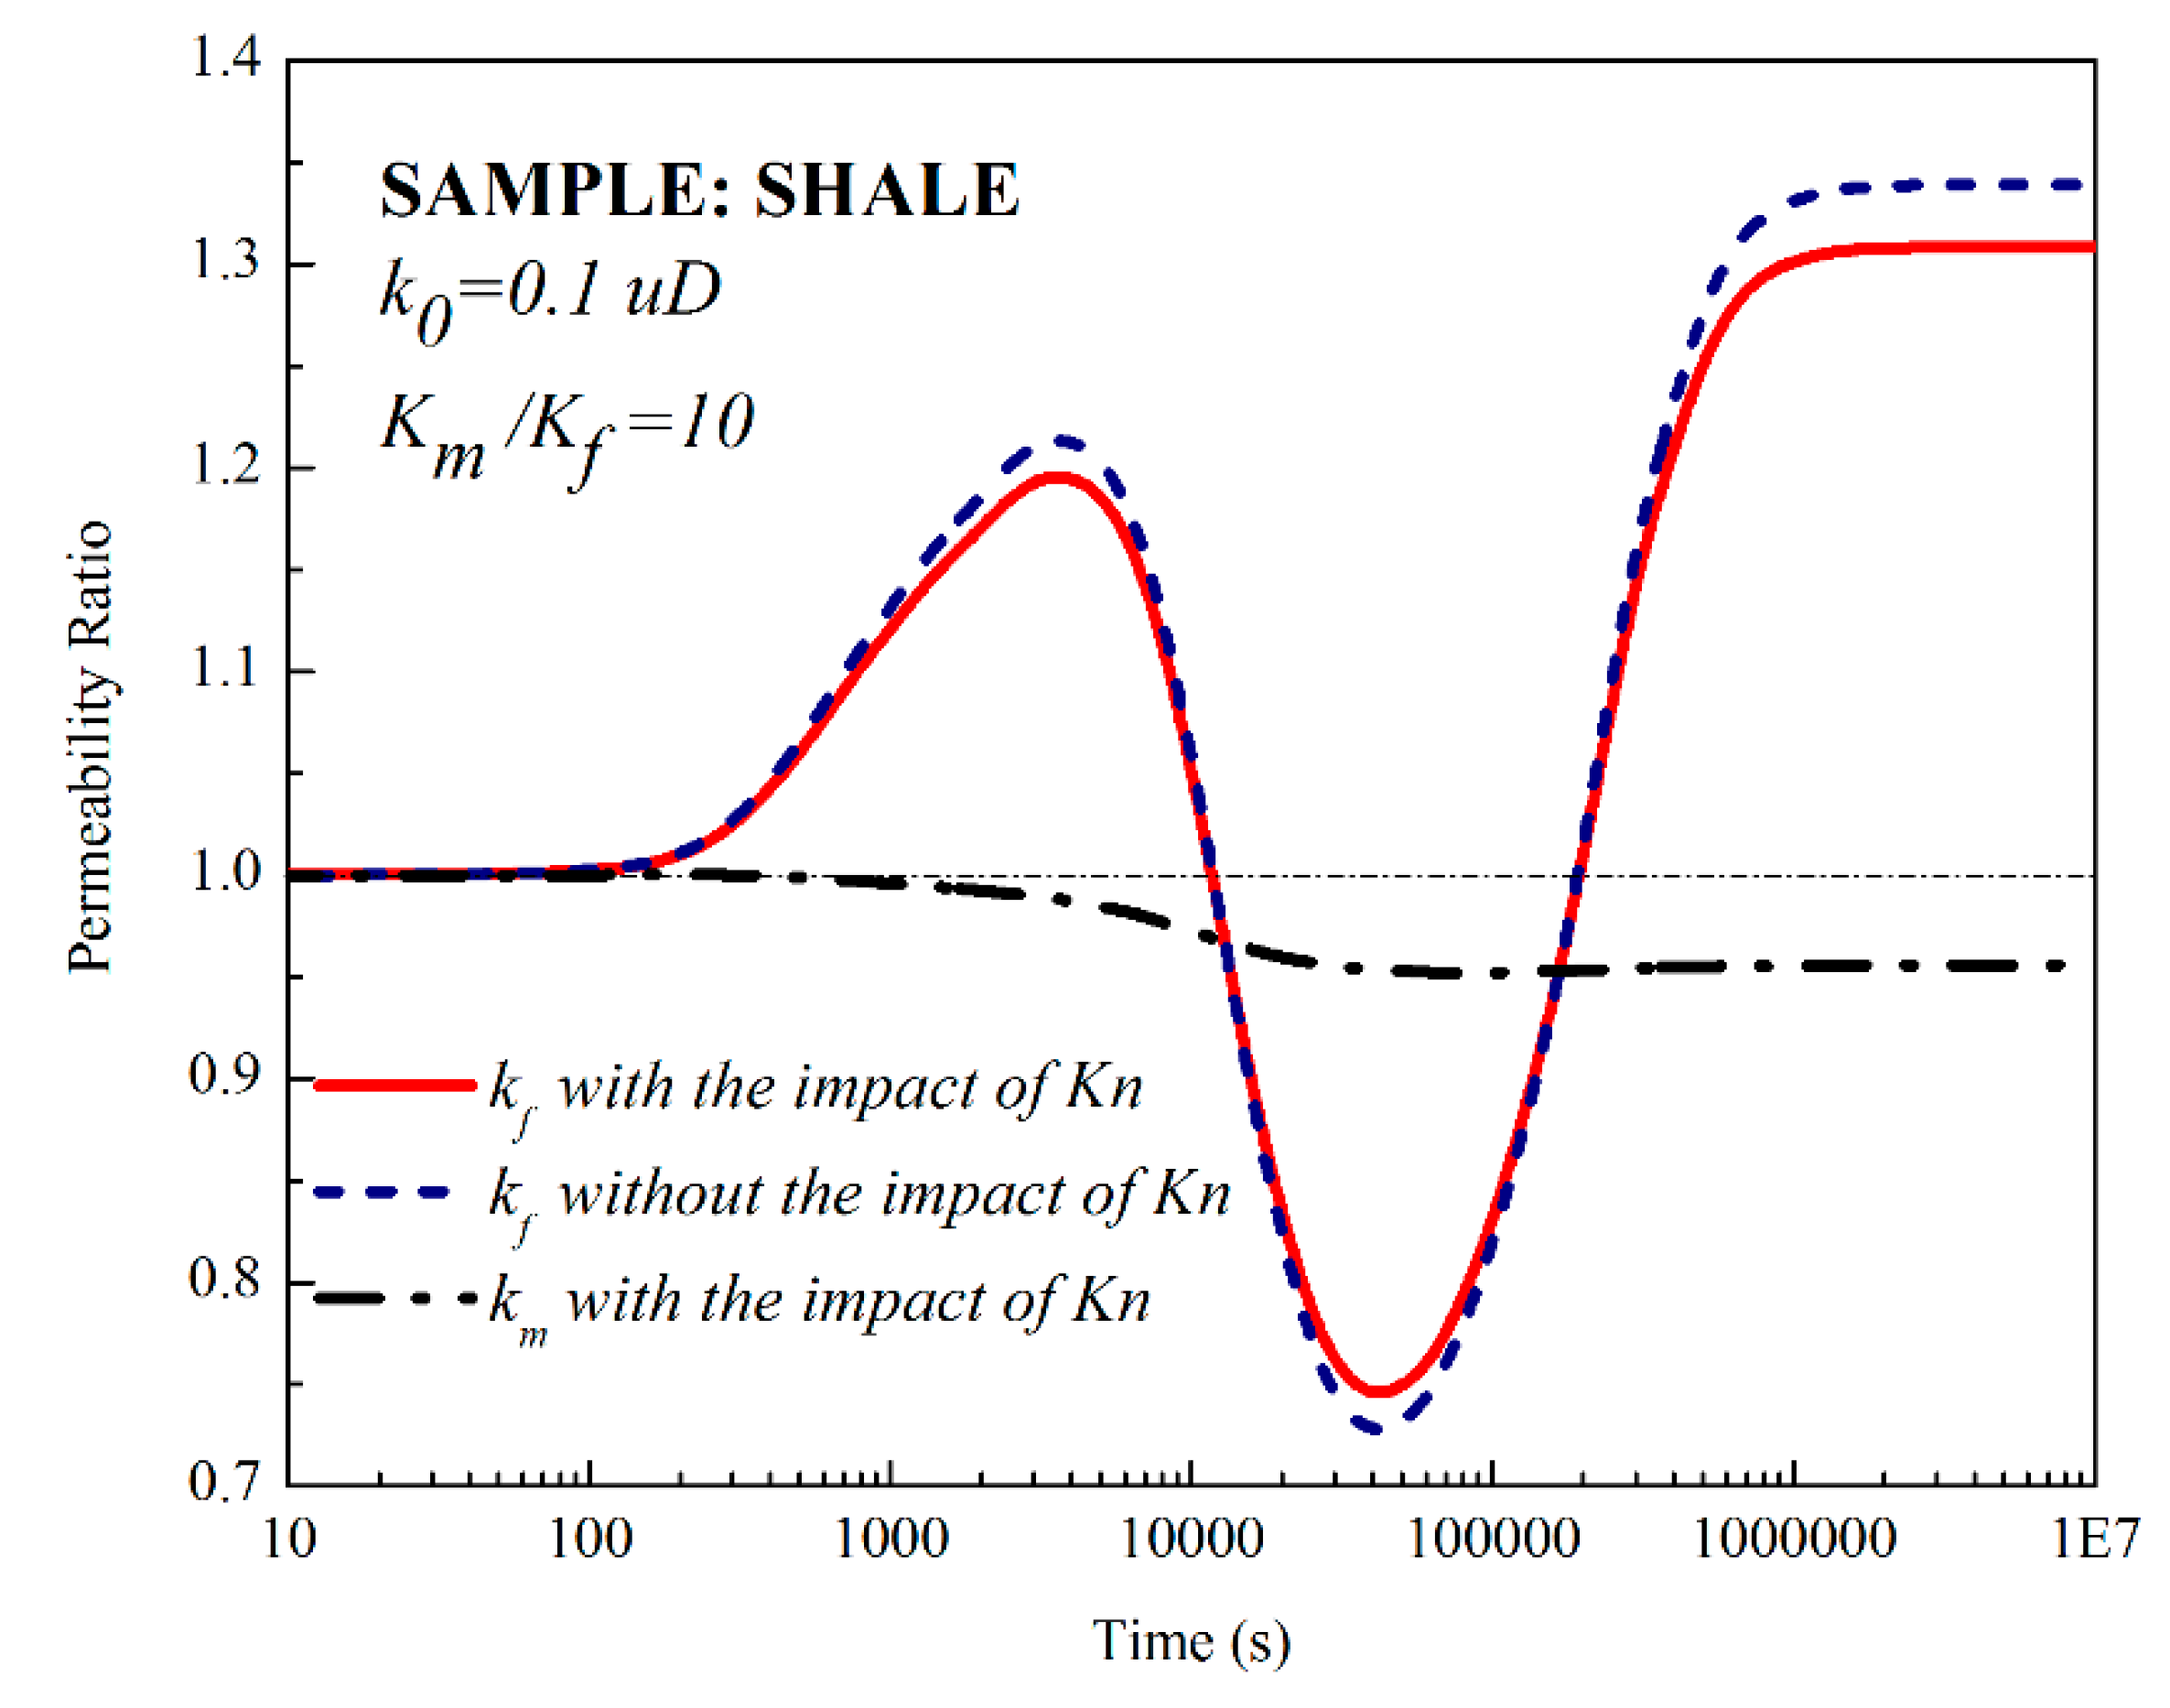
The impact of the Klinkenberg effect (Slip effect) on matrix permeability and the resultant permeability of shale is shown in Figure 8. The parameters used in this simulation case are collected from the literature [31] and are listed in Table 2. The Klinkenberg effect (slip effect) is closely related to the magnitude of the pore pressure and it has a significant influence on the matrix permeability especially under low pore pressures. From the figure, we can know that the higher the pore pressure, the lower the matrix permeability. However, compared to the impact of local strain, the Klinkenberg effect has a weak influence on the resultant permeability. In addition, the Klinkenberg effect cannot explain the net increase of the resultant permeability under the constant confining stress condition.
4.5. Model Evaluation and Discussions
In this section, simulations are conducted using our new model to illustrate the impact of local strains on the permeability evolution. We collect experimental data from Xiang Li at al. [32]. A series of experiments were conducted on the Green River Shale under the condition of a constant total confining stress of 20 MPa. Different gas, He, CH4 and CO2, were injected into the specimens with artificial fractures. The values of the mechanical parameters such as Poisson’s ratio and Young’s modulus are assumed based on the literature [33,34] and are listed in Table 3. The Langmuir constants of shale and dynamic viscosity of gases are listed in Table 4.
To investigate the impact of non-sorbing gas on permeability, researchers obtained the permeability data at pore pressures of 2 MPa, 4.2 MPa, 6.16 MPa, 8.16 MPa and 10.1 MPa. We conducted simulations with the same pore pressures under the same conditions using our new model. Figure 9 shows the permeability evolution against time and pore pressure and the comparisons between the experimental data and simulation results using non-sorbing gas (He). From the experiment, we can know that the shale permeability increases with pore pressure. From the simulation results, we can obtain a three-dimensional permeability evolution not only with pore pressure but also with time. All the experimental data are located in a special zone between 2 h and 7 h.
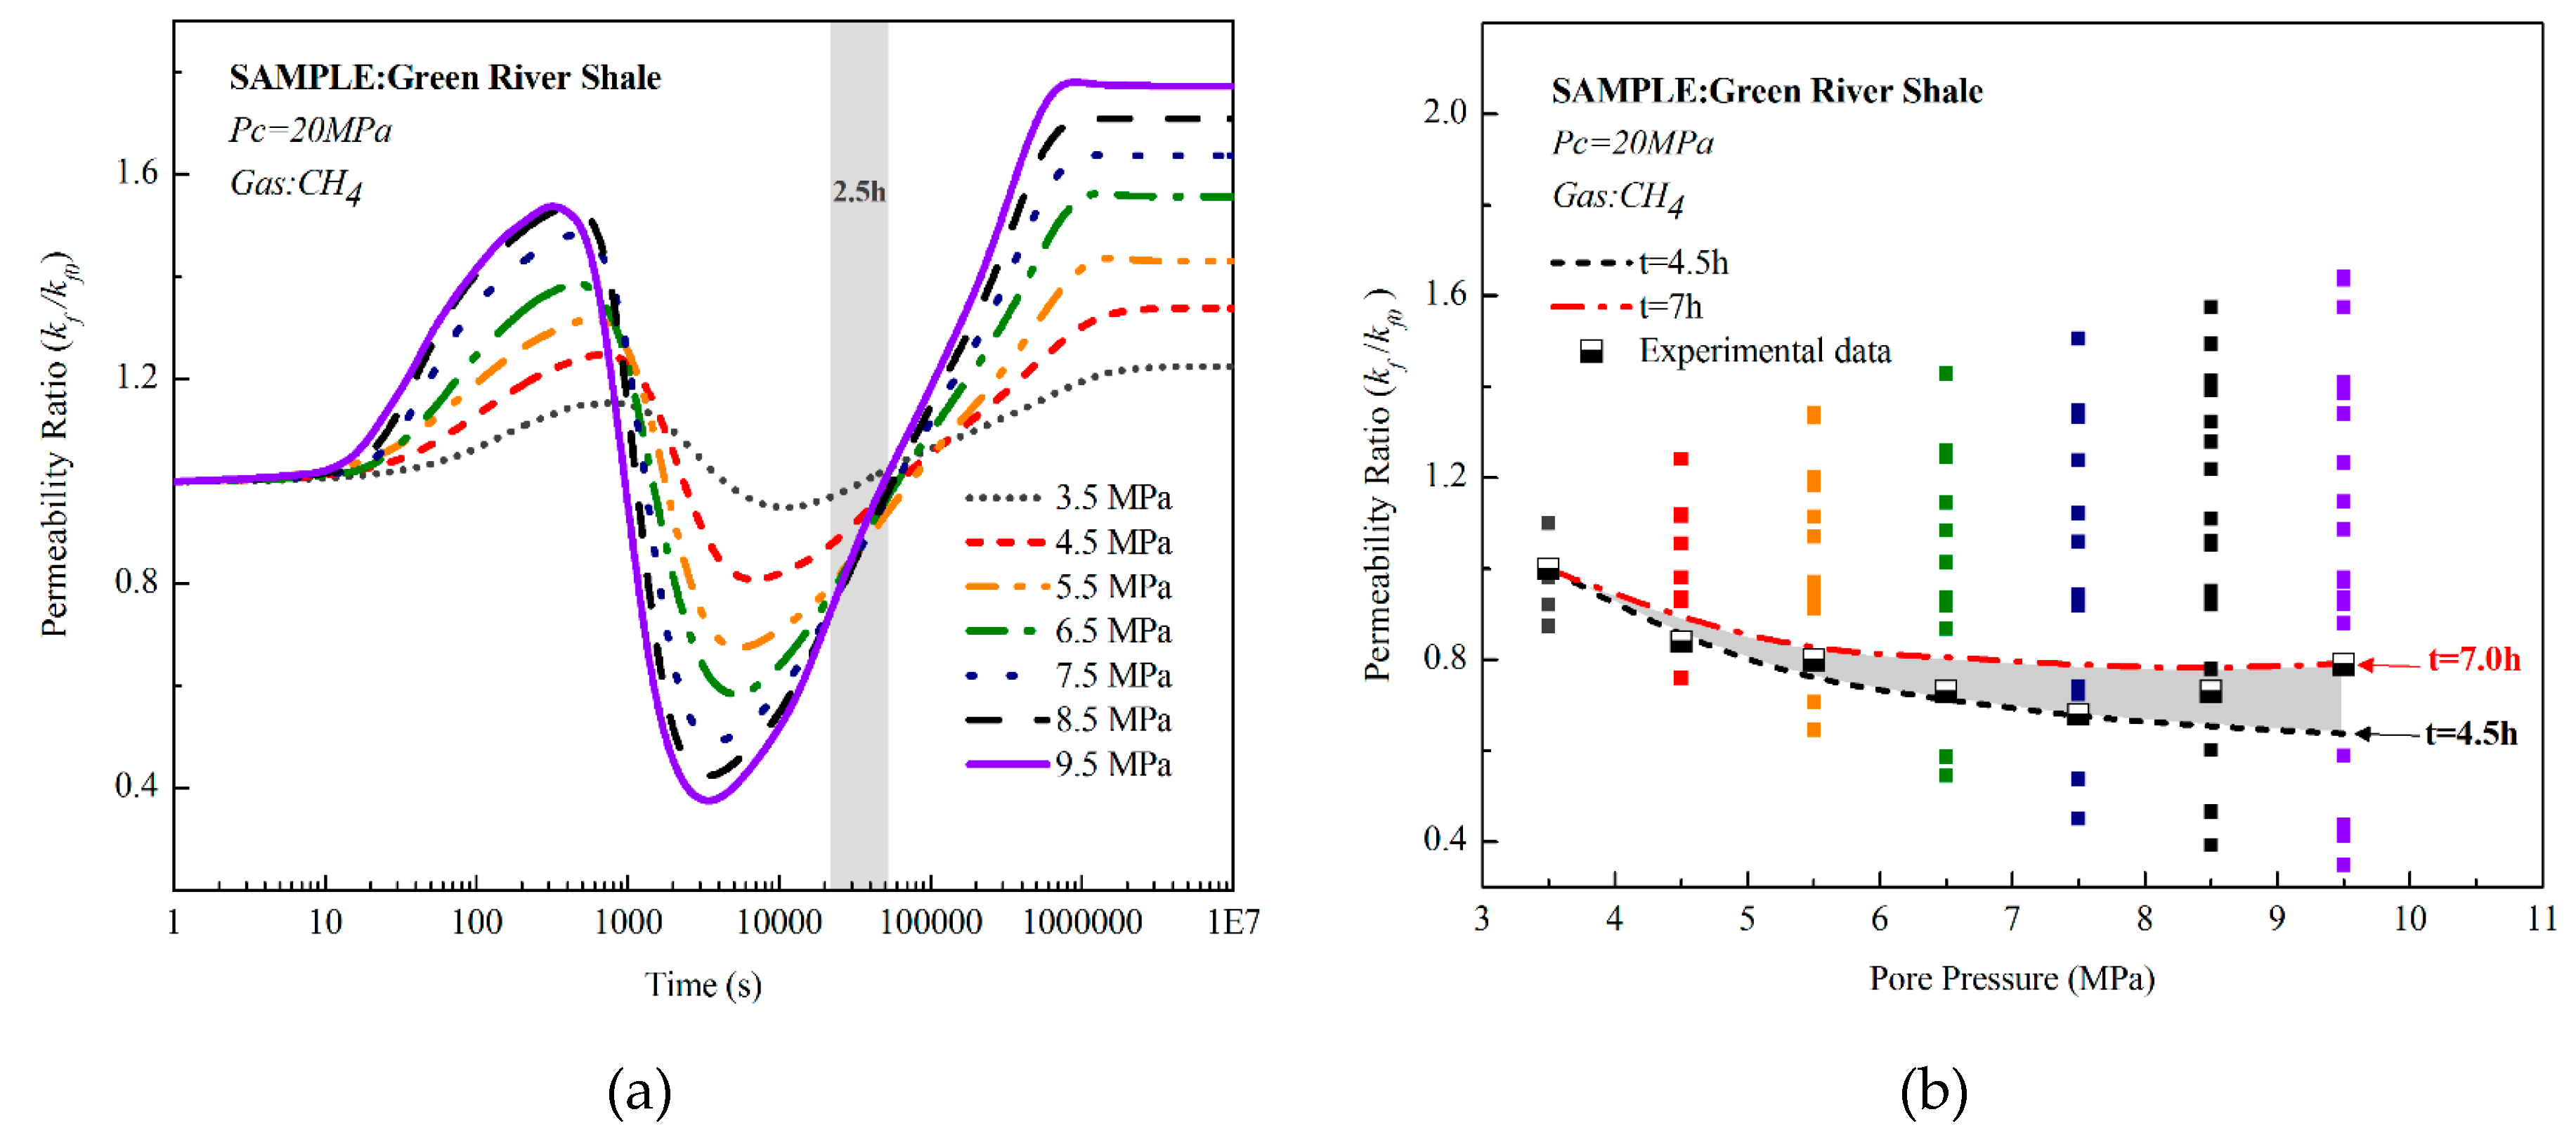
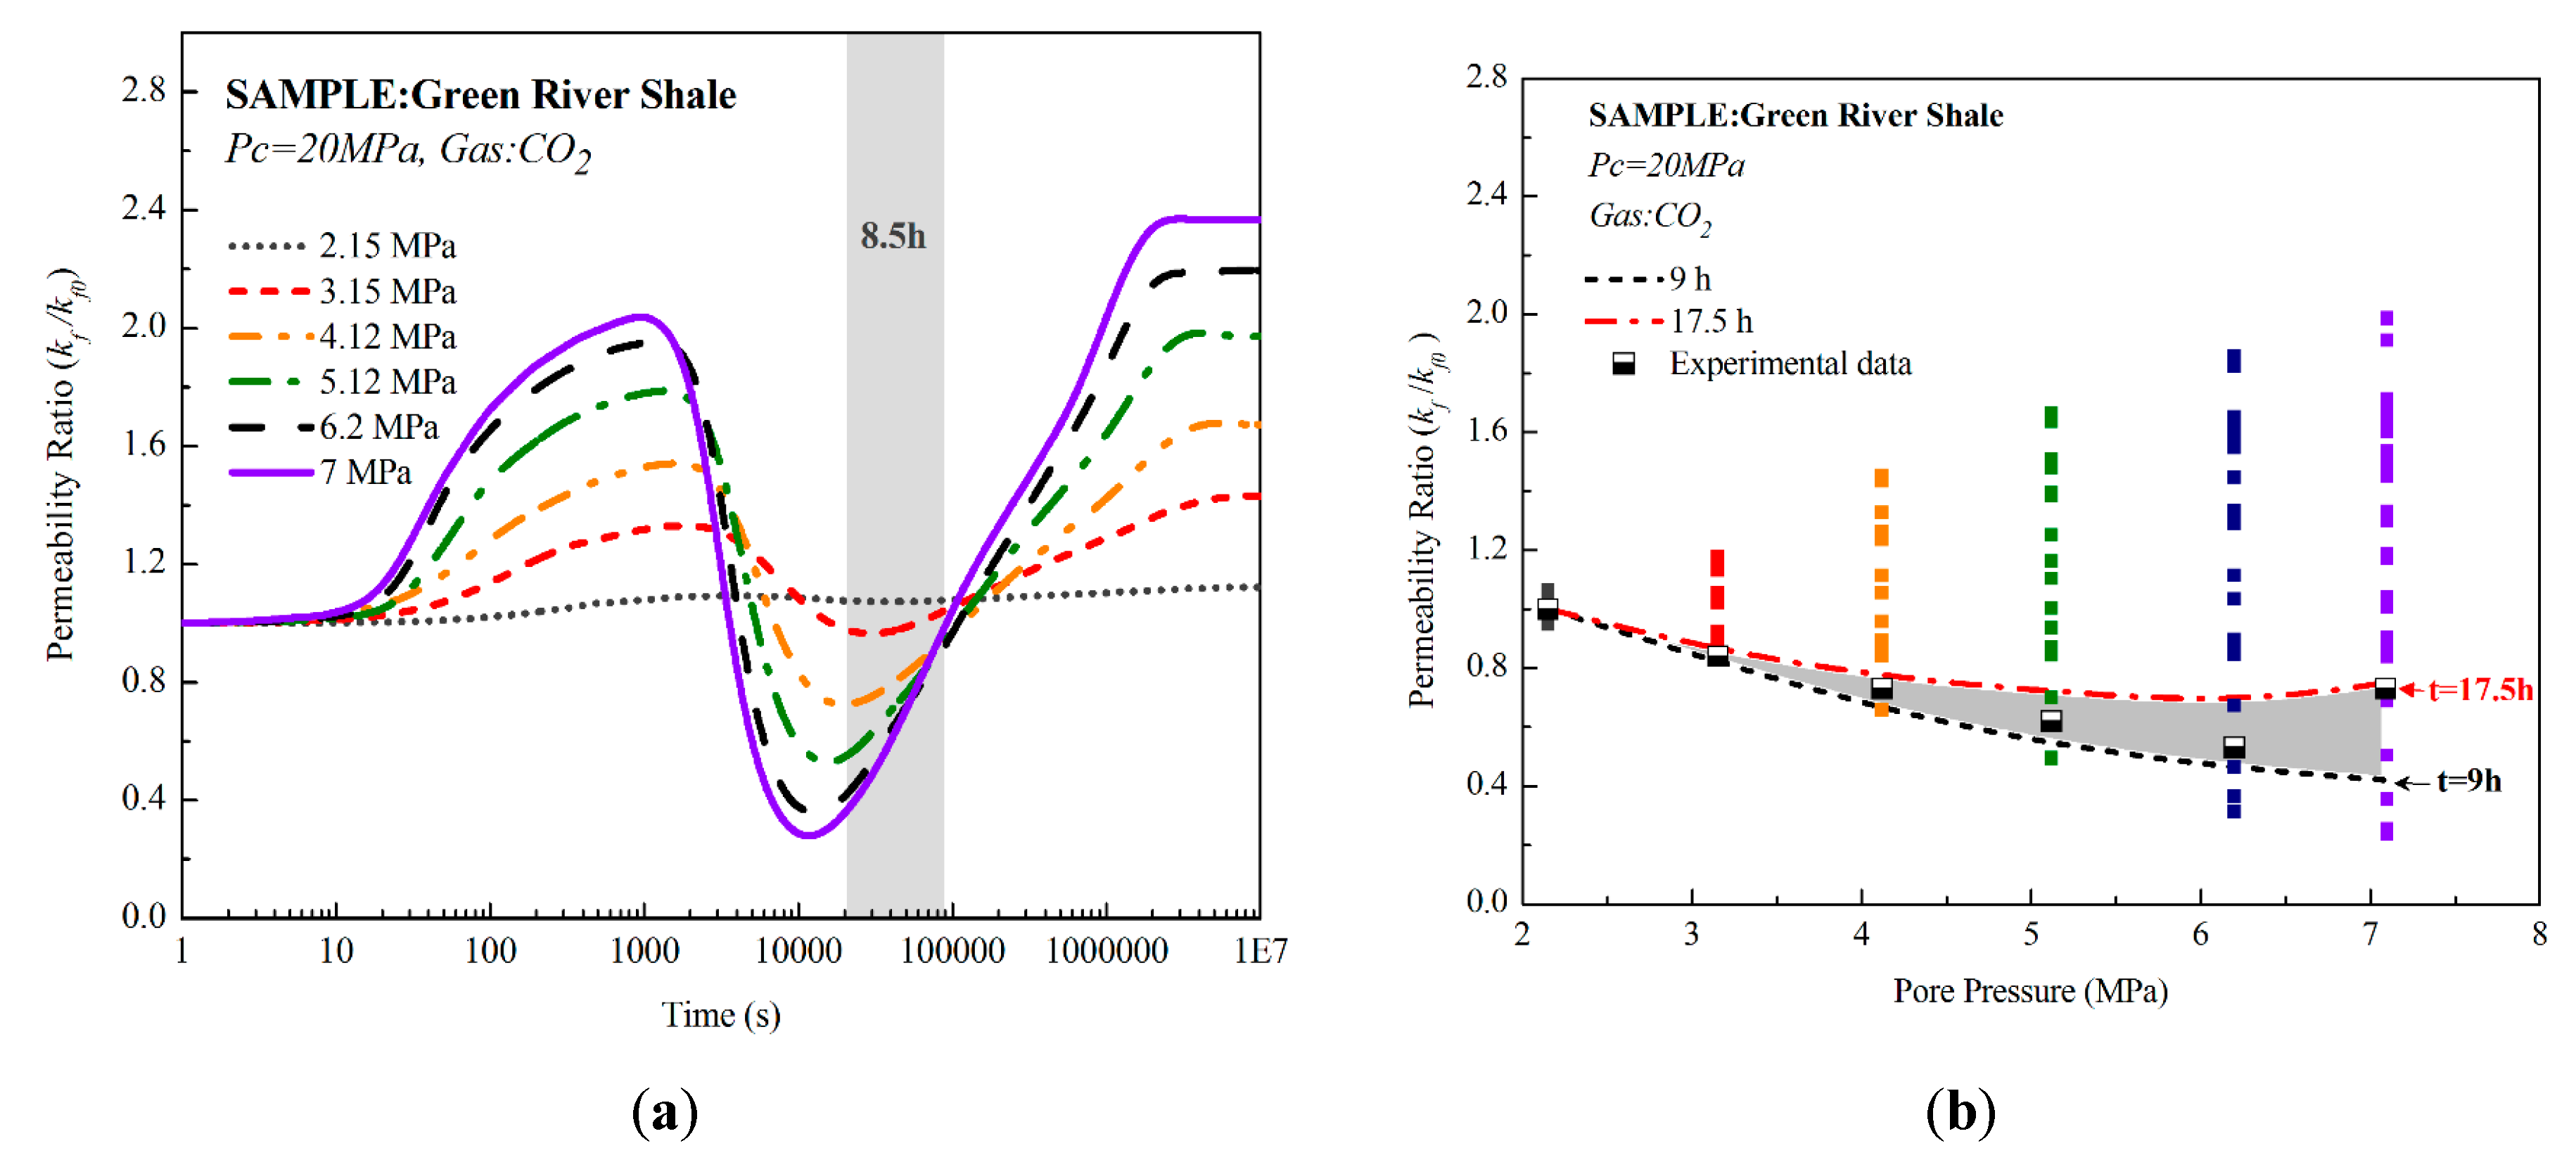
To investigate the impact of the local effect of sorption-induced strain on permeability evolution. Sorbing gases (CH4 and CO2) were used to conduct experiments. The permeability for sorbing gases CH4 and CO2 all show the typical U-shaped curve, as shown in Figure 10 and Figure 11. The permeability decreases firstly and then rebounds to an increase. Compared to the simulation results, the experimental data are in a certain zone with a diffusion time from 4.5 h to 7 h and from 9 h to 17.5 h for CH4 and CO2, respectively. All these experimental data are obtained in the process from the local strain to global strain.
It is obvious that the result calculated by the model with the impact of the local effects matches the experimental data well. And the model without the impact of the local effects induces significant errors that causes the apparent permeability to decrease slowly. The reason is that the local effects applied press stress on the matrix that caused an increase in the effective stress. The change of the effective stress decreased the permeability of the matrix. This phenomenon clearly illustrates the importance of local strain due to local force for the apparent permeability evolution of shale.
5. Conclusions
The full shale matrix-fracture interactions such as mass exchange and deformation compatibility are included into a fully coupled shale deformation and gas flow model. Based on the results of this study, the following conclusions can be drawn:
For shale, gas injection induced effects can last very long because of the huge contrast between the matrix and fracture properties. The primary reason for those added effects is the gas diffusion from the fractures to the matrixes. The diffusion changes the force balance, mass exchange and deformation. Therefore, the non-equilibrium processes are much more important than the equilibrium ones.
The shale matrix and fracture’s permeability experience three stages during gas injection: the initial stage of the fracture permeability increase and the matrix permeability decrease as the gas pressure in the fracture increases, the intermediate stage of the fracture permeability decrease and the matrix permeability increase as the gas diffuses from the fractures into the matrixes, and the later stage of the fracture permeability recovery as the gas desorption expands and the matrix permeability increase due to the slip effects.
Author Contributions
Conceptualization, X.M. and J.L.; Methodology, J.L., S.Z., X.L., and Y.Z.; Software, S.Z.; Validation, S.Z., X.M., and X.H.; Formal Analysis, S.Z., and J.L.; Investigation, S.Z., and X.H.; Resources, X.M., X.L.,and Y.Z. Data Curation, S.Z.; Writing-Original Draft Preparation, S.Z.; Writing-Review & Editing, J.L.; Visualization, S.Z.; Supervision, J.L.
Funding
This work was funded partially by National Key R&D Program of China (No. 2016YFC0801401), the Natural Science Foundation of China (51504235; 51474204) and Investigation and Evaluation of the geological disaster of Karst collapse, Ground subsidence and its Area Planning for Guangzhou. Those sources of support are gratefully acknowledged.
Conflicts of Interest
The authors declare no conflict of interest.
References
- Curtis, J.B. Fractured shale-gas systems. AAPG Bull. 2002, 86, 1921–1938. [Google Scholar]
- Cao, P.; Liu, J.; Leong, Y.K. A fully coupled multiscale shale deformation-gas transport model for the evaluation of shale gas extraction. Fuel 2016, 178, 103–117. [Google Scholar] [CrossRef]
- Amann-Hildenbrand, A.; Ghanizadeh, A.; Krooss, B.M. Transport properties of unconventional gas systems. Mar. Pet. Geol. 2012, 31, 90–99. [Google Scholar] [CrossRef]
- Chalmers, G.R.L.; Ross, D.J.K.; Bustin, R.M. Geological controls on matrix permeability of Devonian Gas Shales in the Horn River and Liard basins, northeastern British Columbia, Canada. Int. J. Coal Geol. 2012, 103, 120–131. [Google Scholar] [CrossRef]
- Bustin, A.M.M.; Bustin, R.M. Importance of rock properties on the producibility of gas shales. Int. J. Coal Geol. 2012, 103, 132–147. [Google Scholar] [CrossRef]
- Swami, V.; Settari, A. A Pore Scale Gas Flow Model for Shale Gas Reservoir. In Proceedings of the SPE Americas Unconventional Resources Conference, Pittsburgh, PA, USA, 5–7 June 2012. [Google Scholar]
- Ghanizadeh, A.; Gasparik, M.; Amann-Hildenbrand, A.; Gensterblum, Y.; Krooss, B.M. Experimental study of fluid transport processes in the matrix system of the European organic-rich shales: I. Scandinavian Alum Shale. Mar. Pet. Geol. 2014, 51, 79–99. [Google Scholar] [CrossRef]
- Moghaddam, R.N.; Aghabozorgi, S.; Foroozesh, J. Numerical Simulation of Gas Production from Tight, Ultratight and Shale Gas Reservoirs: Flow Regimes and Geomechanical Effects. In Proceedings of the EUROPEC 2015, Society of Petroleum Engineers, Madrid, Spain, 1–4 June 2015. [Google Scholar]
- Warren, J.E.; Root, P.J. The Behavior of Naturally Fractured Reservoirs. Soc. Pet. Eng. J. 1963, 3, 245–255. [Google Scholar] [CrossRef]
- Li, N.; Ran, Q.; Li, J.; Yuan, J.; Wang, C.; Wu, Y.S. A multiple-continuum model for simulation of gas production from shale gas reservoirs. In Proceedings of the SPE Reservoir Characterization and Simulation Conference and Exhibition, Abu Dhabi, UAE, 16–18 September 2013. [Google Scholar]
- Yao, J.; Sun, H.; Fan, D.Y.; Wang, C.C.; Sun, Z.X. Numerical simulation of gas transport mechanisms in tight shale gas reservoirs. Pet. Sci. 2013, 10, 528–537. [Google Scholar] [CrossRef]
- Sun, H.; Chawathe, A.; Hoteit, H.; Shi, X.; Li, L. Understanding shale gas production mechanisms through reservoir simulation. In Proceedings of the SPE/EAGE European Unconventional Resources Conference and Exhibition, Vienna, Austria, 25–27 February 2017. [Google Scholar]
- Cao, P.; Liu, J.; Leong, Y.K. Combined impact of flow regimes and effective stress on the evolution of shale apparent permeability. J. Unconv. Oil Gas Resour. 2016, 14, 32–43. [Google Scholar] [CrossRef]
- Moghaddam, R.N.; Jamiolahmady, M. Fluid transport in shale gas reservoirs: Simultaneous effects of stress and slippage on matrix permeability. Int. J. Coal Geol. 2016, 163, 87–99. [Google Scholar] [CrossRef]
- Zhang, H.; Liu, J.; Elsworth, D. How sorption-induced matrix deformation affects gas flow in coal seams: A new FE model. Int. J. Rock Mech. Min. Sci. 2008, 45, 1226–1236. [Google Scholar] [CrossRef]
- Pan, Z.; Connell, L.D. A theoretical model for gas adsorption-induced coal swelling. Int. J. Coal Geol. 2007, 69, 243–252. [Google Scholar] [CrossRef]
- Masoudian, M.S.; El-Zein, A.; Airey, D.W. Modelling stress and strain in coal seams during CO2 injection incorporating the rock–fluid interactions. Comput. Geotech. 2016, 76, 51–60. [Google Scholar] [CrossRef]
- Zhang, S.; Liu, J.; Wei, M.; Elsworth, D. Coal permeability maps under the influence of multiple coupled processes. Int. J. Coal Geol. 2018, 187, 71–82. [Google Scholar] [CrossRef]
- Chen, D.; Pan, Z.; Ye, Z. Dependence of gas shale fracture permeability on effective stress and reservoir pressure: Model match and insights. Fuel 2015, 139, 383–392. [Google Scholar] [CrossRef]
- Masoudian, M.S.; Hashemi, M.A.; Tasalloti, A.; Marshall, A.M. Elastic–Brittle–Plastic Behaviour of Shale Reservoirs and Its Implications on Fracture Permeability Variation: An Analytical Approach. Rock Mech. Rock Eng. 2018, 51, 1565–1582. [Google Scholar] [CrossRef] [Green Version]
- Peng, Y.; Liu, J.; Pan, Z.; Connell, L.D.; Chen, Z.; Qu, H. Impact of coal matrix strains on the evolution of permeability. Fuel 2016, 189, 270–283. [Google Scholar] [CrossRef]
- Liu, J.; Wang, J.; Chen, Z.; Wang, S.; Elsworth, D.; Jiang, Y. Impact of transition from local swelling to macro swelling on the evolution of coal permeability. Int. J. Coal Geol. 2011, 88, 31–40. [Google Scholar] [CrossRef]
- Detournay, E.; Cheng, A.H.-D. Fundamentals of poroelasticity. In Comprehensive Rock Engineering: Principles, Practice and Projects; Fairhurst, C., Ed.; Pergamon Press: Oxford, UK, 1993; Volume 2, Chapter 5; pp. 113–171. [Google Scholar]
- Ranjbar, E.; Hassanzadeh, H. Matrix–fracture transfer shape factor for modeling flow of a compressible fluid in dual-porosity media. Adv. Water Resour. 2011, 34, 627–639. [Google Scholar] [CrossRef]
- Hudson, J.A.; Fairhurst, C. Comprehensive Rock Engineering: Principles, Practice, and Projects, Vol. II. Analysis and Design Method; Pergamon Press: Oxford, UK, 1993; pp. 113–121. [Google Scholar]
- Liu, J.; Chen, Z.; Elsworth, D.; Qu, H.; Chen, D. Interactions of multiple processes during CBM extraction: A critical review. Int. J. Coal Geol. 2011, 87, 175–189. [Google Scholar] [CrossRef]
- Beskok, A.; Karniadakis, G.E. Report: A model for flows in channels, pipes, and ducts at micro and nano scales. Microscale Thermophys. Eng. 1999, 3, 43–77. [Google Scholar]
- Civan, F.; Rai, C.S.; Sondergeld, C.H. Shale-Gas Permeability and Diffusivity Inferred by Improved Formulation of Relevant Retention and Transport Mechanisms. Transp. Porous Media 2011, 86, 925–944. [Google Scholar] [CrossRef]
- Wei, M.; Liu, J.; Feng, X.; Wang, C.; Zhou, F. Evolution of shale apparent permeability from stress-controlled to displacement-controlled conditions. J. Nat. Gas Sci. Eng. 2016, 34, 1453–1460. [Google Scholar] [CrossRef]
- Sakurovs, R.; Day, S.; Weir, S. Causes and consequences of errors in determining sorption capacity of coals for carbon dioxide at high pressure. Int. J. Coal Geol. 2009, 77, 16–22. [Google Scholar] [CrossRef]
- Wei, M.; Liu, J.; Elsworth, D.; Li, S.; Zhou, F. Influence of gas adsorption induced non-uniform deformation on the evolution of coal permeability. Int. J. Rock Mech. Min. Sci. 2019, 114, 71–78. [Google Scholar] [CrossRef]
- Letham, E.A. Matrix Permeability Measurements of Gas Shales: Gas Slippage and Adsorption as Sources of Systematic Error. Bachelor’s Thesis, The University of British Columbia, Kelowna, Canada, March 2011. [Google Scholar]
- Wang, S.; Elsworth, D.; Liu, J. Permeability evolution in fractured coal: The roles of fracture geometry and water-content. Int. J. Coal Geol. 2011, 87, 13–25. [Google Scholar] [CrossRef]
- Wang, J.G.; Liu, J.; Kabir, A. Combined effects of directional compaction, non-Darcy flow and anisotropic swelling on coal seam gas extraction. Int. J. Coal Geol. 2013, 109, 1–14. [Google Scholar] [CrossRef]
Figure 1.
The schematic diagram of the conceptual overlapping approach.

Figure 2.
The simulation model for the gas transfer within the shale matrix and fracture systems under constant confining stress.
Figure 2.
The simulation model for the gas transfer within the shale matrix and fracture systems under constant confining stress.

Figure 3.
The pore pressure evolution in the fracture and matrix under the constant confining pressure condition.
Figure 3.
The pore pressure evolution in the fracture and matrix under the constant confining pressure condition.

Figure 4.
The permeability profile of shale sample with CH4 gas under the constant confining pressure condition.
Figure 4.
The permeability profile of shale sample with CH4 gas under the constant confining pressure condition.

Figure 5.
The impact of local strain on the evolution of permeability ratio. Scenario 1 represents the case without the local strain effects. Scenario 2 represents the case with the impact of local strain induced by the differential pressure only. Scenario 3 represents the case with the impacts of local strain induced by the sorption strain. Scenario 4 represents the case with the impact of local strain induced by the differential pressure and sorption strain.

Figure 6.
The shale permeability evolution with different mechanical properties (Km/Kf).

Figure 7.
The evolutions of the shale permeability ratio (k0 = 10−19 m2). (a) Shale permeability ratio evolution with time; (b) Shale permeability ratio evolution with pore pressure and time.
Figure 7.
The evolutions of the shale permeability ratio (k0 = 10−19 m2). (a) Shale permeability ratio evolution with time; (b) Shale permeability ratio evolution with pore pressure and time.

Figure 8.
The evolutions of the matrix permeability, fracture permeability and resultant permeability.
Figure 8.
The evolutions of the matrix permeability, fracture permeability and resultant permeability.

Figure 9.
The permeability evolutions vary with different injection pressures with Helium gas under a constant confining stress condition and the comparison between the simulation results and experimental data. (a) Permeability evolutions vary with injection pressures; (b) Comparison of the shale permeability between the simulation results and experimental data.

Figure 10.
The permeability evolutions vary with different injection pressures with CH4 gas under a constant confining stress condition and comparison between the simulation results and experimental data. (a) Permeability evolutions vary with injection pressures. (b) Comparison of shale permeability between the simulation results and experimental data.

Figure 11.
The permeability evolutions vary with different injection pressures with CO2 gas under a constant confining stress condition and comparison between the simulation results and experimental data. (a) Permeability evolutions vary with injection pressures. (b) Comparison of shale permeability between the simulation results and experimental data.


Table 1.
The property parameters of the simulation sample.
| Parameter | Value | Physical Meaning | Units |
|---|---|---|---|
| Em | 10 | Young’s modulus of the matrix | GPa |
| Ef | 2 | Young’s modulus of the fracture | GPa |
| vm | 0.35 | Poisson’s ratio of the matrix | - |
| vf | 0.2 | Poisson’s ratio of the fracture | - |
| α | 0.8 | Biot coefficient of the fracture | - |
| β | 0.4 | Biot coefficient of the matrix | - |
| μ | 1.11×10⁻⁵ | Viscosity of Methane | Pa·s |
| φm0 | 0.08 | Initial matrix porosity | - |
| φf0 | 0.04 | Initial fracture porosity | - |
| km0 | 0.5×10⁻²⁰ | Initial matrix permeability | m² |
| kf0 | 1×10⁻¹⁹ | Initial fracture permeability | m² |
| PL | 6.109 | Langmuir pressure constant | MPa |
| εL | 0.02 | Langmuir volumetric strain constant | - |
| m | 1250 | Matrix density | kg/m³ |
| f | 1000 | Fracture density | kg/m³ |
| Pa | 0.1 | Atmosphere pressure | MPa |
| g | 0.178 | Density of gas at standard condition | kg/m³ |
| M | 0.016 | Molar mass of methane | kg/mol |
| R | 8.314 | Gas constant | J/(mol·K) |
| T | 298.15 | Temperature of the reservoir | K |
Table 2.
The parameters of the apparent permeability model of the shale matrix.
| Symbol | Value | Physical Meanings | Units |
|---|---|---|---|
| KB | 1.38 × 10⁻²³ | Boltzmann constant | J/K |
| T | 298.15 | Temperature | K |
| τh | 1 | Tortuosity of the matrix | - |
| A | 0.178 | First constant for ζ | - |
| B | 0.4348 | Second constant for ζ | - |
| ζ0 | 0.25 | Asymptotic upper limit of ζ | - |
Table 3.
The mechanical parameters of the shale samples.
| Sample | Mechanical Properties | |||
|---|---|---|---|---|
| Em (GPa) | Ef (GPa) | |||
| Green River Shale | 8 | 6 | 0.25 | 0.25 |
Table 4.
The Langmuir constants of shale and dynamic viscosity of gases at 300 K.
| Gas | PL (MPa) | (kg/m3) | ||
|---|---|---|---|---|
| He | - | - | 18.9 | 1.293 |
| CO2 | 0.0353 | 3.82 | 14.932 | 1.784 |
| CH4 | 0.0093 | 6.1 | 11.067 | 0.648 |
© 2019 by the authors. Licensee MDPI, Basel, Switzerland. This article is an open access article distributed under the terms and conditions of the Creative Commons Attribution (CC BY) license (http://creativecommons.org/licenses/by/4.0/).
Share and Cite
MDPI and ACS Style
Ma, X.; Li, X.; Zhang, S.; Zhang, Y.; Hao, X.; Liu, J. Impact of Local Effects on the Evolution of Unconventional Rock Permeability. Energies 2019, 12, 478. https://0-doi-org.brum.beds.ac.uk/10.3390/en12030478
AMA Style
Ma X, Li X, Zhang S, Zhang Y, Hao X, Liu J. Impact of Local Effects on the Evolution of Unconventional Rock Permeability. Energies. 2019; 12(3):478. https://0-doi-org.brum.beds.ac.uk/10.3390/en12030478
Chicago/Turabian StyleMa, Xinxing, Xianwen Li, Shouwen Zhang, Yanming Zhang, Xiangie Hao, and Jishan Liu. 2019. "Impact of Local Effects on the Evolution of Unconventional Rock Permeability" Energies 12, no. 3: 478. https://0-doi-org.brum.beds.ac.uk/10.3390/en12030478
Note that from the first issue of 2016, this journal uses article numbers instead of page numbers. See further details here.