Article

Fractal Characterization of Nanopore Structure in Shale, Tight Sandstone and Mudstone from the Ordos Basin of China Using Nitrogen Adsorption

1
Central Laboratory of Geological Sciences, RIPED, PetroChina, Beijing 100083, China
2
Research Institute of Enhanced Oil Recovery, China University of Petroleum, Beijing 102249, China
*
Author to whom correspondence should be addressed.
Submission received: 31 December 2018 / Revised: 26 January 2019 / Accepted: 1 February 2019 / Published: 13 February 2019
(This article belongs to the Special Issue Flow and Transport Properties of Unconventional Reservoirs 2018)

Abstract

:
The characteristics of the nanopore structure in shale, tight sandstone and mudstone from the Ordos Basin of China were investigated by X-ray diffraction (XRD) analysis, porosity and permeability tests and low-pressure nitrogen adsorption experiments. Fractal dimensions D1 and D2 were determined from the low relative pressure range (0 < P/P0 < 0.4) and the high relative pressure range (0.4 < P/P0 < 1) of nitrogen adsorption data, respectively, using the Frenkel–Halsey–Hill (FHH) model. Relationships between pore structure parameters, mineral compositions and fractal dimensions were investigated. According to the International Union of Pure and Applied Chemistry (IUPAC) isotherm classification standard, the morphologies of the nitrogen adsorption curves of these 14 samples belong to the H2 and H3 types. Relationships among average pore diameter, Brunner-Emmet-Teller (BET) specific surface area, pore volume, porosity and permeability have been discussed. The heterogeneities of shale nanopore structures were verified, and nanopore size mainly concentrates under 30 nm. The average fractal dimension D1 of all the samples is 2.1187, varying from 1.1755 to 2.6122, and the average fractal dimension D2 is 2.4645, with the range from 2.2144 to 2.7362. Compared with D1, D2 has stronger relationships with pore structure parameters, and can be used for analyzing pore structure characteristics.

1. Introduction

In recent years, global energy shortages have led to more attention being paid to unconventional oil and gas sources, such as tight oil and shale gas [1,2]. The pore-size of unconventional reservoir formations such as shale and tight sandstone generally spans from micropore to mesopore and macropore. In shale a very complicated pore structure is the result of a wide pore-size distribution and abundant organic matter [3]. Therefore, it is a huge challenge to explore unconventional resources effectively. The study of nanopore structure characteristics of unconventional reservoirs is important for their effective development, as nanopores can contain huge amounts of oil and gas.
There exist various techniques to investigate the characteristics of shale and tight sandstone and their respective nanopore structures, e.g., via mercury intrusion [4,5], field emission scanning electron microscopy, transmission electron microscopy (TEM), and gas adsorption analysis [6]. For example, Ghanbarian et al. analyzed 18 tight-gas sandstones from Texas by mercury intrusion experiments, and the EMA model was used to estimate bulk electrical conductivity and permeability [7]. Low-pressure gas adsorption measurements are very important for characterization of the gas shale pore system. Based on scanning electron microscopy and nitrogen adsorption experiments, Chen et al. found that most of the pores in shale are composed of organic pores and the pores in clay mineral layers [8]. Millán et al. proposed a truncated version of the fractal Frenkel-Halsey-Hill (FHH) model for describing H2O-vapor adsorption and 48 H2O-vapor adsorption isotherm data was used to verify the model [9]. Yang et al. conducted low-pressure nitrogen adsorption studies on eight core samples from upper Ordovician lower Silurian oil reservoirs in the south of Sichuan Basin to better understand the reservoir characteristics of organic-rich shale [10]. In addition, fractal theory has been used to evaluate the pore structure in porous media. Wang et al. compared six different fractal models for calculating the fractal dimensions from mercury intrusion capillary pressures, and an optimal fractal model for analyzing petrophysical properties was recommended [11]. Based on nitrogen adsorption experiments, Ming et al. found that the fractal dimensions of shale have a good positive correlation with total pore volume, micropore volume and mesopore volume, but a poor correlation with macropore volume [12]. Xiong et al. used the FHH model to calculate surface fractal dimensions and volume fractal dimensions from nitrogen adsorption data [13]. Shao et al. analyzed the pore throat structure and fractal characteristics of Longmaxi shale with a series of experiments, and found that shale pore structure is mainly determined by total organic carbon content and thermal maturity, which also affects the value of the fractal dimensions [14]. Li et al. used the FHH model to obtain the fractal dimensions of shale, and the relationships between the calculated fractal dimensions and shale composition and total organic matter content were studied [15]. In this paper, fractal theory was used to study the nanopore structure characteristics of shale, tight sandstone and mudstone from the Yanchang Formation in the Ordos Basin of China based on the nitrogen adsorption experiments. The relationships between the calculated fractal dimensions and pore structure parameters, such as pore diameter and pore volume, were investigated.

2. Core samples and Experiment Results

2.1. Core samples

A total of 14 core samples, including 10 shale core samples, three tight sandstone core samples and one mudstone core sample collected from the Ordos Basin of China were selected in this study.
All samples are taken from fresh cores of different underground depths. The parameters of the collected samples are summarized in Table 1.

2.2. X-ray diffraction (XRD) measurements

XRD is an effective technique to analyze mineral composition and content. Its theoretical basis is that X-rays will diffract in different directions and the mineral composition and structure can be determined by measuring the intensities and angles of these diffracted X-ray beams. As shown in Table 2, the contents of each component in shale and tight sandstone are significantly different. Although the four samples are both rich in clay minerals and quartz, the clay content in shale is greater than in tight sandstone. The clay content for shale samples ranged from 24.8% to 35.0%, while for tight sandstone the clay content varied from 13.3% to 19.8%. The shale quartz content is between 23.3% and 37.2%, and less than that in sandstone, which varies between 60.9% and 61.3%. The content of potash feldspar in shale and sandstone is not that much, with contents between 0.5%–2.0% and 0.3%–1.4%, respectively. Plagioclase feldspar contained in shale is not as abundant as in sandstone, which is about 6% more than shale. The shale also contains a large proportion of pyrite, and sample 32 even contains 42.5% pyrite, while no pyrite can be found in sandstone. In general, the total amount of clay minerals and non-clay minerals in shale and sandstone samples are significantly different.
The relative contents of clay minerals of the four samples are given in Table 3. The samples do not contain S and C/S, but I and I/S are the most abundant. The content of I is 41%–80% in shale and 40%–46% in tight sandstone. In addition to sample 32 without I/S, the I/S of the other three samples is about 40%. This sample also contains certain kaolinite and chlorite. The content of kaolinite in shale is higher than that in tight sandstone, but the content of chlorite in shale is less than that in tight sandstone. The mixed-layer ratio of I/S in the sandstone is about 10%, but C/S mixed-layer is not found in tight sandstone and shale samples.

2.3. Low-Pressure Nitrogen Adsorption-Desorption Experiments

Low-pressure nitrogen adsorption-desorption experiments were conducted using an automatic specific surface area & pore size analyzer produced by Quantachrome Instruments (Boynton Beach, FL, USA). The shapes of the nitrogen adsorption-desorption isotherms can be used to analyze pore shapes. Also, nitrogen adsorption-desorption data can be used to calculate the pore structure parameters. For example, total pore volume can be calculated as the liquid molar volume of adsorbed nitrogen at the relative pressure of 0.99. Total pore volume and pore size distribution can be calculated based on the Barrett-Joyner-Halenda (BJH) model [16]. The principle of nitrogen adsorption is that the gas adsorbed on a certain surface is taken as a function of the relative pressure of the adsorbent. Under the constant temperature, the relationship between gas adsorption and gas balance relative pressure is the adsorption isotherm.
Isothermal adsorption and desorption curves were obtained by nitrogen adsorption experiment with relative pressure P/P0 as abscissa and adsorption amount as ordinate. The nitrogen adsorption curves of 10 shale samples and one mudstone sample are shown in Figure 1, while the nitrogen adsorption curves of three sandstone samples are given in Figure 2.
Nitrogen adsorption-desorption curves can be used to characterize the characteristics of pore complexity and shape. Figure 1 and Figure 2 show that the adsorption-desorption curves of each sample are slightly different in morphology, but the whole curve is inverted S-type. The adsorption process can be divided into three stages: The first stage (0 < P/P0 ≤ 0.4) is the nitrogen adsorption of low pressure stage, where the gas adsorption quantity increases slowly, and the adsorption isotherm is a gentle upward convex shape. The first stage is the single-layer adsorption of nitrogen on the pore surface, and the nitrogen adsorption curve appeared inflection point for monolayer adsorption to the transition of multilayer adsorption [17]. In the second stage (0.4 < P/P0 ≤ 0.9), the adsorption volume of the sample increases rapidly with the increase of relative pressure, and nitrogen adsorption isotherm rises rapidly, which leads to a hysteresis loop, and this stage is a multi-molecular layer stage. In the third stage (P/P0 > 0.9), with the increase of relative pressure, the amount of gas adsorption increases dramatically.
When the relative pressure was close to the saturated vapor pressure, there is no adsorption saturation phenomenon, and this is the capillary condensation stage of the sample. Due to the complex pore structure of the experimental samples, capillary condensation phenomena happen in the substrate surface, and the isothermal desorption curves of the samples show more obvious desorption hysteresis. The desorption amount is far less than the adsorption amount, and then hysteresis loop appeared. There are significant differences in the development morphology and connectivity of small pores and the adsorption of nitrogen is not fully enclosed [18].
According to IUPAC isotherm classification standard, the morphology of the nitrogen adsorption curves of the 10 shale samples and a mudstone one (sample 14) belong to the H2 and H3 type, indicating that the pore morphologies of shale are mainly similar to ink bottle holes and sheet granular matrix. As shown in Figure 2, the nitrogen adsorption curves of the sandstone samples are similar to H3 type, which indicates that the sandstone pores are mainly composed of sheet particles with non-rigid aggregate groove holes. As the pore openness is associated with increased rate of adsorption line, the larger the increasing rate is, the larger the opening of sandstone pore will be.

3. Pore Size Distribution from Nitrogen Adsorption-Desorption Isotherms

3.1. Methods

3.1.1. Specific Surface Area

The BET equation derived by Brunauer, Emmett and Teller was used to calculate the specific surface area with the range of relative pressure of 0.05–0.35 [19]. The surface area of porous media can be calculated by the amount of gas monolayer adsorption according to the Langmuir monolayer adsorption theory:
S B E T = V m N A A m / 22400 W
where NA is Avogadro constant; Am is the cross section area of adsorbed gas nitrogen molecule; W is the quality of the medium; Vm is the nitrogen saturation adsorption amount in a single layer and can be calculated by the BET equation:
1 V ( p 0 / p 1 ) = 1 V m C + C 1 V m C p p 0
where V is total volume of adsorbed gases and C is a constant relating to adsorption.

3.1.2. Pore Size

The recurrence method is usually used to calculate the pore radius of different pore size intervals based on the Kelvin principle based on the assumption of cylindrical pore [20]. Assume the thickness of film adsorbed on the pore surface is t, and the internal radius of the pore with the radius rp is reduced to rp − t, and can be calculated by [21]:
ln ( p / p 0 ) = 2 γ V m R T ( r p t )
where γ is the surface tension at the boiling point of nitrogen; Vm is the molar volume of liquid nitrogen; R is the gas constant; T is the boiling points (77K); p/p0 is the relative pressure of nitrogen. The thickness of the liquid film adsorbed on the pore surface can be calculated by [22]:
t = [ 13.99 0.034 log ( p / p 0 ) ] 1 / 2

3.1.3. Pore Size Distribution

There are three different widely used methods for pore size distribution calculation based on gas adsorption isotherm, including the BJH method, HK method and DFT method [23,24]. The three method are introduced, respectively, and this paper uses the BJH model to calculate the pore size distribution.
Barrett et al. analyzed the desorption process and proposed the BJH method to calculation pore size distribution [16]. According to the desorption line of isothermal adsorption curve, the pore size distribution is obtained by calculating the nitrogen adsorption amount when the relative pressure is 0.99. The calculation formula is as follows:
V p n = ( r p n r k n + Δ t n ) 2 ( Δ V n Δ t n j 1 n 1 A c j )
where Vpn is the pore volume; rpn is the maximum pore radius; rkn is the capillary radius; Vn is capillary volume; tn is the adsorbed nitrogen layer thickness; Acj is the area after the emptying.
Horváth et al. proposed the HK method to calculation pore size distribution [25]:
w / w = f ( l d a )
where w is the mass of nitrogen adsorbed on the pore surface; w is the maximum amount of nitrogen adsorbed into the pores at P/P0 = 0.9; l is the distance between the nuclei of the two layers; da is the diameter of adsorbent. According to the adsorption capacity of different pore sizes, the pore size distribution f can be obtained by plotting the curve of w/w versus (lda).
Seaton et al. [26] calculated the pore size distribution by the adsorption isotherm using the DFT method firstly. Pore size distribution can be obtained by solving the following equation:
N exp ( P / P 0 ) = D min D max N D F T ( P / P 0 , D ) f ( D ) d D
where Nexp(P/P0) is the experimental isotherm; NDFT(P/P0,D) is the theoretical isotherm; D is the pore size; f(D) is the pore size distribution.

3.2. Analysis of Experimental Results

The calculated specific surface area, pore volume and pore size of shale, tight sandstone and mudstone are introduced respectively. Table 4 shows the calculation results for shale samples. It can be observed that BET specific surface area of the 10 shale samples is distributed between 0.05175 m2/g and 0.8988 m2/g, with an average of 0.2345 m2/g. The pore volume of BJH is distributed between 4.359 × 10⁻⁴ cc/g and 27.18 × 10⁻⁴ cc/g, with an average of 12.7 × 10⁻⁴ cc/g. The weighted average pore diameter is between 12.72 nm and 63.8 nm, with an average of 30.9 nm. Shale has the characteristics of small pore size and large BET specific surface area, which is similar to the results presented in Literature [19].
The pore structure parameters of the three tight sandstone samples obtained from the nitrogen adsorption-desorption isotherms are listed in Table 5.
It is shown that the BET specific surface area of the three sandstone samples is distributed between 0.1864 m2/g and 0.4091 m2/g, with an average of 0.2231 m2/g. The pore volume of BJH is distributed between 0.002484 cc/g and 0.004114 cc/g, with an average of 0.003241 cc/g. The average pore diameter ranges from 39.79 nm to 53.20 nm, and the average pore diameter is 48.70 nm. Compared with shale, BET specific surface area of the sandstone sample is smaller than that of the shale, and the pore volume and the average pore diameter are larger than those of the shale.
The experimental data of the silty mudstone sample is shown in Table 6. The BET specific surface area of the mudstone sample is 6.33 m2/g, the BJH pore volume is 93.46 × 10⁻⁴ cc/g, and the average pore diameter is 7.272 nm. Compared with the shale and sandstone samples, the BET specific surface area of the mudstone sample is much larger, and the pore volume and average pore diameter are much smaller.
The pore size distributions of the 10 shales, one mudstone and three sandstones obtained from the BJH method are shown in Figure 3, Figure 4 and Figure 5, respectively. The abscissa value of the peak was marked in the figures. As Figure 3 shows, the pore size distribution of shale has a certain heterogeneity, and mainly concentrated under 30 nm, with at least one obvious peak value distributed in the range of about 3–10 nm. Figure 4 shows that the pore size distribution of mudstone sample has only one peak value which is not obvious, and the pore distribution is relatively uniform, and the pore diameter are mainly below 30 nm. As shown in Figure 5, the pore distribution of the three sandstone samples mostly had two peaks from 3 nm to 10 nm, which was similar to shale. The peak value of No. 24 is around 50 nm. Compared with shale and mudstone, the heterogeneities of tight sandstone pore are relatively large, which also indicated that large and medium pores were the main contributors to gas storage space.

3.3. Pore parameter Relationships

The relationship between average pore diameter and pore volume of the 10 shale samples is shown in Figure 6. It shows that there was no significant correlation between average pore diameter and pore volume of shale. As shown in Figure 7, the BET specific surface area of shale sample is negatively correlated with the average pore diameter, indicating that with the increase of average pore size, shale pore heterogeneity as well as the roughness decreases, and the specific surface area decreases. The relationship between shale pore volume and BET specific surface area is shown in Figure 8. The specific surface area increases with increasing total pore volume, and the correlation coefficient is nearly 0.7.
Porosity and permeability of four core samples including three tight sandstone samples and one mudstone sample were measured, as shown in Table 7. The porosity and permeability of the mudstone sample are ultra-low. The permeability of mudstone is one order of magnitude smaller that of tight sandstone, and the porosity of mudstone is only slightly greater than 1%. Figure 9 shows BET specific surface area decreases with the increase of permeability. The reason is that the larger the permeability is, the larger the corresponding average pore size will be, and it can be verified with Figure 10, which shows that the average pore size is positively correlated to the gas permeability.

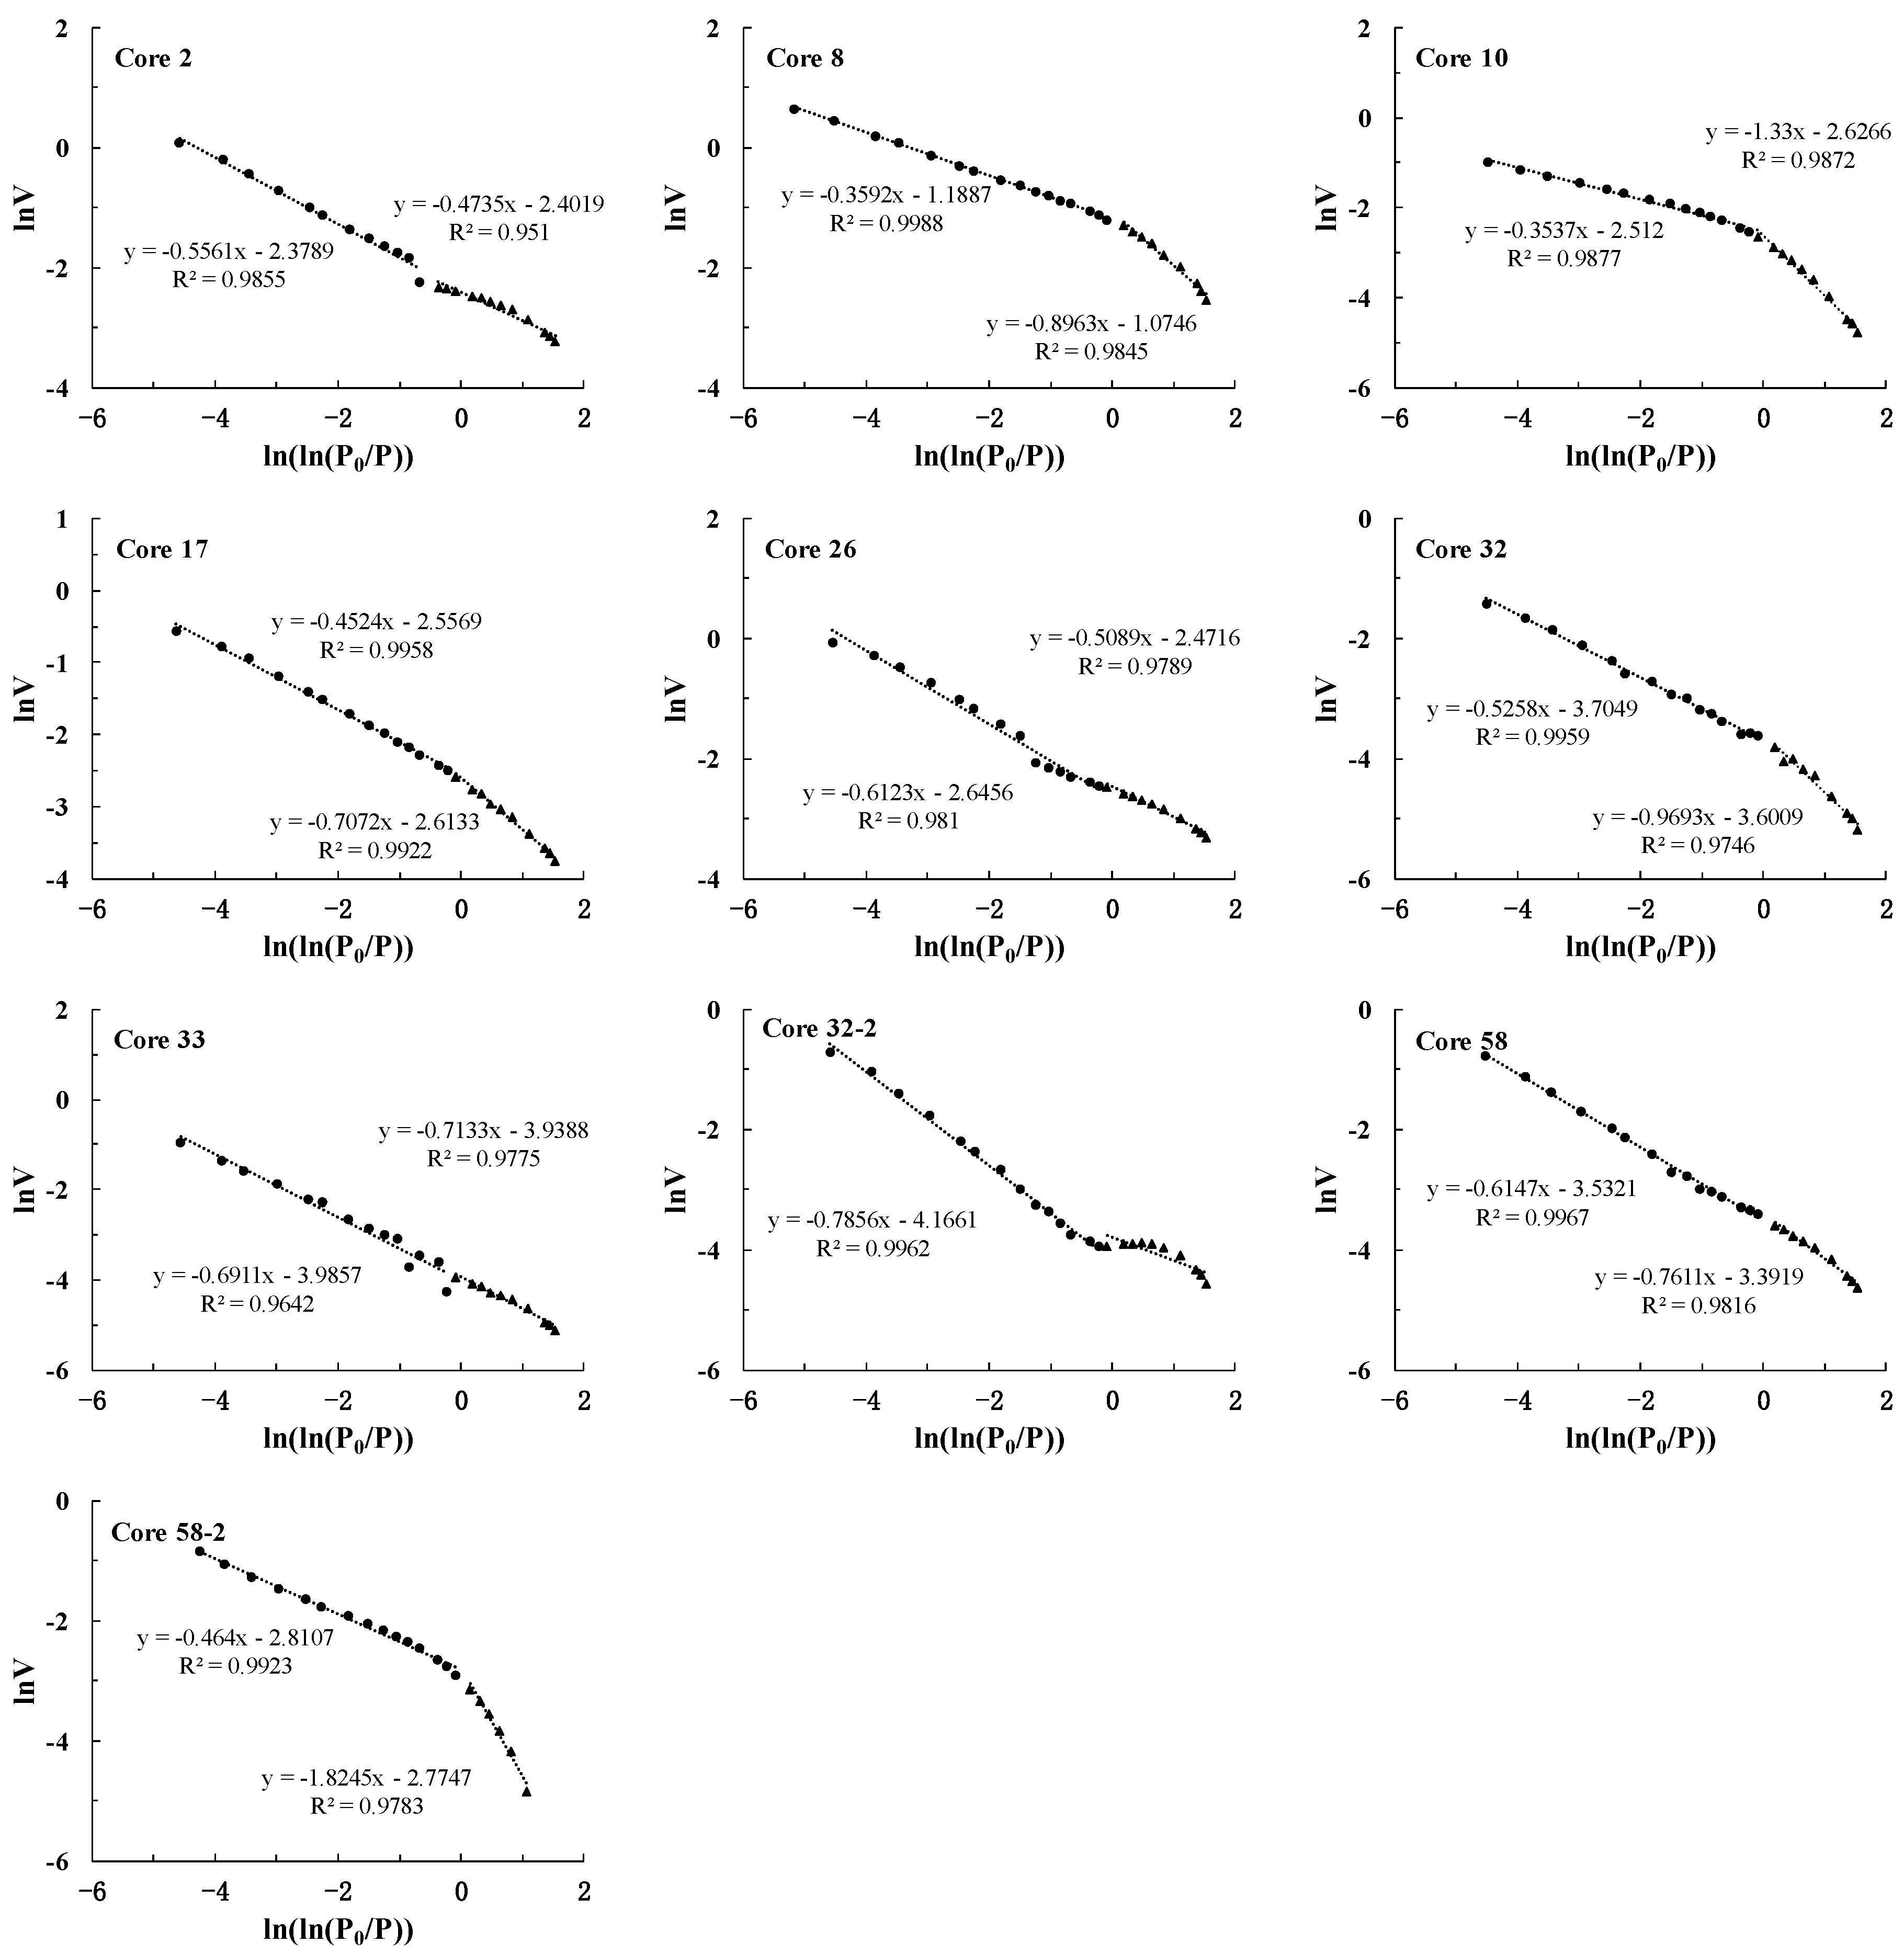
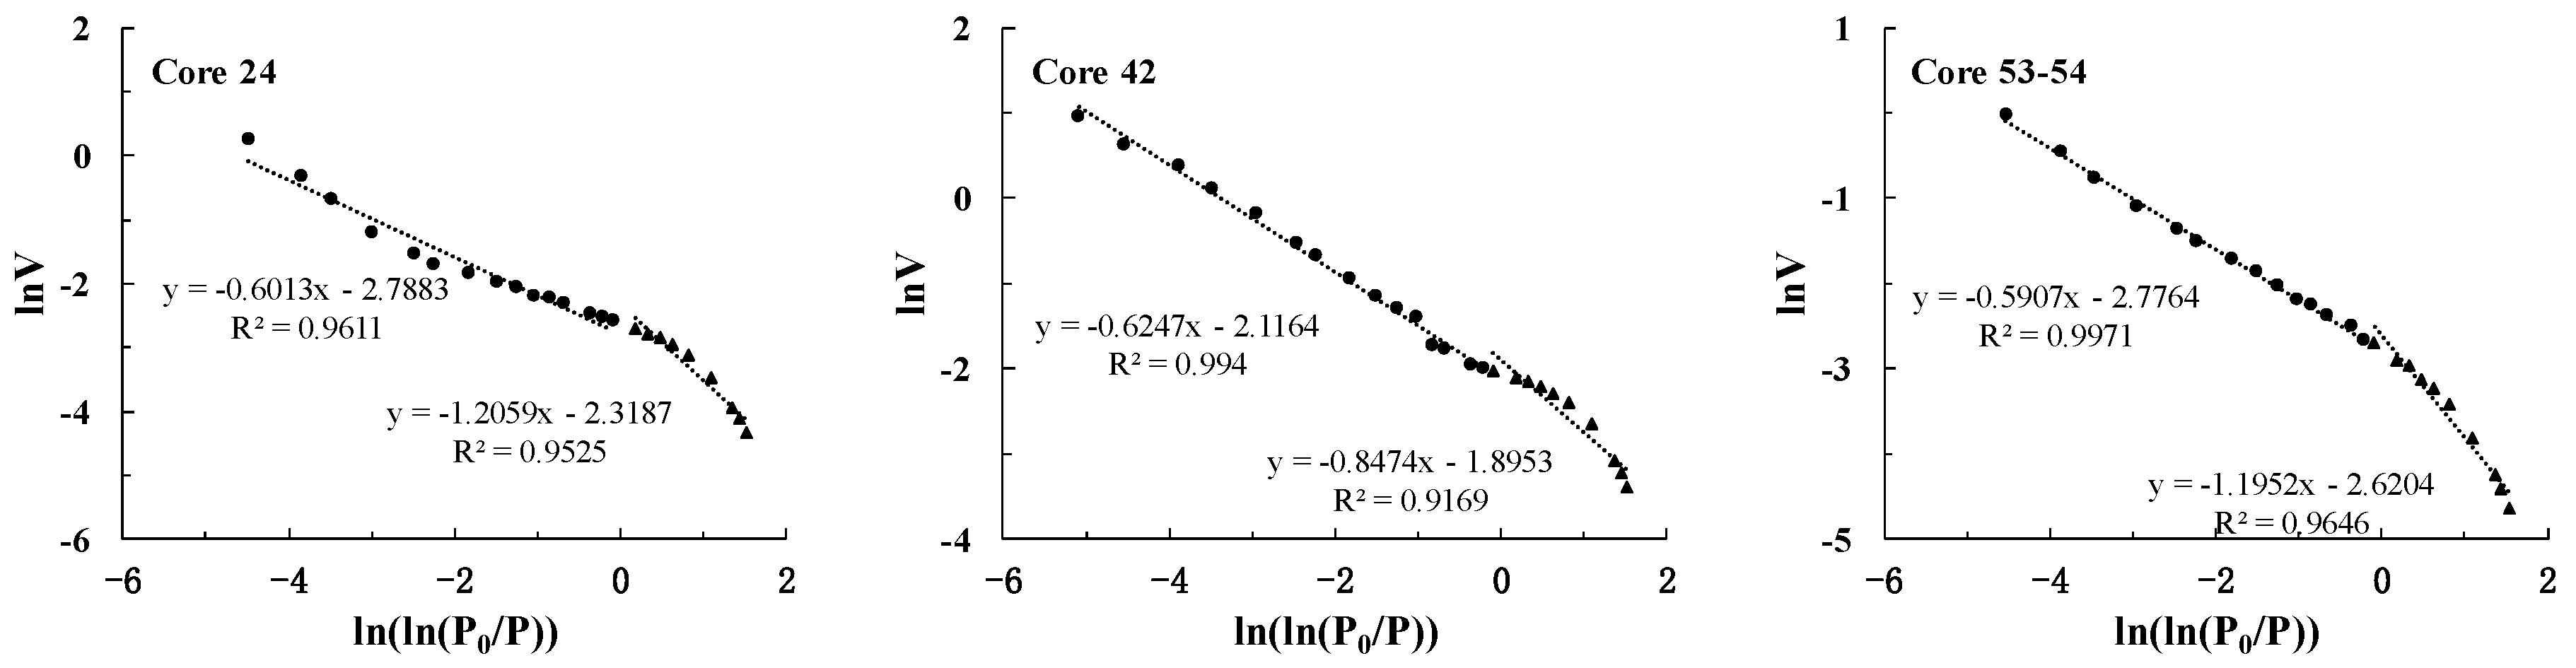
4. Fractal Analysis of Nitrogen Adsorption Isotherms

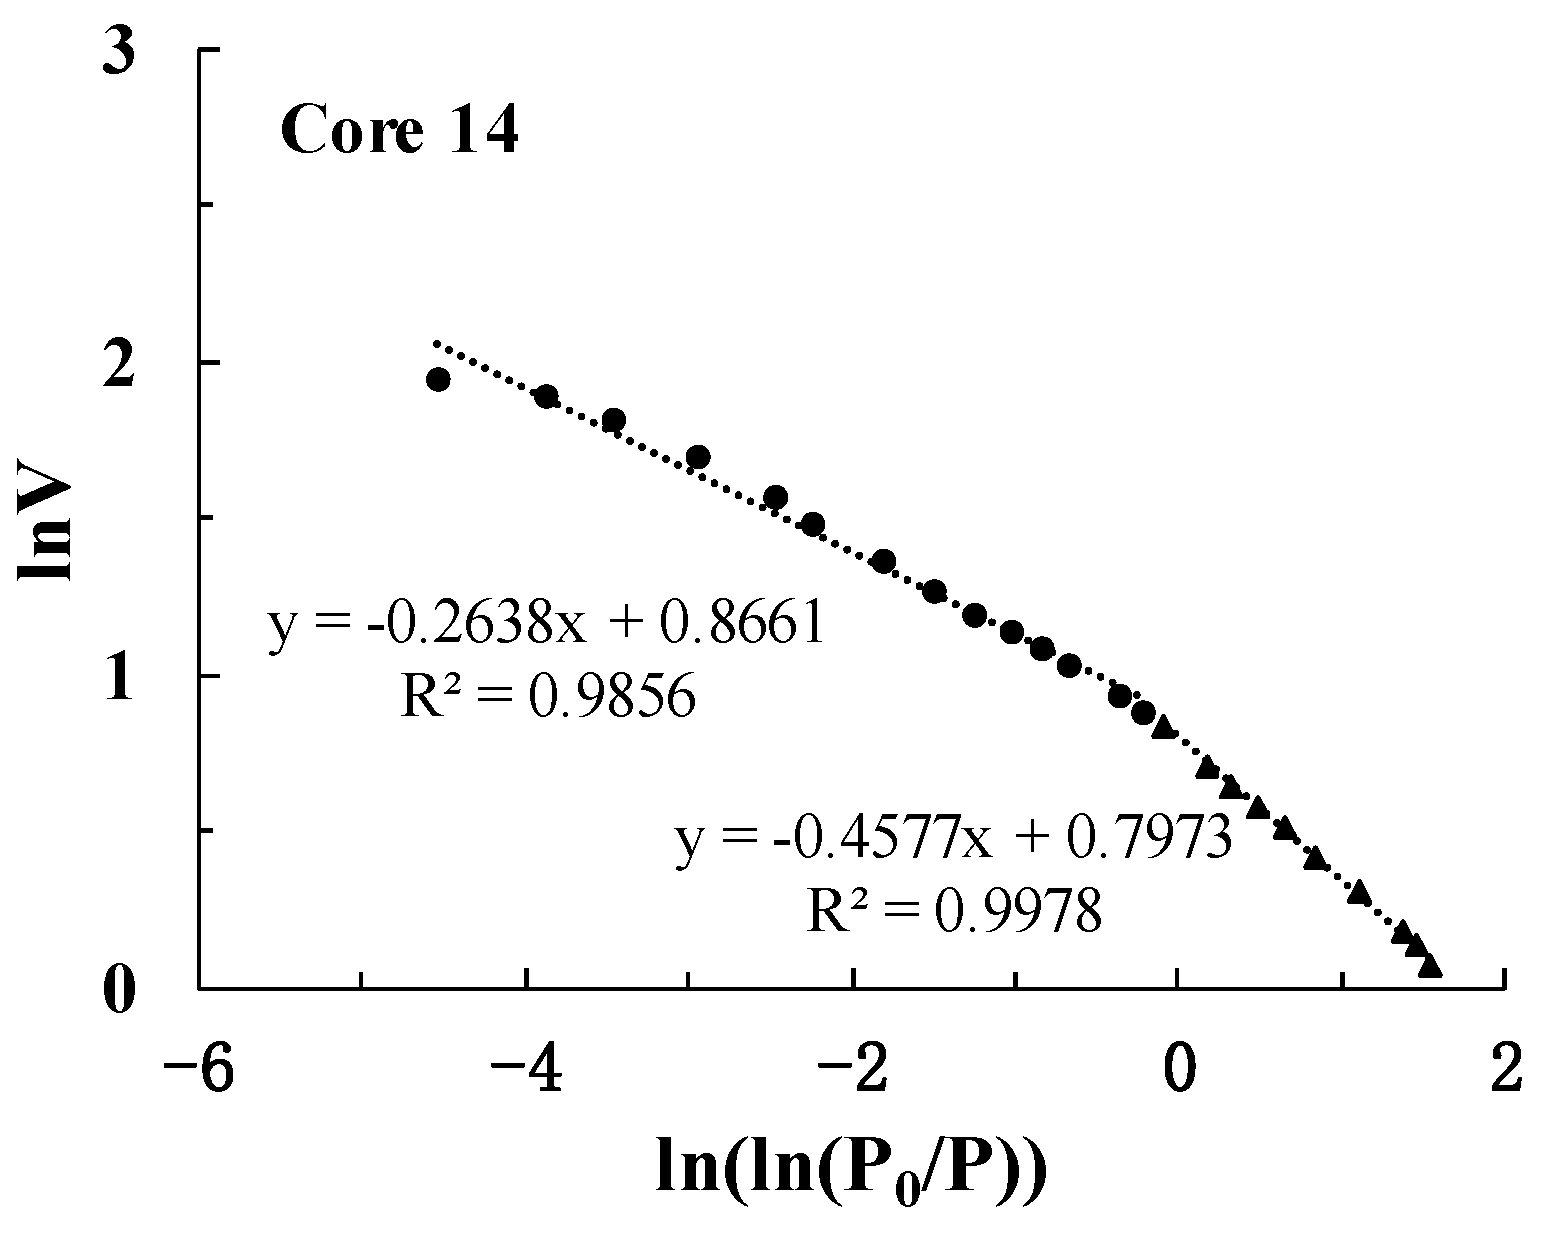
4.1. Principle and Fractal Dimension Calculation Process

Fractal theory has been widely used to characterize the pore structures of unconventional reservoirs [27,28,29,30]. Fractal dimensions can quantitatively evaluate the heterogeneity of pore structure, and generally, pore heterogeneity increases with the increasing fractal dimension [31]. There are many models for calculating fractal dimension from nitrogen adsorption isotherms, including BET model, FHH model, fractal Langmuir model and thermodynamic method, and the FHH model is the one widely applied [32]. According to the FHH model, the fractal dimension D can be calculated from nitrogen adsorption experiments with the following equation:
L n V = K L n [ L n ( P 0 / P ) ] + C
where P is the equilibrium pressure; V is the volume of adsorbed gas corresponding to equilibrium pressure P; P0 is the saturation pressure, K is the slope of the logarithmic curve, which is related to the adsorption mechanism and K = D − 3; C is a constant. If the pores has fractal characteristics, lnV and ln(ln(P0/P)) will have a linear relationship [18].
The fractal dimension processes of the 10 shale samples are shown in Figure 11. The adsorption and desorption curves of the experimental samples produce hysteresis loops when relative pressure is about 0.4, indicating that there is a large difference in porosity before and after this relative pressure due to different adsorption behaviors. There are two fractal characteristics in the study area. In this paper, the fractal dimension calculated from the low relative pressure range of 0 < P/P0 < 0.4 is denoted as D1, and the fractal dimension calculated from the high relative pressure range of 0.4 < P/P0 < 1 is denoted as D2. The fractal dimension D1 characterizes the effect of van der Waals force and reflects the surface roughness. The fractal dimension D2 represents properties of multi-layer adsorption, which can be used to describe the spatial roughness and irregularity of pore structures [33,34]. Ghanbarian and Daigle found that the cut-off values of the upper and lower boundaries of fractal regions have a significant impact on the results of fractal dimension calculation [35]. Meanwhile, when the curve is segmented, the boundaries of relative pressure is not constant at 0.4. In order to ensure the accuracy of fractal dimension calculation, this paper divides the curve according to the change of slope. The segmentation points of the curve are shown in Table 8.
In Figure 11, the curves for calculating fractal dimension D1 and D2 are displayed. For the core 2, core 26 and core 33, the slopes of the two curves before and after the segmentation points are close to each other can be fitted by a straight line. The reason is that the pore radii of these cores are small and their distributions are concentrated, which leads to that their surface fractal dimensions are close to the volume fractal dimension. For the core 32–2, the curve of D2 calculation is not linear and the linear correlation is very poor. Therefore, the fractal dimension D2 of core 32–2 was not calculated. The values of D1 and D2 are shown in Table 9. D1 is distributed between 1.67 and 2.5265 with an average value of 2.1975, D2 is distributed between 2.3076–2.6463 with an average value of 2.4791.
The curves of fractal dimension calculation for the three tight sandstone samples and one mudstone sample are shown in Figure 12 and Figure 13, respectively, and the calculated fractal dimensions D1 and D2 are shown in Table 10 and Table 11, respectively.
For the tight sandstone samples, the calculated D1 changes from 1.7941 to 2.1526 with an average value of 1.9172, and D2 varies from 2.3753 to 2.4093 with an average value of 2.3944. The correlation coefficient R2 is close to 1, indicating that the pores in tight sandstone has good fractal characteristics. For the mudstone sample, the calculated D1 is 2.5423 and the calculated D2 is 2.7362. It can be found that the values of D1 and D2 of mudstone are largest, followed by shale, and the values of D1 and D2 of tight sandstone are smallest.
As shown in Table 9, Table 10 and Table 11, it can be found that the surface fractal dimension D1 is generally less than the volume fractal dimension D2. The relationship between the fractal dimension D1 and D2 for shale samples is shown in Figure 14. The fractal dimension D2 decreases with the fractal dimension D1 increasing. The surface fractal dimensions D1 of the cores 10, 24, 53-54, 58-2 are less than 2 which are not in the typical range: 2 < D < 3 for three-dimensional space. Ghanbarian-Alavijeh et al. believed that the fractal dimension can be -∞ when the pore size is the same, and demonstrated that theoretically fractal dimension can range between −∞ and 3 [36]. Therefore, the fractal dimension D1 less than 2 is acceptable.

4.2. Relationship between Fractal Dimensions and Pore Structure Parameters

A summary of fractal dimensions and pore parameters of shale, sandstone and mudstone samples as shown in Table 12. The relationships between the calculated fractal dimensions and pore structure parameters will be studied below.

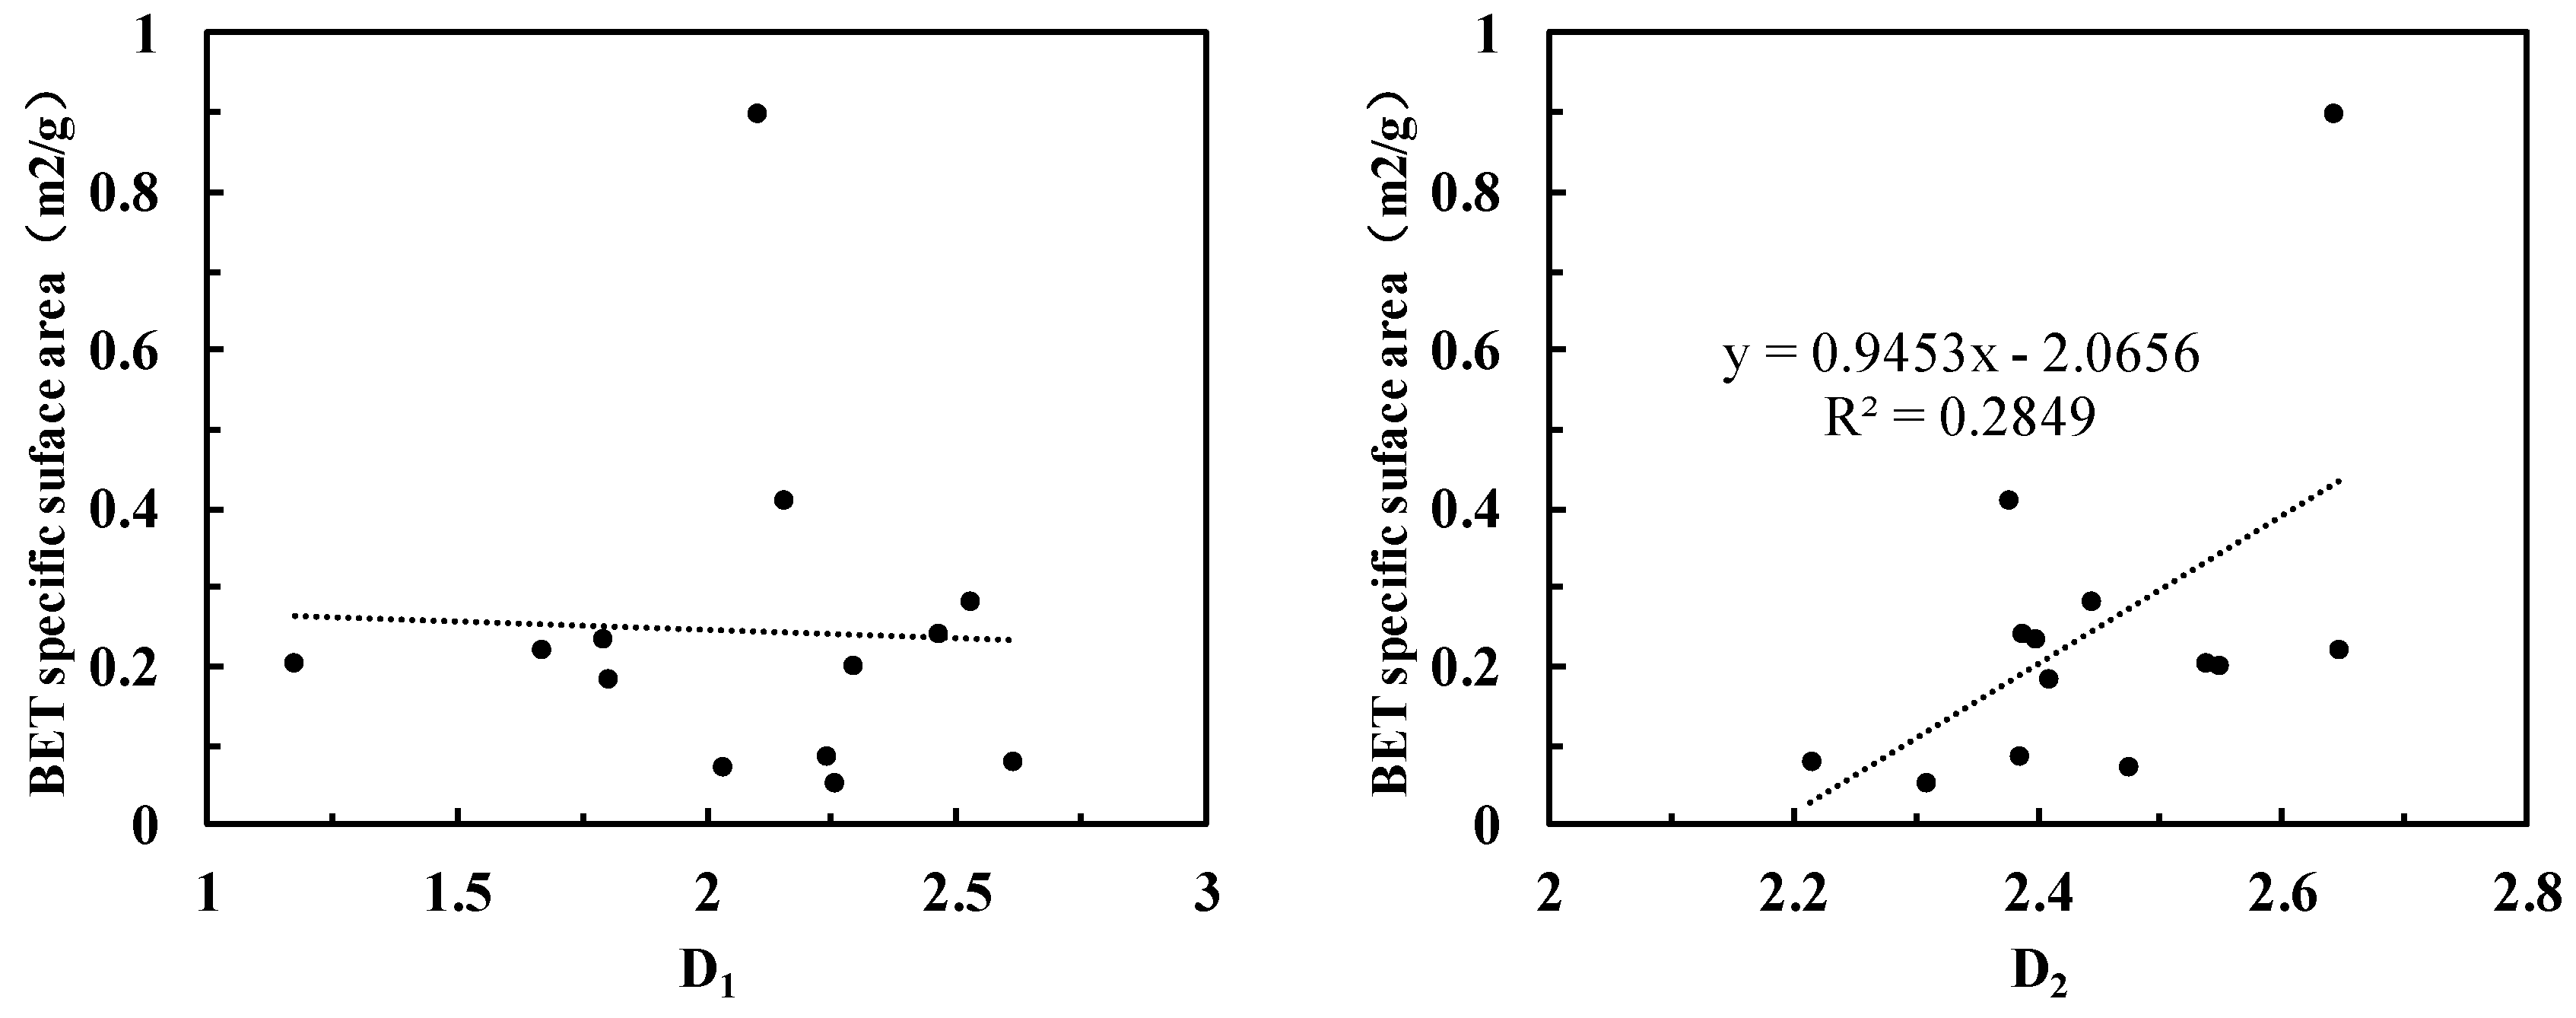
4.2.1. Relationship between Fractal Dimension and Specific Surface area

The relationship between specific surface area and fractal dimension of 10 shale samples and three sandstone samples is shown in Figure 15. There is no obvious relationship between D1 and BET specific surface area, but BET specific surface area is positively correlated with D2, indicating that the larger the specific surface area is, the more complex pore structure will become.

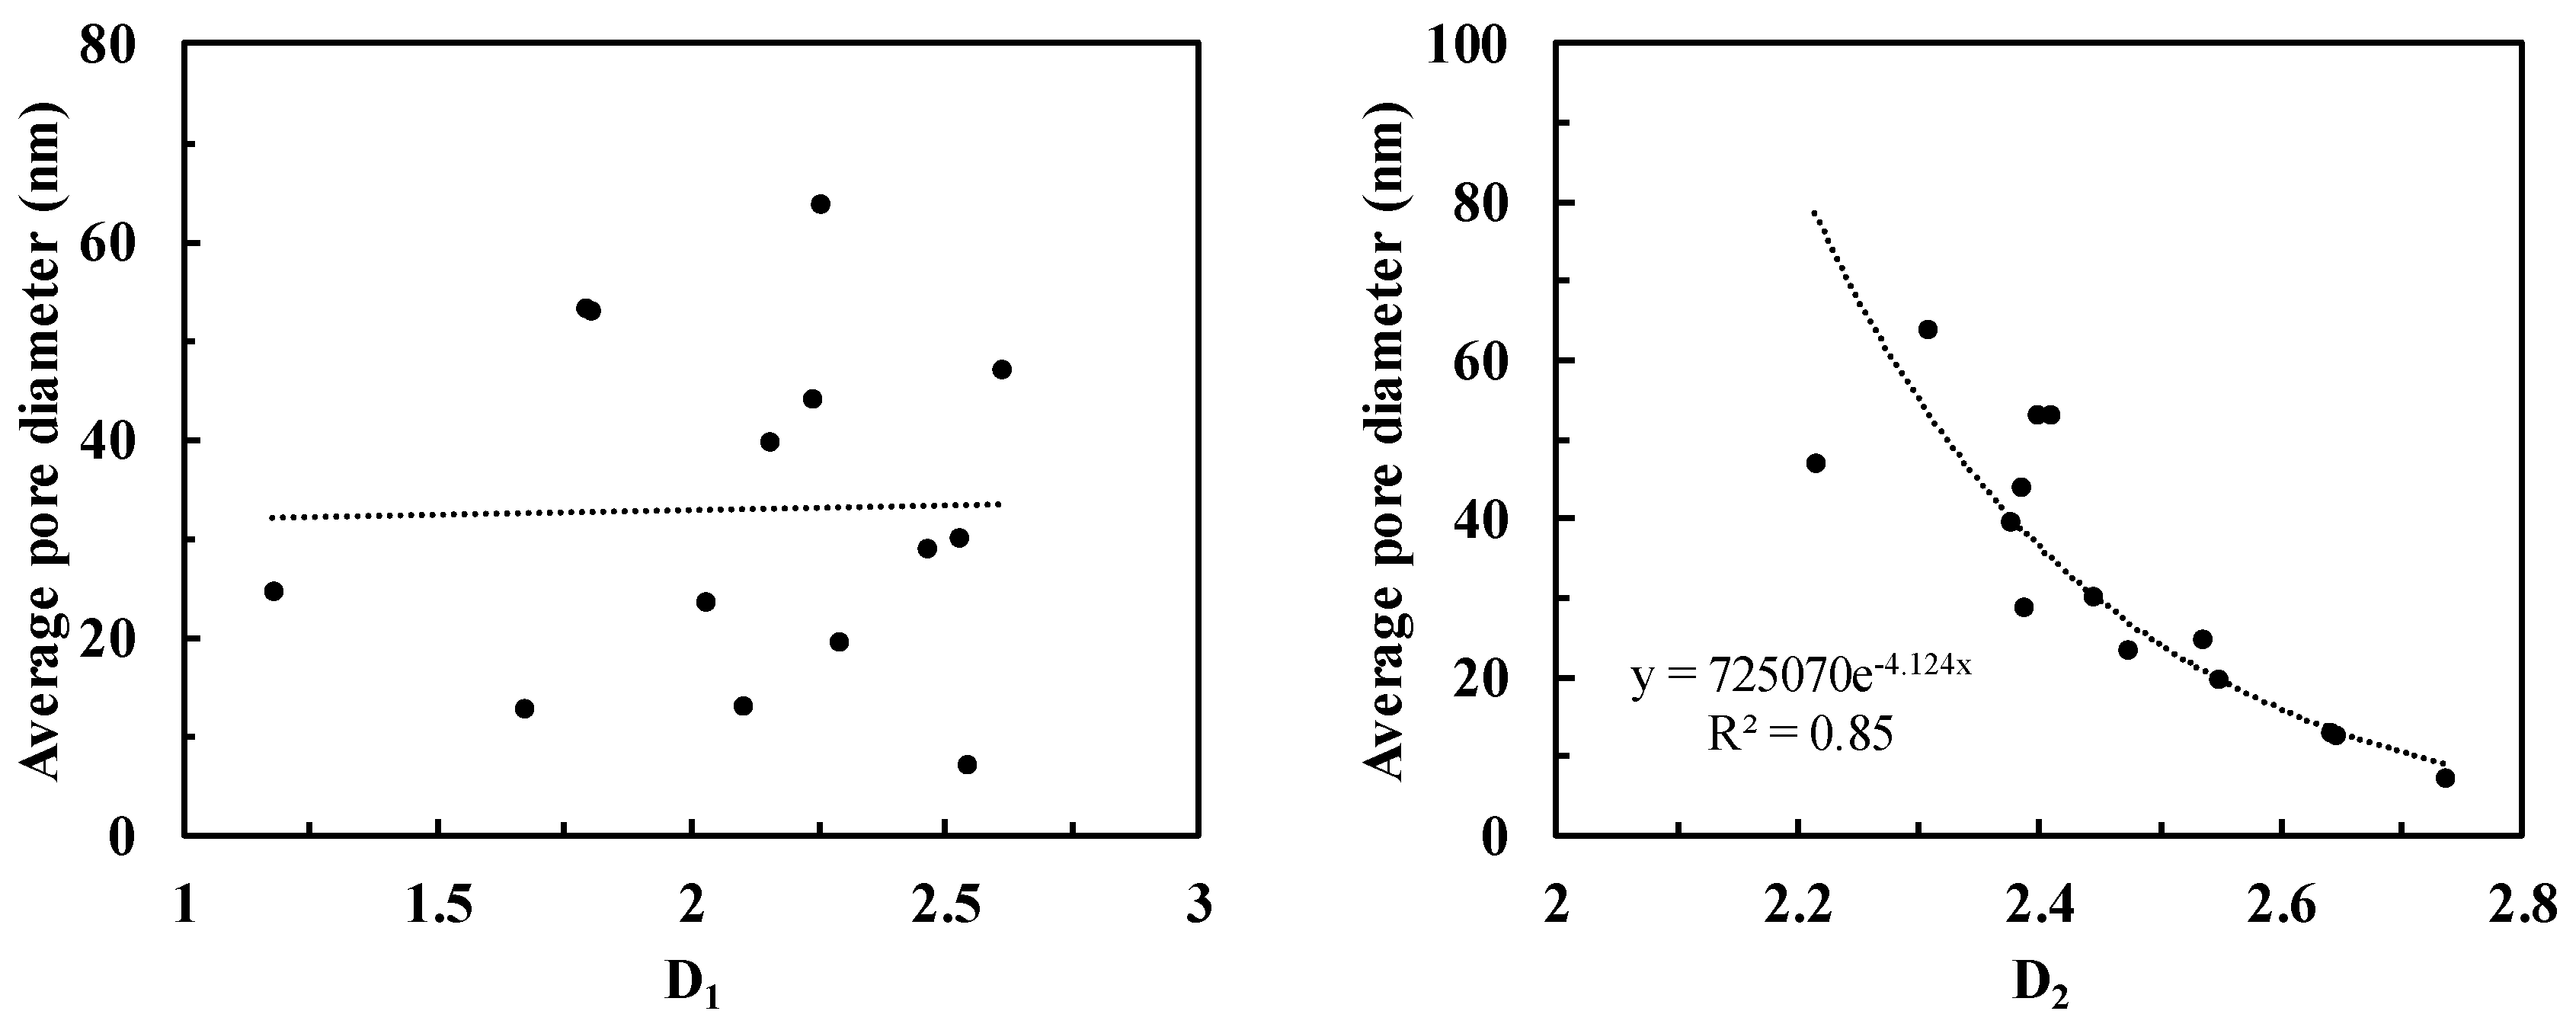
4.2.2. Relationship between Fractal Dimension and Average Pore Diameter

As shown in Figure 16, average pore diameter of all samples has no obvious relationship between D1, but is negatively correlated with D2. With average pore diameter increasing, fractal dimension D2 decreases exponentially, indicating properties of core samples become better.

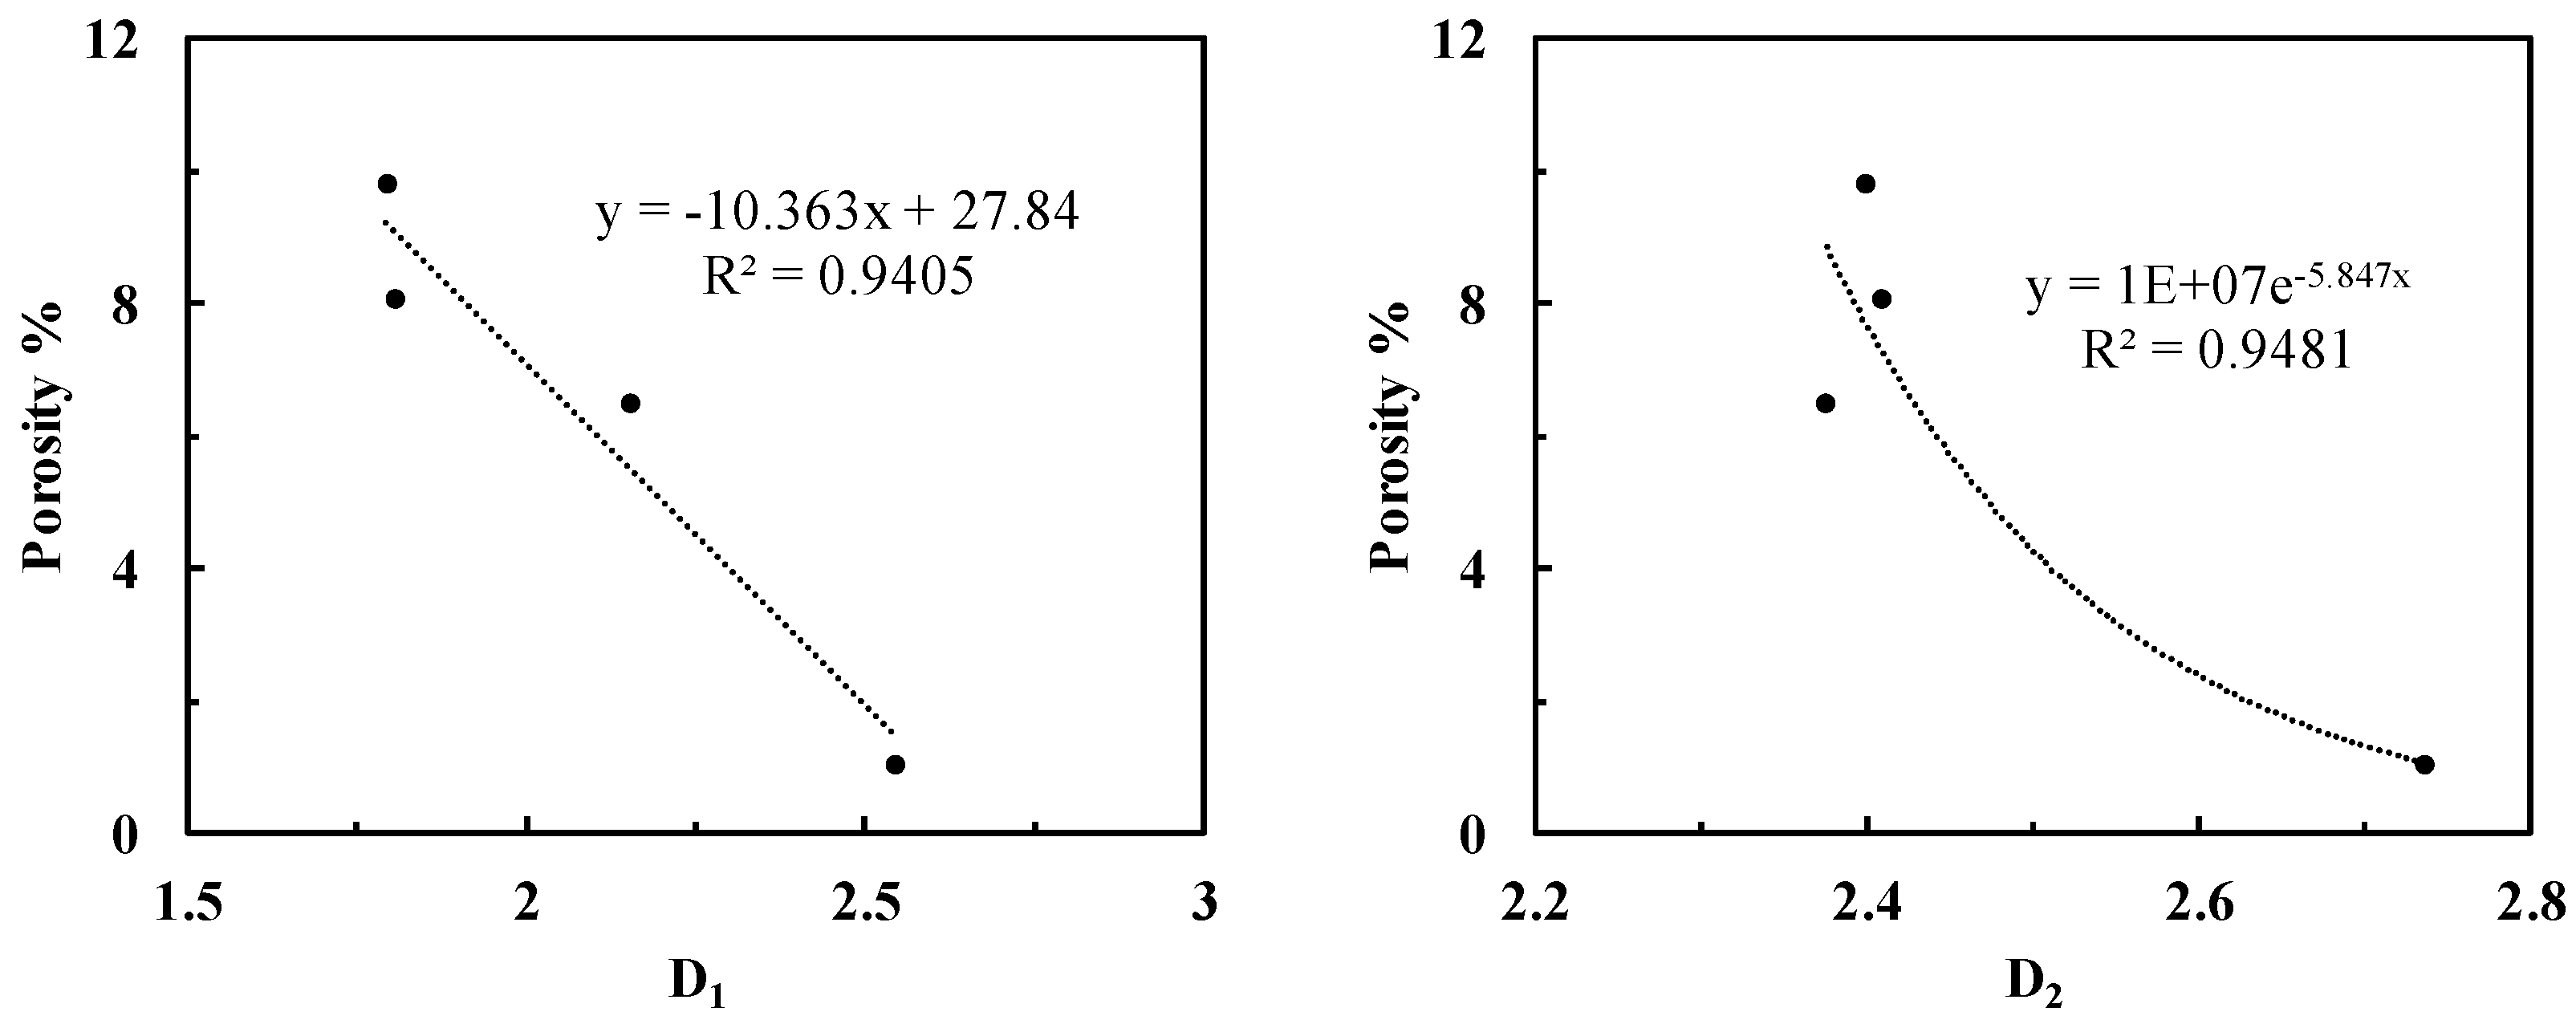
4.2.3. Relationship between Fractal Dimension and Porosity

As shown in Figure 17, the fractal dimension D1 and D2 of the three sandstone samples (Nos. 53–54, 42, 24) and one mudstone sample (No. 14) are negatively correlated with porosity.
The fractal dimension decreases with the increasing porosity. It is reasonable as the increasing porosity usually means the increasing pore size, and therefore properties of core samples become better.

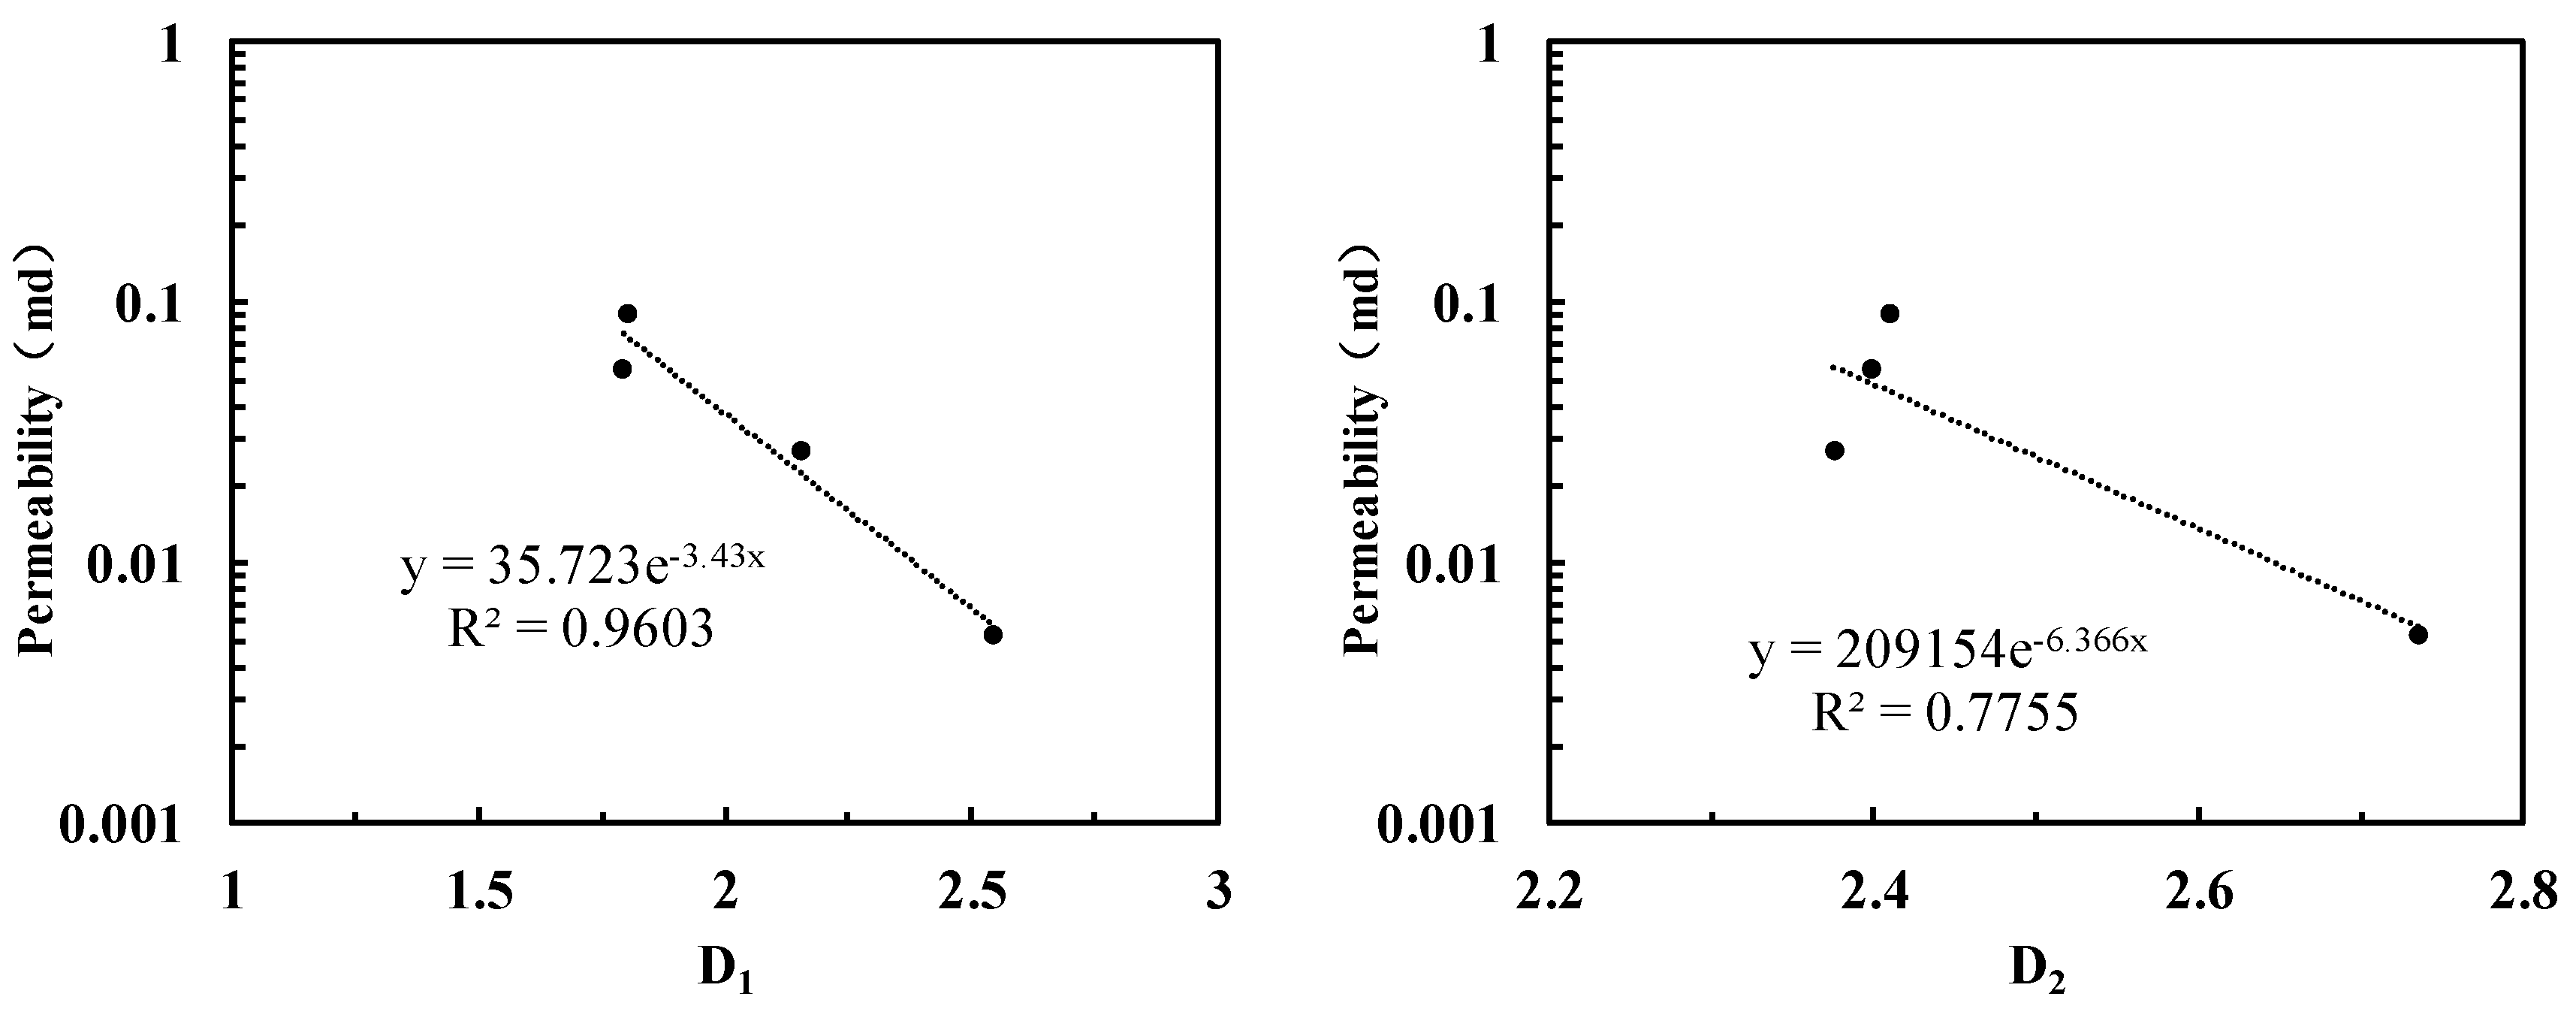
4.2.4. Relationship between Fractal Dimension and Permeability

The relationship between permeability and fractal dimension of three sandstone samples (Nos 53–54, 42 and 24) and one mudstone (No. 14) is shown in Figure 18. Similar to porosity, permeability is both negatively correlated to D1 and D2. Therefore, the calculated fractal dimension D1 and D2 can be used for evaluating core properties.

5. Conclusions

Characteristics of nanopore structure in shale, tight sandstone and mudstone have been studied with nitrogen adsorption experiment and fractal theory. Several conclusions could be drawn as follows:
(1)
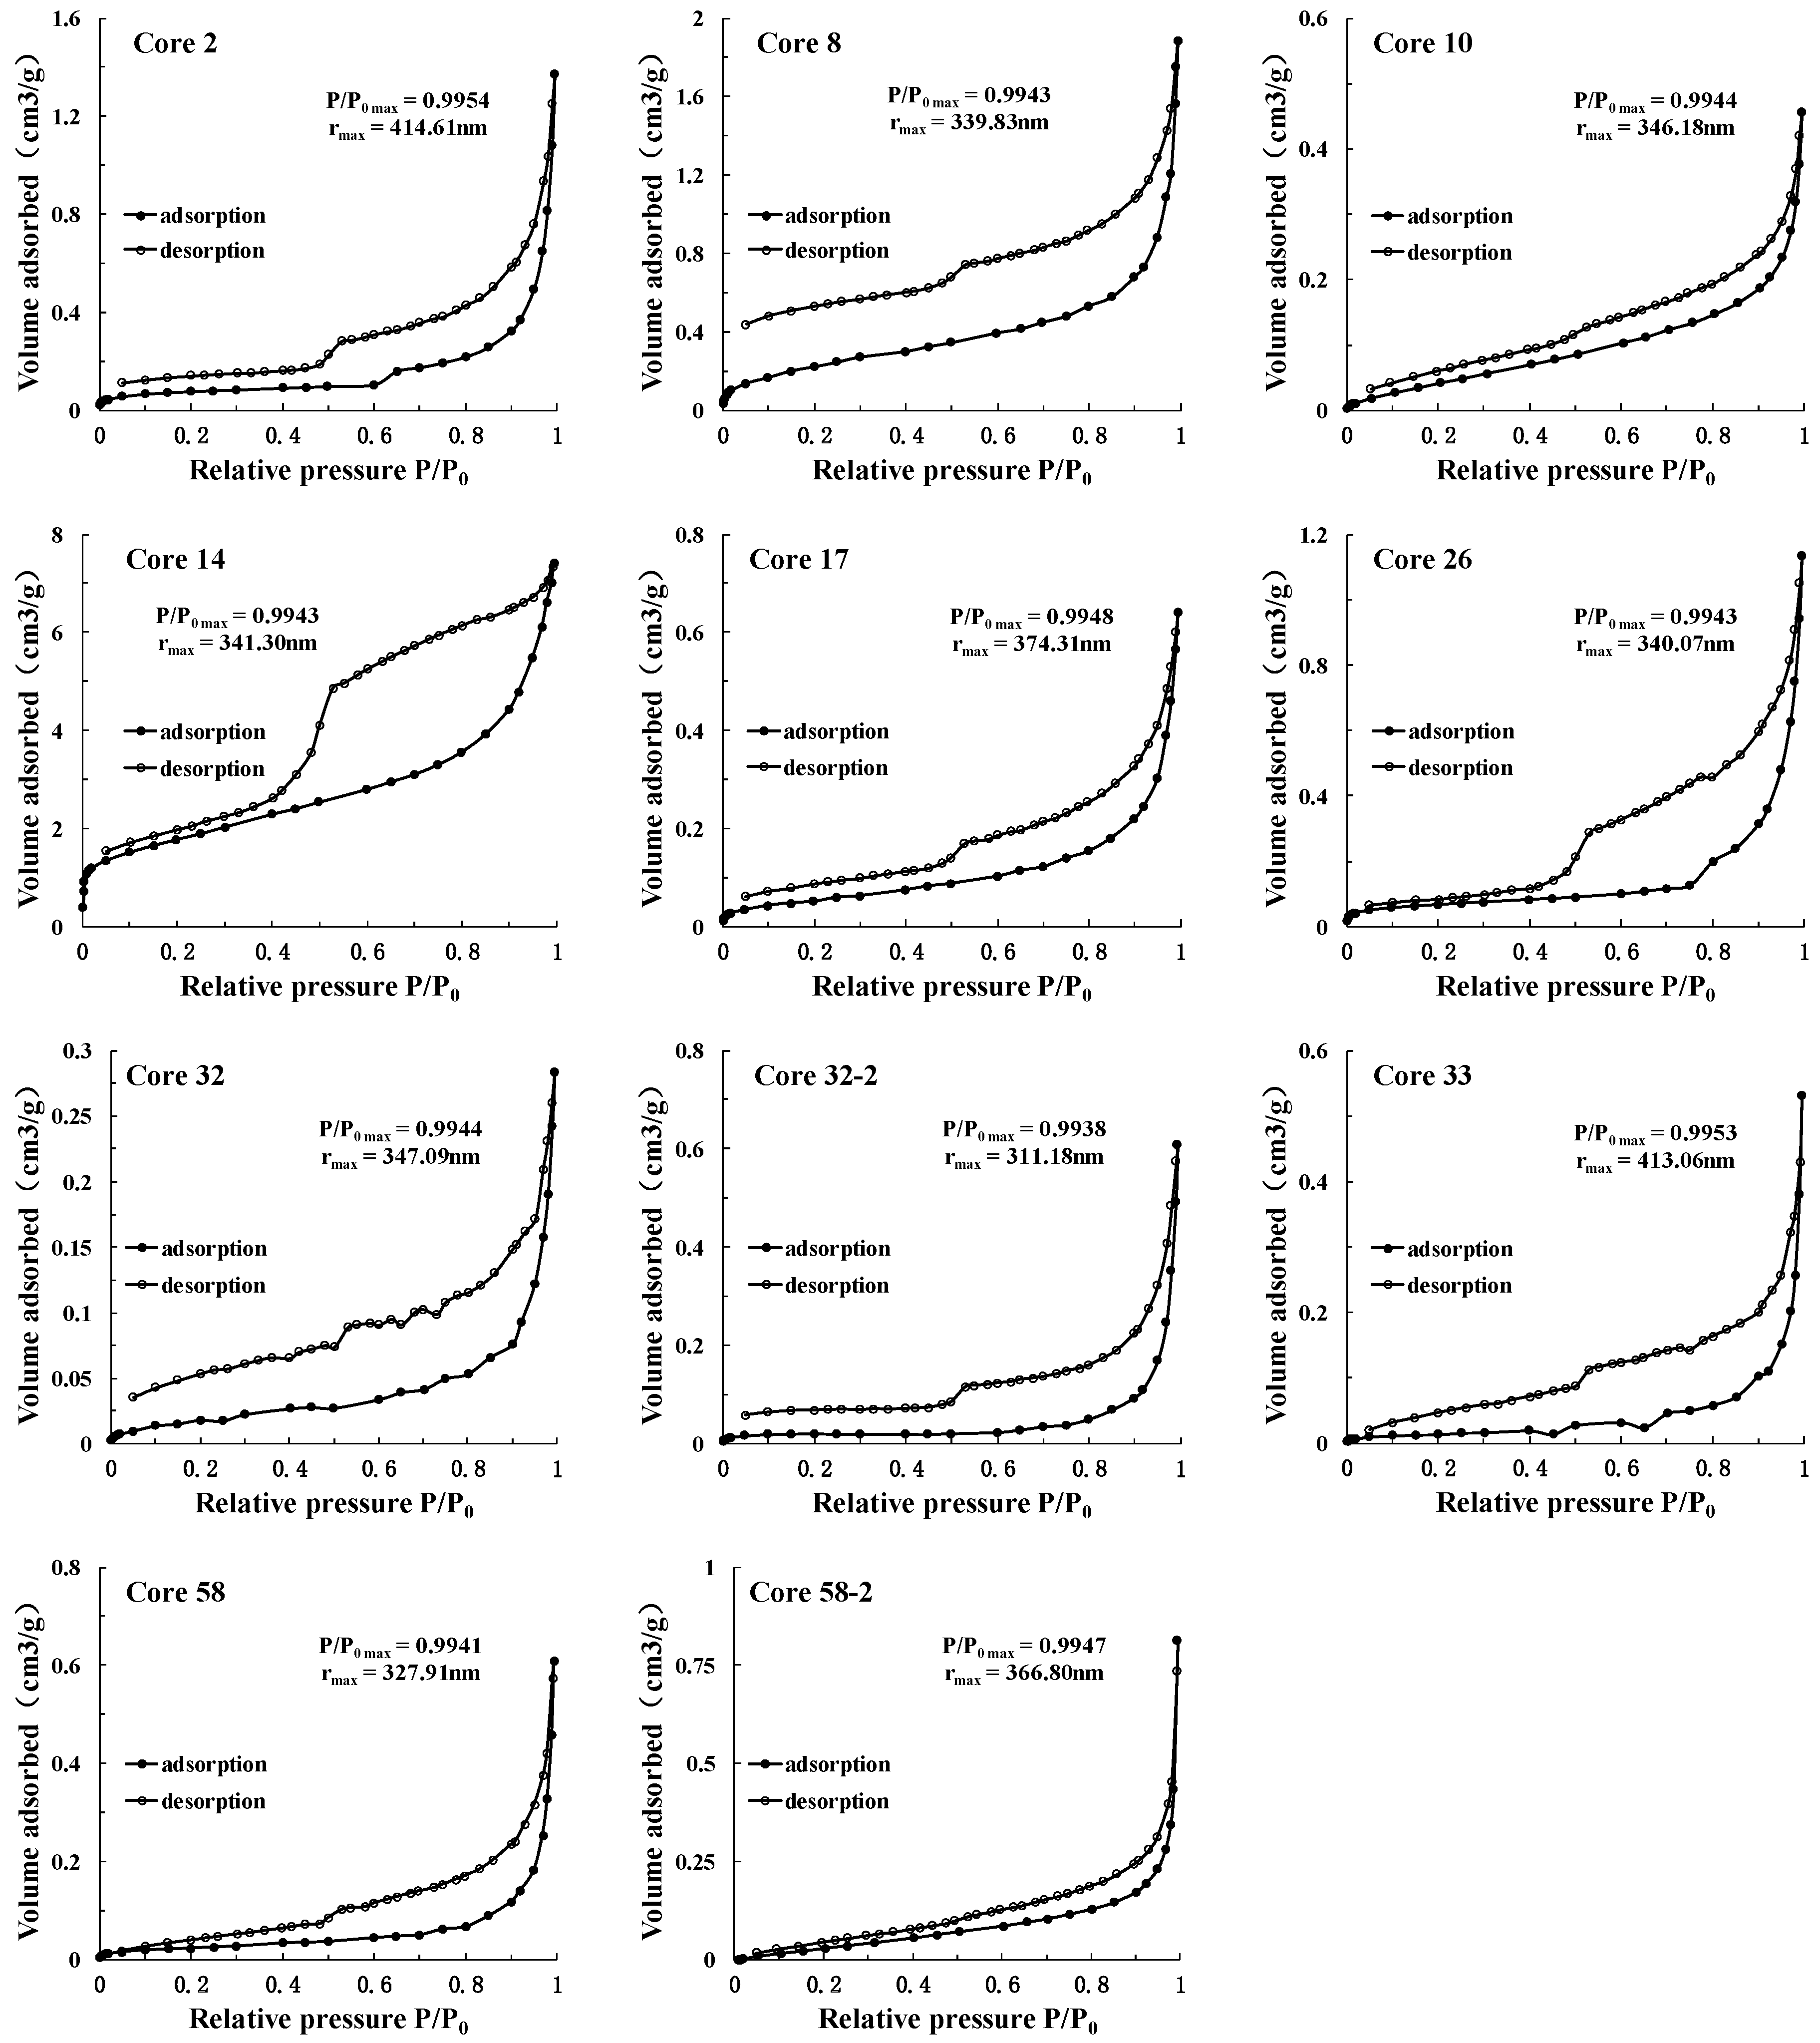
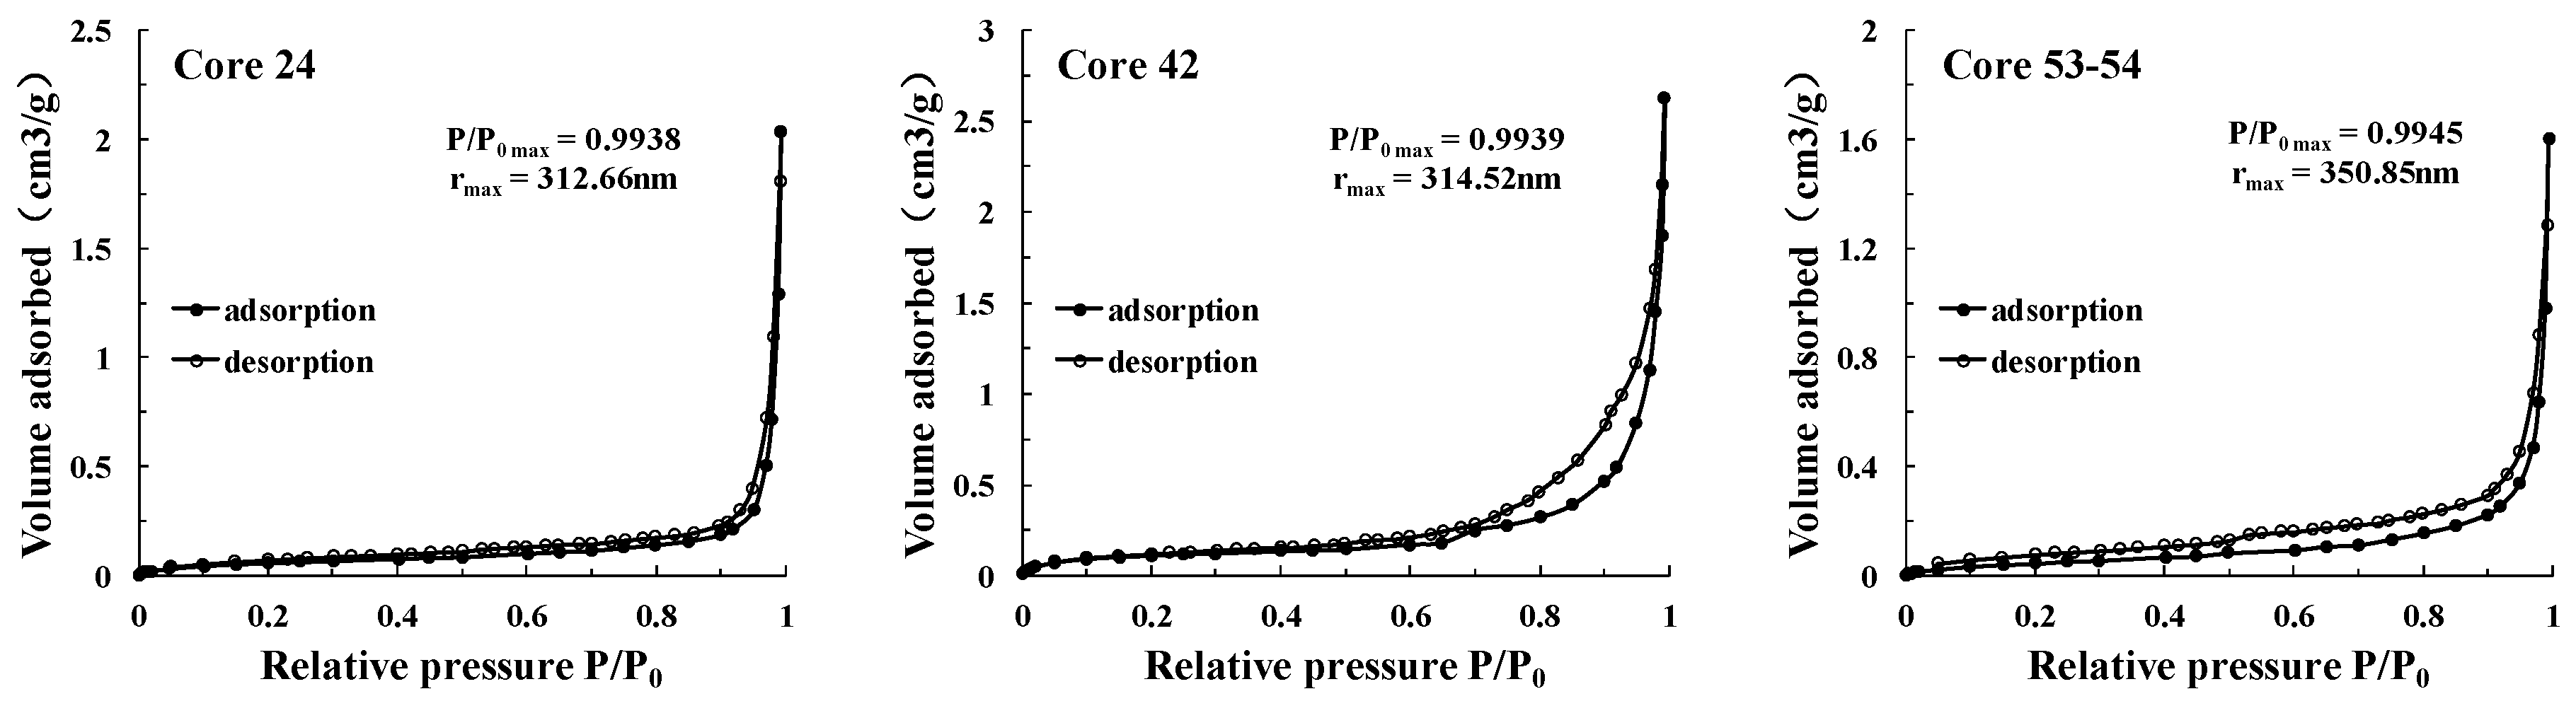
The morphologies of nitrogen adsorption-desorption curves of 10 shale samples belong to the H2 and H3 types according to IUPAC isotherm classification standard, while the curve of nitrogen adsorption-desorption of three sandstone sample is closer to H3 type.
(2)
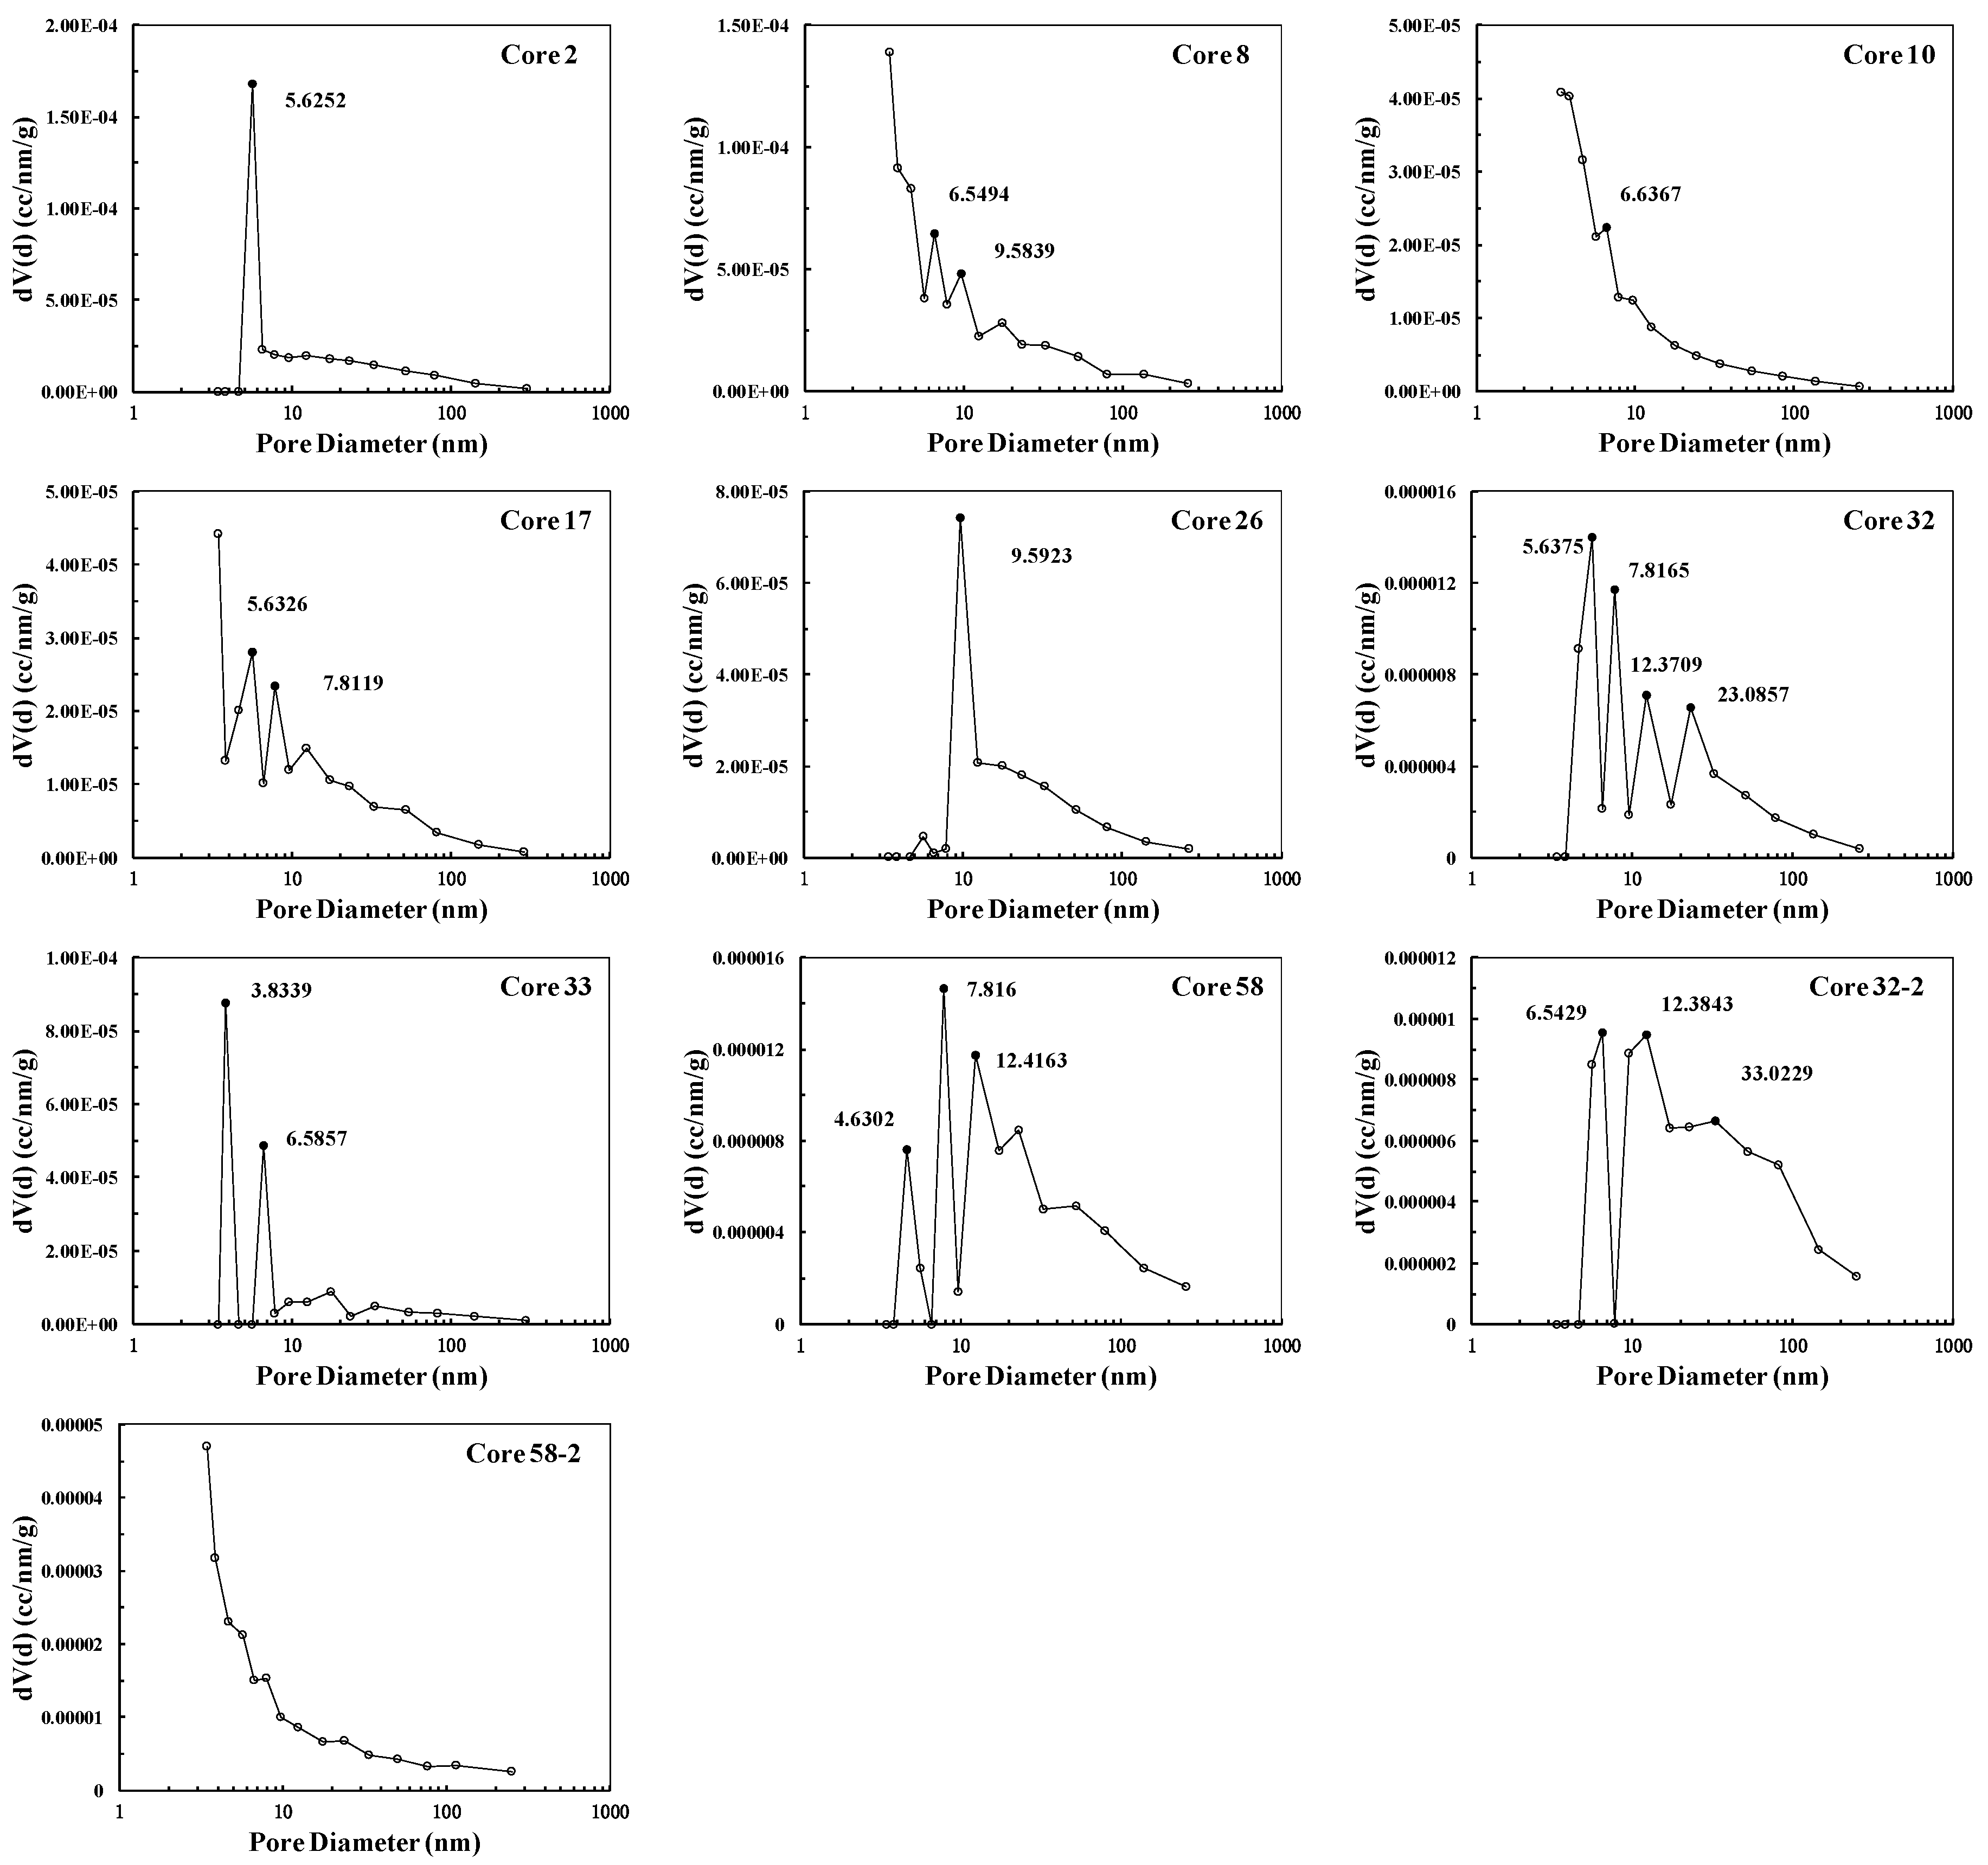
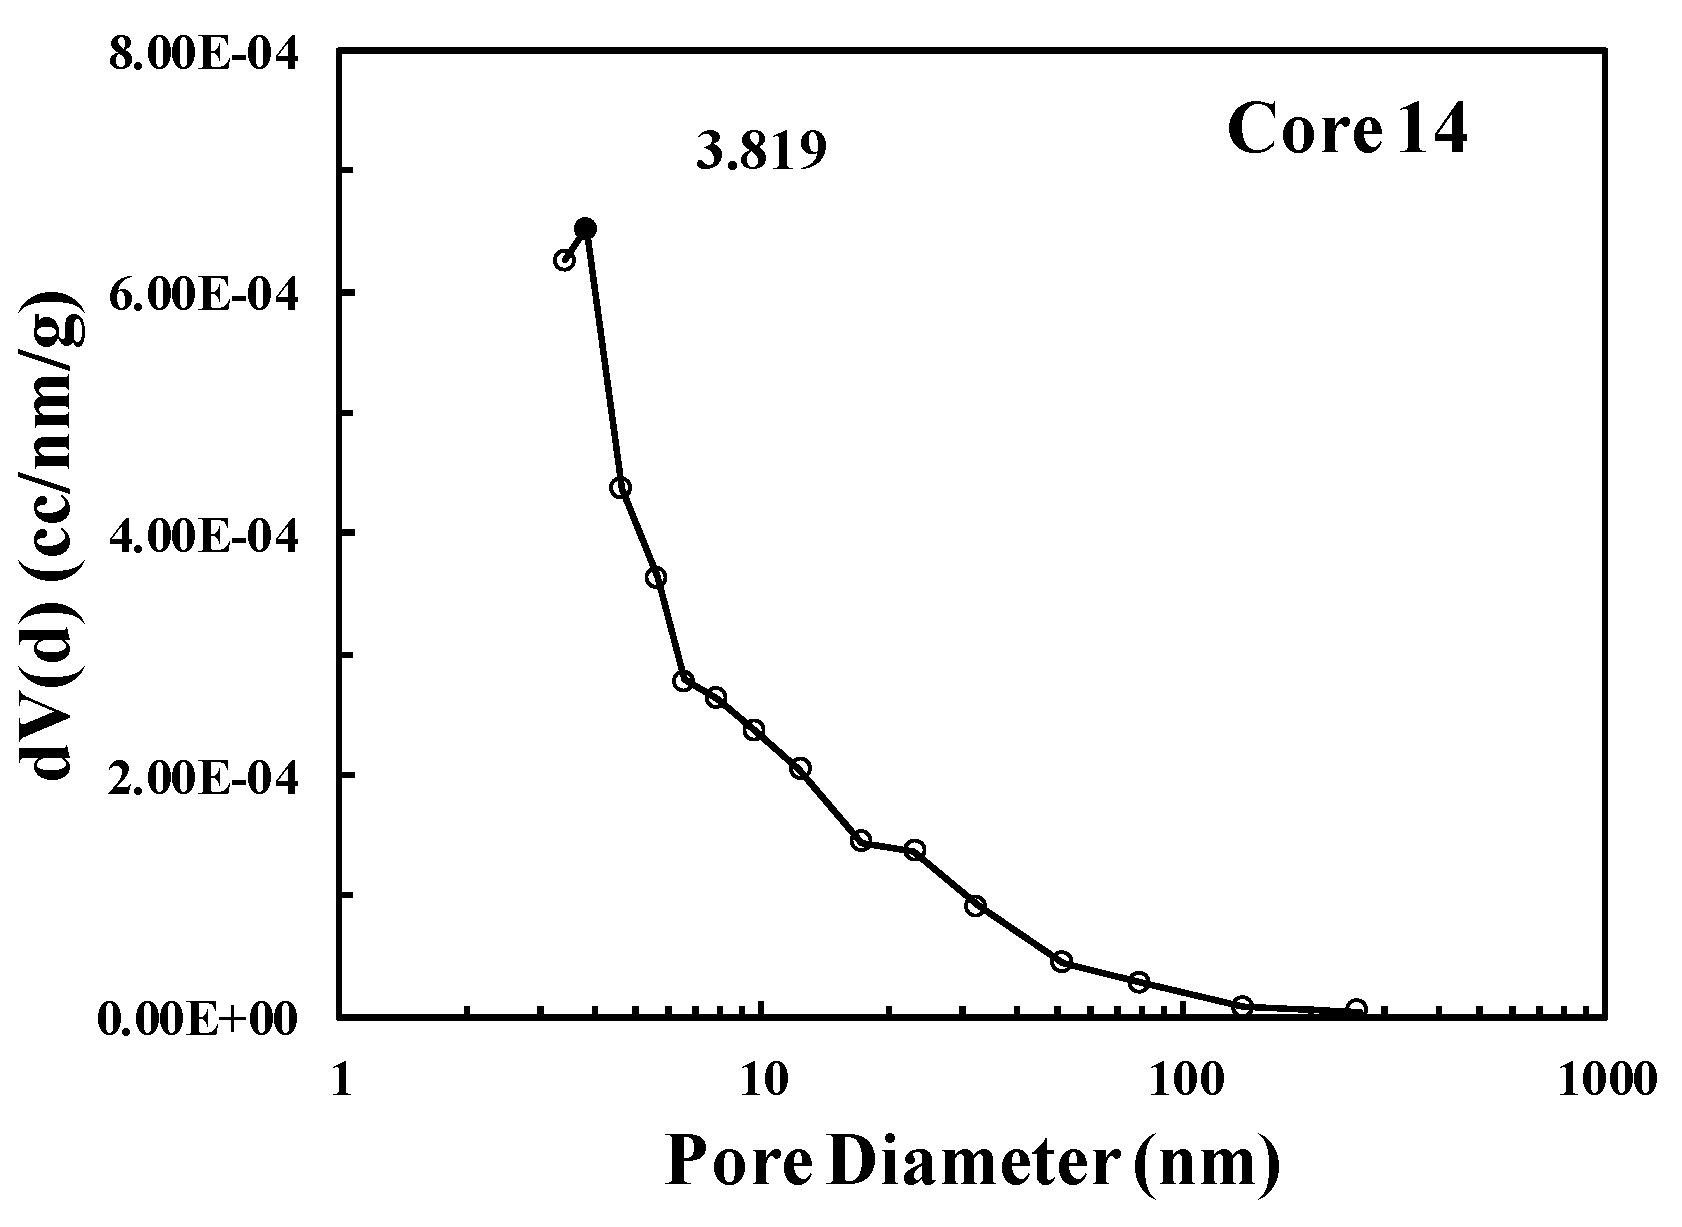
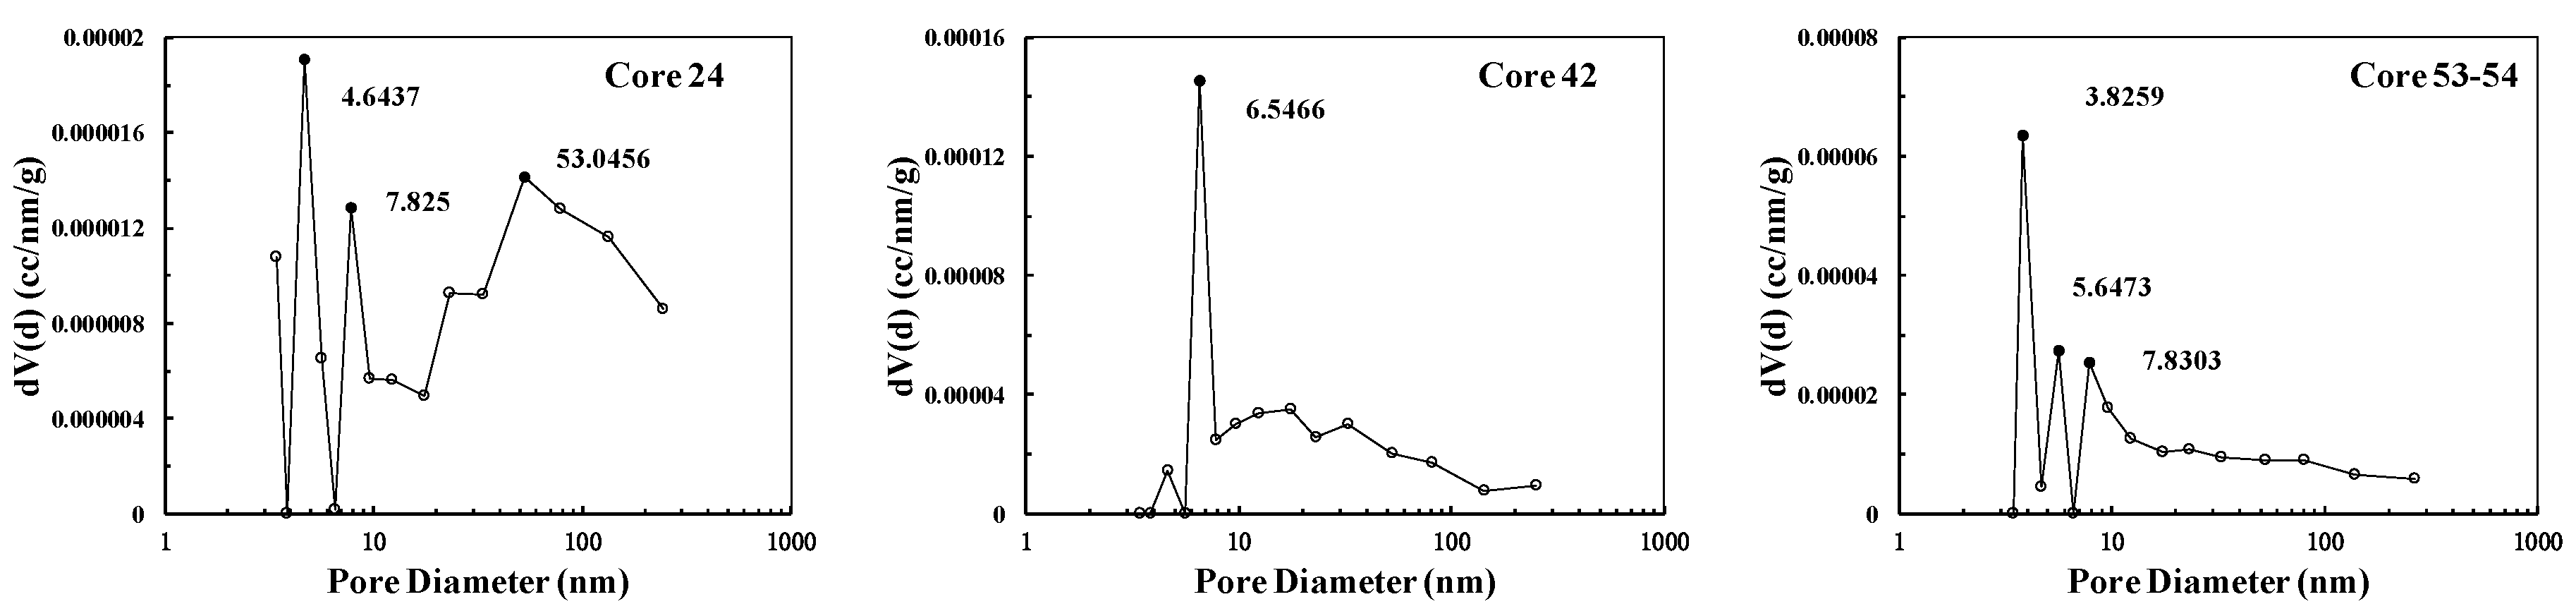
The pore sizes of the shale have certain heterogeneity, and the pore size intervals are mainly concentrated less than 30 nm, with at least a relatively obvious peak value distributed around 3 nm–10 nm.
(3)
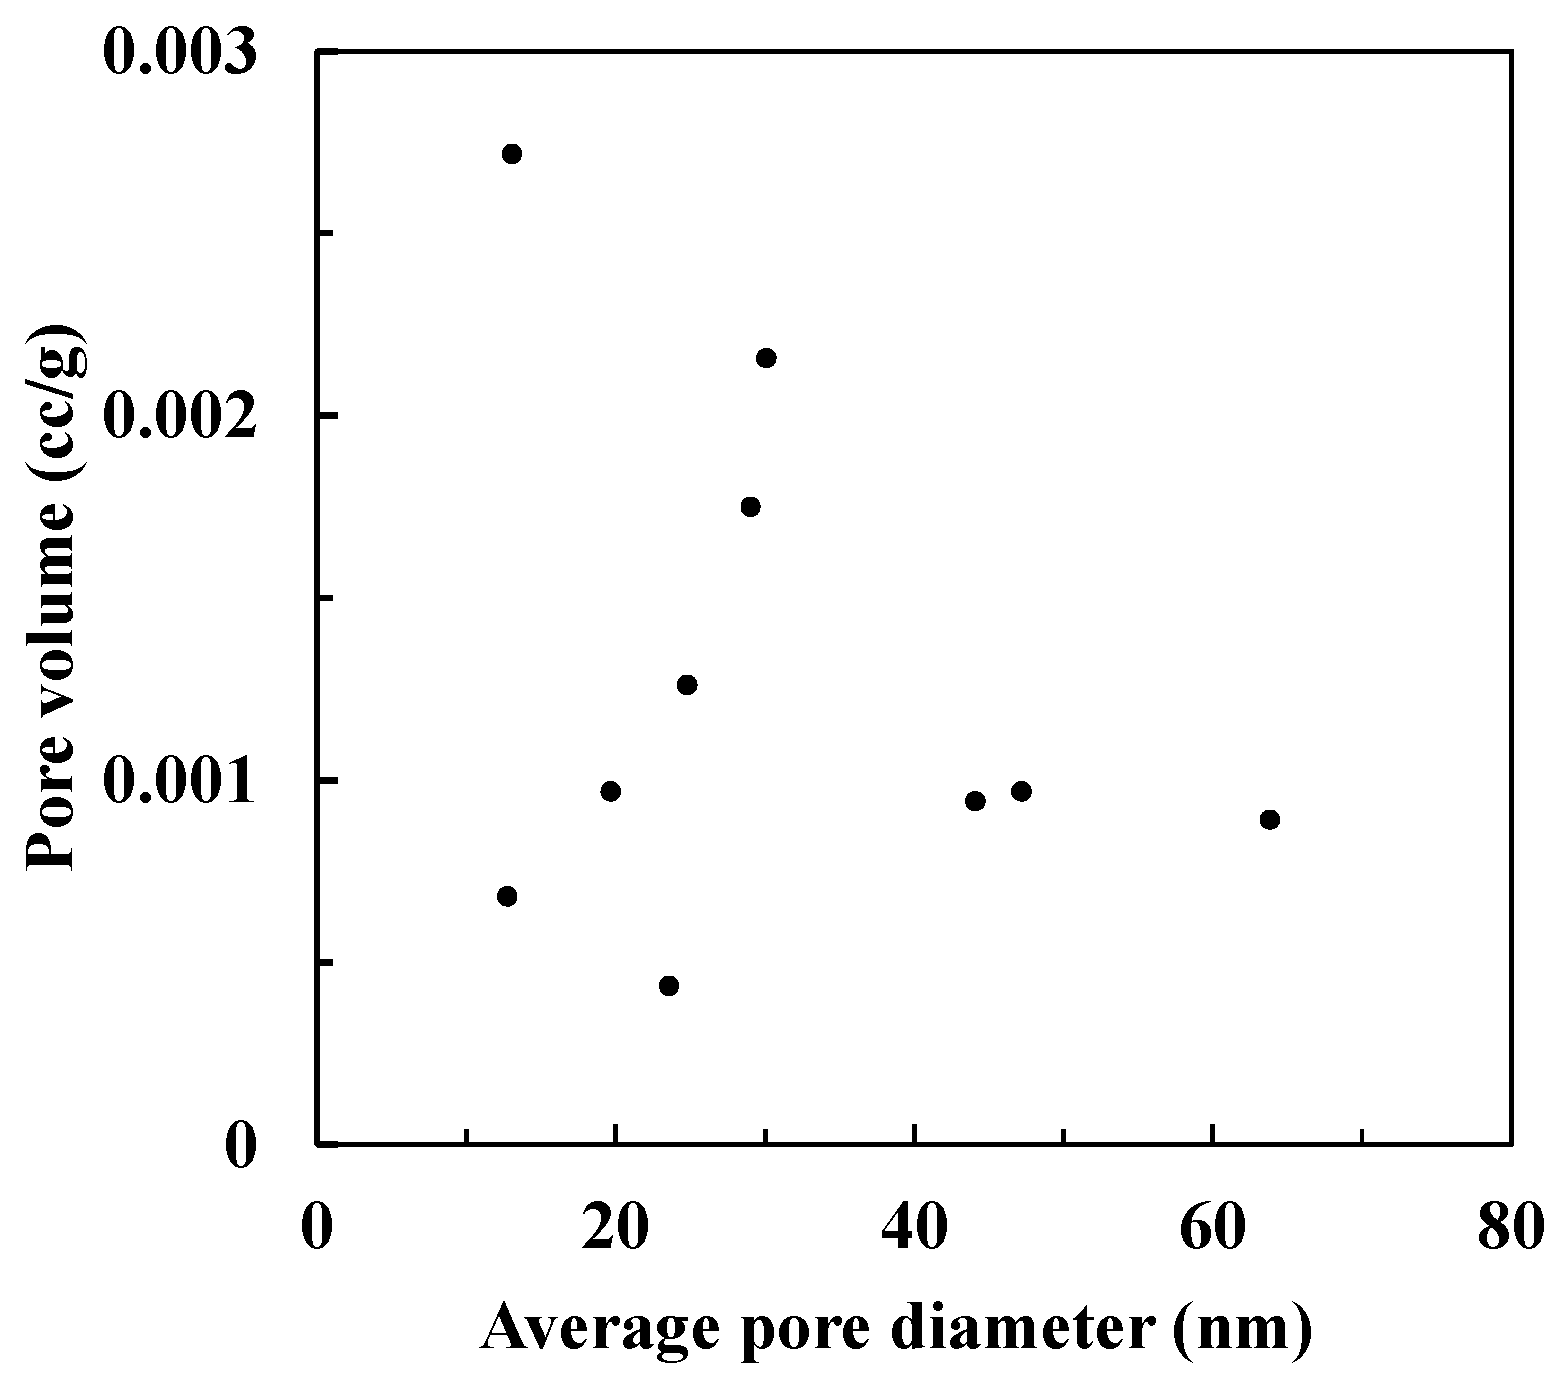
BET specific surface area of sandstone is smaller than that of shale, and the pore volume and average pore diameter are much larger than those in shale. The BET specific surface area of mudstone is much larger than that of sandstone, and the pore volume and average diameter are much smaller than those in sandstone.
(4)
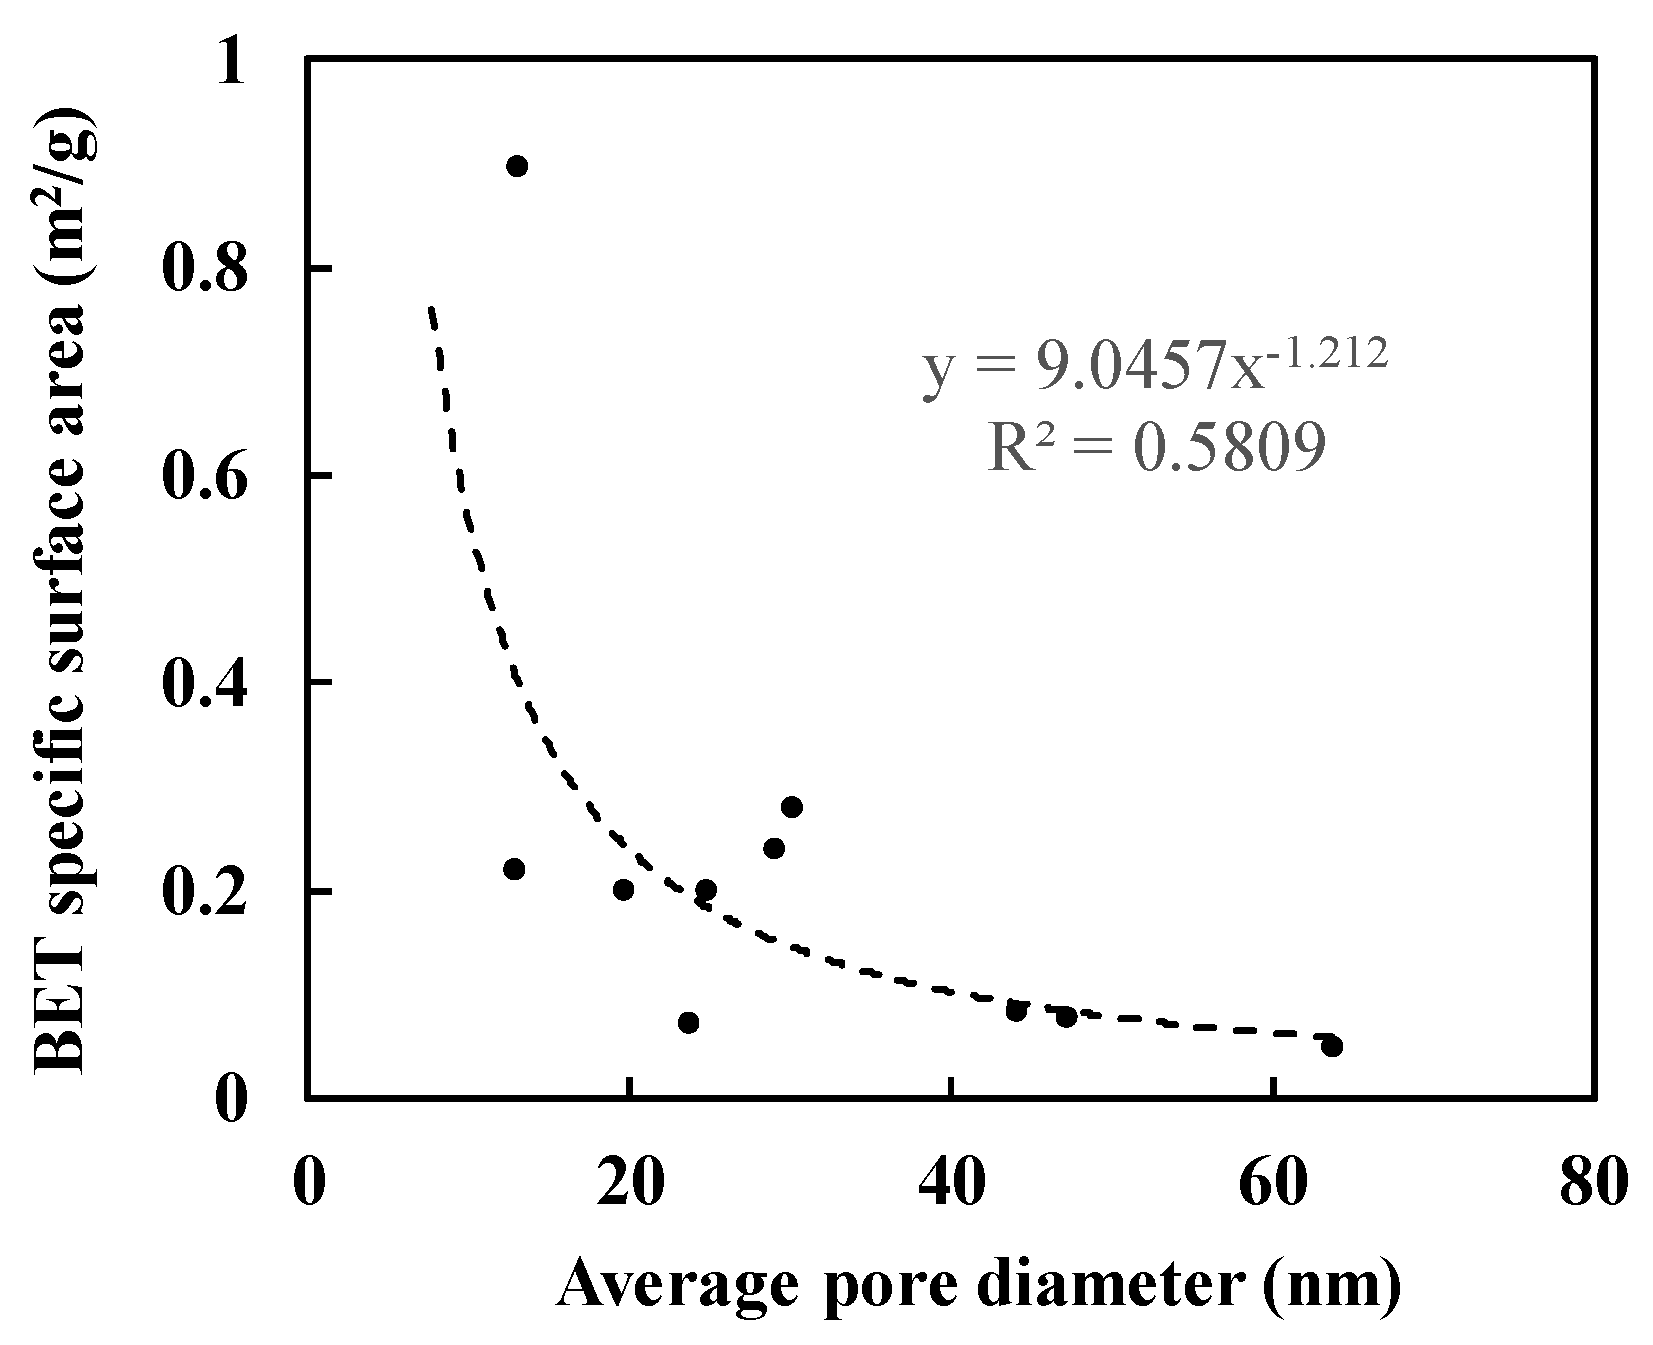
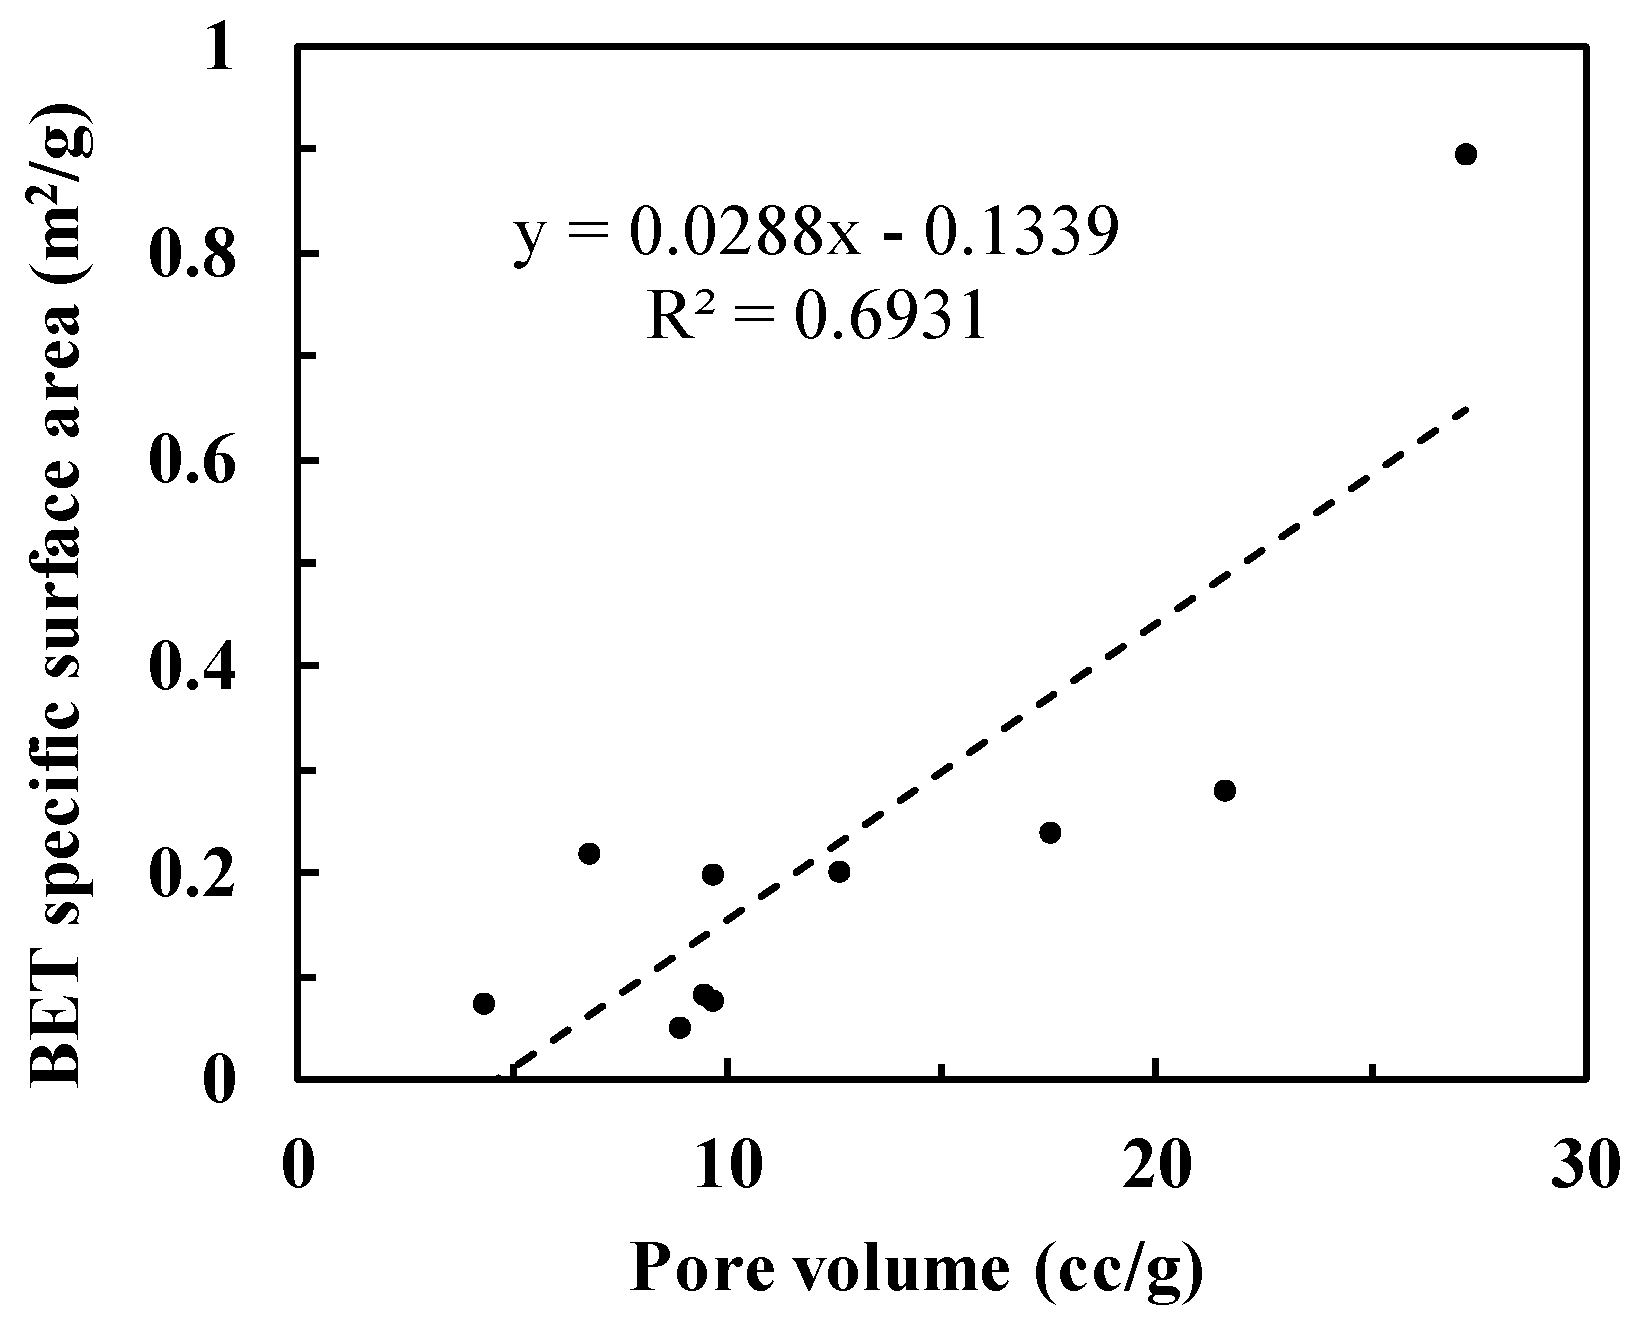
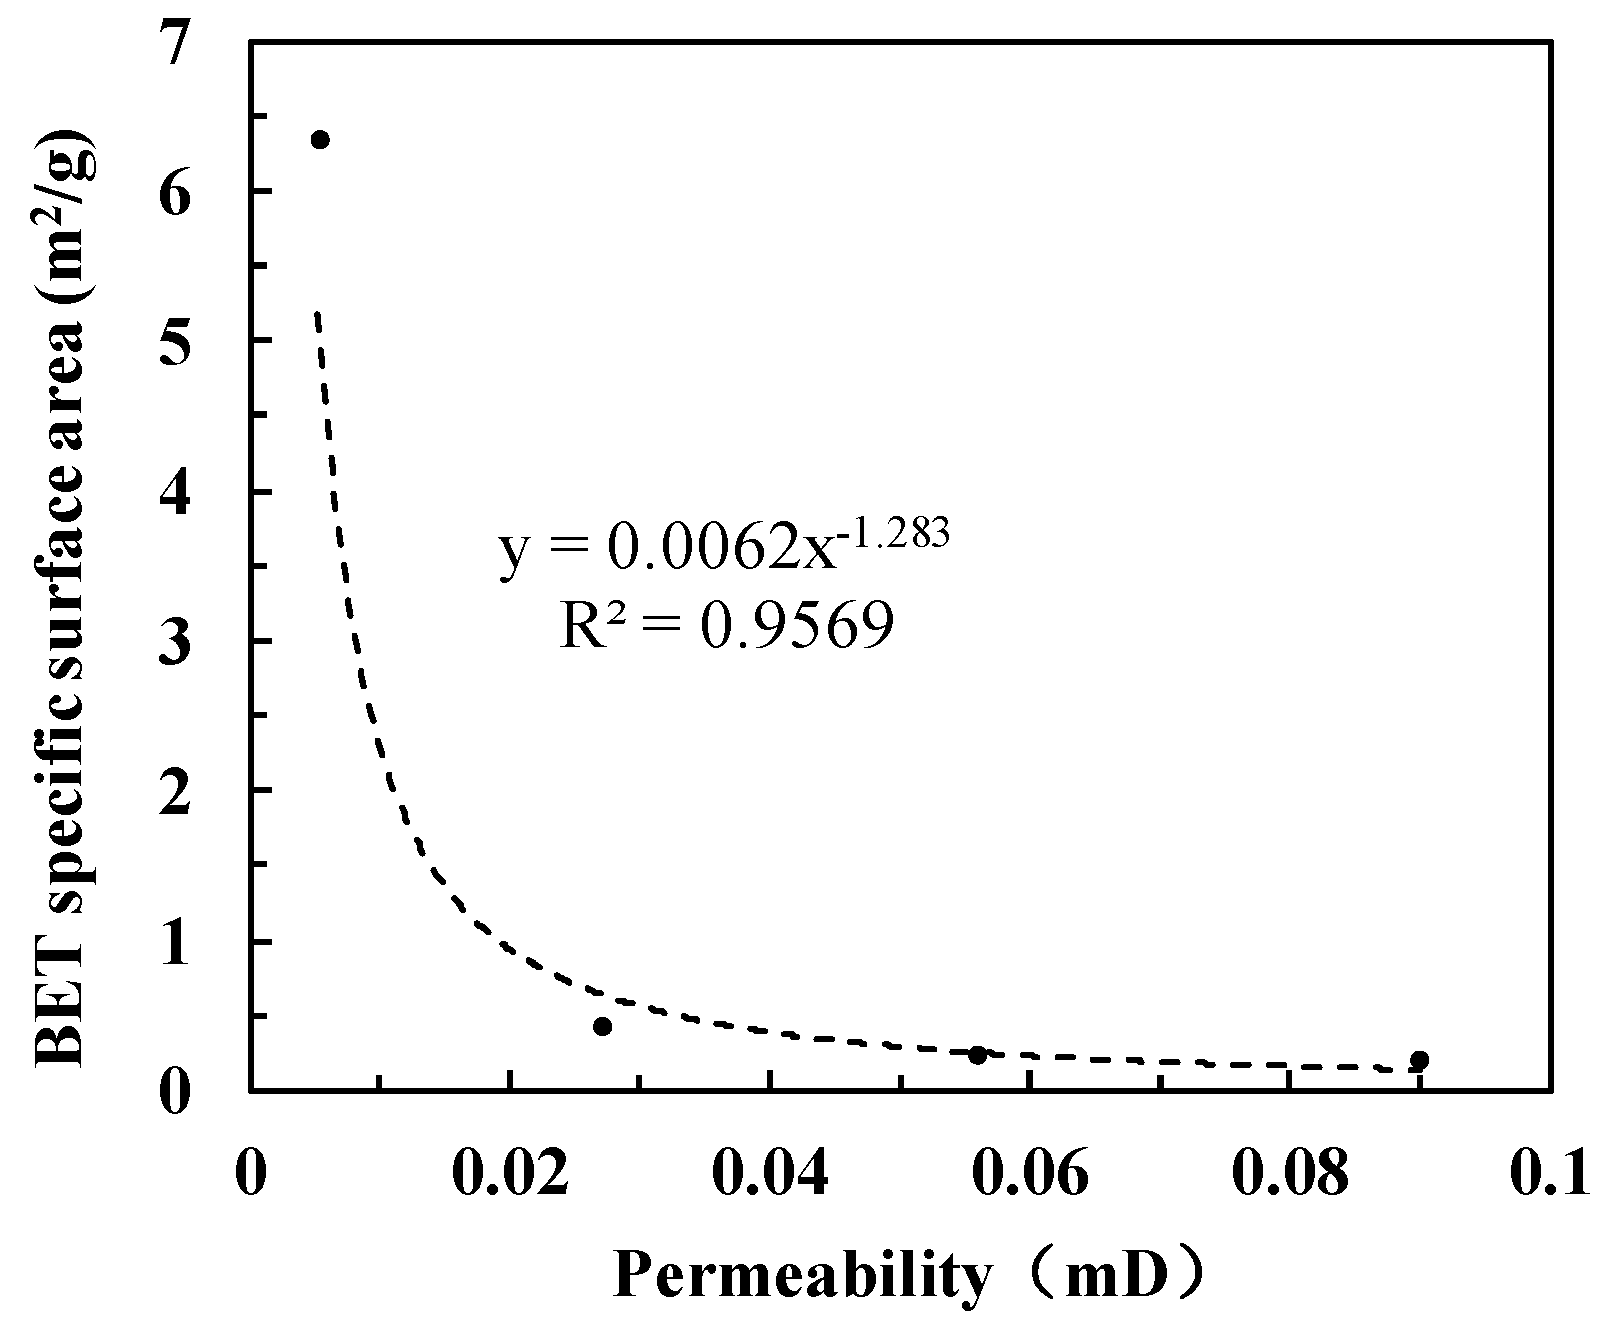
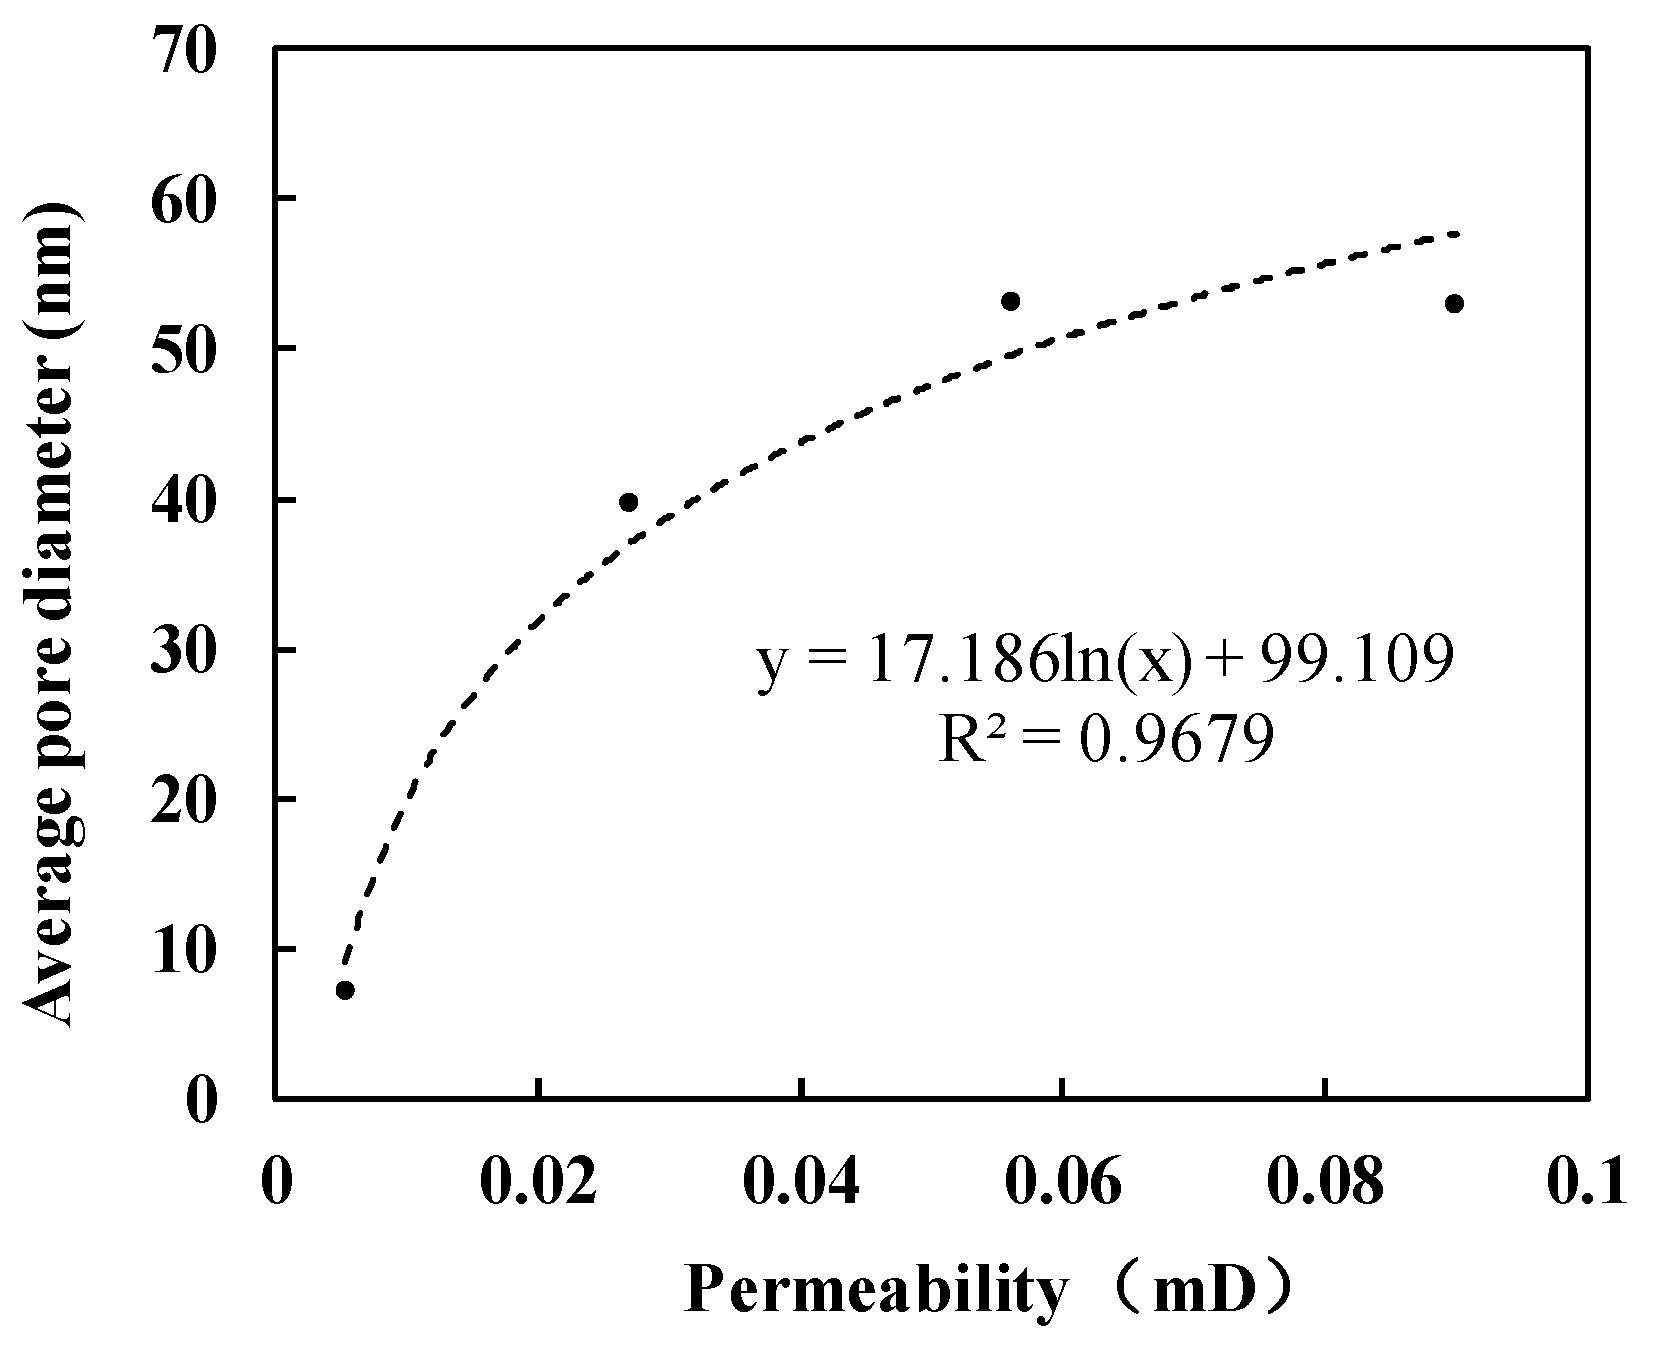
The larger the average pore size of sandstone is, the smaller the BET specific surface area will be, and the BET specific surface area decreases with the increase of permeability. With the increase of porosity and permeability, BET specific surface area decreases with the increasing average pore size.
(5)
Fractal dimensions calculated from the low relative pressure range D1 are generally less than those calculated from the high relative pressure range D2. D1 reflects the surface roughness of pore structures and D2 quantifies the spatial irregularity of pore spaces, and D1 and D2 are negatively correlated with each other. Compared with D1, D2 has stronger relationships with pore structure parameters and core properties. With D2 increases, BET specific surface area increases but average pore diameter, porosity and permeability decreases.

Author Contributions

Experiment and Methodology, X.L., Z.G. and C.R.; Writing-Original Draft Preparation, S.F.; Writing-Review & Editing, K.Y.; Data Analysis & Editing, F.W.

Funding

This work was supported by the National Science and Technology Major Project (No. 2017ZX05001-001), National Natural Science Foundation of China (Nos. 51604285 and 51874320) and Scientific Research Foundation of China University of Petroleum, Beijing (No. 2462017BJB11).

Conflicts of Interest

The authors declare no conflict of interest.

References

  1. Gasparik, M.; Ghanizadeh, A.; Bertier, P.; Gensterblum, Y.; Bouw, S.; Krooss, B.M. High-Pressure Methane Sorption Isotherms of Black Shales from The Netherlands. Energy Fuels 2012, 26, 4995–5004. [Google Scholar] [CrossRef]
  2. Loucks, R.G.; Ruppel, S.C. Mississippian Barnett Shale: Lithofacies and depositional setting of a deep-water shale-gas succession in the Fort Worth Basin, Texas. AAPG Bull. 2007, 91, 579–601. [Google Scholar] [CrossRef]
  3. Loucks, R.G.; Reed, R.M.; Ruppel, S.C.; Jarvie, D.M. Morphology, Genesis, and Distribution of Nanometer-Scale Pores in Siliceous Mudstones of the Mississippian Barnett Shale. J. Sediment. Res. 2009, 79, 848–861. [Google Scholar] [CrossRef]
  4. Wang, F.; Lian, P.; Jiao, L.; Liu, Z.; Zhao, J. Fractal analysis of microscale and nanoscale pore structures in carbonates using high-pressure mercury intrusion. Geofluids 2018, 2018, 1840017. [Google Scholar] [CrossRef]
  5. Wang, F.; Yang, K.; Cai, J. Fractal characterization of tight oil reservoir pore structure using nuclear magnetic resonance and mercury intrusion porosimetry. Fractals 2018, 26, 1840017. [Google Scholar] [CrossRef]
  6. Ross, D.J.K.; Marc Bustin, R. The importance of shale composition and pore structure upon gas storage potential of shale gas reservoirs. Mar. Pet. Geol. 2009, 26, 916–927. [Google Scholar] [CrossRef]
  7. Ghanbarian, B.; Torres-Verdín, C.; Lake, L.W.; Marder, M. Gas permeability in unconventional tight sandstones: Scaling up from pore to core. J. Pet. Sci. Eng. 2019, 173, 1163–1172. [Google Scholar] [CrossRef]
  8. Chen, K.; Zhang, T.; Chen, X.; He, Y.; Liang, X. Model construction of micro-pores in shale: A case study of Silurian Longmaxi Formation shale in Dianqianbei area, SW China. Pet. Explor. Dev. 2018, 45, 412–421. [Google Scholar] [CrossRef]
  9. Millán, H.; Govea-Alcaide, E.; García-Fornaris, I. Truncated fractal modeling of H2O-vapor adsorption isotherms. Geoderma 2013, 206, 14–23. [Google Scholar] [CrossRef]
  10. Yang, Y.; Wu, K.; Zhang, T.; Xue, M. Characterization of the pore system in an over-mature marine shale reservoir: A case study of a successful shale gas well in Southern Sichuan Basin, China. Petroleum 2015, 1, 173–186. [Google Scholar] [CrossRef] [Green Version]
  11. Wang, F.; Jiao, L.; Liu, Z.; Tan, X.; Wang, C.; Gao, J. Fractal Analysis of Pore Structures in Low Permeability Sandstones Using Mercury Intrusion Porosimetry. J. Porous Media 2018, 21, 1097–1119. [Google Scholar] [CrossRef]
  12. Ming, M.; Guojun, C.; Yong, X.; Shijun, H.; Chengfu, L.; Lianhua, X. Fractal characteristics of pore structure of continental shale in the process of thermal evolution. Coal Geol. Explor. 2017, 45, 41–47. [Google Scholar]
  13. Xiong, J.; Liu, X.; Liang, L. An Investigation of Fractal Characteristics of Marine Shales in the Southern China from Nitrogen Adsorption Data. J. Chem. 2015, 2015, 303164. [Google Scholar] [CrossRef]
  14. Shao, X.; Pang, X.; Li, Q.; Wang, P.; Chen, D.; Shen, W.; Zhao, Z. Pore structure and fractal characteristics of organic-rich shales: A case study of the lower Silurian Longmaxi shales in the Sichuan Basin, SW China. Mar. Pet. Geol. 2017, 80, 192–202. [Google Scholar] [CrossRef]
  15. Li, A.; Ding, W.; He, J.; Dai, P.; Yin, S.; Xie, F. Investigation of pore structure and fractal characteristics of organic-rich shale reservoirs: A case study of Lower Cambrian Qiongzhusi formation in Malong block of eastern Yunnan Province, South China. Mar. Pet. Geol. 2016, 70, 46–57. [Google Scholar] [CrossRef]
  16. Barrett, E.P.; Joyner, L.G.; Halenda, P.P. The Determination of Pore Volume and Area Distributions in Porous Substances. I. Computations from Nitrogen Isotherms. J. Am. Chem. Soc. 1951, 73, 373–380. [Google Scholar] [CrossRef]
  17. Jiang, F.; Chen, D.; Chen, J.; Li, Q.; Liu, Y.; Shao, X.; Hu, T.; Dai, J. Fractal Analysis of Shale Pore Structure of Continental Gas Shale Reservoir in the Ordos Basin, NW China. Energy Fuels 2016, 30, 4676–4689. [Google Scholar] [CrossRef]
  18. Zhang, L.; Li, J.; Jia, D.U.; Zhao, Y.; Xie, C.; Tao, Z. Study on the adsorption phenomenon in shale with the combination of molecular dynamic simulation and fractal analysis. Fractals 2018, 26, 1840004. [Google Scholar] [CrossRef]
  19. Brunauer, S.; Emmett, P.H.; Teller, E. Adsorption of Gases in Multimolecular Layers. J. Am. Chem. Soc. 1938, 60, 309–319. [Google Scholar] [CrossRef]
  20. Wang, Y.; Zhu, Y.; Liu, S.; Zhang, R. Pore characterization and its impact on methane adsorption capacity for organic-rich marine shales. Fuel 2016, 181, 227–237. [Google Scholar] [CrossRef]
  21. Tian, H.; Pan, L.; Xiao, X.; Wilkins, R.W.T.; Meng, Z.; Huang, B. A preliminary study on the pore characterization of Lower Silurian black shales in the Chuandong Thrust Fold Belt, southwestern China using low pressure N2 adsorption and FE-SEM methods. Mar. Pet. Geol. 2013, 48, 8–19. [Google Scholar] [CrossRef] [Green Version]
  22. De Boer, J.H.; Lippens, B.C.; Linsen, B.G.; Broekhoff, J.; Van den Heuvel, A.; Osinga, T.J. Thet-curve of multimolecular N2-adsorption. J. Colloid Interface Sci. 1966, 21, 405–414. [Google Scholar] [CrossRef]
  23. Mishra, S.; Mendhe, V.A.; Varma, A.K.; Kamble, A.D.; Sharma, S.; Bannerjee, M.; Kalpana, M.S. Influence of organic and inorganic content on fractal dimensions of Barakar and Barren Measures shale gas reservoirs of Raniganj basin, India. J. Nat. Gas Sci. Eng. 2018, 49, 393–409. [Google Scholar] [CrossRef]
  24. Sun, L.; Tuo, J.; Zhang, M.; Wu, C.; Wang, Z.; Zheng, Y. Formation and development of the pore structure in Chang 7 member oil-shale from Ordos Basin during organic matter evolution induced by hydrous pyrolysis. Fuel 2015, 158, 549–557. [Google Scholar] [CrossRef]
  25. Horváth, G.; Kawazo, K. Method for The Calculation of Effective Pore Size Distribution in Molecular Sieve Carbon. J. Chem. Eng. Jpn. 1983, 16, 470–475. [Google Scholar] [CrossRef]
  26. Seaton, N.A.; Walton, J. A new analysis method for the determination of the pore size distribution of porous carbons from nitrogen adsorption measurements. Carbon 1989, 27, 853–861. [Google Scholar] [CrossRef]
  27. Liu, K.; Ostadhassan, M.; Kong, L. Multifractal characteristics of Longmaxi Shale pore structures by N2 adsorption: A model comparison. J. Pet. Sci. Eng. 2018, 168, 330–341. [Google Scholar] [CrossRef]
  28. Cai, J.; Lin, D.; Singh, H.; Wei, W.; Zhou, S. Shale gas transport model in 3D fractal porous media with variable pore sizes. Mar. Pet. Geol. 2018, 98, 437–447. [Google Scholar] [CrossRef]
  29. Xia, Y.; Cai, J.; Wei, W.; Hu, X.; Wang, X.; Ge, X. A new method for calculating fractal dimensions of porous media based on pore size distribution. Fractals 2018, 26, 1850006. [Google Scholar] [CrossRef]
  30. Cai, J.; Wei, W.; Hu, X.; Liu, R.; Wang, J. Fractal characterization of dynamic fracture network extension in porous media. Fractals 2017, 25, 17500232. [Google Scholar] [CrossRef]
  31. Wang, F.; Jiao, L.; Lian, P.; Zeng, J. Apparent gas permeability, intrinsic permeability and liquid permeability of fractal porous media: Carbonate rock study with experiments and mathematical modelling. J. Pet. Sci. Eng. 2019, 173, 1304–1315. [Google Scholar] [CrossRef]
  32. Pfeifer, P.; Avnir, D. Chemistry in noninteger dimensions between two and three. I. Fractal theory of heterogeneous surfaces. J. Chem. Phys. 1983, 79, 3558–3565. [Google Scholar] [CrossRef]
  33. Hinai, A.A.; Rezaee, R.; Esteban, L.; Labani, M. Comparisons of pore size distribution: A case from the Western Australian gas shale formations. J. Unconv. Oil Gas Resour. 2014, 8, 1–13. [Google Scholar] [CrossRef]
  34. Sun, Z.; Zhang, H.; Wei, Z.; Wang, Y.; Wu, B.; Zhuo, S.; Zhao, Z.; Li, J.; Hao, L.; Yang, H. Effects of slick water fracturing fluid on pore structure and adsorption characteristics of shale reservoir rocks. J. Nat. Gas Sci. Eng. 2018, 51, 27–36. [Google Scholar] [CrossRef]
  35. Ghanbarian, B.; Daigle, H. Fractal dimension of soil fragment mass-size distribution: A critical analysis. Geoderma 2015, 245–246, 98–103. [Google Scholar] [CrossRef]
  36. Ghanbarian-Alavijeh, B.; Hunt, A.G. Comments on “More general capillary pressure and relative permeability models from fractal geometry” by Kewen Li. J. Contam. Hydrol. 2012, 140, 21–23. [Google Scholar] [CrossRef] [PubMed]
Figure 1. Nitrogen adsorption-desorption curve of samples of shale and mudstone.
Energies 12 00583 g001
Figure 2. Nitrogen adsorption-desorption curve of three sandstone samples.
Energies 12 00583 g002
Figure 3. The pore size distribution of shale calculated by BJH method (The peak values of pore size distribution are marked by black circles, and the corresponding pore sizes are displayed).
Energies 12 00583 g003
Figure 4. The pore size distribution of mudstone calculated by BJH method (The peak values of pore size distribution are marked by black circles, and the corresponding pore sizes are displayed).
Energies 12 00583 g004
Figure 5. The pore size distribution of sandstone calculated by BJH method (the peak values of pore size distribution are marked by black circles, and the corresponding pore sizes are displayed).
Energies 12 00583 g005
Figure 6. Relationship between average pore diameter and pore volume of shale samples.
Energies 12 00583 g006
Figure 7. Relationship between average pore diameter and BET specific surface area of shale samples.
Energies 12 00583 g007
Figure 8. Relationship between pore volume and BET specific surface area of shale samples.
Energies 12 00583 g008
Figure 9. The relationship between gas permeability and specific surface area of 3 tight sandstone samples and 1 mudstone sample.
Energies 12 00583 g009
Figure 10. The relationship between gas permeability and average pore diameter of 3 tight sandstone samples and 1 mudstone sample.
Energies 12 00583 g010
Figure 11. The curves of fractal dimension calculation for 10 shale samples.
Energies 12 00583 g011
Figure 12. The curves of fractal dimension calculation for 3 tight sandstone samples.
Energies 12 00583 g012
Figure 13. The curves of fractal dimension calculation for 1 mudstone sample.
Energies 12 00583 g013
Figure 14. Relationship between the fractal dimension D1 and D2 of shale samples.
Energies 12 00583 g014
Figure 15. Relationship between fractal dimension and specific surface area.
Energies 12 00583 g015
Figure 16. Relationship between fractal dimension and average pore diameter of all samples.
Energies 12 00583 g016
Figure 17. Relationship between porosity and fractal dimension of 3 sandstone samples and 1 mudstone sample.
Energies 12 00583 g017
Figure 18. Relationship between fractal dimension and permeability of 3 sandstone samples and 1 mudstone sample.
Energies 12 00583 g018
Table 1. The information of collected samples in this study.
Core No.Top DepthBottom DepthLithology
22069.882070.00Shale
82070.772070.87Shale
102071.082071.25Shale
172071.982072.08Shale
262073.182073.30Shale
332074.192074.35Shale
142000.782000.94Silty mudstone
53–542005.192005.40Sandstone
422028.722029.00Fine sandstone
582049.932050.09Shale
242054.122054.33Sandstone
322073.932074.19Shale
32–22073.932074.19Shale
58–22049.932050.09Shale
Table 2. Mineralogical composition results and total clay.
Core No.LithologyTotal Clay (%)Mineralogical Composition Results (%)
QuartzPotash FeldsparPlagioclase FeldsparCalciteDolomitePyrite
24Sandstone19.860.91.411.51.74.7/
32Shale24.823.32.04.71.61.142.5
58Shale35.037.20.54.5/13.59.3
53Sandstone13.361.30.311.02.411.7/
Table 3. Relative clay mineral contents and mixed-layer ratio.
Sample No.LithologyRelative Clay Mineral Contents (%)Mixed-Layer Ratio (%)
SI/SIKCC/SI/SC/S
24Sandstone/3946/15/10/
32Shale//8020////
58Shale/4041712/10/
53Sandstone/3440620/10/
Note: S: smectite; I/S: illite smectite mixed layer; I: illite; K: kaolinite; C: chlorite; C/S: chlorite smectite mixed-layer.
Table 4. The calculated specific surface area, pore volume and pore size of shale samples.
Core No.Specific Surface Area (10−2 m2/g)Pore Volume (104 cc/g)Pore Diameter (nm)
BETBJHDFTBJHDFTLangmuir VolumeWeighted Average Pore DiameterBJHDFT
228.3028.6027.6721.5814.211371.630.065.6256.556
889.8849.8867.3127.1821.061886.513.023.4144.887
1022.2216.0816.456.8085.161455.512.723.4546.079
1720.2217.3118.849.6867.641640.719.663.4146.079
2624.2420.8324.6117.5012.681134.329.039.5929.098
335.17512.946.4358.9221.625532.363.803.8349.416
588.5728.769.7759.4195.909608.944.067.81610.49
327.4746.306.8274.3593.284283.923.565.6387.310
32-28.0118.488.5519.6866.135609.547.196.54311.68
58-220.3616.3414.6812.616.21881324.763.4516.079
Average23.4518. 5520.1112.78.39833.6230.95.287.77
Table 5. The calculated specific surface area, pore volume and pore size of tight sandstone samples.
Core No.Specific Surface Area (10−2 m2/g)Pore Volume (104 cc/g)Pore Diameter (nm)
BETBJHDFTBJHDFTLangmuir VolumeAverage Pore DiameterBJHDFT
2423.7017.2323.5431.2515.362029.453.204.64429.40
4240.9042.2461.2341.1424.672624.139.796.54712.55
53-5418.6020.1730.1024.8412.041596.653.123.8268.145
Average27.7326.5538.2932.4117.362083.3748.705.0116.70
Table 6. The calculated specific surface area, pore volume and pore size of mudstone sample.
Core No.Specific Surface Area (m2/g)Pore Volume (104 cc/g)Pore Diameter (nm)
BETBJHDFTBJHDFTLangmuir VolumeAverage Pore DiameterBJHDFT
146.332.6895.73893.461037421.17.2723.8193.78
Table 7. Summary of pore parameters of 3 sandstone samples and 1 mudstone sample.
Core No.LithologyPorosity
(%)
Permeability
(mD)
BET Specific Surface Area (m2/g)Average Pore Diameter (nm)Pore Volume
(10−3 cc/g)
53–54Tight sandstone8.070.090.186453.122.48
42Tight sandstone6.490.0270.409139.794.11
24Tight sandstone8.070.0560.236653.203.13
14Mudstone1.050.00536.33072.729.35
Table 8. The upper and lower boundaries of relative pressure for fractal dimension calculation.
Core No.Upper and Lower Boundaries of Relative Pressure for Each Fractal Regime
Initial PointSegmentation PointEnding Point
20.00990.49900.9954
80.00960.30010.9896
100.01010.40350.9944
170.01000.40040.9948
260.00990.44930.9943
330.00980.39900.9953
140.00980.40030.9943
240.00990.30100.9938
320.00980.29950.9944
32-20.00950.39980.9938
420.00980.40110.9888
53-540.00960.40160.9945
580.00970.29990.9941
58-20.05450.31460.9947
Table 9. The calculated fractal dimensions of 10 shale samples.
Core No.0 < P/P0 < 0.40.4 < P/P0 < 1
K1D1 = 3 + k1R2K2D2 = 3 + K2R2
2−0.47352.52650.951−0.55612.44390.9855
8−0.89632.10370.9845−0.35922.64080.9988
10−1.331.670.9872−0.35372.64630.9877
17−0.70722.29280.9922−0.45242.54760.9958
26−0.53642.46360.982−0.61232.38770.981
33−0.74612.25390.9775−0.69242.30760.9684
58−0.76112.23890.9816−0.61472.38530.9967
32−0.96932.03070.9746---
32-2−0.38782.61220.7652−0.78562.21440.9962
58-2−1.82451.17550.9783−0.4642.5360.9923
Average−0.86322.13680.9574−0.54162.45840.9898
Table 10. The calculated fractal dimensions of three tight sandstone samples.
Core No.0 < P/P0 < 0.40.4 < P/P0< 1
K1D1 = 3 + k1R2K2D2 = 3 + K2R2
53–54−1.19521.80480.9646−0.59072.40930.9971
42−0.84742.15260.9169−0.62472.37530.994
24−1.20591.79410.9525−0.60132.39870.9611
Average−1.08281.91720.9447−0.60562.39440.9841
Table 11. The calculated fractal dimensions of one mudstone sample.
Core No.0 < P/P0 < 0.40.4 < P/P0 < 1
K1D1 = 3 + k1R2K2D2 = 3 + K2R2
14−0.45772.54230.9978−0.26382.73620.9856
Table 12. Summary of fractal dimensions and pore parameters of shale, sandstone and mudstone.
Core No.D1D2Specific Surface Area
(m2/g)
Average Pore Diameter
(nm)
Porosity
(%)
Langmuir Volume
(10−4 cc/g)
Permeability
(mD)
22.52652.44390.28330.06-1371.6-
82.10372.64080.898813.02-1886.5-
101.672.64630.222212.72-455.5-
172.29282.54760.202219.66-640.7-
262.46362.38770.242429.03-1134.3-
332.25392.30760.0517563.8-532.3-
582.23892.38530.0857244.061.3608.9-
322.03072.47420.0747423.560.8283.9-
32–22.61222.21440.0801147.19-609.5-
58–21.17552.5360.203624.76-813-
53–541.80482.40930.186453.128.071596.60.09
422.15262.37530.409139.796.492624.10.027
241.79412.39870.236653.29.82029.40.056
142.54232.73626.337.2721.057421.10.0053
Average2.11862.46450.67932.954.591571.90.0446

