Multiscale PMU Data Compression via Density-Based WAMS Clustering Analysis †


Department of Electrical and Electronic Engineering, Yonsei University, Seoul 03722, Korea
*
Author to whom correspondence should be addressed.
†
This paper is an extended version of our paper published in Proceedings of IEEE International Conference on Smart Grid Communications (SmartGridComm), Dresden, Germany, 23–27 October 2017.
Energies 2019, 12(4), 617; https://0-doi-org.brum.beds.ac.uk/10.3390/en12040617
Submission received: 21 January 2019
/
Revised: 10 February 2019
/
Accepted: 11 February 2019
/
Published: 15 February 2019
(This article belongs to the Special Issue Data Analytics in Energy Systems)
Abstract
:This paper presents a multiscale phasor measurement unit (PMU) data-compression method based on clustering analysis of wide-area power systems. PMU data collected from wide-area power systems involve local characteristics that are significant risk factors when applying dimensionality-reduction-based data compression. Therefore, density-based spatial clustering of applications with noise (DBSCAN) is proposed for the preconditioning of PMU data, except for bad data and the automatic segmentation of correlated local datasets. Clustered PMU datasets of a local area are then compressed using multiscale principal component analysis (MSPCA). When applying MSPCA, each PMU signal is decomposed into frequency sub-bands using wavelet decomposition, approximation matrix, and detail matrices. The detail matrices in high-frequency sub-bands are compressed by using a PCA-based linear-dimensionality reduction process. The effectiveness of DBSCAN for data compression is verified by application of the proposed technique to the real-world PMU voltage and frequency data. In addition, comparisons are made with existing compression techniques in wide-area power systems.
1. Introduction
Electric-power utilities have installed phasor measurement units (PMUs) for the implementation of a reliable wide-area monitoring, protection, and control (WAMPAC) system. Compared to conventional supervisory control and data acquisition (SCADA) systems, a PMU has the ability to provide global positioning system (GPS) time-synchronized phasor and frequency data. In addition, the time resolution of PMU (10–60 samples per second) is better than that of SCADA (1 sample every 2–4 s). Time-synchronized and detailed real-time information from PMUs improves an operator’s situational awareness about the power system’s behavior, such as subsynchronous resonance (SSR), which is invisible in SCADA-based monitoring systems [1].
However, in spite of advantages, there are emerging technical challenges regarding the management of PMU data. The high resolution and increasing number of PMUs yield tremendous amounts of information on wide-area power systems. According to the North American Synchro Phasor Initiative (NASPI), the number of PMUs has increased from 200 to 2500 between 2009 and 2017 in North America. For example, a system operator in southwestern North America has deployed 350 PMUs in their wide-area system over 78,000 km, and the operator receives 56 GB of data per day [2]. These huge data flows can cause congestion in the communication system and increase data-storage costs. From this perspective, numerous approaches have been proposed to reduce the size of PMU data, as well as to preserve information of power-system dynamics as much as possible.
Existing data-compression techniques can be categorized into individual and comprehensive compression. Individual-compression methods usually reduce the size of a single PMU data stream. First, application of real-time compressive sensing tries to directly reduce the number of measured samples. In Reference [3], subspace pursuit (SP)-based compressive sampling was applied in order to save frequency bandwidth. Similarly, exception compression and swing-door trending is combined for real-time compressive sampling [4]. Wavelet analysis is another efficient tool to extract time-varying features due to power-system dynamics, and to reduce noise components in high-frequency sub-bands. The fundamental application of wavelet analysis to compress PMU data is presented in Reference [5], including event analysis. In addition, authors in Reference [6] proposed the application of an embedded zerotree wavelet, which was developed for image-data compression.
On the other hand, the approaches of comprehensive compression exploit the similarity between PMU signals that originated from the electrically coupled structure of the power systems. Principal-component analysis (PCA) and singular-value decomposition (SVD) are generally adopted to reduce the dimensionality of an aggregated PMU dataset. An application of PCA for PMU data in steady state is presented in Reference [7]. Two kinds of power-system conditions, ambient and event state, are considered when compressing PMU data by using PCA [8]. An application of PCA to detect a power-system event and to reduce dimensionality is proposed in Reference [9]. An SVD based approach for missing-data recovery process and data compression is proposed in Reference [10]. Authors in Reference [11] proposed a compression process by using PCA, followed by DWT (Discrete Wavelet Transform) and DCT (Discrete Cosine Transform) based coefficient thresholding.
Individual compression methods are specifically designed to a signal data stream, which implies that spatial sparsity from similarity cannot be exploited well. Comprehensive approaches can achieve a high compression ratio, but there can be significant distortions because PCA and SVD are linearized analysis between signals. Moreover in the case of wide-area power systems, components consisting of power systems may exhibit different responses to an event such as disturbances, local control, and changes in topology. Thus, linearized methods are able to yield huge distortion in local PMU signals [12,13].
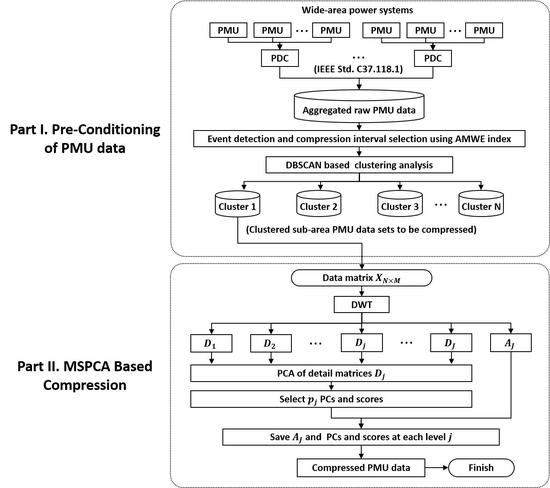
In this paper, a data-compression technique for wide-area power systems is proposed considering both individual and comprehensive characteristics. The desired performance criteria are efficiency (averagely high and adaptive compression ratio) and robustness (averagely low and consistent reconstruction error). For the first part, PMU data aggregated from wide-area power systems are preconditioned: compression-interval selection, bad-data exception, and clustering into correlated subdatasets. In this part, the average value of modified wavelet energy (AMWE) and density-based spatial clustering of applications with noise (DBSCAN) are applied. In the next part, the preconditioned datasets are then compressed using multiscale PCA (MSPCA), which is a combined technique of wavelet analysis and PCA.
The organization of the rest of this paper is as follows. In Section 2, the motivation of our compression method is proposed by investigating real-world PMU data. Section 3 describes in detail the proposed PMU data-compression process, and Section 4 provides our efforts to set predefined parameters. The results of real-world data compression are presented in Section 5. Section 6 concludes this research.
2. Characteristics of Real-World PMU Data
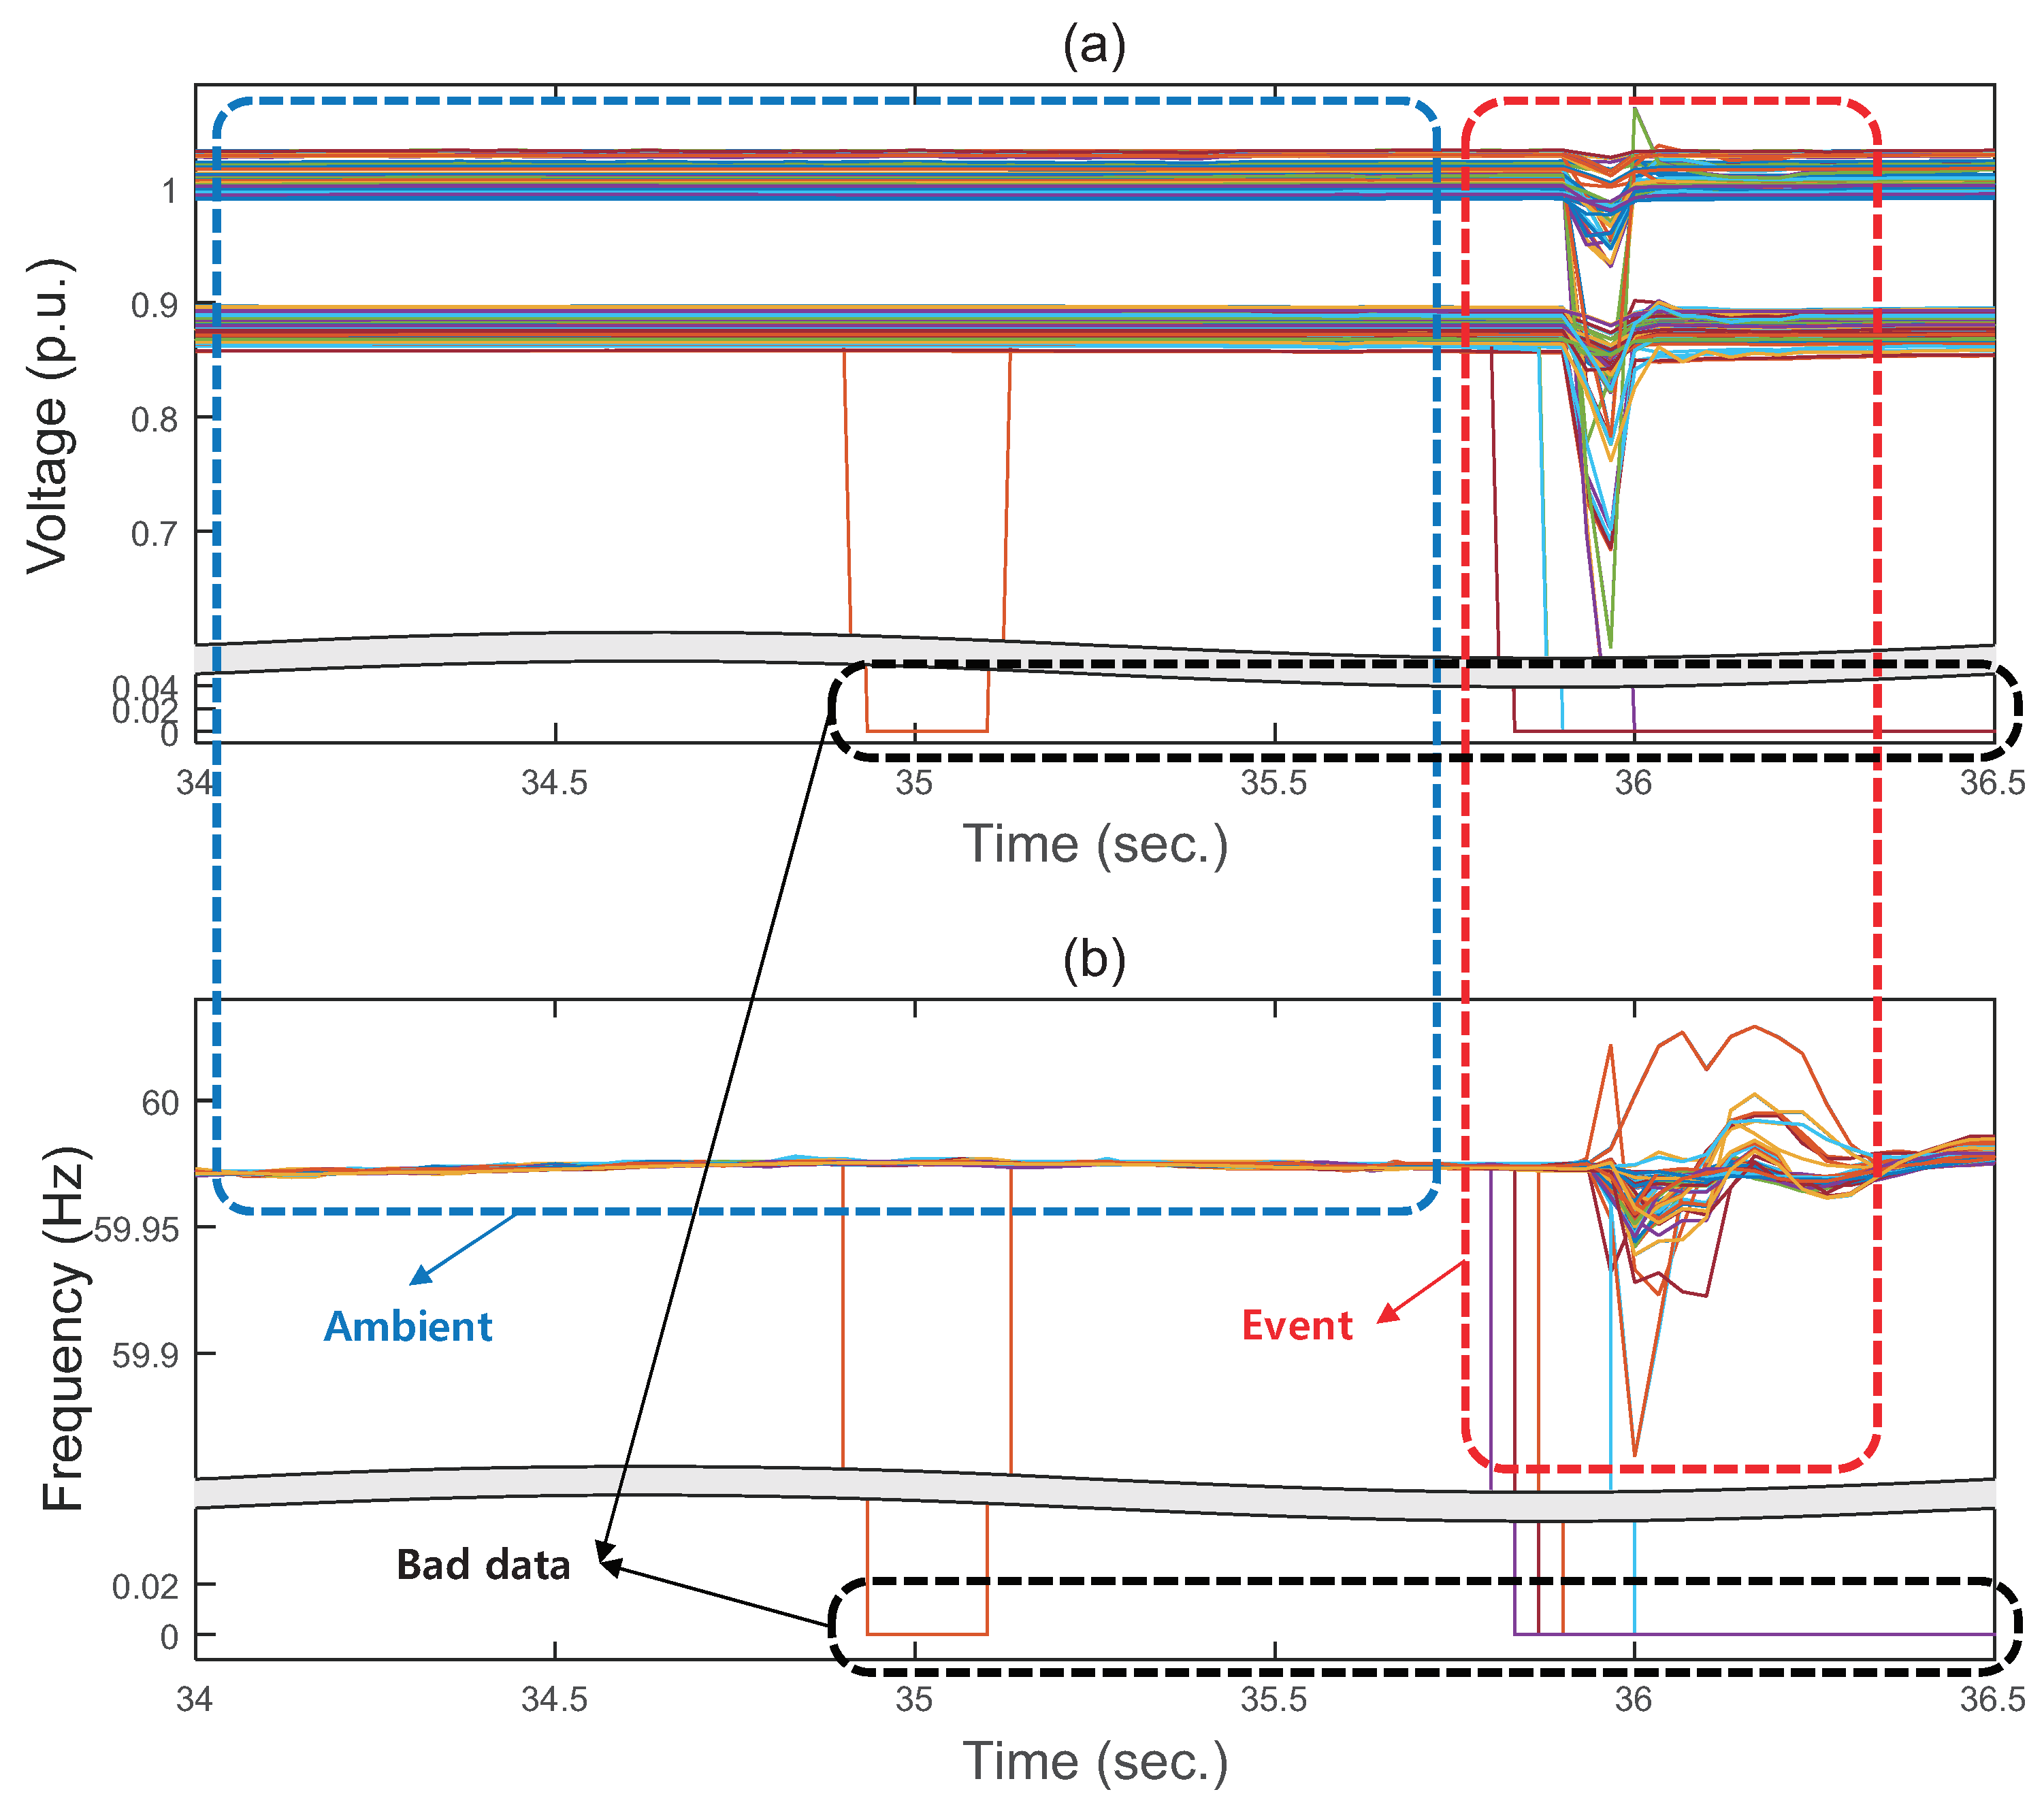
As preliminary work, we investigated the representative characteristics of real-world PMU data in wide-area power systems. Figure 1 shows a set of 194 real-world PMU signals containing an event caused by a transformer bank trip.
In ambient state (before the event), a noticeable point is that voltage and frequency signals have low variation, and signals are highly correlated for a long period. The low variation can be interpreted as temporal sparsity that can be extremely positive when applying individual compression. On the other hand, correlation between signals comes from the fact that grid components such as transmission lines and transformers are electrically coupled. This characteristic in the ambient period can be expressed as spatial sparsity. Therefore, dimension-reduction methods such as PCA and SVD can effectively reduce the size of aggregated PMU data because the distribution of correlated signals can easily be linearized due to spatial sparsity.
However, in the event state (around 36 s), signals show huge and disparate variations during the event in a short period. The duration and occurrence of events are also usually unpredictable. Voltage and frequency exhibit local characteristics such as different levels of voltage drop, oscillation, and frequency response. This uncorrelated signature of PMU data from a wide area contains information that is important for further PMU applications, such as system-operation decision [14], event detection/identification [15,16], fault location [17], monitoring/control of renewable resources [18], and stability analysis [19,20].
Furthermore, there exist missing data that are defined as bad data in both ambient and event periods. Bad data are one of the most challenging obstacles for real-world PMU applications such as state estimation (SE) [21]. The occurrence of bad data results from measurement errors, loose connection of PT (Potentail Transformer) and CT (Current Transformer), GPS malfunction, and communication failures. Bad data should be excluded because they can cause significant distortions when applying compressive sampling or dimensionality reduction.
Thus, reflecting these characteristics of real-world PMU data, our strategy for designing a compression technique was as follows:
- The technique automatically clusters PMU signals into correlated subdatasets for the accurate reduction of dimensionality and exception of bad data.
- In an ambient period, a high compression ratio is applied to the clustered PMU dataset using redundancies between PMU signals over a long duration.
- In an event period, the clustered PMU dataset is compressed with high accuracy to preserve the individual transient phenomena that arise.
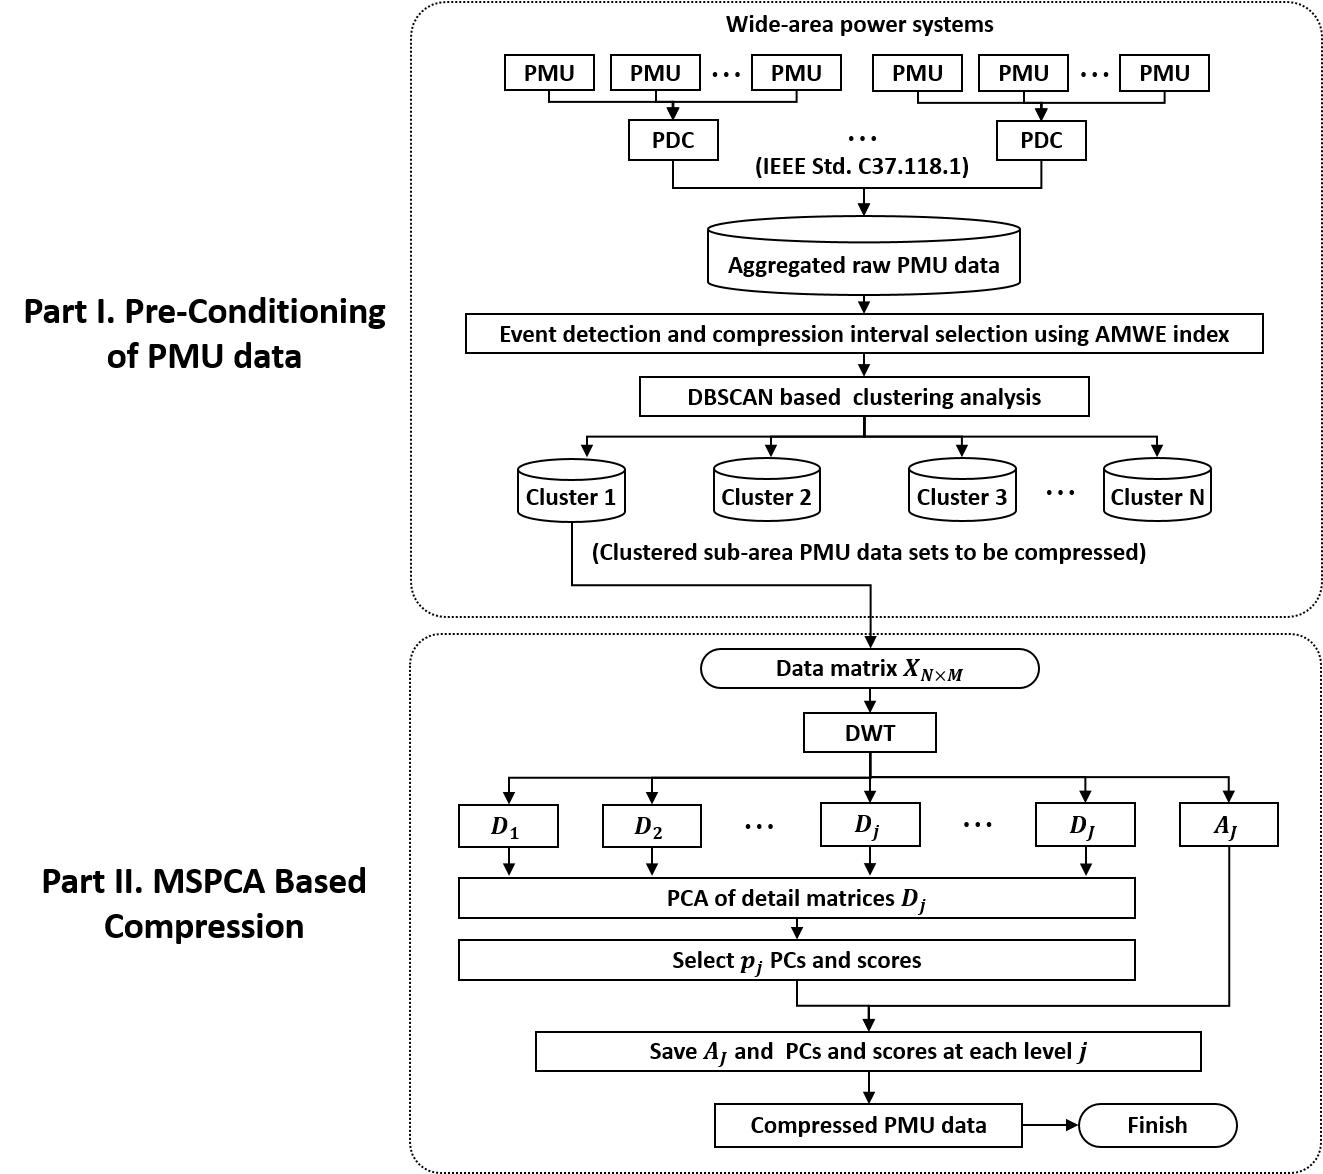
To satisfy the requirements listed above, a framework for a PMU data-compression algorithm was designed, as illustrated in Figure 2. The aggregated PMU dataset from a wide-area power system was monitored to detect an event and bad data. The importance of selecting compression interval considering event detection was discussed in References [9,11,22] because abnormal variation caused by an event can yield significant distortion in dimensionality reduction. In this paper, event detection is implemented using modified wavelet energy (MWE), proposed in Reference [15]. In ambient periods, long-term PMU data are collected for ambient dataset. When an event is detected, the data of a short period around the event are defined as an event period [22]. The interval-selected dataset is then partitioned by using DBSCAN so as to segment the dataset into correlated subdatasets except for bad data.
The targeted data types in PMU data are magnitude and frequency data that involve correlated characteristics over entire wide-area power systems. Phase data are not covered in this paper, because phase data have wrapping points around . Wavelet decomposition and PCA-based dimensionality reduction of phase data can cause significant distortion in wrapping points. Therefore, application of the proposed method to phase data remains as future work, and compression performance of magnitude and frequency data is provided.
3. Framework for PMU Data Compression
3.1. Preconditioning of PMU Data
3.1.1. Event Detection and Compression Interval Selection
As described in Figure 2, compression intervals are selected according to power-system conditions, ambient and event. This event-detection method utilizes an index of modified wavelet energy that was developed in Reference [15]. In this work, the average value () was adopted for all monitoring of wide-area power systems. When M is the number of PMUs, is the monitoring window size, decomposition level is , and the of a current time n is defined as
where is the number of wavelet coefficients at level j, and is a detail coefficient of the m-th PMU at level j and time translation factor k. The AMWE-based event-detection and compression-interval selection results can be referred in Reference [22]. Interval-selected datasets for ambient and event states are then clustered into correlated subdatasets using DBSCAN.
3.1.2. PMU Data Clustering Using DBSCAN
The objective of clustering PMU data is grouping correlated PMU signals so as to guarantee efficient and accurate dimensionality reduction in the compression part. The interval-selected PMU data are partitioned by using an unsupervised clustering algorithm. Unsupervised clustering has been utilized to improve WAMS by application of PMU data-driven analysis. Fuzzy k-means was adopted to segment wide-area power systems for dynamic vulnerability assessment [23]. Authors in Reference [24] used agglomerative hierarchical clustering to classify and identify events by using historical PMU data. DBSCAN-based calibration of PMU data was proposed in Reference [25]. In this work, DBSCAN was chosen for automatically partitioning PMU data because of the two following reasons.
First, DBSCAN does not require the user to predefine the number of clusters [26]. A realistic limitation to apply a clustering algorithm such as k-means and hierarchical clustering is to determine the optimal number of clusters. However, the optimal number of clusters can change according to power-system conditions. As shown in Figure 1, in an ambient state, many clusters are not required because PMU signals are already highly correlated. In the event state, on the other hand, a relatively large number of clusters are needed to reflect disparate responses of local areas. If the predefined parameters are well-designed, DBSCAN can adjust the number of clusters based on distribution of the current dataset. In the ambient state of power systems, a small number of clusters are formed by DBSCAN, thereby increasing compression-ratio performance. In the event state, a large number of clusters are adaptively constructed in order to prevent distortions in dimensionality reduction by grouping correlated subdatasets.
Second, DBSCAN can automatically except for outliers such as missing and noisy data. In DBSCAN, outliers do not construct a different cluster from k-means and hierarchical clustering. The excepted few bad data or uncorrelated data remained without compression in this work.
The DBSCAN algorithm requires two preset parameters, epsilon (), which specifies how close points should be to each other to be considered a part of a cluster; and , which specifies how many neighbors a point should have to be included in a cluster. In order to interpret the DBSCAN algorithm, the following definitions are needed [26]:
- -neighborhood: points within an from a point p.
- Core point: a point of which the -neighborhood contains at least of points.
- Border point: a point has neighbor points within a fewer than , but is the neighbor of a core point.
- Directly density-reachable: a point q is directly density-reachable from a point p if q is within the -neighborhood of p, and p is a core point.
- Density-reachable: a point p is density-reachable from q with regard to and if there is a chain of objects with , , such that is directly density-reachable from with regard to and for all .
- Density-connected: a point p is density-connected to object q with regard to and if there is a point o, such that both p and q are density-reachable from o with regard to and .
- Cluster C in a set of points D with regard to and is a nonempty subset of D, such that
- -
- Maximalirty: for all , if , and if q is density-reachable from p with regard to and , then .
- -
- Connectivity: for all , p is density-connected to q with regard to and in D.
- Outliers: points that are not directly density-reachable from at least one core point.
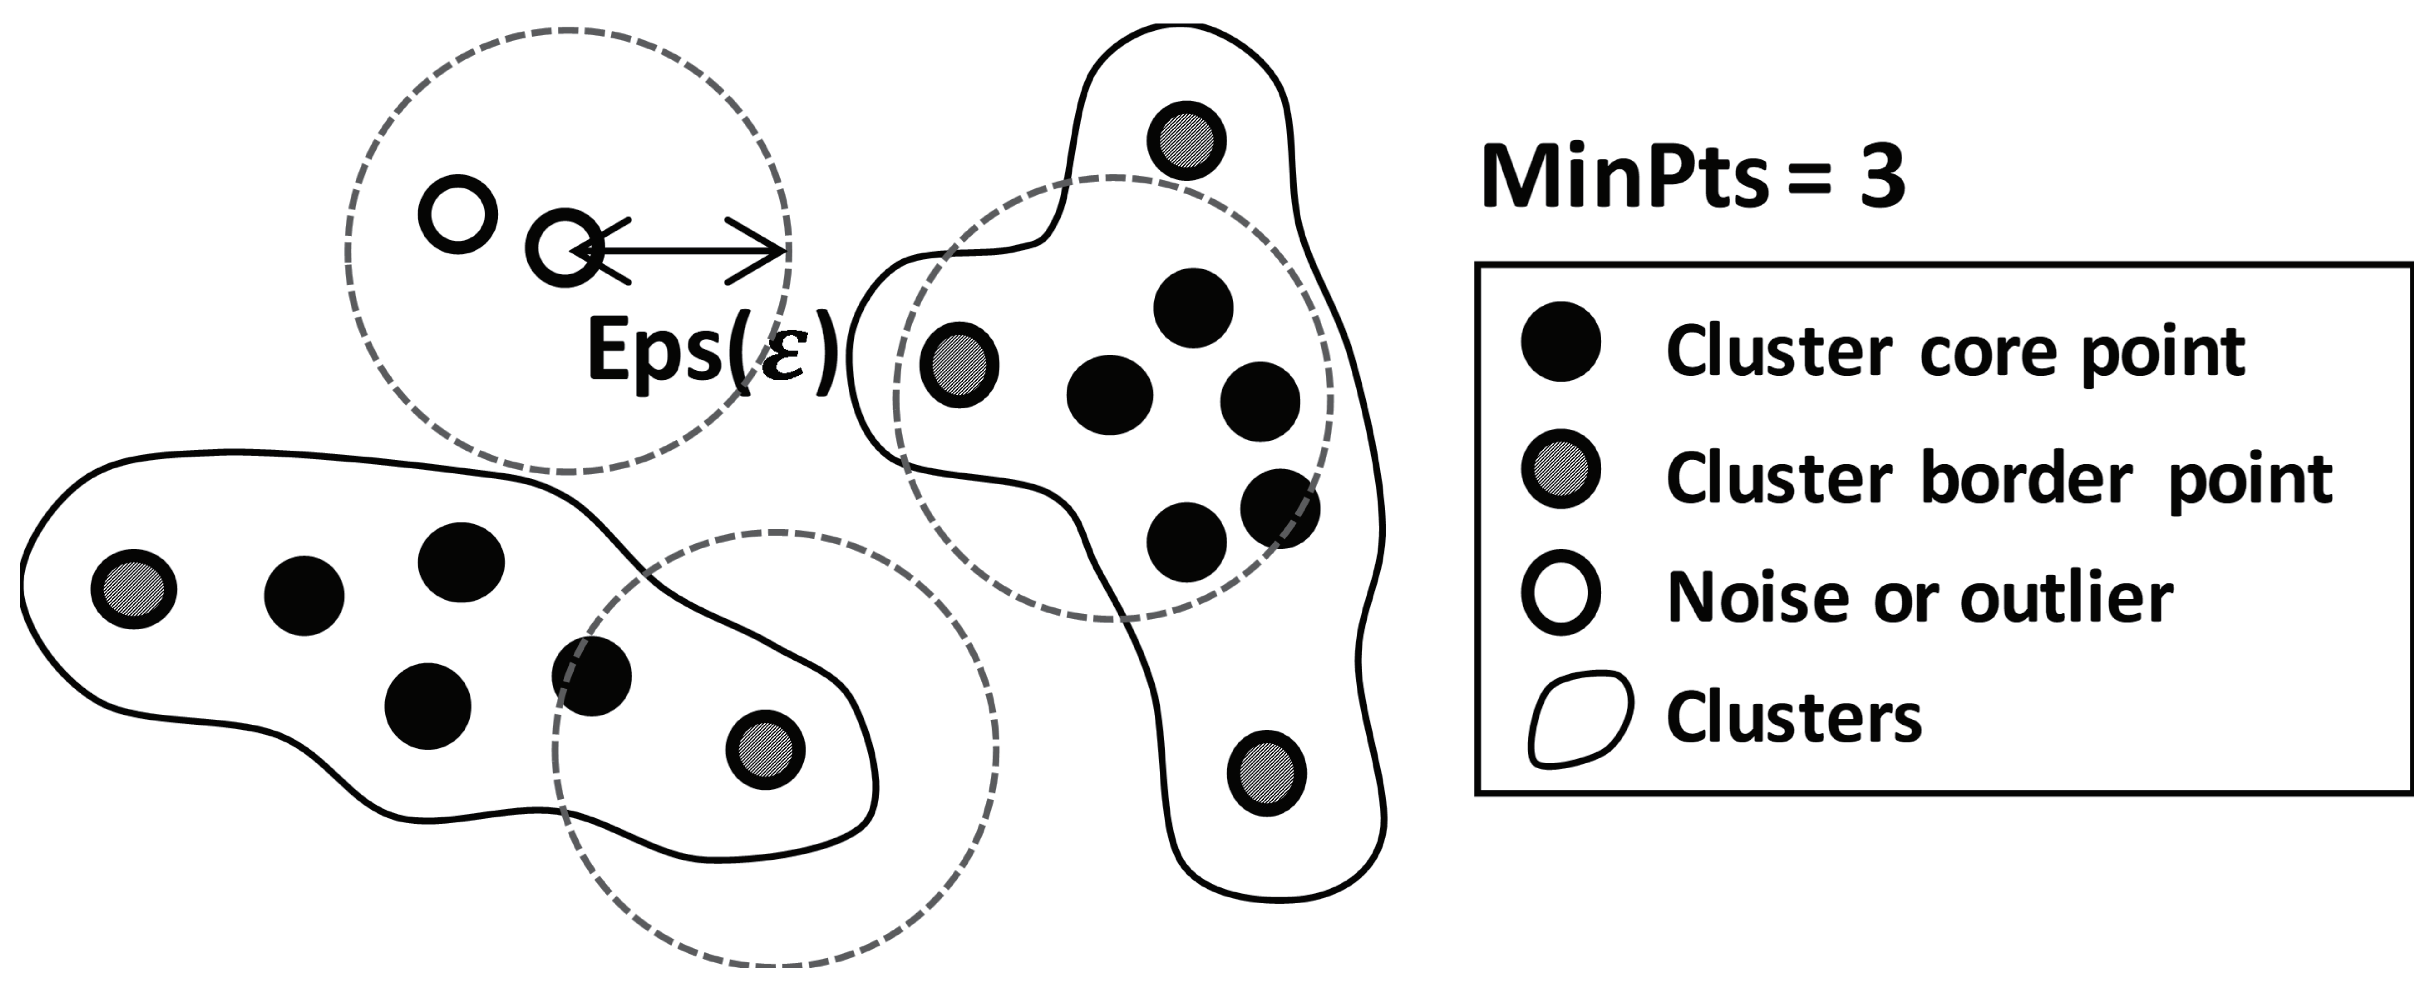
The basic example of clustered points using the DBSCAN algorithm is depicted in Figure 3. A point of which the neighbors contain at least points within is determined as a core point. A border point is a point that has neighbor points within that are fewer than , but is the neighbor of a core point. Core points that are each other’s neighbor construct a cluster until border points are included. Notice that the number of clusters are not predefined, and the cluster boundary can have an arbitrary shape. Outliers are points that are neighbors neither of a core point nor a border point. The outliers are excepted and do not construct a cluster. In the compression framework in this paper, clustered points correspond to segmented PMU signals, while the outliers are PMU signals containing bad data. Details for the DBSCAN algorithm can be found in Reference [26].
3.2. Data Compression via MSPCA
Clustered subdatasets using DBSCAN are then compressed using MSPCA-based multiscale dimensionality reduction. For each data type, a clustered subdataset is formed as an M by N data matrix X, where M is the number of PMU signals, the dimensionality of the data matrix, with N measurements.
Data matrix X is then decomposed into multiscale by discrete wavelet transform. The operation matrix of wavelet transform is defined as
where is the scaling-function matrix, and is the wavelet-function matrix at each decomposition level j [27]. The decomposed sub-band matrices are represented as Equation (3), where is an approximation submatrix, and is a detail submatrix at scale j, respectively.
In the sub-band matrices (, for ), the time-varying features of PMU signals are extracted in multiscale. The approximation coefficients include significant individual characteristics with the fewest samples in the lowest frequency sub-band, while the detail coefficients capture information about abrupt changes and noise with the large number of samples in the high-frequency sub-bands [28]. Since the approximation matrix reflects the individual characteristics of each PMU signal, such as voltage level, trends in frequency, and unique local variations, approximation matrix is retained without dimensionality reduction. On the other hand, detail matrices () contain information on global variations and include unnecessary components, such as measurement noise. Similarity due to global variations over high-frequency sub-bands allows the dimensionality of a detail submatrix to be reduced via PCA by deriving a new basis for the effective representation of data distribution.
In order to conduct PCA of a detail matrix , the eigenvalue decomposition of a covariance matrix of is calculated. The eigenvectors are a new orthogonal basis of . By rearranging the eigenvectors in decreasing order of corresponding eigenvalues, the detail matrix is represented as a linear combination as follows:
where T is the detail matrix projected onto a space spanned by P. Each column of P is called a principal component (PC), and each column T is determined as a score. As noted above, the variance of is equal to , so that total variance .
Thus, it is possible to reduce dimensionality by selecting the first few PCs in high order, which are sufficient to represent variances of the original detail matrices. A bound for selecting k PCs is determined by
where is the percentage cumulative variance () of the k-th PC, is an eigenvalue of the m-th PC, and is bound, respectively [8,9]. The number of PCs k needed to satisfy Equation (5) are decided from the distribution in each detail matrix.
Following multiscale dimensionality reduction, the approximation matrix, selected PCs, and corresponding scores at each scale are saved to a database. For analysis or data transmission, the compressed data can be reconstructed via linear combination of the stored PCs and scores using Equation (4) followed by inverse discrete wavelet transform (IDWT) [28].
3.3. Performance Evaluation
Performance-evaluation parameters are applied in order to evaluate the reduction in data size, and the accuracy of the compressed data. The parameter for evaluating data reduction is the compression ratio () [9], defined as follows:
The resulting from multiscale data compression can be directly calculated as follows:
where is the number of PCs to be saved at each decomposition level j, which is obtained by Equation (5). Equation (7) adaptively derives the , reflecting the underlying dimensionality at each scale. As the accuracy parameter, normalized mean squared error () was used. In this approach, the accuracy of a reconstructed signal is assessed at selected interval sizes [9]. The of the m-th PMU is defined as follows:
where is the original data sequence of the m-th PMU, and is the reconstructed data sequence, respectively. The average and maximum values of the are used to construct a comprehensive evaluation of accuracy. There is a trade-off relation between and [11]; a condition of the robustness of PMU data compression is that the should be adaptive to the state dataset, whereas the should be maintained at a low level regardless of conditions.
4. Experiments
In this section, the process of selecting predefined DBSCAN and MSPCA parameters is described, and application results are provided with a comparison with existing PMU data-compression approaches.
4.1. Selecting DBSCAN Density Parameters
Density parameters should be carefully chosen because clustering performance is sensitive to them. There is no general way to choose parameters. Thus, they should be set by a deeper understanding of the given real-world PMU data.
The more is set as a small value, the more the DBSCAN process sensitively constructs the clusters. This implies that should be set as small as possible in order to reflect unpredictable power-system dynamics and group the few correlated PMU signals in a local area. In practice, must be larger than 2. is not appropriate because every point is already a cluster. In addition, DBSCAN with a setting of is exactly equivalent to hierarchical clustering. Therefore, is set as 3.
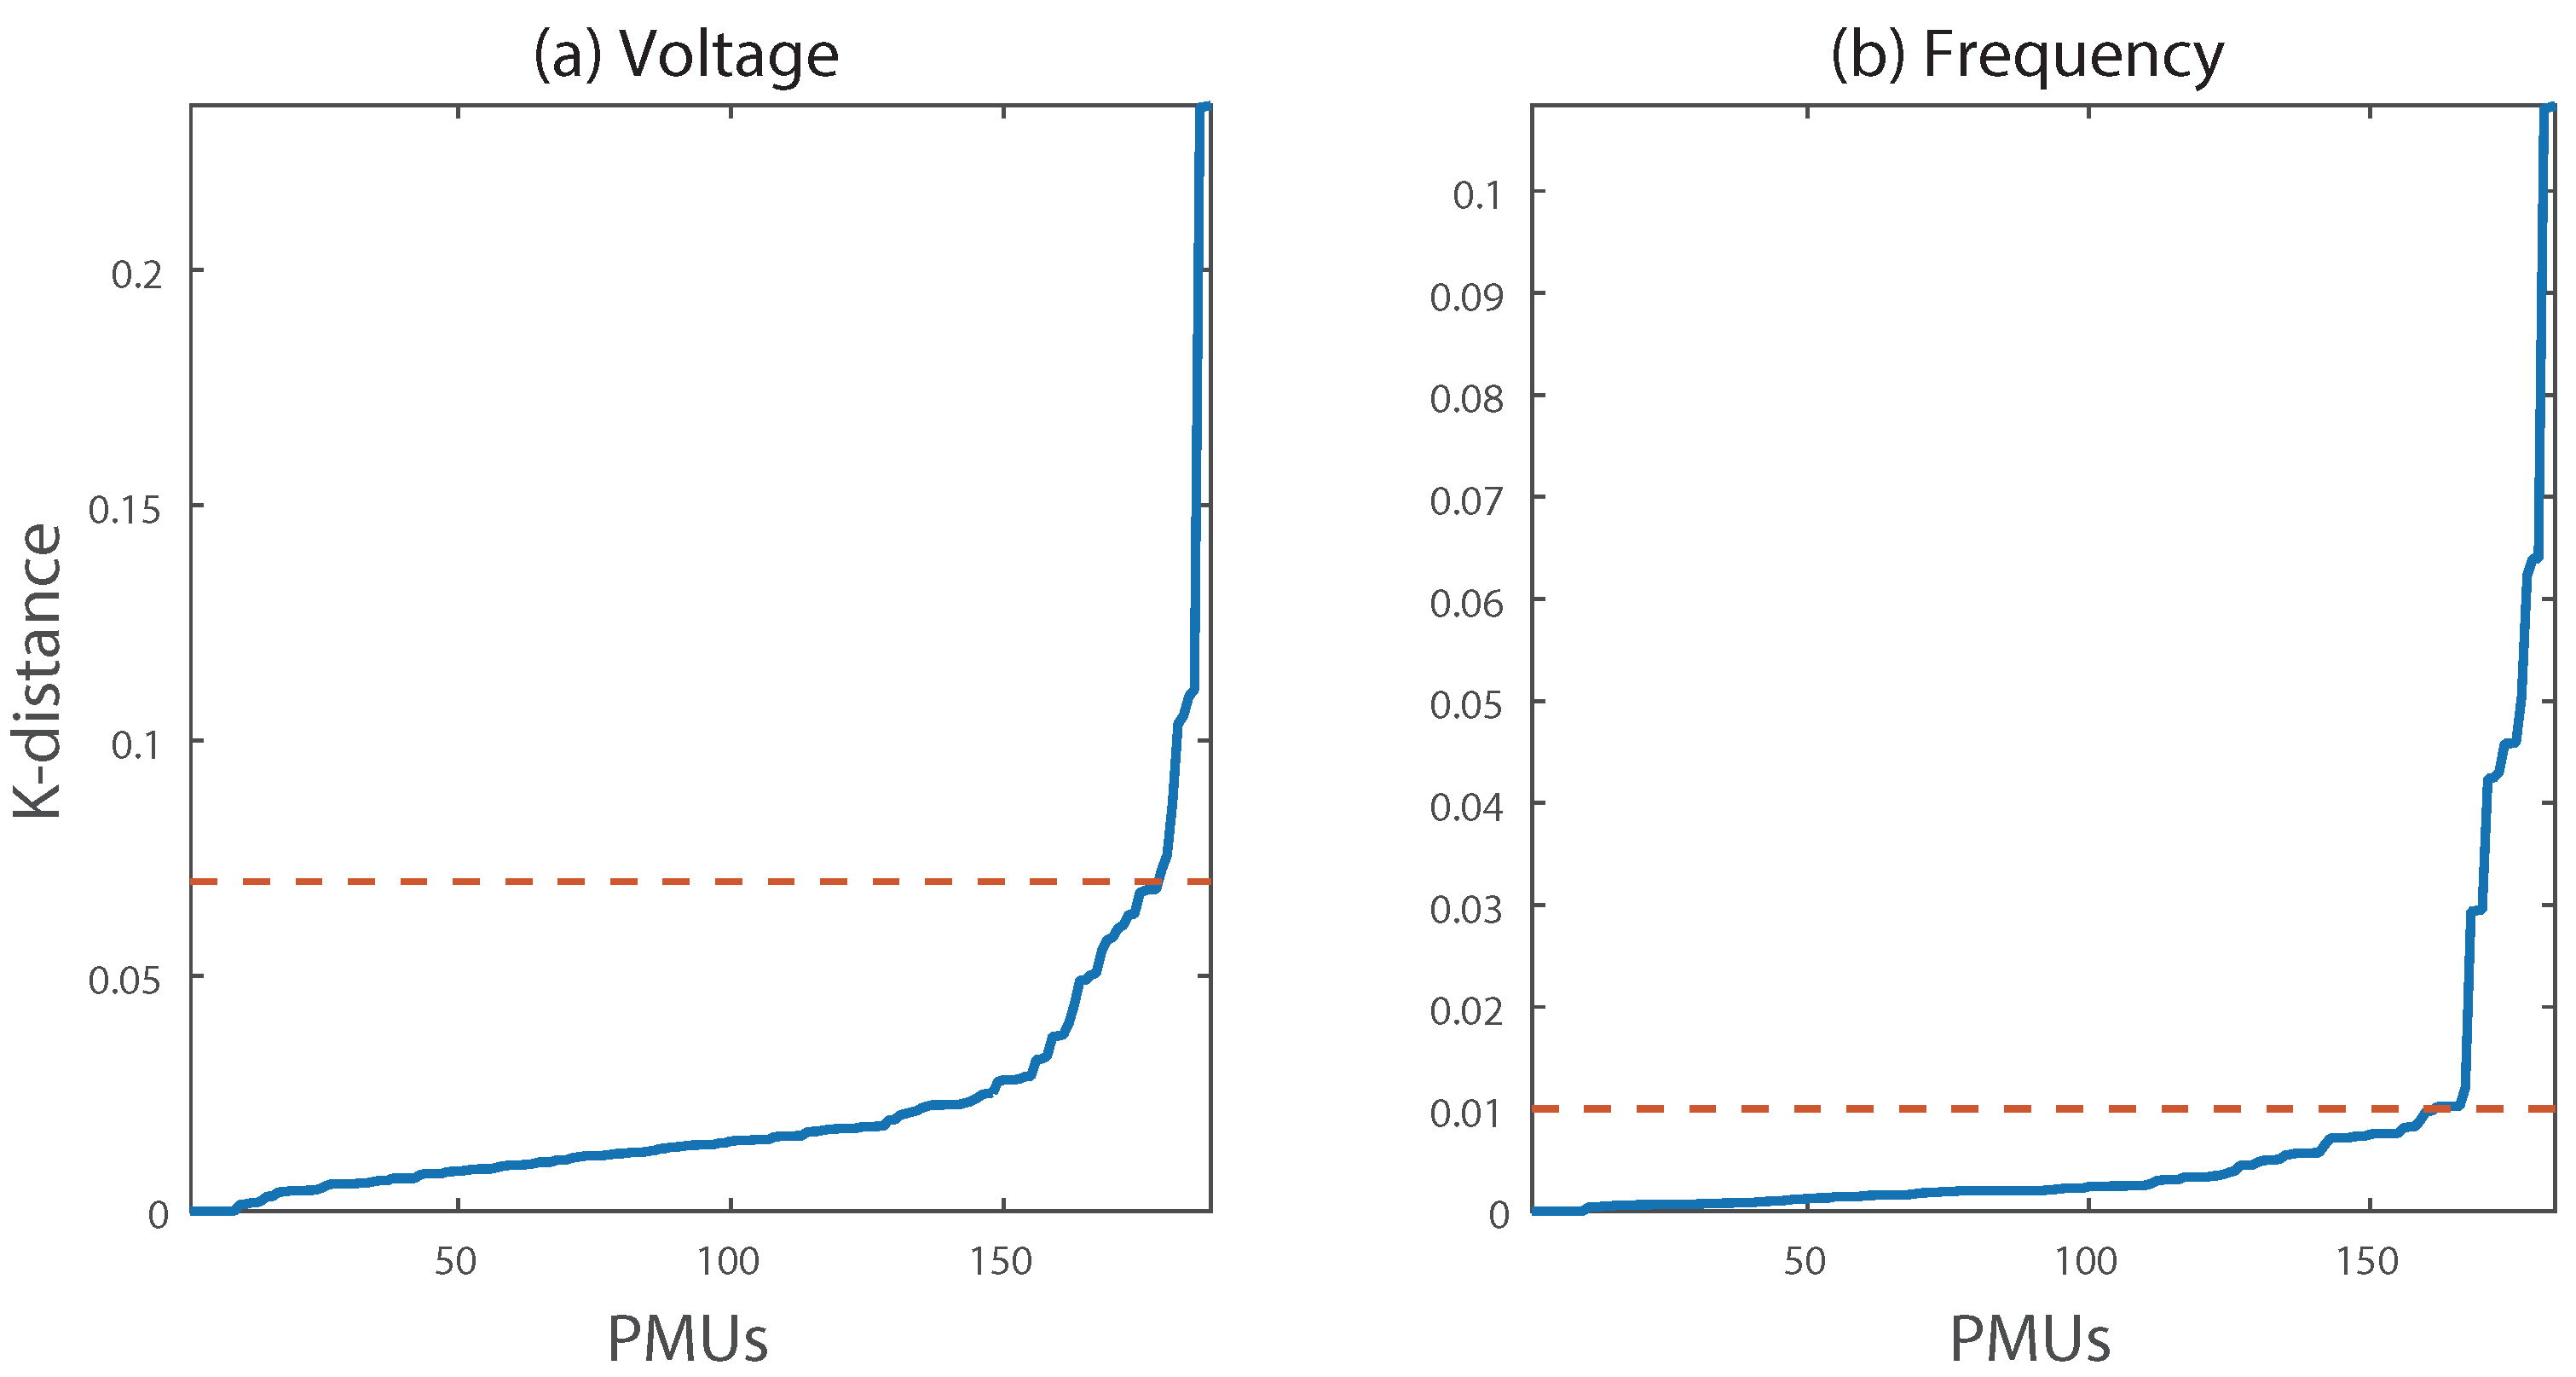
In the case of setting , k-distance analysis of PMU data is conducted for each type of data, as shown in Figure 4. For consistent setting and understanding of the density distribution of PMU data, PMU signals of a 24 h involving event and ambient states are utilized when computing k-nearest neighbors (k-NN). Given , Euclidean distances of the k-nearest neighbor are then rearranged in increasing order. By capturing a point where a slope suddenly changes, k-distance at that point is selected as because most PMU signals are neighboring with respect to and . In this paper, a threshold of determining is an inclination of 0.01. From this analysis, 0.07 and 0.01 were set as for voltage and frequency signals, respectively.
4.2. MSPCA Parameter Setting
In order to decide the for different types of PMU data, the characteristics of both voltage and frequency signals were investigated using real-world data. If a type of PMU data in the detail matrices carries a large amount of information, should be set at a high value to preserve significant information. Therefore, energy contribution () is used to compare the portion of wavelet coefficient energy in the detail matrices with the total energy of the original signal. is defined as follows:
The of the voltage and frequency signals is analyzed over a 24 h period of data as presented in Table 1. As can be seen, the of the voltage signal is higher than that of the frequency signal. This is because voltage is a local variable, whereas frequency is a global variable [8]. Voltage is subject to global operations as well as local operations, which leads to large variations in features. However, variation in frequency should be small to ensure the stability of a power system. Thus, in this research, the bound of voltage was given a higher value than that of frequency. However, when an event is detected, the bound is set at the extreme value for both types of data in order to capture individual transient phenomena.
5. Application to Real-World Data
In this section, the proposed PMU data-compression process is applied to real-world wide-area power systems.
5.1. Evaluation of Proposed Method by Application
Figure 5 describes the DBSCAN-based clustering results of frequency signals in event state in Figure 1. The original signals involve event information, as well as seven signals including bad data, as shown in Figure 1a. By applying DBSCAN, 11 signals were excepted as outliers, and every seven signals including bad data were successfully removed (Figure 5b). Meanwhile, 183 other signals constructed clusters, Clusters 1–6, as can be seen in Figure 5c–h. A notable point is that 163 PMU signals were clustered into Cluster 1 because frequency is a global parameter. A high compression ratio for Cluster 1 was expected because of its large number of PMU signals and correlated signature. However, PMU signals in a local area depart from the main grid and exhibit individual responses to the event. Thus, few PMU signals correlated to each other were clustered into Clusters 2–6. In these clusters, low compression ratios were expected due to few dimensionalities to be compressed. However, the low compression ratios do not significantly influence the entire compression performance.
While in the ambient state, there was one signal containing bad data. This PMU signal was successfully excepted as outlier, and this signal was not compressed. In addition, 193 other PMU signals were aggregated as Cluster 1, which implies that the compression ratio could be expected to be high.
A clustered subdataset was decomposed by wavelet transform, and PCA was applied to detail matrices (). The mother wavelet and decomposition level used for multiscale decomposition of the data matrix were set at db2 and 5, respectively. In Reference [5], the db2 wavelet and decomposition level 5 were shown to the optimal result for the maximum value of the wavelet energy used as an indicator of information in PMU data.
The numerical results of all clusters for voltage and frequency signals are summarized in Table 2 and Table 3. In the ambient period, signals containing bad data were excepted as outliers, and voltage and frequency datasets were compressed with a of 18.22 and 15.37, respectively. In the event period, bad data were also successfully removed, and there were five clusters for voltage and six clusters for frequency. The large number of clusters in the event period was derived from the fact that PMU signals were uncorrelated due to the unique responses of the local area. Voltage signals construct dispersed clusters compared to frequency signals (see Clusters 1 and 3), because voltage is a local variable, as discussed in Section 3. In addition, the s of clusters in event state had low values, as expected in Figure 5. This originated from a large number of PCs being selected for both types of data to capture the transient phenomena. Note that the results of a high in ambient state and low in event state exactly match with the compression strategy presented in Section 2.
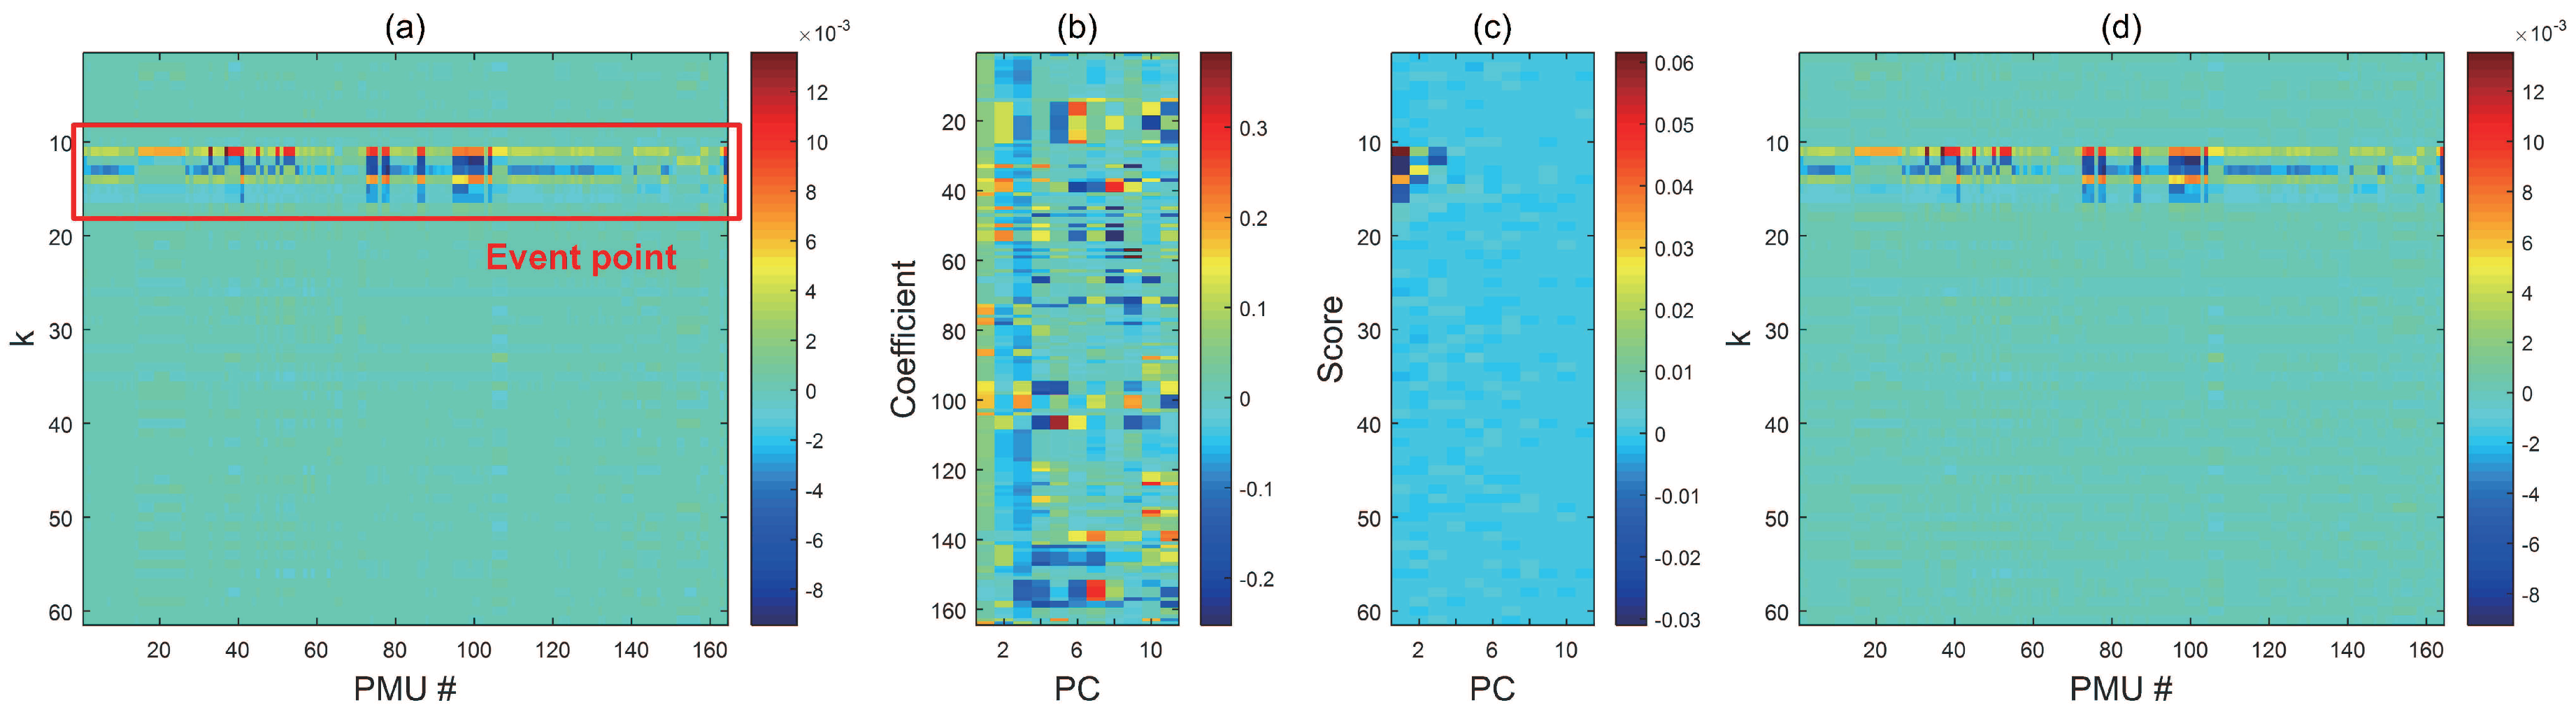
To allow visual interpretation, the dimensionality reduction and reconstruction process of a detail matrix is depicted in Figure 6. Figure 6a shows the original detail matrix () of the Cluster 1 frequency dataset. The global influence of the event was well-captured by the large detail coefficients. In addition to these global characteristics, the detail coefficients of the PMU signal showed individual characteristics. As a result, ten PCs accounted for 99.99% of the total variance. By selecting these PCs, the original dimensionality of 165 was reduced to 10. The selected PCs and corresponding scores are shown in Figure 6b,c. The reconstructed detail matrix is shown in Figure 6d. It can be seen that the information of the original matrix was well-retained. Reconstructed matrix can then be obtained in the time domain through IDWT.
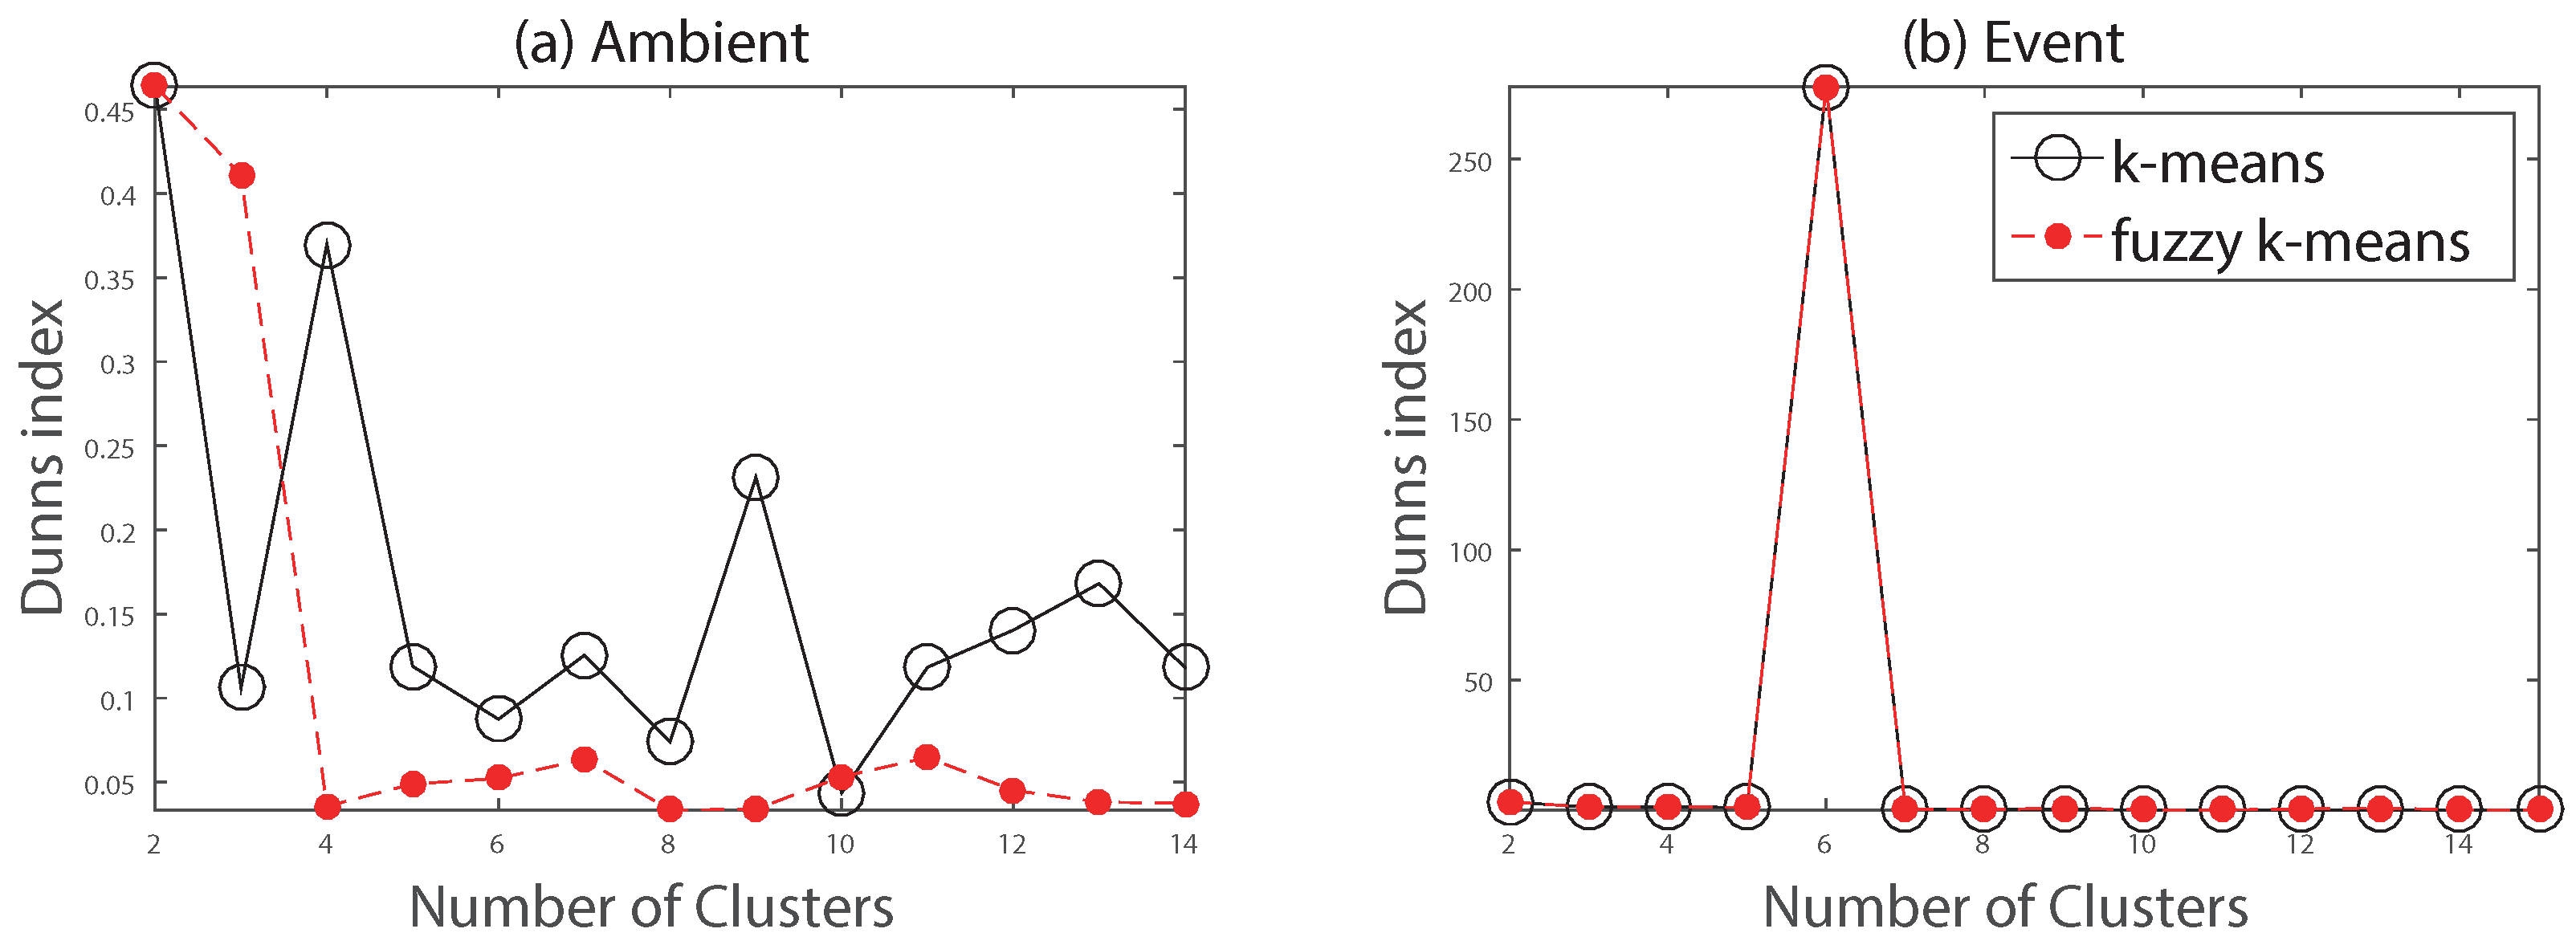
For the evaluation of a DBSCAN-based procedure, other clustering methods, such as k-means clustering and fuzzy k-means clustering, are analyzed. Figure 7 shows the Dunn index (DI) of frequency signals, an indicator of clustering performance [29], according to the different number of clusters. A higher DI implies a dataset is well-clustered. As shown in Figure 7a, two clusters are the optimal number of clusters for an ambient dataset. On the other hand, five clusters are optimal in an event period, as shown in Figure 7b. One can see that, though both k-means and fuzzy k-means require numerous iterations to find the optimal number of clusters, DBSCAN automatically provided the optimal number of clusters, as summarized in Table 3, using the preset density parameters as discussed in Section 4.
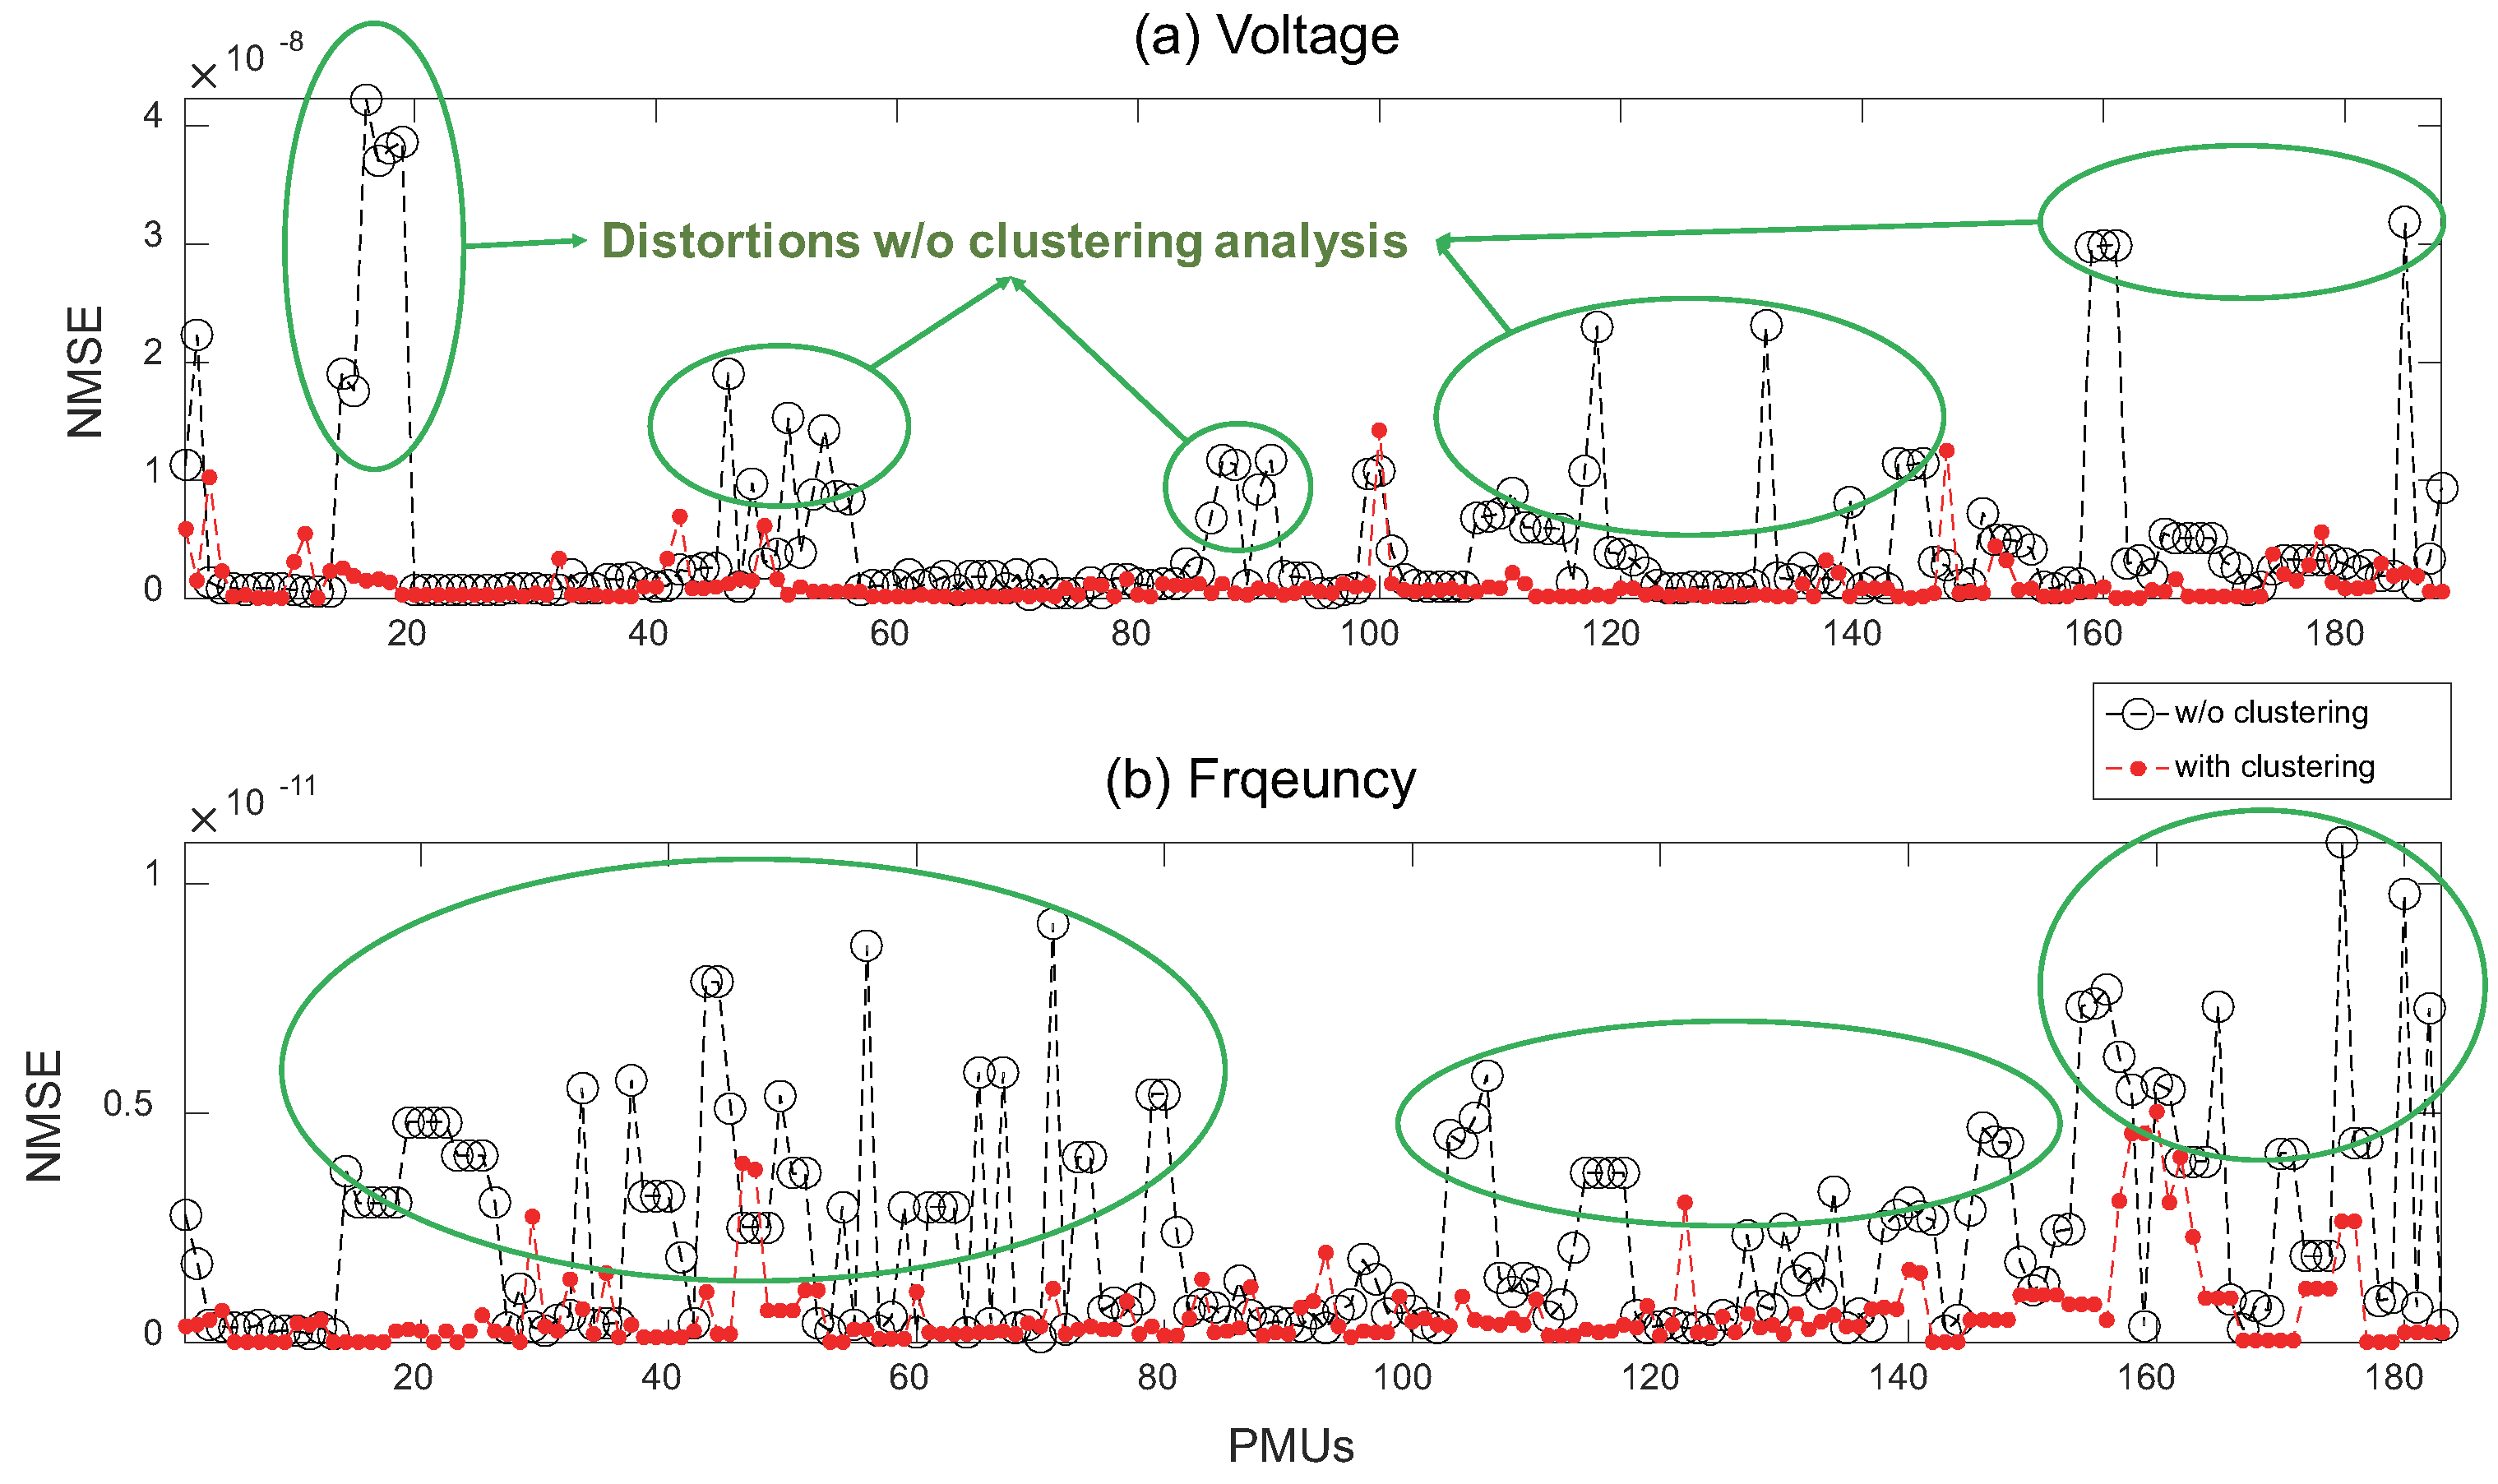
Reconstruction results with and without clustering analysis are depicted in Figure 8, which shows the values of every PMU signal in the event period. Without clustering, huge distortions (green circles) were observed in PMU signals as peaks in black circles. This implies that, though MSPCA first extracts individual characteristics by wavelet decomposition, linearized PCA can ignore each piece of event information in high-frequency sub-bands. However, by clustering analysis, these distortions are significantly reduced by partitioning the original dataset into correlated subdatasets. As a result, values with clustering (red dots) were low and relatively even when compared with results without clustering. Therefore, it is confirmed that clustering analysis before compression can improve reconstruction accuracy and guarantee the preservation of local phenomena in wide-area power systems.
5.2. Comparison with Existing Approaches by Case Studies
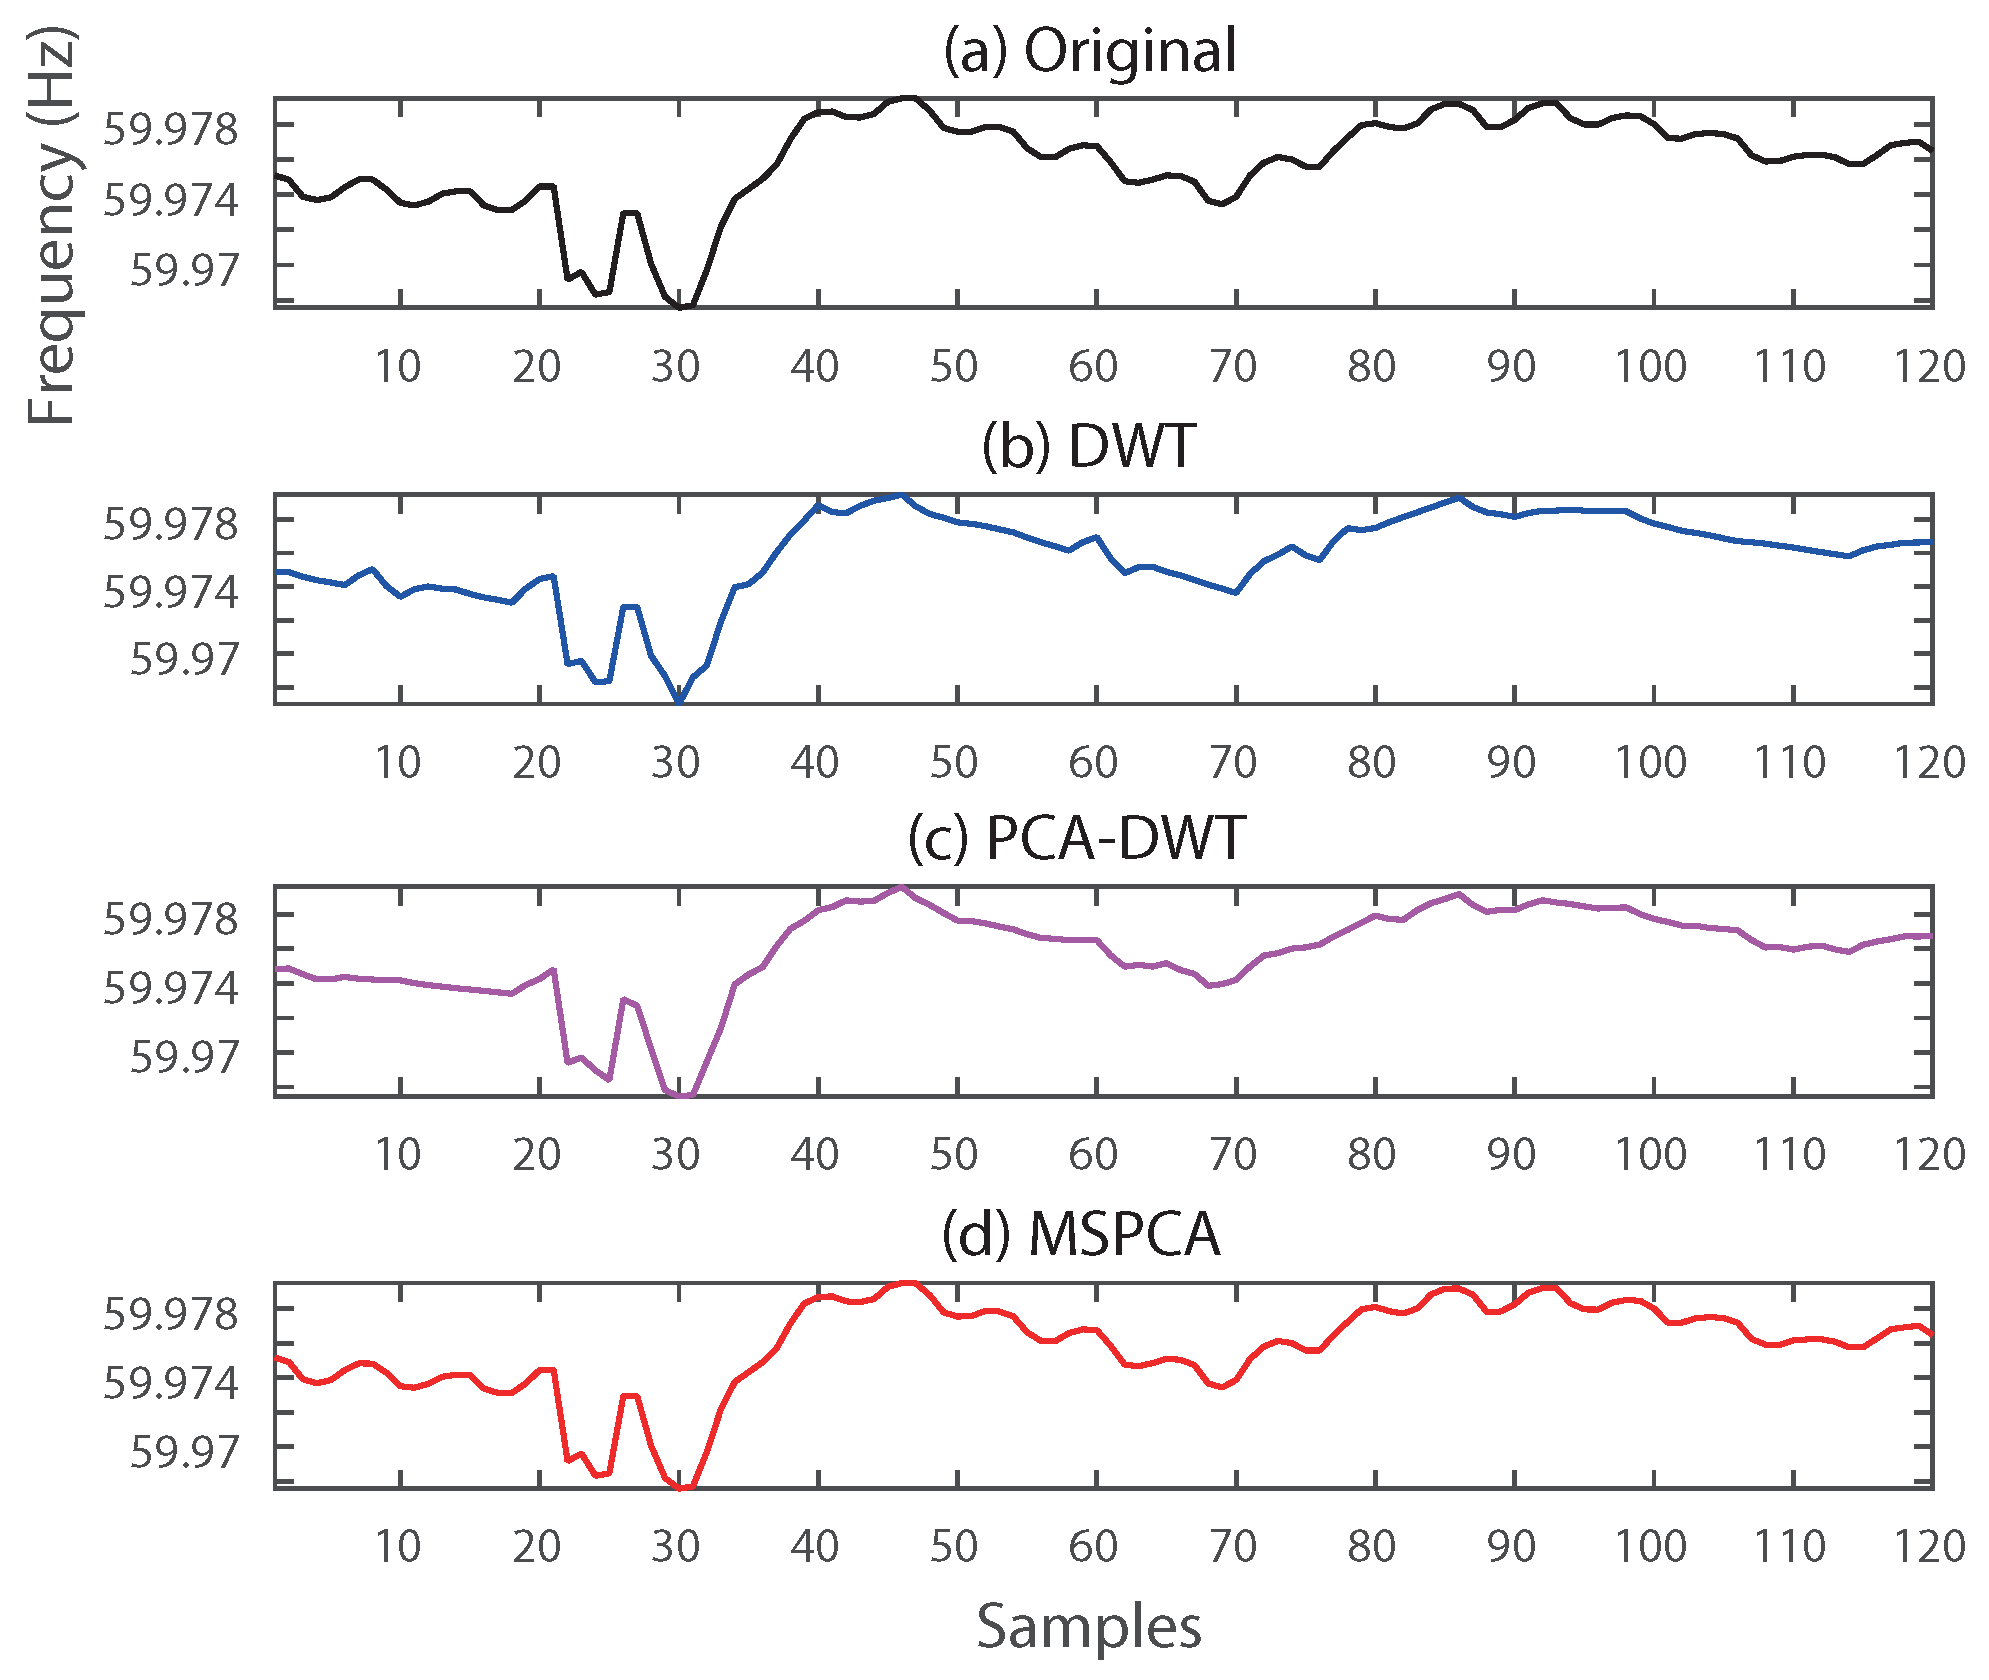
In order to verify the efficiency and robustness of our proposed method, the existing individual- and comprehensive-compression methods were compared by application to real-world data. For individual compression, DWT-based compression presented in Reference [5] was analyzed to confirm whether MSPCA distorts the unique characteristics in a PMU signal or not. The PCA–DWT combined compression method in Reference [11] was compared to show that MSPCA accurately extracts hidden dimensionalities of PMU data in large-scale power systems. Figure 9 and Figure 10 provide examples of the reconstructed voltage and frequency signals of the DWT, PCA–DWT, and MSPCA compression methods, respectively.
As shown in Figure 9 and Figure 10, DWT almost ignored transient phenomena such as voltage fluctuation and frequency oscillation. The reason is that DWT compression thresholded almost detail coefficients related to the variations, and a signal is mainly reconstructed by using low-pass filtered data and approximation coefficients. Reconstructed signals by PCA–DWT, on the other hand, seem to preserve transient information compared to the results of DWT compression. However, the proposed MSPCA provided near-perfect reconstruction, as shown in Figure 9d and Figure 10d. This result implies that, though PCA–DWT is an efficient way to compress PMU data, just discarding coefficients below a threshold can distort the transient phenomena of a local area. MSPCA does not just discard coefficients of low values, but also extracts hidden dimensionality at each scale, as shown in Figure 6.
The numerical results in Table 4 and Table 5 also show the efficacy of the proposed method. Both DWT and PCA–DWT provided better compression ratio for voltage and frequency event data. However, MSPCA derived much lower reconstruction error for both types of data. The maximum value of especially implies that MSPCA can preserve significant distortions of PMU signals in a local area.
Most of the time, a power system operates in an ambient state, and the can be expected to be higher than that of the event cases studied in this paper, since most states of the PMU dataset are from ambient periods. To verify the overall performance of the proposed method, the PMU data collected during the 24 h encompassing the discussed cases were compressed. Over 24 h, the four events in the utility data log were successfully detected from both voltage and frequency data. A further four voltage-only events were detected, and frequency-only events were also detected.
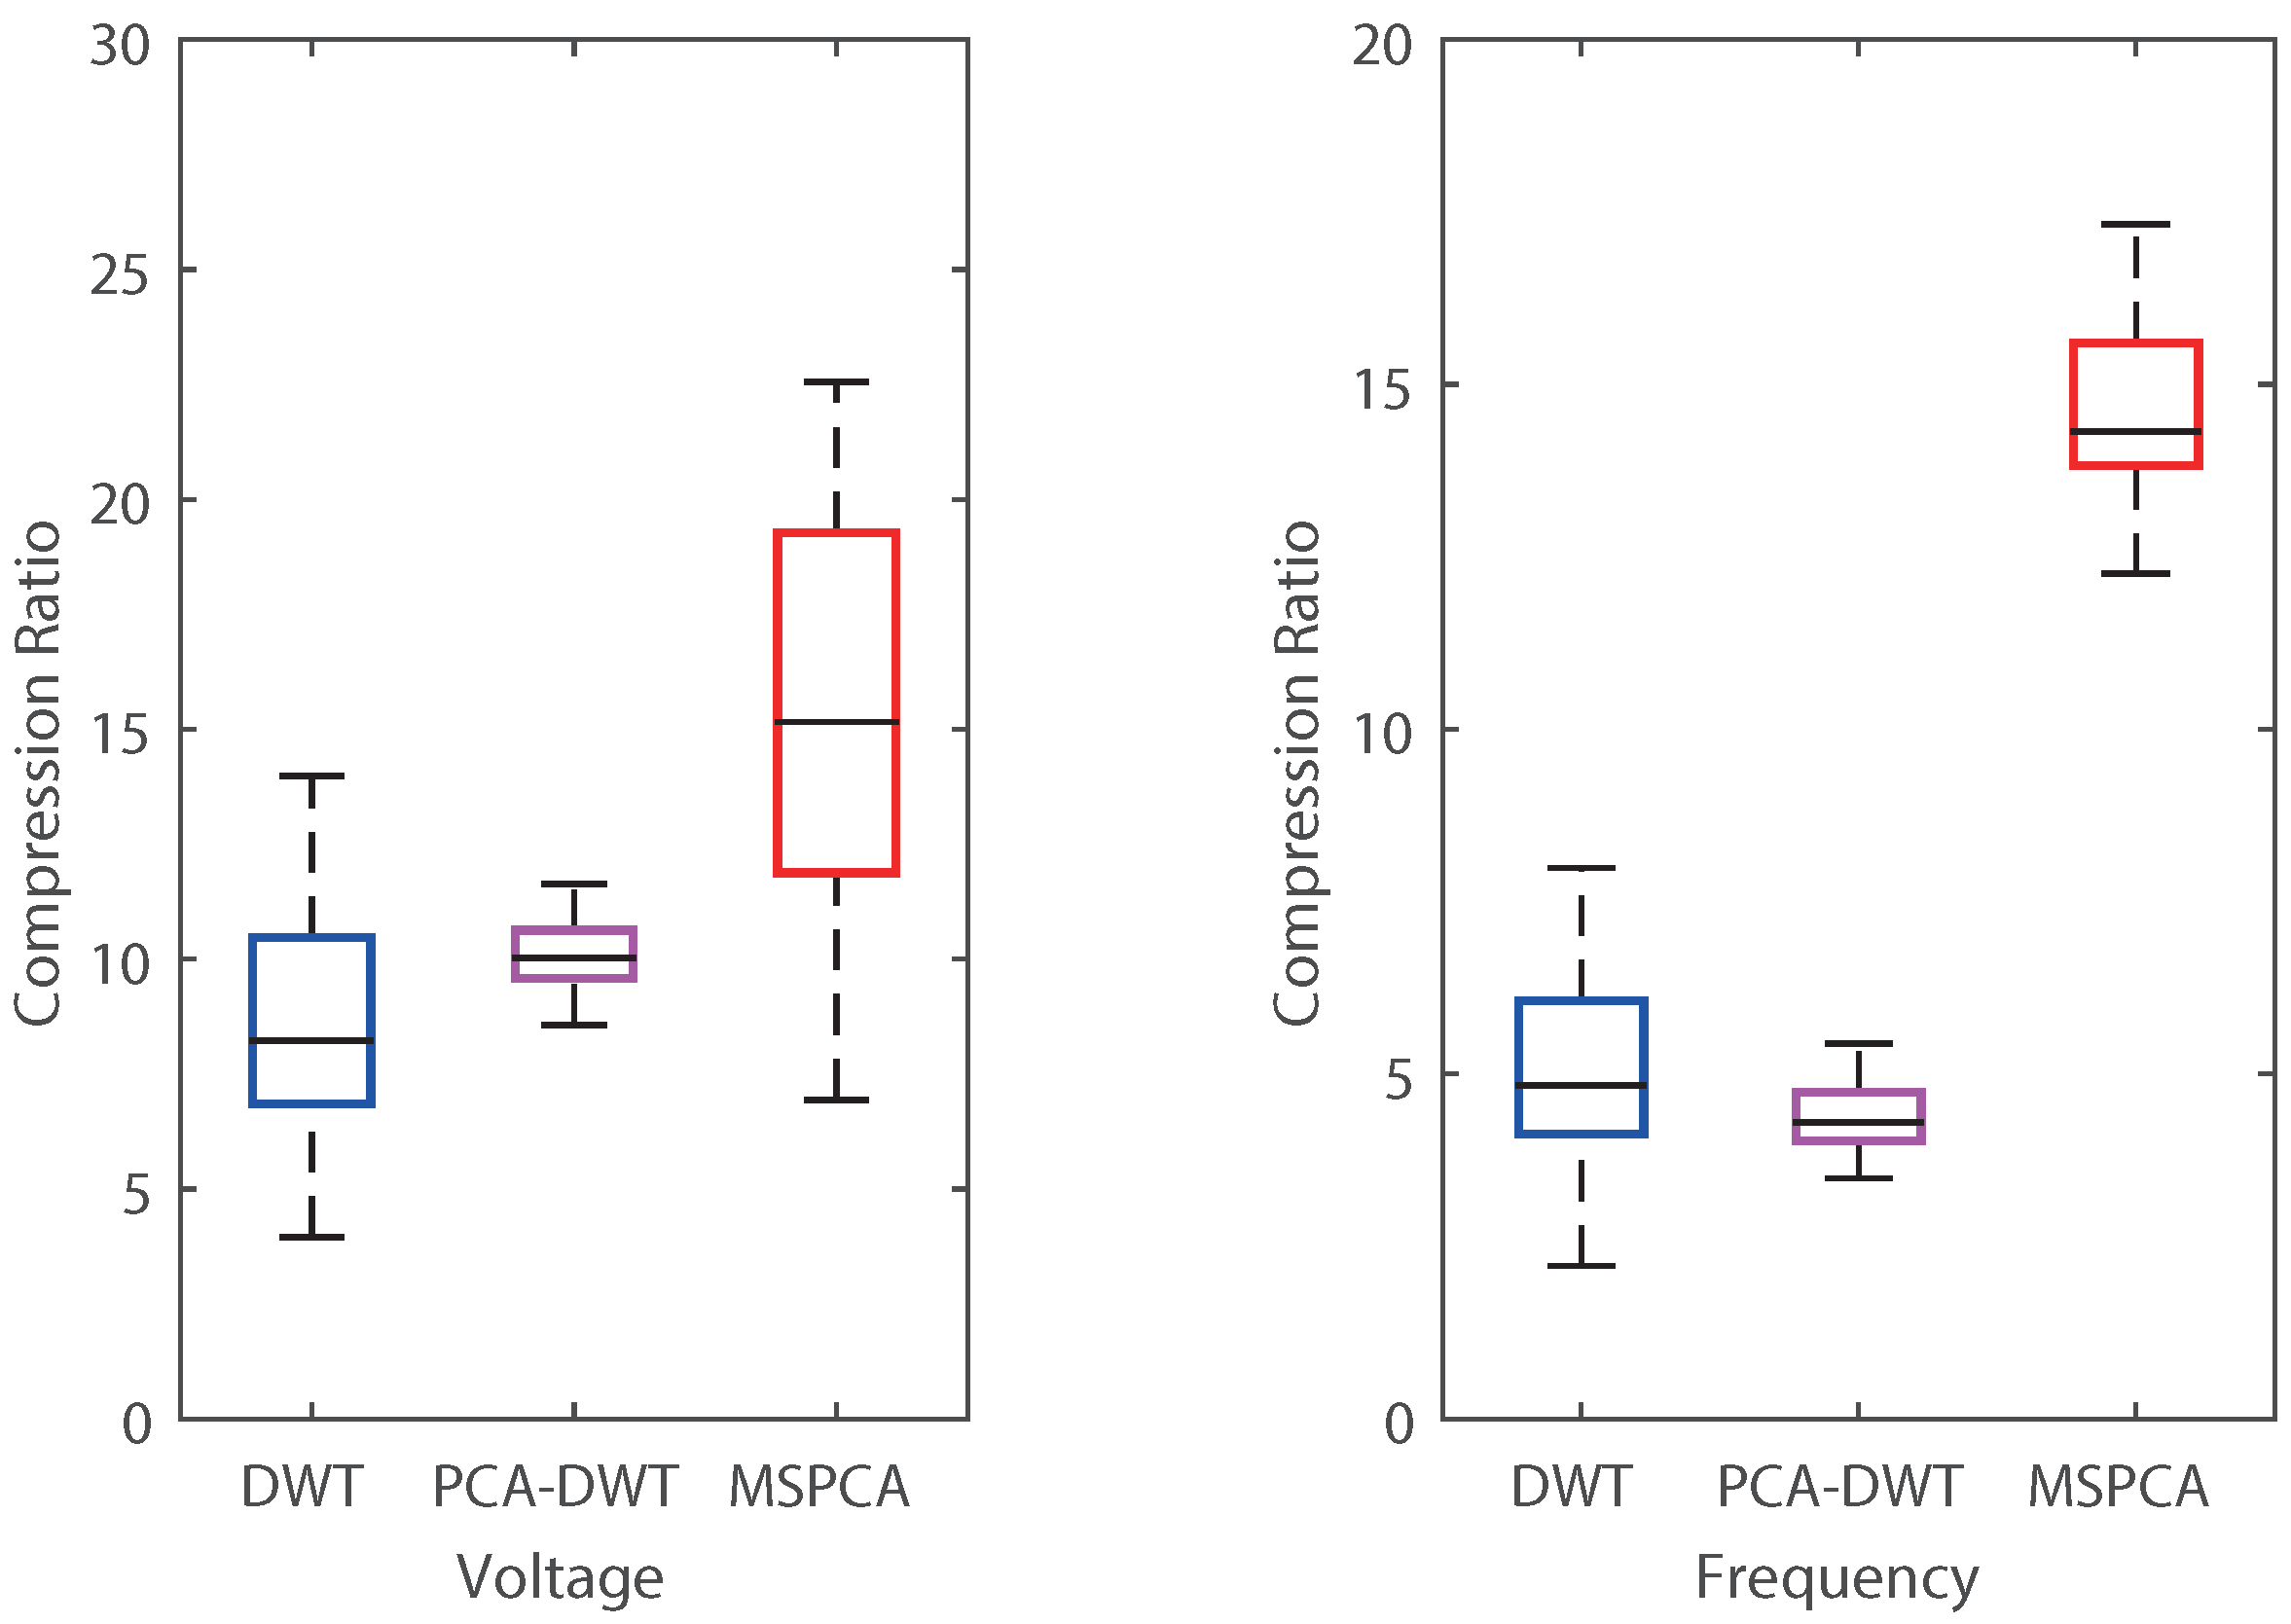
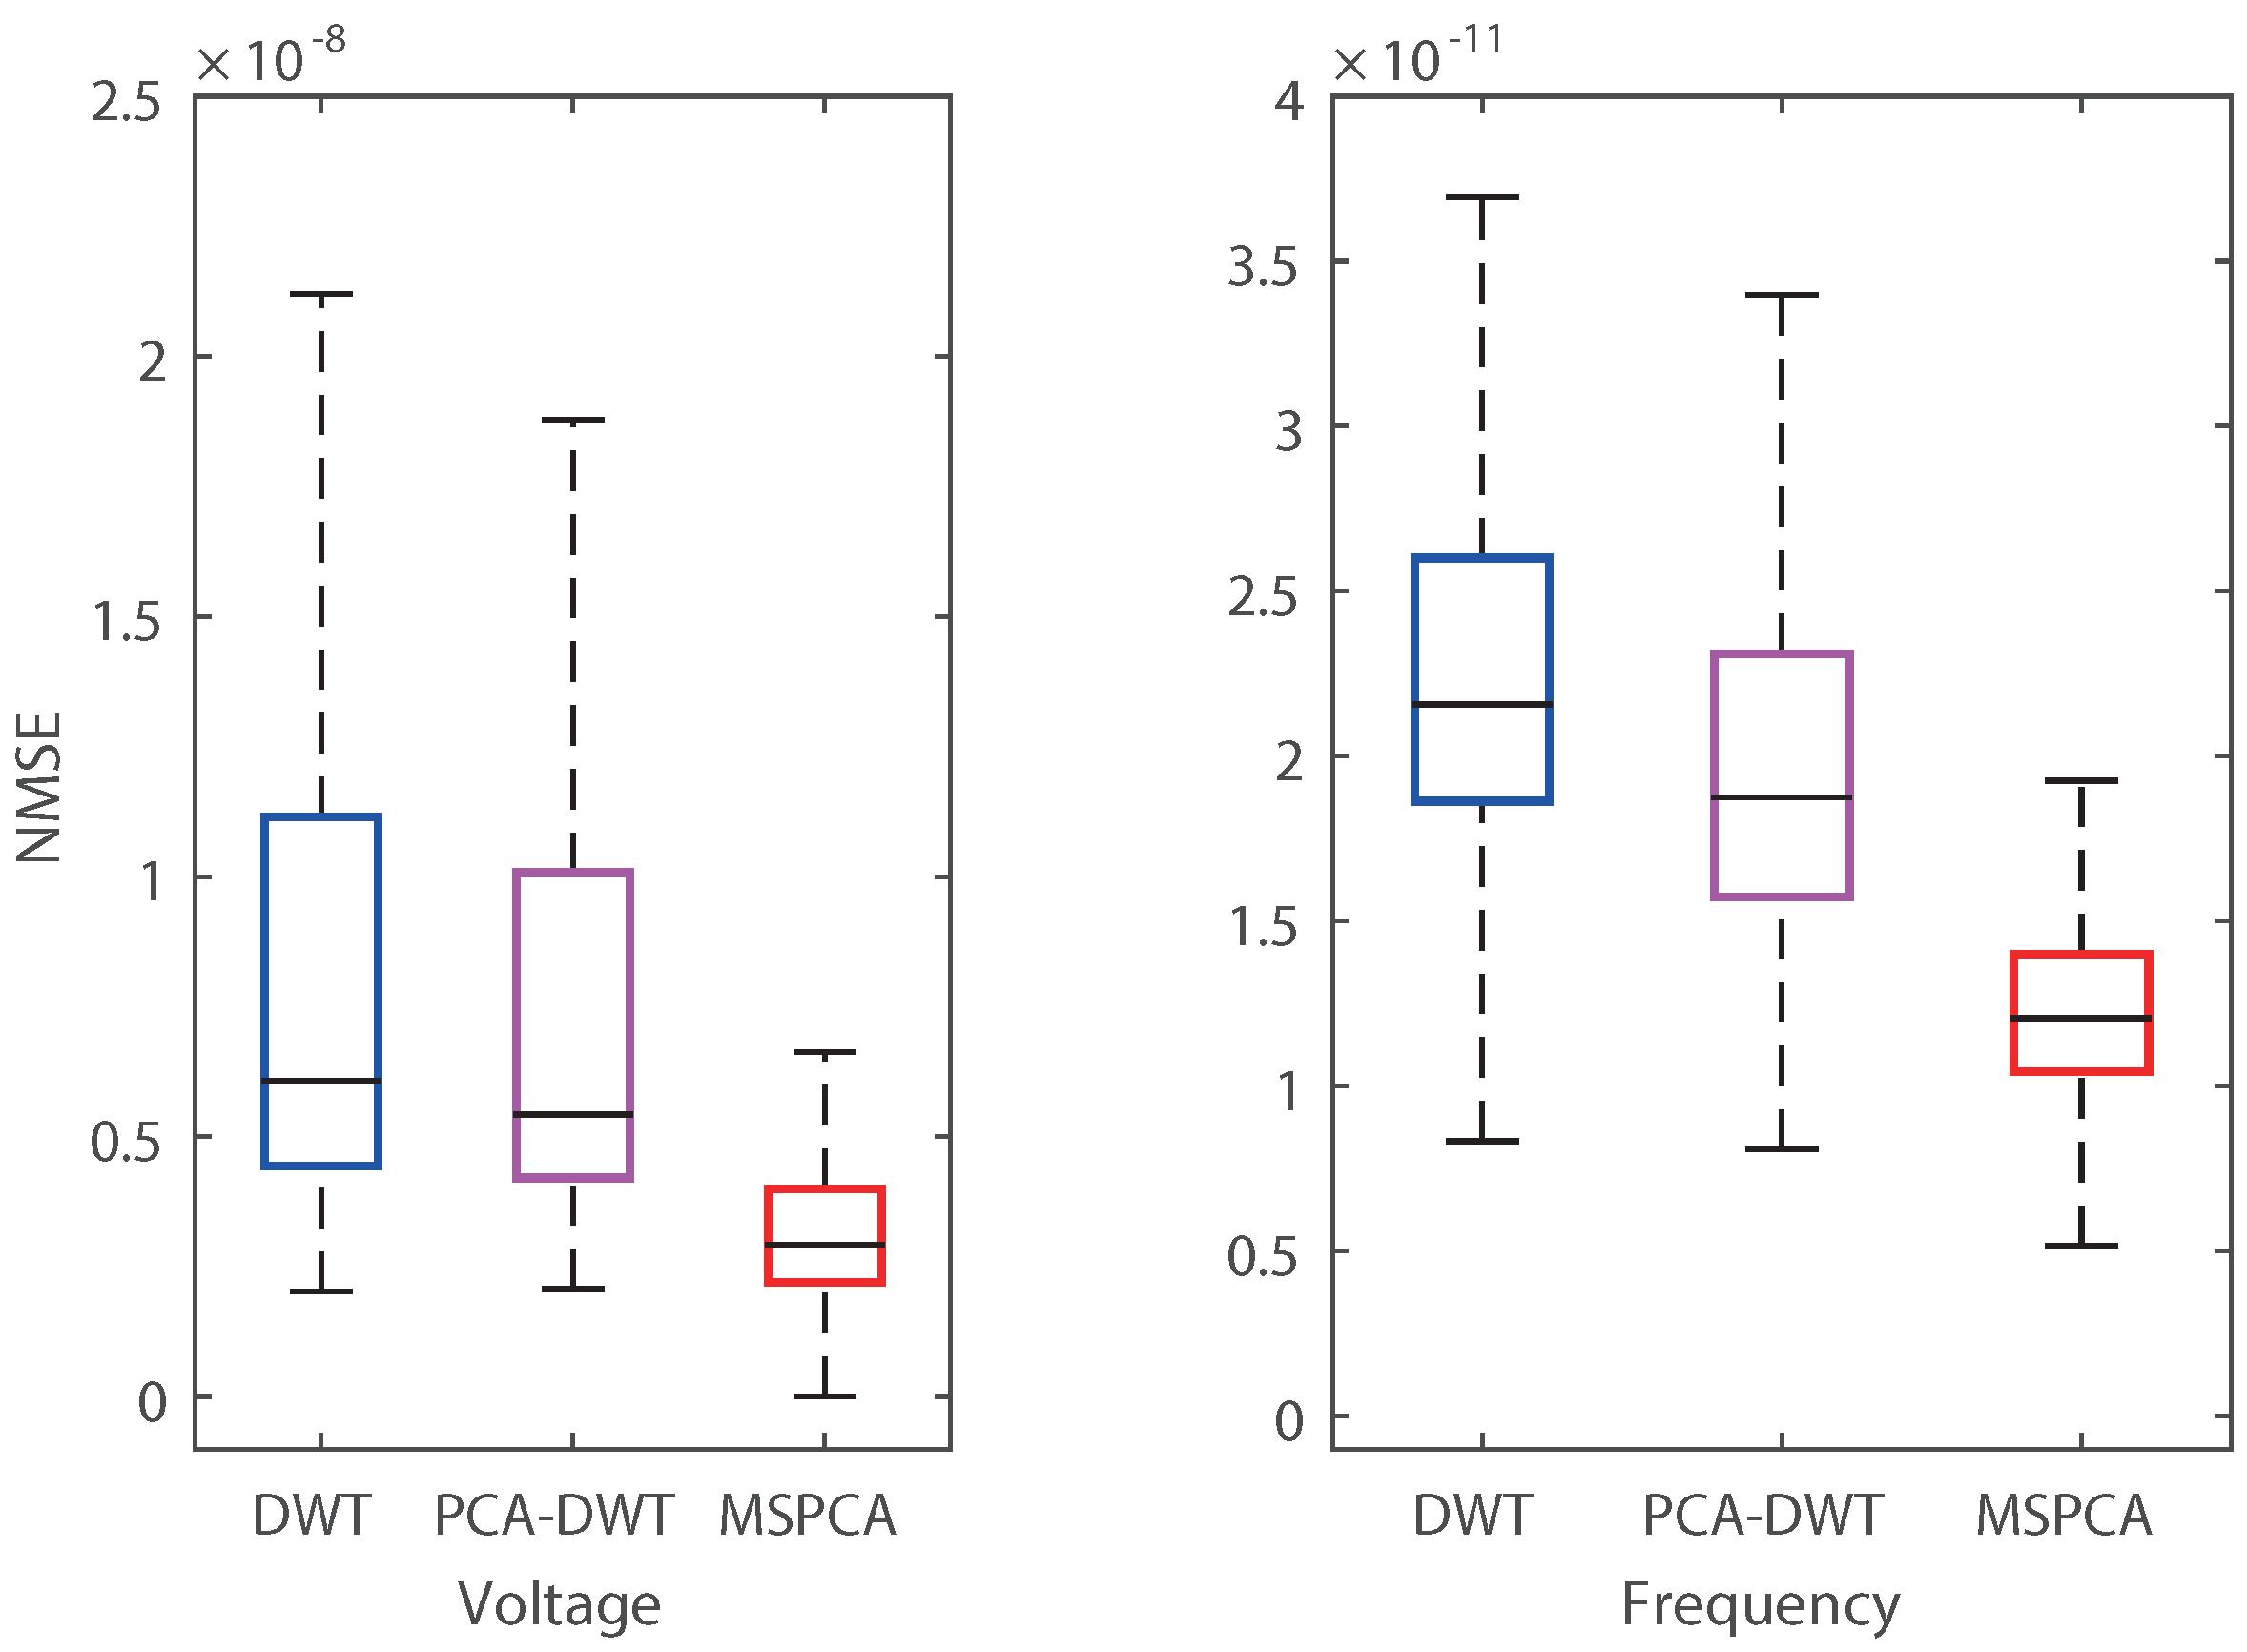
Overall compression results are analyzed in Figure 11 and Figure 12. Figure 11 shows distribution for the interval-selected datasets. distribution using multiscale compression is broader and has a higher median value than that of DWT and PCA–DWT. This adaptive results from multiscale compression adaptively selecting PCs according to the time-varying characteristics of the PMU signals. The PMU data for 24 h were compressed with a of 14.41 for voltage and 15.11 for frequency. Multiscale compression also has narrower distribution with lower s than DWT for both voltage and frequency as shown in Figure 12. By simultaneously taking the compression ratio and accuracy, the proposed method is shown to provide efficient and robust results, because DBSCAN automatically clustered correlated subdatasets, and MSPCA efficiently reduced dimensionality while preserving individual information.
Computation time of the proposed technique is measured for implementation and real application using MATLAB. Table 6 shows the averaged computation time over 24 h according to data types and power-system conditions. Run times for processing DBSCAN are generally longer than those of MSPCA because DBSCAN requires calculating distances between all signals in a dataset. However, the total computation times for all cases do not exceed windowed times of ambient (1 min) and event (4 s) conditions. Therefore, the proposed technique can compress PMU data without time delay and latency to compression of subsequent windowed data.
6. Conclusions
In this paper, a new framework for PMU data compression was proposed that combined DBSCAN and MSPCA. DBSCAN-based preconditioning clustered PMU signals into correlated subdatasets, as well as excepted for bad data. The size of the clustered PMU datasets was then reduced by using MSPCA-based compression. MSPCA first captures individual characteristics by wavelet analysis and reduces the dimensionalities of detail matrices in high-frequency sub-bands. The proposed method provided high compression in an ambient state and high accuracy in an event state, which is the desired performance for real-world PMU data in wide-area power systems. Numerical results and comparison with existing approaches confirmed the efficiency and robustness of DBSCAN-based multiscale PMU data compression. For future work, recovery and management techniques for bad data excepted by DBSCAN will be investigated.
Author Contributions
G.L. developed the main idea and designed the proposed method, conducted analysis of experiment results, and wrote the paper with the support of D.-I.K under the supervision of the corresponding author; Y.-J.S. and S.H.K. contributed to the editing of the paper. All authors have read and approved the final manuscript.
Acknowledgments
This work was supported by Korea Electric Power Corporation (KEPCO) #CX72170123 and #R18XA05. KEPCO provided technical advices on application of the proposed technique to real-world data.
Conflicts of Interest
The authors declare no conflict of interest.
References
- Aminifar, F.; Fotuhi-Firuzabad, M.; Safdarian, A.; Davoudi, A. Shahidehpour, M. Synchrophasor measurement technology in power systems: Panorama and state-of-the-art. IEEE Access 2014, 1, 1607–1628. [Google Scholar] [CrossRef]
- White, A.; Jacobs, S. Use of Synchrophasor at OG&E. Available online: https://www.naspi.org/File.aspx?fileID=1318 (accessed on 26 August 2014).
- Das, S.; Sidhu, T.S. Application of compressive sampling in synchrophasor data communication in WAMS. IEEE Trans. Ind. Informat. 2015, 10, 450–460. [Google Scholar] [CrossRef]
- Zhang, F.; Cheng, L.; Li, X.; Sun, Y.; Gao, W.; Zhao, W. Application of a real-time data compression and adapted protocol techniques for WAMS. IEEE Trans. Power Syst. 2015, 30, 653–662. [Google Scholar] [CrossRef]
- Ning, J.; Wang, J.; Gao, W.; Liu, C. A wavelet-based data compression technique for smart grid. IEEE Trans. Smart Grid 2011, 2, 212–218. [Google Scholar] [CrossRef]
- Khan, J.; Bhuiyan, S.M.A.; Murphy, G.; Arline, M. Embedded-zerotree-wavelet-based data denoising and compression for smart grid. IEEE Trans. Ind. Appl. 2015, 51, 4190–4200. [Google Scholar] [CrossRef]
- Das, S.; Rao, P.S.N. Principal component analysis based compression scheme for power system steady state operational data. In Proceedings of the IEEE PES Innovative Smart Grid Technologies-India, Kollam, India, 1–3 December 2011. [Google Scholar]
- Mehra, R.; Bhatty, N.; Kazi, F.; Singh, N.M. Analysis of PCA based compression and denoising of smart grid data under normal and fault conditions. In Proceedings of the IEEE International Conference on Electronics, Computing and Communication Technologies, Bangalore, India, 17–19 January 2013. [Google Scholar]
- Ge, Y.; Flueck, A.J.; Kim, D.-K.; Ahn, J.-B.; Lee, J.-D.; Kwon, D.-Y. Power system real-time event detection and associated data archival reduction based on synchrophasors. IEEE Trans. Power Syst. 2015, 6, 2088–2097. [Google Scholar] [CrossRef]
- Gao, P.; Wang, M.; Ghiocel, S.G.; Chow, J.H.; Fardanesh, B.; Stefopoulos, G. Missing data recovery by exploiting low-dimensionality in power system synchrophasor measurements. IEEE Trans. Power Syst. 2016, 31, 1006–1013. [Google Scholar] [CrossRef]
- Gadde, P.H.; Biswal, M.; Brahma, S.; Cao, H. Efficient compression of PMU Data in WAMS. IEEE Trans. Smart Grid 2016, 7, 2406–2413. [Google Scholar] [CrossRef]
- Zhang, F.; Cheng, L.; Li, X.; Sun, Y.; Gao, W.; Zhao, W. Dimensionality reduction of synchrophasor data for early event detection: Linearized analysis. IEEE Trans. Power Syst. 2014, 29, 2784–2794. [Google Scholar]
- Kiu, X.; Laverty, D.M.; Best, R.J.; Li, K.; Morrow, D.J.; McLoone, S. Principal component analysis of wide-area phasor measurement for islanding detection a geometric view. IEEE Trans. Power Deliv. 2015, 30, 976–985. [Google Scholar]
- Tang, Y.; Li, F.; Zheng, C.; Wang, Q.; Wu, Y. PMU Measurement-Based Intelligent Strategy for Power System Controlled Islanding. Energies 2018, 11, 143. [Google Scholar] [CrossRef]
- Kim, D.-I.; Chun, T.Y.; Yoon, S.-H.; Lee, G.; Shin, Y.-J. Wavelet-based event detection method using PMU data. IEEE Trans. Smart Grid 2017, 8, 1154–1162. [Google Scholar] [CrossRef]
- Lotfifard, S. Sparse sensing slatform for line-outage identification in multiarea power systems. IEEE Trans. Ind. Informat. 2017, 13, 947–955. [Google Scholar] [CrossRef]
- Khoa, N.M.; Tung, D.D. Locating Fault on Transmission Line with Static Var Compensator Based on Phasor Measurement Unit. Energies 2018, 11, 2380. [Google Scholar] [CrossRef]
- Klaric, M.; Kuzle, I.; Holjevac, N. Wind Power Monitoring and Control Based on Synchrophasor Measurement Data Mining. Energies 2018, 11, 3525. [Google Scholar] [CrossRef]
- Esparza, A.; Segundo, J.; Nuñez, C.; Visairo, N.; Barocio, E.; García, H. Transient Stability Enhancement Using a Wide-Area Controlled SVC: An HIL Validation Approach. Energies 2018, 11, 1639. [Google Scholar] [CrossRef]
- Ivanković, I.; Kuzle, I.; Holjevac, N. Algorithm for Fast and Efficient Detection and Reaction to Angle Instability Conditions Using Phasor Measurement Unit Data. Energies 2018, 11, 681. [Google Scholar] [CrossRef]
- Zhao, J.; Zhang, G.; Scala, M.L.; Wang, Z. Enhanced robustness of state estimator to bad data processing through multi-innovation analysis. IEEE Trans. Ind. Informat. 2017, 13, 1610–1619. [Google Scholar] [CrossRef]
- Lee, G.; Shin, Y.-J. Multiscale PMU data compression based on wide-area event detection. In Proceedings of the IEEE International Conference on Smart Grid Communications (SmartGridComm), Dresden, Germany, 23–27 October 2017. [Google Scholar]
- Kamwa, I.; Pradhan, A.K.; Joos, G. Automatic segmentation of large power systems into fuzzy coherent areas for dynamic vulnerability assessment. IEEE Trans. Power Syst. 2007, 22, 1974–1985. [Google Scholar] [CrossRef]
- Dahal, O.P.; Brahma, S.M.; Cao, H. Comprehensive clustering of disturbance events recorded by phasor measurement units. IEEE Trans. Power Deliv. 2014, 29, 1390–1397. [Google Scholar] [CrossRef]
- Wang, X.; Shi, D.; Wang, Z.; Xu, C.; Zhang, O.; Zhang, X.; Yu, Z. Online calibration of phasor measurement unit using density-based spatial clustering. IEEE Trans. Power Deliv. 2018, 33, 1081–1090. [Google Scholar] [CrossRef]
- Ester, M.; Kriegel, H.-P.; Sander, J.; Xu, X. A density-based algorithm for discovering clusters in large spatial databases with noise. In Proceedings of the Second International Conference on Knowledge Discovery and Data Mining, Portland, OR, USA, 2–4 August 1996. [Google Scholar]
- Bakshi, B.R. Multiscale PCA with application to multivariate statistical monitoring. AIChE J. 1998, 44, 1596–1610. [Google Scholar] [CrossRef]
- Burrus, C.S.; Gopinatha, R.A.; Guo, H. Introduction to Wavelets and Wavelet Transforms—A Primer; Prentice-Hall: Englewood Cliffs, NJ, USA, 1998. [Google Scholar]
- Dunn, J. A fuzzy relative of the ISODATA process and its use in detecting compact well separated clusters. J. Cybern. 1974, 3, 32–57. [Google Scholar] [CrossRef]
Figure 1.
Phasor measurement unit (PMU) signals in real world. (a) Voltage; (b) Frequency.

Figure 2.
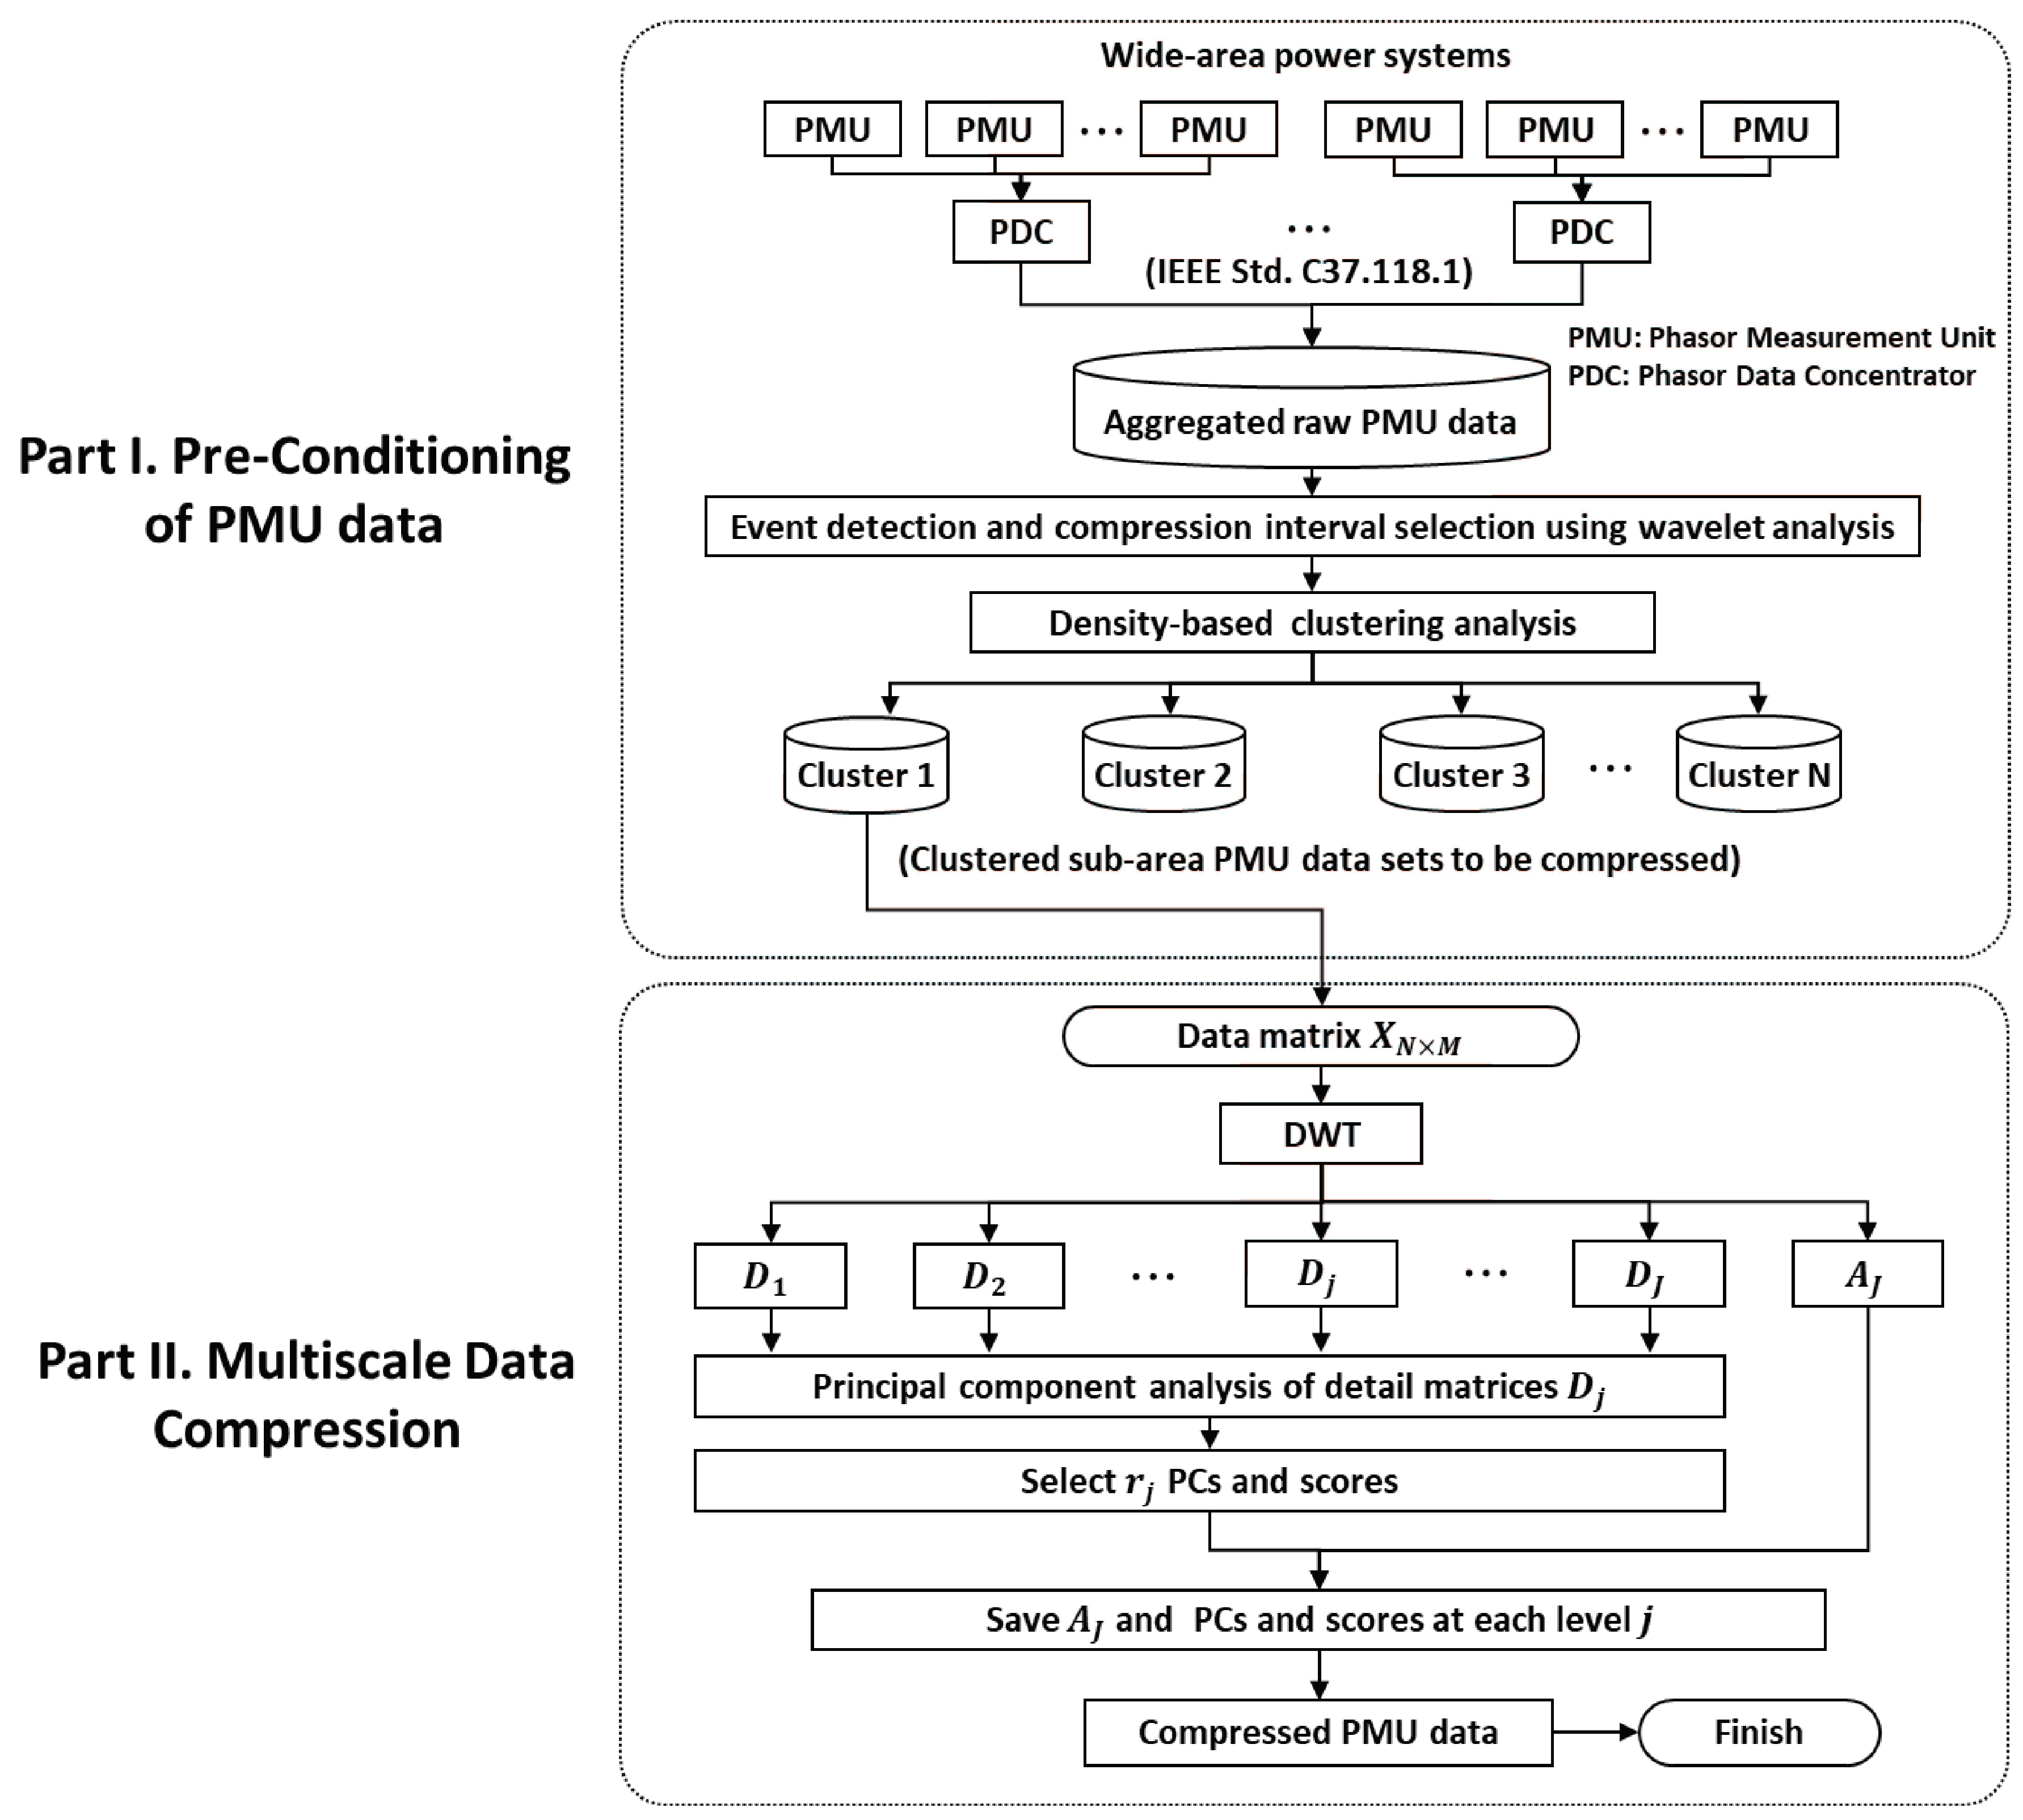
Flowchart of PMU data compression.

Figure 3.
Density-based spatial clustering of applications with noise (DBSCAN) concept.

Figure 4.
K-distance analysis. (a) Voltage dataset, (b) frequency dataset.

Figure 5.
Clustering result of frequency data containing an event and bad data. (a) Original dataset, (b) outliers, (c–h) clustered PMU datasets by DBSCAN.
Figure 5.
Clustering result of frequency data containing an event and bad data. (a) Original dataset, (b) outliers, (c–h) clustered PMU datasets by DBSCAN.
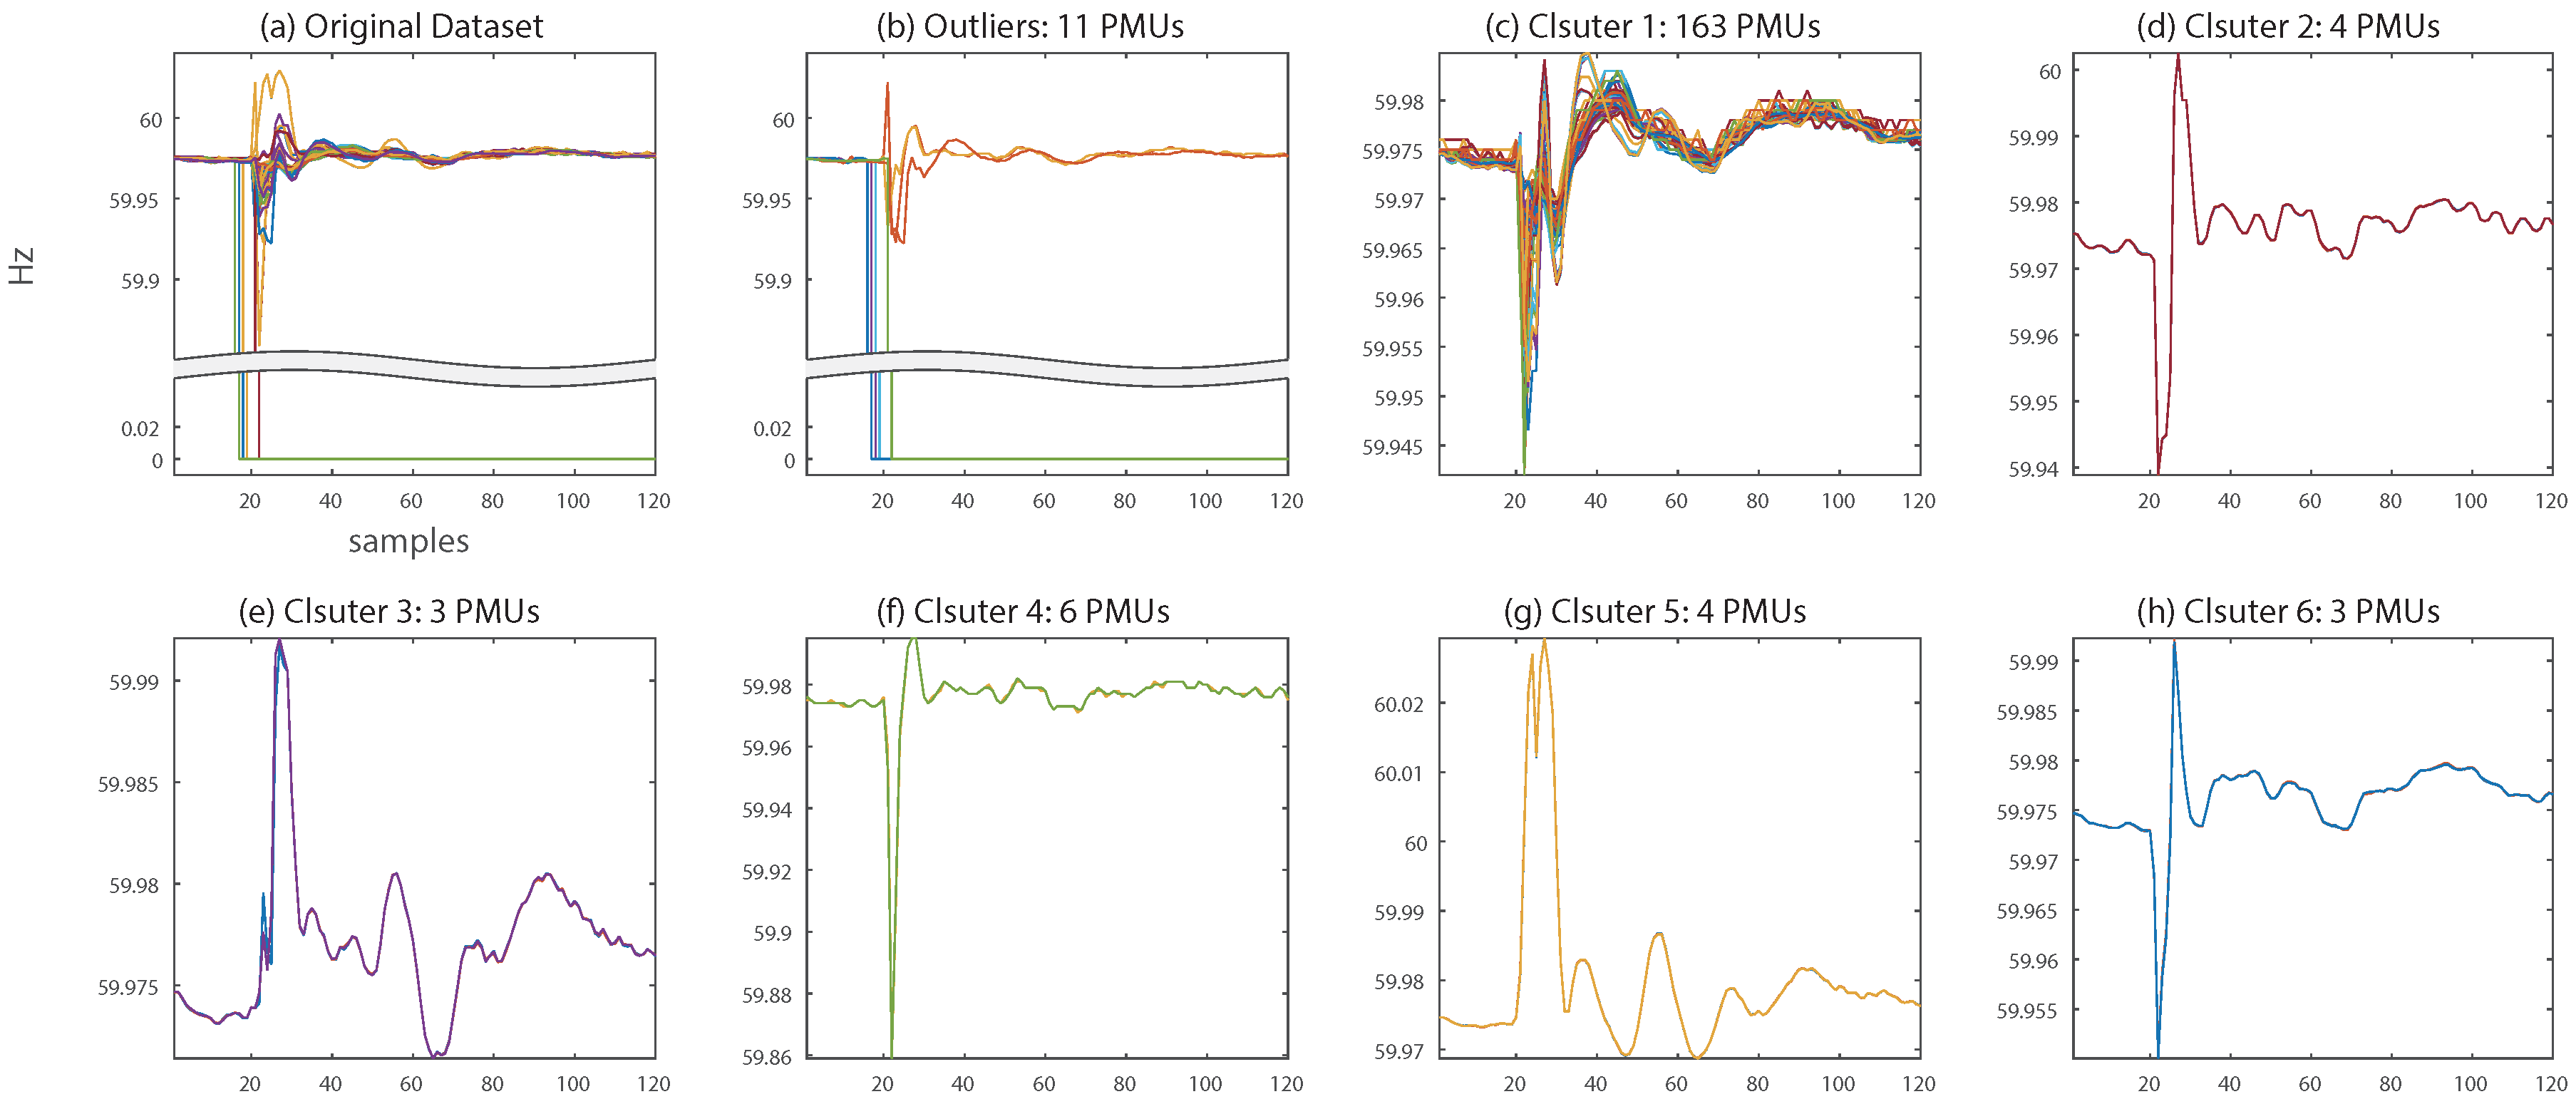
Figure 6.
MSPCA-based data compression. (a) Original detail matrix , (b) saved principle components (PCs), (c) saved scores, and (d) reconstructed detail matrix using saved PCs and scores.
Figure 6.
MSPCA-based data compression. (a) Original detail matrix , (b) saved principle components (PCs), (c) saved scores, and (d) reconstructed detail matrix using saved PCs and scores.

Figure 7.
Dunn index analysis of PMU data. (a) Ambient case, (b) event case.

Figure 8.
NMSE results of every PMU. (a) Voltage, (b) frequency.

Figure 9.
Comparison of reconstructed voltage signals. (a) Original data, (b) discrete wavelet transform (DWT), (c) PCA (principal component analysis)–DWT, (d) MSPCA (multiscale principal component analysis).
Figure 9.
Comparison of reconstructed voltage signals. (a) Original data, (b) discrete wavelet transform (DWT), (c) PCA (principal component analysis)–DWT, (d) MSPCA (multiscale principal component analysis).
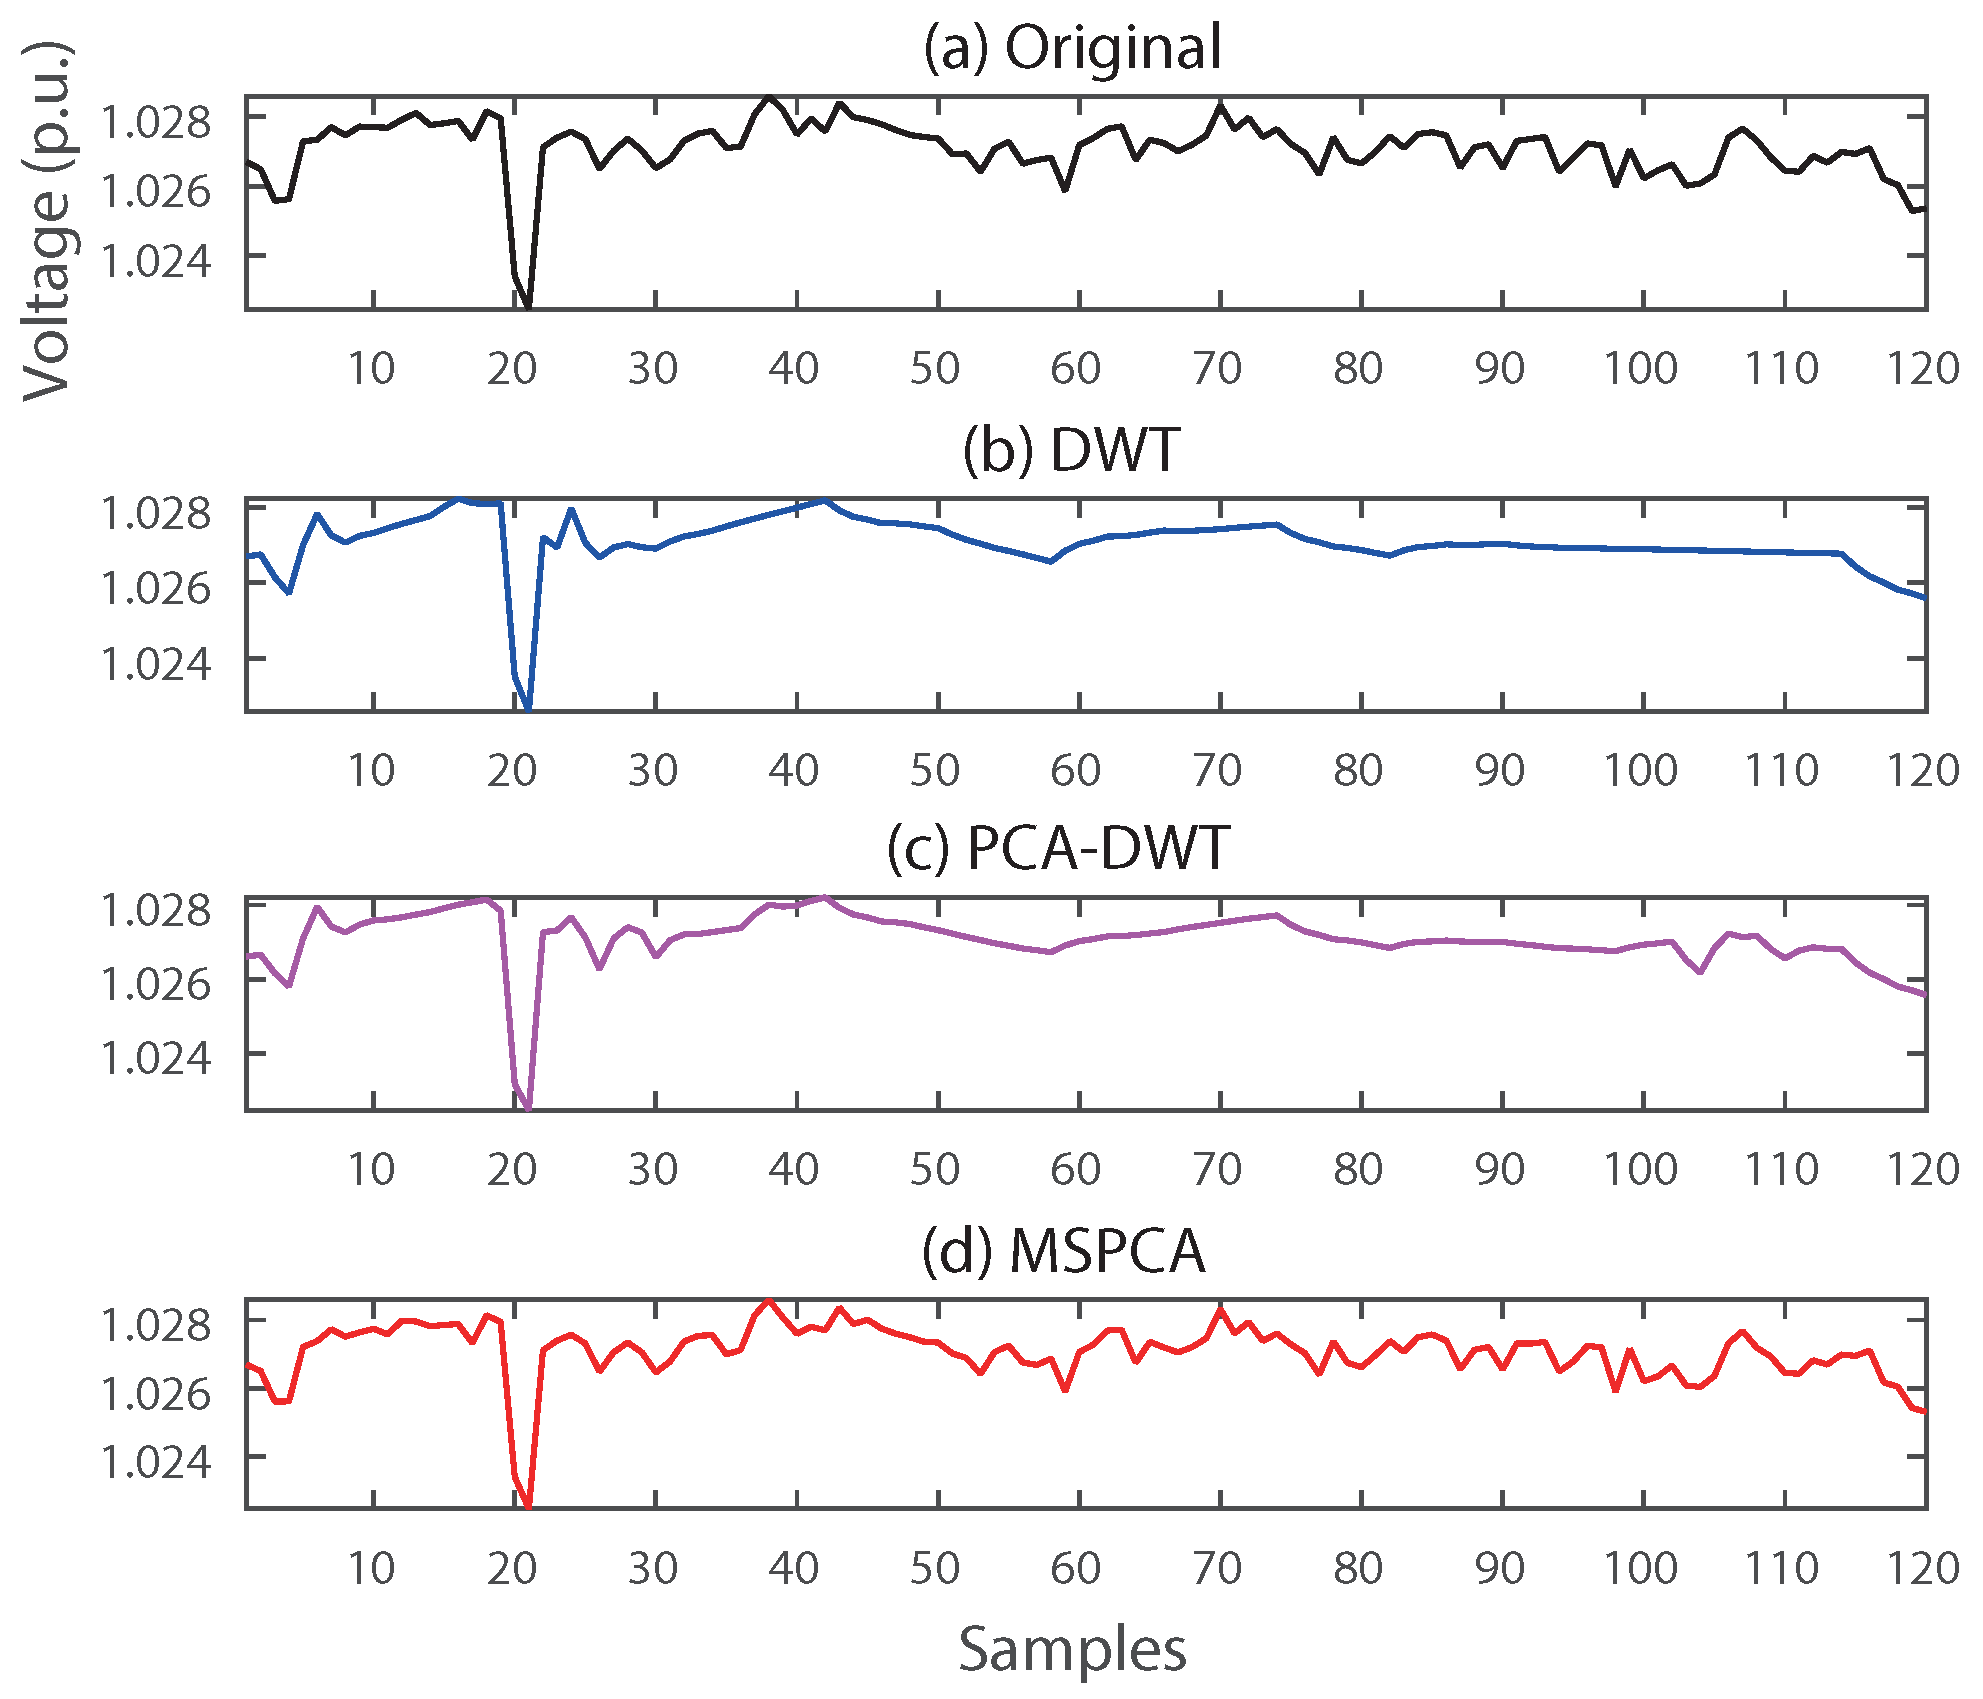
Figure 10.
Comparison of reconstructed frequency signals. (a) Original data, (b) discrete wavelet transform (DWT), (c) PCA (principal component analysis)–DWT, (d) MSPCA (multiscale principal component analysis).
Figure 10.
Comparison of reconstructed frequency signals. (a) Original data, (b) discrete wavelet transform (DWT), (c) PCA (principal component analysis)–DWT, (d) MSPCA (multiscale principal component analysis).
Figure 11.
Compression-ratio results for 24 h of PMU data.

Figure 12.
NMSE results for 24 h of PMU data.


Table 1.
Energy contribution of PMU data types.
| Data Type | Voltage | Frequency |
|---|---|---|
| EC (%) |
Table 2.
Multiscale principle-component analysis (MSPCA) compression of clustered data (voltage). Note: NMSE, normalized mean squared error; CR, compression ratio; PMU, phasor measurement unit.
Table 2.
Multiscale principle-component analysis (MSPCA) compression of clustered data (voltage). Note: NMSE, normalized mean squared error; CR, compression ratio; PMU, phasor measurement unit.
| State | Cluster | # of PMUs | # of Bad Data | NMSE (Average) | CR |
|---|---|---|---|---|---|
| Ambient | 0 | 1 | 1 | - | - |
| 1 | 193 | 0 | 18.22 | ||
| Event | 0 | 8 | 7 | - | - |
| 1 | 73 | 0 | 2.83 | ||
| 2 | 6 | 0 | 2.24 | ||
| 3 | 97 | 0 | 3.12 | ||
| 4 | 7 | 0 | 2.03 | ||
| 5 | 3 | 0 | 2.07 |
Table 3.
MSPCA compression of clustered data (frequency).
| State | Cluster | # of PMUs | # of Bad Data | NMSE (Average) | CR |
|---|---|---|---|---|---|
| Ambient | 0 | 1 | 1 | - | - |
| 1 | 193 | 0 | 15.37 | ||
| Event | 0 | 11 | 7 | - | - |
| 1 | 163 | 0 | 2.01 | ||
| 2 | 4 | 0 | 1.11 | ||
| 3 | 3 | 0 | 1.55 | ||
| 4 | 6 | 0 | 1.79 | ||
| 5 | 4 | 0 | 1.70 | ||
| 6 | 3 | 0 | 1.43 |
Table 4.
Comparison of compression result (voltage). Note: DWT, discrete wavelet transform; PCA, principal component analysis; MSPCA, multiscale principal component analysis.
Table 4.
Comparison of compression result (voltage). Note: DWT, discrete wavelet transform; PCA, principal component analysis; MSPCA, multiscale principal component analysis.
| Compression Method | NMSE | CR | |
|---|---|---|---|
| Mean () | Max () | ||
| DWT | 7.57 | 1.39 | 3.78 |
| PCA–DWT | 9.85 | 2.26 | 4.62 |
| MSPCA | 1.85 | 0.39 | 2.64 |
Table 5.
Comparison of compression result (frequency). Note: DWT, discrete wavelet transform; PCA, principal component analysis; MSPCA, multiscale principal component analysis.
Table 5.
Comparison of compression result (frequency). Note: DWT, discrete wavelet transform; PCA, principal component analysis; MSPCA, multiscale principal component analysis.
| Compression Method | NMSE | CR | |
|---|---|---|---|
| Mean () | Max () | ||
| DWT | 2.37 | 2.41 | 2.87 |
| PCA–DWT | 2.31 | 2.28 | 2.03 |
| MSPCA | 0.01 | 0.19 | 1.96 |
Table 6.
Computation time (s).
| Process | DBSCAN | MSPCA | Total (s) | |
|---|---|---|---|---|
| Voltage | Ambient | 1.0184 | 0.5943 | 1.6127 |
| Event | 1.0842 | 0.5651 | 1.6493 | |
| Frequency | Ambient | 1.2914 | 0.6525 | 1.9439 |
| Event | 1.1501 | 0.6174 | 1.7675 | |
© 2019 by the authors. Licensee MDPI, Basel, Switzerland. This article is an open access article distributed under the terms and conditions of the Creative Commons Attribution (CC BY) license (http://creativecommons.org/licenses/by/4.0/).
Share and Cite
MDPI and ACS Style
Lee, G.; Kim, D.-I.; Kim, S.H.; Shin, Y.-J. Multiscale PMU Data Compression via Density-Based WAMS Clustering Analysis. Energies 2019, 12, 617. https://0-doi-org.brum.beds.ac.uk/10.3390/en12040617
AMA Style
Lee G, Kim D-I, Kim SH, Shin Y-J. Multiscale PMU Data Compression via Density-Based WAMS Clustering Analysis. Energies. 2019; 12(4):617. https://0-doi-org.brum.beds.ac.uk/10.3390/en12040617
Chicago/Turabian StyleLee, Gyul, Do-In Kim, Seon Hyeog Kim, and Yong-June Shin. 2019. "Multiscale PMU Data Compression via Density-Based WAMS Clustering Analysis" Energies 12, no. 4: 617. https://0-doi-org.brum.beds.ac.uk/10.3390/en12040617
Note that from the first issue of 2016, this journal uses article numbers instead of page numbers. See further details here.