Article

Sensitivity Analysis of Different Parameters on the Performance of a CHP Internal Combustion Engine System Fed by a Biomass Waste Gasifier

1
Department of Agricultural and Forestry Sciences (DAFNE), Tuscia University, Via San Camillo de Lellis, 01100 Viterbo, Italy
2
Department of Nuclear, Subnuclear and Radiation Physics, Marconi University, 00193 Rome, Italy
*
Author to whom correspondence should be addressed.
Submission received: 10 January 2019 / Revised: 5 February 2019 / Accepted: 13 February 2019 / Published: 20 February 2019

Abstract

:
The present paper presents a study of biomass waste to energy conversion using gasification and internal combustion engine for power generation. The biomass waste analyzed is the most produced on Italian soil, chosen for suitable properties in the gasification process. Good quality syngas with up to 16.1% CO–4.3% CH4–23.1% H2 can be produced. The syngas lower heating value may vary from 1.86 MJ/ Nm3 to 4.5 MJ/Nm3 in the gasification with air and from 5.2 MJ/ Nm3 to 7.5 MJ/Nm3 in the gasification with steam. The cold gas efficiency may vary from 16% to 41% in the gasification with air and from 37% to 60% in the gasification with steam, depending on the different biomass waste utilized in the process and the different operating conditions. Based on the sensitivity studies carried out in the paper and paying attention to the cold gas efficiency and to the LHV, we have selected the best configuration process for the best syngas composition to feed the internal combustion engine. The influence of syngas fuel properties on the engine is studied through the electrical efficiency and the cogeneration efficiency.

1. Introduction

Sustainability and environmental issues regarding energy are becoming of more and more concern in this present age, and proper policies can determine the future low-carbon profile of the global system [1,
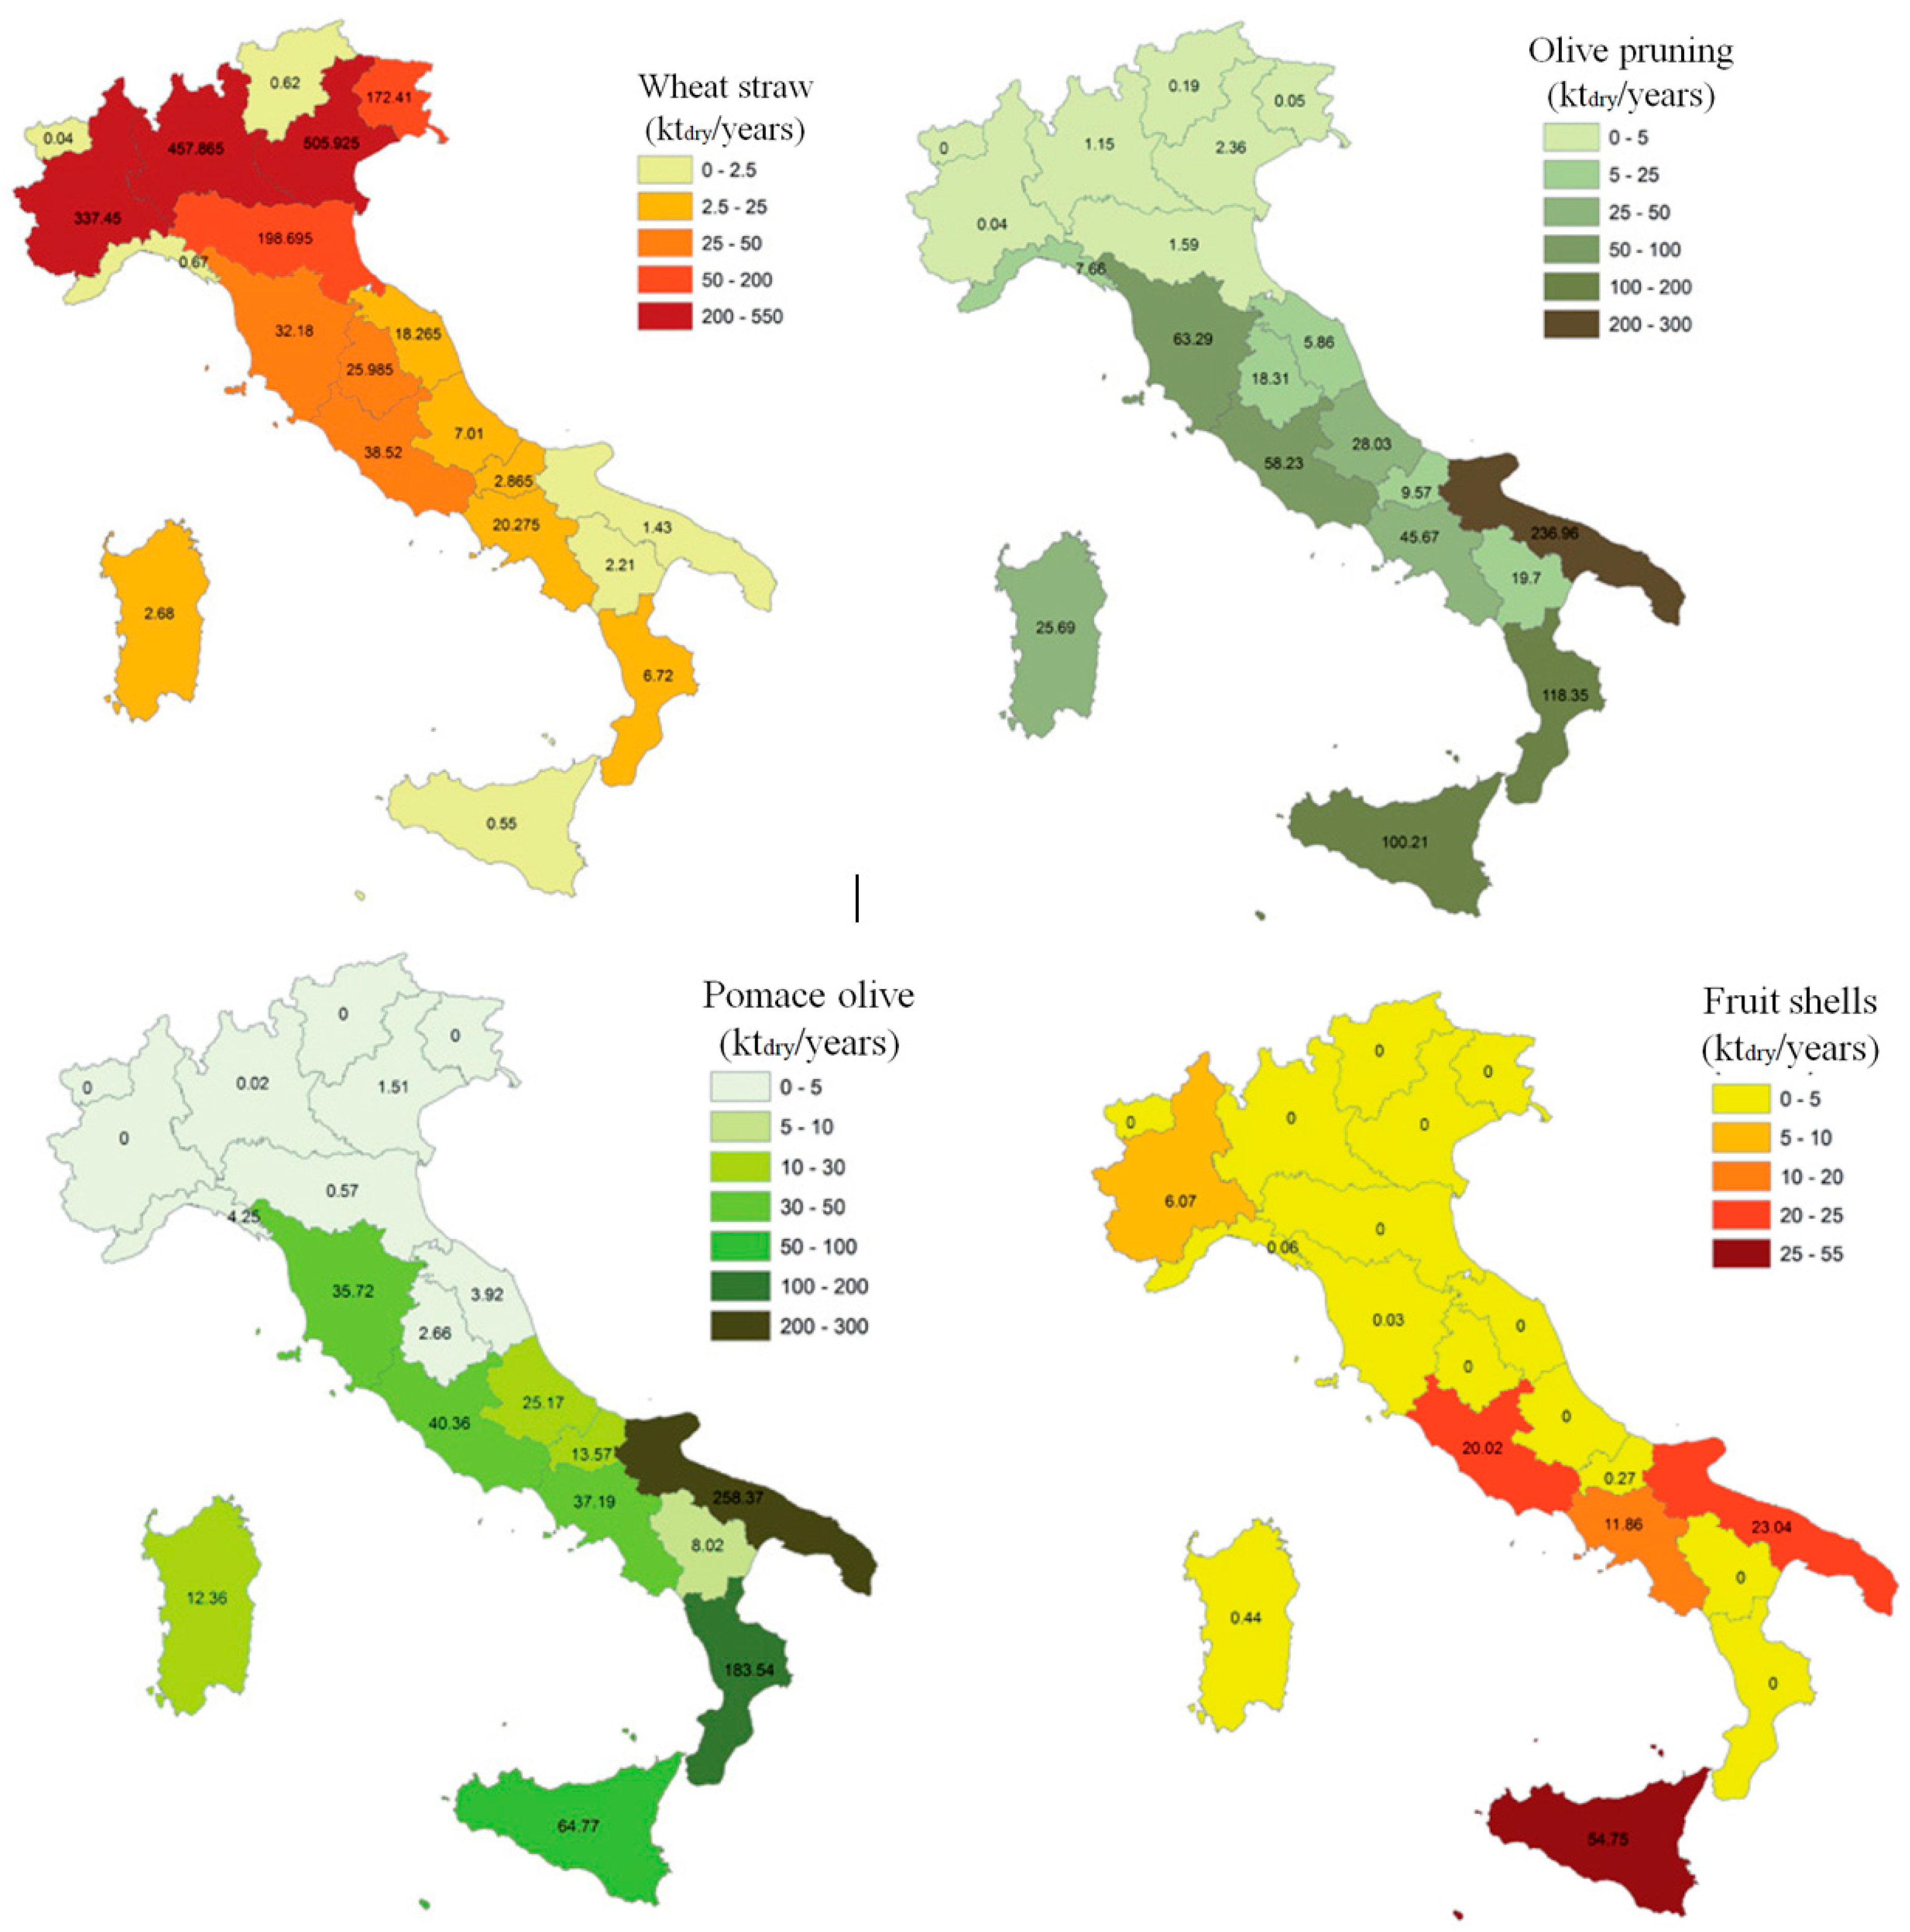
2]. In Europe, every year, a large quantity of biomass waste is produced. This biomass is mostly vegetable waste from the agri-food chain (pruning of vines, olives, fruit trees, shells, etc.) and from wood [3,4].
The reuse of biomass waste is essential for a circular economy and sustainability [5,6]; in fact, biomass is considered one of the most important renewable energy sources as it can increase global energy sustainability and reduce greenhouse gas emissions [7,8].
There are many technologies by which to convert biomass into energy [9,10,11]. The two most important methods of conversion are conversion to power and to biofuel [12]. For the former, one of the most feasible and productive ways is thermochemical conversion [13]. Among the thermochemical processes, gasification is one of the most effective and studied methods to produce energy and fuels from biomass due to its capacity to handle different biomass feedstock [13,14,15,16]. Gasification, through the partial oxidation of the biomass at high temperature in the range of 800–1000 °C [17,18], with air, oxygen, and/or steam as a gasifying agent, allows for the production of a final product called syngas [19]. The application of biomass gasification to power generation has shown many important environmental benefits [20]. Syngas is mainly made up of CO, H2, and CH4; the remaining part consists of the non-combustible gases N2 and CO2 [21,22]. Obviously, depending on the quality of the biomass, particle size, gasifier type, operating conditions, and gasification agents, there are different compositions of the resulting syngas [23,24]. High-quality syngas is often characterized by low N2 content, high H2 content, low tar levels [25], and a high heating value [26].
Many studies have focused on the use of syngas produced from biomass gasification as an alternative fuel in engines in order to substitute fossil fuels with clean energy [27,28] and on the response of rapid compression machines to the composition of different fuels [29,30]. A gasification process combined with the cogeneration of heat and power has been considered more and more important, especially as a consequence of the growing interest toward small sizes plant [31]. In recent years, a considerable number of syngas-powered engines [32,33] have been developed, but the majority of them are based on a spark-ignition (SI) combustion system and studies have demonstrated that this engine is not suitable for this kind of fuel because the fluctuation of the syngas components makes it difficult to achieve stable combustion [21,34,35]. Therefore, the best approach seems to be the high pressure ratio [27,36].
Roy et al. [37] studied the effect of hydrogen content in syngas produced from biomass on the performance of a fuel engine and demonstrated that the engine power with a high H2 content was greater than that obtained with low H2. Akansu et al. [25] experimentally investigated the combustion and emissions characteristics of internal combustion engines fueled by natural gas/hydrogen blends and concluded that NOx emissions generally increased with increased hydrogen content. Pilatau et al. [23] studied the ICE behavior with syngas from different biomass sources in a system where the exhausted ICE gases fed the gasifier and provided a method for selecting the type of main fuel used for the engine based on the chemical composition of the syngas and taking into account the engine operating parameters.
The first aim of this paper was to investigate the most available biomass waste on Italian soil in order to choose those with the best features to be gasified. Next, we proposed a simulation plant using Aspen Plus software that considered both the gasification system and the ICE. The type of gasifier analyzed was a bubbling fluidized bed gasifier, which has a lot of benefits for biomass conversion due to the good heat and mass transfer between the gas and solid phase, the high fuel flexibility and uniformity, and the easier to control temperature [38]. The gasification model was based on the restricted chemical equilibrium. The ICE was simulated with a gas turbine [39,40], fixing the pressure drop corresponding to the chosen engine. Gasification is very sensitive to some operation parameters often considered in the performance analysis such as the steam to biomass ratio, air equivalent ratio, or stoichiometric ratio [41,42]. The sensitivity analysis conducted in the simulation varied the gasification temperature, the air equivalent ratio (ER), and the steam to biomass ratio (S/B), thus allowing us to determine the best syngas composition to feed the ICE. Then, the ICE behavior was investigated through the electrical efficiency and the cogeneration efficiency.

2. Materials and Methods

2.1. Biomass Waste

The biomass waste can be classified in four categories: shells (i.e., hazelnuts, walnuts, almonds); pruning (i.e., of olives, vines, hazelnuts), straws (i.e., of wheat, corn, barley); and agro-industrial residues (i.e., exhausted olives). The chemical and physical characteristics of these biomass wastes are shown in Table 1.
To select the biomass waste to be used in the gasification process, the first criterion to be considered was the feedstock availability on a significant scale (t/year). Then, the second criterion was the LHV, which has to be high, so biomass waste with a lower humidity is preferable. Another aspect to pay attention to is the density of the biomass waste as it significantly affects the storage and, in a fluidized bed gasifier, should be comparable with that of the bed. The size and shape of the biomass waste are also important, in fact, the waste must be processed to a uniform size or shape to feed into the gasifier to ensure homogeneous and efficient gasification. Chemical composition is another important characteristic that must be considered, especially the content of sulfur, chlorine, and ash [14].
To sum up, the following characteristics have to be taken into account during the choice of biomass waste for the gasification process:
  • Availability;
  • LHV;
  • Bulk density;
  • Cutting and shape;
  • Elemental composition, volatile substances, and ash.
From the research published by Enama [43], which referred to Italy, we selected the most suitable biomass with the characteristics listed above and report them in Table 2 [18,44,45].
Table 3 [44,46,47] shows the proximate and ultimate analysis of the various biomass waste types used in this study.
For the analysis presented in this paper, we selected four biomass waste sources from Table 2, each of them belonging to one of the four categories of biomass waste reported in Table 1. The biomass sources chosen, with consideration of the greatest availability and LHV within the categories, were:
  • Hazelnut shells, belonging to the shell category;
  • Olive pruning, belonging to the pruning category;
  • Olive pomace, belonging to the exhausted oil; and
  • Wheat, belonging to the straw category.
The diffusion of the biomass waste under examination on Italian soil is reported in Figure 1.

2.2. Process Modeling

For the model developed in this study, the Aspen Plus process model simulator was used. The following assumptions were considered for the simulation:
  • The process is steady state and isothermal [48,49,50];
  • Drying and pyrolysis take place instantaneously, and the volatile products mainly consist of H 2 , CO , CO 2 , CH 4 , and H 2 O [25,46];
  • Char is 100% carbon [51]; and
  • All gases behave ideally.
Equations (1)–(8) are the chemical reactions considered in this work for the gasification process [17,26,52] and are listed in Table 4.
The Boudouard reaction was not considered in this simulation as it does not achieve kinetic equilibrium and causes destabilization in reactor behavior [53].
For the simulation, we analyzed two different configurations:
(1)
Air was used as the only gasifying agent, and the relative Aspen Plus flowsheet is shown in Figure 2;
(2)
Steam was used as the gasifying agent, and the associate Aspen Plus flowsheet is shown in Figure 3.
The stream BIOMASS was specified as a non-conventional stream, as defined by its proximate and ultimate analysis. The BIOMASS stream goes to the RYELD reactor used to simulate the decomposition of the unconventional feed into its conventional components (carbon, hydrogen, oxygen, sulfur, nitrogen, and ash by specifying the yield distribution according to the biomass ultimate analysis in Table 3).
Off products from DECOMP moves in the RSTOIC block to simulate the production of HCl, NH3, and H2S, through the reactions (7) and (8), by considering the fractional conversion for H2S and HCl as equal to 1 and NH3 as equal to 0.5 [54], because, in order to have more realistic results, these components cannot be modeled with a chemical equilibrium. The resulting stream S2 moves into a separator SEP, which divides the stream into three sub-streams: volatile part VOLATILE, char part CHAR, and a stream composed of NH3, HCl, and H2S, called H2SNH3. The VOLATILE stream, after mixing with oxidizing fluid, goes in the gasifier GASIF. The CHAR stream is split into two sub-streams: S3, which represents the un-reacted char, and S4, which represents the char that reacted in the gasifier.
To simulate the gasification process in Aspen Plus, we used a RGibbs reactor, called GASIF in the flowsheets of Figure 2 and Figure 3, modeled with the restricted chemical equilibrium, which allowed us to describe the syngas composition more accurately than the equilibrium models. Equations (1)–(6) of Table 4 are the chemical reactions considered in this work for the gasification process. The restricted chemical equilibrium can be obtained by choosing the calculation option “Restrict chemical equilibrium-specify temperature approach or reactions” in Aspen Plus and specifying the zero temperature approach for each reaction in the gasifier model. In this way, the RGibbs evaluates the chemical equilibrium constant for each reaction at the reactor temperature, thereby giving the equilibrium gas composition [55,56]. In the present model, tar formation and catalyst deactivation were not taken into account. The block CYCLONE represents the simulation of gas cleaning, where solid parts are separated from gas. We only considered this step of cleaning because an engine needs gas at low temperature to have low density, so this type of cleaning is sufficient for our purposes. Therefore, the stream GAS2 goes into a cooler called COOLING in Figure 2 and Figure 3 that represents the cooling of syngas before its entrance into the internal combustion engine, which was simulated with a gas turbine and composed of the block COMPR and the block TURBINE. At the end, the EXHAUST stream goes into a cooler UTIL to achieve the chosen utilization temperature.
The configuration presented in Figure 3 is the same as that of Figure 2 except for the utilization of steam instead of air: the stream WATER goes into the cooler, called COOLING2, which is a counter-current heat exchanger where syngas loses temperature and water is lifted up to the saturation temperature that becomes the STEAM stream. Therefore, the following Table 5 and Table 6 showing the ASPEN units and the system operating conditions, are valid for the flowchart presented in Figure 2 and in Figure 3.

3. Internal Combustion Engine Simulation

The ICE was simulated as a gas turbine in this paper. The process parameters are shown in Table 7 and discussed in Section 4.7 for the reference case of hazelnut shells and olive pruning feeding. The gas turbine engine was fed with syngas at an ambient temperature (30 °C) that was compressed by up to 20 bar pressure before entering the turbine [39,40].

4. Results and Discussion

In this simulation, we considered 1 MWth as the input size and the HHV of each of the four biomass wastes analyzed and the feed was fixed in this way: for the hazelnut shells, the input flow settled at the constant flow rate of 180 kg/h; for the olive pruning, the input flow settled at the constant flow rate of 170 kg/h; for the olive pomace, the input flow settled at the constant flow rate of 153 kg/h; and for wheat straw, it was settled at the constant flow rate of 179 kg/h.
In the first configuration with air, the gasification agent considered was at the constant flow rate of 159 kg/h at 25 °C and 1 bar.
Focusing on the syngas composition out of the gasifier, a sensitivity study was carried out by varying:
  • The gasifier operating temperature to verify the influence of gasification temperature on the syngas composition, from 785 to 870 °C, in case of air as oxidant agent;
  • The ER, to analyze the system reaction changing the input flow of air by varying the equivalent ratio from 0.2 to 0.6, but keeping the gasification temperature constant at 800 °C in order to evaluate the decrease in the energy needed for the gasification reaction (thermal energy that has to be added);
  • The gasifier operating temperature and ER simultaneously to evaluate the LHV of the syngas and the cold gas efficiency η C G , which represents the fraction of energy in the biomass feed that can be acquired as energy from the use of the produced syngas. The cold gas efficiency was calculating using the following equation:
    η C G = M s y n · L H V s y n M b i o m a s s · L H V b i o m a s s ,
    where M s y n and M b i o m a s s are the mass of the produced syngas and the original biomass, respectively; L H V s y n and L H V b i o m a s s are the LHV of the produced syngas and the original biomass, respectively.
  • The steam to biomass (S/B) ratio, in the configuration of Figure 3, to study the possible improvements of the plant efficiency when more steam was delivered to the gasifier.

4.1. Syngas Composition

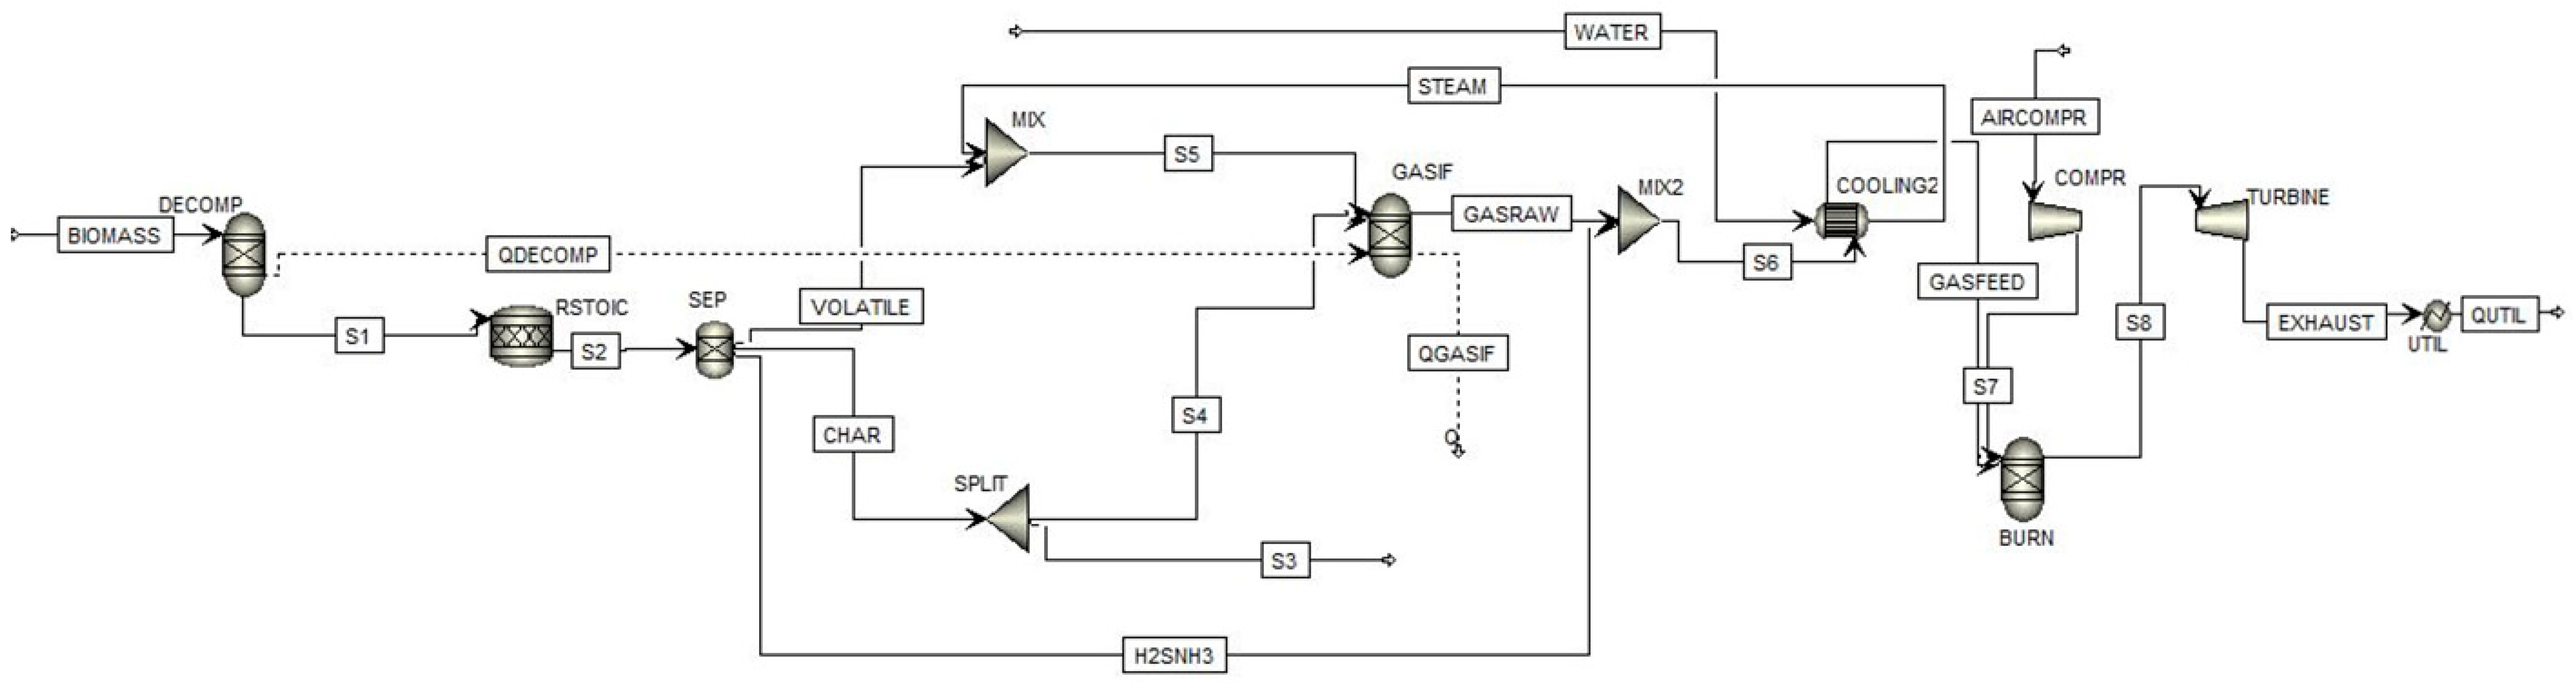
At the gasification temperature of 800 °C and with the input flow rate declared above, with air as the gasifying agent, the simulation was conducted in Aspen Plus, as shown in Figure 2. The compositions of the product syngas for each biomass waste analyzed are shown in Table 8.

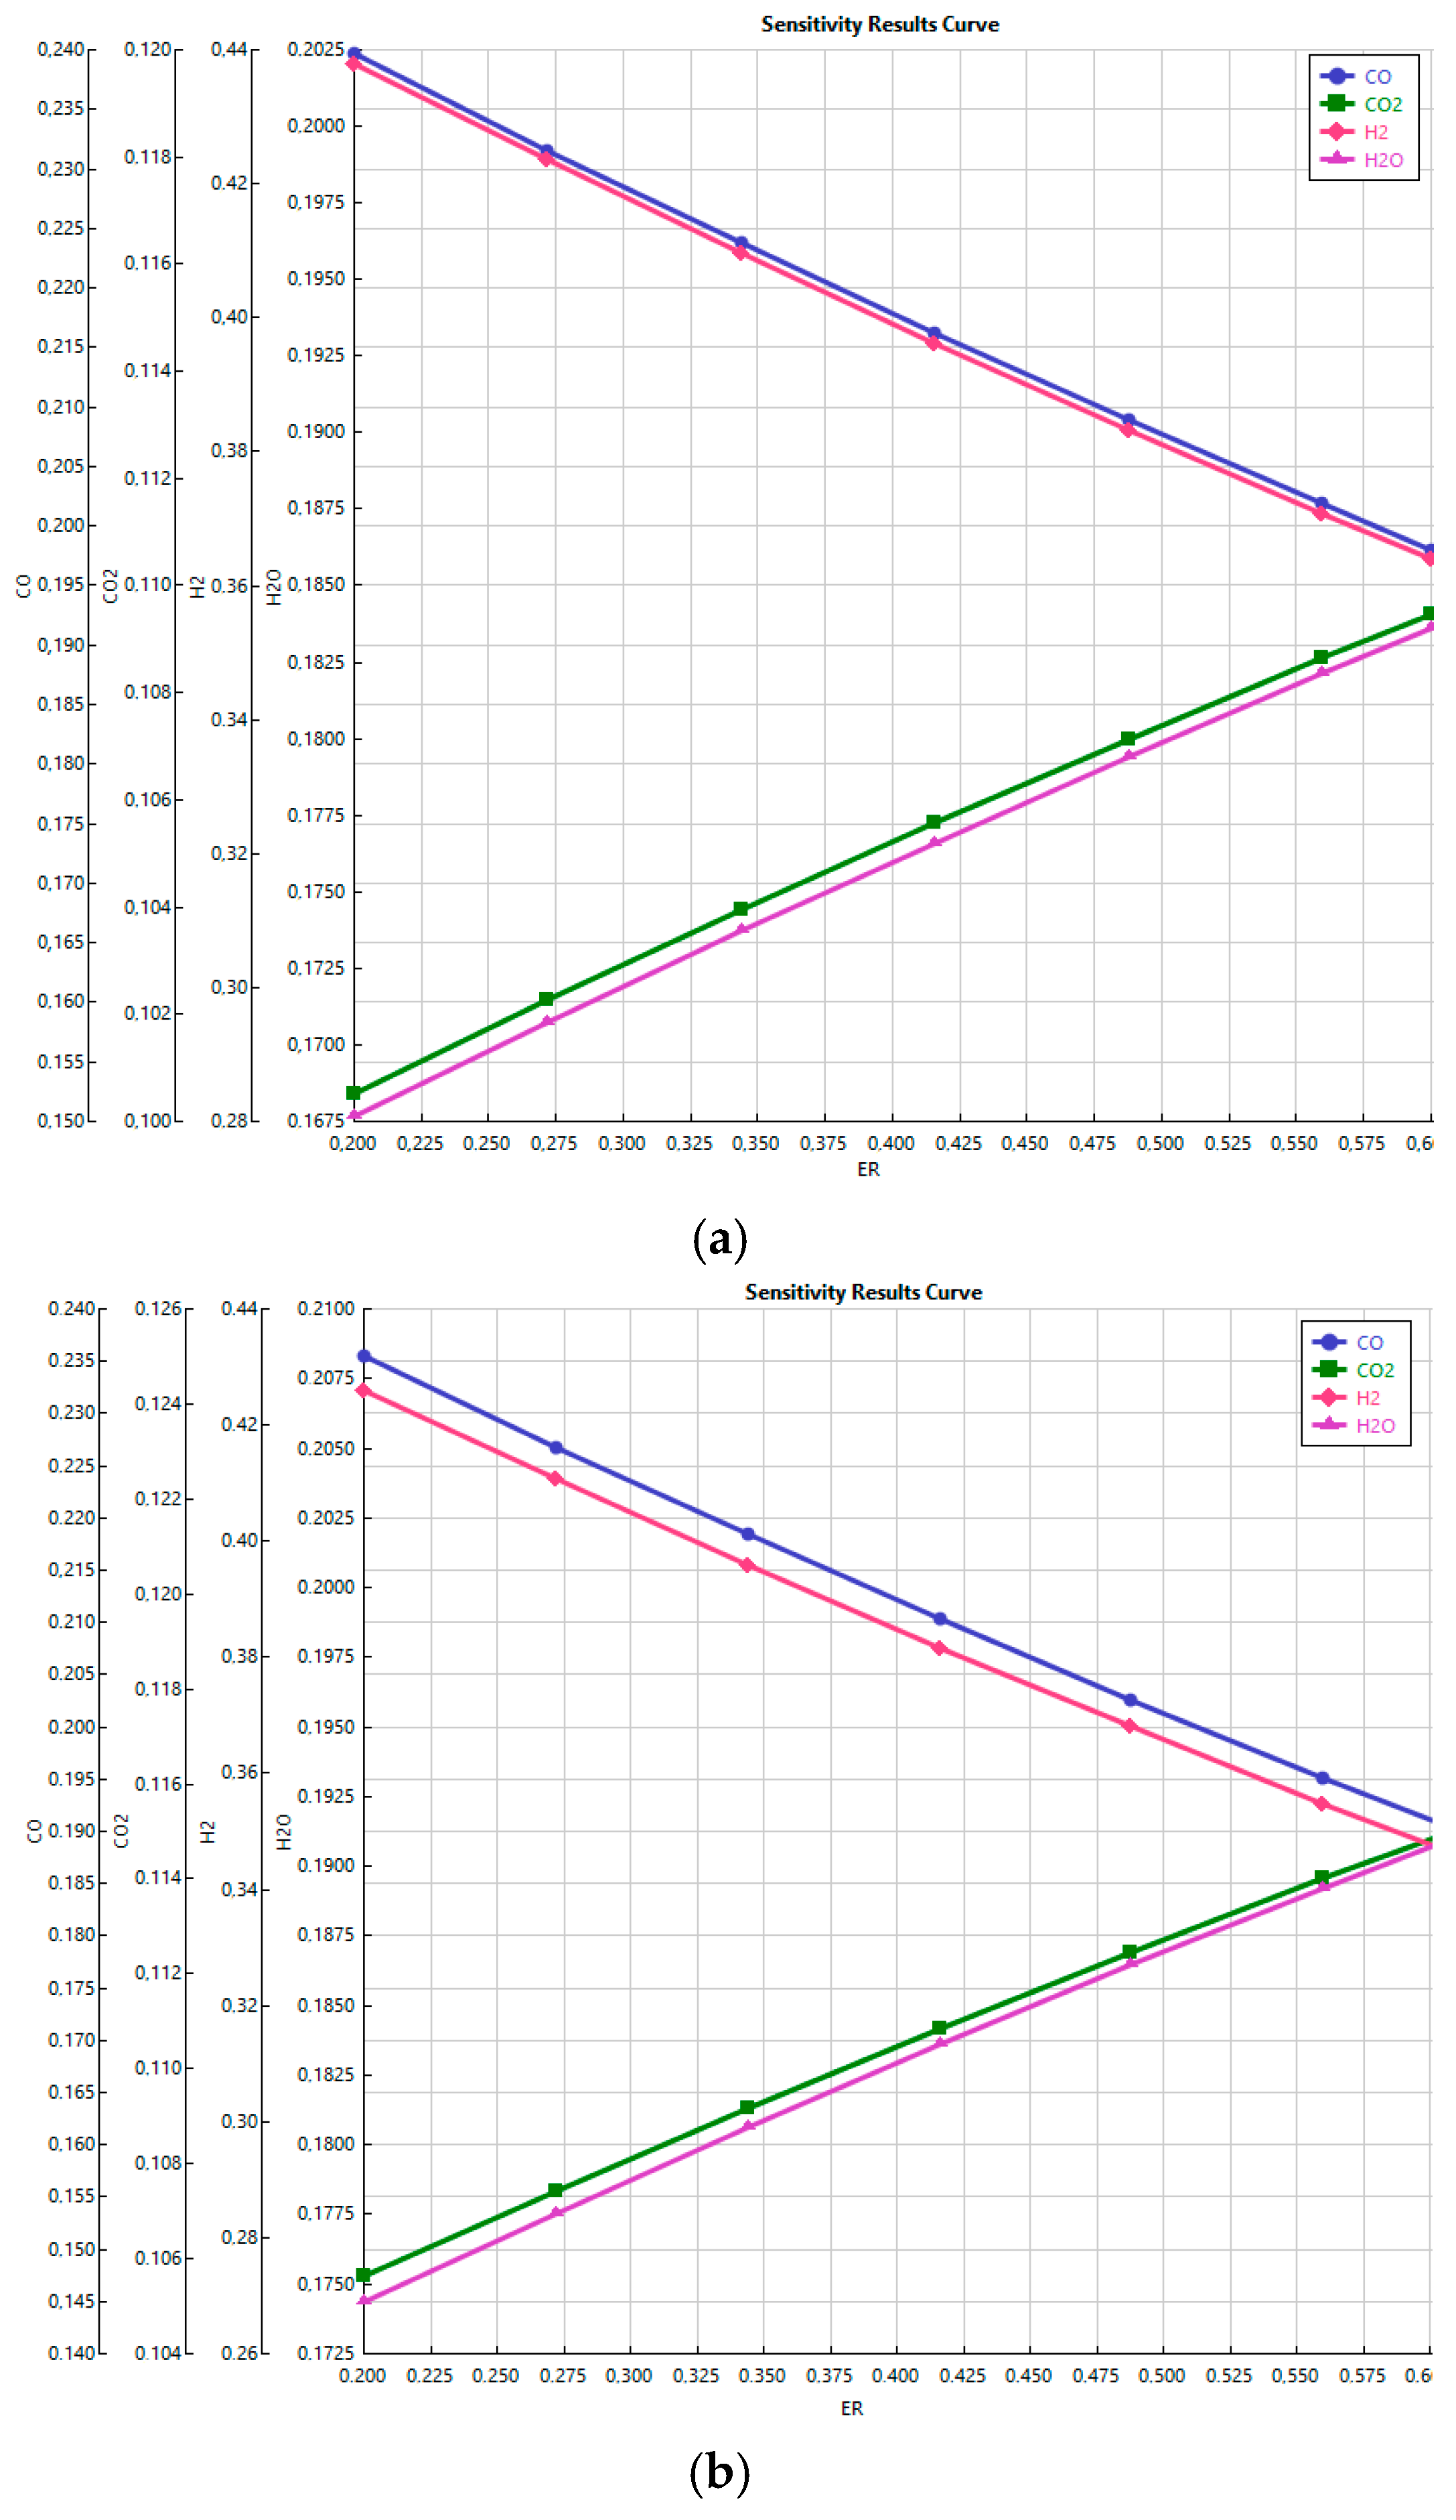
4.2. Effect of Gasification Temperature

The syngas composition, in the stream GASRAW as defined in 
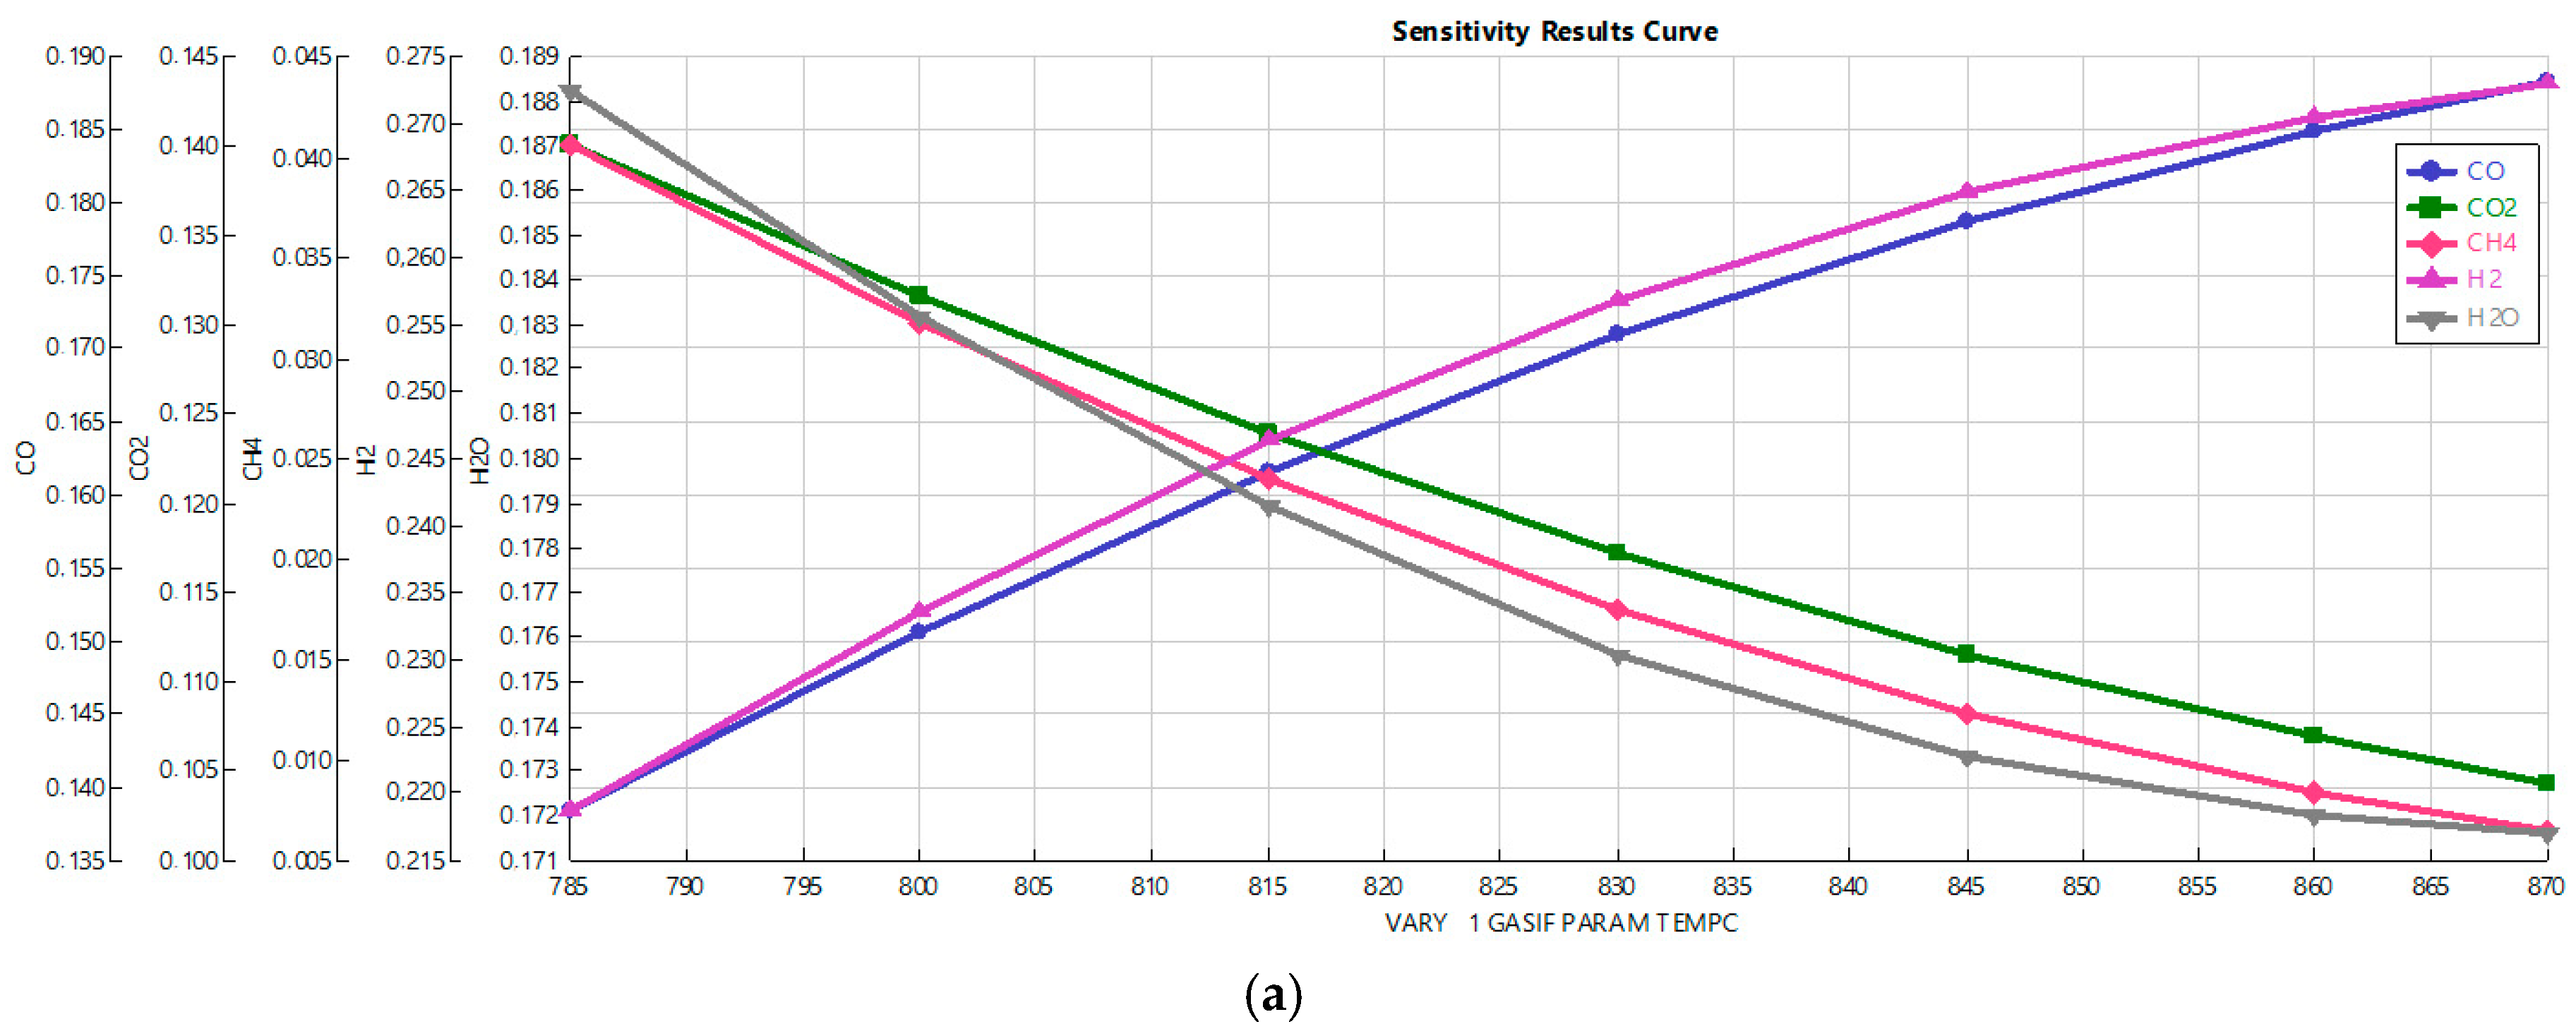
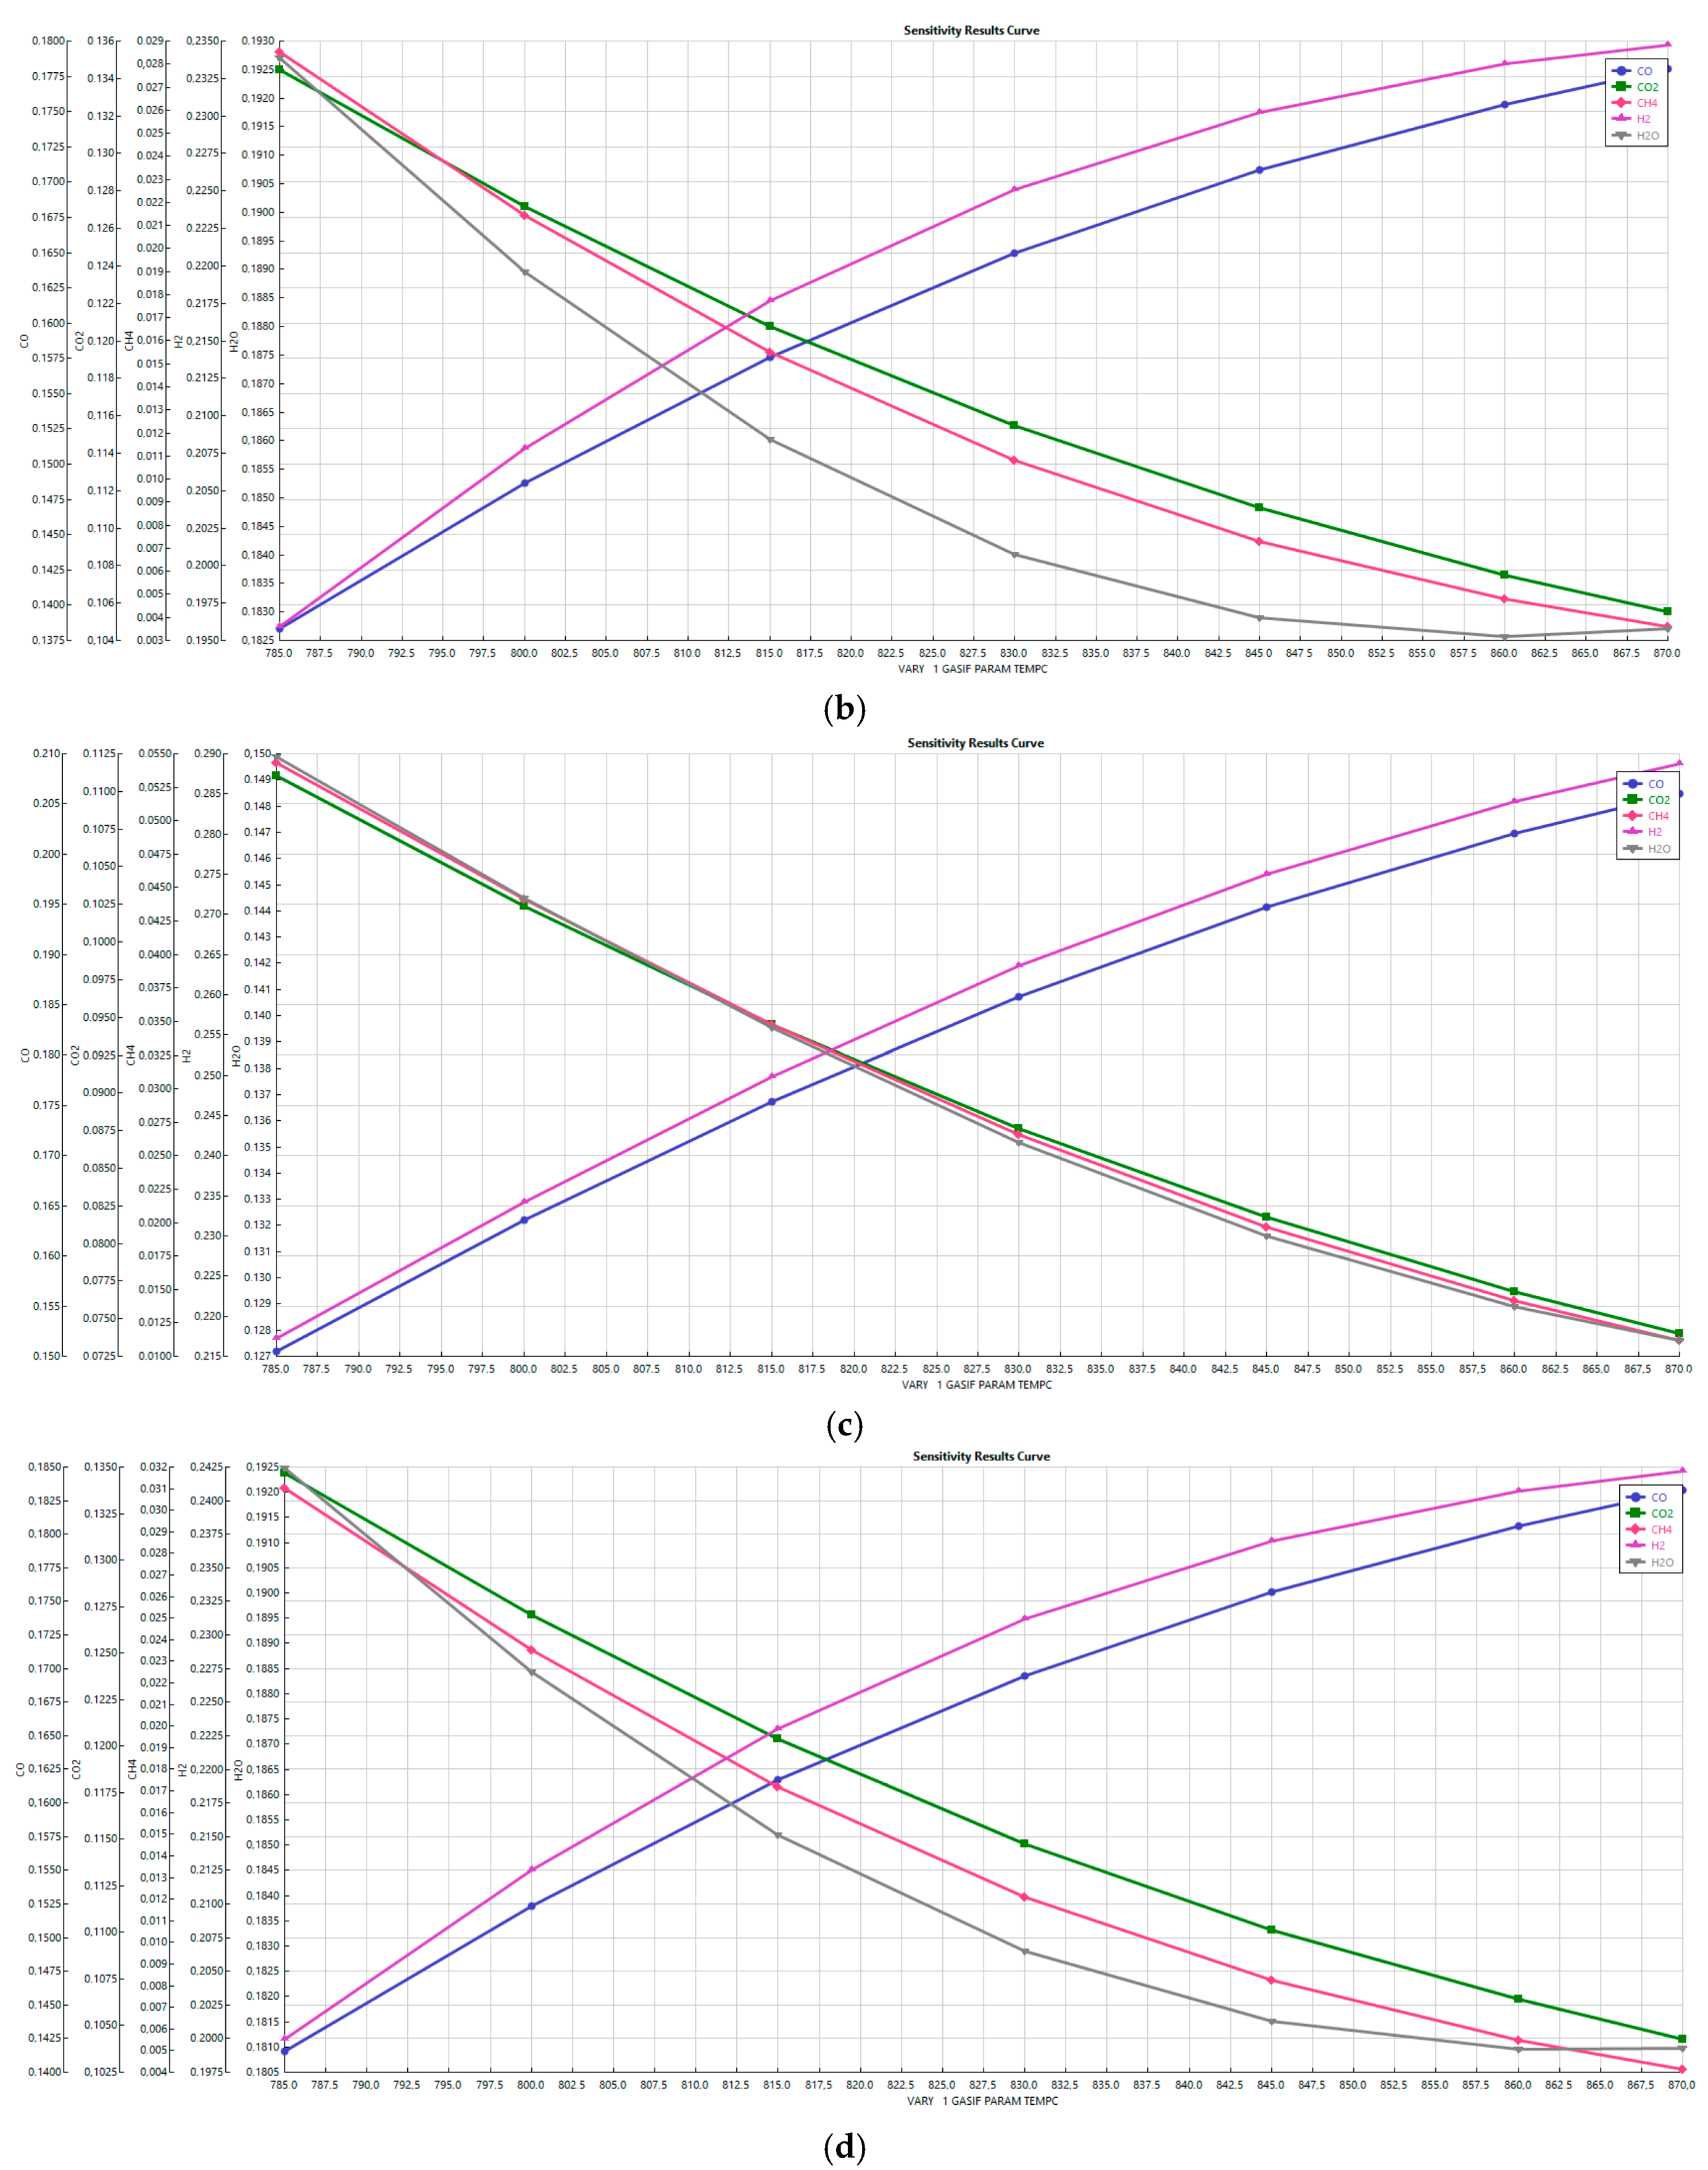
Figure 2, was obtained by varying the gasification temperature between 785 and 870 °C. The sensitivity analysis conducted for the hazelnut shells is shown in Figure 4a, for the olive pruning in Figure 4b, for olive pomace in Figure 4c, and for wheat in Figure 4d.
From Figure 4a–d, it can be observed that the concentrations of CO and H2O increased with an increase in temperature, instead the concentrations of CO2 and CH4 decrease with increasing in temperature. Similar trends were reported in [55]. The endothermic reactions (3) and (6) reported in Table 4 favor their forward reaction with increasing gasification temperature and will result in an increase of the concentration of CO and H2 and a decrease of CO2 and CH4. However, the decrease of CH4 is mostly determined by the effect of steam methane reforming, which is prevalent at high temperature.
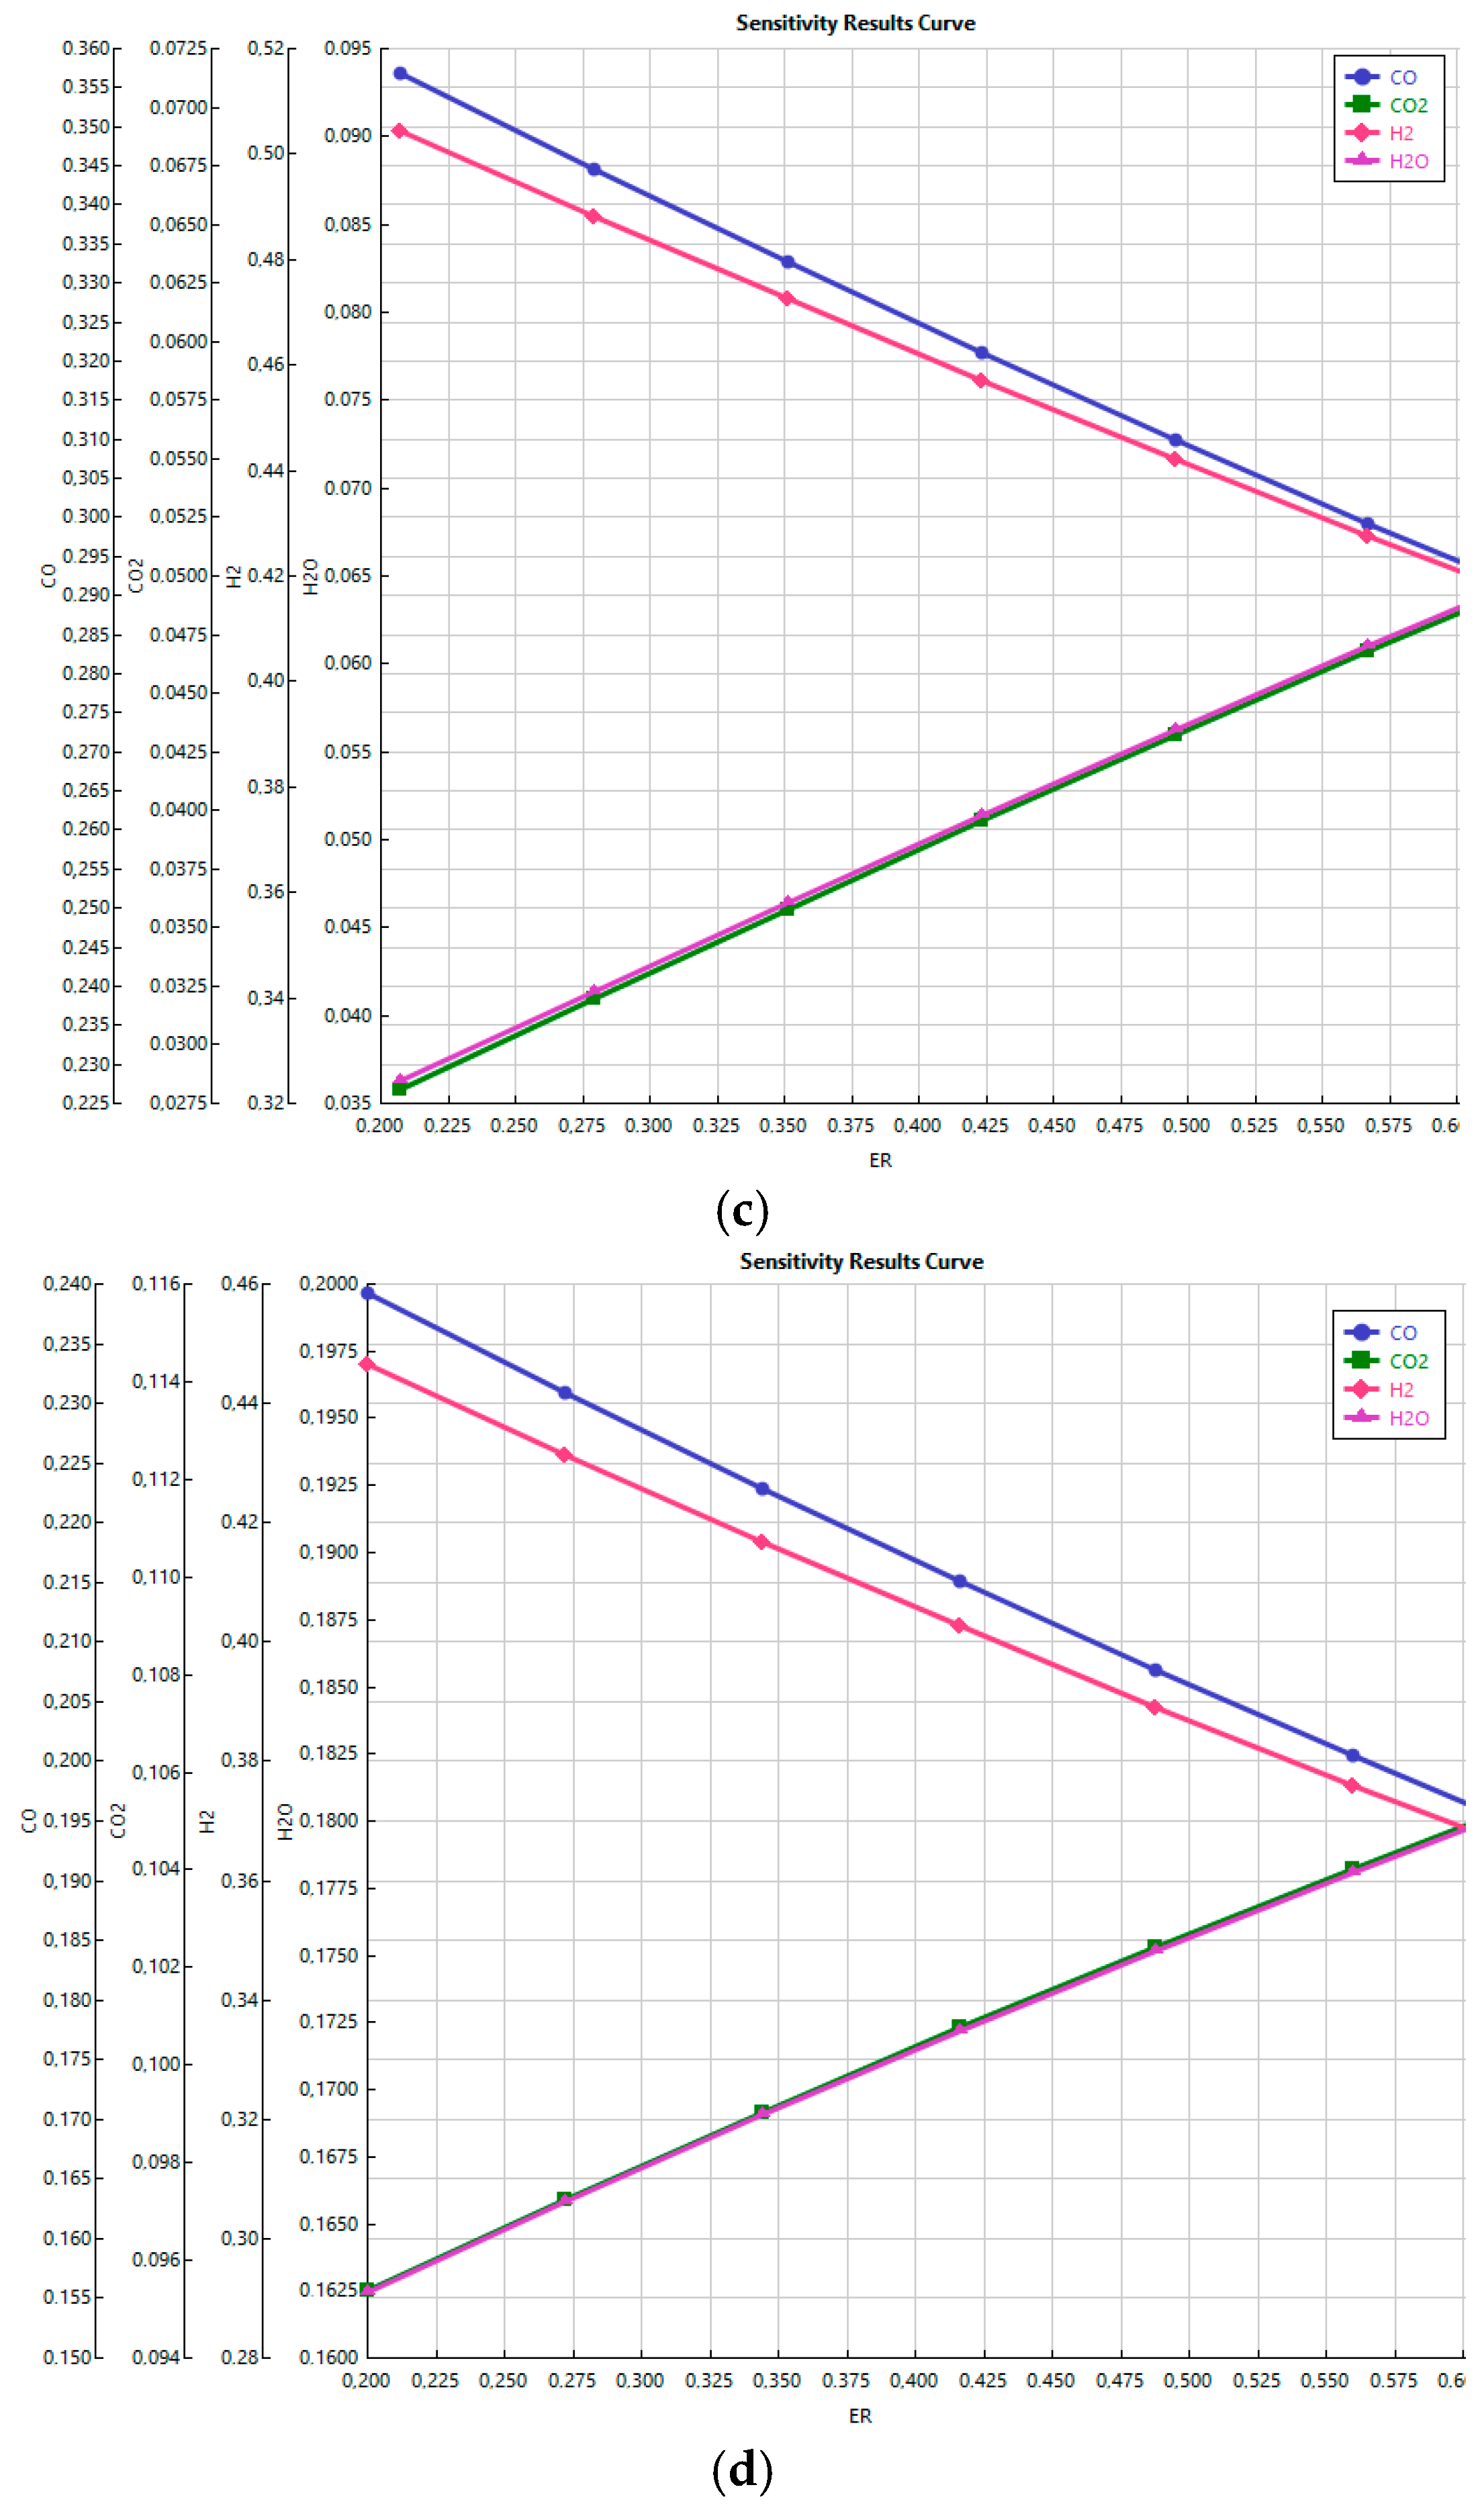
4.3. Effect of ER

The effect of ER on syngas composition was investigated. Figure 5a–d show the trend of syngas composition by varying ER from 0.2 to 0.6 and maintaining the gasification temperature at 800 °C.
The trend obtained showed good agreement with the results in the literature. With the increase in ER, the yields of CO2 and H2O increased, and the yields of H
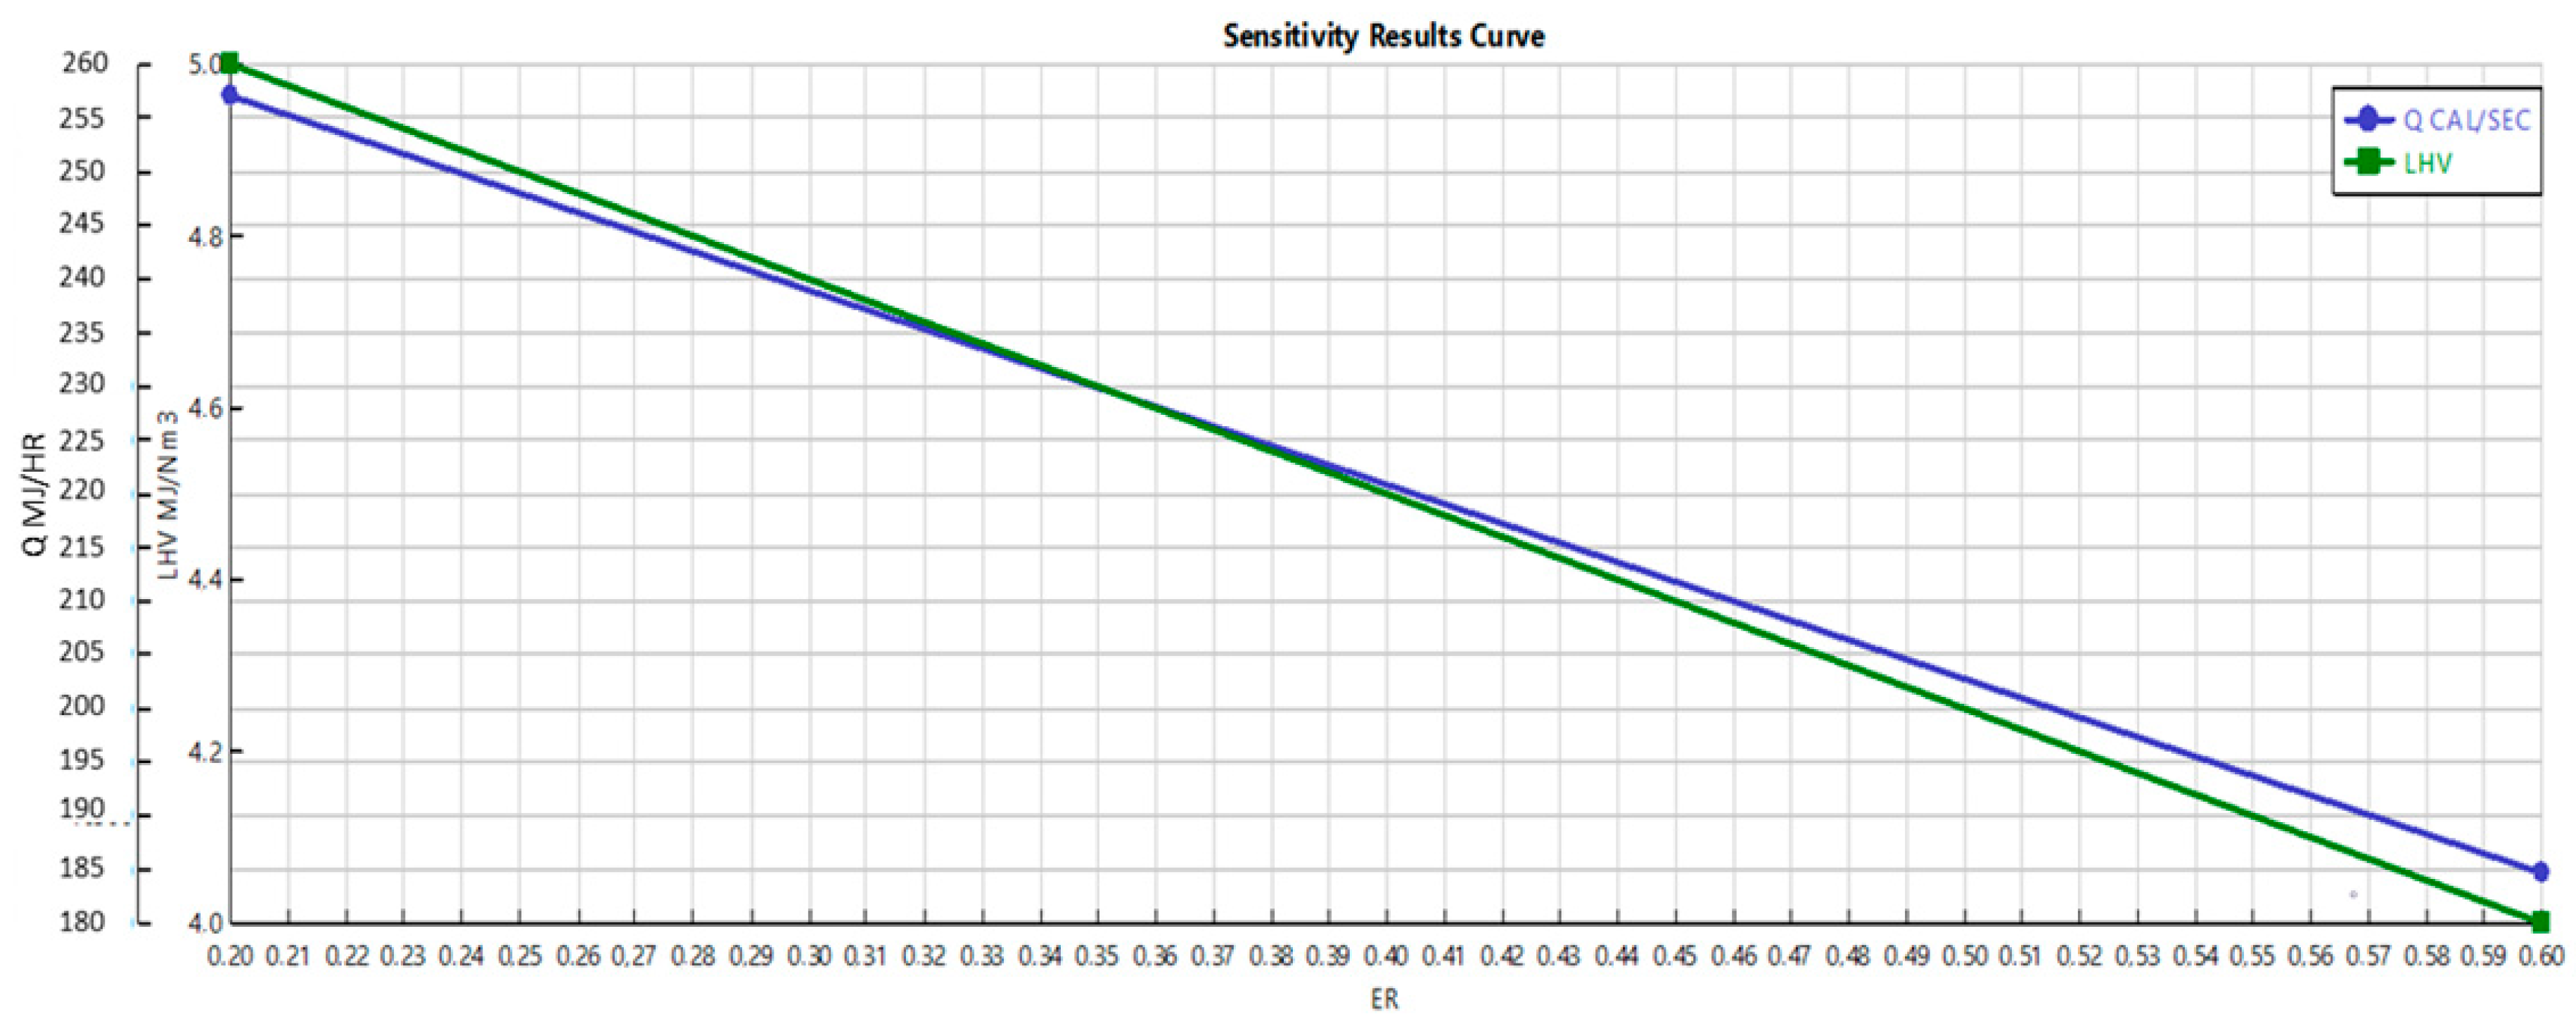
2 and CO decreased. In order to evaluate the thermodynamic balance into the gasifier, Figure 6 shows the gasifier heat required and the LHV of the syngas produced (stream GASRAW), using olive pruning as an example because the others showed a similar trend. The heat required and LHV decreased as the ER increased, as foreseen from the previous figures and from the increase in the oxidant. The LHV varied between 5 and 4 MJ/Nm3, while the heat demand Q varied between 257 and 185 MJ/h. In the example of olive pruning, given the similar results for the other biomass wastes, the gas yield was 1.7 Nm3/kg and the biomass inlet was 170 kg/h, so the variation of 1 MJ/Nm3 of the LHV corresponded to a variation of 100 MJ/h while the Q variation was 72 MJ/h. As the LHV decreased faster than Q with the increase of the ER and a loss of LHV accounted for more than a decrease of heat demand, the optimum value was lowest at ER = 0.2, when considering the overall energy balance. Indeed, at ER = 0.2, the corresponding values of Q and LHV were the highest (260 MJ/h and 5 MJ/Nm3, respectively), and with an increase in the ER, there was a decrease in efficiency given that the lower LHV was not compensated for by the decrease in the heat demand.

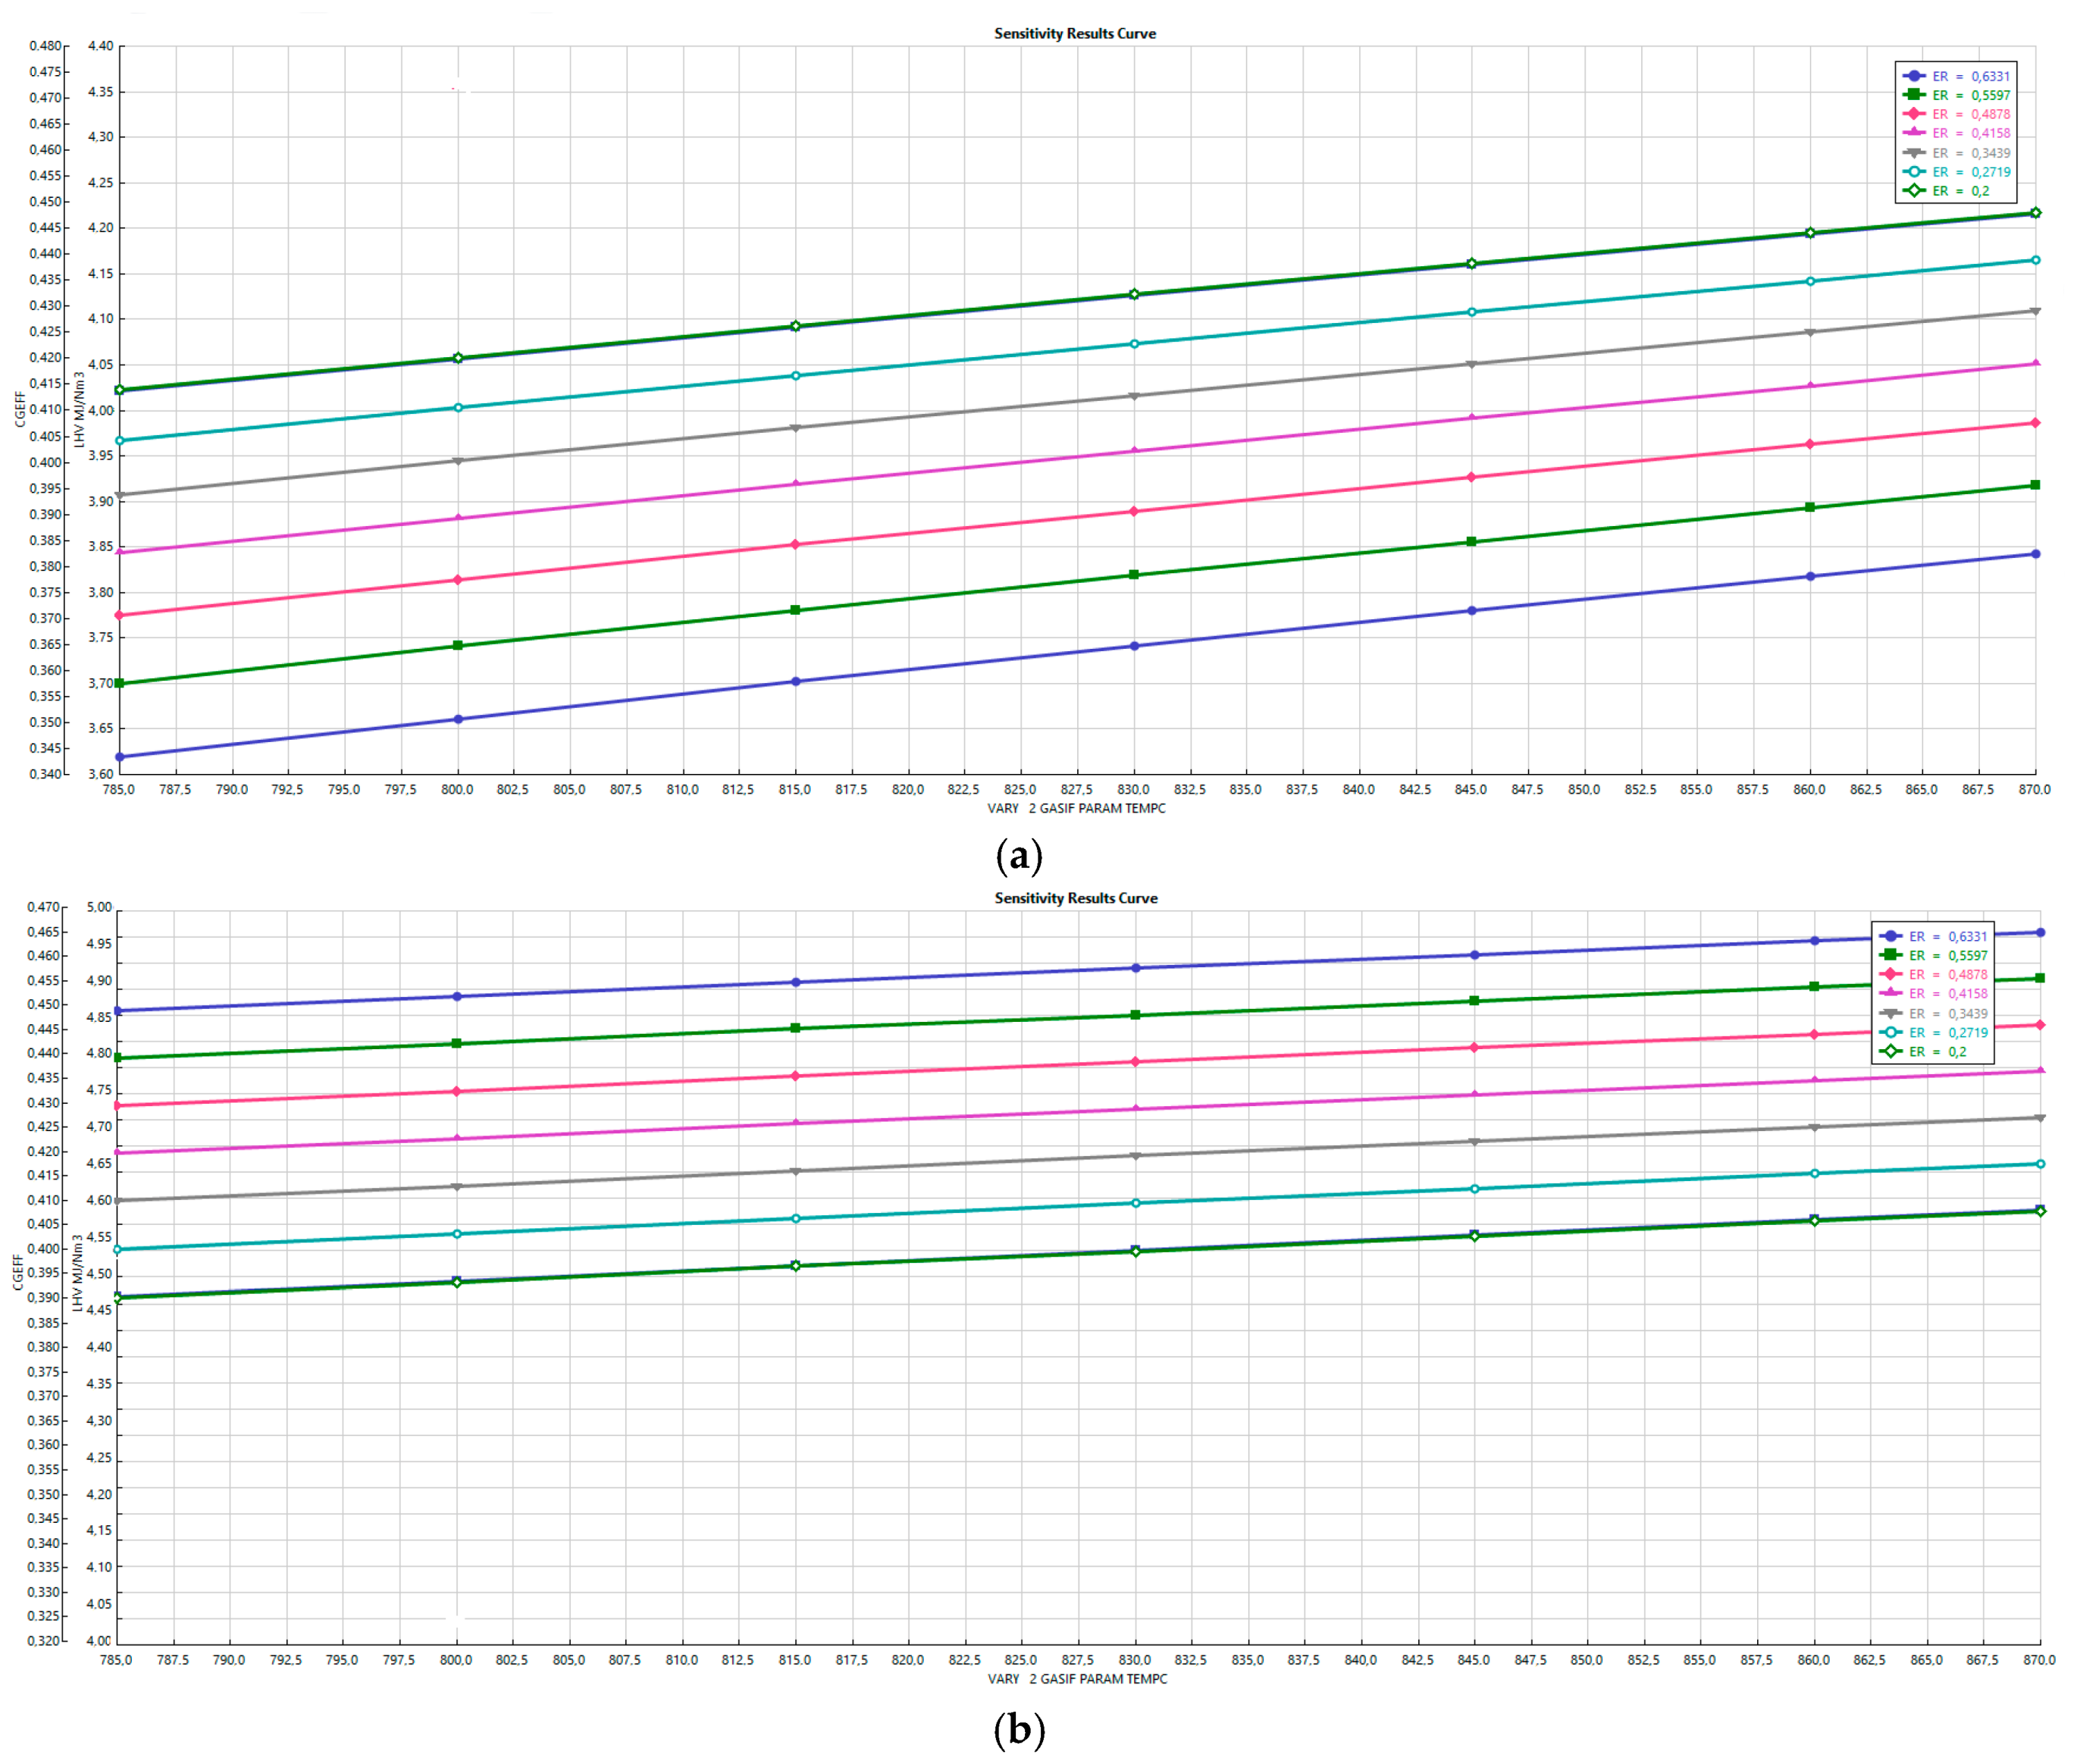
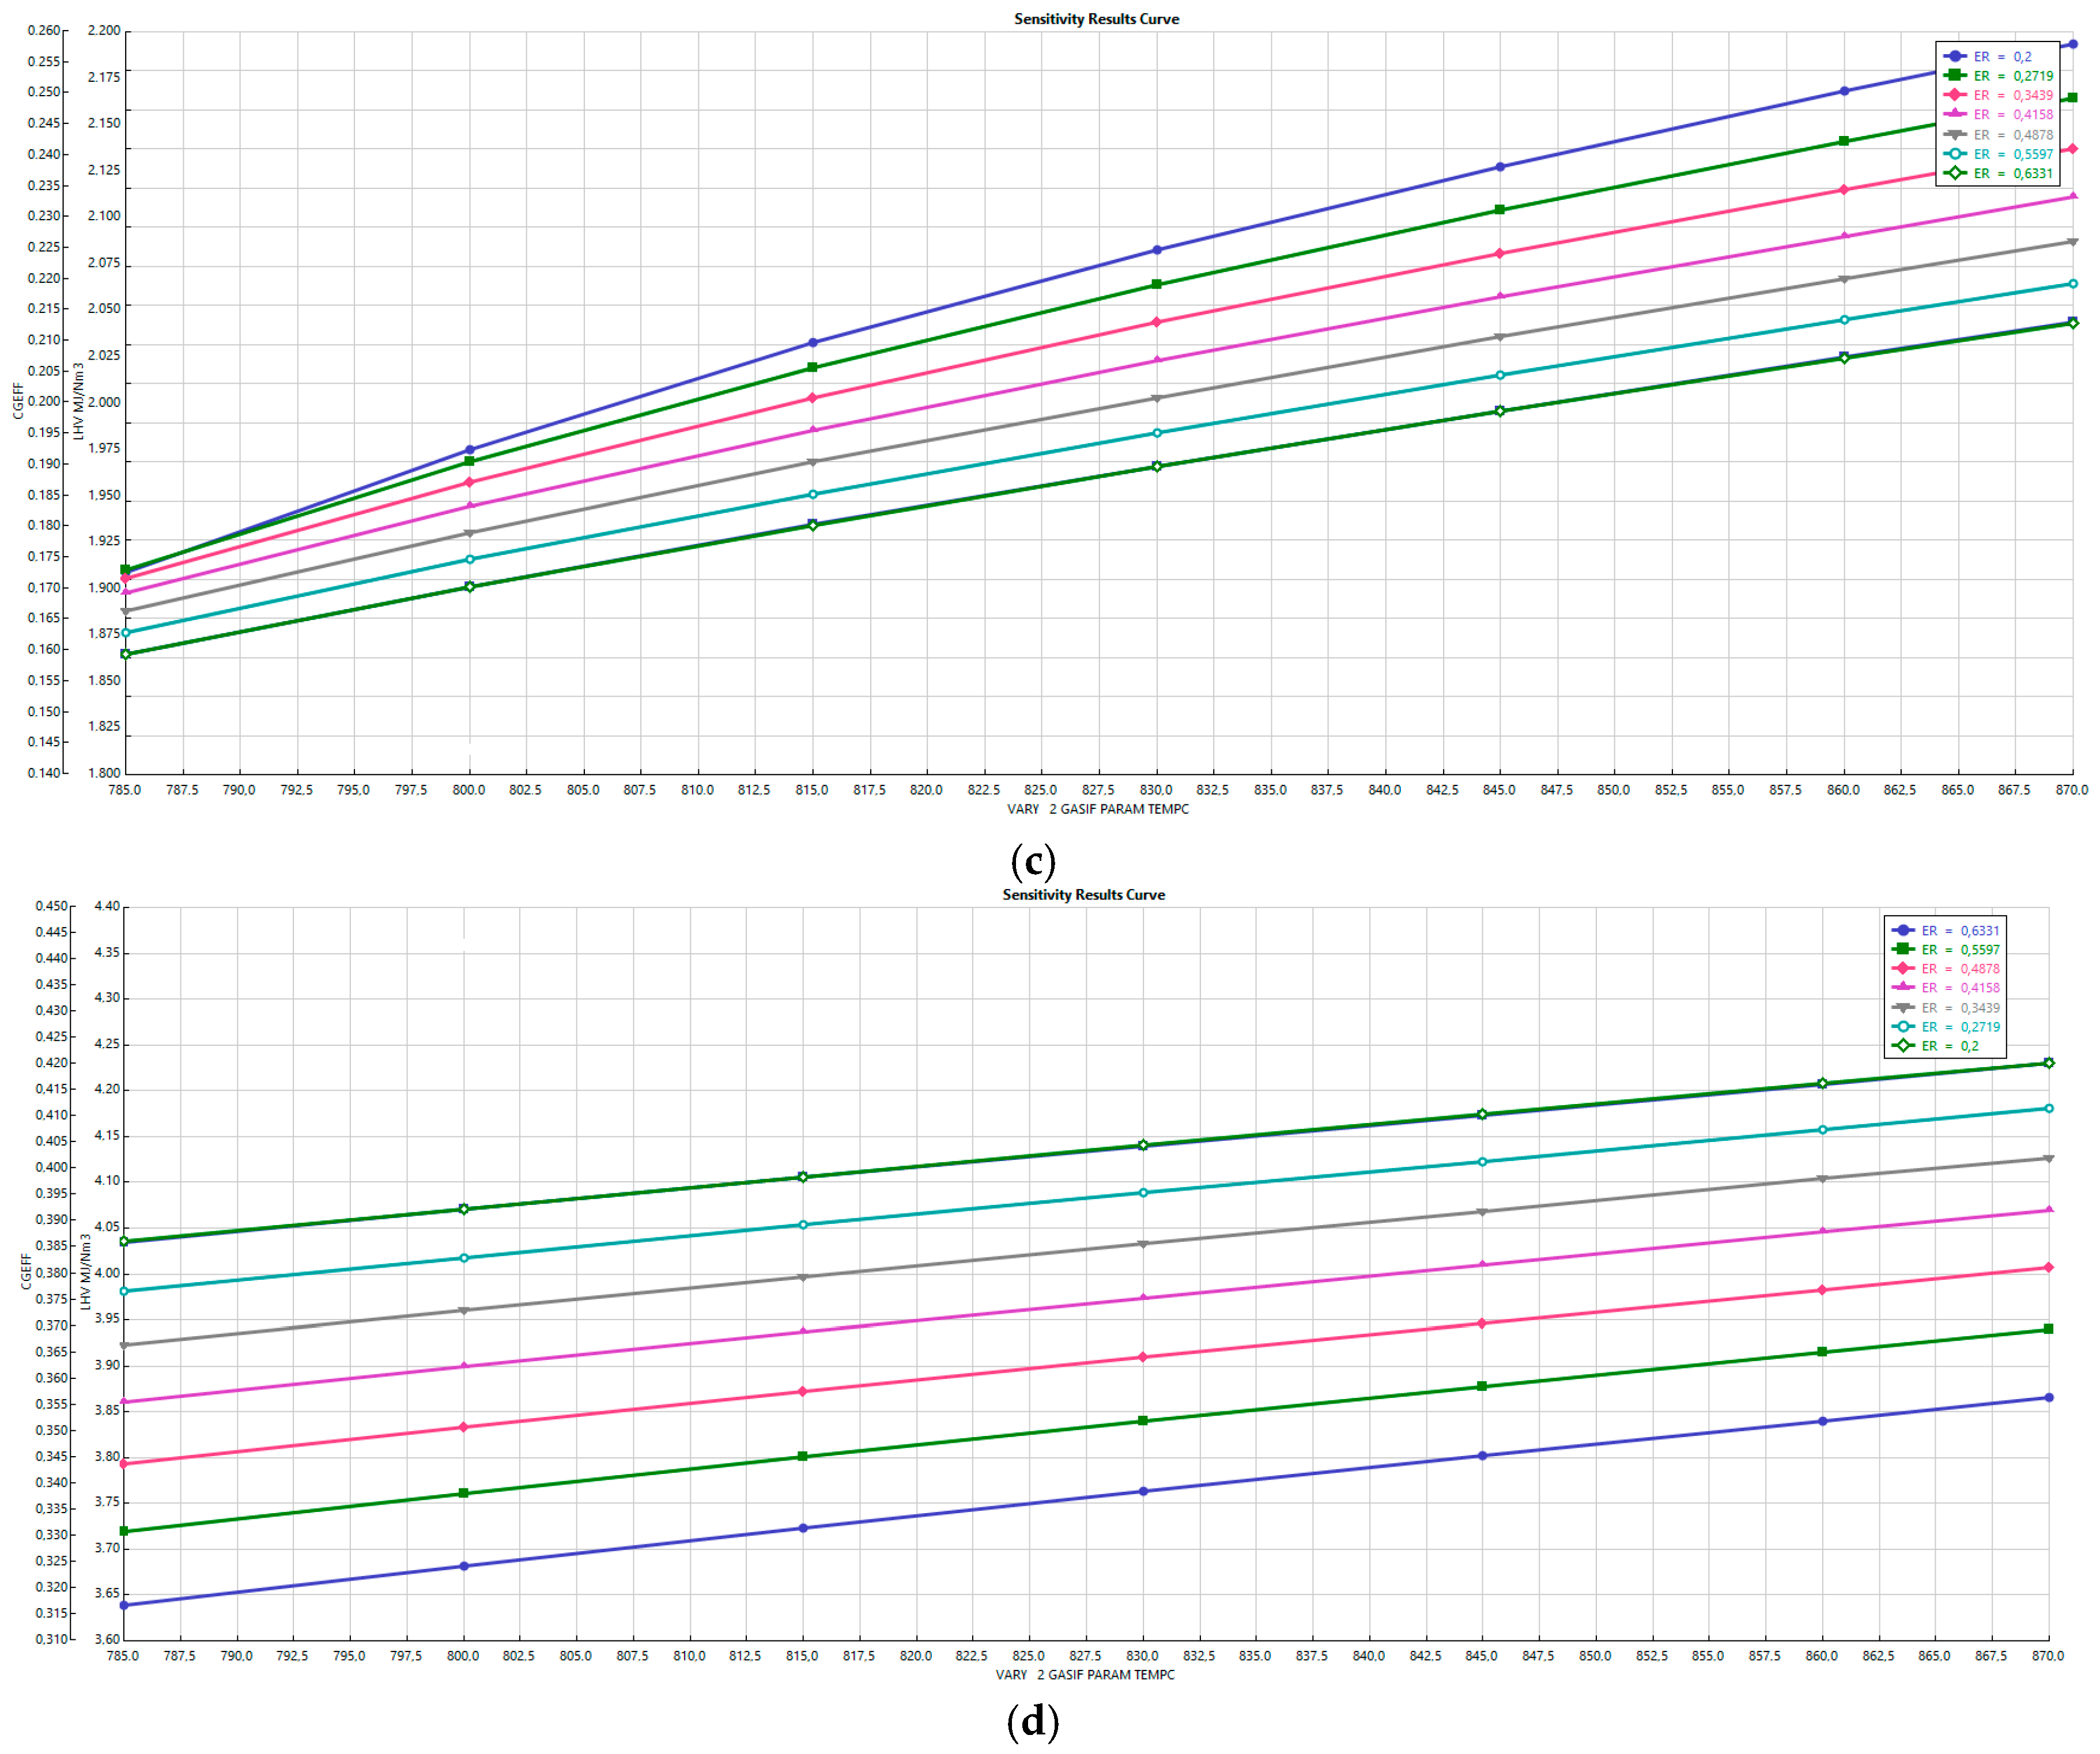
4.4. Cold Gas Efficiency and LHV vs. Gasification Temperature and ER

In Figure 7a–d, it can be seen that the value of the cold gas efficiency, named CGEFF, and the LHV (MJ/Nm3) on the y-axis, was obtained by varying the gasifier temperature corresponding to the parametric curves representing the ER.
As shown in Figure 7a–d, the cold gas efficiency and the LHV decreased as the ER increased; according to Figure 6, they showed increasing behavior as the temperature rose, so higher values of ER are not useful because the lower value of LHV means that lower heat can be generated through gas combustion, which leads to lower net power from the turbines. The best combination of LHV and cold gas efficiency for each biomass waste was:
-
Hazelnut shells, η C G = 42% and LHV = 4 MJ/Nm3 at 870 °C and ER = 0.2;
-
Olive pruning, η C G = 46.4% and LHV = 5 MJ/Nm3 at 870 °C and ER = 0.2;
-
Olive pomace, η C G = 26% and LHV = 2.2 MJ/Nm3 at 870 °C and ER = 0.2;
-
Wheat straw, η C G = 41% and LHV = 4 MJ/Nm3 at 870 °C and ER = 0.2.
However, the necessary ER calculated for the total combustion considered an excess of air of 10%, which was equal to 0.27. Therefore, the best values of LHV and cold gas efficiency obtained by moving the parametric line representing ER = 0.27 in Figure 7a–d are:
-
Hazelnut shells, η C G   = 43.5% and LHV = 4.15 MJ/Nm3 at 870 °C and ER = 0.27;
-
Olive pruning, η C G = 45.5% and LHV = 4.9 MJ/Nm3 at 870 °C and ER = 0.27;
-
Olive pomace, η C G = 24.5% and LHV = 2.16 MJ/Nm3 at 870 °C and ER = 0.27;
-
Wheat straw, η C G = 41% and LHV = 4.16 MJ/Nm3 at 870 °C and ER = 0.27.

4.5. Effect of Steam to Biomass (S/B) Ratio

Considering the configuration shown in Figure 3 where the oxidant was only steam, a sensitivity analysis was carried out by varying the S/B parameter between 0.2 to 1.35. The S/B ratio is important to identify the quantitative effects of the addition of steam on the performance of the gasifier. Figure 8a–d show the effect of the S/B ratio on the syngas composition at a gasification temperature of 800 °C for the biomass wastes analyzed.
It was observed that the concentration of H2 increased with the increasing S/B ratio until it reached a maximum; then the concentration decreased. The hydrogen peak was almost at the beginning, which was due to the absence of air and the use of a variable external source of heat. In particular, Figure 8 shows that there was a lower regime of steam to biomass in order to reduce the heat demand, which, as shown in Figure 8, increased with the increase of S/B.
In order to evaluate the thermodynamic balance into the gasifier, Figure 9 shows the gasifier heat required and the LHV of the syngas produced (stream GASRAW). This has been shown only for the example of hazelnut shells as the other sources showed a similar trend. The heat required Q and LHV increased as the S/B increased, as foreseen from the previous figures and from the increase in the oxidant. The LHV varied between 6.5 and 9 MJ/Nm3 while the heat demand Q varied between 550 and 1550 MJ/h. In the case of the hazelnut shells, which was similar to that of the other waste sources, the gas yield was 1.56 Nm3/kg and the biomass inlet was 180 kg/h, so the variation of 1 MJ/Nm3 of the LHV corresponded to a variation of 350 MJ/h. Moreover, as shown in Figure 9, the curve representing the LHV had a higher slope and was always stronger with respect to the heat demand Q. For this reason, the optimum had the lowest value of S/B after the intersection point of the two curves. Considering the overall energy balance, a good value of S/B could be 0.2. However, as S/B increased, the LHV also increased. Therefore, each time, a careful evaluation is needed in order to determine the aim of the research. If, for example, the goal was to improve the H2 production or the increment of the LHV value, great heat required for the gasifier could be accepted.

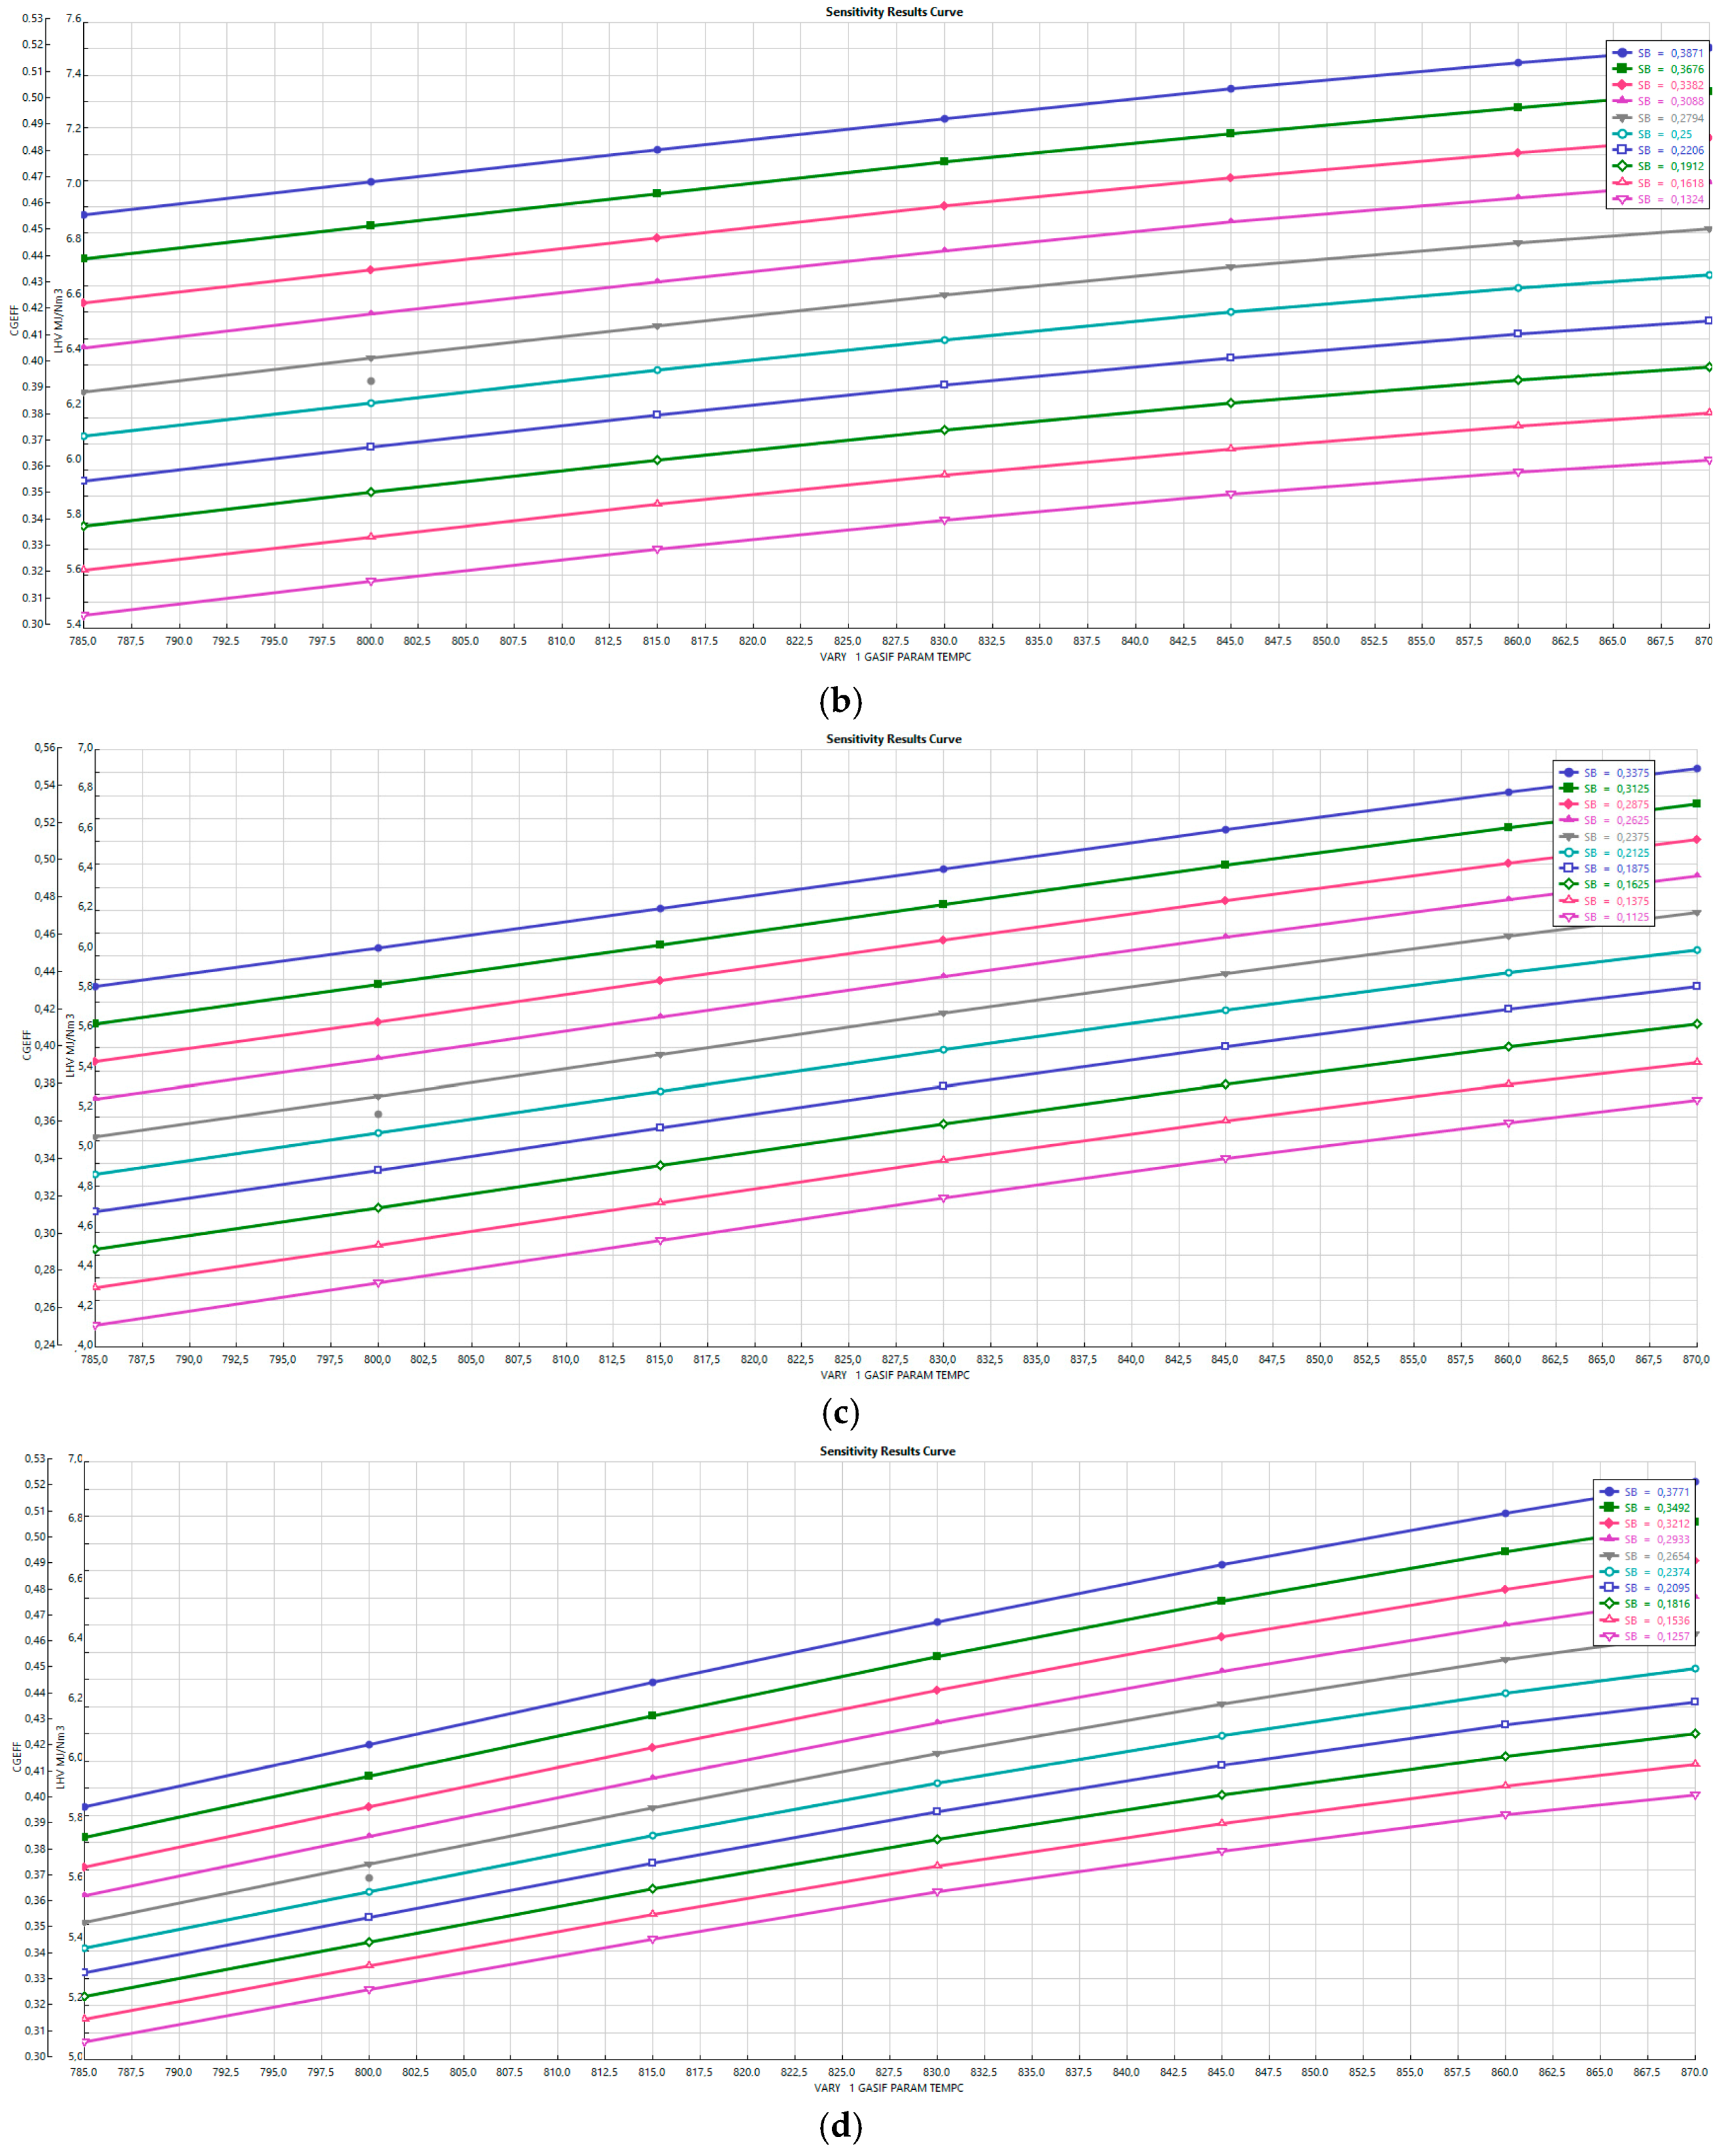
4.6. Cold Gas Efficiency and LHV vs. Gasifier Temperature and S/B

Referring to the configuration shown in Figure 3 where the gasifying agent is steam, the values of the cold gas efficiency and the LHV obtained by varying the gasifier temperature corresponding to the parametric curves representing the S/B are shown in Figure 10a–d.
Considering that the simulation was conducted assuming that S/B = 0.33 and that the increase of S/B means an increase of the heat required, we chose to stay with a low value of steam to biomass. Figure 10a–d show a decrease in the cold gas efficiency and the LHV with the increase in temperature and decrease of the S/B ratio. A comparison between Figure 10a–d shows that the cold gas efficiency was higher for hazelnut shells than for the othr biomass wastes and its maximum value was 58% at 870 °C with a S/B = 0.33. The highest value of LHV and cold gas efficiency for each biomass waste type was:
-
Hazelnut shells, η C G = 58% and LHV = 6.9 MJ/Nm3 at 785 °C and S/B = 0.33;
-
Olive pruning, η C G = 55% and LHV = 6.9 MJ/Nm3 at 785 °C and S/B = 0.33
-
Olive pomace, η C G = 54% and LHV = 6.7 MJ/Nm3 at 785 °C and S/B = 0.33;
-
Wheat straw, η C G = 51% and LHV = 6.8 MJ/Nm3 at 785 °C and S/B = 0.33.

4.7. Internal Combustion Engine Performance

As a result of the consideration explained in Section 4.4 and Section 4.6 by taking into account the highest value of LHV and cold gas efficiency, we chose to analyze the ICE behavior using the example of olive pruning for the configuration of air gasification and the example of hazelnut shells for the configuration of steam gasification. For the two cases under observation, the following Table 9 quotes the electrical efficiency and the cogeneration efficiency, by bringing the exhaust fumes at the utilization temperature of 80 °C and a pressure drop in the turbine of 10 kPa.
The cogeneration efficiency is defined as follows:
η C H P = N T U R B + Q E X C H + Q E X L H V B I O M · M B I O M + Q I N P U T ,
where NTURB is the effective electrical power of the turbine, QEXCH is the heat of the exchangers, QEX is the heat produced to bring the exhausted fumes to 80 °C, LHVBIOM is the lower heat value of the biomass, MBIOM is the mass of the biomass and QINPUT is the heat associate to the Gibbs reactor.
The electrical efficiency is defined as:
η e l = N T U R B L H V B I O M · M B I O M .

5. Conclusions

An Aspen Plus model was developed for the gasification of biomass waste and for power generation from syngas. The most available biomass wastes on Italian soil were investigated to select those most suitable for the gasification process. The main parameters governing the gasification process of biomass waste in a bubbling fluidized bed gasifier using air and steam as the oxidizing agents were discussed. The effect of gasification temperature, ER, and S/B ratio was analyzed and the results showed that it was more useful to work at high temperature, low ER, and with a S/B of around 0.33. The value of the cold gas efficiency and the LHV achieved for each biomass waste in different configurations and operative conditions were studied. The best syngas compositions to feed the ICE were:
  • In the case of air gasification with olive pruning and an ER = 0.27, it had 26% electrical efficiency, 46.5% cold gas efficiency, and 41% cogeneration global efficiency;
  • In the case of steam gasification with hazelnut shells and a S/B = 0.33, it had 30% electrical efficiency, 58% cold gas efficiency, and 64% cogeneration global efficiency.
These results confirm that the gasifier/ICE is an attractive technique when considering the environmental benefits and the electrical efficiency obtained.

Author Contributions

E.B.: concept, methodology and revision of the simulation results; A.C.: biomass analysis in particular regarding the agricultural biomass waste typologies, properties and availability; V.M.: software simulation, draft writing; M.V.: management of the resources, data curation, validation, writing, review and editing.

Funding

This research was chiefly funded by “HBF2.0” research project within Ricerca di Sistema of Italian Ministry of the Economic Development, grant number CCSEB_00224 and partially funded by MIUR (Italian MInistry for education, University and Research), Law 232/2016, “Department of excellence”.

Conflicts of Interest

The authors declare no conflict of interest.

References

  1. Grafakos, S.; Enseñado, E.; Flamos, A.; Rotmans, J. Mapping and Measuring European Local Governments’ Priorities for a Sustainable and Low-Carbon Energy Future. Energies 2015, 8, 11641–11666. [Google Scholar] [CrossRef]
  2. Anifantis, A.S.; Colantoni, A.; Pascuzzi, S. Thermal energy assessment of a small scale photovoltaic, hydrogen and geothermal stand-alone system for greenhouse heating. Renew. Energy 2017, 103, 115–127. [Google Scholar] [CrossRef]
  3. Manzone, M.; Airoldi, G.; Balsari, P. Energetic and Economic Evaluation of a Poplar Cultivation for the Biomass Production in Italy. Biomass Bioenergy 2009, 33, 1258–1264. [Google Scholar] [CrossRef]
  4. Testa, R.; Di Trapani, A.M.; Foderà, M.; Sgroi, F.; Tudisca, S. Economic Evaluation of Introduction of Poplar as Biomass Crop in Italy. Renew. Sustain. Energy Rev. 2014, 38, 775–780. [Google Scholar] [CrossRef]
  5. Zeman, F. Metropolitan Sustainability: Understanding and Improving the Urban Environment; Woodhead Publishing: Cambridge, UK, 11 September 2012; ISBN 9780857096463. [Google Scholar]
  6. Hill, J.; Nelson, E.; Tilman, D.; Polasky, S.; Tiffany, D. Environmental, Economic, and Energetic Costs and Benefits of Biodiesel and Ethanol Biofuels. Proc. Natl. Acad. Sci. USA 2006, 103, 11206–11210. [Google Scholar] [CrossRef] [PubMed]
  7. Ahmadi, P.; Dincer, I.; Rosen, M.A. Development and Assessment of an Integrated Biomass-Based Multi-Generation Energy System. Energy 2013, 56, 155–156. [Google Scholar] [CrossRef]
  8. González-García, S.; Bacenetti, J. Exploring the Production of Bio-Energy from Wood Biomass. Italian Case Study. Sci. Total Environ. 2019, 647, 158–168. [Google Scholar] [CrossRef] [PubMed]
  9. McKendry, P. Energy Production from Biomass (Part 3): Gasification Technologies. Bioresour. Technol. 2002, 83, 55–63. [Google Scholar] [CrossRef]
  10. Orecchini, F.; Bocci, E. Biomass to Hydrogen for the Realization of Closed Cycles of Energy Resources. Energy 2007, 32, 1006–1011. [Google Scholar] [CrossRef]
  11. Caputo, A.C.; Palumbo, M.; Pelagagge, P.M.; Scacchia, F. Economics of Biomass Energy Utilization in Combustion and Gasification Plants: Effects of Logistic Variables. Biomass Bioenergy 2005, 28, 35–51. [Google Scholar] [CrossRef]
  12. Cuellar, A.D.; Herzog, H. A Path Forward for Low Carbon Power from Biomass. Energies 2015, 8, 1701–1715. [Google Scholar] [CrossRef]
  13. Yao, Z.; You, S.; Ge, T.; Wang, C.H. Biomass Gasification for Syngas and Biochar Co-Production: Energy Application and Economic Evaluation. Appl. Energy 2018, 209, 43–55. [Google Scholar] [CrossRef]
  14. Bocci, E.; Sisinni, M.; Moneti, M.; Vecchione, L.; Di Carlo, A.; Villarini, M. State of Art of Small Scale Biomass Gasification Power Systems: A Review of the Different Typologies. Energy Procedia 2014, 45, 247–256. [Google Scholar] [CrossRef]
  15. Chen, H.; Zhang, X.; Wu, B.; Bao, D.; Zhang, S.; Li, J.; Lin, W. Analysis of Dual Fluidized Bed Gasification Integrated System with Liquid Fuel and Electricity Products. Int. J. Hydrog. Energy 2016, 41, 11062–11071. [Google Scholar] [CrossRef]
  16. Kabalina, N.; Costa, M.; Yang, W.; Martin, A. Production of Synthetic Natural Gas from Refuse-Derived Fuel Gasification for Use in a Polygeneration District Heating and Cooling System. Energies 2016, 9, 1080. [Google Scholar] [CrossRef]
  17. Nikoo, M.B.; Mahinpey, N. Simulation of Biomass Gasification in Fluidized Bed Reactor Using ASPEN PLUS. Biomass Bioenergy 2008, 32, 1245–1254. [Google Scholar] [CrossRef]
  18. Dogru, M.; Howarth, C.R.; Akay, G.; Keskinler, B.; Malik, A.A. Gasification of Hazelnut Shells in a Downdraft Gasifier. Energy 2002, 27, 415–427. [Google Scholar] [CrossRef]
  19. Sharma, S.; Sheth, P.N. Air-Steam Biomass Gasification: Experiments, Modeling and Simulation. Energy Convers. Manag. 2016, 110, 307–318. [Google Scholar] [CrossRef]
  20. Rajabi Hamedani, S.; Villarini, M.; Colantoni, A.; Moretti, M.; Bocci, E. Life Cycle Performance of Hydrogen Production via Agro-Industrial Residue Gasification—A Small Scale Power Plant Study. Energies 2018, 11, 675. [Google Scholar] [CrossRef]
  21. Azimov, U.; Tomita, E.; Kawahara, N.; Harada, Y. Effect of Syngas Composition on Combustion and Exhaust Emission Characteristics in a Pilot-Ignited Dual-Fuel Engine Operated in PREMIER Combustion Mode. Int. J. Hydrog. Energy 2011, 36, 11985–11996. [Google Scholar] [CrossRef]
  22. Shilling, N.Z.; Lee, D.T. IGCC—Clean Power Generation Alternative for Solid Fuels; PowerGen Asia: Ho Chi Minh City, Vietnam, 2003. [Google Scholar]
  23. Pilatau, A.Y.; Viarshyna, H.A.; Gorbunov, A.V.; Nozhenko, O.S.; Maciel, H.S.; Baranov, V.Y.; Mucha, O.V.; Maurao, R.; Lacava, P.T.; Liapeshko, I.; et al. Analysis of Syngas Formation and Ecological Efficiency for the System of Treating Biomass Waste and Other Solid Fuels with CO2 recuperation Based on Integrated Gasification Combined Cycle with Diesel Engine. J. Braz. Soc. Mech. Sci. Eng. 2014, 36, 673–679. [Google Scholar] [CrossRef]
  24. Couto, N.; Rouboa, A.; Silva, V.; Monteiro, E.; Bouziane, K. Influence of the Biomass Gasification Processes on the Final Composition of Syngas. Energy Procedia 2013, 36, 596–606. [Google Scholar] [CrossRef]
  25. Thapa, S.; Bhoi, P.R.; Kumar, A.; Huhnke, R.L. Effects of Syngas Cooling and Biomass Filter Medium on Tar Removal. Energies 2017, 10, 349. [Google Scholar] [CrossRef]
  26. Doherty, W.; Reynolds, A.; Kennedy, D. Aspen Plus Simulation of Biomass Gasification in a Steam Blown Dual Fluidised Bed. In Materials and Processes for Energy: Communicating Current Research and Technological Developments; Méndez-Vilas, A., Ed.; Formatex Research Centre: Badajoz, Spain, 2013. [Google Scholar]
  27. Pradhan, A.; Baredar, P.; Kumar, A. Syngas as An Alternative Fuel Used in Internal Combustion Engines: A Review. J. Pure Appl. Sci. Technol. 2015, 5, 51–66. [Google Scholar]
  28. Marculescu, C.; Cenuşă, V.; Alexe, F. Analysis of Biomass and Waste Gasification Lean Syngases Combustion for Power Generation Using Spark Ignition Engines. Waste Manag. 2016, 47, 133–140. [Google Scholar] [CrossRef] [PubMed]
  29. Monteiro, E.; Sotton, J.; Bellenoue, M.; Moreira, N.A.; Malheiro, S. Experimental Study of Syngas Combustion at Engine-like Conditions in a Rapid Compression Machine. Exp. Therm. Fluid Sci. 2011, 35, 1473–1479. [Google Scholar] [CrossRef]
  30. Liu, C.; Song, H.; Zhang, P.; Wang, Z.; Wooldridge, M.S.; He, X.; Suo, G. A Rapid Compression Machine Study of Autoignition, Spark-Ignition and Flame Propagation Characteristics of H2/CH4/CO/Air Mixtures. Combust. Flame 2018, 188, 150–161. [Google Scholar] [CrossRef]
  31. Villarini, M.; Bocci, E.; Di Carlo, A.; Savuto, E.; Pallozzi, V. The Case Study of an Innovative Small Scale Biomass Waste Gasification Heat and Power Plant Contextualized in a Farm. Energy Procedia 2015, 82, 335–342. [Google Scholar] [CrossRef]
  32. Ando, Y.; Yoshikawa, K.; Beck, M.; Endo, H. Research and Development of a Low-BTU Gas-Driven Engine for Waste Gasification and Power Generation. Energy 2005, 30, 2206e18. [Google Scholar] [CrossRef]
  33. Pushp, M.; Mande, S. Development of 100% Producer Gas Engine and Field Testing with Pid Governor Mechanism for Variable Load Operation; SAE Pap.; SAE: Warrendale, PA, USA, 2008. [Google Scholar]
  34. Rakopoulos, C.D.; Michos, C.N.; Giakoumis, E.G. Availability Analysis of a Syngas Fueled Spark Ignition Engine Using a Multi-Zone Combustion Model. Energy 2008, 33, 1378–1398. [Google Scholar] [CrossRef]
  35. Martínez, J.D.; Mahkamov, K.; Andrade, R.V.; Silva Lora, E.E. Syngas Production in Downdraft Biomass Gasifiers and Its Application Using Internal Combustion Engines. Renew. Energy 2012, 38, 1–9. [Google Scholar]
  36. Boloy, R.A.M.; Silveira, J.L.; Tuna, C.E.; Coronado, C.R.; Antunes, J.S. Ecological Impacts from Syngas Burning in Internal Combustion Engine: Technical and Economic Aspects. Renew. Sustain. Energy Rev. 2011, 15, 5194–5201. [Google Scholar] [CrossRef]
  37. Mohon Roy, M.; Tomita, E.; Kawahara, N.; Harada, Y.; Sakane, A. Performance and Emission Comparison of a Supercharged Dual-Fuel Engine Fueled by Producer Gases with Varying Hydrogen Content. Int. J. Hydrog. Energy 2009, 34, 7811–7822. [Google Scholar] [CrossRef]
  38. Warnecke, R. Gasification of Biomass: Comparison of Fixed Bed and Fluidized Bed Gasifier. Biomass Bioenergy 2000, 18, 489–497. [Google Scholar] [CrossRef]
  39. Baratieri, M.; Baggio, P.; Bosio, B.; Grigiante, M.; Longo, G.A. The Use of Biomass Syngas in IC Engines and CCGT Plants: A Comparative Analysis. Appl. Therm. Eng. 2009, 29, 3309–3318. [Google Scholar] [CrossRef]
  40. Damartzis, Th.; Michailos, S.; Zabaniotou, A. Energetic Assessment of a Combined Heat and Power Integrated Biomass Gasification–Internal Combustion Engine System by Using Aspen Plus®. Fuel Process. Technol. 2012, 95, 37–44. [Google Scholar] [CrossRef]
  41. Pallozzi, V.; Di Carlo, A.; Bocci, E.; Villarini, M.; Foscolo, P.U.; Carlini, M. Performance Evaluation at Different Process Parameters of an Innovative Prototype of Biomass Gasification System Aimed to Hydrogen Production. Energy Convers. Manag. 2016, 130, 34–43. [Google Scholar] [CrossRef]
  42. González-Vázquez, M.P.; García, R.; Pevida, C.; Rubiera, F. Optimization of a Bubbling Fluidized Bed Plant for Low-Temperature Gasification of Biomass. Energies 2017, 10, 306. [Google Scholar] [CrossRef]
  43. Castelli, S. Biomasse ed energia: Produzione, gestione e processi di trasformazione; Maggioli Editore: Milan, Italy, 2011; ISBN 8838765278/9788838765278. [Google Scholar]
  44. Biagini, E.; Barontini, F.; Tognotti, L. Gasification of Agricultural Residues in a Demonstrative Plant: Vine Pruning and Rice Husks. Bioresour. Technol. 2015, 194, 36–42. [Google Scholar] [CrossRef] [PubMed]
  45. Colantoni, A.; Longo, L.; Gallucci, F.; Monarca, D. Pyro-Gasification of Hazelnut Pruning Using a Downdraft Gasifier for Concurrent Production of Syngas and Biochar. Contemp. Eng. Sci. 2016, 9, 1339–1348. [Google Scholar] [CrossRef]
  46. Lapuerta, M.; Hernández, J.J.; Pazo, A.; López, J. Gasification and Co-Gasification of Biomass Wastes: Effect of the Biomass Origin and the Gasifier Operating Conditions. Fuel Process. Technol. 2008, 89, 828–837. [Google Scholar] [CrossRef]
  47. Nordin, A. Chemical Elemental Characteristics Fuels. Biomass Bioenergy 1994, 6, 339–347. [Google Scholar] [CrossRef]
  48. Ye, G.; Xie, D.; Qiao, W.; Grace, J.R.; Lim, C.J. Modeling of Fluidized Bed Membrane Reactors for Hydrogen Production from Steam Methane Reforming with Aspen Plus. Int. J. Hydrog. Energy 2009, 34, 4755–4762. [Google Scholar] [CrossRef]
  49. Lv, P.; Xiong, Z.; Chang, J.; Wu, C.; Chen, Y.; Zhu, J. An Experimental Study on Biomass Air–Steam Gasification in a Fluidized Bed. Bioresour. Technol. 2004, 95, 95–101. [Google Scholar] [CrossRef] [PubMed]
  50. Sadaka, S.S.; Ghaly, A.E.; Sabbah, M.A. Two Phase Biomass Air-Steam Gasification Model for Fluidized Bed Reactors: Part I—Model Development. Biomass Bioenergy 2002, 22, 439–462. [Google Scholar] [CrossRef]
  51. Demirbaş, A. Carbonization Ranking of Selected Biomass for Charcoal, Liquid and Gaseous Products. Energy Convers. Manag. 2001, 42, 1229–1238. [Google Scholar] [CrossRef]
  52. Begum, S.; Rasul, M.G.; Akbar, D.; Ramzan, N. Performance Analysis of an Integrated Fixed Bed Gasifier Model for Different Biomass Feedstocks. Energies 2013, 6, 6508–6524. [Google Scholar] [CrossRef]
  53. Franco, C.; Pinto, F.; Gulyurtlu, I.; Cabrita, I. The Study of Reactions Influencing the Biomass Steam Gasification Process. Fuel 2003, 82, 835–842. [Google Scholar] [CrossRef]
  54. Torres, W.; Pansare, S.S.; Goodwin, J.G. Hot Gas Removal of Tars, Ammonia, and Hydrogen Sulfide from Biomass Gasification Gas. Catal. Rev. 2007, 49, 407–456. [Google Scholar] [CrossRef]
  55. Pala, L.P.R.; Wang, Q.; Kolb, G.; Hessel, V. Steam Gasification of Biomass with Subsequent Syngas Adjustment Using Shift Reaction for Syngas Production: An Aspen Plus Model. Renew. Energy 2017, 101, 484–492. [Google Scholar] [CrossRef]
  56. Liao, C.H.; Summers, M.; Seiser, R.; Cattolica, R.; Herz, R. Simulation of a Pilot-Scale Dual-Fluidized-Bed Gasifier for Biomass; Environmental Progress and Sustainable Energy, John Wiley & Sons, Ltd.: Hoboken, NJ, USA, 2014; pp. 732–736. [Google Scholar]
Figure 1. Diffusion of the biomass waste on Italian soil analyzed in this study [43].
Energies 12 00688 g001
Figure 2. Flowchart of the plant evaluated in this study (the hatched streams are the heat streams, representing thermal recoveries; the continuous streams are the material streams), considering air as the gasifying agent.
Energies 12 00688 g002
Figure 3. Flowchart of the plant evaluated in this study (the hatched streams are the heat streams, representing thermal recoveries; the continuous streams are the material streams), considering steam as the gasifying agent.
Energies 12 00688 g003
Figure 4. (a) Effect of gasification temperature on the syngas composition from hazelnut shells. (b) Effect of gasification temperature on the syngas composition from olive pruning. (c) Effect of gasification temperature on the syngas composition from olive pomace. (d) Effect of gasification temperature on the syngas composition from wheat straw.
Energies 12 00688 g004aEnergies 12 00688 g004b
Figure 5. (a) Effect of air equivalent ratio on the syngas composition from hazelnut shells. (b) Effect of air equivalent ratio on the syngas composition from olive pruning. (c) Effect of air equivalent ratio on the syngas composition from olive pomace. (d) Effect of air equivalent ratio on the syngas composition from wheat straw.
Energies 12 00688 g005aEnergies 12 00688 g005b
Figure 6. Gasifier heat demand and LHV vs. ER.
Energies 12 00688 g006
Figure 7. (a) Cold gas efficiency and LHV for hazelnut shells. (b) Cold gas efficiency and LHV for olive pruning. (c) Cold gas efficiency and LHV for olive pomace. (d) Cold gas efficiency and LHV for wheat straw.
Energies 12 00688 g007aEnergies 12 00688 g007b
Figure 8. (a) Effect of the S/B ratio on the syngas composition from hazelnut shells. (b) Effect of the S/B ratio on the syngas composition from olive pruning. (c) Effect of the S/B ratio on the syngas composition from pomace olive. (d) Effect of the S/B ratio on the syngas composition from wheat straw.
Energies 12 00688 g008
Figure 9. Gasifier heat demand vs. S/B considering hazelnut shells.
Energies 12 00688 g009
Figure 10. (a) Cold gas efficiency and LHV for hazelnut shells. (b) Cold gas efficiency and LHV for olive pruning. (c) Cold gas efficiency and LHV for olive pomace. (d) Cold gas efficiency and LHV for wheat straw.
Energies 12 00688 g010aEnergies 12 00688 g010b
Table 1. Preliminary and definitive biomass waste properties [13].
Biomass WasteMoisture (wt %)Bulk Density (kg/m3)Ash (wt %)VM (wt %)FC (wt %)C (%)H (%)N (%)O (%)Cl (%)S (%)LHV (MJ/kgdry)
Shells11–14300–5001–274–7820–2548–5160.2–0541–440.02–0.030.01–0.0318–20
Pruning7–25200–3000.5–470–8512–2045–495–60.1–0836–440.01–0.080.01–0.0816–18
Straw7–1220–1405–1567–7616–1841–475–60.3–636–440.03–0.40.04–0.215–18
Exhausted olive9350477195160.3380.020.0220
Table 2. Biomass waste most available on Italian soil.
BiomassAvailability (tdry/year)LHV ( M J / k g d r y ) HHV ( M J / k g d r y ) Bulk Density (kg/m3)Moisture (wt %)
Olive pomace3,246,0002023.503509
Wheat 3,050,55618.9020.10429.5
Olive pruning1,548,71119.9021.2020020
Corn1,269,98017.6018.60588.50
Vine pruning1,123,37218.6019.9026017.60
Barley687,73318.6019.70808
Hazelnut pruning67,90417.901923015
Hazelnut shells58,00018.8520.20319.1412.45
Table 3. Biomass proximate and ultimate analysis.
BiomassProximate Analysis (wt %, Dry Basis)Ultimate Analysis (wt %, Dry Basis)
AshVolatile MatterFixed CarbonCHNOClS
Hazelnut shells0.7762.7024.0846.765.760.2245.830.760.67
Olive pruning3.6782.3513.9847.506.001.0643.661.740.04
Vine pruning2.6280.8416.5450.845.820.8840.081.870.05
Hazelnut pruning 3.2079.6017.2047.405.230.7043.503.140.03
Olive pomace477195160.30380.020.02
Corn769.51547.305.500.9045.30.50.5
Wheat1166.321.448.866.800.5943.40.150.2
Barley7651946.8870.6044.700.700.12
Table 4. Chemical reactions involved in the process.
Reaction NumberReaction EquationReaction NameHeat of Reaction ΔH (kJ/mol)
1C + O2 → CO2Carbon combustion−393.0
2C + 0.5O2 → COCarbon partial oxidation−112.0
3C + H2O CO + H2Water gas reaction+131.0
4CO + H2O CO2 + H2Water gas-shift reaction−41.0
5H2 + 0.5O2 → H2OHydrogen partial combustion−242.0
6CH4 + H2O → CO + 3H2Steam reforming of methane+206.0
7H2 + S → H2SH2S formation−20.2
80.5N2 + 1.5H2 → NH3NH3 formation−46.0
9H2 + 2Cl →2 HClHCl formation−92.31
Table 5. Description of ASPEN Plus flowsheet unit operation presented in Figure 2.
ASPEN Plus NameBlock IDDescription
RYIELDDECOMPYield reactor—converts the non-conventional stream “BIOMASS” into its conventional components
RSTOICRSTOICRstoic reactor—simulates the production of HCl, NH3 and H2S
SEPSEPSeparator—separates the biomass in three streams: volatile, char and a stream of NH3 and H2S
MIXERMIXMixer—mixes oxidizing fluid with VOLATILE stream, that represents combustible fluid
MIXERMIX2Mixer—mixes the gas from gasifier with NH3, HCl and H2S
FSPLITSPLITSplitter—splits char unreacted (S3) from char to burn (S4)
RGIBBSGASIFGibbs free energy reactor—simulates drying, pyrolysis, partial oxidation and gasification and restricts chemical equilibrium of the specified reactions to set the syngas composition by specifying a temperature approach for individual reactions
CYCLONECYCLONECyclone—simulates gas‒solid separation
HEATERCOOLINGHeater—lowers the temperature between GASIF and ICE
COMPR COMPRCompressor—used to simulate internal combustion engine
COMPRTURBINETurbine—used to simulate internal combustion engine
RGIBBSBURNCombustion chamber—used to simulate gas turbine combustion
HEATERUTILHeater—lowers the temperature of exhausted fumes to utilization temperature
Table 6. System operating conditions.
Plant UnitProcess ParametersValue
GASIFTemperature800 °C
Pressure1 bar
COOLINGTemperature syngas (out)30 °C
Pressure syngas (out)1 bar
UTILTemperature (out)80 °C
Table 7. Gas turbine’s cycle operating conditions.
Process ParametersValue
Temperature, syngas (in)30 °C
Temperature, air (in, compressor)20 °C
Equivalence ratio [35]3
Isentropic expansion coefficient90%
Isentropic compression coefficient90%
Pressure, fumes (out, turbine)1 bar
Table 8. Composition of the syngas in %dry mole fraction.
Component ( % d r y   m o l e   f r a c t i o n ) Hazelnut ShellsOlive PruningOlive PomaceWheat Straw
H 2 20.720.423.121.9
C O 14.814.616.115.1
C O 2 1312.710.111.7
H 2 O 19.618.614.318.5
C H 4 224.32.7
H C l 0.170.380.050.03
Table 9. Cold Gas, Electrical and Cogenerative efficiencies of the analyzed biomass waste.
BiomassGasification AgentGasification Temperature (°C)Gas Yield (Nm3/kg)LHV (MJ/Nm3) η C G (%) η e l (%) η C H P (%)
Olive pruningAir, ER = 0.277851.74.2352641
Hazelnut shellsSteam, S/B = 0.47851.567.25 603064

