Experimental Studies Involving the Impact of Solar Radiation on the Properties of Expanded Graphite Polystyrene


Faculty of Civil Engineering, Silesian University of Technology, Gliwice 44–100, Poland
*
Author to whom correspondence should be addressed.
Energies 2020, 13(1), 75; https://0-doi-org.brum.beds.ac.uk/10.3390/en13010075
Submission received: 27 November 2019
/
Revised: 19 December 2019
/
Accepted: 20 December 2019
/
Published: 22 December 2019
(This article belongs to the Special Issue Building Thermal Envelope)
Abstract
:This article presents the research studies aimed at identifying the behavior of expanded polystyrene with the addition of graphite in the conditions of exposure to solar radiation. For this purpose, a series of in situ tests and laboratory studies were carried out. Three types of material were tested, i.e. expanded polystyrene (EPS) (white polystyrene), polystyrene with the addition of graphite (gray polystyrene) and two-layer polystyrene (gray bottom layer and white top layer). Temperature distributions on the surfaces of the panels in field and laboratory conditions were determined. The distributions of temperature were recorded at varied wind impact (field conditions and laboratory conditions) and at varied impact of solar radiation (laboratory conditions). Based on the conducted experiments, differences in temperature distribution on the surfaces of the tested panels were determined. In addition, geometric changes and deformation levels of the tested white and gray expanded polystyrene panels exposed to artificial sun radiation were determined in laboratory conditions.
1. Introduction
The subject of the thermal insulation of buildings is very important because, according to Berardi [1], energy consumption in buildings accounts for 30% of the total final energy consumption in the world. In addition to environmental protection, it is very important to meet the expectations of ordinary building users, who in general are not experts in the field of energy saving [2]. In building envelope insulation systems, we very often apply such insulation materials as expanded polystyrene (EPS) and extruded polystyrene (XPS) [3], or their modifications [4,5,6,7]. Such systems can be used on building envelopes as insulation from the inside, which is often applied in buildings having historical character [8]. When using EPS as insulation from the inside, we consider, among others, the problems of the thermal accumulation of building envelopes, which have impact on their energy performance [9]. The second and more frequent application of such systems involves the insulation from the outside [10]. Also for that type of application, various physical processes are taken into consideration [11]. One of such important problems is the impact of the moisture content of polystyrene used in thermal insulation systems on thermal conductivity [12,13]. Another important issue related to the thermal insulation of buildings is the distribution of temperature on the outer wall surface [14,15,16], which often depends upon various perturbations [17]. Another application of expanded polystyrene (EPS) involves its use in ready-made wall systems in the form of lightweight panels [18]. The most commonly applied system for the thermal insulation of buildings is the system for wall insulation from the outside, such as External Thermal Insulation Composite System (ETICS) [19].
Frequently, graphite is applied for expanded polystyrene composites [20], which improves the capacity of energy storage [21]. The described problems involving the impact of temperature on polystyrene with thermal additives have been discussed by various research teams [22,23,24]. There is relatively little information on the scale of the issue under consideration. Based on the Polish literature, we can find information that, among others, relates how rapid changes of temperature on the surface of ‘black polystyrene panels’ contribute to their damage on building facades, in particular from the south. In other works in Poland, the issue involving the impact of solar radiation was investigated both in laboratory and natural conditions, as well as in numerical simulations. It was found that the temperature on the surface of polystyrene under intense solar radiation may surpass the softening point. In addition, it may result in the deformation of the thermal insulation boards, which can bring about the detachment of the polystyrene boards from the wall surface. Exposing the material to excessive, direct solar radiation may damage polystyrene. The said problem was pointed out by Kussauer and Ruprecht [23] in their monograph.
The parameters of such composites may depend on the method of their development [25]. Minh-Phuong Tran et al. demonstrated that adding various types of graphite particles to polystyrene during the production process reduces its thermal conductivity [26]. However, it should be noted that when exposed to solar radiation, gray polystyrene, i.e., with the addition of graphite, behaves differently to white polystyrene, i.e., without such addition. Due to the fact that polystyrene with the addition of graphite is a popular material reducing energy consumption in buildings, and at the same time is sensitive to the impact of solar radiation, the objective of the work is to assess the impact of solar radiation intensity on temperature distribution on the surface of various polystyrenes and on the development of structural and geometric imperfections of thermal insulation materials. The objective formulated in that way allows us to identify the problems related to the impact of solar radiation intensity on unprotected polystyrene, both with and without the addition of graphite.
The implementation technology in the ETICS system for fixing thermal insulation to the wall requires the mortar setting time of over 72 h.
2. Methodology
The influence of solar radiation intensity on unprotected thermal insulation boards was examined. It takes place during construction works, before the successive stages of the ETICS system implementation.
The study involved three 0.15 m-thick expanded polystyrene (EPS) boards of the dimensions 0.5 m × 1.0 m marked with letters A, B, C. The dimensions of the tested elements reflect on the scale 1:1 the actual dimensions of the thermal insulation boards used for insulation. Therefore, it was not necessary to plan scale studies.
Panel A—composite polystyrene consisting of two layers: the main layer in the form of gray, expanded polystyrene, and an additional layer 0.006 m thick in the form of white expanded polystyrene (a layer protecting the gray layer against the impact of solar radiation)
Panel B—polystyrene board made entirely of expanded polystyrene with the addition of graphite (gray polystyrene)
Panel C—expanded polystyrene board without the addition of graphite (white polystyrene) with raised technical parameters.
When testing the distribution of temperature on the surface of a material, it is very important to test its emissivity. These tests are important, because incorrectly determined emissivity does not allow us to determine the real distribution of temperature.
Therefore, in the Section 2.2.1, the methodology of the emissivity test was presented. However, to make the remaining part of the work clearer, except for the methodology in the sub-chapter 2.2.1, also the values of the adopted emissivity of the tested panels A, B, C were provided.
2.1. In Situ Research
2.1.1. Determining the Emissivity of the Panels
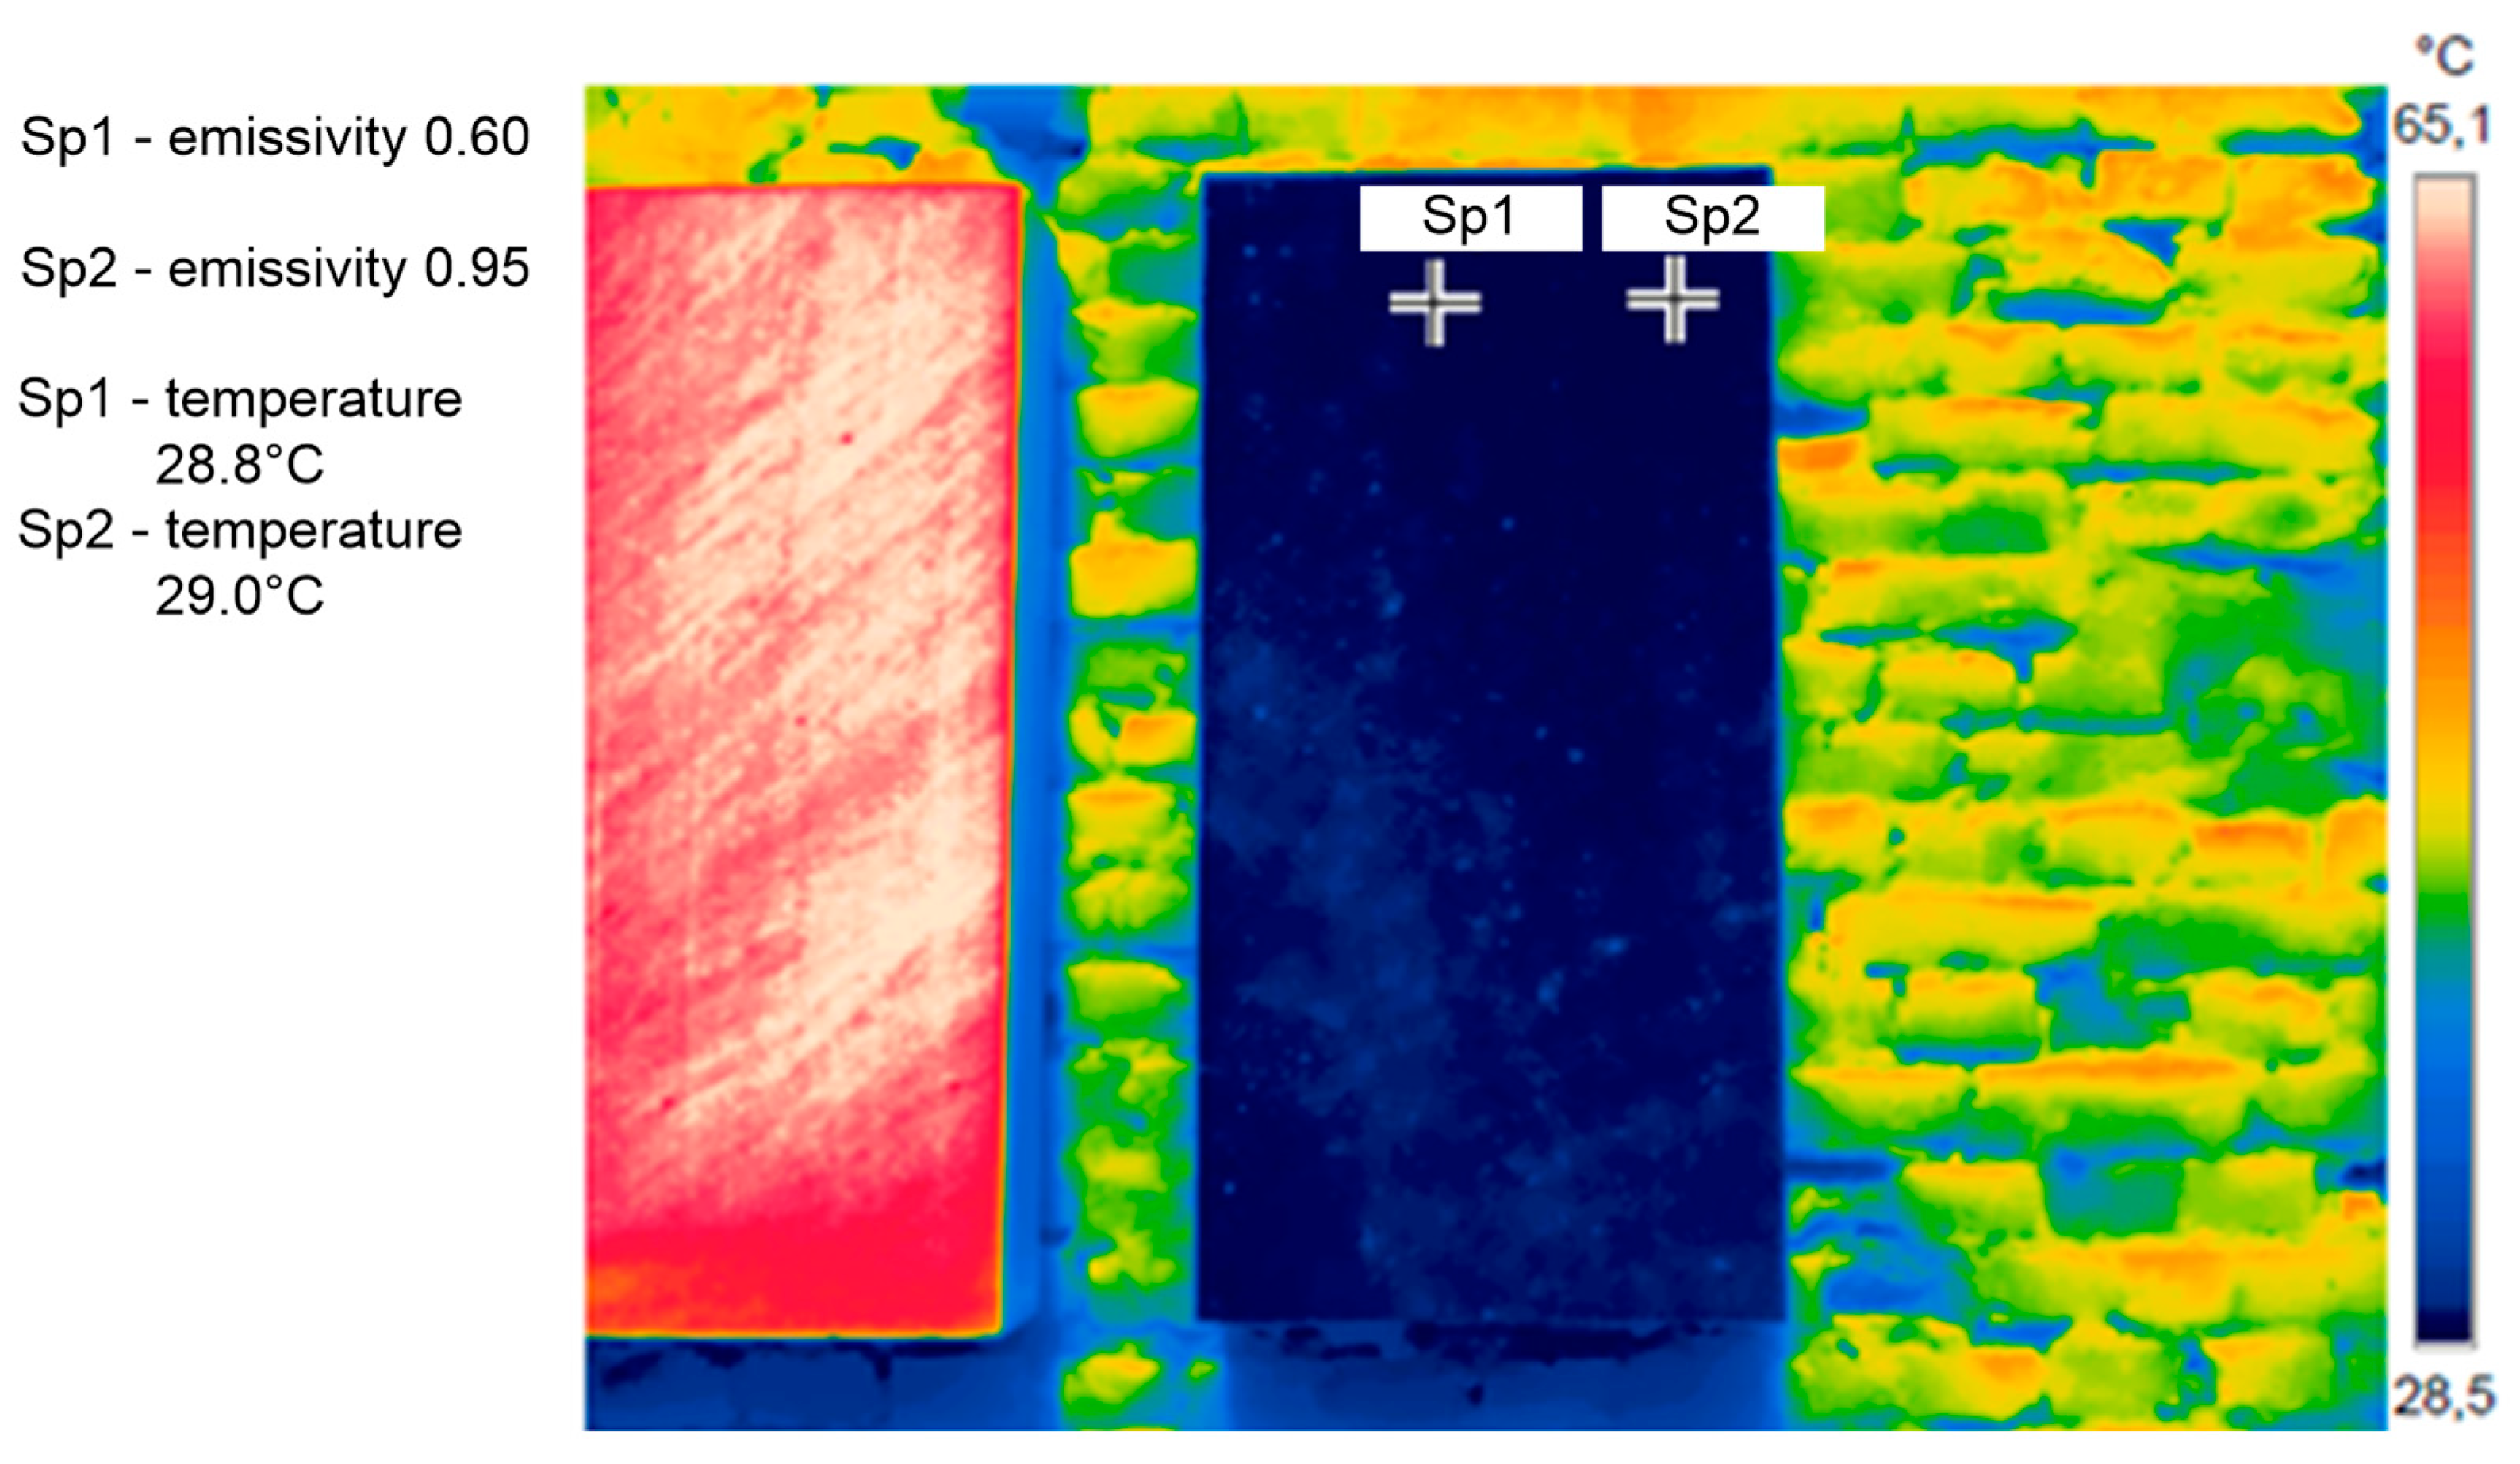
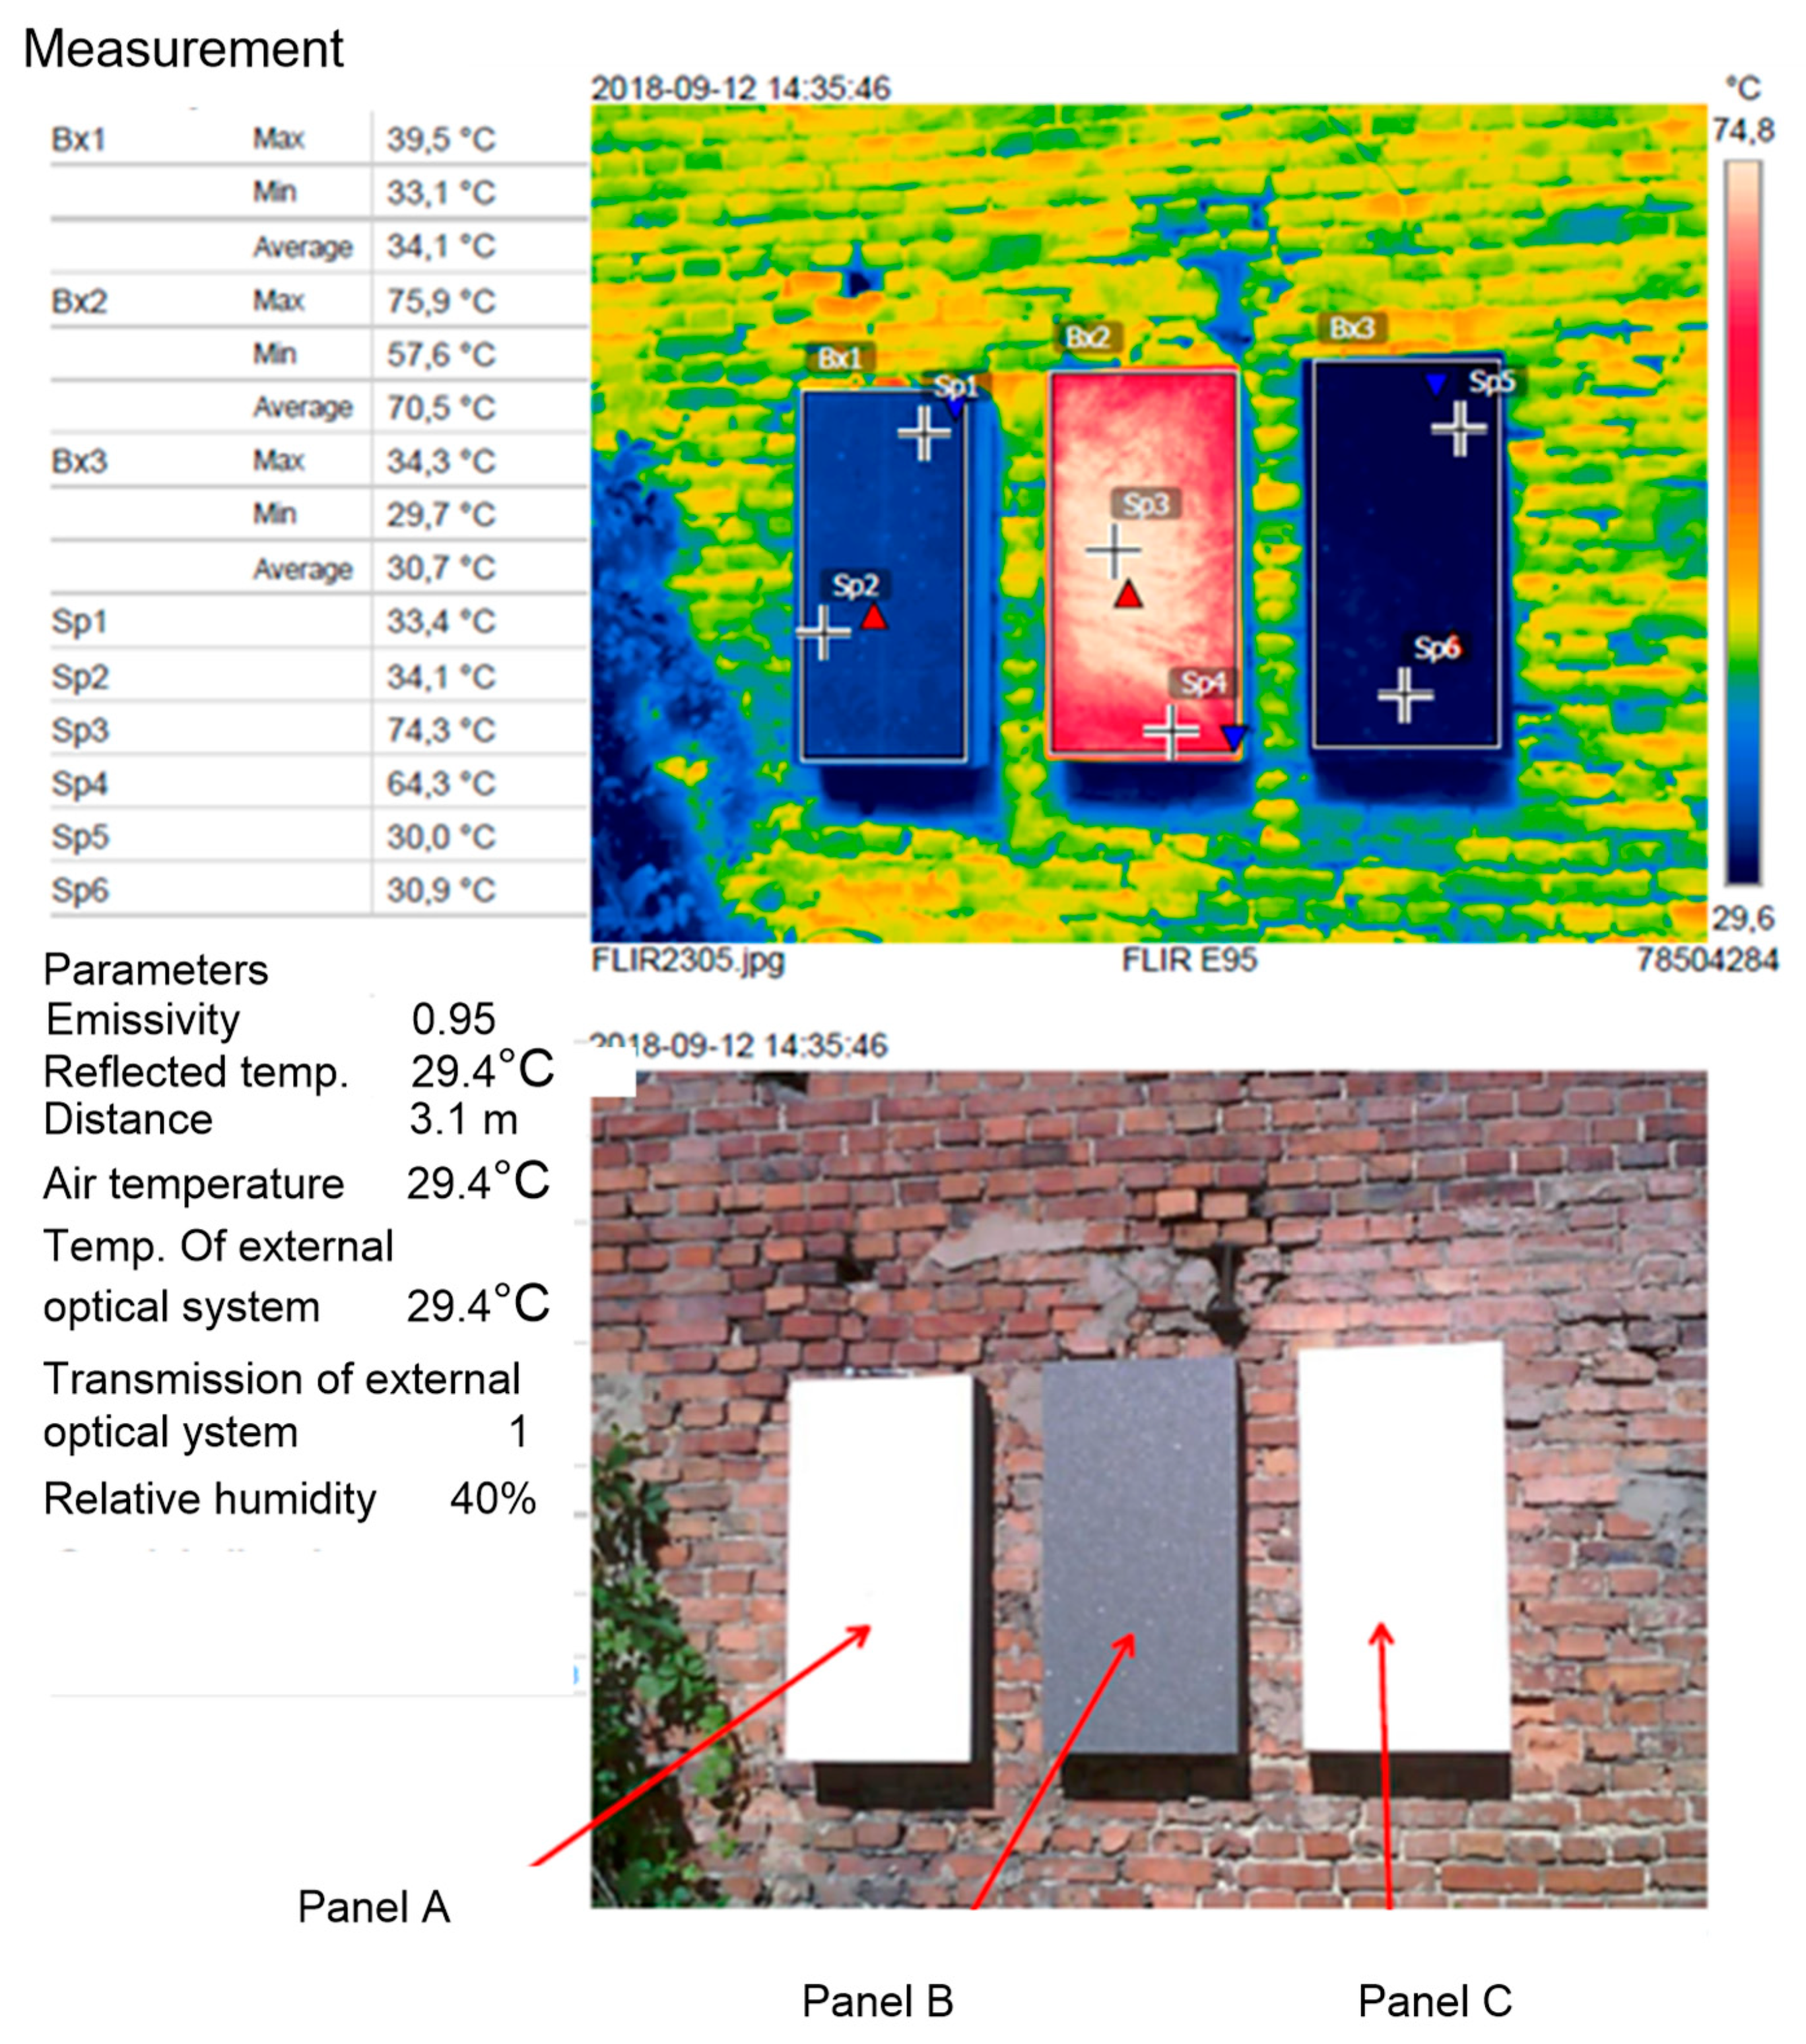
Since there are no unequivocal emissivity values for individual polystyrene boards (no declarations in this respect offered by manufacturers), a testing study was carried out. The emissivity of the expanded polystyrene boards (panel B) was determined using a comparative method with respect to the reference tape of the known emissivity of 0.96. The emissivity of the panel B determined on that basis was 0.95, and basing on the literature [27], for white polystyrene (panel C) the emissivity is assumed to be 0.60. In order to determine the impact of the adopted emissivity value on the temperature distribution on the surface for the white polystyrene, a thermographic measurement was made. Two measurement points Sp1 and Sp2 were selected, at which the emissivity values of 0.60 and 0.95 were assumed, respectively. The results are presented in Figure 1.
The temperature values obtained on the surface of white polystyrene for two different measurement points of different surface emissivity differ from each other by 0.2 °C. The difference is lower than 1% of the measured values. It bespeaks of the fact that the change of emissivity for white polystyrene (panel C) under solar radiation conditions does not significantly affect temperature distribution on the surface of the polystyrene board. Therefore, there was no need to determine the exact emissivity value for the white board, which is why, for the purpose of comparison with panels A and B, the emissivity value of 0.95 (value determined for panel B) was adopted for all three panels.
2.1.2. Field Study
For the tests in real conditions, the following equipment was applied:
- Thermal imaging camera Flir E95 of the temperature measurement range of −20 °C–1500 °C, resolution of 161,472 pixels, thermal sensitivity for the 42° × 32° lens of <30 mK, spatial IFOV resolution for 42° × 32° lens of 2.41 mrad/pixel and fractional spectral sensitivity of 7.5–14 μm.
- Solar data logger of the measuring range of 0–1999 W/m2, resolution of 1 W/m2, operating temperature of 0 °C–50 °C, storage temperature of −10 °C– 60 °C, operation in the relative air humidity of 10%–90% and storage in the relative air humidity of 10%–80%.
- Electronic thermometer for measuring temperature inside the polystyrene boards equipped with a stainless steel probe skewer of the length of 0.15 m and temperature measurement range of −50 °C–300 °C.
The tests were carried out at two test stands for in situ studies, which were located at the place having the geographical coordinates of: 18°54’E 50°10’N (i.e., Mikołów, Silesa, Poland).
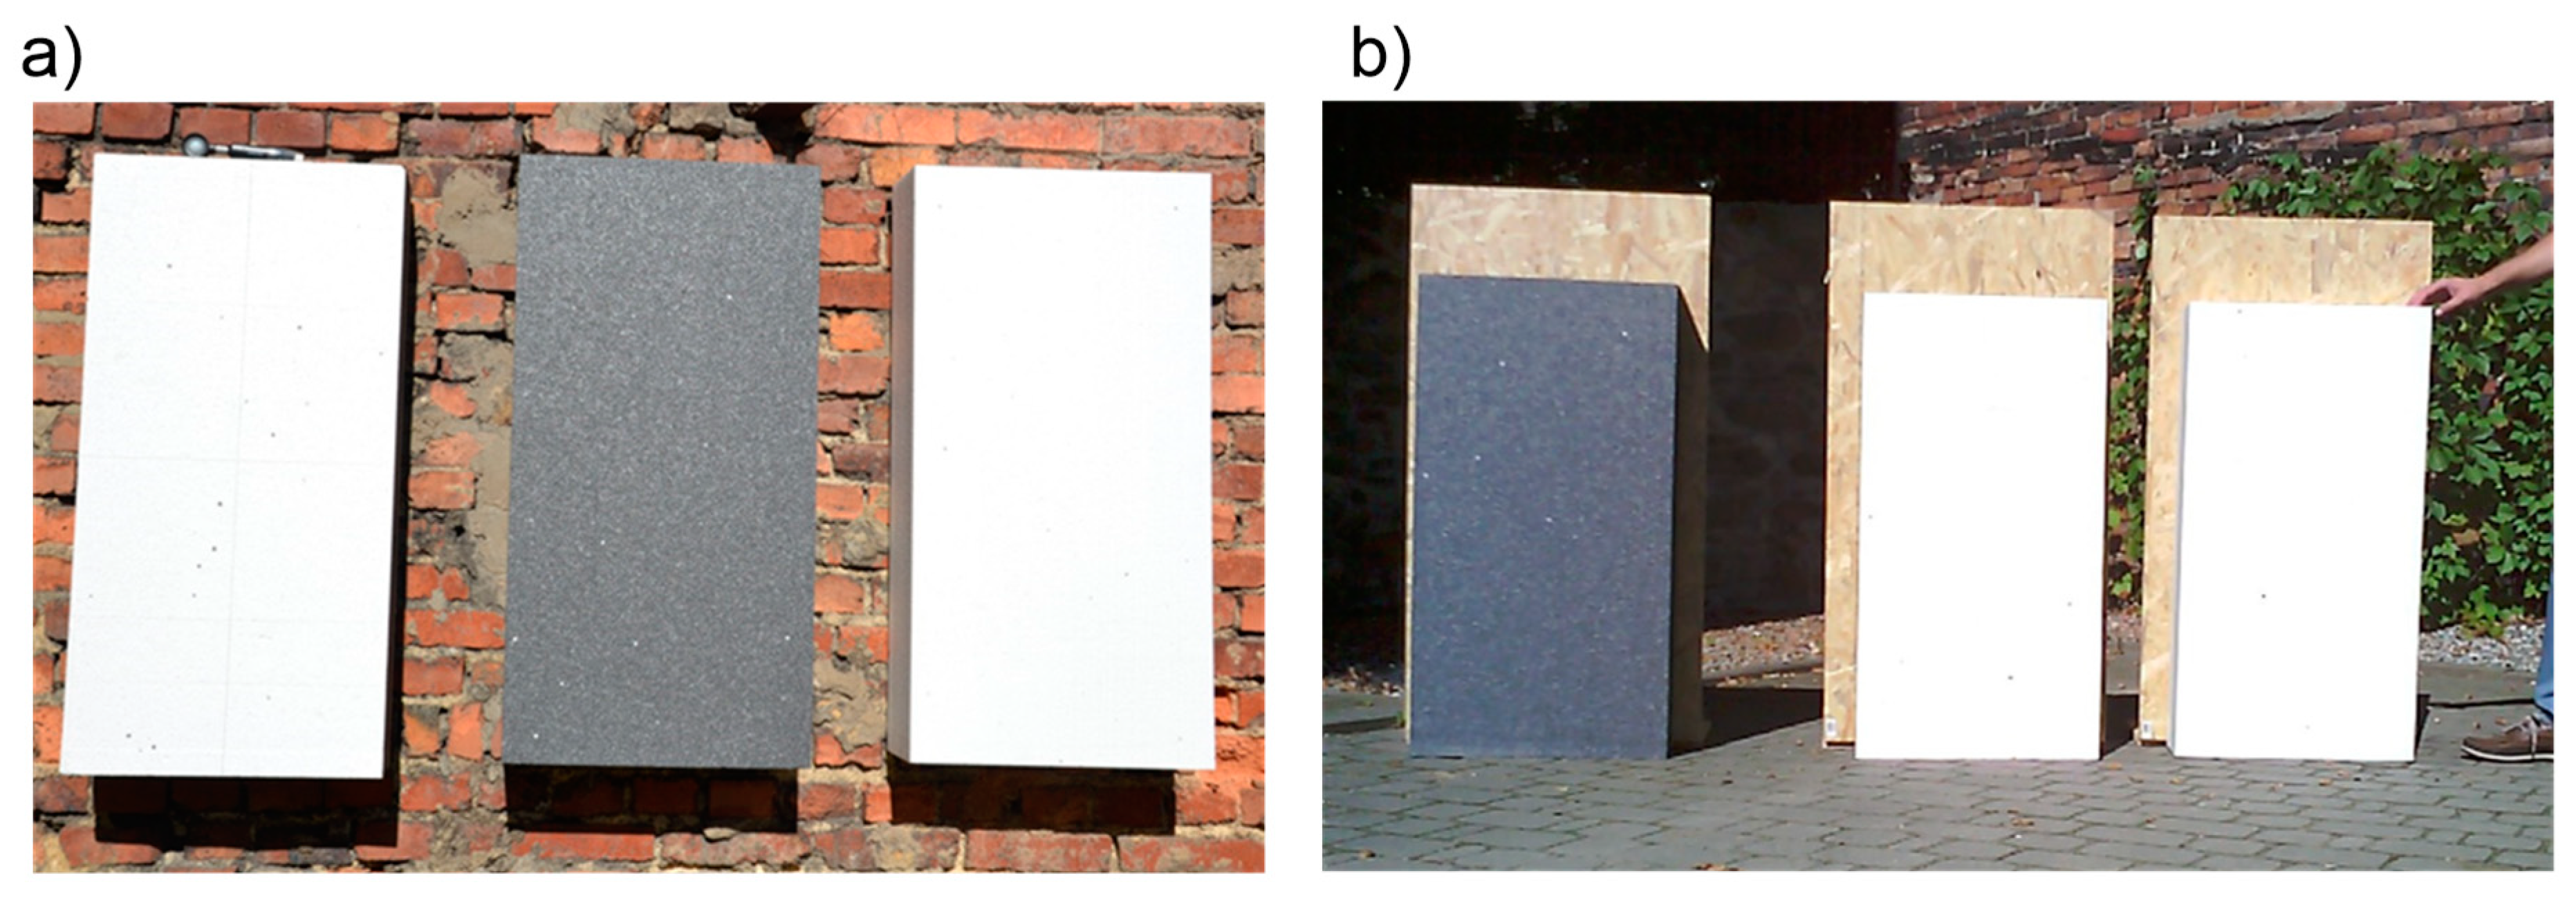
- Stationary stand—polystyrene boards glued to the wall with polyurethane adhesive (Figure 2a).
- Mobile stand—a support structure made of 0.018 m-thick boards, wooden slats, hinges and strings, was prepared for each of the polystyrene boards. The structure enabled us to position the tested polystyrene board vertically to the base surface (Figure 2b).
The tests comprised the registration of temperature distribution on the surfaces of the tested polystyrene panels, and they were carried out for four panels of each of the three types.
The results were recorded at both measuring stands. As part of the measurements, the maximum temperatures, obtainable on a given day, on the surface of the analyzed polystyrene panels, were determined. During the tests, the position of the polystyrene panels on the mobile stand was being adjusted in such a way as to ensure the highest possible load of the tested panels with solar radiation. Simultaneously with the thermographic measurements, the measurements of solar radiation intensity (W/m2) were carried out. The studies were conducted in the period from 12 September 2018 to 22 September 2018.
2.1.3. Meteorological Measurements
The parameters of the external climate were obtained on the basis of continuous measurements carried out at the local meteorological station, located about 1 km from the place of measurements. The recording of external environment conditions was carried out using the wireless meteorological station VantagePro2 Davis Instruments, powered by a PV cell. The weather station comprised sensors of temperature, air humidity, an anemometer and Pirani meter.
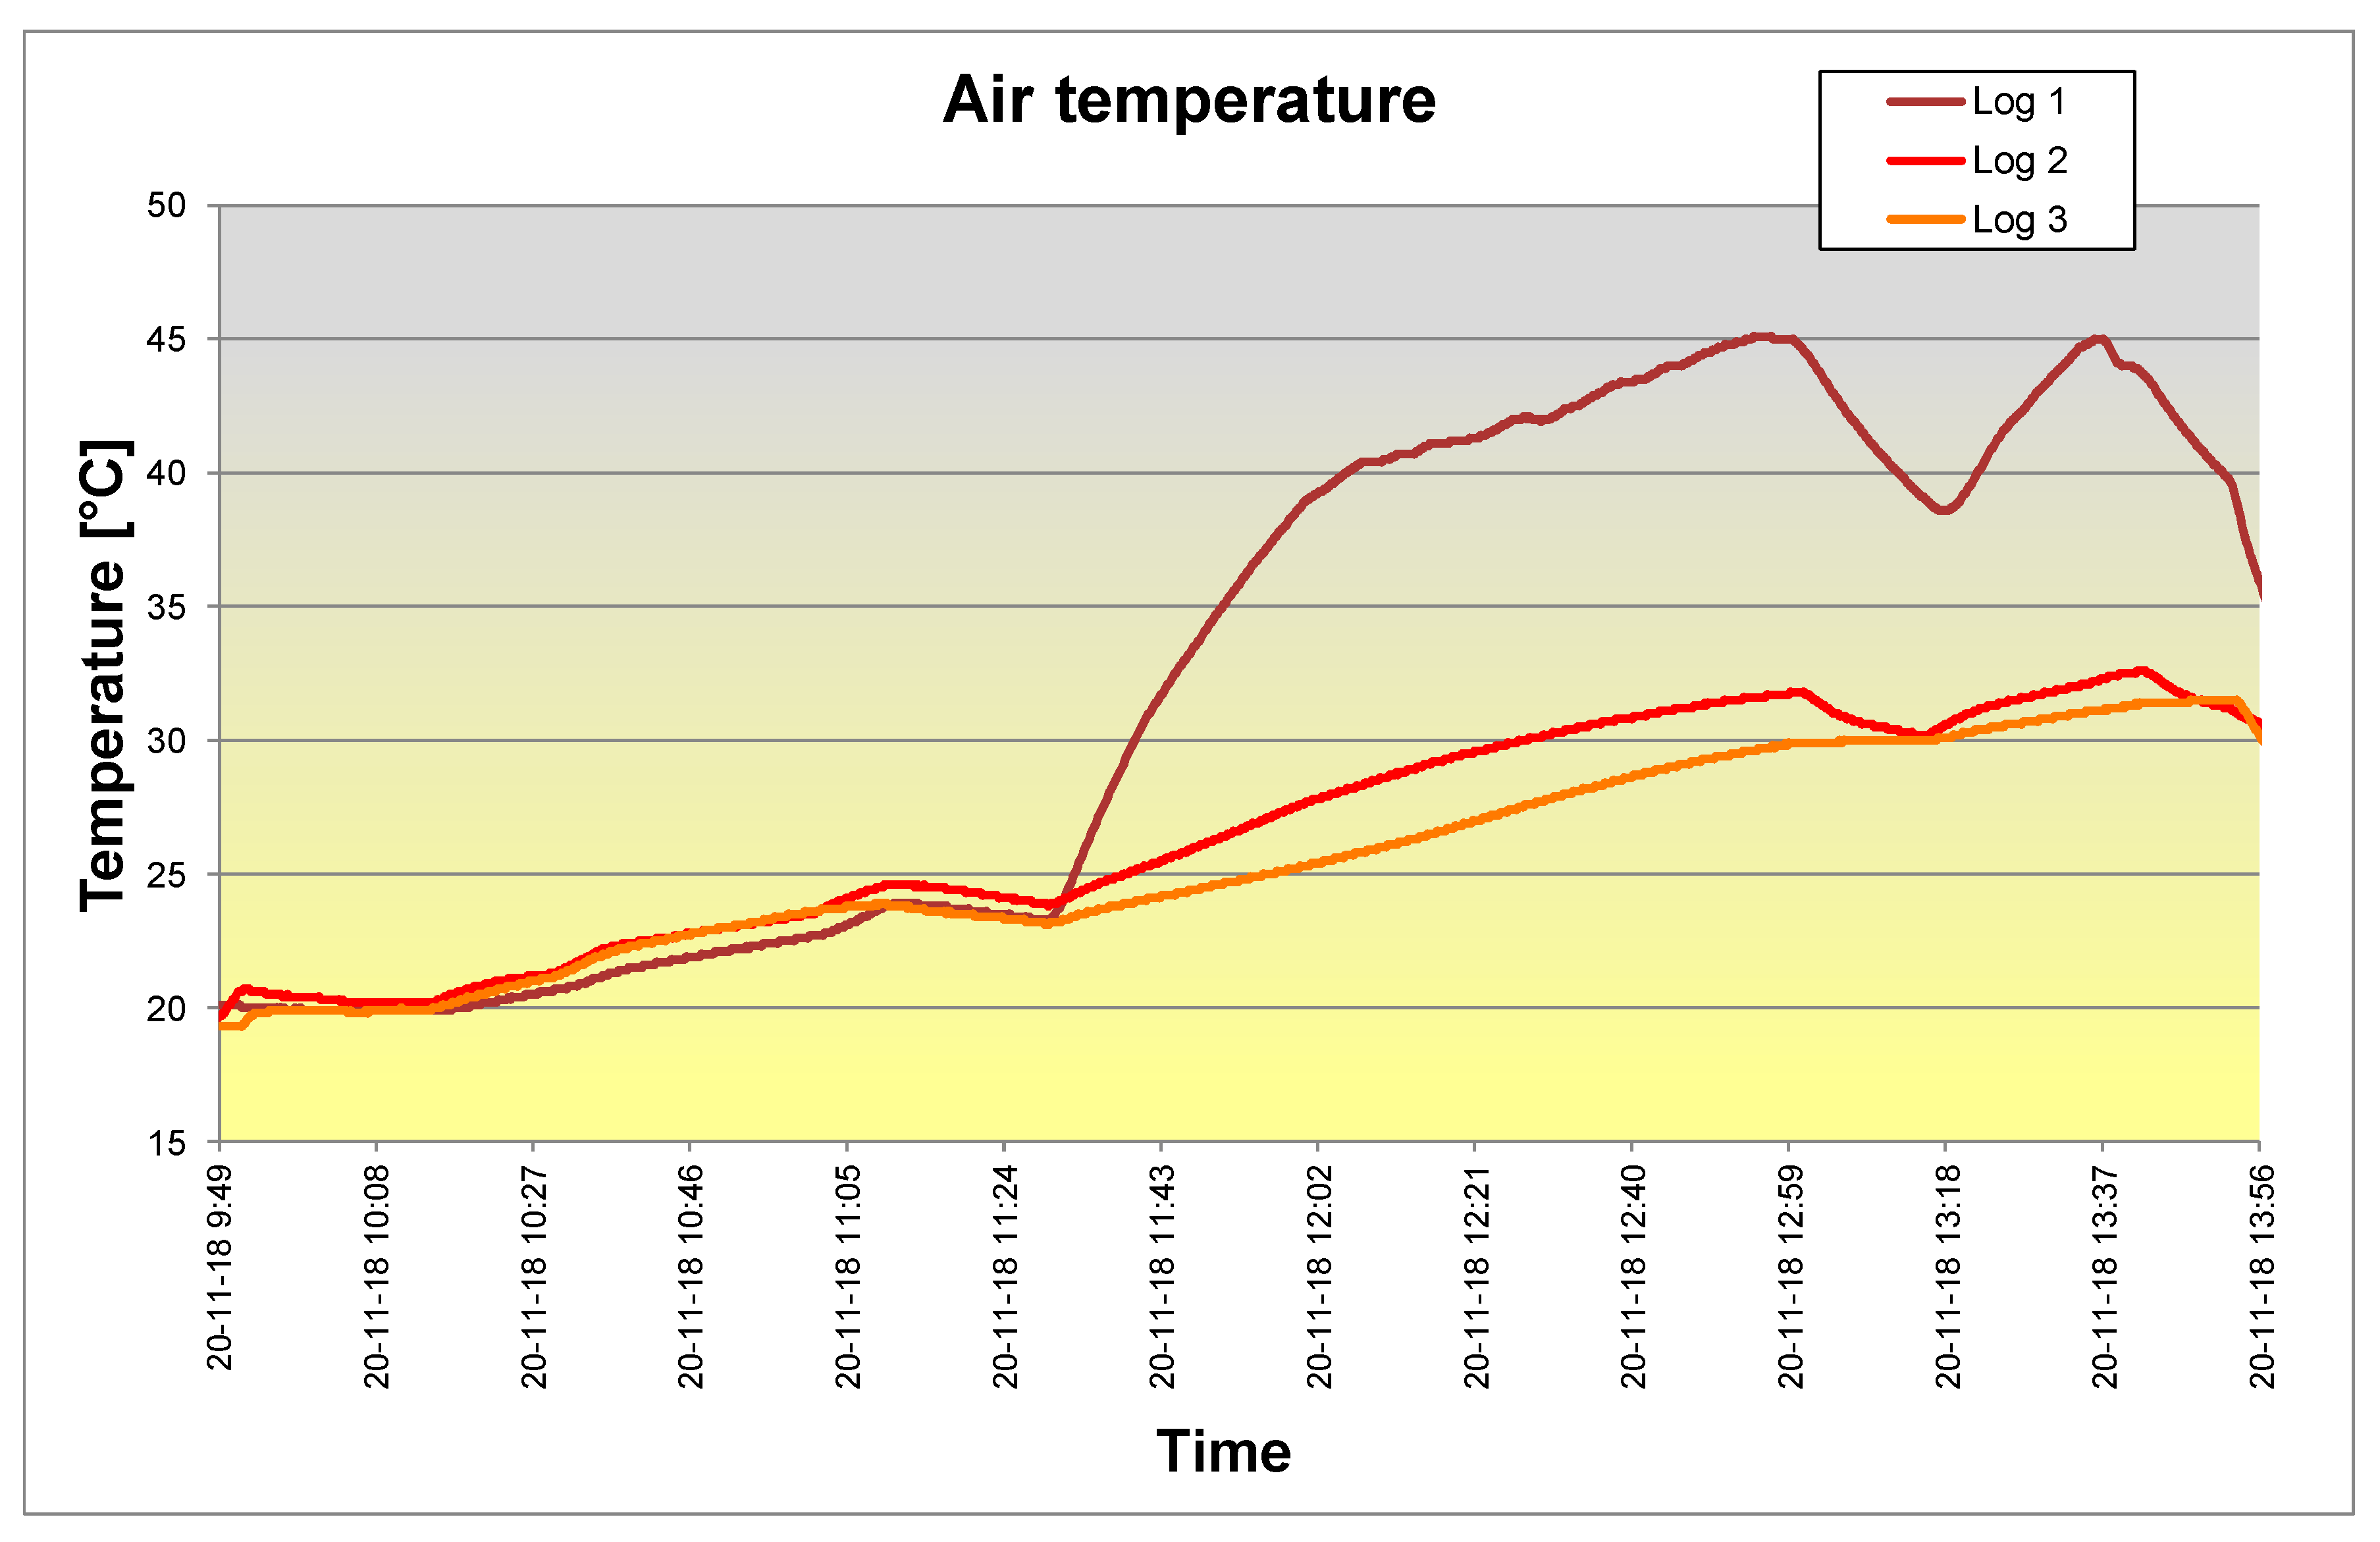
Climate parameters are presented in the graphs. All results were obtained on the basis of continuous measurements carried out at the local meteorological station located in the town where the measurements of the polystyrene panels were carried out.
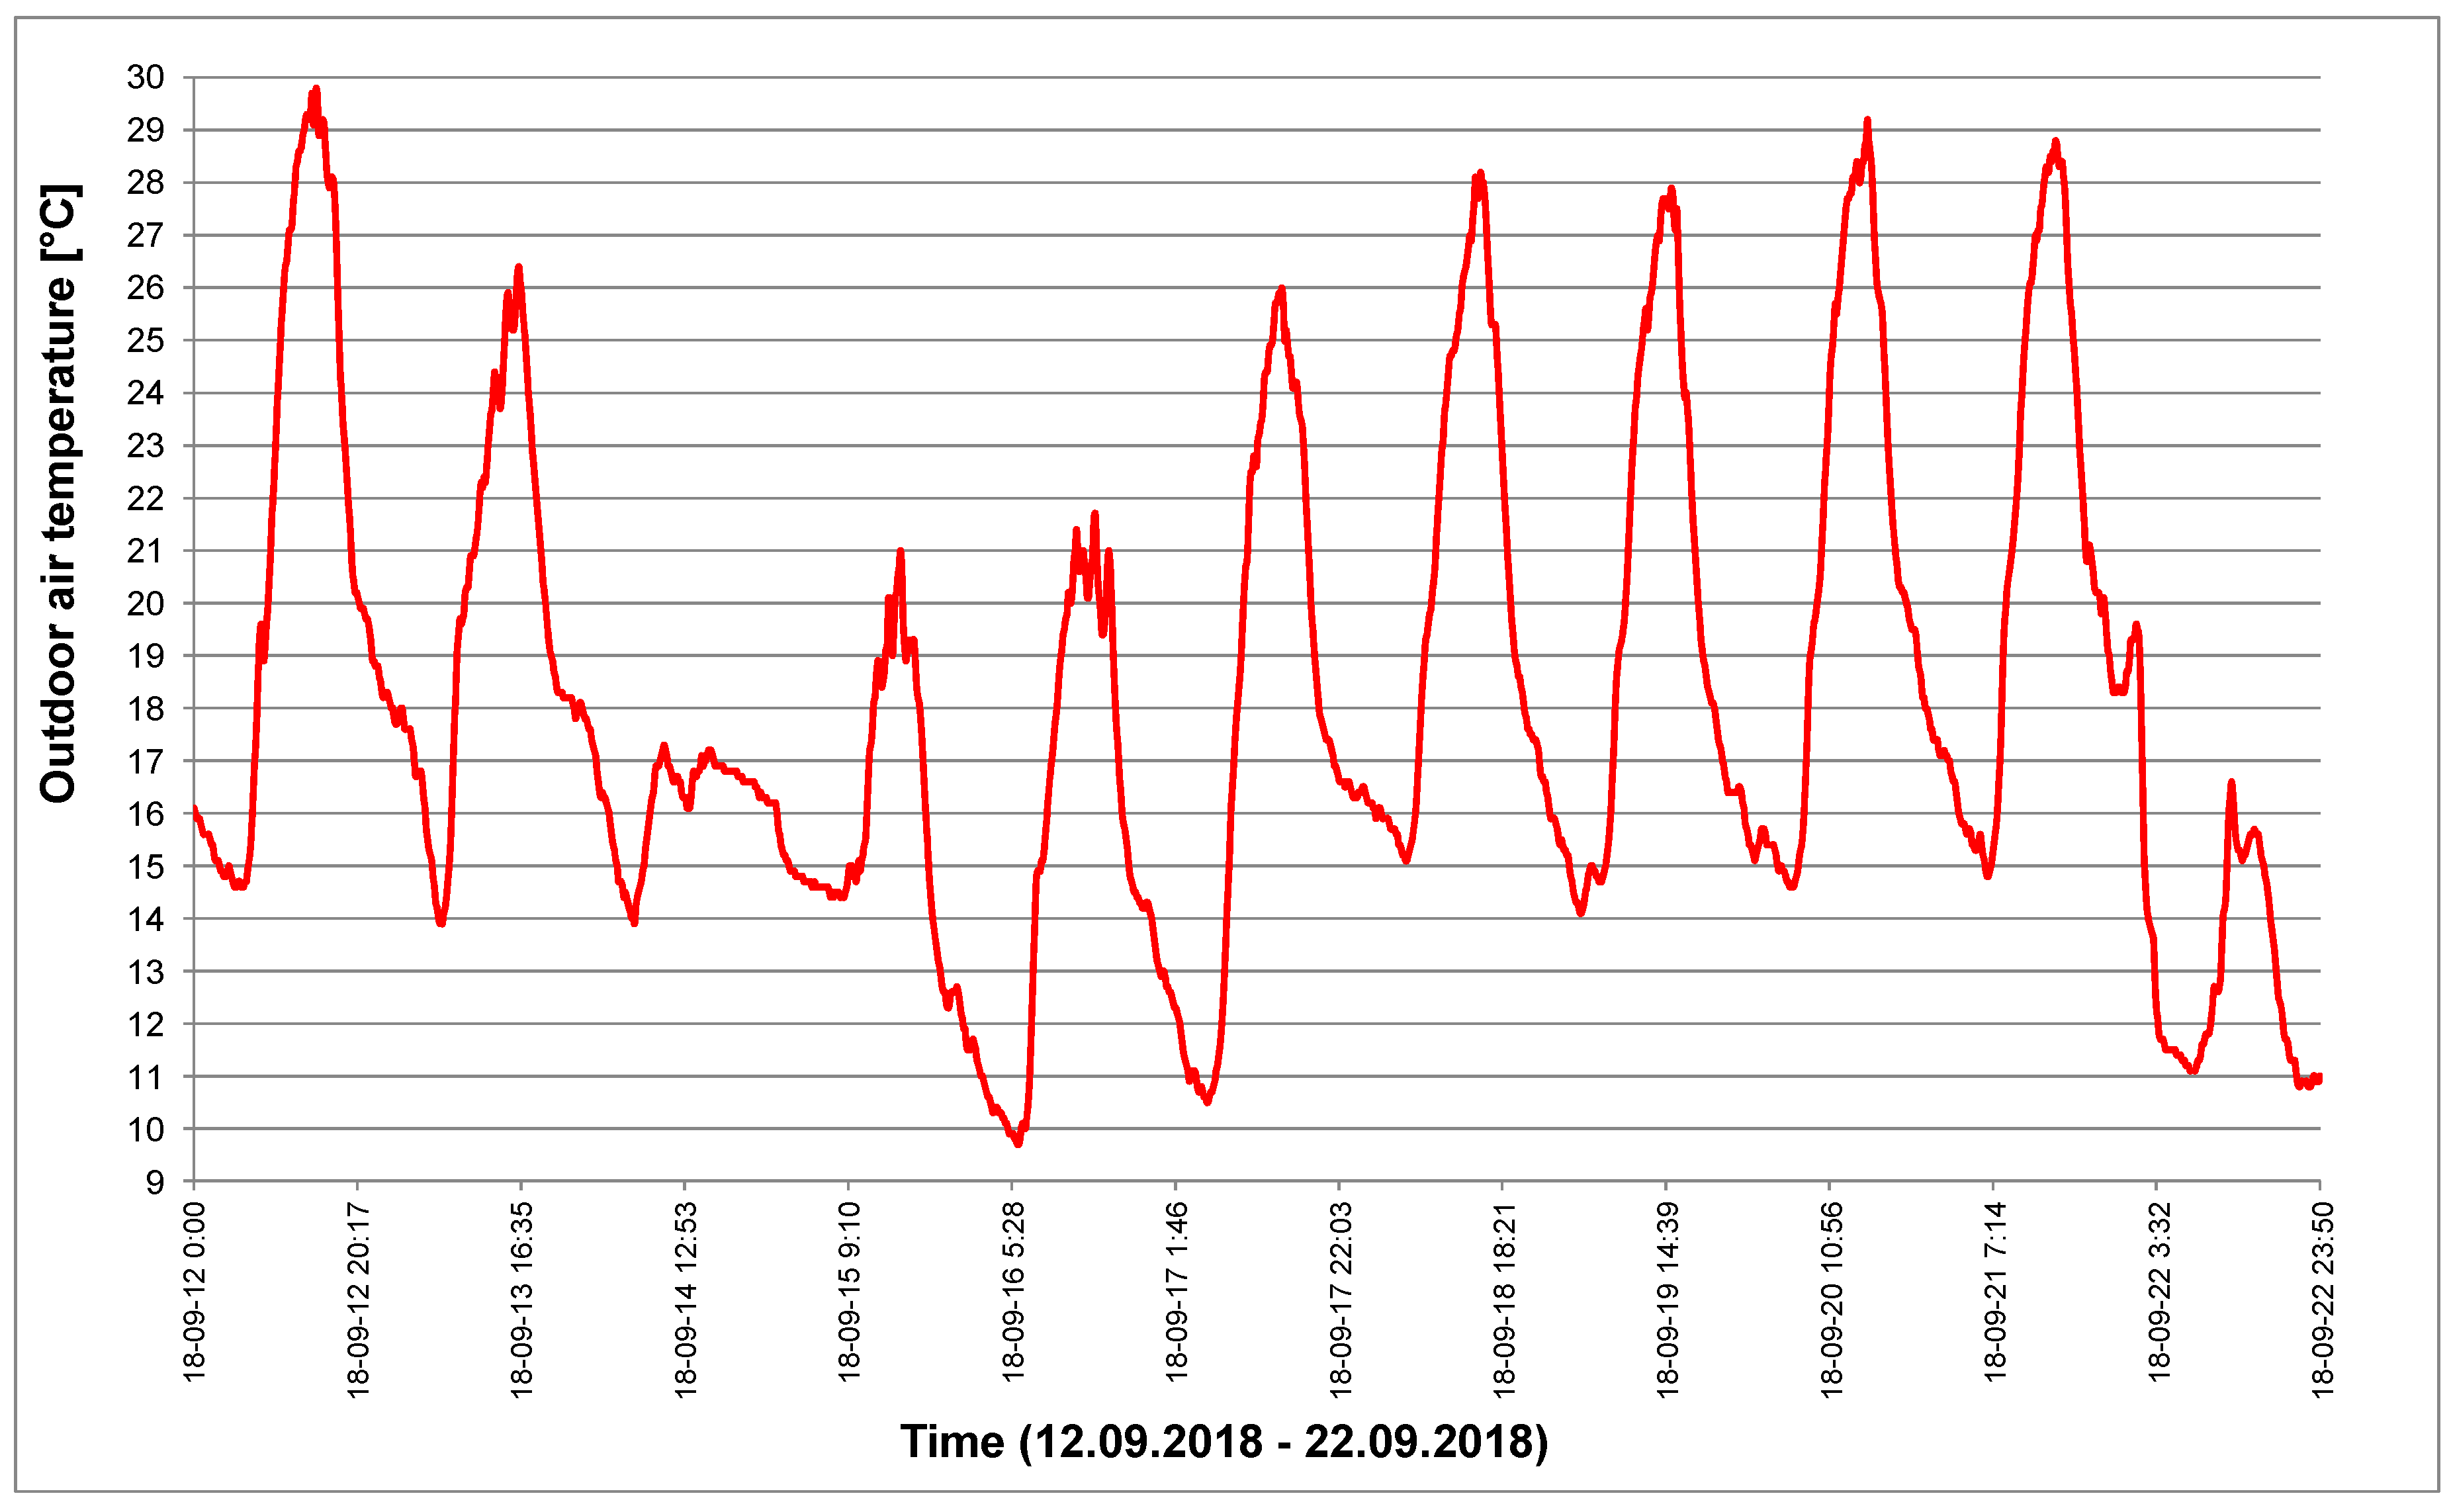
Figure 3 presents the results for air temperature.
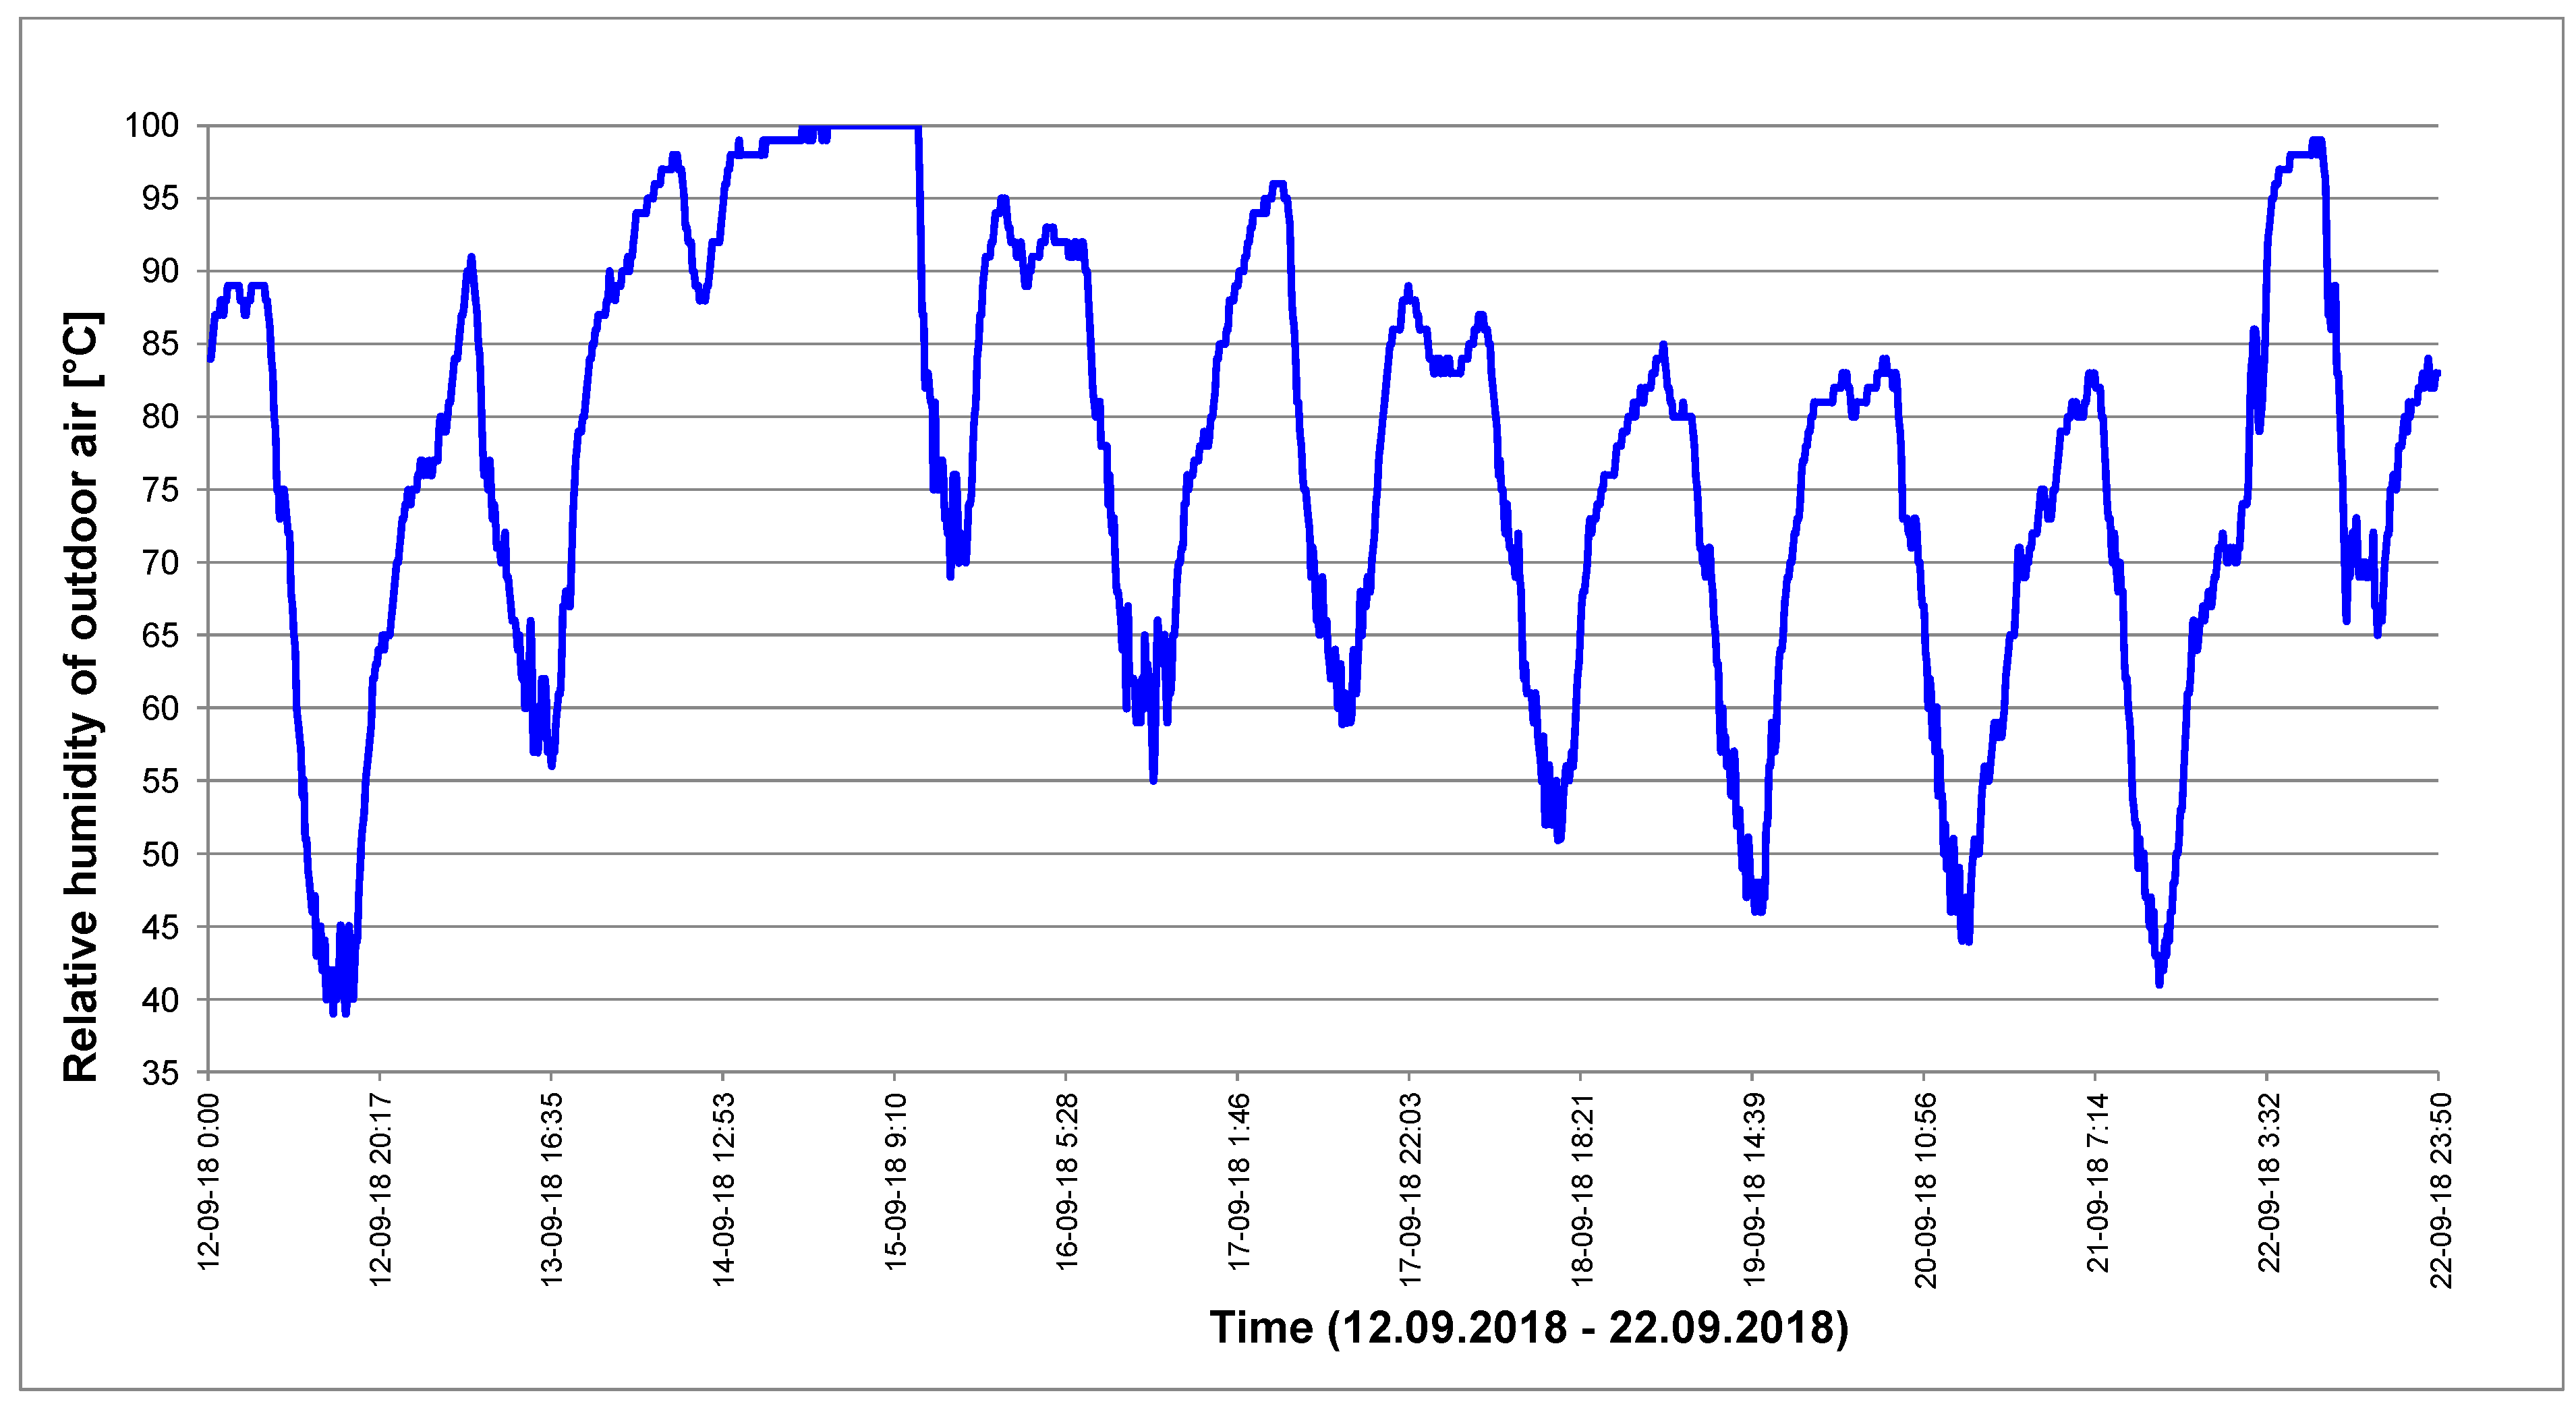
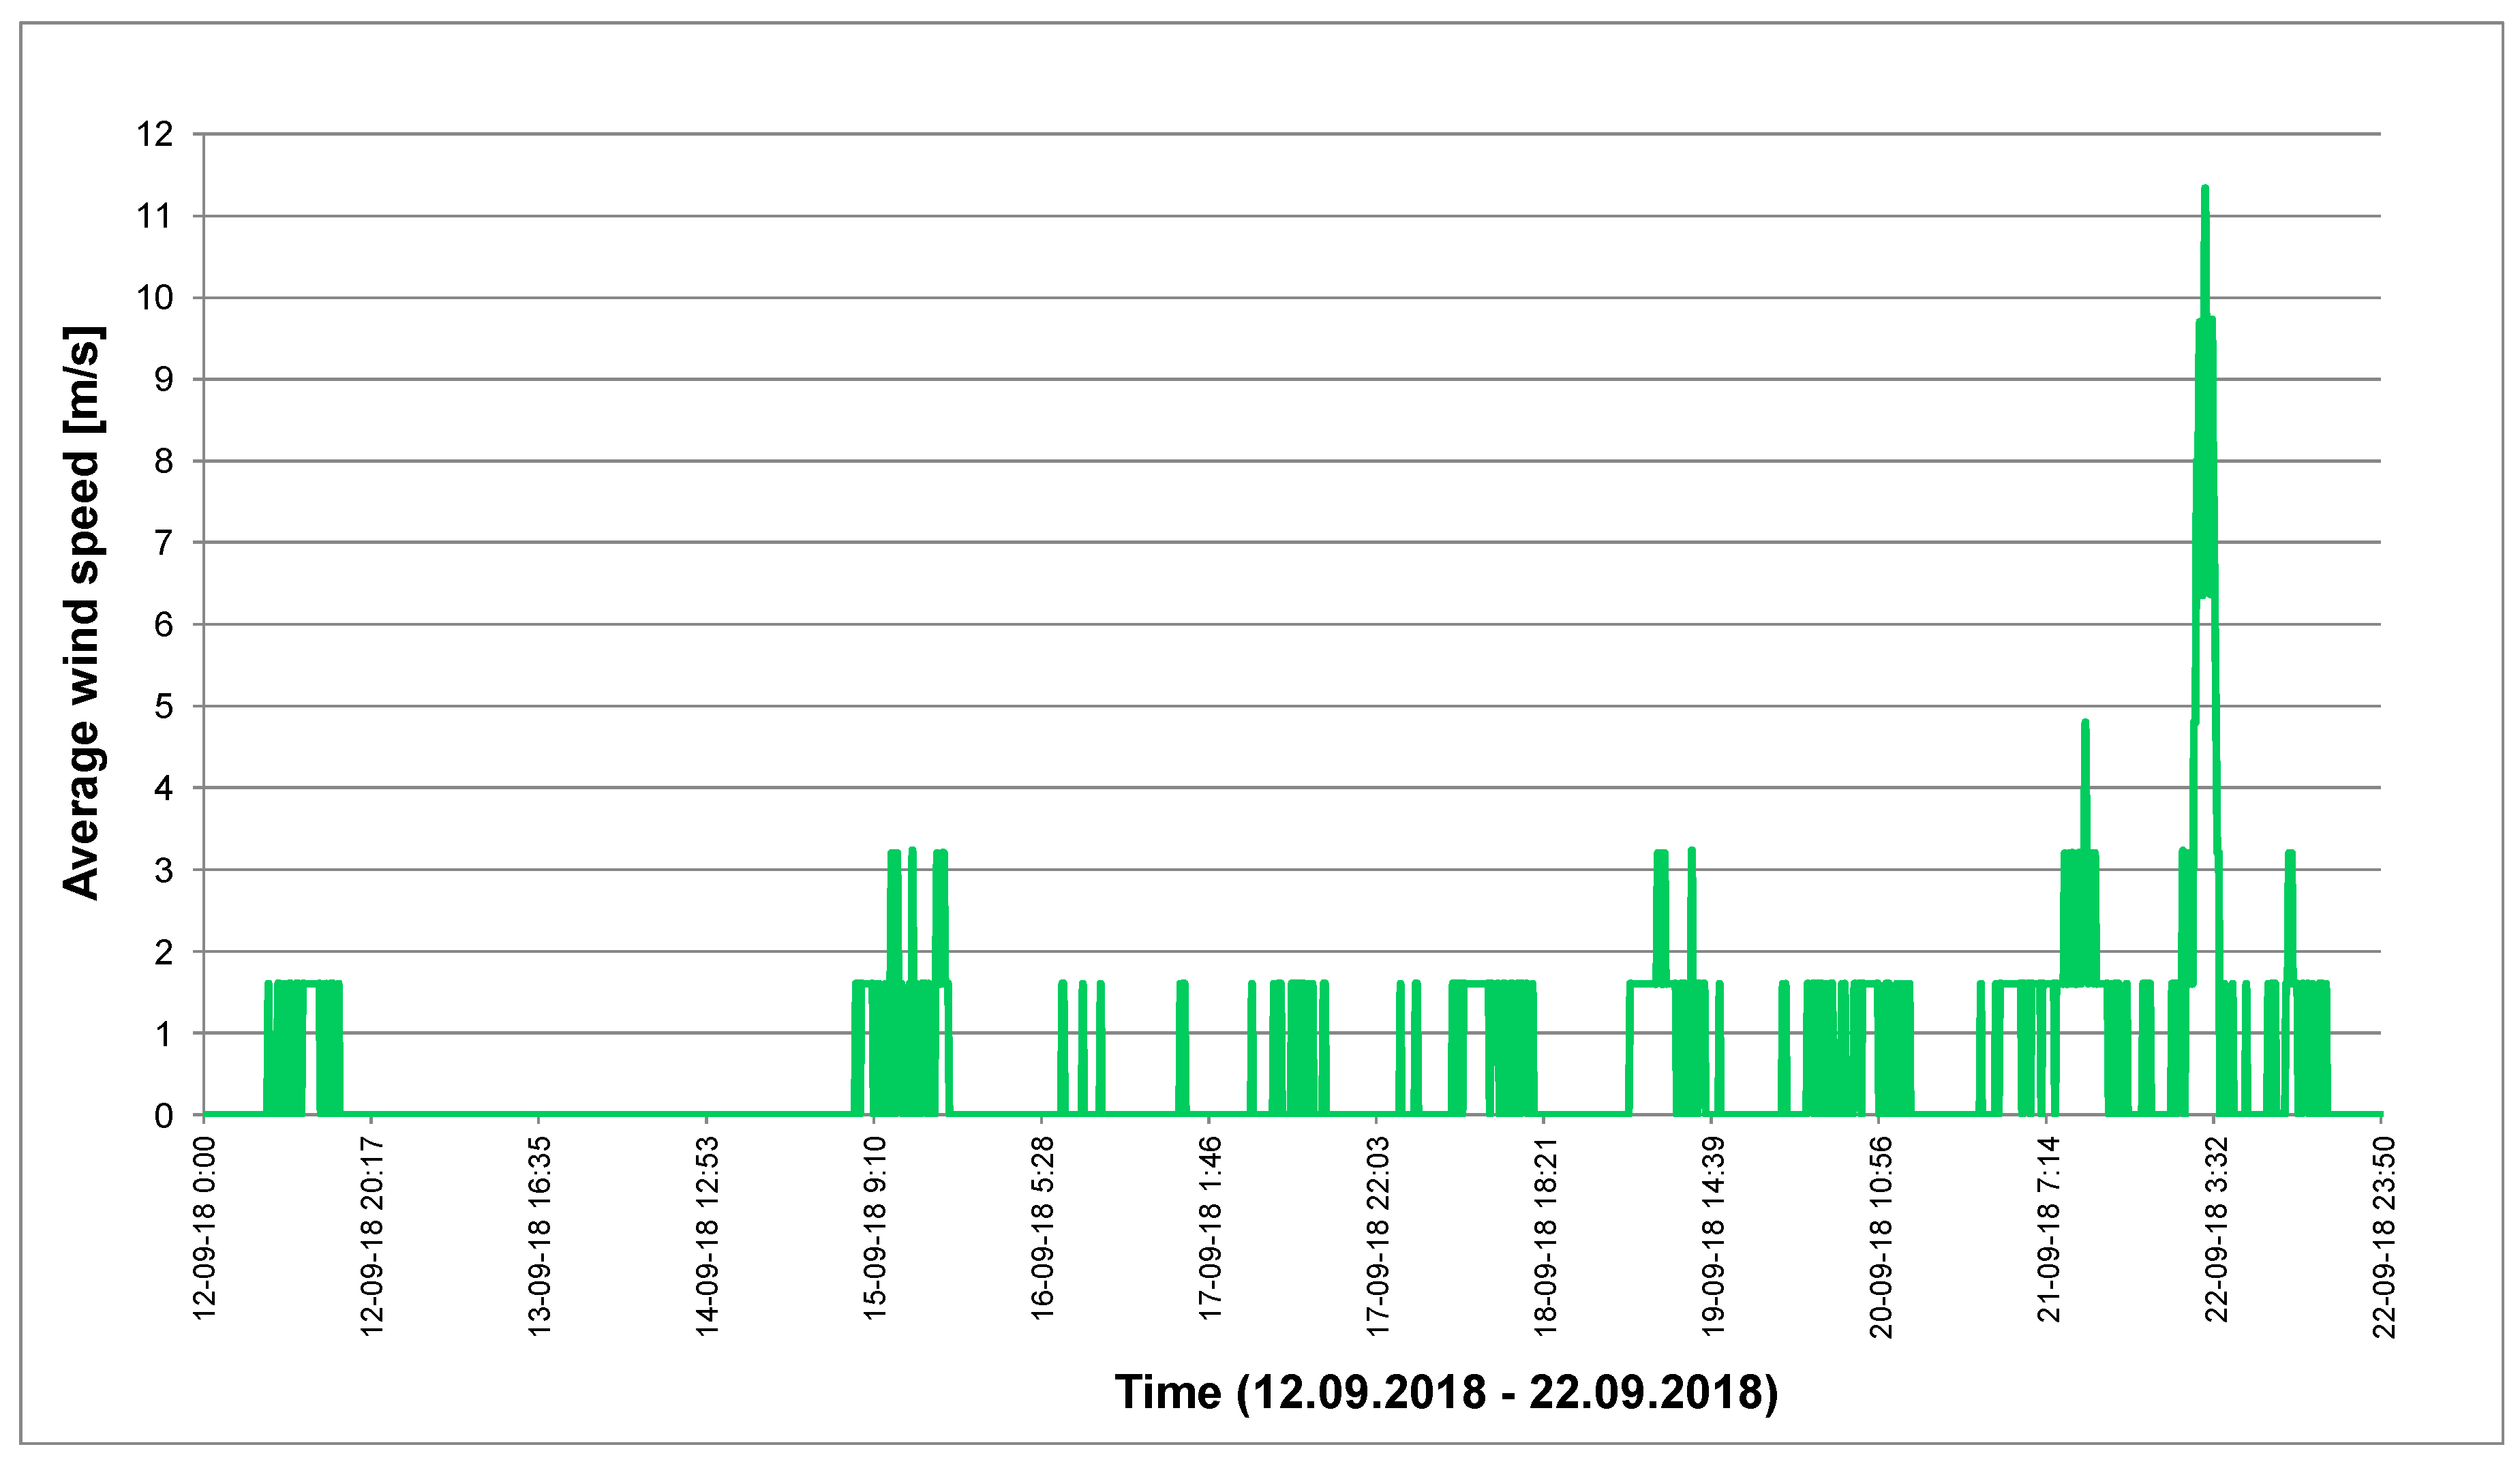
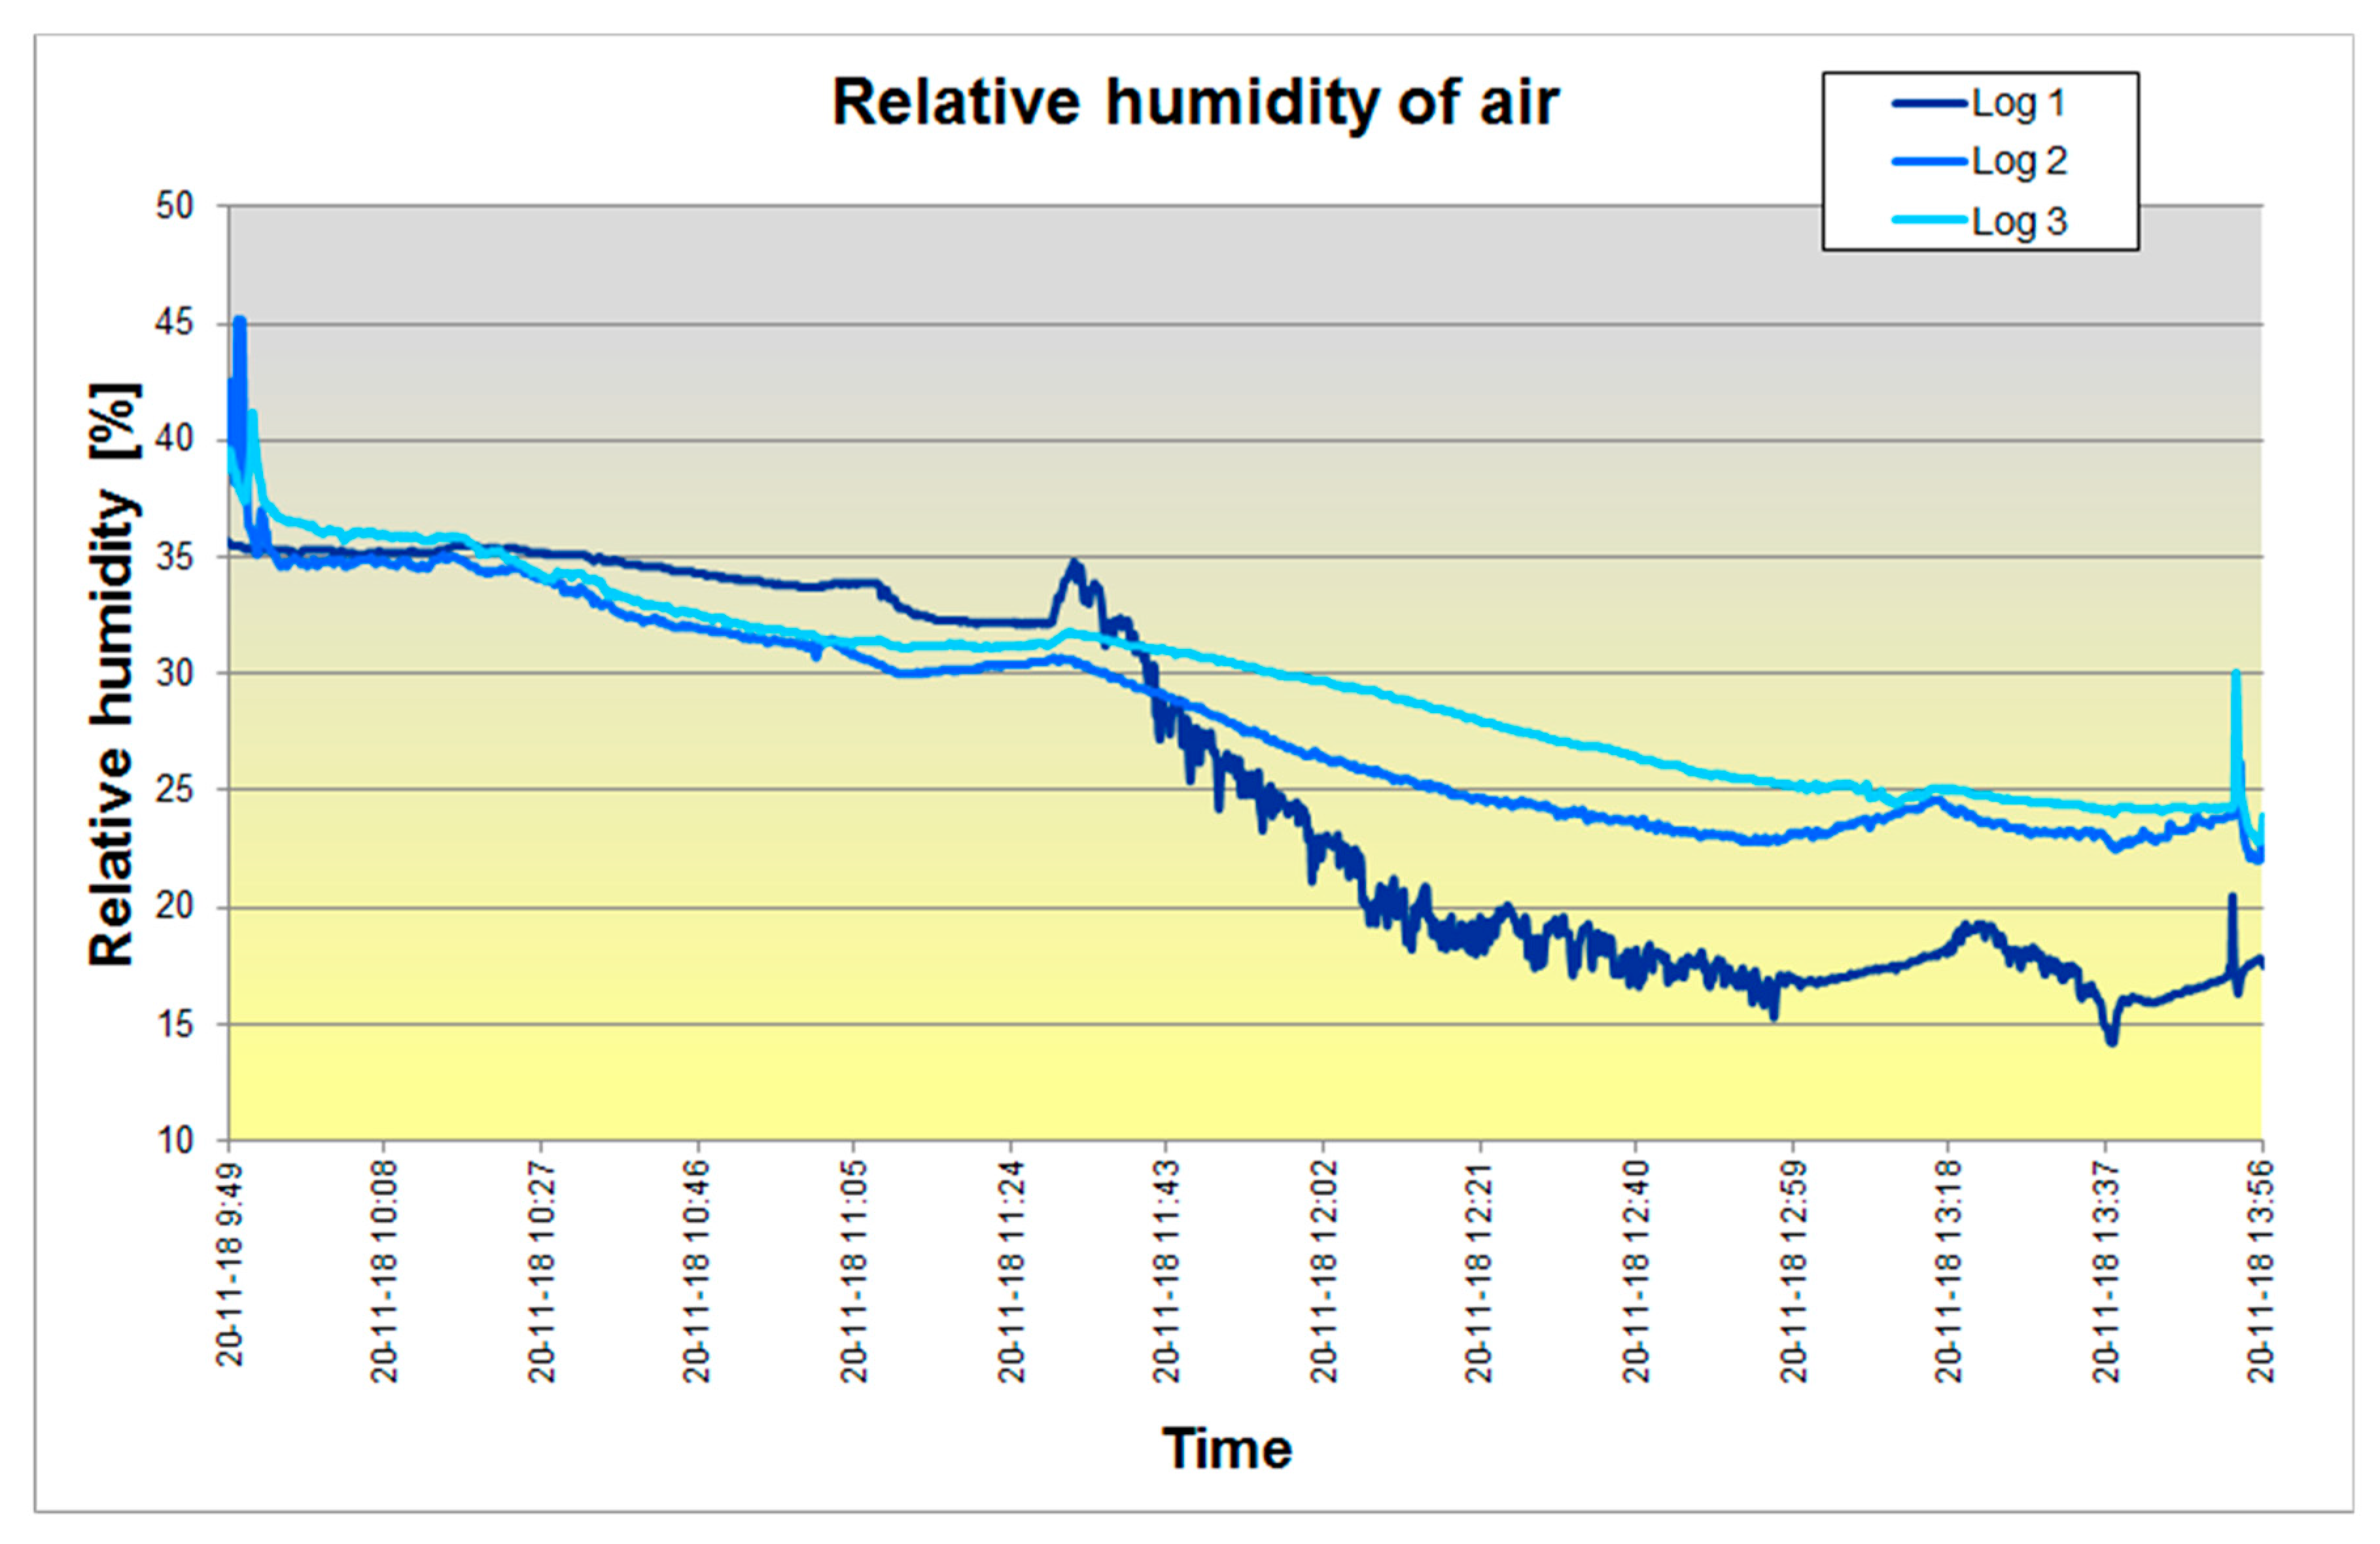
Also the measurements of average air humidity and wind speed were carried out. The results are presented in Figure 4 and Figure 5, respectively.
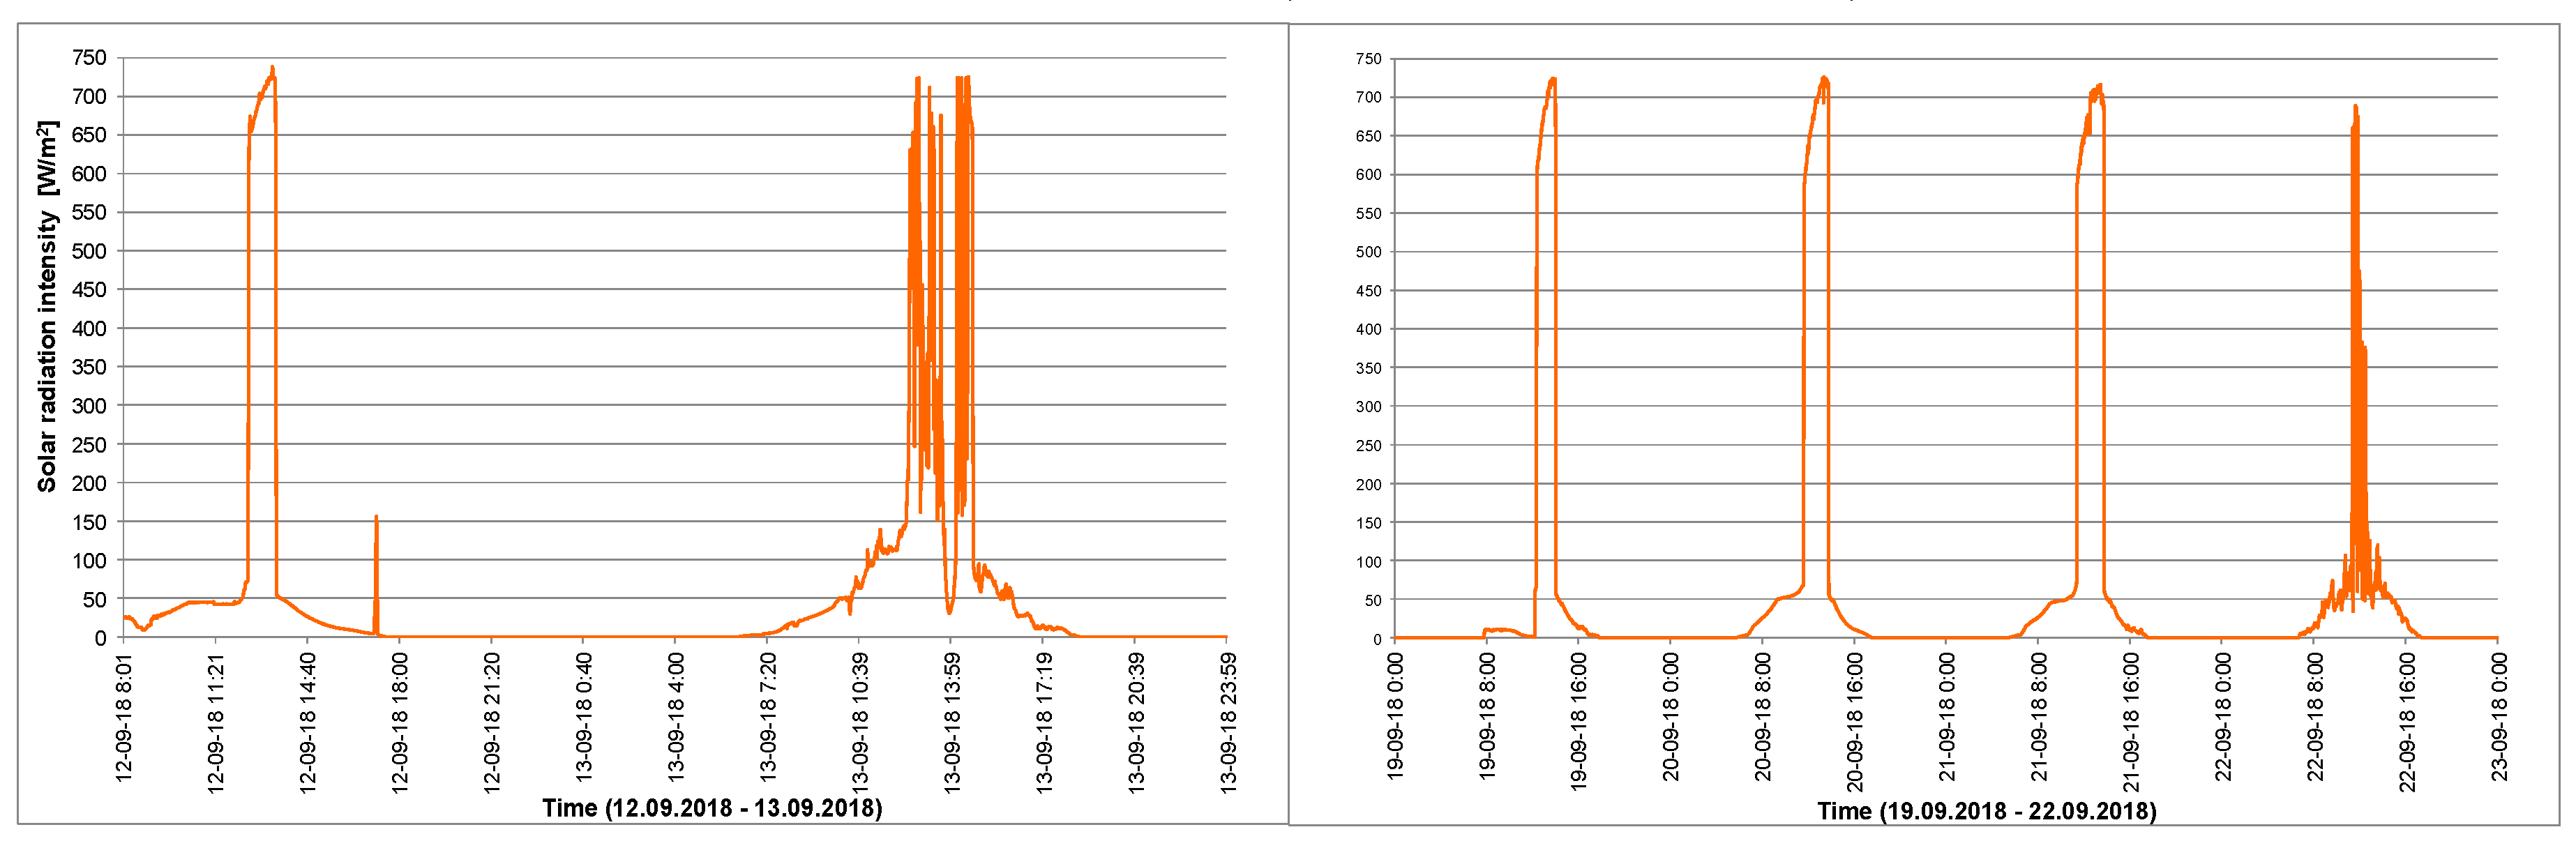
The last series of results involved the intensity of solar radiation Figure 6.
2.2. Laboratory Tests
The laboratory tests of the temperature distribution of the insolated polystyrene panels were carried out in the laboratory hall of the Solar Systems Testing Center located in the laboratory hall of the Euro-Center Science and Technology Park in Katowice in Poland (very close to Mikołów, Silesa). The tests comprised the determination of maximum temperatures at different levels of solar radiation and at different wind speeds. The tested panels had the same geometrical dimensions as the ones tested in situ.
2.2.1. Solar Radiation Stimulator
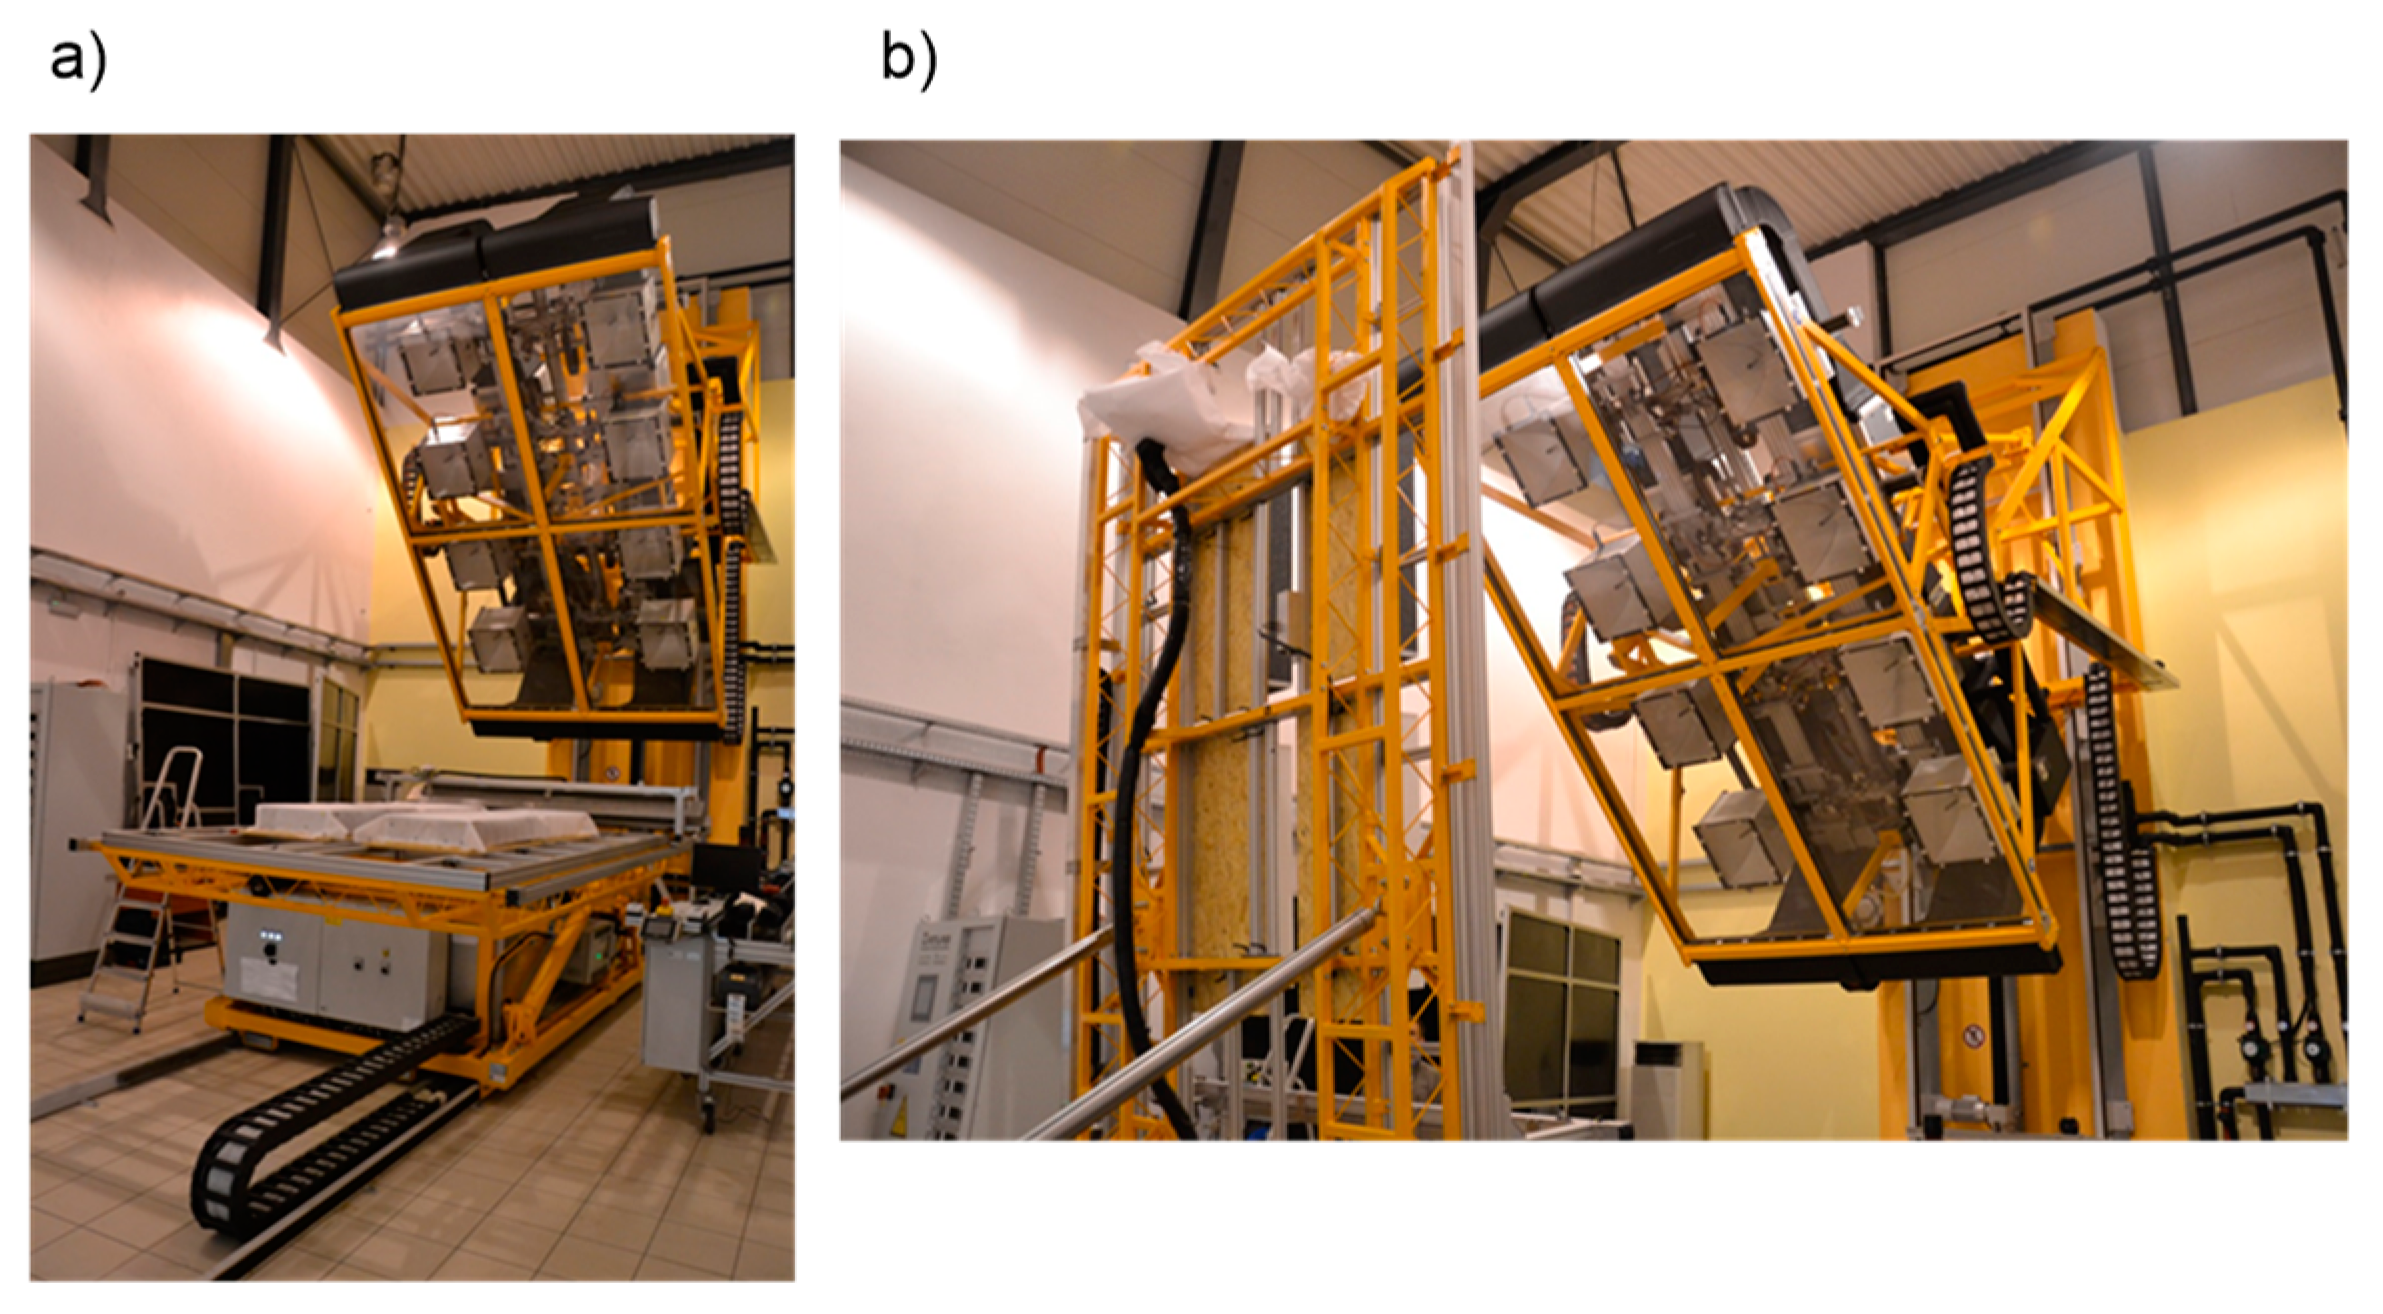
A solar radiation stimulator (artificial sun) is a stationary complex system of devices that enables the generation of radiation in laboratory conditions which reflects the emission of solar radiation. The simulator consists of a field of lamps, artificial sky, temperature sensors and data generation devices. The main element of the research station is made up of eight metal halide lamps of the total power of 32 kW, enabling the simulation of natural solar radiation. The design of the device allows precise positioning of the tested object and the field of lamps, ensuring angle adjustments in the range of 0°–90°. In that way we can imitate the actual ‘journey’ of the sun on the horizon (Figure 7).
2.2.2. Measurement in Laboratory Conditions
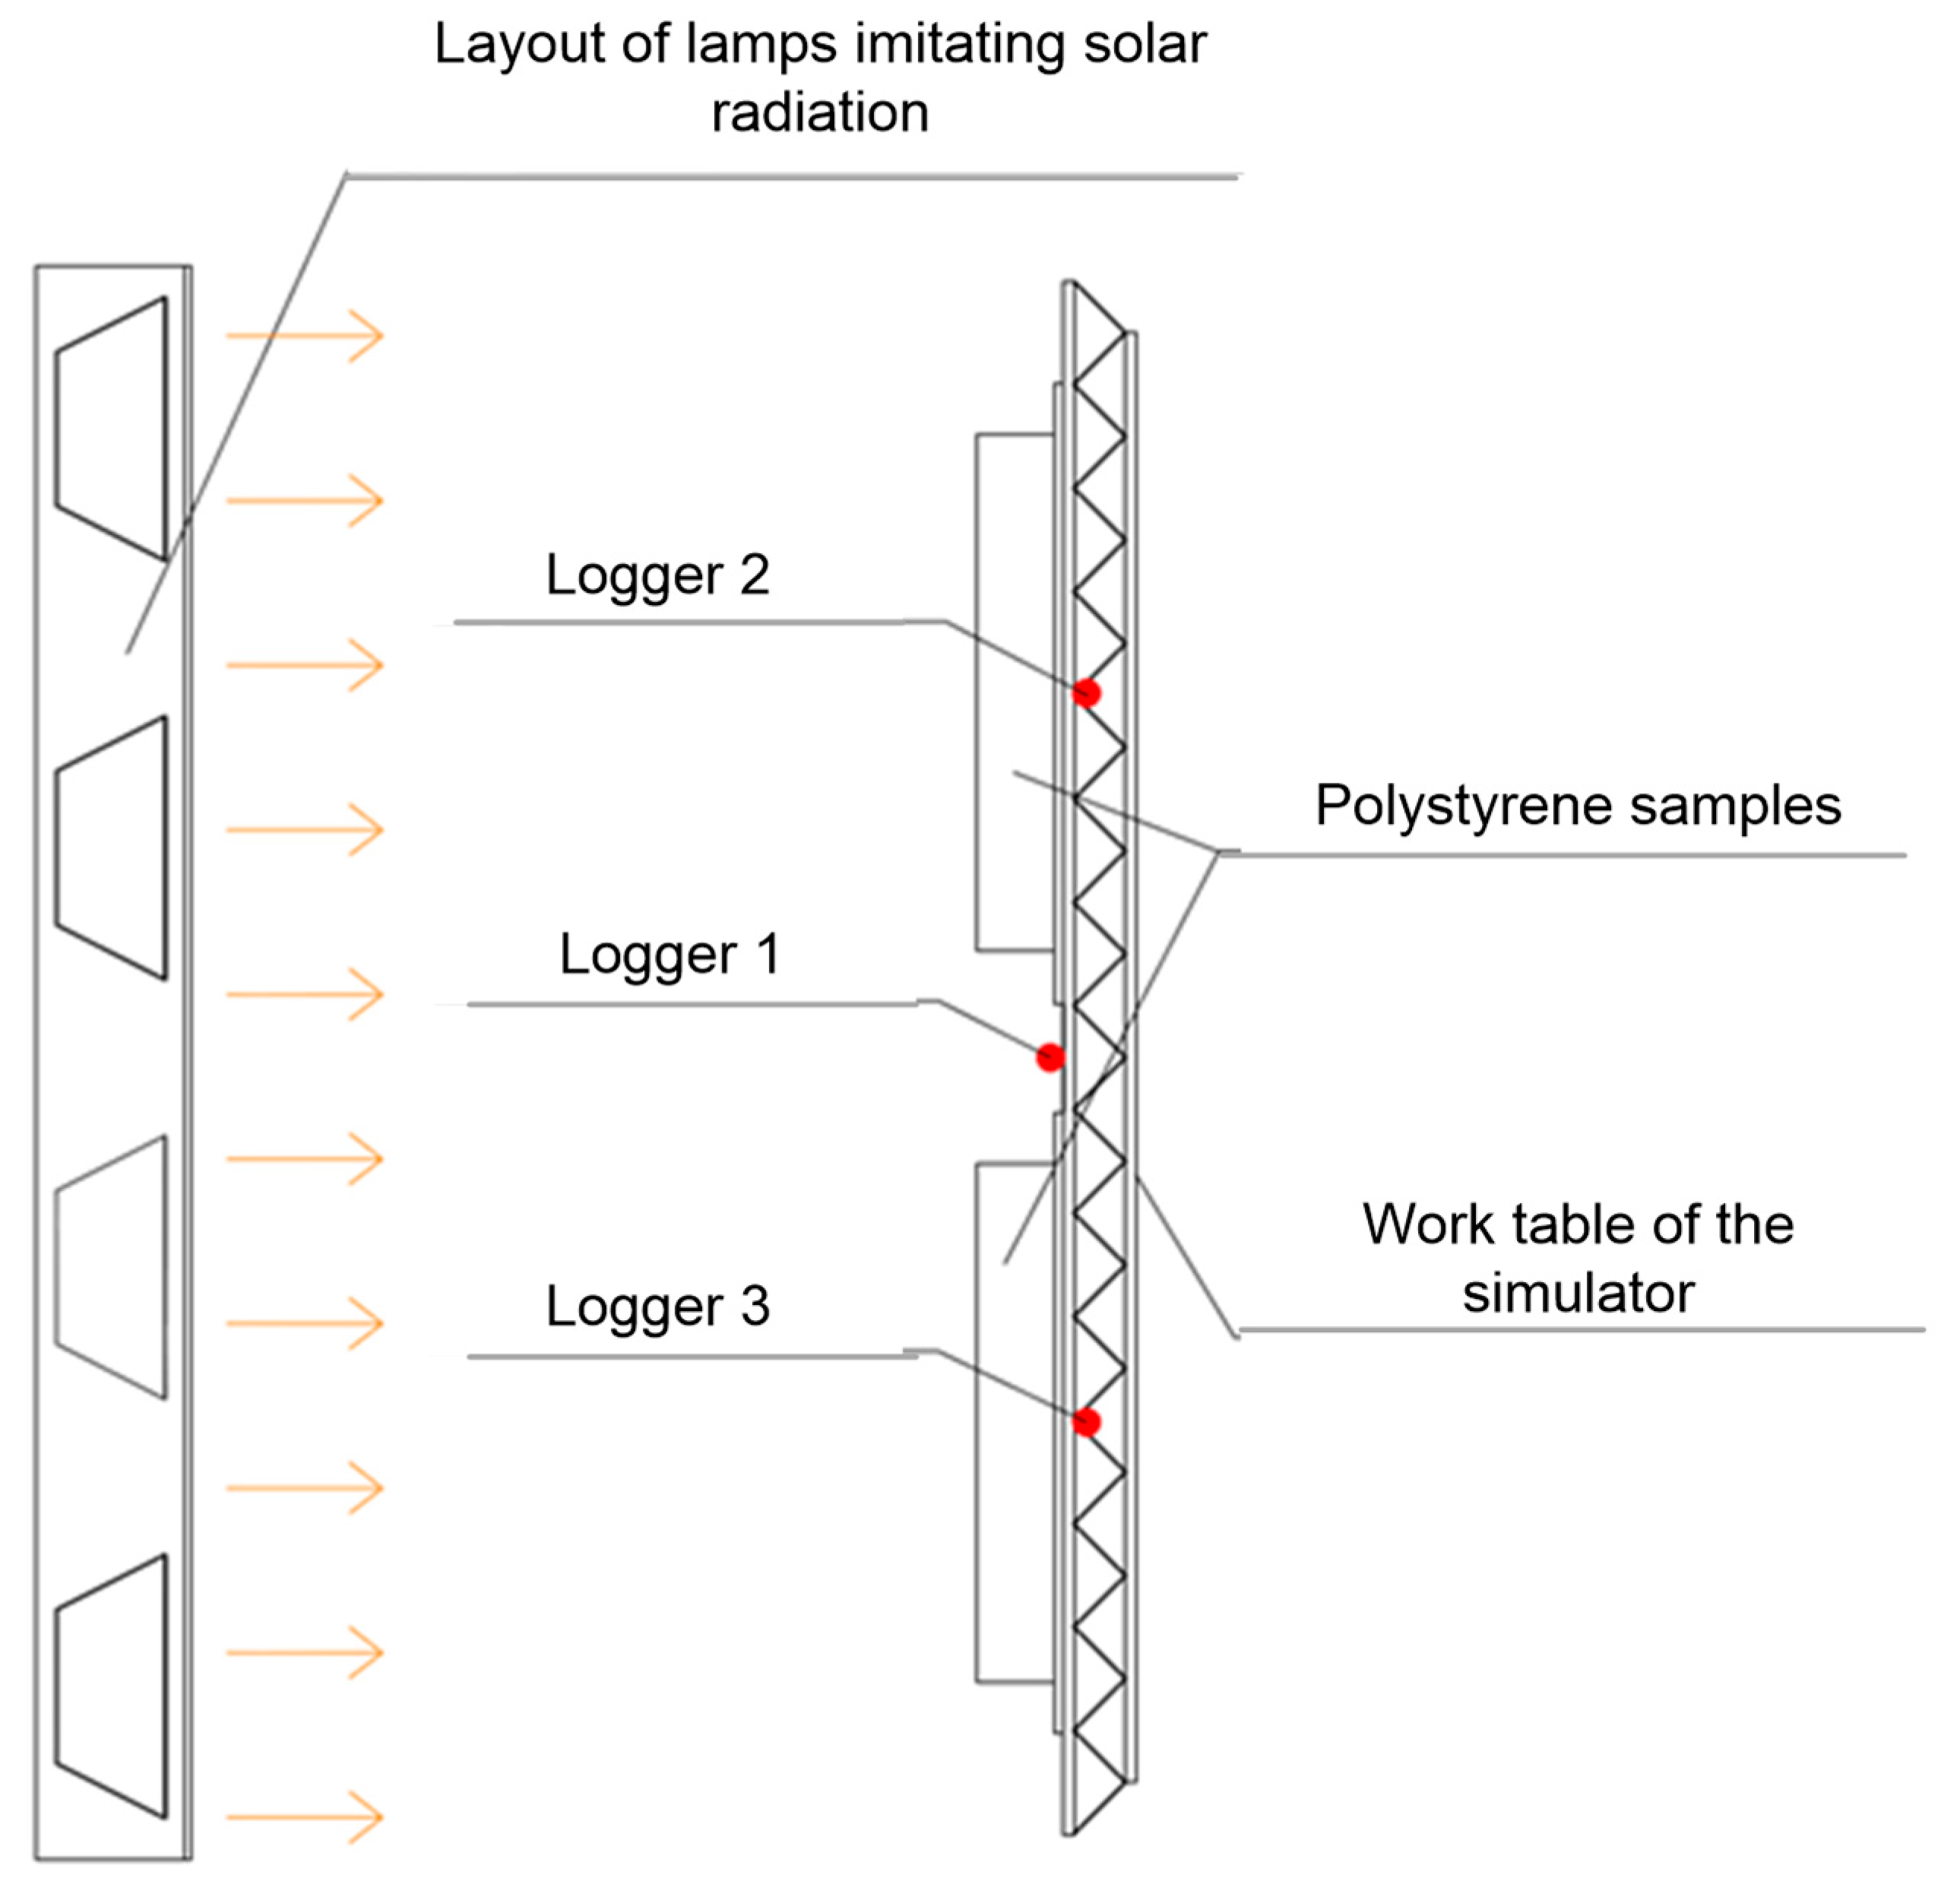
Along with the laboratory tests with the use of a solar radiation simulator, the measurements of microclimate parameters prevailing inside the laboratory room were carried out simultaneously. The loggers measuring temperature and relative humidity were located in the vicinity of the work table of the solar radiation simulator (Figure 8).
The logger No.1 was placed between the tested polystyrene panels (in the middle of the simulator’s work table) from the side of the lamps (artificial sun). The logger No.1 was covered with a layer of aluminum foil from the side of the lamps, which allowed us to eliminate the direct influence of solar radiation on the recorded results of the room climate. The recorders nos. 2 and 3 were placed in the plane of the tested polystyrene samples under the simulator’s work table. The logger No. 2 was located in the upper part of the work table, while the logger No. 3 in its lower part. The measurement time step was set at 10 s. Figure 9 and Figure 10 present the measurement results.
The tests in the laboratory conditions comprised the recording of temperature distribution on the surfaces of the tested polystyrene boards using a thermal imaging camera in two test series. The tested polystyrene boards were subjected to the impact of solar radiation generated by the simulator.
In the first series of tests, the measurements of temperature distribution on the surfaces of EPS panels were carried out for three different values of solar radiation intensity, i.e. 640 W/m2, 950 W/m2 and 1008 W/m2. For each of these intensities, the actual position of the sun above the horizon was simulated by setting the normal to the lamps plane at an appropriate angle to the horizontal surface. Those positions were, respectively, 640 W/m2 → 43.28°, 950 W/m2 → 21°, 1008 W/m2 → 16.28°.
The intensity at the level of 1008 W/m2 corresponds to the maximum value of solar radiation intensity onto the vertical plane turned to the south (azimuth of 180°) selected from all Polish climate bases. The value of 950 W/m2 corresponds to the maximum value of solar radiation intensity onto the vertical plane turned to the south in the period of March–November for the Katowice climate station, i.e. for the climate corresponding to the in situ measurements. The value of 640 W/m2 corresponds to the maximum value obtained from the initial measurements carried out by the authors of this study at the exact location of the in-situ tests.
In the second series, the tests were carried out with the same position of solar radiation simulator lamps, turned perpendicular to the surface of the tested panels. The average radiation intensity for such a position was adopted at 1104 W/m2.
3. Results and Discussion
3.1. In Situ Tests
The in situ tests were principally based on thermographic measurements. On the images of the investigated objects, we applied the measuring elements in the form of measuring points (Sp) and rectangular areas (Bx). An exemplary thermogram from the measurements is presented in Figure 11.
Table 1 and Table 2 summarize the results of thermographic tests from the in situ measurements for two types of test stands.
The results of the carried out in situ thermographic tests demonstrate that in the case of direct impact of solar radiation, the addition of graphite to expanded polystyrene (EPS) panels (panel B) brings about much higher temperature values on the surface as compared to the A and C panels. The quality of the results is not dependent on the type of test stand. Quantitative differences in the results are due to different intensities of solar radiation. For the meteorological conditions during the realization of the measurements, with the emissivity value of the panel being 0.95, we recorded temperatures which did not exceed the softening temperature of the panel, this being 80 °C. The differences of temperature on the surfaces of the remaining panels did not differ significantly, and these had values far different from the critical value i.e. the softening point.
Simultaneously with the field thermal imaging tests of the insolated panels, temperature measurements were carried out inside the samples placed on the mobile stand, and the following results were obtained:
Panel B 50.1 °C, Panel A 36.4 °C, Panel C 31.2 °C
The thermographic measurement is confirmed in that case. The highest surface temperature also corresponds to the highest internal temperature of the panel.
3.2. Laboratory Tests
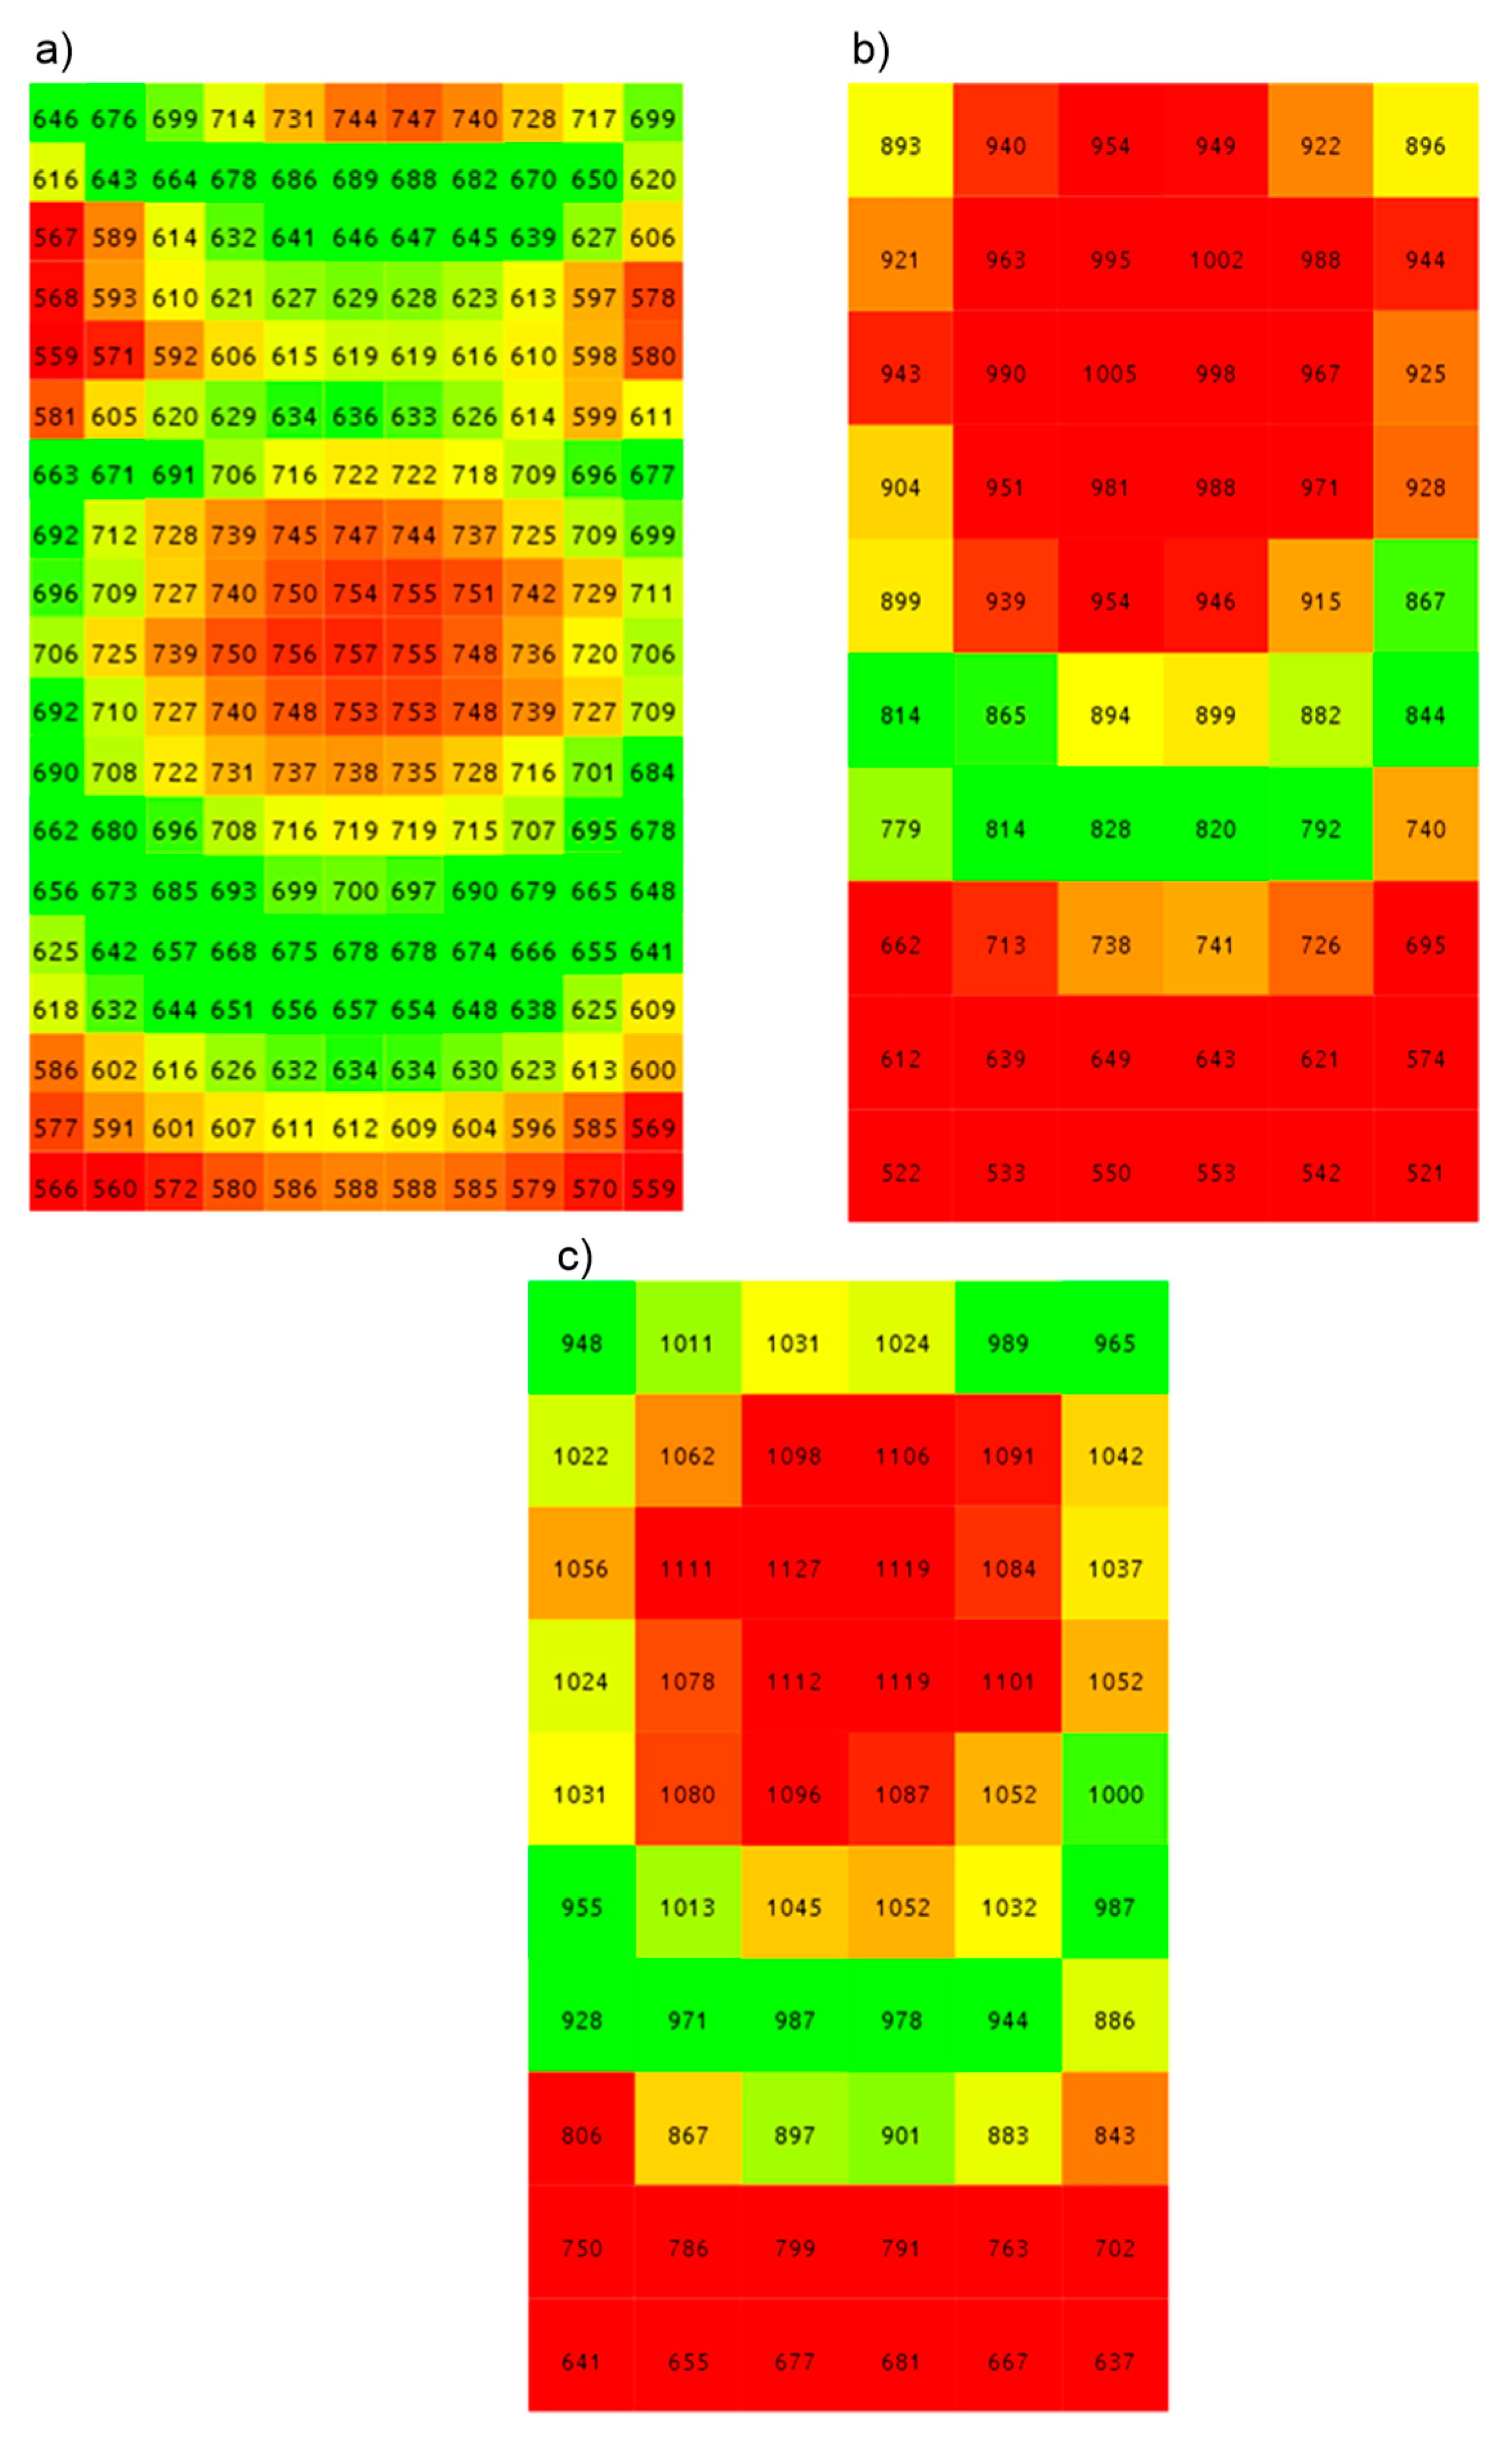
Based on the measurements of solar radiation intensity for the adopted measuring grid, the images presented in Figure 12 and Figure 13 were obtained, using the software dedicated for the test stand.
The second series of tests consisted of one situation presented in Figure 13.
As demonstrated by the in situ tests, the distributions of temperature for panels A and C were very similar. Therefore, the laboratory tests were limited to panel C, which was being compared to the B-type panel. The results of surface temperatures were collected in Table 3 and Table 4.
The results presented in Table 3 imply the same conclusions as for the in situ tests, i.e. expanded polystyrene with the addition of graphite has much higher temperature values on the panel surface than polystyrene without the addition of graphite. In addition, we observe that with the absence of wind for the solar radiation intensity of 950 W/m2 and higher, the risk of exceeding the softening temperature increases significantly. We must admit that such a high intensity did not occur during the in situ tests, but we can read from the data collected for the area of Poland that such high intensities do occur, which was described in the Section 2.2.2 of this work.
Table 3 and Table 4 plainly demonstrate that wind speeds of 3 m/s and 5 m/s significantly reduced the temperatures on the surfaces of the panels. Even with the maximum solar radiation intensity of ls = 1008 W/m2, the temperatures dropped below the softening point of the panels.
For the second series of tests, i.e. with the lamps of the solar radiation simulator directed perpendicular to the surface of the tested panels, the results are collected in Table 5.
As we can see in Table 5, solar radiation perpendicular to the surface of the panels is plainly threatening their durability. This may bring about a complete destruction of expanded polystyrene with the addition of graphite.
Then the comparative tests of internal temperature distribution were carried out for panels A and B.
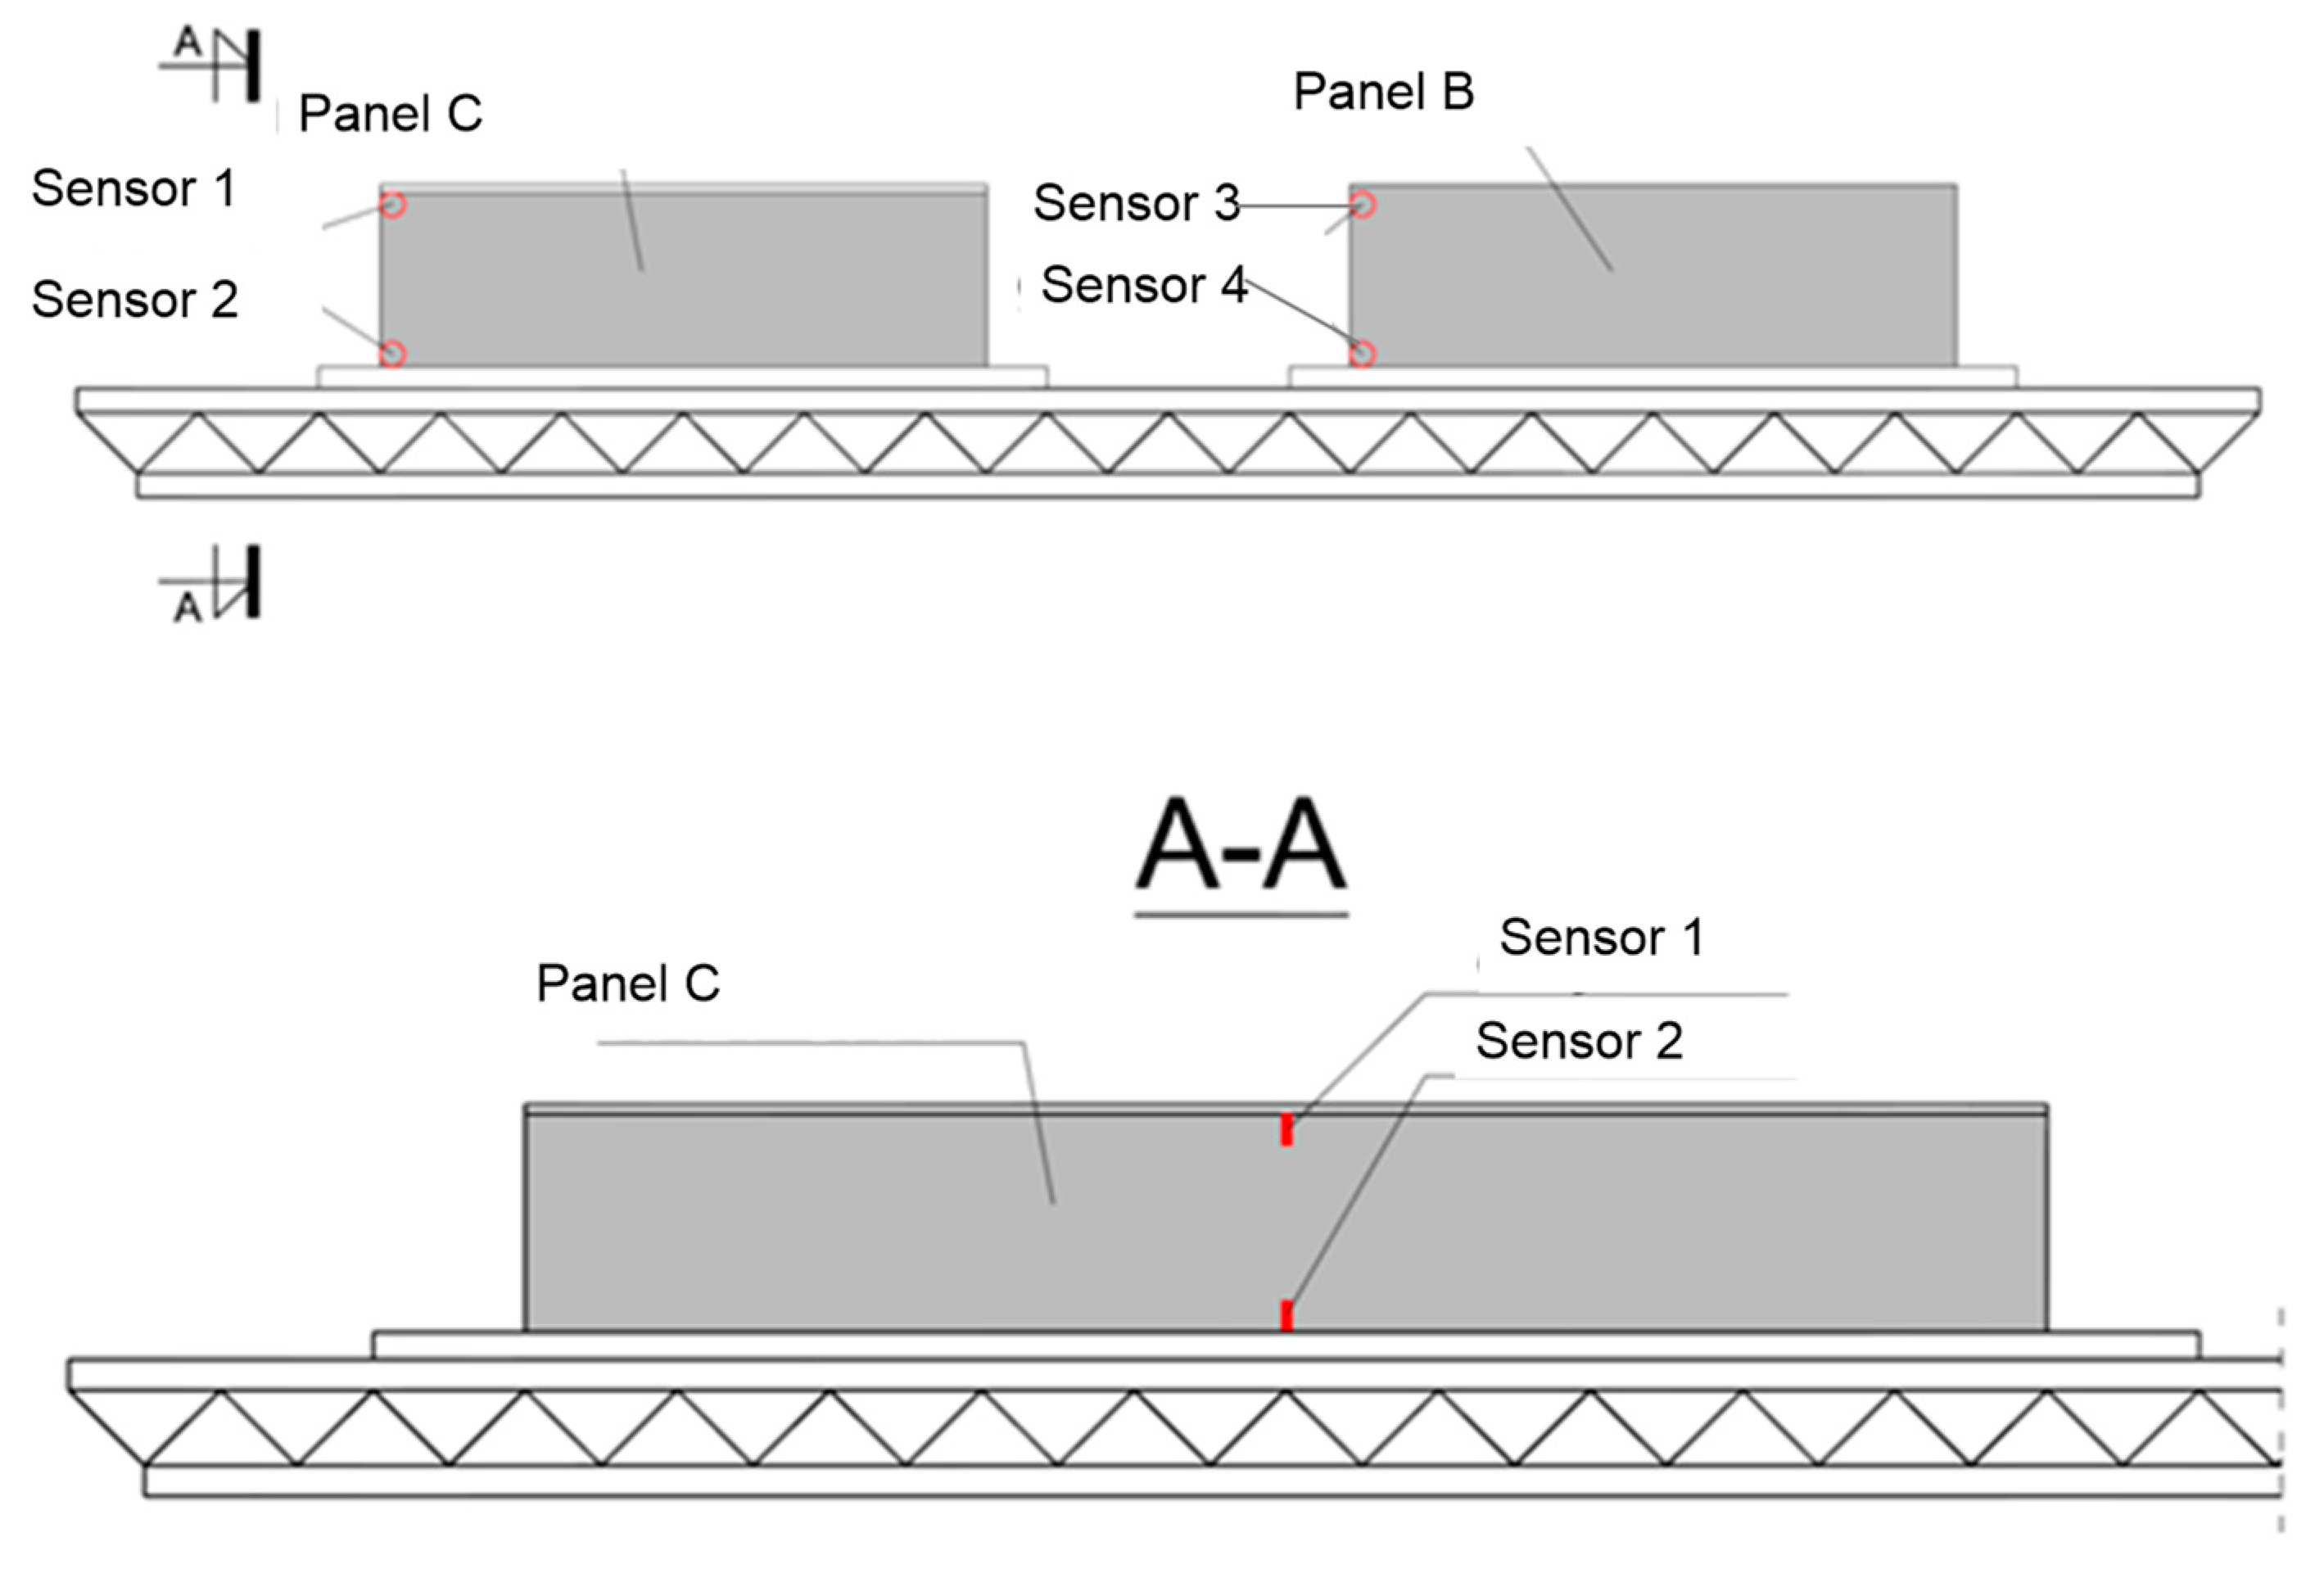
In order to examine the distribution of temperature inside the panels, two temperature measurement sensors were placed on the lateral planes of the panels. The sensors were arranged in such a way (see Figure 14) to examine the impact of the protective layer of panel A on temperature distribution inside it as compared to panel B.
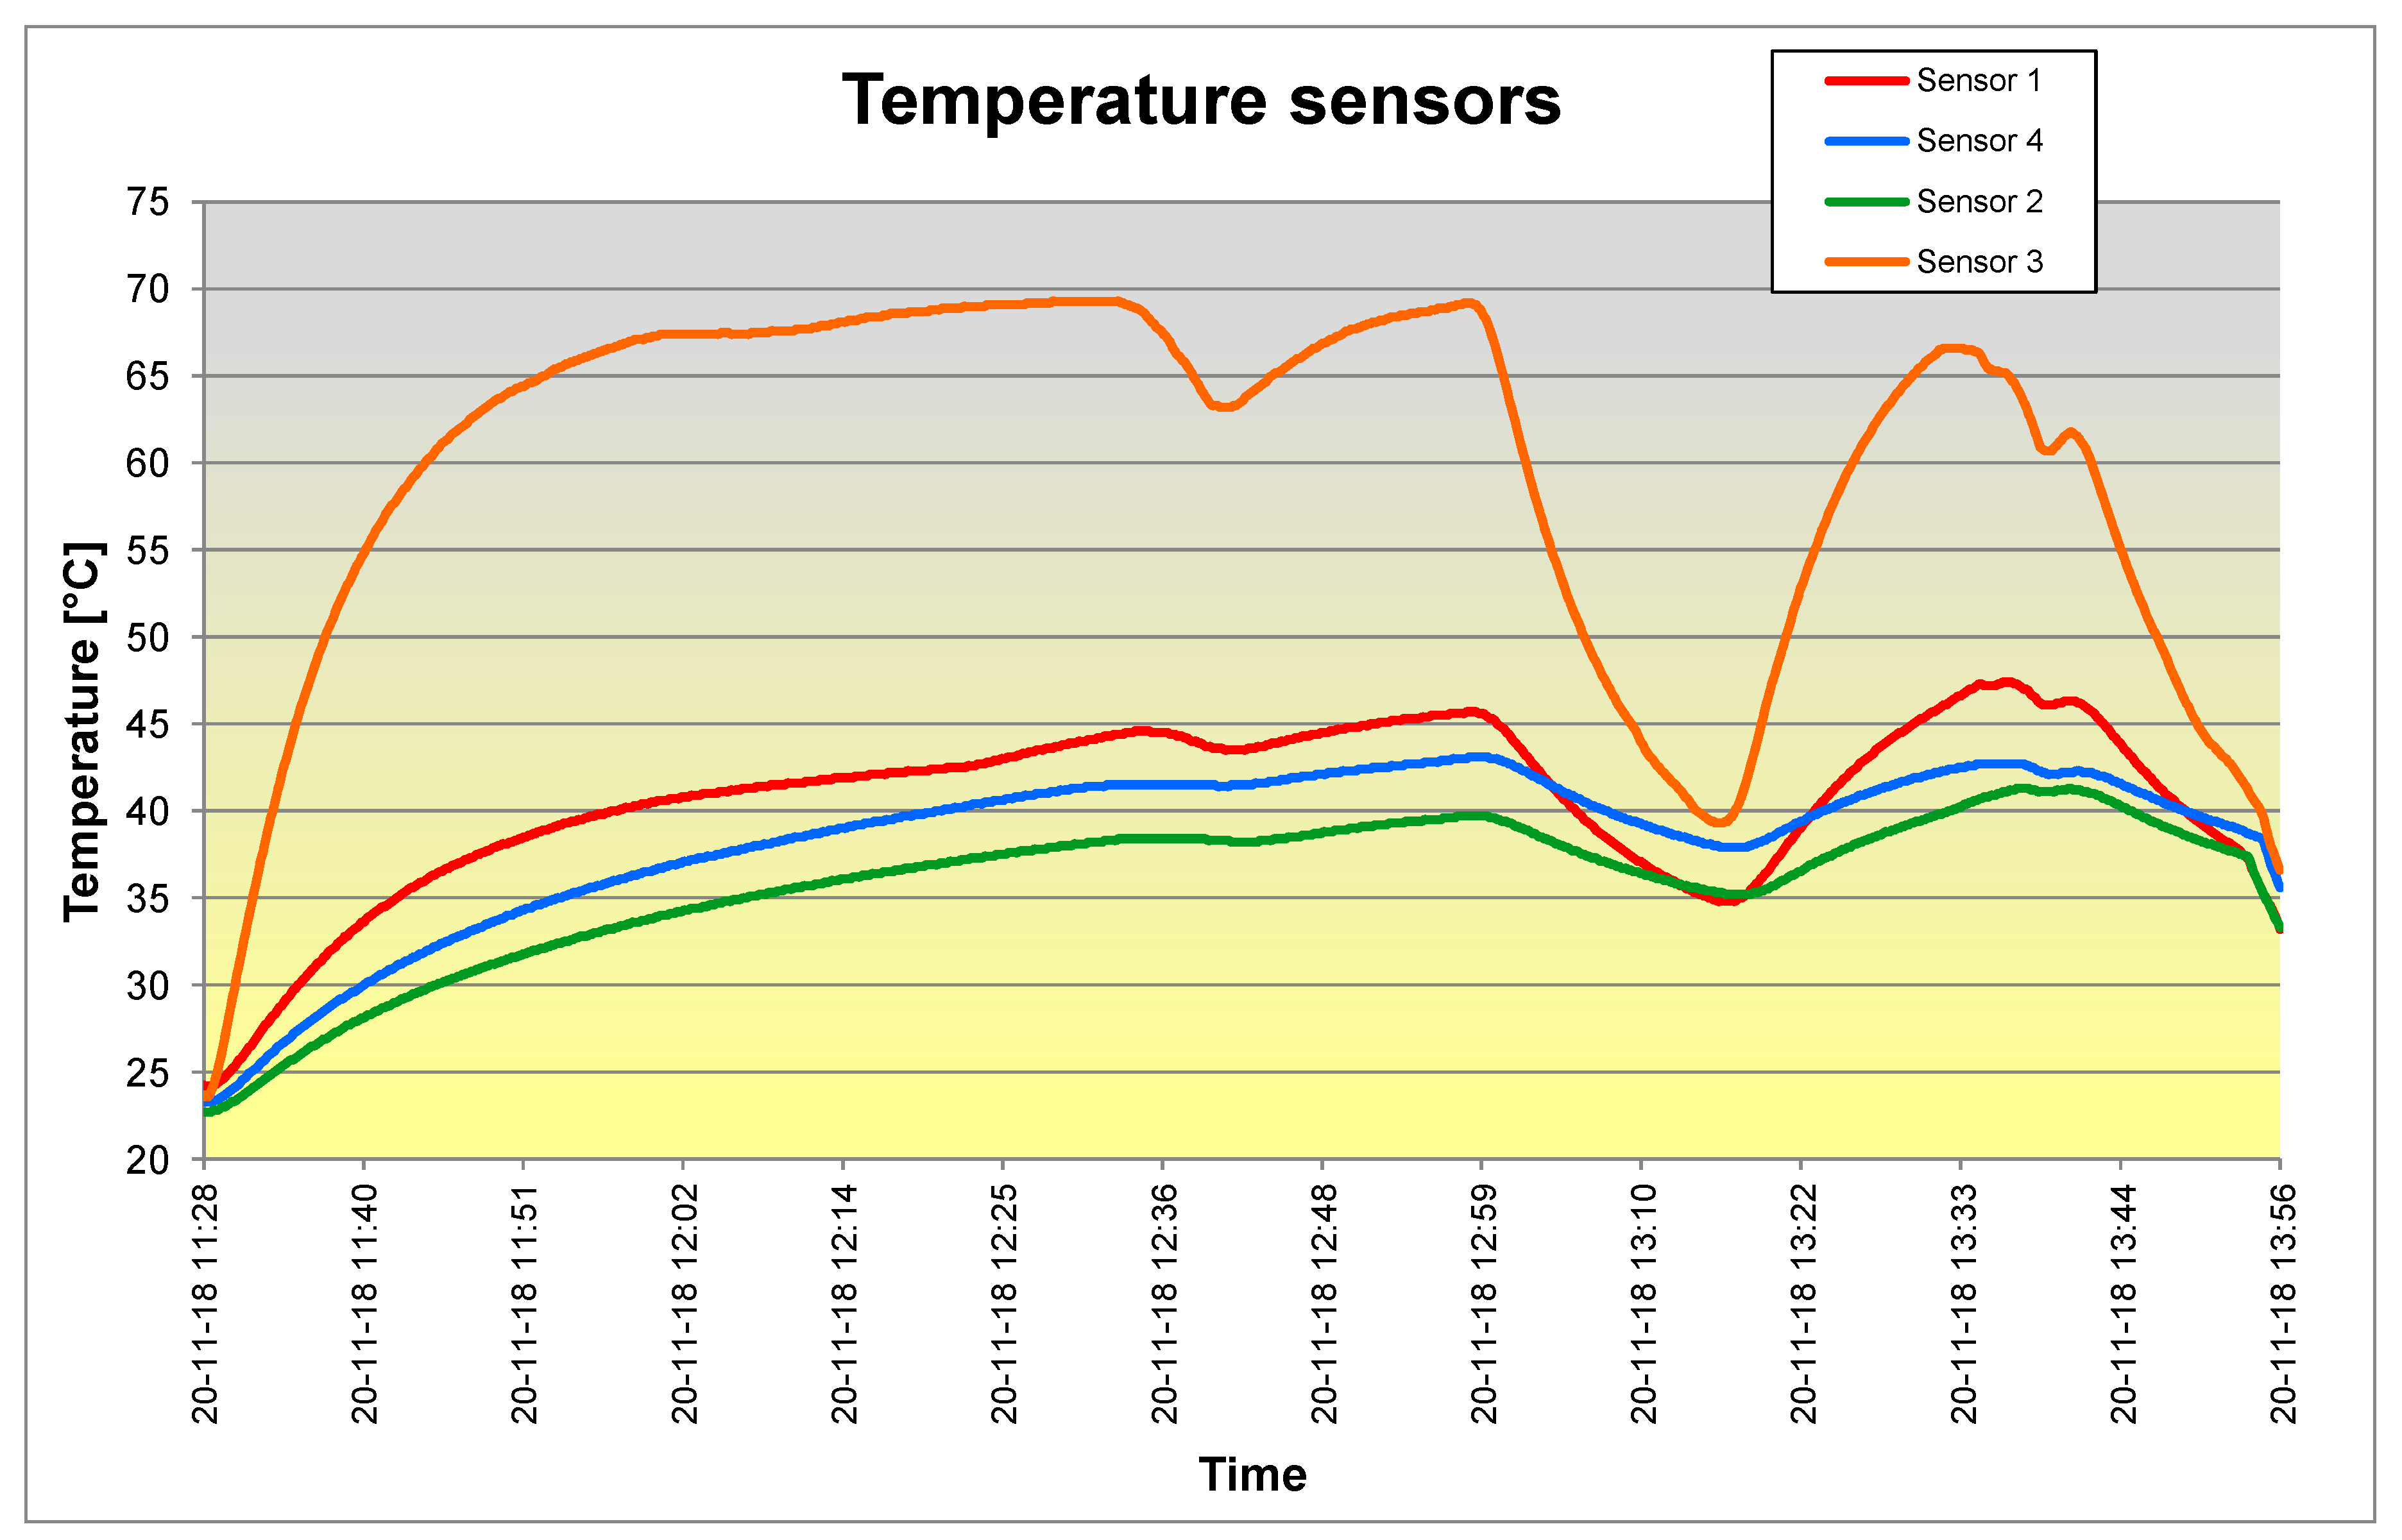
The measurement results are presented in Figure 15.
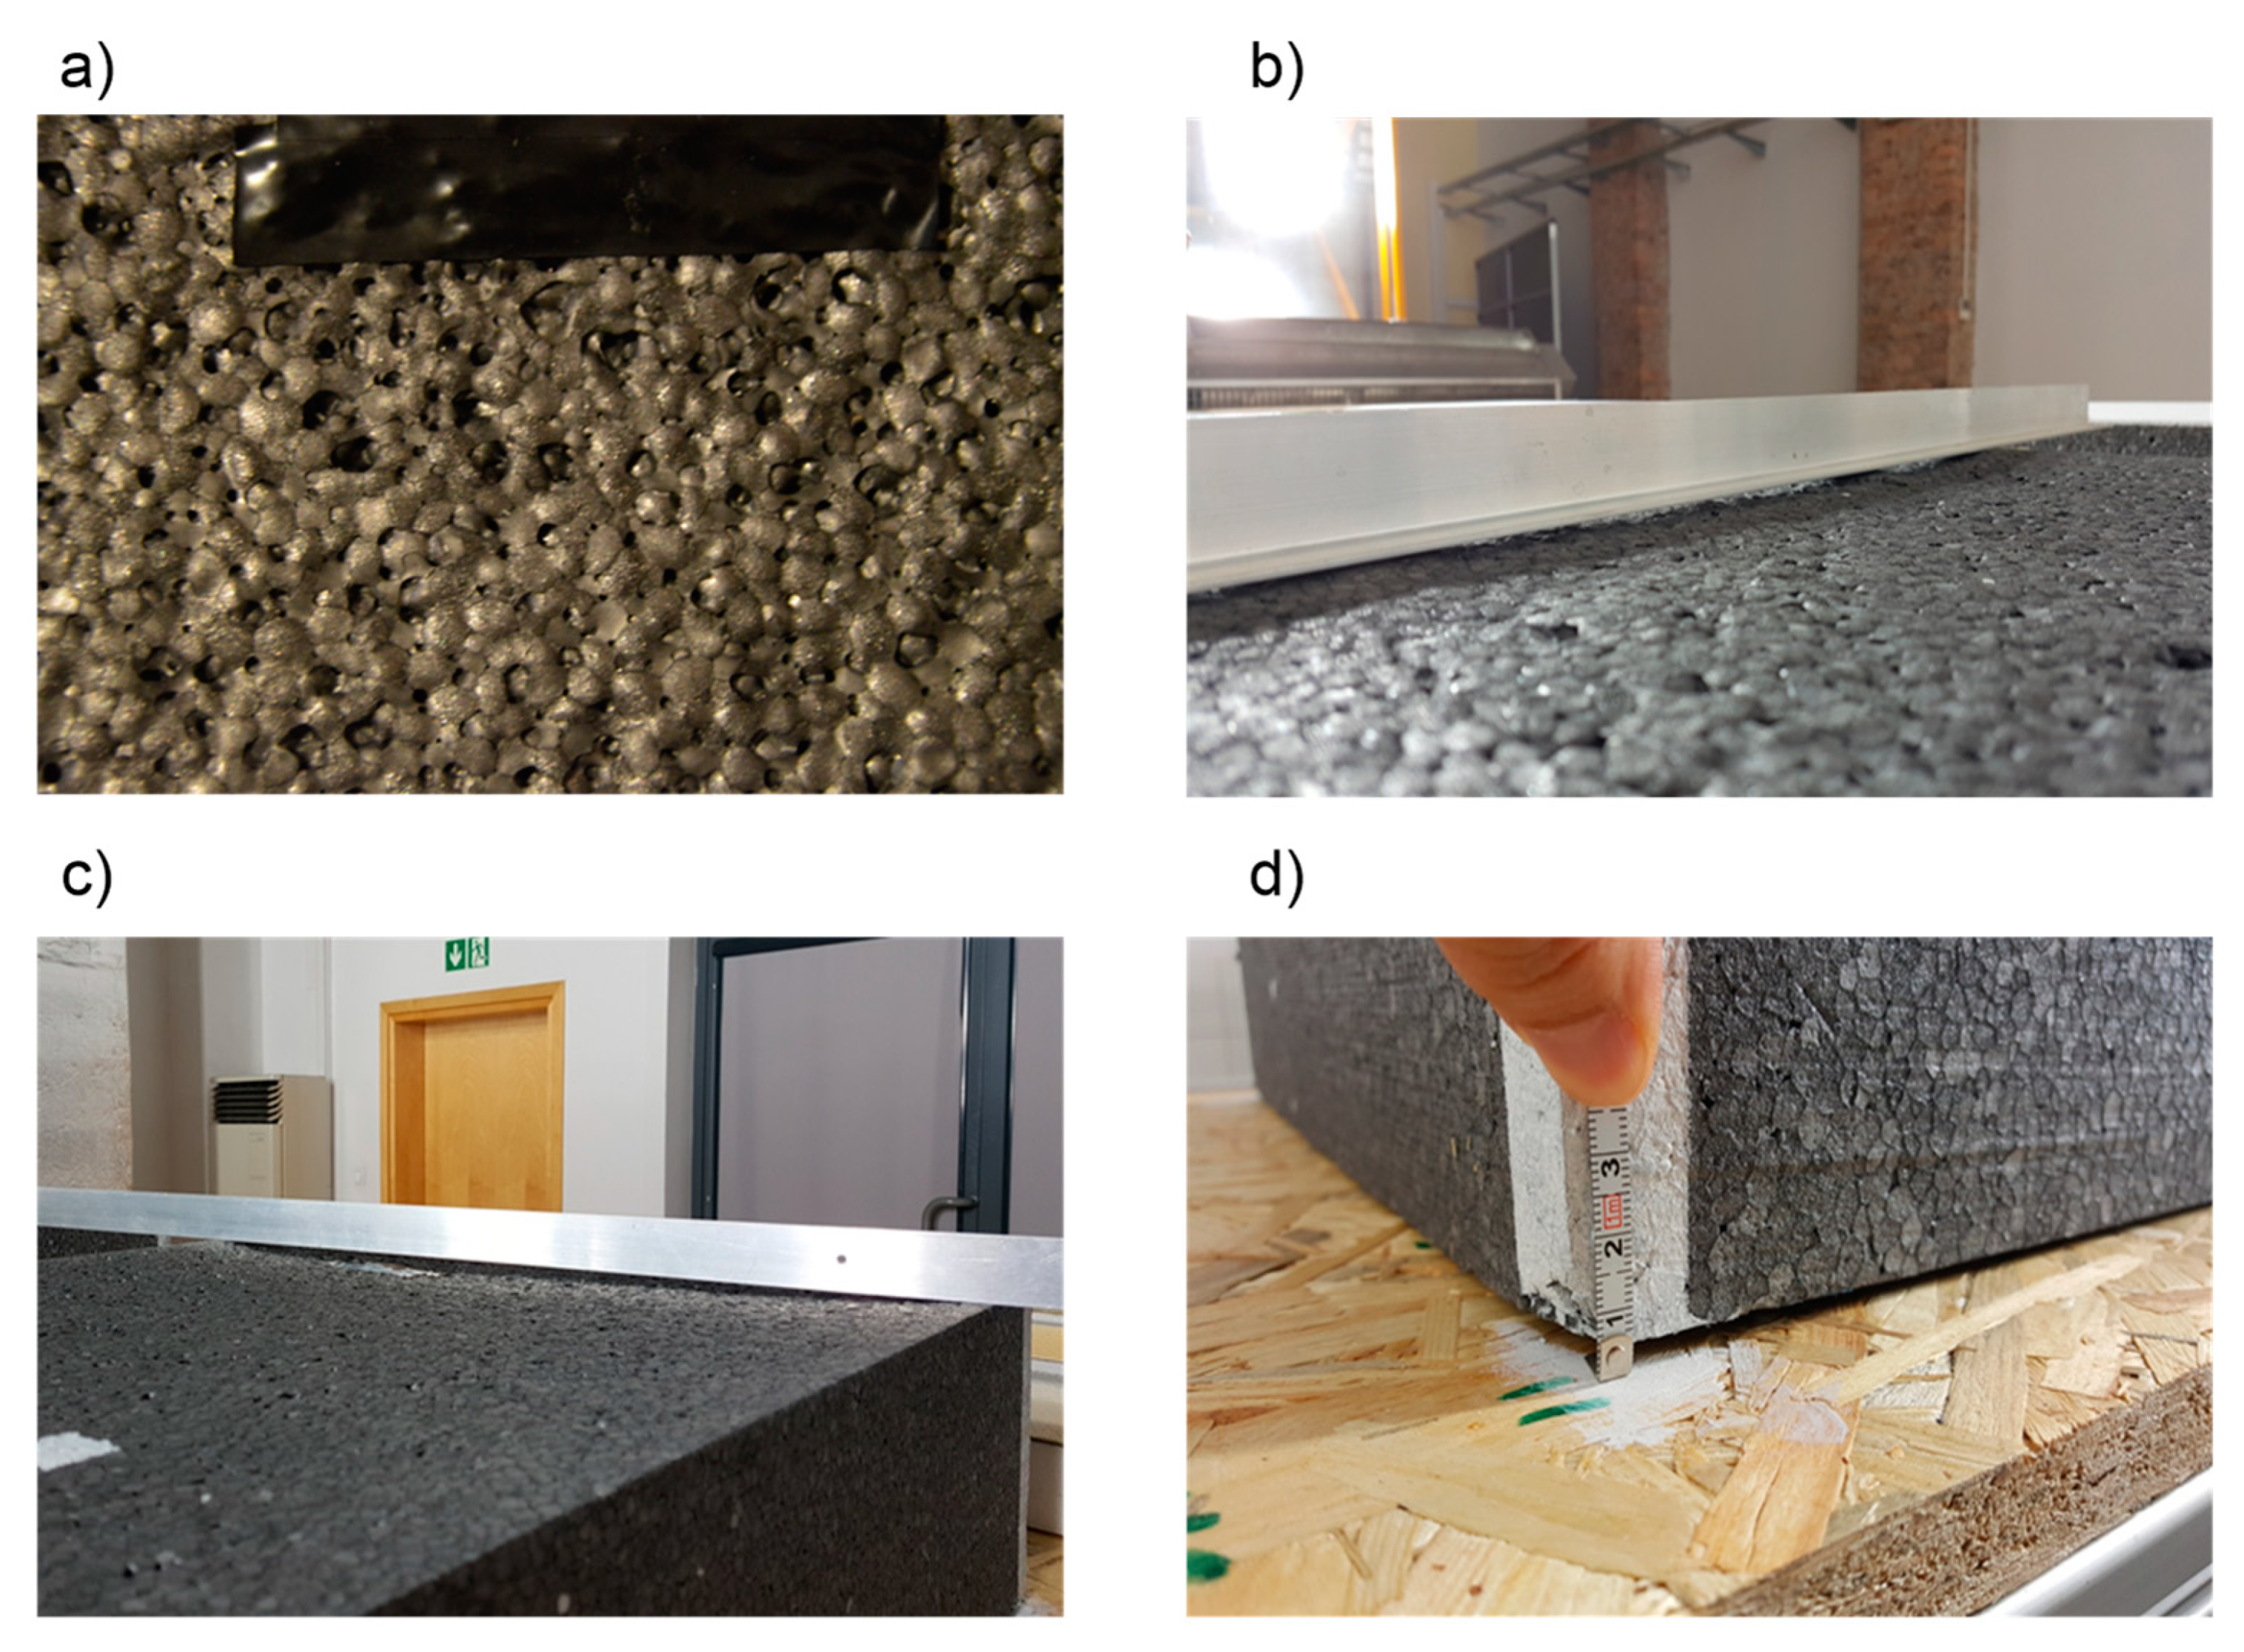
With the uniform insolation of the panels with solar radiation, the temperature readings indicated that panel B exhibited the susceptibility to strong heating. At the place of sensor 3, the maximum recorded temperature was 69.3 °C. Due to that heating susceptibility of panel B, we decided to carry out additional tests involving the impact of temperature on the deformation of polystyrene boards installed on the surface of building envelopes. The boards were mounted to the base surface using only the spot method. Macroscopic examinations of the panel B demonstrated significant deformations in the form of raised edges of the panel and local degradation of the polystyrene surface in the form of softening. In order to illustrate the resulting deformations and damages of panel B, a measuring staff was applied to it, and the measurements were carried out with the use of a steel tape and a folding measure, as presented in Figure 16.
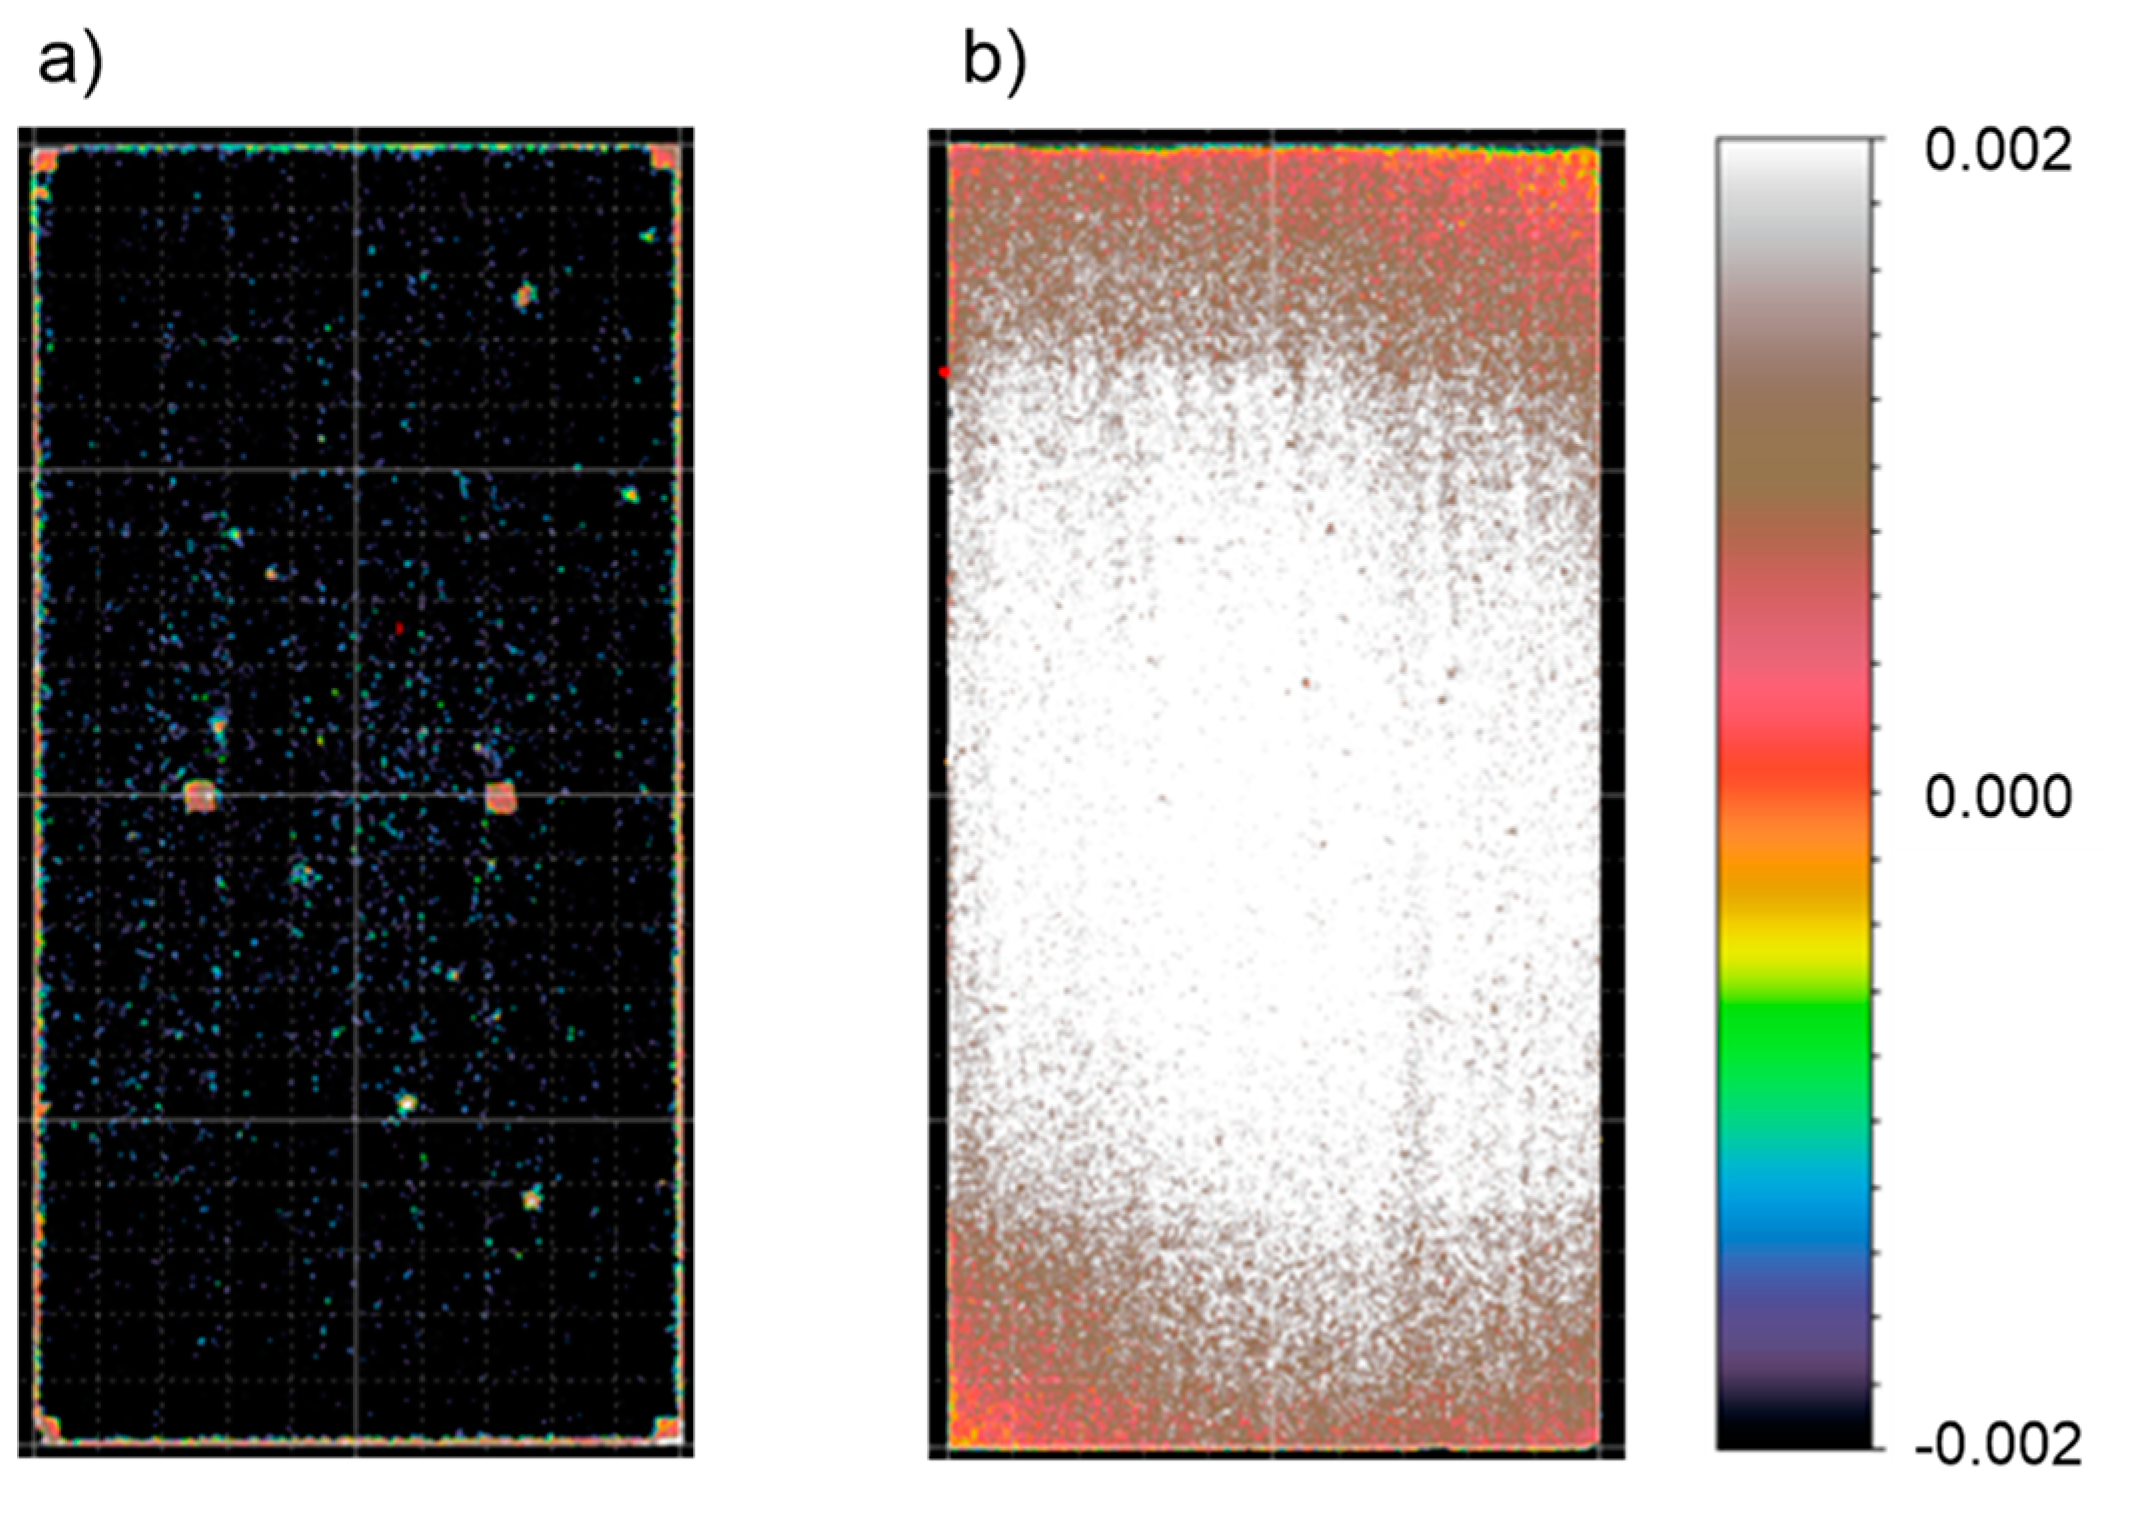
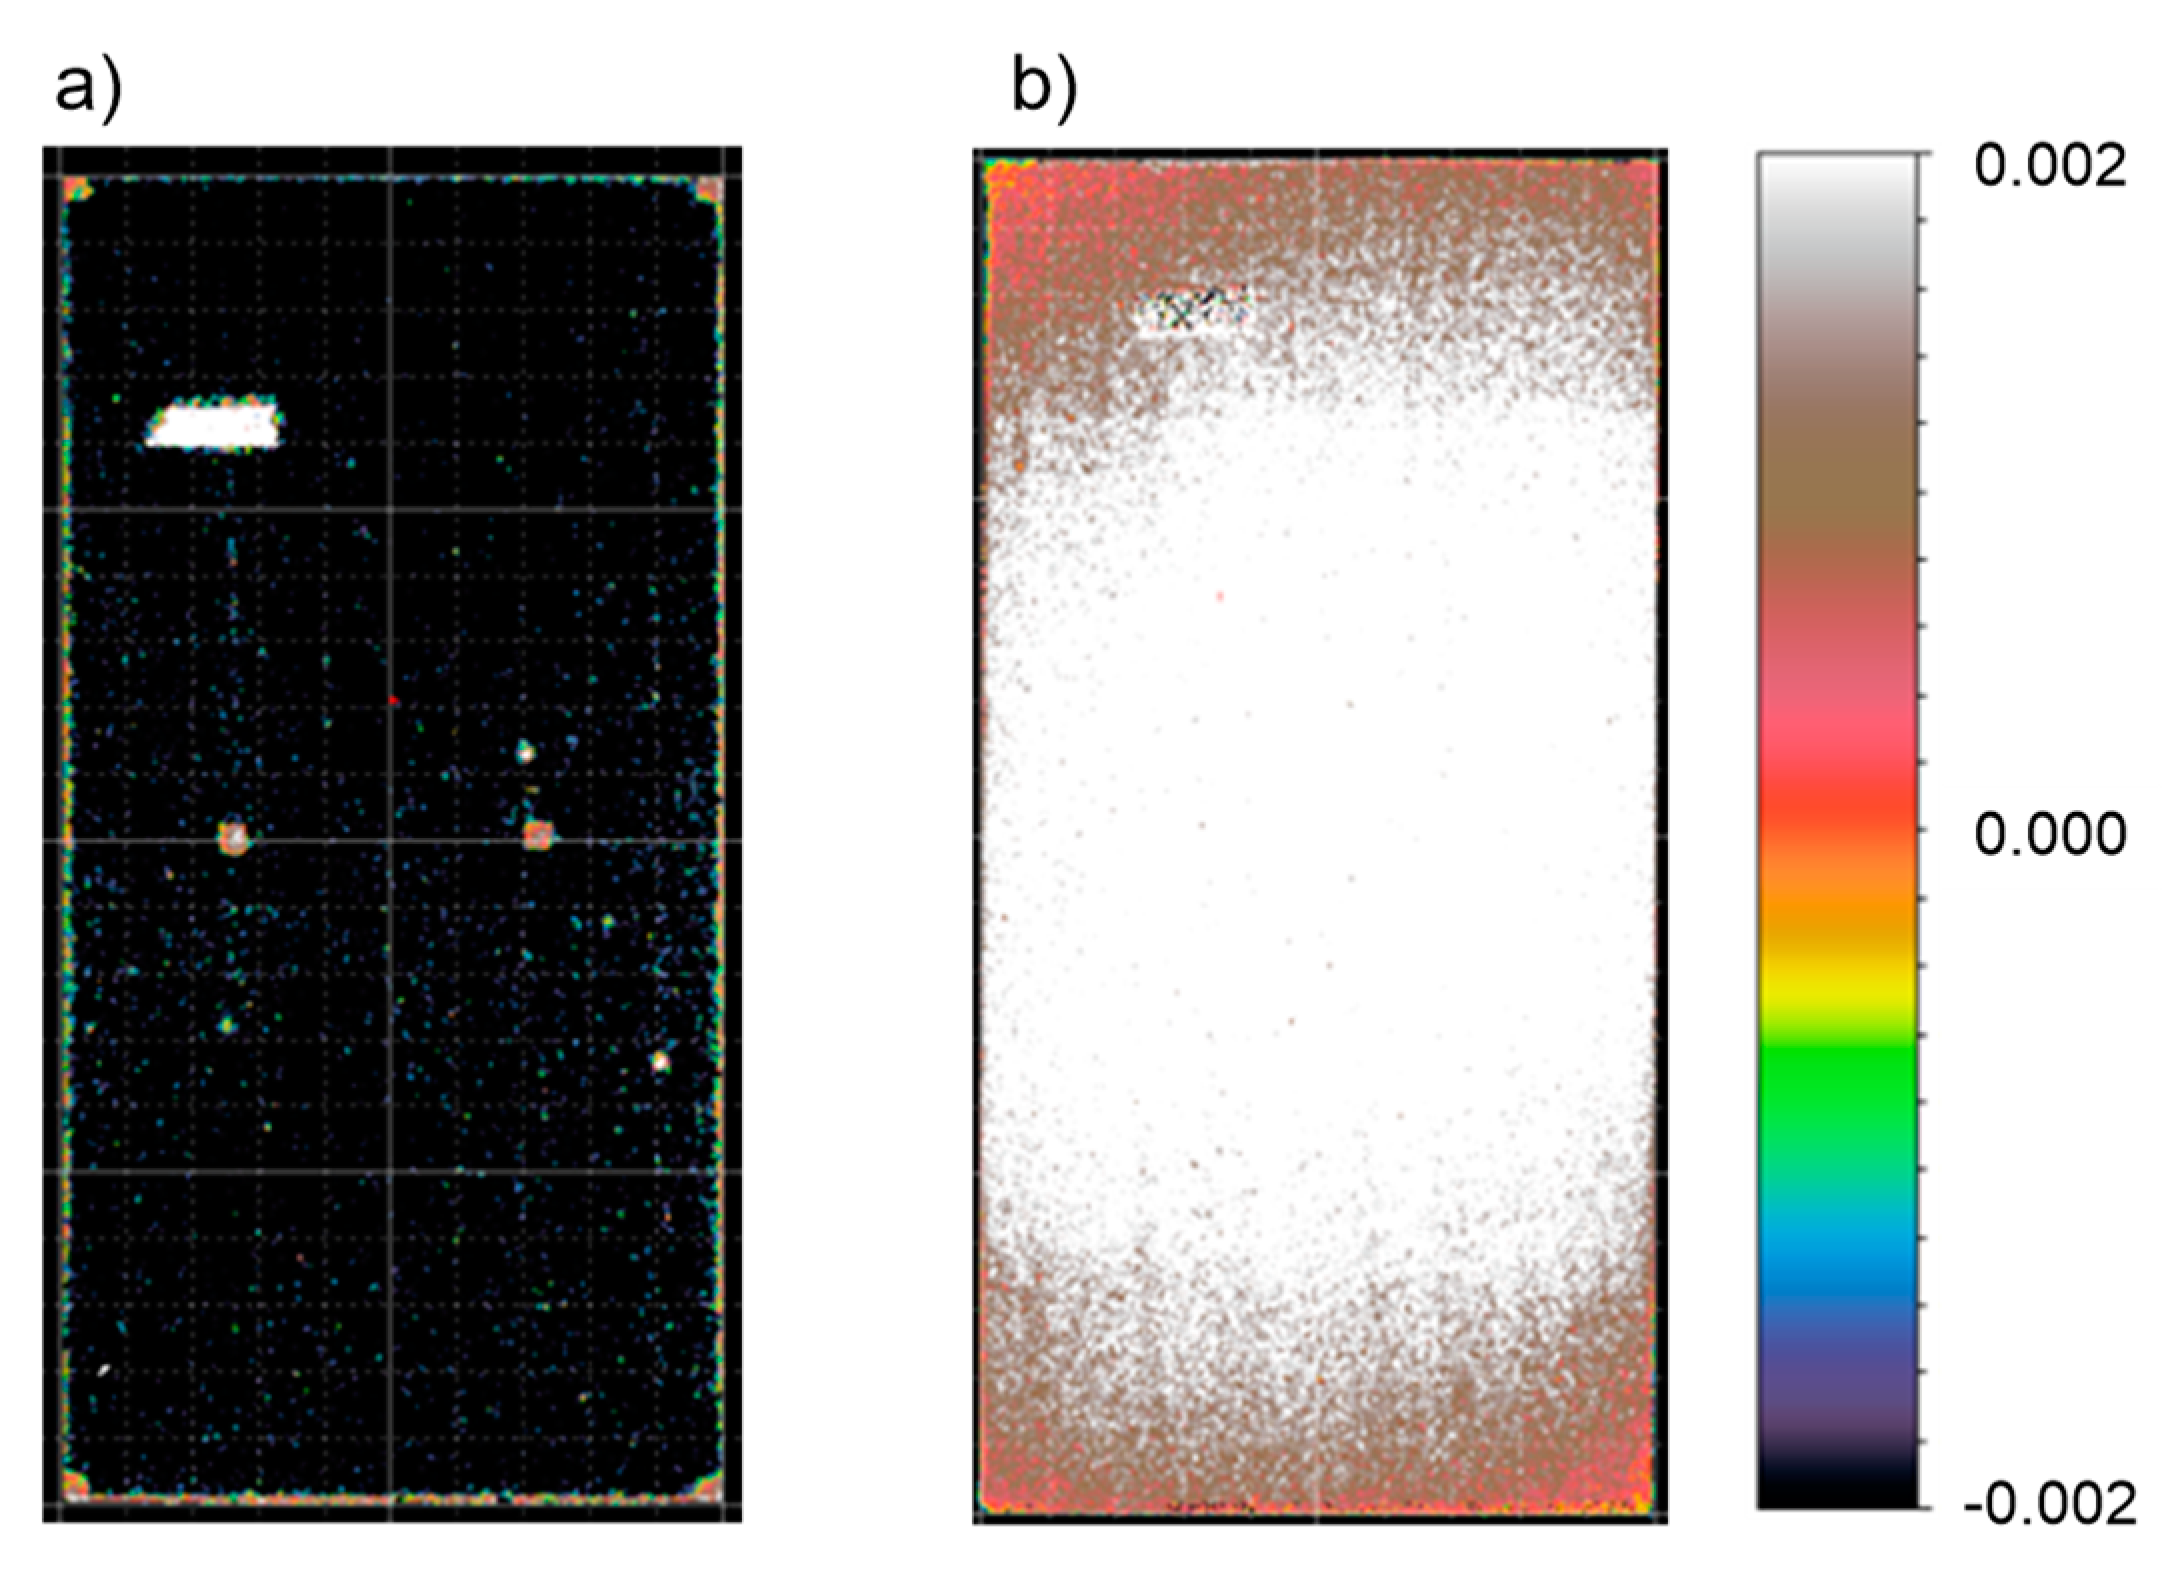
The deformations of the panels were confirmed by the measurements using a 3D scanner. The results are presented in Figure 17 and Figure 18.
In the case of C panels, we are faced with point deformations of the tested surfaces. We can presume that these deformations result from the occurrence of trace inclusions of gray polystyrene granules in the structure of polystyrene C. In the B-type panels (gray polystyrene) due to the impact of solar radiation, deformations of entire surfaces of the tested panels were identified.
4. Conclusions
Temperature measurements carried out using different methods demonstrated a different impact of solar radiation intensity on unprotected EPS insulation panels in the ETICS system. Panels A and C are characterized by low sensitivity to the changes of solar radiation intensity as adopted in the study. Panel B, entirely made of polystyrene with the addition of graphite, demonstrated high sensitivity to external factors such as insolation and wind. The temperatures measured on the surface of the panels with the addition of graphite for the intensity of 950 W/m2 are similar to the softening point of polystyrene declared by the manufacturer. In the case of radiation intensity of 1000 W/m2 and windless conditions, the softening temperature is exceeded, and destruction of material is taking place in the form of melting traces and deformation of the panels. The conducted research has demonstrated that there is a significant impact of wind influence on lowering the temperature of the polystyrene surface, even by 20 °C for the wind speed of 5 m/s. It should also be noted that the extent and nature of temperature changes on the external surface of the panels depends on the area of impact and exposure time, while the extent of deformations is additionally dependent on the method used to fix the panels to the ground. Thus, adverse environmental conditions, such as windless conditions and strong insolation, foster destructive processes, causing geometrical changes and deformations of elements made of B-panels. By using a composite panel (A-panel), many adverse effects of environmental conditions are avoided compared to B-panels. Further studies should be addressed to determining the environmental conditions ensuring safe realization of thermal insulation works in the ETICS system using B-panels.
Author Contributions
A.N. wrote the article, P.K. methodology, writing-original draft preparation and checked the manuscript and carried out the revision. All authors have read and agreed to the published version of the manuscript.
Funding
Publication supported is a part of the postdoctoral habilitation grant. Silesian University of Technology, no. 03/030/RGH18/0077.
Conflicts of Interest
The authors declare no conflict of interest.
References
- Berardi, U. A cross-country comparison of the building Energy consumptions and their trends. Resour. Conserv. Recycl. 2017, 123, 230–241. [Google Scholar] [CrossRef]
- Caniato, M.; Gasparella, A. Discriminating people’s attitude towards building physical features in sustainable and conventional buildings. Energies 2019, 12, 1429. [Google Scholar] [CrossRef] [Green Version]
- Cai, S.; Zhang, B.; Cremaschi, L. Review of moisture behavior and thermal performance of polystyrene insulation in building applications. Build. Environ. 2017, 123, 50–65. [Google Scholar] [CrossRef]
- Ciulla, G.; Galatioto, A.; Ricciu, R. Energy and economic analysis and feasibility of retrofit actions in Italian residential historical buildings. Energy Build. 2016, 128, 649–659. [Google Scholar] [CrossRef]
- Orlik-Kożdoń, B.; Nowoświat, A. Modelling and testing of a granular insulating material. J. Build. Phys. 2018, 42, 6–15. [Google Scholar] [CrossRef]
- Hansen, T.K.; Bjarløv, S.P.; Peuhkuri, R. The effects of wind-driven rain on the hygrothermal conditions behind wooden beam ends and at the interfaces between internal insulation and existing solid masonry. Energy Build. 2019, 196, 255–268. [Google Scholar] [CrossRef]
- Manzan, M.; De Zorzi, E.Z.; Lorenzi, W. Numerical simulation and sensitivity analysis of a steel framed internal insulation system. Energy Build. 2018, 158, 1703–1710. [Google Scholar] [CrossRef] [Green Version]
- Orlik-Kożdoń, B.; Steidl, T. Impact of internal insulation on the hygrothermal performance of brick wall. J. Build. Phys. 2017, 41, 120–134. [Google Scholar] [CrossRef]
- Nowoświat, A.; Pokorska-Silva, I. The influence of thermal mass on the cooling off process of buildings. Period. Polytech. Civ. Eng. 2018, 62, 173–179. [Google Scholar] [CrossRef] [Green Version]
- Krause, P. The numeric calculation of selected thermal bridges in the walls of AAC. Cement Wapno Beton 2017, 22, 371–380. [Google Scholar]
- Pokorska-Silva, I.; Nowoświat, A.; Fedorowicz, L. Identification of thermal parameters of a building envelope based on the cooling process of a building object. J. Build. Phys. 2019. in Press. [Google Scholar] [CrossRef]
- Khoukhi, M. The combined effect of heat and moisture transfer dependent thermal conductivity of polystyrene insulation material: Impact on building Energy performance. Energy Build. 2018, 169, 228–235. [Google Scholar] [CrossRef]
- Havinga, L.; Schellen, H. The impact of convective vapour transport on the hygrothermal risk of the internal insulation of post-war lightweight prefab housing. Energy Build. 2019, 204, 109418. [Google Scholar] [CrossRef]
- Budaiwi, I.; Abdou, A. Effect of thermal conductivity change of moist fibrous insulation on Energy performance of buildings under hot-humid conditions. Energy Build. 2013, 60, 388–399. [Google Scholar] [CrossRef]
- Kontoleon, K.J.; Giarma, G. Dynamic thermal response of building material layers in aspect of their moisture content. Appl. Energy 2016, 170, 76–91. [Google Scholar] [CrossRef]
- Orlik-Kozdoń, B.; Nowoswiat, A.; Krause, P.; Ponikiewski, T. A numerical and experimental investigation of temperature field in place of anchors in ETICS System. Constr. Build. Mater. 2018, 167, 553–565. [Google Scholar] [CrossRef]
- Nowoświat, A.; Skrzypczyk, J.; Krause, P.; Steidl, T.; Winkler-Skalna, A. Estimation of thermal transmittance based on temperature measurements with the application of perturbation numbers. Heat Mass Transf. 2018, 54, 1477–1489. [Google Scholar] [CrossRef] [Green Version]
- Dissanayake, D.M.K.W.; Jayasinghe, C.; Jayasinghe, M.T.R. A comparative embodied Energy analysis of a house with recycled expanded polystyrene (EPS) based foam concrete wall panels. Energy Build. 2017, 135, 85–94. [Google Scholar] [CrossRef]
- Firlag, S.; Piasecki, M. NZEB renovation definition in a heating dominated climate: Case study of Poland. Appl. Sci. 2018, 8, 1605. [Google Scholar] [CrossRef] [Green Version]
- Lakatos, A.; Deak, I.; Berardi, U. Thermal Characterization of different graphite polystyrene. Int. Rev. Appl. Sci. Eng. 2018, 9, 163–168. [Google Scholar] [CrossRef]
- Ye, R.; Lin, W.; Yuan, K.; Fang, X.; Zhang, Z. Experimental and numerical investigations on the thermal performance of building plane containing CaCl2 6H2O/expanded graphite composite phase material. Appl. Energy 2017, 193, 325–335. [Google Scholar] [CrossRef]
- Faravelli, T.; Pinciroli, M.; Pisano, F.; Bozzano, G.; Dente, M.; Ranzi, E. Thermal degradation of polystyrene. J. Anal. Appl. Pyrolysis 2001, 60, 103–121. [Google Scholar] [CrossRef]
- Kussauer, R.; Ruprecht, M. Die häufigsten Mängel bei Beschichtungen und Wärmedämm-Verbundsystemen: Erkennen, Vermeiden, Beheben; Rudolf Müller: Köln, Germany, 2014. [Google Scholar]
- Mehta, S.; Biederman, S.; Shivkumar, S. Thermal degradation of foamed polystyrene. J. Mater. Sci. 1995, 30, 2944–2949. [Google Scholar] [CrossRef]
- Shu-Kai, Y.; Chien-Hsiung, H.; Kuo-Chung, C.; Tsu-Huang, C.; Weng-Jeng, G.; Sea-Fues, W. Effect of dispersion method and process variables on the properties of supercritical CO2 foamed polystyrene/graphite nanocomposite foam. Polym. Eng. Sci. 2013, 53, 2061–2072. [Google Scholar]
- Tran, M.P.; Gong, P.; Detrembleur, C.; Thomassin, J.M.; Buahom, P.; Saniei, M.; Kenig, S.; Parka, C.B.; Lee, S.E. Reducing Thermal Conductivity of Polymeric Foams with High Volume Expansion Made From Polystyrene/Expanded Graphite. PIERS Online 2016, 4, 1870–1882. [Google Scholar]
- Vlcek, J. A field method for determination of emissivity with imaging radiometers. Photogramm. Eng. Remote Sens. 1982, 48, 609–614. [Google Scholar]
Figure 1.
Test thermogram of white polystyrene board with two measurement points.

Figure 2.
Stand for the in situ tests. (a) stationary stand, (b) mobile stand.

Figure 3.
Outdoor air temperature distribution obtained on the basis of measurements carried out in the period from 12 September 2018 to 22 September 2018.
Figure 3.
Outdoor air temperature distribution obtained on the basis of measurements carried out in the period from 12 September 2018 to 22 September 2018.

Figure 4.
Relative humidity distribution of the outdoor air obtained on the basis of measurements carried out in the period from 12 September 2018 to 22 September 2018.
Figure 4.
Relative humidity distribution of the outdoor air obtained on the basis of measurements carried out in the period from 12 September 2018 to 22 September 2018.

Figure 5.
Distribution of average wind speed obtained on the basis of measurements carried out in the period from 12 September 2018 to 22 September 2018.
Figure 5.
Distribution of average wind speed obtained on the basis of measurements carried out in the period from 12 September 2018 to 22 September 2018.

Figure 6.
Distribution of solar radiation intensity.

Figure 7.
Solar radiation simulator. (a) location of samples in the horizontal plane, (b) location of samples in the vertical plane.
Figure 7.
Solar radiation simulator. (a) location of samples in the horizontal plane, (b) location of samples in the vertical plane.

Figure 8.
Schematic distribution of loggers on the test stand in the laboratory.

Figure 9.
Indoor air temperature of the laboratory recorded by the three loggers.

Figure 10.
Relative humidity of indoor air of the laboratory recorded by the three loggers.

Figure 11.
Temperature measurements made for three polystyrene boards. Average wind speed: 1.6 m/s.

Figure 12.
Distribution of solar radiation intensity on the surface comprising the tested samples. (a) distribution for artificial sun slope of 43.28°—minimum intensity 665 W/m2, maximum 757 W/m2, medium 665 W/m2, (b) distribution for artificial sun slope of 21.0°—minimum intensity 521 W/m2, maximum 1005 W/m2, medium 827 W/m2, (c) distribution for artificial sun slope of 16.28°—minimum intensity 637 W/m2, maximum 1127 W/m2, average 955 W/m2.

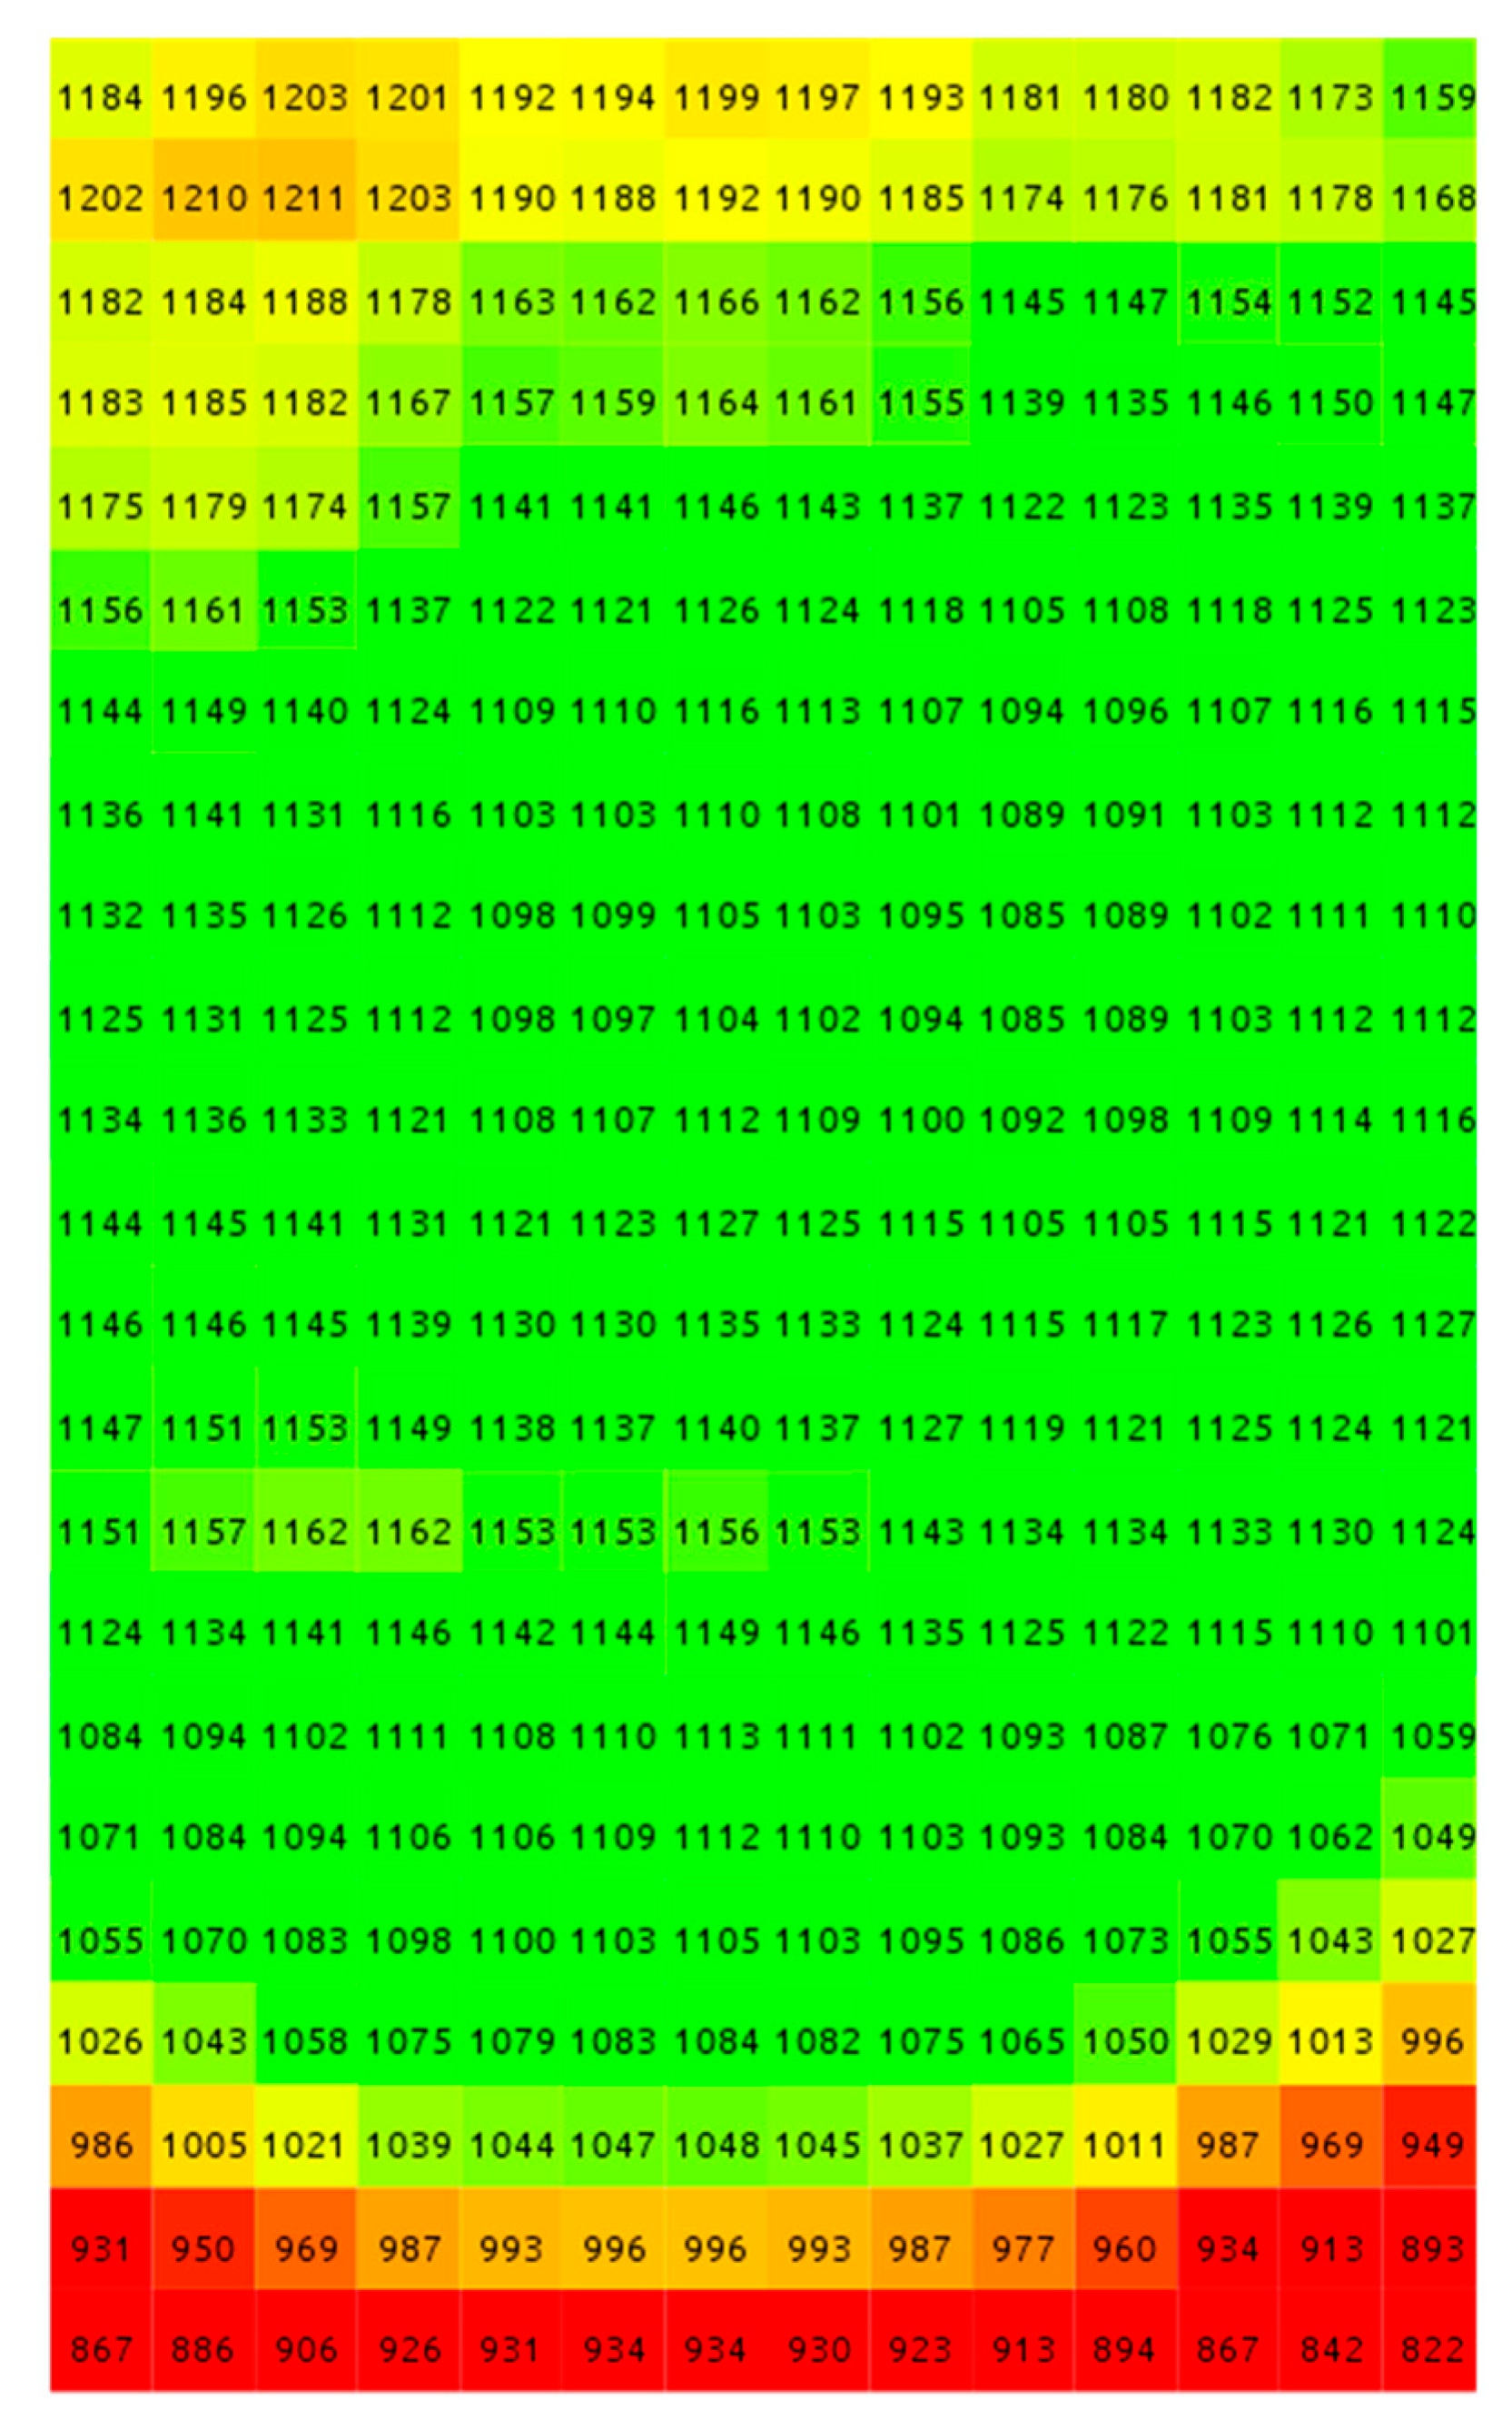
Figure 13.
Distribution of solar radiation intensity on the surface comprising the tested samples. Location of lamps perpendicular to the tested samples. Minimum intensity 822W/m2, maximum 1211 W/m2, medium 1104 W/m2.
Figure 13.
Distribution of solar radiation intensity on the surface comprising the tested samples. Location of lamps perpendicular to the tested samples. Minimum intensity 822W/m2, maximum 1211 W/m2, medium 1104 W/m2.

Figure 14.
Schematic of the arrangement of sensors in the panels as part of temperature measurements in the samples.
Figure 14.
Schematic of the arrangement of sensors in the panels as part of temperature measurements in the samples.

Figure 15.
Graph of temperature values on the time axis obtained from the measurements.

Figure 16.
Damage to panels B. (a) loss of polystyrene granules in effect of exceeding the softening temperature, (b) and (c) deformation of the panel due to the exposure to artificial sun, (d) panel edge raised away from the ground.
Figure 16.
Damage to panels B. (a) loss of polystyrene granules in effect of exceeding the softening temperature, (b) and (c) deformation of the panel due to the exposure to artificial sun, (d) panel edge raised away from the ground.

Figure 17.
Deformation map of spot-glued panels obtained from 3D scanner readings. (a) C-type panel, (b) B-type panel.
Figure 17.
Deformation map of spot-glued panels obtained from 3D scanner readings. (a) C-type panel, (b) B-type panel.

Figure 18.
Deformation map of spot-glued panels obtained from 3D scanner readings, (a) C-type panel, (b) B-type panel.
Figure 18.
Deformation map of spot-glued panels obtained from 3D scanner readings, (a) C-type panel, (b) B-type panel.


Table 1.
Temperatures read in the measuring fields of the thermogram made for the stationary stand. The thermograms were obtained in weather conditions close to windless conditions, with a low average wind speed of up to 1.6 m/s. The maximum recorded values of solar radiation intensity were within the range of 716.7 W/m2–738.4 W/m2.
| Panel Type | TMAX (°C) | TMIN (°C) | TAVR (°C) |
|---|---|---|---|
| Panel B | 77.4 | 59.9 | 72.5 |
| Panel A | 39.7 | 33.0 | 34.2 |
| Panel C | 34.8 | 29.0 | 29.8 |
Table 2.
Temperatures read in the measurement fields of the thermogram made for the mobile stand. The thermograms were obtained in weather conditions close to windless conditions, with a low average wind speed of up to 1.6 m/s. The maximum recorded values of solar radiation intensity were within the range of 716.7 W/m2–738.4 W/m2.
| Panel Type | TMAX (°C) | TMIN (°C) | TAVR (°C) |
|---|---|---|---|
| Panel B | 68.7 | 56.6 | 63.6 |
| Panel A | 36.7 | 29.6 | 30.7 |
| Panel C | 33.6 | 27.2 | 27.9 |
Table 3.
Temperatures as a function of the changes in solar radiation intensity read in the measurement fields of the thermogram made for the laboratory stand (Wind speed v = 0 m/s).
Table 3.
Temperatures as a function of the changes in solar radiation intensity read in the measurement fields of the thermogram made for the laboratory stand (Wind speed v = 0 m/s).
| Panel Type | TMAX (°C) | TMIN (°C) | TAVR (°C) |
|---|---|---|---|
| Intensity ls = 640 W/m2 | |||
| Panel B | 71.7 | 59.2 | 67.2 |
| Panel C | 31.0 | 26.4 | 27.0 |
| Intensity ls = 950 W/m2 | |||
| Panel B | 84.4 | 67.0 | 80.2 |
| Panel C | 32.0 | 26.1 | 26.8 |
| Intensity ls = 1008 W/m2 | |||
| Panel B | 93.4 | 74.6 | 89.0 |
| Panel C | 36.4 | 29.7 | 30.4 |
Table 4.
Temperatures as the function of wind speed changes read in the measurement fields of the thermogram made for the laboratory stand. Radiation intensity ls = 1008 W/m2.
Table 4.
Temperatures as the function of wind speed changes read in the measurement fields of the thermogram made for the laboratory stand. Radiation intensity ls = 1008 W/m2.
| Panel Type | TMAX (°C) | TMIN (°C) | TAVR (°C) |
|---|---|---|---|
| Wind speed v = 1 m/s | |||
| Panel B | 93.2 | 74.9 | 88.6 |
| Panel C | 35.4 | 29.9 | 30.4 |
| Wind speed v = 3 m/s | |||
| Panel B | 81.4 | 61.0 | 75.8 |
| Panel C | 33.6 | 29.4 | 29.8 |
| Wind speed v = 5 m/s | |||
| Panel B | 71.0 | 54.3 | 66.3 |
| Panel C | 32.5 | 29.6 | 29.9 |
Table 5.
Temperatures for the second series of tests.
| Panel Type | TMAX (°C) | TMIN (°C) | TAVR (°C) |
|---|---|---|---|
| Panel B | 101.9 | 72.7 | 91.6 |
| Panel C | 44.8 | 35.8 | 37.0 |
© 2019 by the authors. Licensee MDPI, Basel, Switzerland. This article is an open access article distributed under the terms and conditions of the Creative Commons Attribution (CC BY) license (http://creativecommons.org/licenses/by/4.0/).
Share and Cite
MDPI and ACS Style
Krause, P.; Nowoświat, A. Experimental Studies Involving the Impact of Solar Radiation on the Properties of Expanded Graphite Polystyrene. Energies 2020, 13, 75. https://0-doi-org.brum.beds.ac.uk/10.3390/en13010075
AMA Style
Krause P, Nowoświat A. Experimental Studies Involving the Impact of Solar Radiation on the Properties of Expanded Graphite Polystyrene. Energies. 2020; 13(1):75. https://0-doi-org.brum.beds.ac.uk/10.3390/en13010075
Chicago/Turabian StyleKrause, Paweł, and Artur Nowoświat. 2020. "Experimental Studies Involving the Impact of Solar Radiation on the Properties of Expanded Graphite Polystyrene" Energies 13, no. 1: 75. https://0-doi-org.brum.beds.ac.uk/10.3390/en13010075
Note that from the first issue of 2016, this journal uses article numbers instead of page numbers. See further details here.