1. Introduction
The issue of global warming and climate change has been known for a long time. Now that we experience the first consequences resulting from the pollution and high greenhouse gas emissions of the past, the subject is widely recognized, not only by scientists, but also by governments and industry all over the world, and by the general public. This recognition led to the integration of sustainable energy usage and reduced energy consumption into the sustainable development goals (SDGs), which were adopted by all UN member states in 2015 and are a call by all countries to promote prosperity while protecting the environment [
1]. Here, the member states set goals to be achieved by 2030 to build a better future by ending poverty, building economic growth and addressing a range of social needs, including education, health, equality and job opportunities, while tackling climate change and working to preserve our oceans and forests. SDG 7 focuses on ensuring access to affordable, reliable, sustainable and modern energy, with one of the goals being ‘doubling the rate of improvement in energy efficiency by 2030′. Additionally, ever-growing extreme climate conditions and an increased number of weather-related natural disasters also lead to public protests, like the Fridays for Future movement. This shows us not only that we have to intensify our effort to reduce emissions and counteract climate change and global warming, but also that the current political and societal situation is well-suited for implementing climate friendly solutions and developing new technologies for a climate neutral society.
To reach the targets set by SDG 7 and counteract climate change, we not only have to increase the use of renewable energy sources, but we also need to reduce our total energy consumption. The total energy consumption can be divided into three major economic sectors: buildings, transportation and industry. Amongst those, the building sector contributes about one third of total energy consumption and CO
2 emission, with more than 50% of this energy being used for Heating, Ventilation and Air-Conditioning (HVAC) systems [
2]. This means that about one fifth of the total energy consumption worldwide results from the use of HVAC systems in buildings, and this percentage is predicted to grow even further in the future. A large part of this energy consumption results from heat loss through windows in cold conditions, or from cooling due to solar heat gain through windows. Therefore, windows account for more than 30% of the total energy consumption in buildings [
3]. To improve the energy efficiency of windows and reduce the energy consumption of buildings, there are already several different energy-efficient glazing systems on the market. Nevertheless, the European building stock is still mostly equipped with dated, inefficient glazing. A recent study, commissioned by Glass for Europe, analyzing the energy and CO
2 emission savings potential, has shown that by equipping all buildings in Europe with energy-efficient glazing, the total energy consumption of the building sector can be reduced by over 30% for most countries in Europe. That means if this transition were completed in the whole European Union, by 2030 annual energy saving of 75.5 Mt oil equivalents (with 1 kt of oil equivalent equals 11.6 GWh) and annual emission reduction of 94.5 Mt CO
2 would be achieved [
4]. This shows the huge energy savings and emission reduction potential of not only the introduction of already available energy-efficient glazing systems, but also of the development of new materials and technologies already outperforming the commercial ones.
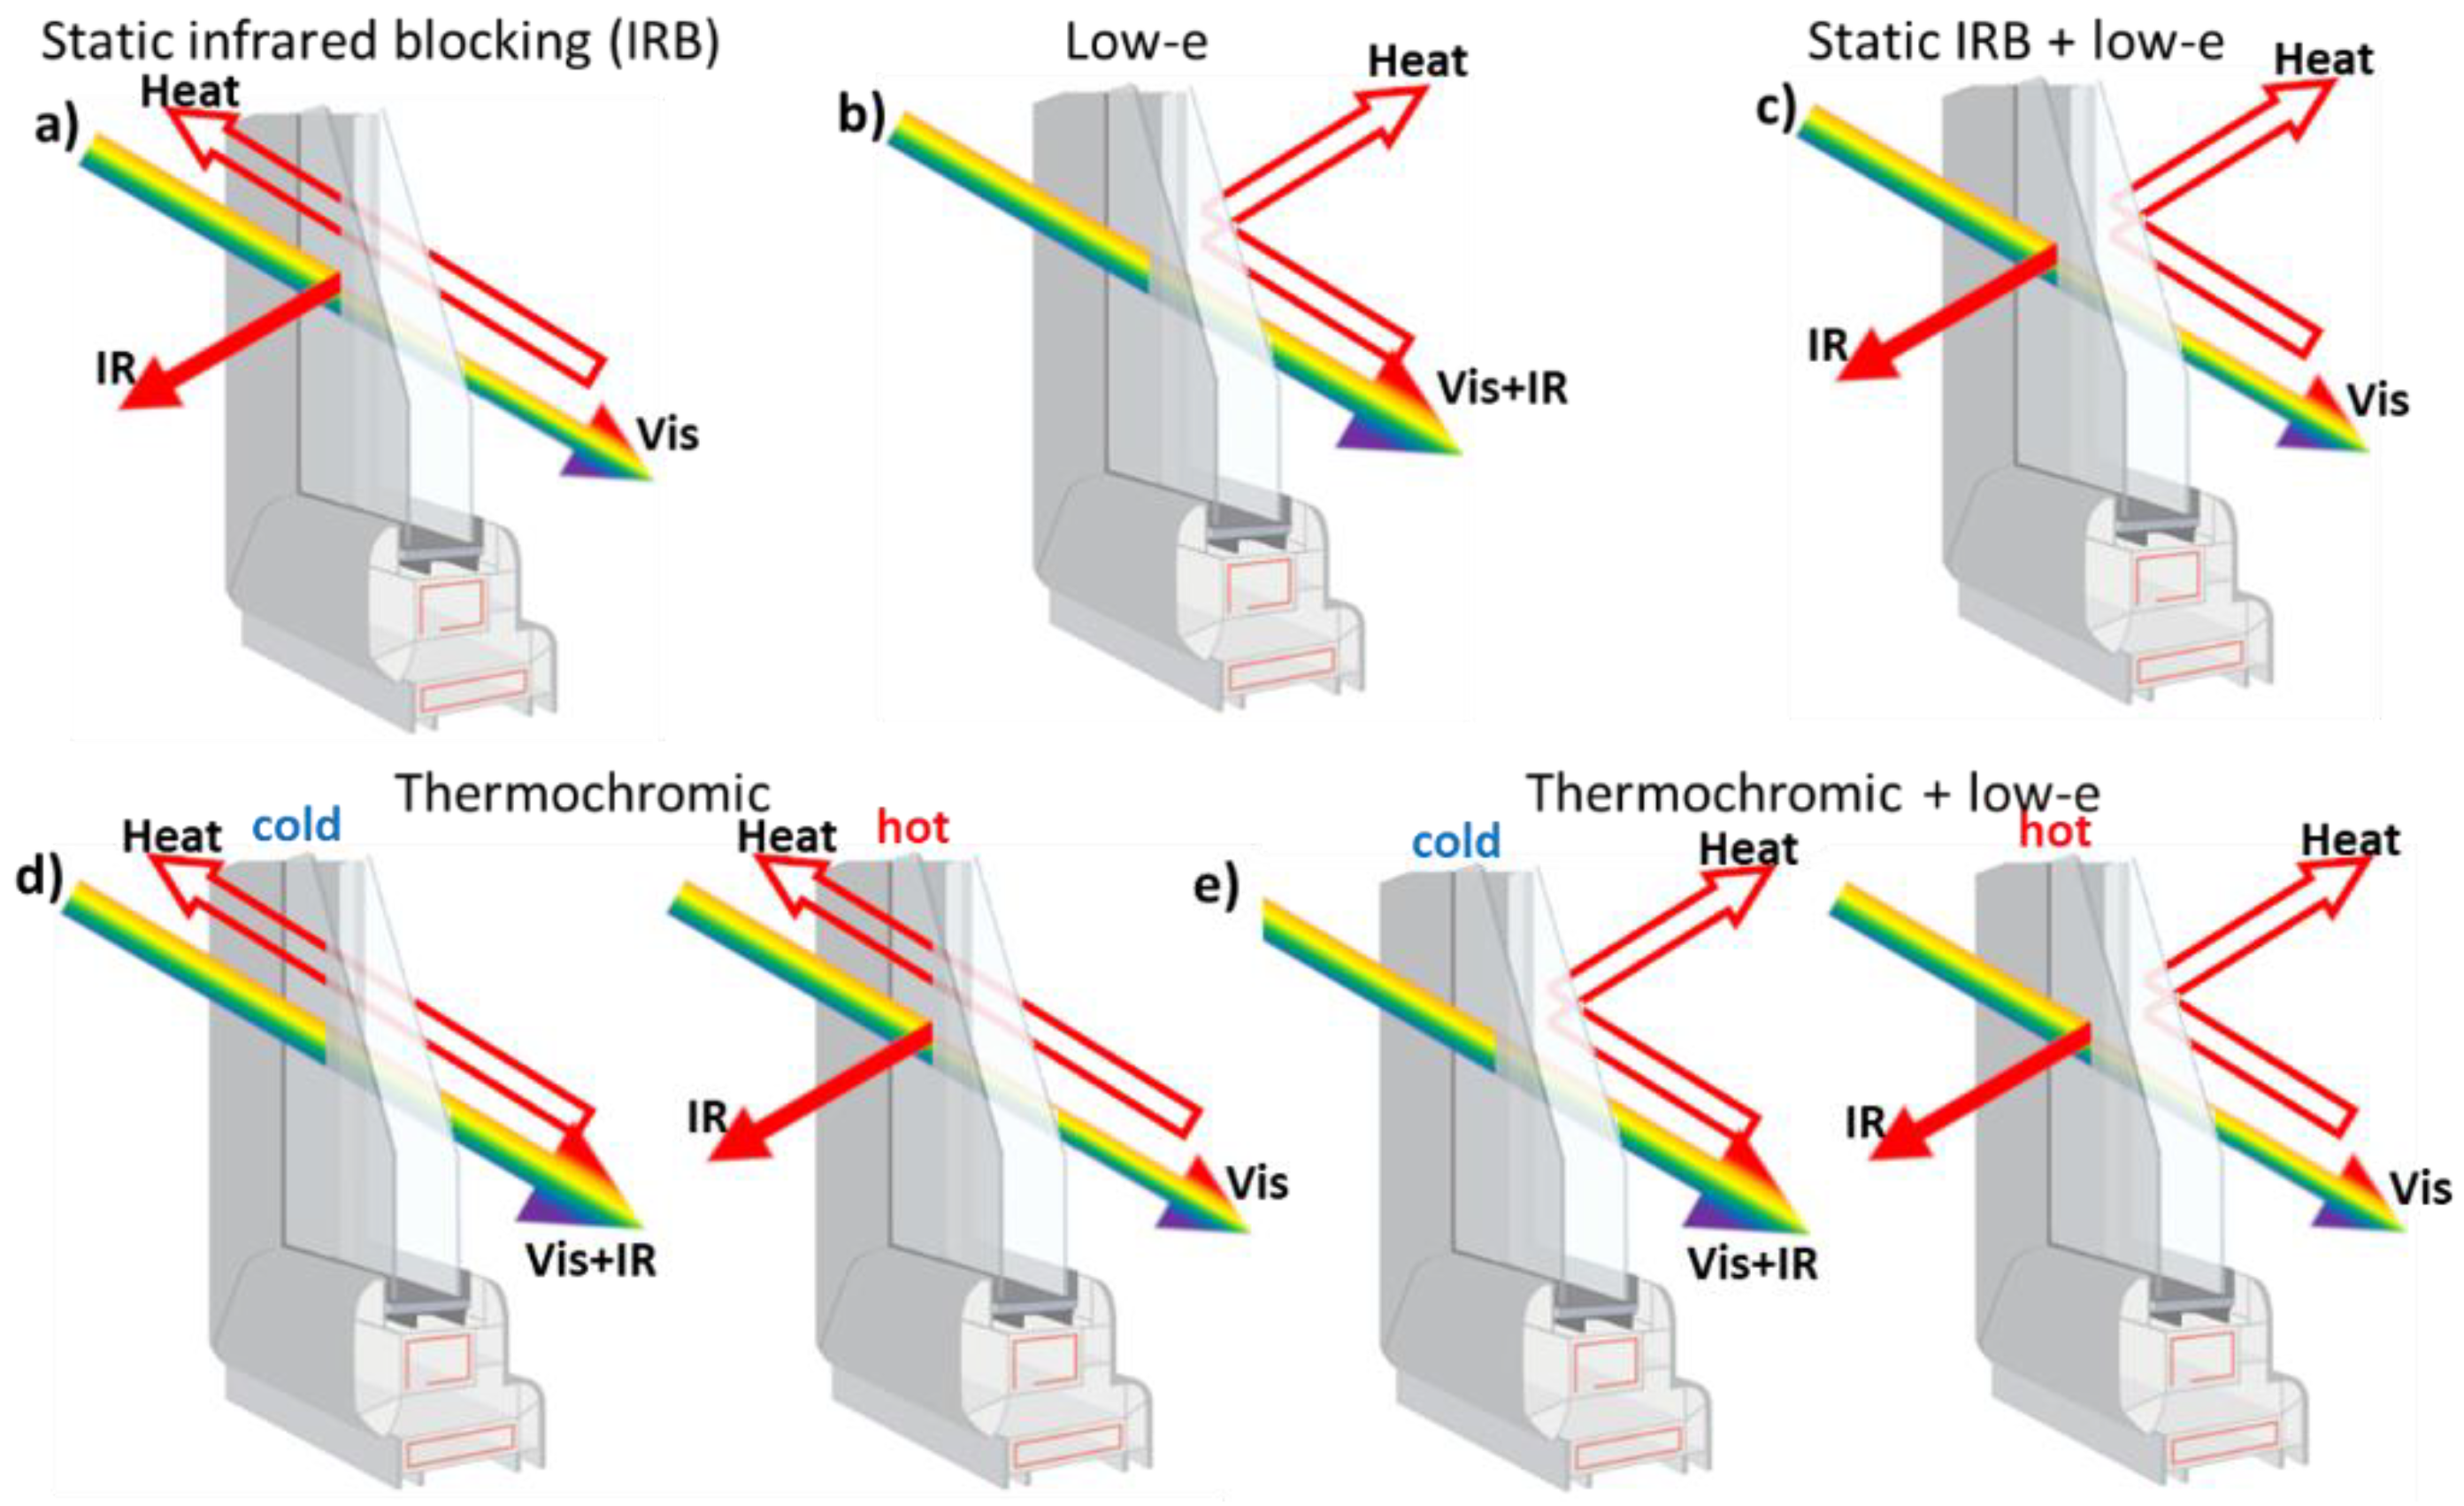
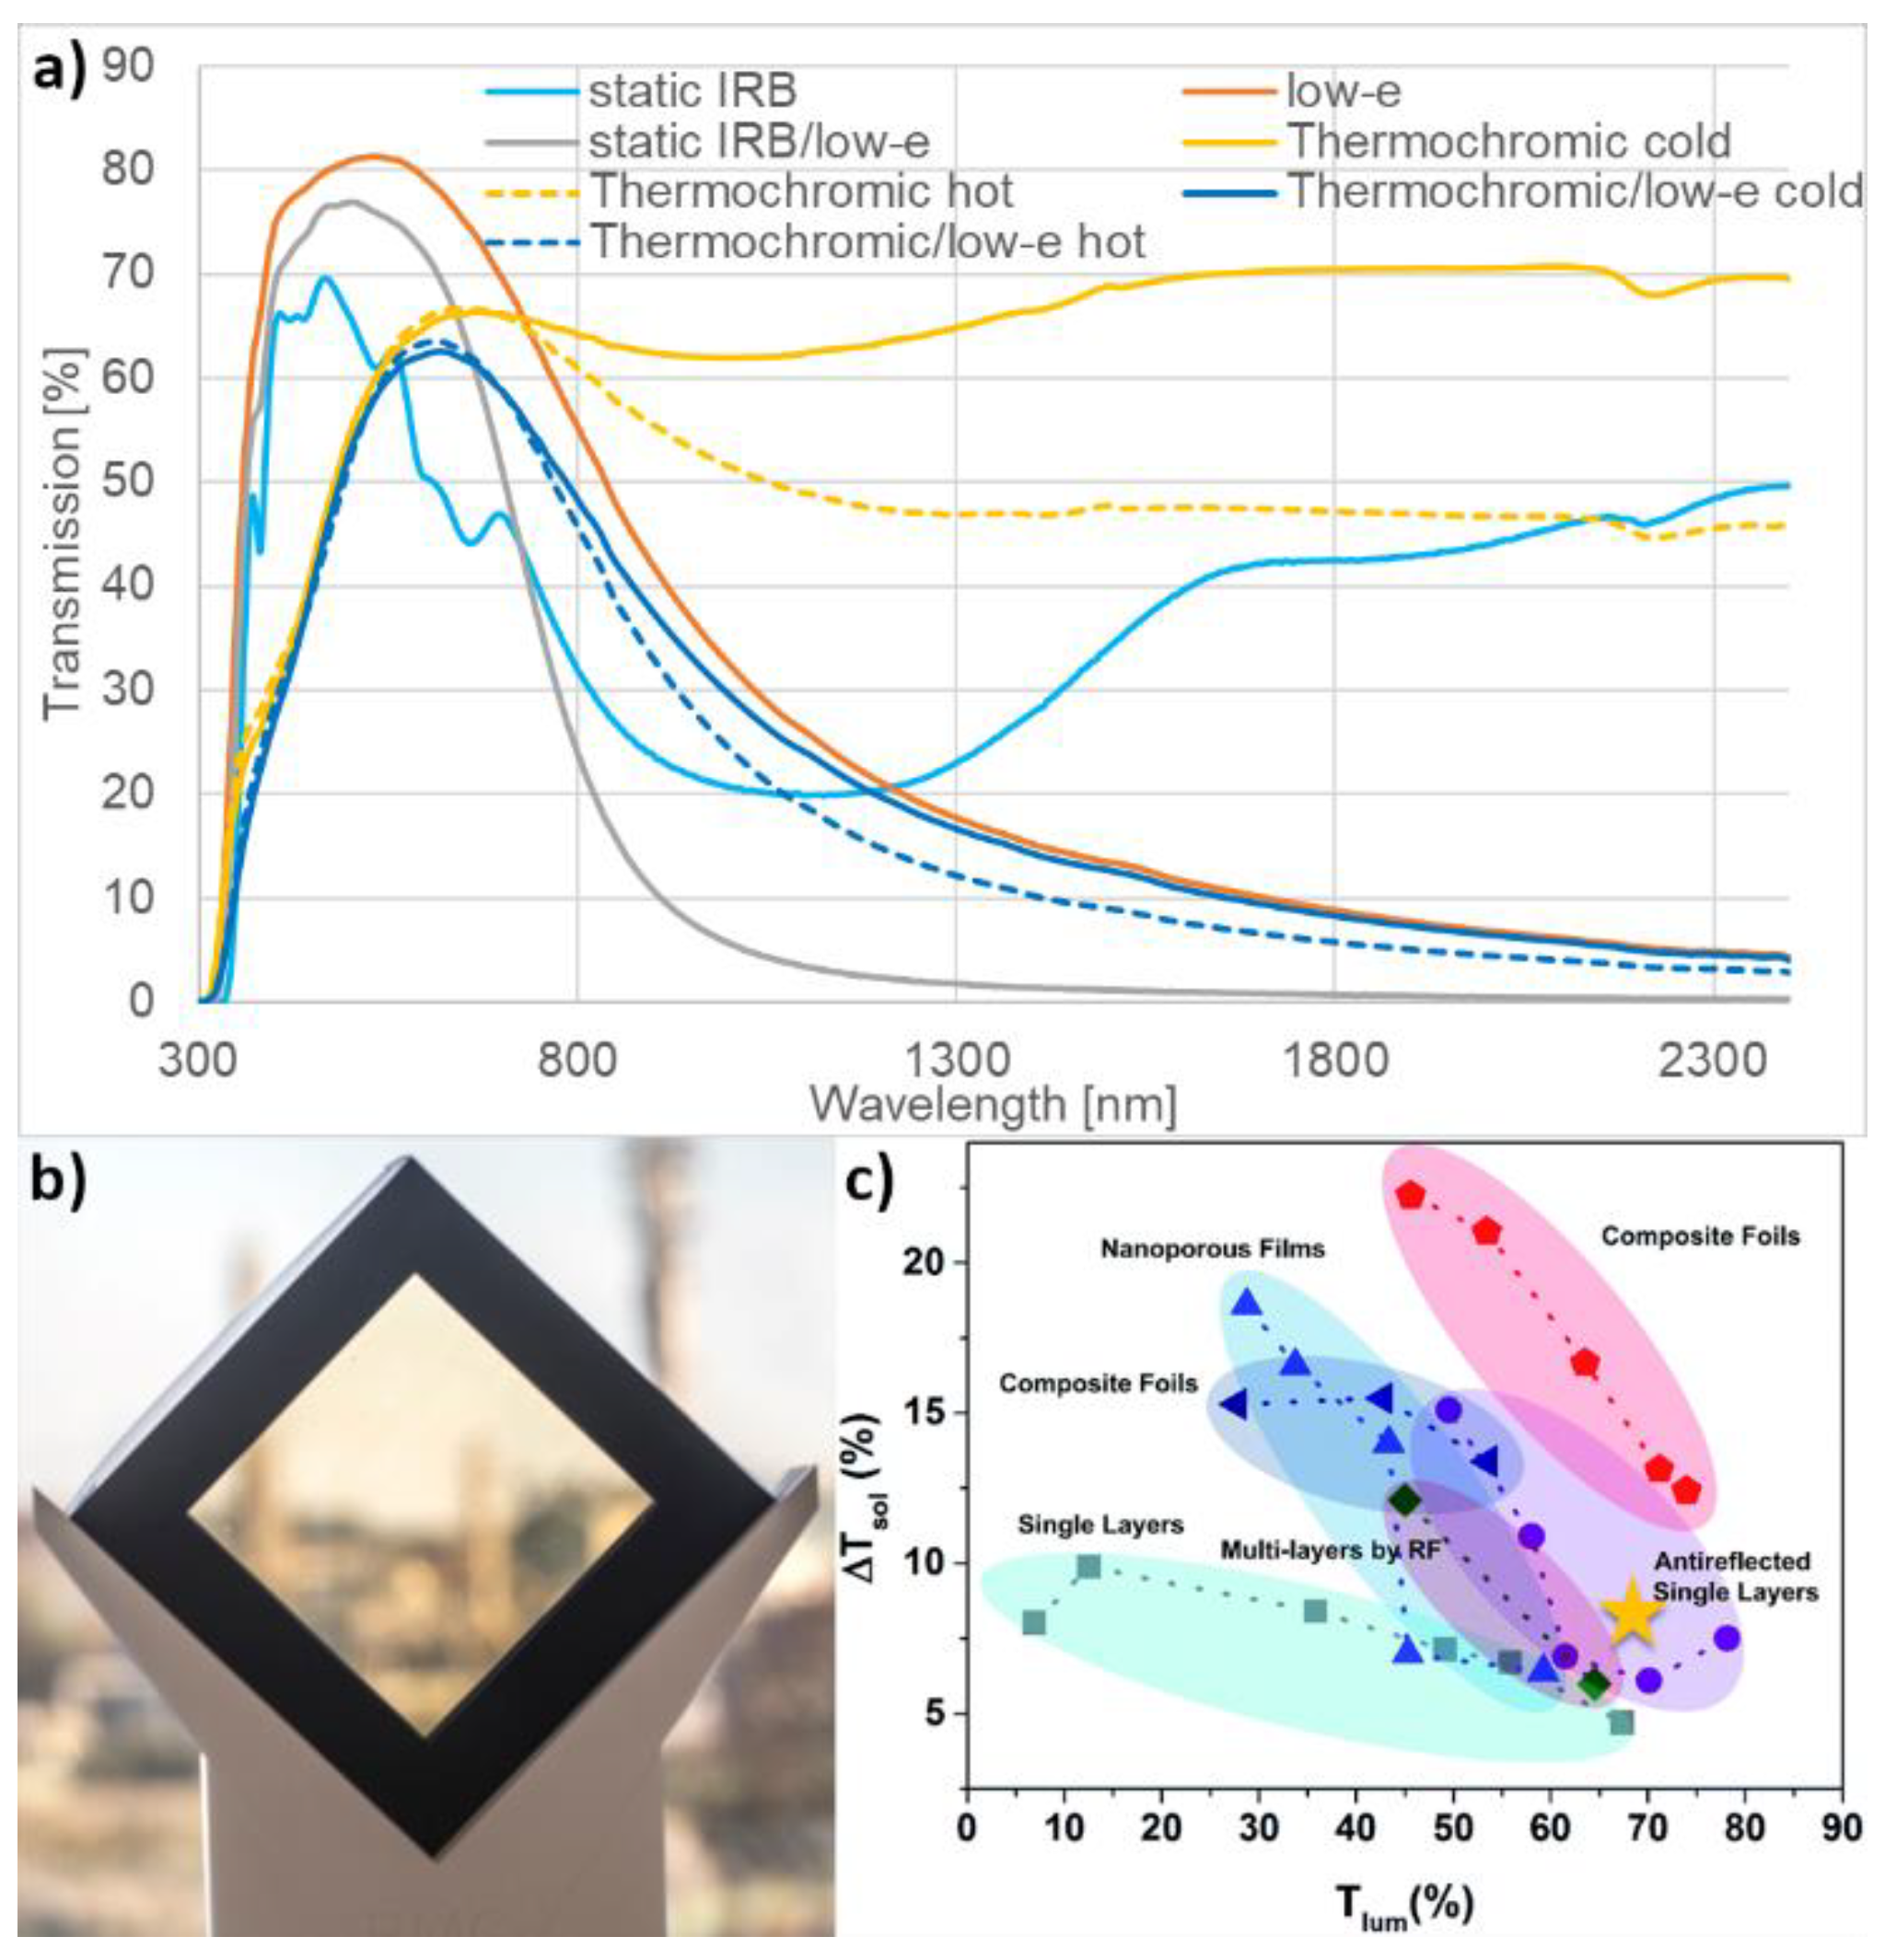
Current commercially available energy-efficient glazing solutions are static systems. They are either developed to regulate the solar heat gain of windows through blocking of infrared (IR) light (
Figure 1a), or to reduce radiator heat loss through the window (
Figure 1b). Therefore, static solar infrared blocking (IRB) glazing has its highest efficiency in hot climates, and low emissivity (low-e) glazing, which reflects longer wavelength infrared radiation, has its highest efficiency in cold climates. There are systems that combine static IRB with low-e to exploit the benefit of both systems (
Figure 1c), but, due to the reduced solar heat gain of these glazing systems, there is still room for improvement in climates with increased heating demands. Especially in climate regions with hot summers and cold winters, adaptive systems are required, that are able to change their properties depending on the requirements of the building and the weather conditions. Therefore, current research and development focusses on glazing systems that can switch their visible transmission and/or solar heat gain depending on an external stimulus, such as electrochromics [
5,
6,
7] and thermochromics [
8,
9,
10].
Thermochromics can switch their solar infrared modulating properties from transmissive to blocking depending on the glazing temperature (
Figure 1d). Due to this self-adaptive property, which promises huge benefits in intermediate climate regions, thermochromics has been the subject of many research articles in recent decades [
9,
10,
11,
12,
13,
14]. The studied material is mostly monoclinic VO
2, which is used as single [
15,
16] or multi-layer [
17] coating on glass, introduced in porous coatings [
18], combined with antireflective coatings [
19,
20] or used in nanocomposite films for glass laminates [
21]. It has also been reported that the temperature at which the change in optical properties occurs can be reduced, from its initial 68 °C for pure VO
2, to room temperature via doping [
10]. Additionally, there have been multiple studies experimentally showing the impact of thermochromics on temperature development in a model room [
19,
22], and modelling studies analyzing the impact of thermochromic windows on the energy consumption of buildings with full and partial window façades in different climate regions [
23,
24,
25,
26]. Additionally, there have been modeling studies investigating the influence of the hysteresis width and gradient of thermochromic material—an intrinsic material property which can be influenced experimentally—on the potential energy consumption of a building [
27].
Several modelling studies have shown that energy performance simulations can quite accurately depict the energy consumption of buildings, and can have a significant impact on designing new materials to optimize the energy performance [
28,
29,
30]. Nevertheless, it is important that modeling parameters are defined and documented precisely, to prevent pitfalls and to ensure comparability between the studied systems, as well as between different studies. A recent review on modeling studies for thermochromic windows states the following shortcomings of the analyzed studies: (i) the number of thermochromic systems that are studied is limited, and not always the best-performing systems reported are studied; (ii) only single rooms are modeled instead of full buildings; (iii) occupancy and lighting schedule are not distinguished between office and residential buildings; (iv) inconsistent or unreported layering type and positioning of thermochromic window, and inconsistent HVAC settings; (v) overheating of thermochromic surface due to intense solar radiation and high absorptivity is not taken into account [
23]. Furthermore, we have deducted several other parameters that are important to ensure comparability and convey the full energy reduction potential of thermochromic windows to the glazing industry and the general public: (i) when thermochromic windows are compared to commercially available energy-efficient glazing solutions, systems with similar visible transmission have to be compared; (ii) for better comparison with commercial products, G and U-values [
31,
32] need to be reported; (iii) to grasp the full potential of thermochromic windows, the switching temperature has to be optimized for each system individually. Further, most modeling studies on thermochromic windows focus on the energy reduction potential in office buildings [
23,
24,
25,
26], but it is also mentioned that due to the full window façade and the high cooling demand, systems with the greatest solar heat blocking properties can show the highest energy savings even in cold climates [
24]. Therefore, the adaptive properties of thermochromics do not always lead to an additional benefit.
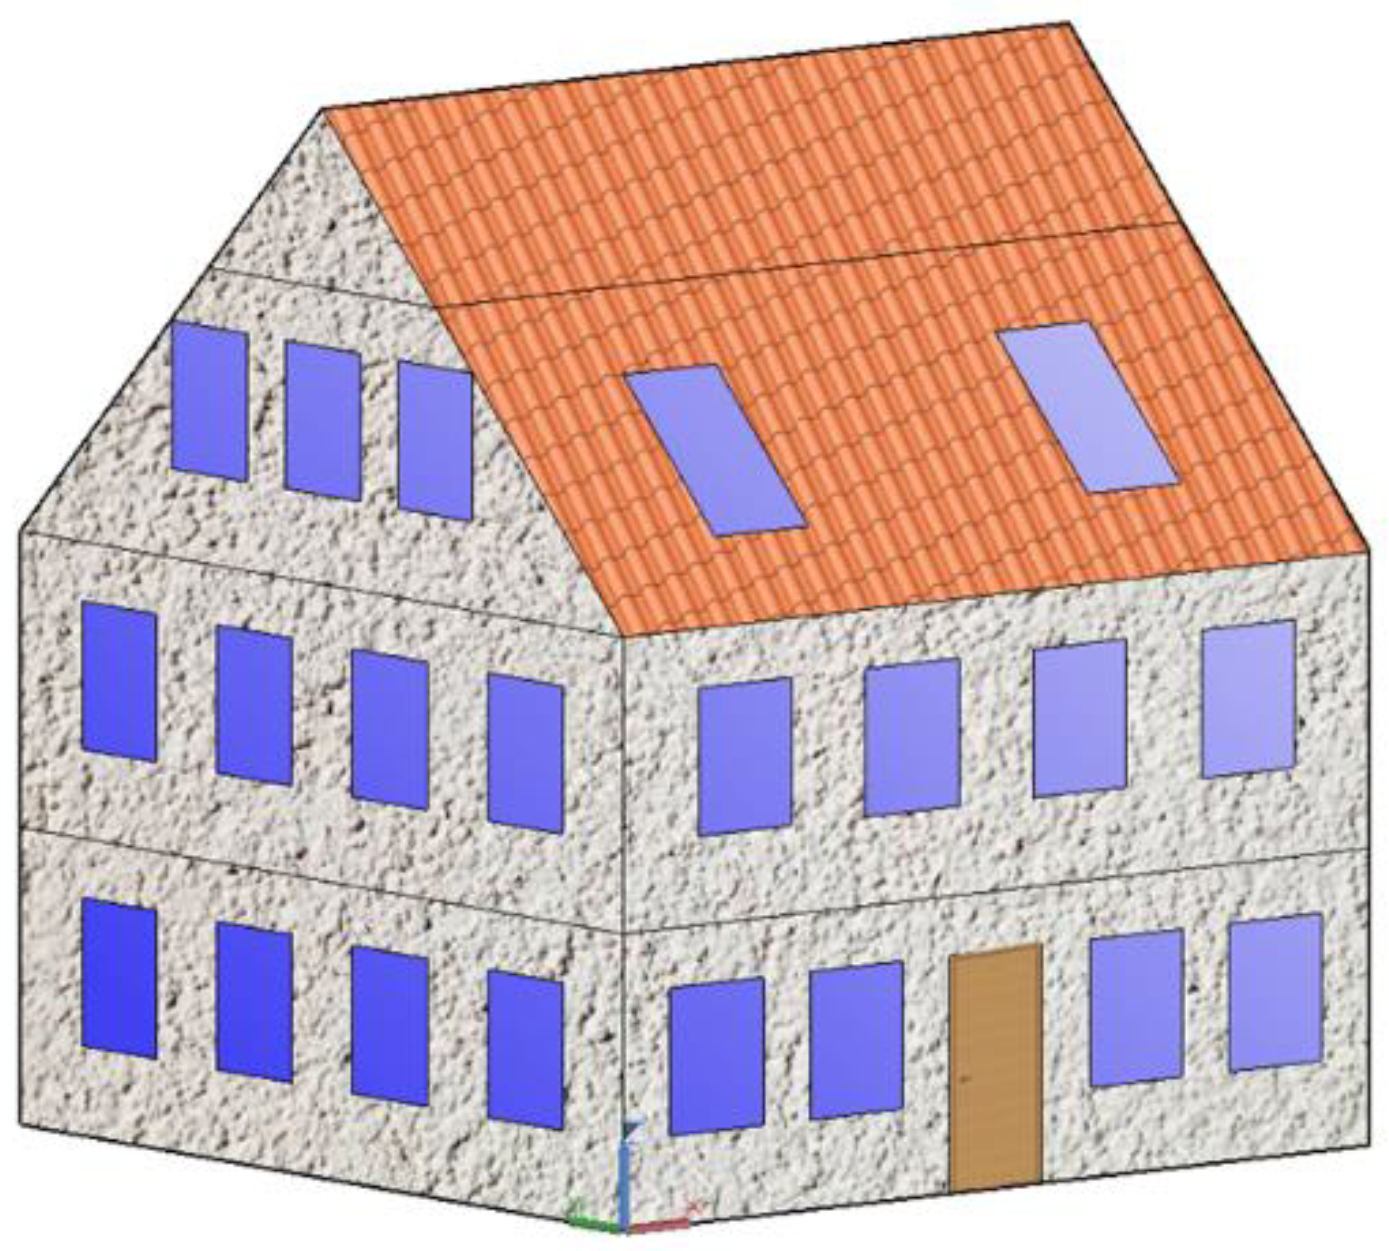
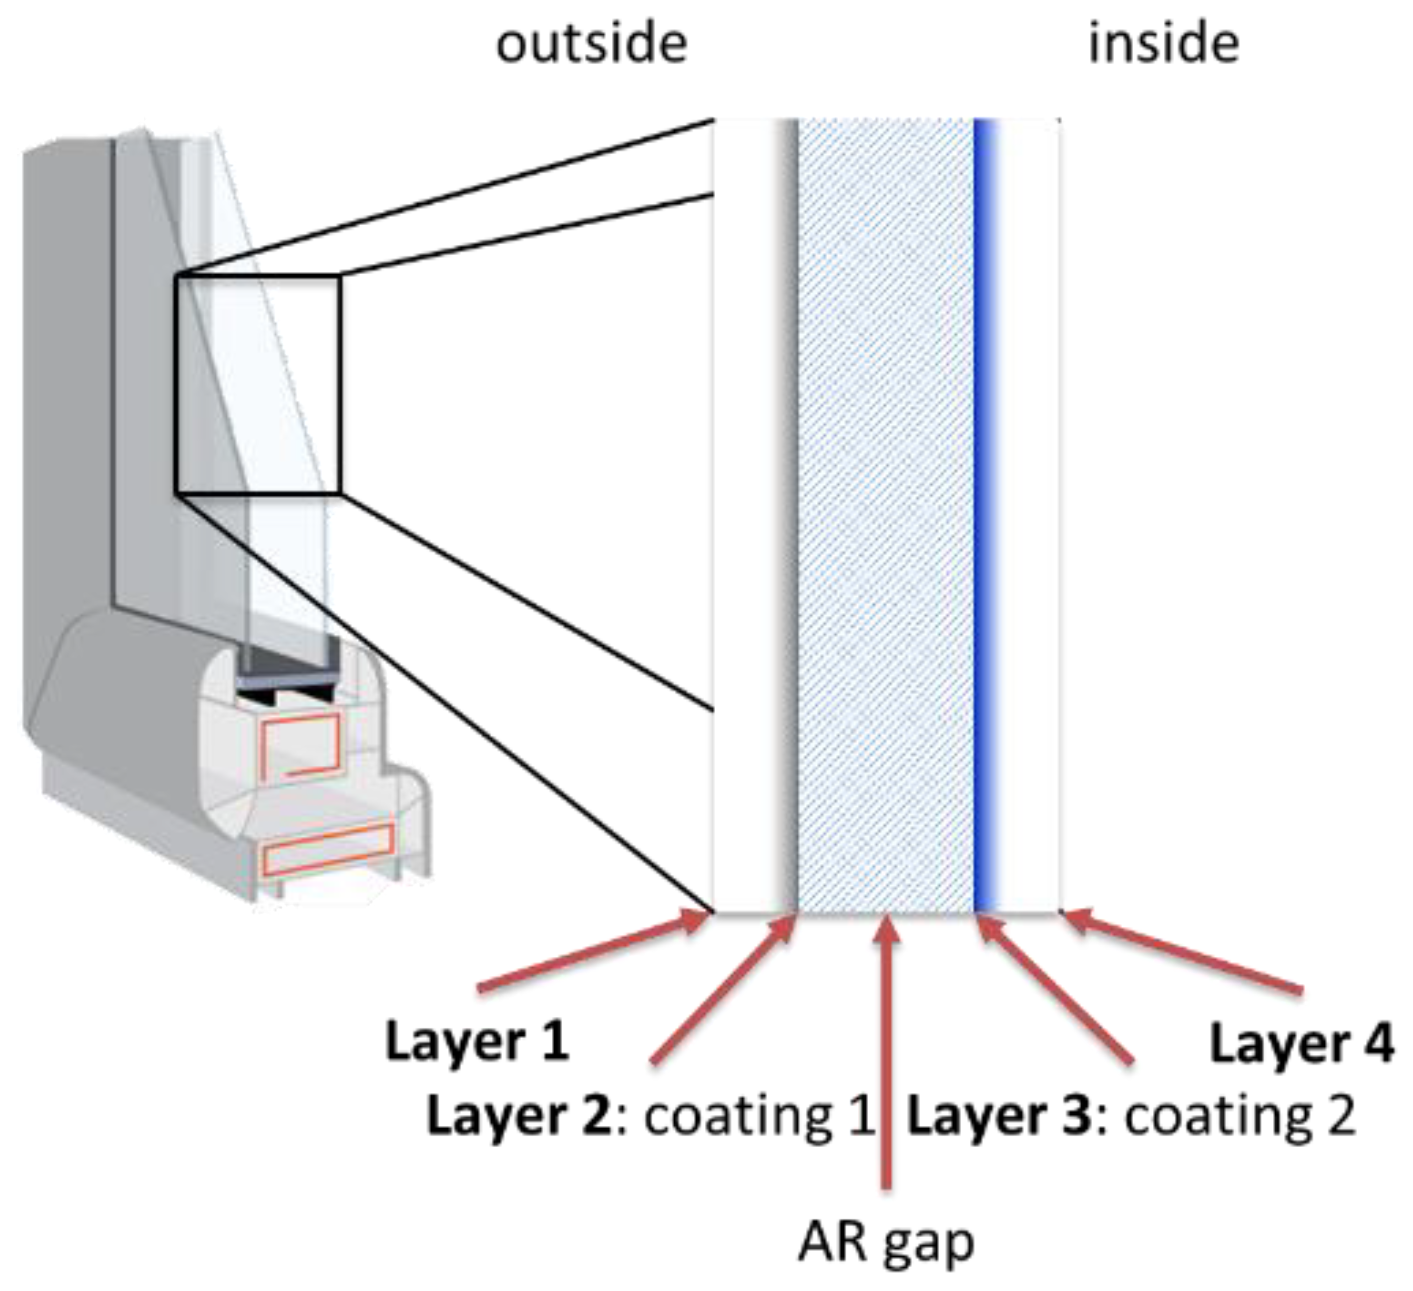
To analyze and present the full potential of thermochromic windows, and to deliver well-reported, understandable and comparable results, we developed a new model system tackling all the shortcomings mentioned above. Here, we report the first integrated modelling study on thermochromic windows using the energy simulation software Energy Plus on a full-size residential building, with occupancy and lighting schedule defined accordingly, well-defined double glazing units with consistent layering type and positioning, and an optimized HVAC system to neglect energy loss and reduce complexity. The annual energy consumption of this building is modeled for 10 different location in various climate zones, ranging from hot over intermediate to cold climates. Furthermore, four commercial double glazing systems, including three energy-efficient glazing solutions and two thermochromic glazing systems, are compared. All glazing systems featuring solar heat modulating properties are selected with similar visible transmission, and the thermochromic coating used in this study is the best-performing single layer coating ever reported. Additionally, the switching temperature of the thermochromic systems is adjusted for each location individually to realize highest possible energy savings and to include overheating effects.
3. Results and Discussion
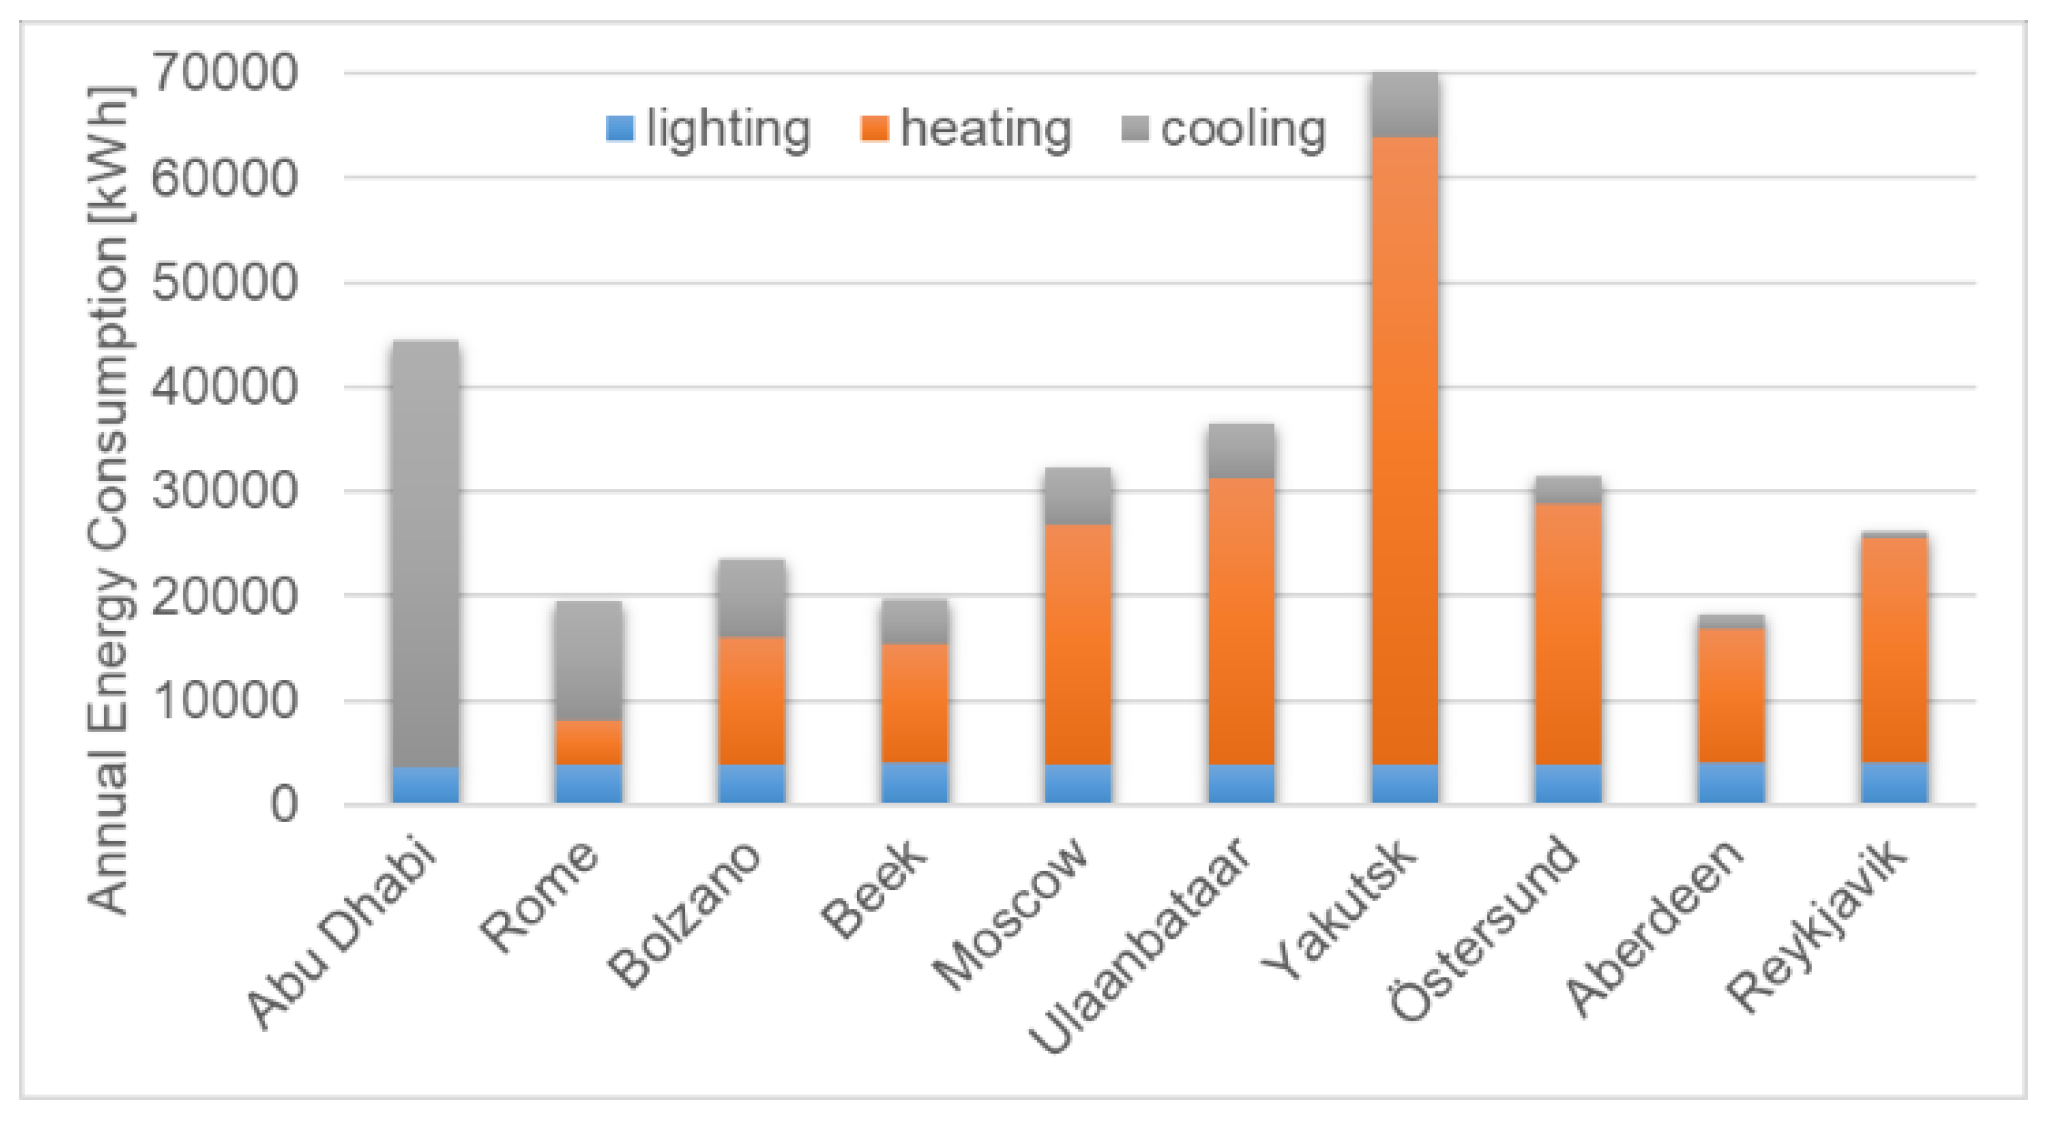
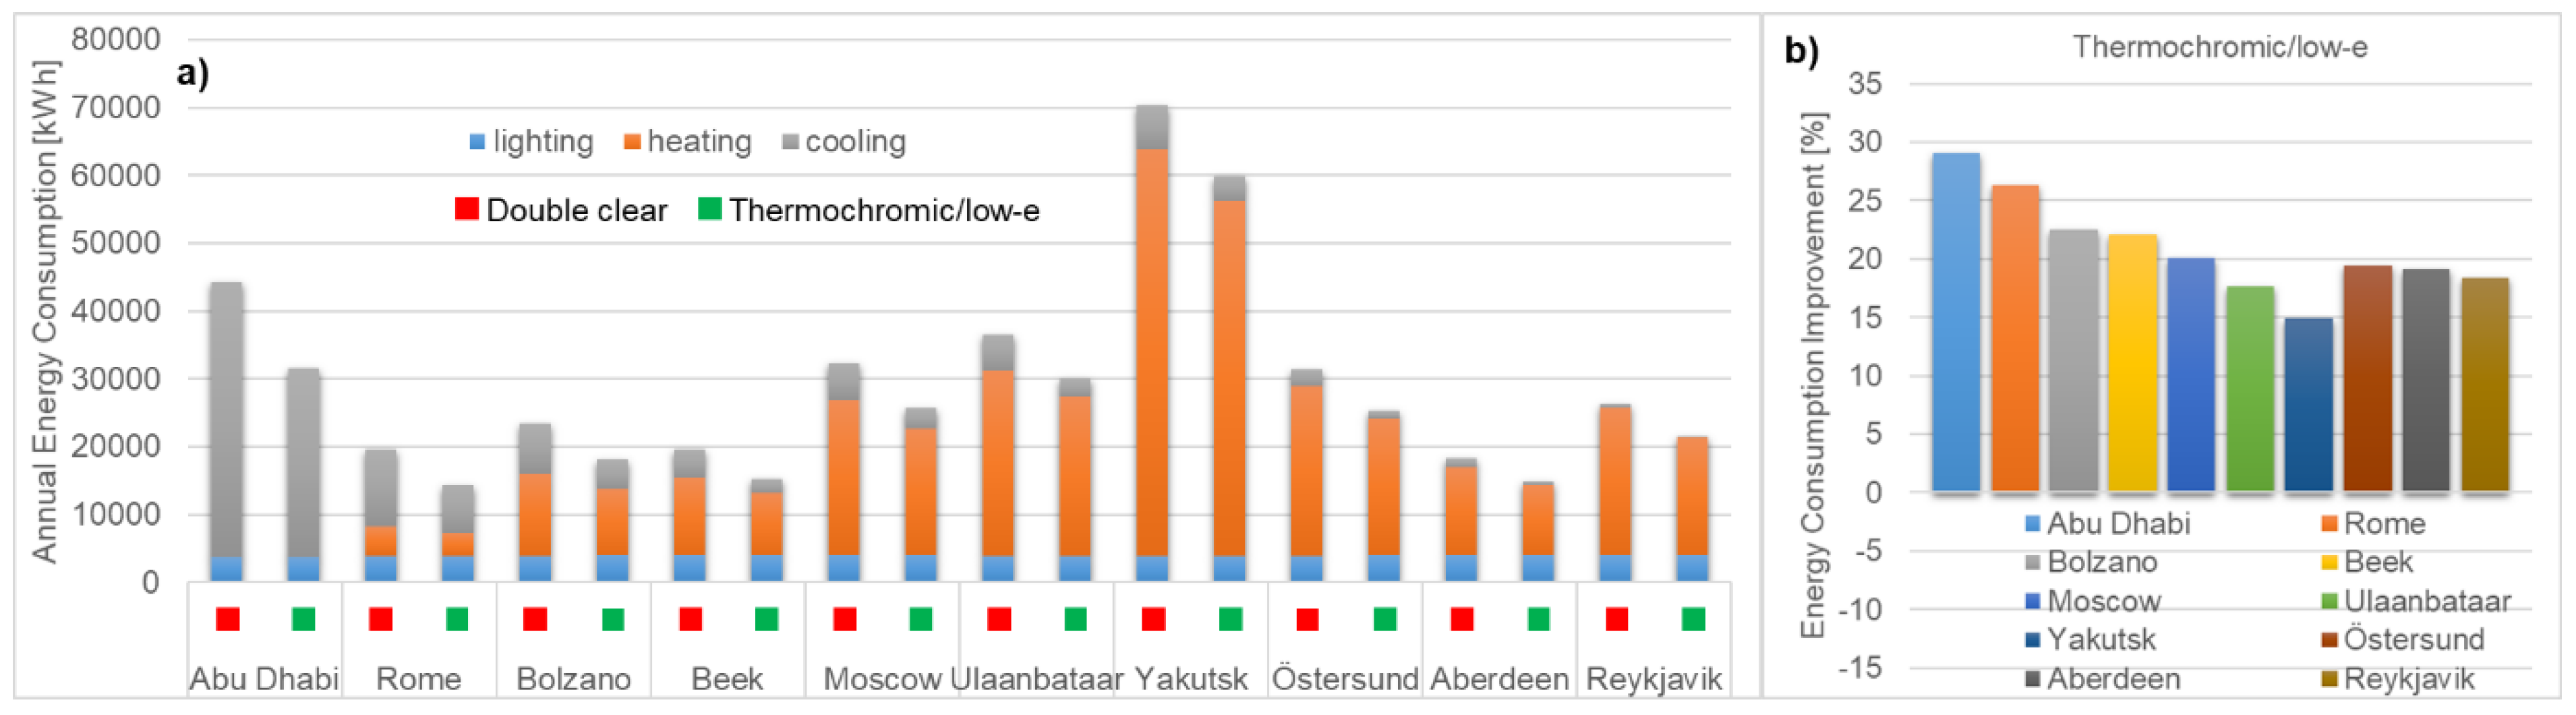
To compare the energy consumption efficiency of different energy-efficient gazing systems, the model house in Energy Plus was equipped with one of the five selected double glazing units. The annual energy consumption due to heating, cooling and lighting was calculated for all above selected regions. For each modelled system and location the annual energy consumption for heating, cooling and lighting were obtained separately, and combined to calculate the total annual energy consumption. Consequently, we could analyze the total energy consumption for different glazing systems, and identify the shares contributed by heating, cooling and lighting.
3.1. Performance of Each Double Glazing System at Different Locations
After calculation of the annual energy consumption for our model house, equipped with all five energy-efficient double glazing systems and for all locations, we first studied the performance of each glazing system individually, and compared the energy consumption of the selected energy-efficient glazing to double clear glass. Hence, we analyzed the energy consumption improvement of the individual energy-efficient solutions over clear glass for different locations, and worked out trends for each glazing system. A general observation could be made in regard to the annual lighting energy. Here, for all locations only minor differences between all simulated glazing systems were observed, which can be explained by the high visible transmission for all selected double glazing systems.
3.1.1. Energy Consumption Improvement of Static IRB Glazing
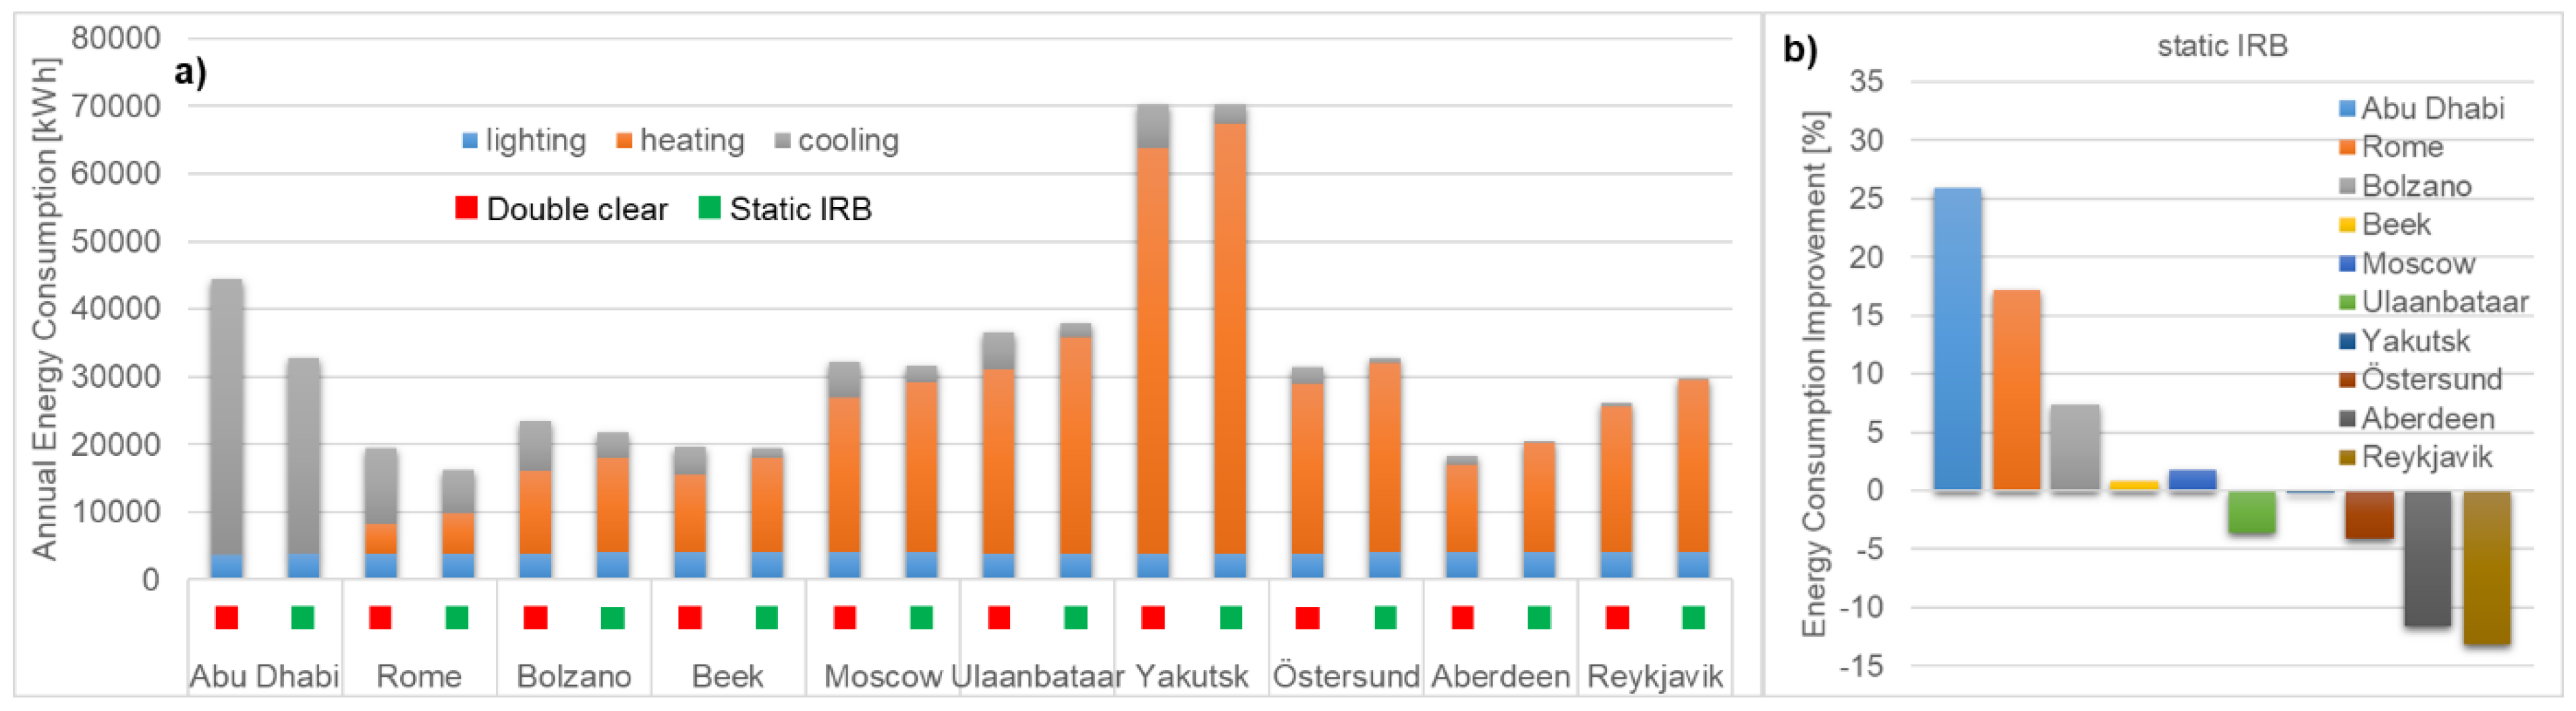
In general, the simulations showed that using static IRB glazing reduces annual cooling demand in comparison to clear glass, and increases the annual heating demand. Annual cooling can be reduced between 28% and 83% depending on the climate, whereas heating demand is increased between 10% and 31% (
Figure 6a). The impact on lighting demand is only marginal, and increases between 1% and 3%. The static IRB glazing shows the highest energy consumption improvement over clear glass in Abu Dhabi. Here the large amount of cooling energy needed over the year can be reduced drastically by lowering the solar hear gain of the windows (
Figure 6a), which leads to a total annual energy consumption improvement of about 26% over clear glass (
Figure 6b). In hot and warm regions (Rome and Bolzano), where cooling represents a substantial part of the total annual energy demand, the static IRB glazing shows a higher energy consumption efficiency (17% and 7%, respectively) than clear glass. Here, the reduction in necessary cooling energy between 48% and 61% lowers the total annual energy consumption in comparison to clear glass, but the static low solar heat gain of the window leads to an increased heating demand of between 13% and 31% (
Figure 6a). These conflicting gains become more prominent, increasing the impact of the heating demand on the total annual energy consumption and offsetting the benefit of the static IRB glazing on the cooling costs. Therefore, the energy consumption improvement of this type of energy-efficient glazing over clear glass drops drastically when moving to regions with increased annual heating demand (
Figure 6b). The increased heating demand for intermediate regions like Beek and Moscow, of 21% and 10% respectively, leads to the positive effect of static IRB glazing on the annual cooling demand (61% and 55% respectively) being completely negated by the negative effect on the annual heating demand. Therefore, in these regions the static IRB glazing shows a similar total annual energy demand to double clear glazing (
Figure 6a,b). This trend continues when we move further into colder climates, with further increased impact of heating demand on the total annual energy consumption. Therefore, when the annual heating demand equals or exceeds five times the annual cooling demand, the static IRB glazing is detrimental to double clear glass. Here, the increased annual heating energy due to the low solar heat gain of the window cannot be counterbalanced anymore by the reduction in annual cooling costs, and therefore leads to a net increase in total annual energy consumption of up to 13%, in comparison to double clear glazing (
Figure 6a,b).
3.1.2. Energy Consumption Improvement of Low-e Glazing
The low-e glazing shows a very steady performance in comparison to double clear glass over all regions. The reduced emissivity from the low-e coating leads to a reduction in annual heating demand for all regions of between 20% and 25%, by reduction of radiator heat loss. Additionally, the lowered solar heat gain of the glazing leads to lowered cooling costs in comparison to clear glass; between 23% and 41% (
Figure 7a). The impact on lighting demand for this type of glazing can be almost neglected, since it is only increased between 0.2% and 0.4%. This combination causes the very steady energy consumption improvement of low-e over double clear glazing, of around 20% for all climate regions (
Figure 7b). Only the regions with average temperatures <−25 °C in winter (Ulaanbaatar, Yakutsk) show a lower energy consumption improvement. Here the annual energy consumption for heating is only reduced by approximately 15%, which is probably due to insufficient insulation of the wall material. Since this is not optimized for the different regions, the deviation in energy performance in these regions is due to a limitation of the selected boundary conditions.
3.1.3. Energy Consumption Improvement of Combined Static IRB/Low-e Glazing
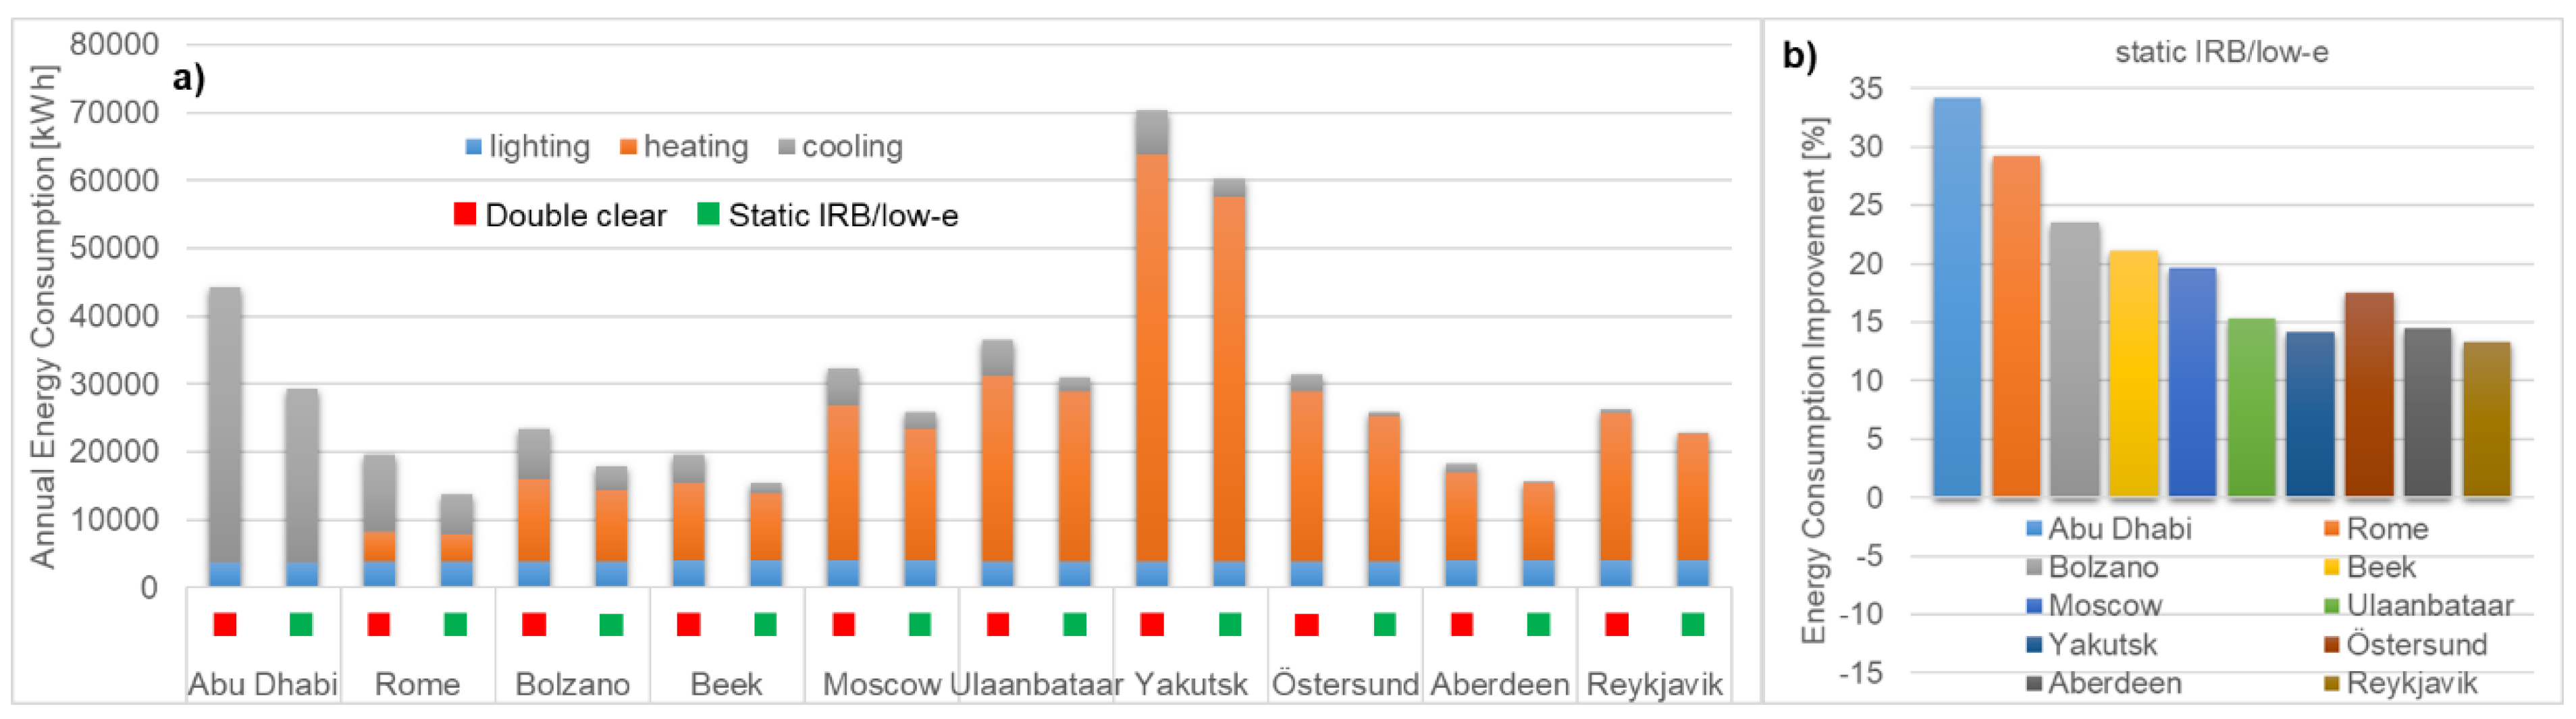
The combination of static IRB with low-e glazing shows the highest reduction of annual cooling demand of all windows. Here, the annual energy consumption for cooling can be reduced between 37% and 80% (
Figure 8a). Additionally, heating demand in comparison to clear glass can be reduced between 11% and 15%. The annual energy consumption required for lighting is again only marginally increased, by approximately 1% for all regions. The static IRB/low-e glazing shows very high energy consumption improvement over clear glass in the hottest climate (Abu Dhabi). Here, a substantial amount of annual cooling costs (37%) can be reduced by the low solar heat gain of the window in combination with the increased insulation provided by the low-e properties (
Figure 8a). This reduction in cooling leads to the total annual energy consumption improvement of static IRB/low-e over double clear glazing of 34% (
Figure 8b). When moving to hot climates, with moderate amounts of heating needed over the year, yet still with high annual cooling demands (Rome), the energy consumption improvement of static IRB/low-e glazing reduces to 29%. Here, the impact of the reduction in annual cooling (47%), which is still high, is diminished by the low reduction in annual heating (11%). Due to the static low solar heat gain of the window, the effect of the low-e properties on the reduction of annual heating costs is reduced since solar heat can only have a small influence on room heating at cold temperatures. This effect is further increased when moving to climates with higher annual heating than cooling costs. Here, for all warm, intermediate and cold climates, more than 50% of the annual cooling energy can be saved, but due to shutting out solar heat over the whole year the annual heating costs are only reduced by approximately 15% for all these regions. This leads to a strong decrease in annual energy consumption improvement of static IRB/low-e glazing, below 24% for warm climates, and below 20% for intermediate climates (
Figure 8b). Since, especially in cold climates, the reduction in cooling costs has almost no impact on the total annual energy consumption, only a 13% improvement over clear glass is reached, due to the small heating costs reduction resulting from the static low solar heat gain of the window. Deviations from the observed trend in regions with average winter temperatures <−25 °C can again be attributed to the limitation of the chosen boundary conditions, with regard to insufficient insulation.
3.1.4. Energy Consumption Improvement of Thermochromic Glazing
By using the thermochromic double glazing system, annual cooling demand can be reduced between 18% and 57%, whereas annual heating demand is slightly increased between 5% and 13% in comparison to clear glass (
Figure 9a). The increase in lighting demand is between 1% and 2%. The thermochromic glazing shows the highest energy consumption improvement in hot climates. Here, the reduced solar heat gain of the window leads to a reduction in annual cooling energy consumption of 18% (
Figure 9a). In Abu Dhabi, the performance of the thermochromic glazing is highest when it is always in the hot state. Since there is no heating needed over the year, the adaptive functionality, which allows a higher solar heat gain at cold temperatures, is redundant. By adjusting the switching temperature of the thermochromic glazing to keep it always in the hot state, annual energy consumption improvement of 17% over double clear glass can be reached (
Figure 9b). When moving to Rome, a hot climate with mainly cooling and some heating needed over the year, the energy consumption improvement is reduced to 13%, due to an increase in annual heating in comparison to clear glass of 13% (
Figure 9a,b). Here, the thermochromic properties have a positive impact on the annual energy consumption of the residential building. By adjusting the switching temperature to 18 °C, the increase in annual heating costs in comparison to clear glass can be minimized, with a reduction in annual cooling demand that is still high at 28%. For climates with higher annual heating than cooling demand, the annual energy consumption improvement of the thermochromic glazing over clear glass is further reduced. Since the impact of increased annual heating costs on the overall energy consumption increases and the impact of reduced annual cooling costs is reduced, the overall energy consumption improvement is reduced to 6% for warm climates, and drops below 5% for intermediate climates. Here, adjusting the switching temperature between 14 and 17 °C, to optimize the annual energy consumption, can minimize the disadvantage of the reduced solar heat gain for conditions when heating of the residential building is required. The thermochromic properties hereby keep the increased heating demand at a minimum—for all warm and intermediate climates, below a 9% increase over clear glass. In combination with the cooling demand reduction between 31% and 44%, this leads to an overall lower energy consumption of thermochromic glazing in these regions. For cold climates, the advantage of reduced annual cooling is counterbalanced completely by increased annual heating. Even by adjusting the switch temperature to 17–20 °C, the impact of increased annual heating demand, between 5% and 10%, is still too high, and no overall improvement over clear glass can be achieved.
3.1.5. Energy Consumption Improvement of Combined Thermochromic/Low-e Glazing
The combination of thermochromic and low-e glazing shows reduced annual cooling demand for all regions between 32% and 62%, in combination with reduced annual heating demand between 18% and 22% (
Figure 10a). The annual lighting demand is increased, in comparison to clear glass, between 2% and 3%. The thermochromic/low-e glazing again shows the highest energy consumption improvement in hot climates. Here, the high cooling energy consumption can be reduced severely, by 32%, due to lowering the solar heat gain of the window (
Figure 10a). As for the pure thermochromic glazing, the adaptive properties of the thermochromic material are redundant, since the lowest annual energy consumption is reached with the coating always in the hot state. An annual energy consumption improvement over clear glass of 29% can be reached (
Figure 10b). For hot regions with low annual heating demand, the thermochromic properties in combination with the low-e properties lead to a reduction in annual heating costs of 22%. In combination with reducing annual cooling costs by 38%, a total annual energy consumption improvement over clear glass of 26% is reached, which is only slightly lower than the performance in Abu Dhabi (
Figure 10a,b). Here, the switching temperature of the thermochromic coating has to be adjusted to 17 °C for minimum total energy consumption. In all regions with higher annual heating than cooling demand, the annual energy consumption due to heating can be reduced by approximately 20% when the switching temperature of the thermochromic coating is adjusted for optimized total annual energy consumption. Combined with an annual cooling energy reduction between 40% and 51% for warm and intermediate climates, and >60% for cold climates, the energy consumption improvement over clear glass stays around 20%. In warm and intermediate climates with up to three times the annual heating to cooling demand, 22% improvement can be reached. This only decreases slightly for regions with higher annual heating to cooling demand ratios, and reaches 18–19% for cold climates due to the increased impact of the annual heating costs. In all these regions, the thermochromic properties show their impact and lead to a combination of high annual cooling demand reduction with high annual heating reduction. Deviations in regions with average winter temperatures <−25 °C can again be attributed to the limitation of the boundary conditions, with regard to insufficient insulation.
3.2. Comparison of the Energy-Efficient Glazing Systems and Recommendations for All Locations
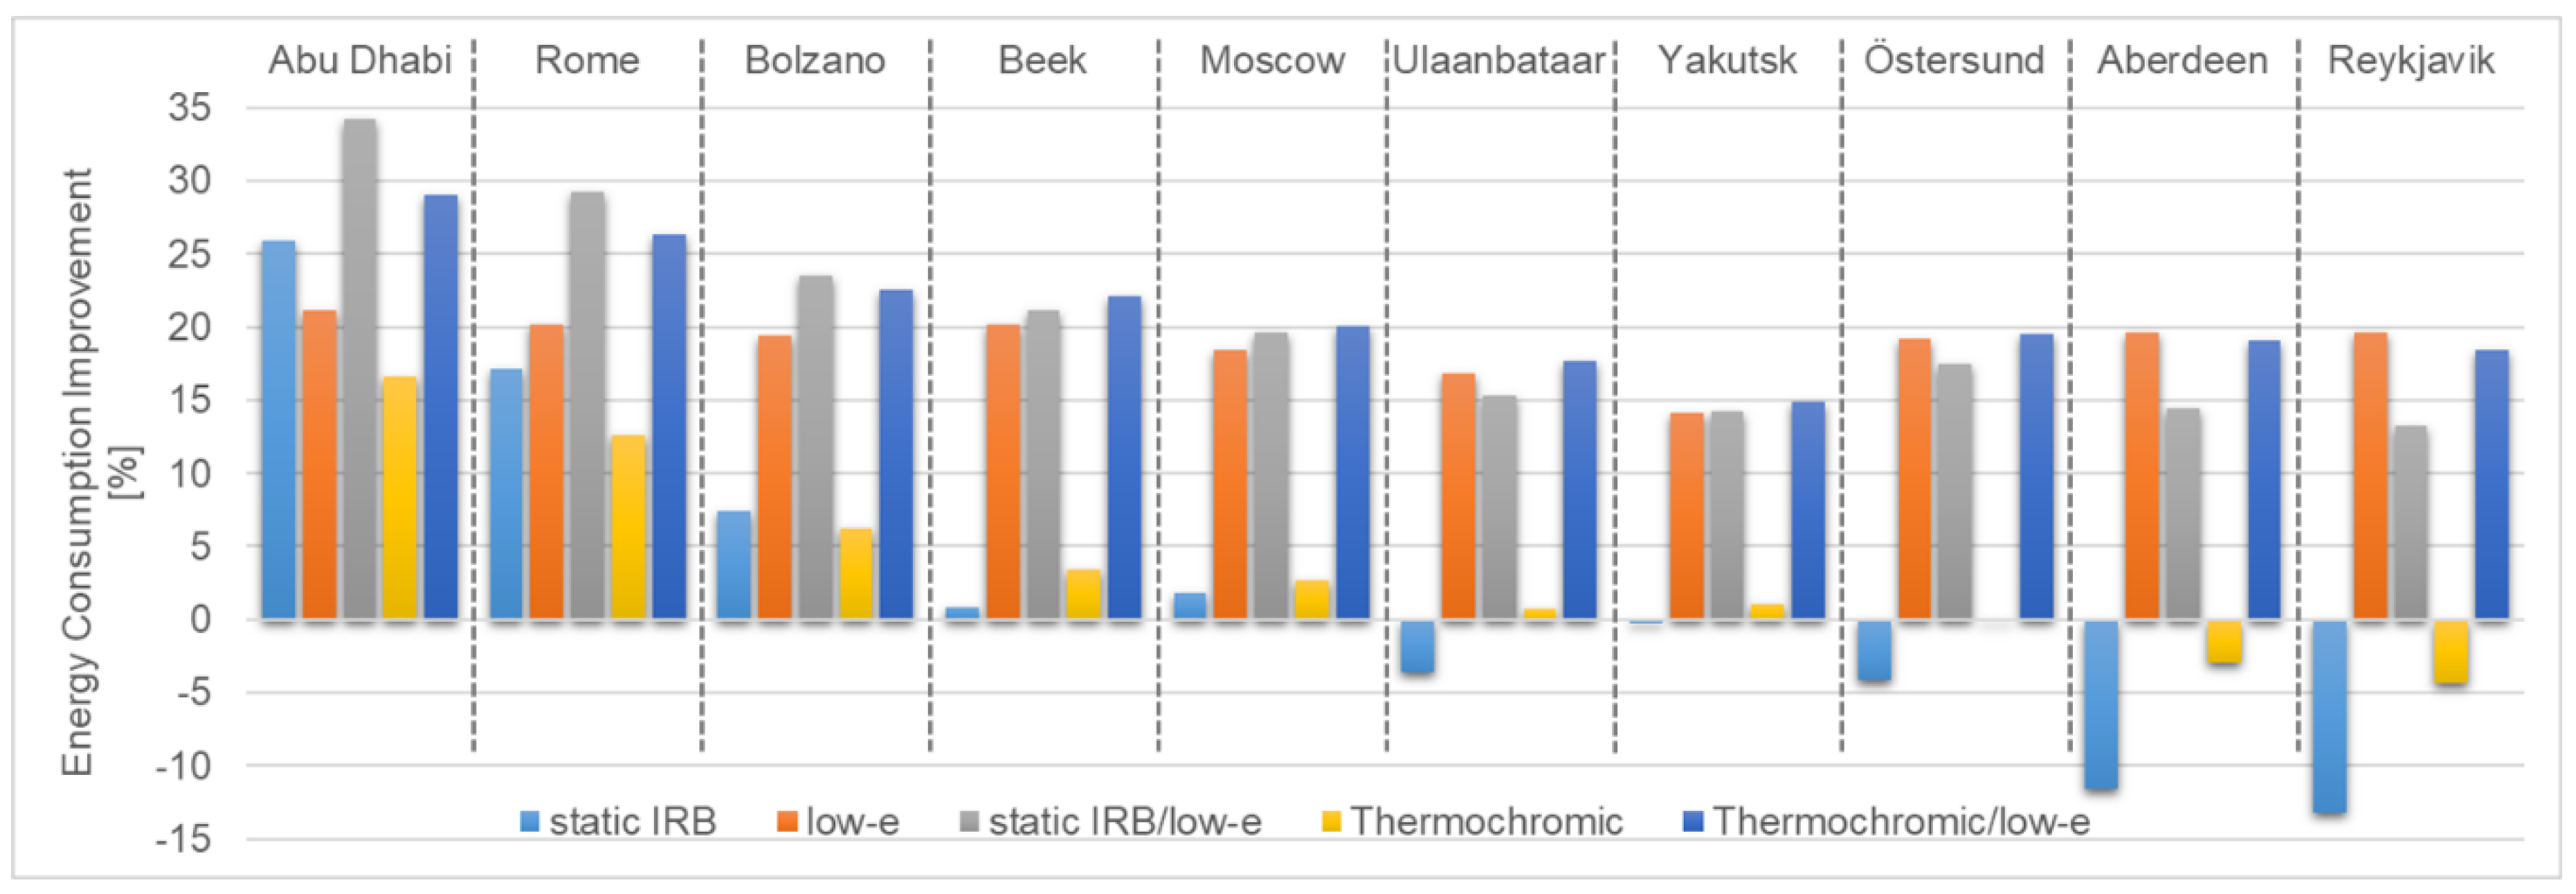
By comparing the five energy-efficient glazing systems for each location individually, a clear trend can be observed. For hot and warm climates with either no heating costs (Abu Dhabi), higher cooling than heating costs (Rome) or only twice the annual heating to cooling demand, the static IRB/low-e glazing provides the highest annual energy consumption improvement of all energy-efficient glazing solutions (
Figure 11). Here, the high reduction in annual cooling demand—between 37% and 51%, due to the low solar heat gain—in combination with annual heating demand reduction between 11% and 15%—due to the low-e properties—leads to a total annual energy consumption improvement over clear glass of between 24% and 34%. In these regions, the impact of reducing annual cooling costs on the total annual energy consumption is much higher than the impact reduced annual heating has. Therefore, the glazing system with the highest reduction in annual cooling demand has the best overall performance, even if other glazing systems, such as pure low-e, have a higher impact on the annual heating demand. The second-highest performance (23–29% total annual energy reduction) in these regions is attributed to the combination of thermochromic with low-e, where the high reduction of annual cooling (between 32% and 40%) is combined with a high reduction of annual heating (between 20% and 22%), even though the solar heat gain reduction is not high enough to reach the values of the static IRB/low-e glazing. For the hottest region, the static IRB glazing shows the third-highest annual energy consumption improvement of 26%. Due to the intense performance decline for regions where heating starts playing a role, this is surpassed already for Rome by the low-e glazing; the static IRB glazing reduces the annual energy consumption by 17%, whereas the low-e glazing shows 20% annual energy consumption improvement. This trend continues, so that at Bolzano, IRB glazing shows a 7% annual energy consumption improvement, which is only a slightly better performance than the thermochromic glazing at 6%, which has the lowest annual energy consumption improvement of all studied glazing systems in hot regions.
For all intermediate to cold regions, with a heating/cooling ratio from 3:1 up to 10:1 and large to medium temperature difference between summer and winter, the thermochromic/low-e glazing shows the highest annual energy consumption improvement over clear glass; between 15% and 22% (
Figure 11). Here, the high reduction in annual cooling (44–51%) in combination with the high reduction in annual heating demand (around 20%), which result from the thermochromic properties of the glazing in combination with the low-e effect, lead to total annual energy savings that surpass all other glazing systems. In intermediate regions with three or four times the annual heating to cooling loads, the combined static IRB/low-e shows the second-highest performance, of 20–21%. Here, the impact of the annual cooling costs reduction, of 56–61%, on the total annual energy consumption is still high enough to compensate for the lower annual heating costs reduction, of 14–15%, when compared to pure low-e glazing, which reduces annual heating demand by 28–31%. When the impact of annual heating on the total annual energy demand increases, and reaches 5 to 10 times the annual cooling costs, the static IRB/low-e glazing is surpassed by the pure low-e glazing, which shows a steady performance of approximately 20% total annual energy reduction over all regions. The two glazing systems without low-e properties only show very small or even no improvement over clear glass in the intermediate regions, although the thermochromic glazing performs slightly better than the static IRB glazing.
For cold regions, with a heating/cooling ratio of 10:1 and with a small temperature spread between summer and winter, and for regions with even higher heating/cooling ratios, the annual energy consumption improvement is dominated by the annual heating costs reduction. Here, reducing annual cooling costs has almost no influence on the total annual energy consumption, and the glazing with the highest annual heating costs reduction performs best. Therefore, in Aberdeen and Reykjavik the low-e glazing shows the highest annual energy consumption improvement (20% total; 20–23% annual heating cost reduction), followed by the thermochromic/low-e glazing (18–19% total; 19–21% annual heating cost reduction) and the static IRB/low-e glazing (13–15% total; 12–15% annual heating cost reduction). The two glazing systems without low-e properties show higher annual energy consumption than clear glass in these regions, due to increased annual heating costs between 5% and 10% and 12% and 24%, for thermochromic and static IRB glazing, respectively.
3.3. Ecological and Economic Analysis of Thermochromic/Low-e Glazing in the Netherlands
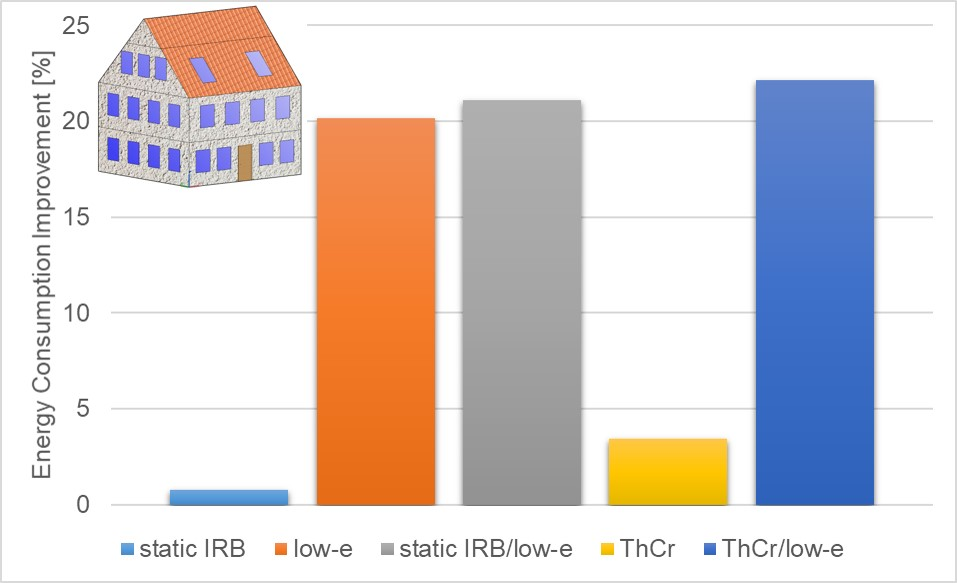
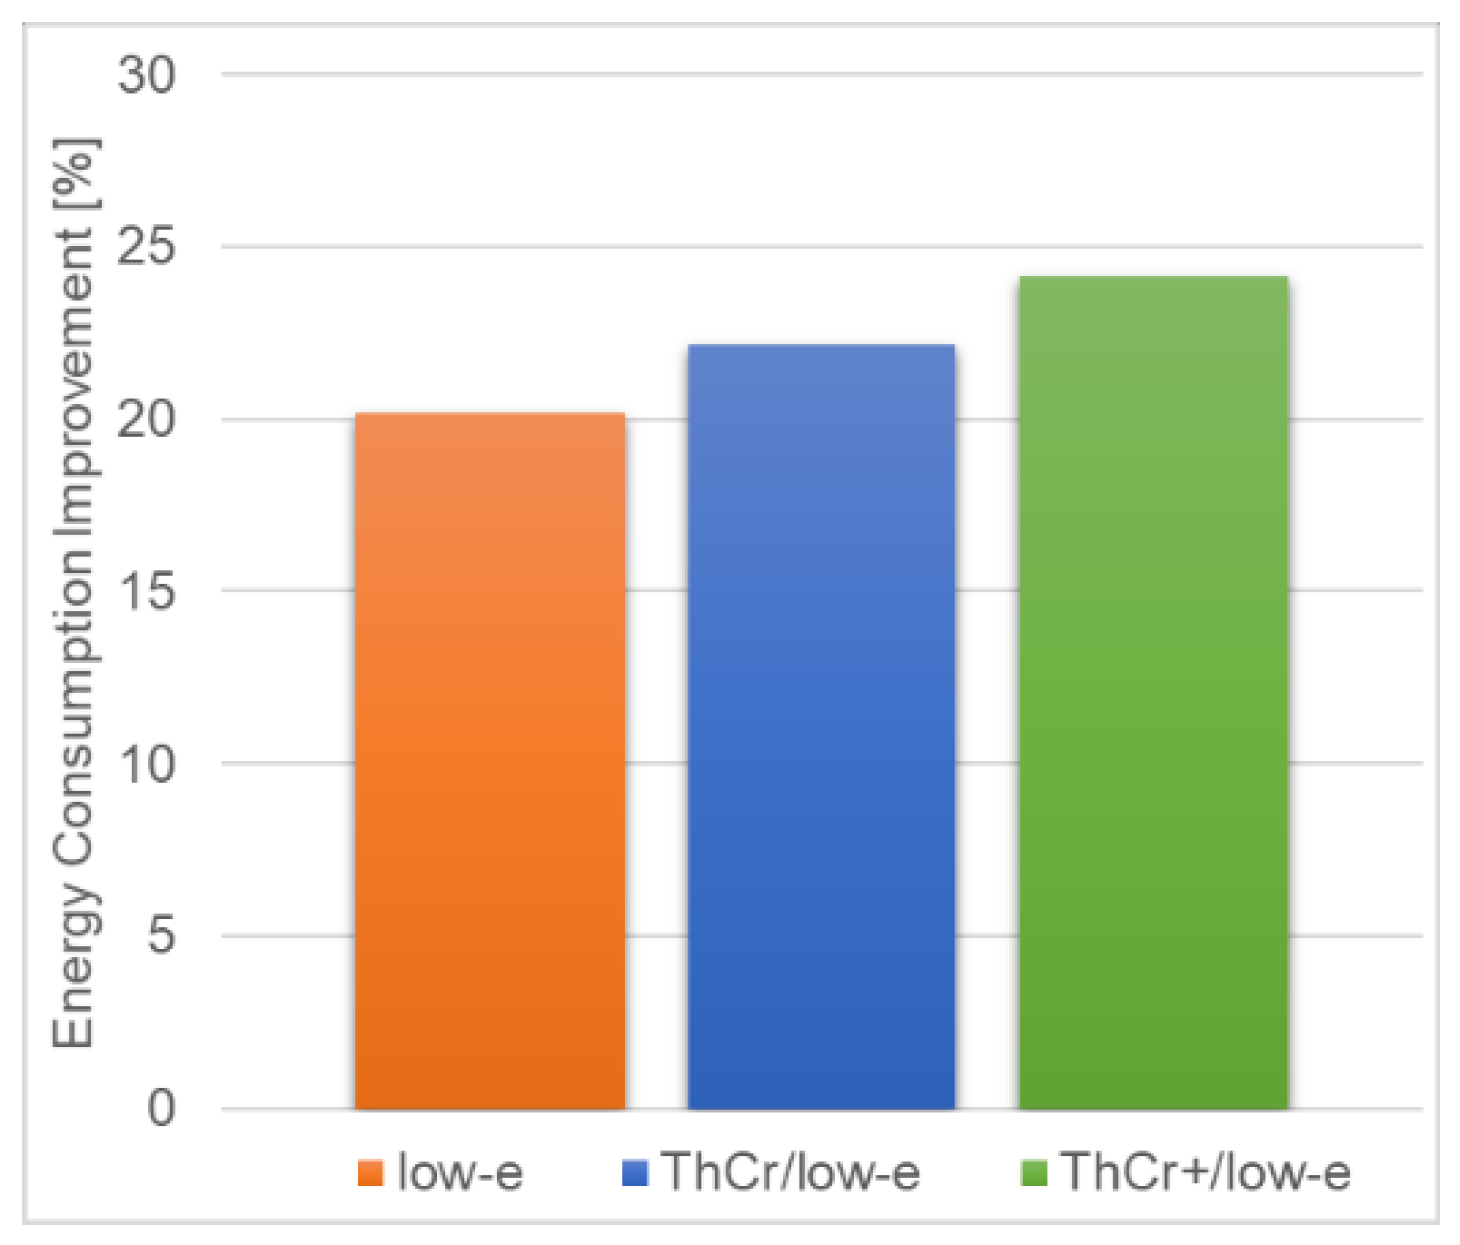
In the Netherlands, the thermochromic/low-e glazing shows an annual energy consumption improvement over clear glass of 22%. This is an increase of 10% over the improvement obtained with low-e glazing only (
Figure 12). When we use these values in combination with reported possible annual CO
2 emission savings of 4.0 Mt, attainable by equipping all buildings in the Netherlands with low-e glazing [
4], we can calculate the possible annual CO
2 emission reduction attributable to the use of combined thermochromic/low-e glazing in the whole Dutch built environment. Hereby, we can conclude that the annual CO
2 emissions in the Netherlands can be reduced by 4.5 Mt if all buildings are equipped with our new adaptive glazing system. The huge ecological impact that the combined thermochromic/low-e glazing can have on the Dutch built environment can be seen when these possible savings are compared to the goals the Dutch government has set for 2030. Here, annual emission reductions for the built environment of 3.4 Mt are targeted [
36].
The economic impact the thermochromic/low-e glazing can have for the individual household in the Netherlands can be calculated from the annual energy savings obtained by simulations. With the obtained annual energy savings for heating in combination with the average energy density and cost price of natural gas in the Netherlands, annual cost savings for gas can be calculated. Additionally, annual cost savings for electricity can be directly calculated, via the obtained combined energy savings for cooling and lighting and the average electricity cost per kWh in the Netherlands. The economic impact here is specifically calculated for a free-standing, fully air-conditioned residential building, with 172 m2 floor area and 25% window façade. With annual energy savings for this type of residential building, for the combination of lighting and cooling, of 1963 kWh, and average electricity costs in the Netherlands of 23 cents/kWh, an individual household can save annually EUR 452 on electricity. Additionally, with annual natural gas savings for heating of 2391 kWh, which equals 245 m3, and an average natural gas price in the Netherlands of 76 cents/m3, annual cost savings of EUR 186 for an individual household can be achieved. This results in total annual savings, for an individual household equipped with combined thermochromic/low-e glazing over clear glass, of EUR 638.
In the literature, it is reported that the properties of a single layer thermochromic coating can be further increased by integrating it into a three-layer antireflective coating stack [
19,
20]. To analyze the potential of further improving the properties of our thermochromic coating by integrating it into such an antireflective coating, we calculated the energy consumption improvement in the Netherlands over clear glass for a thermochromic/low-e glazing, with the same visible transmission as our single layer coating but an increased solar modulation. This resulted in an annual energy consumption improvement of 24% (
Figure 12). Therefore, we see huge potential for further improving the already very good solar properties of our thermochromic coating, since it should be possible to double the improvement the combination of thermochromic/low-e currently has over pure low-e glazing.
4. Conclusions
In this study, we compared the energy-saving potential of three commercially available (low-e, IRB and combined IRB/low-e) and two thermochromic energy-efficient glazing systems developed by our group (thermochromic, and combined thermochromic/low-e) over clear glass. Our energy performance simulation study revealed that the highest energy-saving potential for all systems is in hot climates, where high annual cooling costs can be reduced by lowering the solar heat gain of a window. As soon as heating is required over the year, glazing systems without low-e properties underperform due to increased annual heating costs, in comparison to clear glass. For intermediate climates, a perfect balance between annual heating and cooling costs reduction can be achieved with a double-glazing window, comprising our newly developed adaptive thermochromic glazing and low-e coated glass, where the solar heat gain of the window changes depending on the temperature.
With the obtained results, we can give a recommendation of which type of glazing system to use in each climate region. For hot climates, a combined static IRB/low-e glazing has the best energy performance of all windows. With this type of energy-efficient glazing, a total annual energy consumption improvement over clear glass of between 24% and 34% can be reached. Furthermore, we showed that in cold climates, low-e glazing performs best because of the highest reduction in annual heating costs for this type of glazing; between 20% and 23%. A total annual energy consumption improvement over clear glass of approximately 20% can be reached. In all intermediate regions, where both heating and cooling have a significant impact, the combined thermochromic/low-e glazing has the highest total annual energy consumption improvement, of between 15% and 22%. This type of glazing system combines a high reduction in annual cooling (between 44% and 51%) with a high reduction in annual heating demand (around 20%), and therefore performs best wherever heating and cooling are equally important.
For the Netherlands, we demonstrated that a nationwide annual CO2 emission reduction for the built environment of 4.5 Mt can be achieved if the total building stock is equipped with the new thermochromic/low-e smart window. Additionally, we showed that an individual household with 172 m2 living space and 25% window façade can save up to EUR 638 annually, because of reduced electricity and natural gas consumption, if the building is equipped with the new smart window.
As demonstrated in this study, the newly developed thermochromic coating displays very good solar properties and high energy-saving potential. We are currently working on introducing our single layer thermochromic coating into an interference coating stack, to further optimize the balance between transmission in the visible and solar modulation. We expect to realize an optical improvement that results in a doubling of the energy consumption improvement over pure low-e glazing.
Even though we presented a modeling study which is comparable and eliminates the shortcomings of previous studies, there are still some aspects that can be further improved for a better representation of a real environment. For one, the construction material for walls was not changed for the individual locations, which would be the case in reality; to be able to directly relate the change in energy consumption to the different windows, the change in construction material was left out of this study. Secondly, the hysteresis in switching of the thermochromic material was not taken into account, which can influence the potential impact on energy savings. In future work, we will study the impact of the optical hysteresis on the energy consumption of a residential building. Furthermore, we are currently scaling up our thermochromic coating technology for production of pilot-sized windows, and aim to experimentally validate this study as soon as we have realized this development step.

 ,
, 


