Partial Discharge Behaviour of a Protrusion in Gas-Insulated Systems under DC Voltage Stress


Chair of High Voltage and High Current Engineering, Faculty of Electrical and Computer Engineering, Institute of Electrical Power Systems and High Voltage Engineering (IEEH), Technische Universität Dresden, 01069 Dresden, Germany
*
Author to whom correspondence should be addressed.
†
These authors contributed equally to this work.
Energies 2020, 13(12), 3102; https://0-doi-org.brum.beds.ac.uk/10.3390/en13123102
Submission received: 20 May 2020
/
Revised: 4 June 2020
/
Accepted: 5 June 2020
/
Published: 16 June 2020
(This article belongs to the Special Issue Outdoor Insulation and Gas Insulated Switchgears)
Abstract
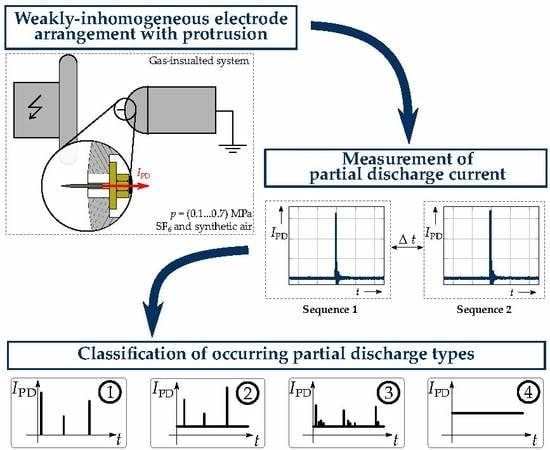
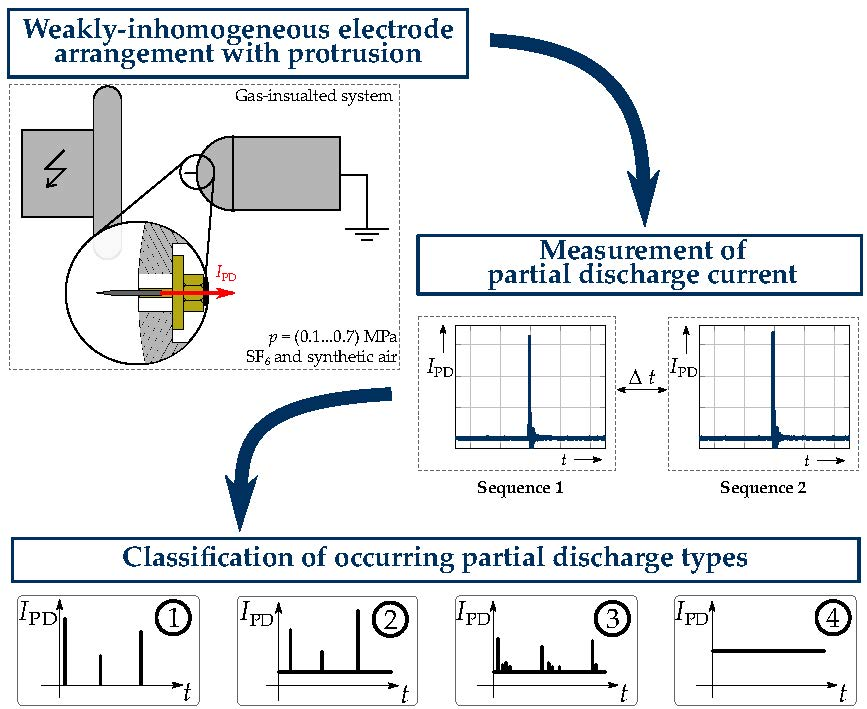
:High reliability, independence from environmental conditions, and the compact design of gas-insulated systems will lead to a wide application in future high voltage direct current (HVDC) transmission systems. Reliable operation of these assets can be ensured by applying meaningful and robust partial discharge diagnosis during development tests, acceptance tests, or operation. Therefore, the discharge behavior must be well understood. This paper aims to contribute to this understanding by investigating the partial discharge behavior of a distorted weakly inhomogeneous electrode arrangement in sulfur hexafluoride (SF6) and synthetic air under high DC voltage stress. In order to get a better understanding, the partial discharge current is measured under the variation of the insulation gas pressure, the gas type, the electric field strength, and the voltage polarity. Derived from this, a classification of the different discharge types is performed. As a result, four different discharge types can be categorized depending on the experimental parameters: discharge impulses, discharge impulses with superimposed pulseless discharges, discharge impulses with superimposed pulseless discharges, and subsequent smaller discharges and pulseless discharges. Concluding suggestions for partial discharge measurements under DC voltage stress are given: recommendations for the necessary measurement time, the applied voltage and polarity, and useful measurement techniques.
1. Introduction
Gas-insulated systems (GIS) have been the state-of-the-art in high voltage alternating current (HVAC) transmission grids since the 1960s [1]. These systems have major advantages compared to air-insulated systems (AIS) like their space-saving design, their independence from environmental conditions, and their higher reliability. These advantages are beneficial for high voltage direct current (HVDC) transmission systems as well. Especially due to the growing importance of renewable energy sources and their integration into the existing power grid, longer transmission lines have to be built. This is economically feasible only by using HVDC technologies. The advantageous space-saving design of GIS can be used, for example, to reduce the size of offshore converter-platforms, to ensure a reliable power transmission in densely populated areas, and to allow building high voltage infrastructure close to protected landscapes due to their low visual impact. Therefore, gas-insulated HVDC systems are a space-saving solution for HVDC substations.
Due to the transition of the electric field, the directed movement of charge carriers, and the accumulation of charge carriers on gas-solid interfaces, the development of gas-insulated HVDC systems is challenging [2,3]. Reliable operation can be ensured, using partial discharge (PD) measurements during type tests, factory acceptance tests, on-site tests, and operation (monitoring). For AC applications, electrical PD measurements using the phase-resolved partial discharge pattern (PRPD) have been well known since the 1960s for various types of defects [4]. Due to the missing phase relation, the procedures and analysis tools used under AC voltage stress cannot be applied directly for DC equipment. Additionally, the directed movement of charge carriers, space-charges in the gas, and accumulated charges at the gas-solid interfaces lead to a significantly different partial discharge behavior under DC voltage stress [5,6,7,8,9,10,11,12]. One major challenge, reported in the literature, is the occurrence of pulseless discharges, which cannot be detected using the conventional methods according to IEC 60270 [13] and ultra-high frequency (UHF) measurements [5,10,11]. Summarizing these challenges, the PD experts stated in the literature that a major problem during PD measurements and analysis under DC voltage stress is the lack of experience [14]. In addition, the physical PD behavior under DC voltage stress is not as well understood as under AC voltage stress, since space charges can accumulate over a long time period. However, a reliable PD diagnosis requires the knowledge of the discharge behavior. Hence, the aim of this investigation is to bridge the gap of knowledge for one typical defect in gas-insulated systems: a protrusion. Therefore, the partial discharge current of a fixed needle in a weakly inhomogeneous electric field is measured. The measurements reveal four different discharge types that may occur depending on the electric field strength, gas pressure, and voltage polarity.
The insulating gas sulfur-hexafluoride (SF6) has been used as a dielectric in gas-insulated systems since the early 1960s. Due to the high global warming potential (GWP) of this gas and the related political will to reduce the emission of fluorinated gases, alternative gases with a low GWP come to the fore of manufacturers and customers [15,16,17,18]. These gases can be pure natural gases or mixtures of natural gases, like synthetic air. Furthermore, these alternatives can be gas-mixtures with highly electron affine components in order to improve their dielectric behavior. In this contribution, the discharge behavior of SF6 is compared with the behavior of pressurized synthetic air as one example for an alternative gas.
2. Physical Fundamentals
Comprehensive knowledge about the physical fundamentals of the discharge formation is necessary, in order to understand the different discharge phenomena observed in this investigation.
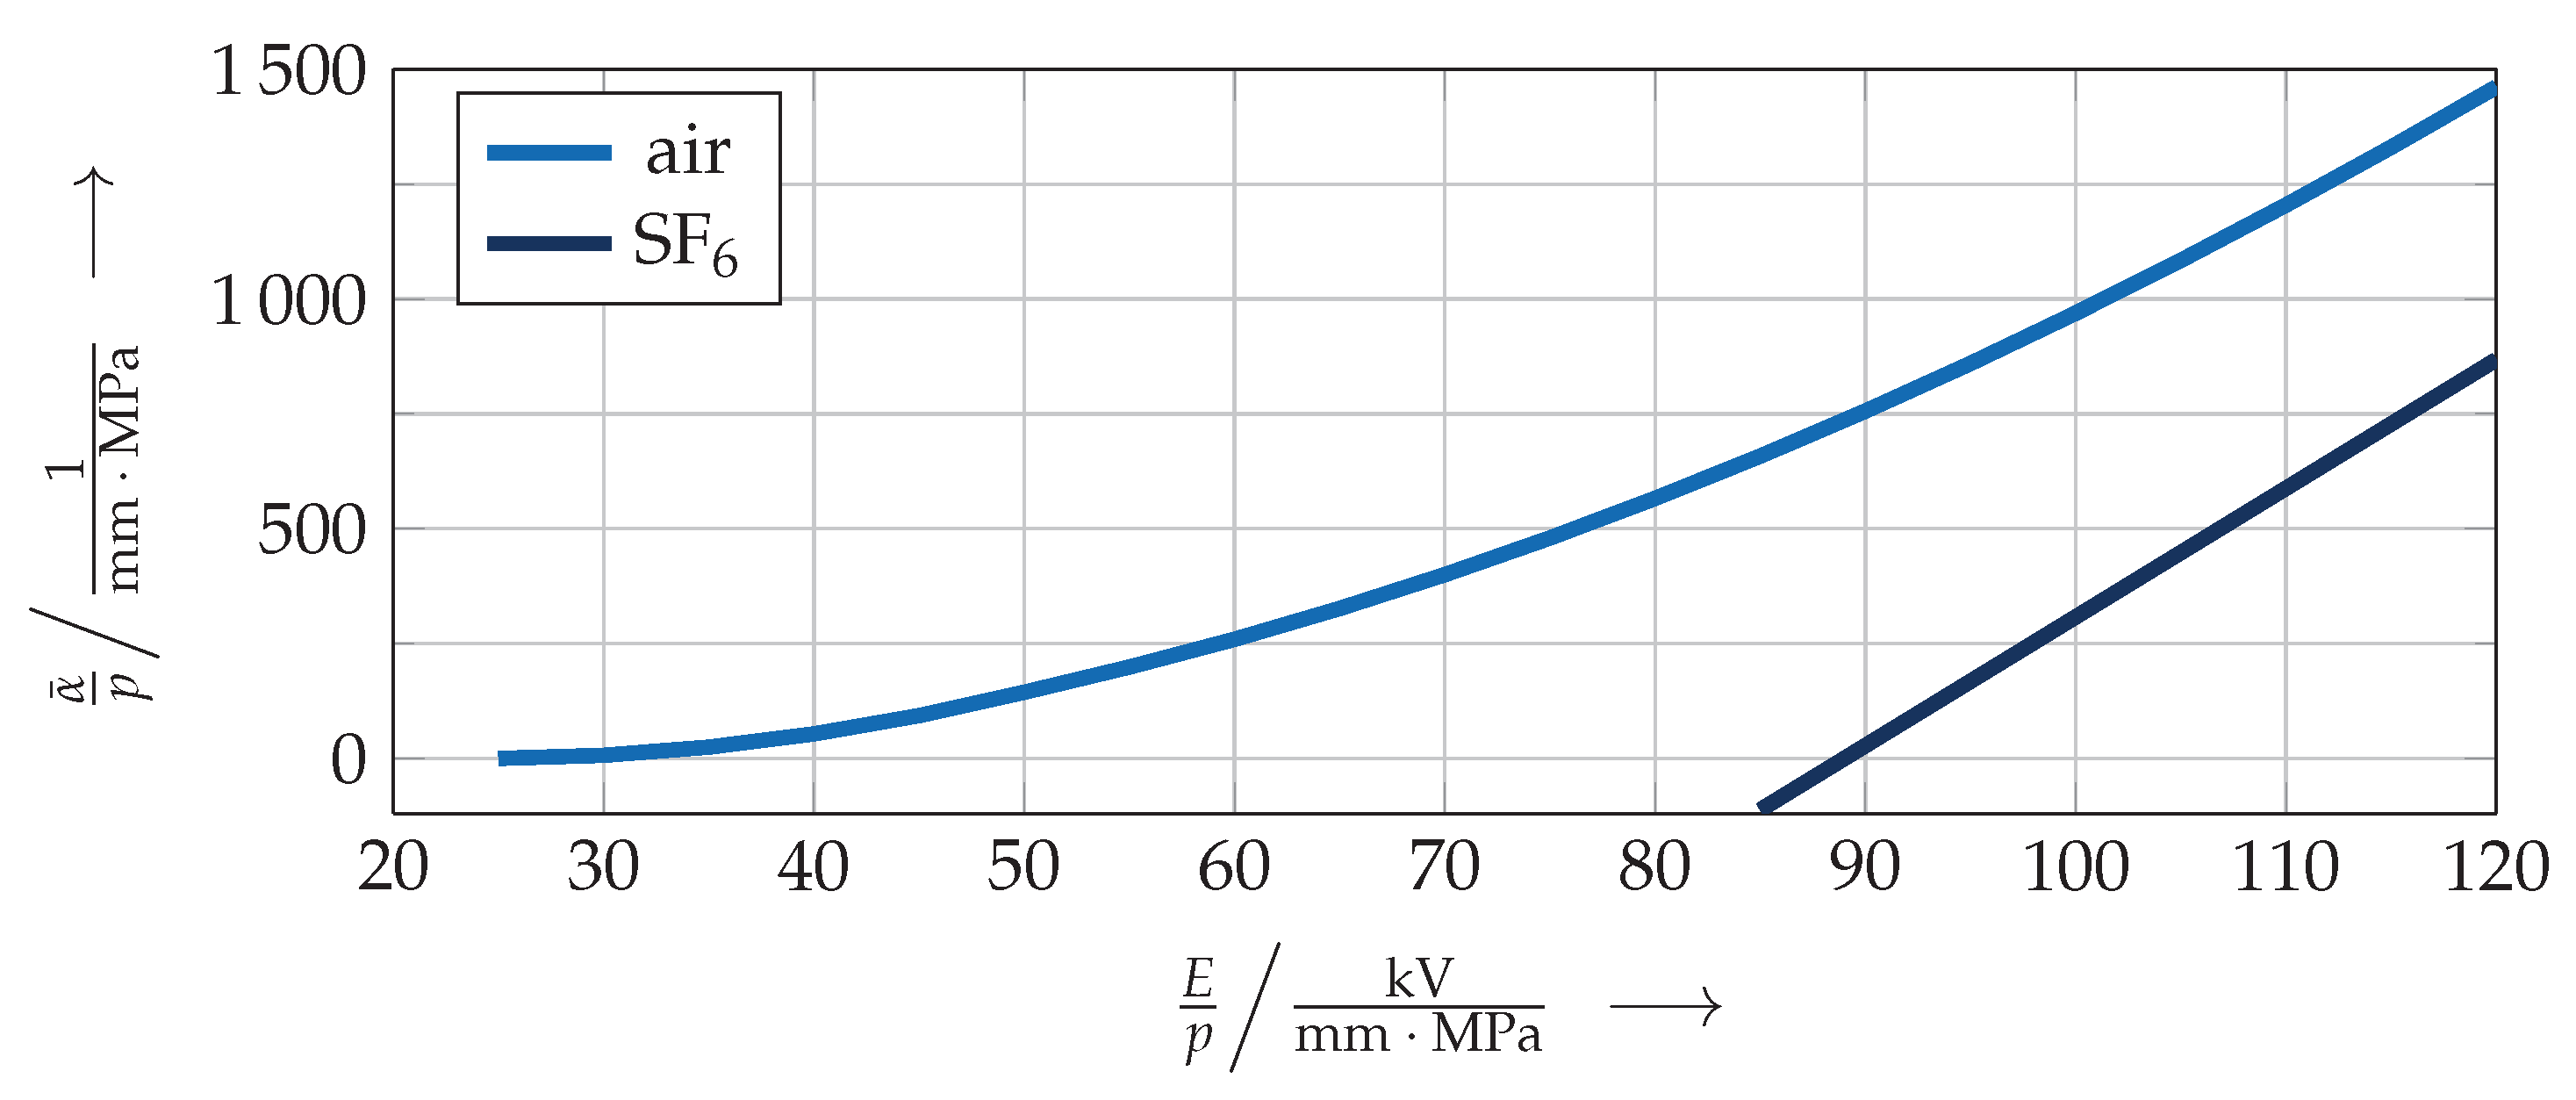
A necessary requirement for the discharge inception is the presence of a starting electron. It can be emitted from the cathode [19] or by electron detachment of gas molecules. This detachment mainly occurs due to cosmic radiation [20,21]. The starting electron will be accelerated in the stationary electric field. As soon as the kinetic energy, absorbed from the electric field, is high enough, ionization due to the collision with other molecules or ions takes place. Newly generated electrons are again accelerated in the electric field. The number of ionization processes per electron and per unit of distance is described by the ionization coefficient . At the same time, electrons are attached to molecules or ions. If more electrons are generated than attached to ions or molecules (), an electron avalanche develops. Hence, the main parameter characterizing insulating gases is the effective ionization coefficient . If the effective ionization coefficient becomes , the number of free electrons in the gas increases like an avalanche. The ionization coefficient depends on the type of insulating gas [22], mainly determined by its electron affinity. For example, the electron affinity of oxygen is lower than that of SF6. Nitrogen has no ability to attach free electrons. Hence, the electrical strength of synthetic air is lower than that of SF6. The effective ionization coefficient can be calculated according to Equation (1) for SF6 and according to Equations (2) and (3) for atmospheric air depending on the electric field strength E and the gas pressure [21,23]. Since the dielectric strength of an insulating gas depends on its gas density, is related to p20 °C, the gas pressure at 20 °C, in order to specify this density dependence. It is assumed that the discharge behavior of pressurized synthetic air and pressurized atmospheric air is comparable.
According to the physics, the ionization coefficient of SF6 is considerably lower than that of synthetic air (Figure 1). This leads to the assumption that the inception and growth of the PD avalanches will show remarkable differences between the insulating gases. Due to the significantly higher slope of the effective ionization coefficient of SF6 compared to air in the zero crossing (), the discharge behavior of SF6 is expected to be much stronger, dependent on small changes of the electric field strength.
The charge carriers, electrons and ions, generate drift in the electric field with a certain velocity, which is inversely proportional to the gas pressure [20]. Due to their higher mass, the mobility of positive and negative ions is significantly lower than the mobility of electrons (Table 1).
The differences in the drift velocities of electrons and ions lead to a concentration of electrons in the avalanches’ head, whereas the generated ions can be considered as remaining at their position. If the number of electrons in the avalanches’ head exceeds the critical number of , the electric field strength of the avalanche, in addition to the background field, is sufficiently high to initiate photoionization, and thus, additional electron avalanches in the vicinity of the first discharge channel are started. This discharge process is well known as streamer discharge [30,31]. If streamer inception takes place, the electrical field strength exceeds the gas density dependent dielectric strength of the insulating gas in a certain region, the so-called critical volume.
In SF6, the discharge inception is equivalent to the streamer inception [21]. In addition to this single streamer discharge, it is reported in the literature that one PD impulse with a high magnitude can be followed by several impulses with a lower magnitude [32,33]. These subsequent PD events are generated in the channel of the first streamer [32].
The charge carriers, generated by the streamers, can form a stable space charge, which significantly influences the electric field strength in this region. If the number of charges generated is equivalent to the number of charges drifting off from the space charge region, a constant pulseless direct current can be measured, known as glow discharge. It is evident that a streamer discharge might be superimposed on this glow discharge, if the space charge region becomes instable [21].
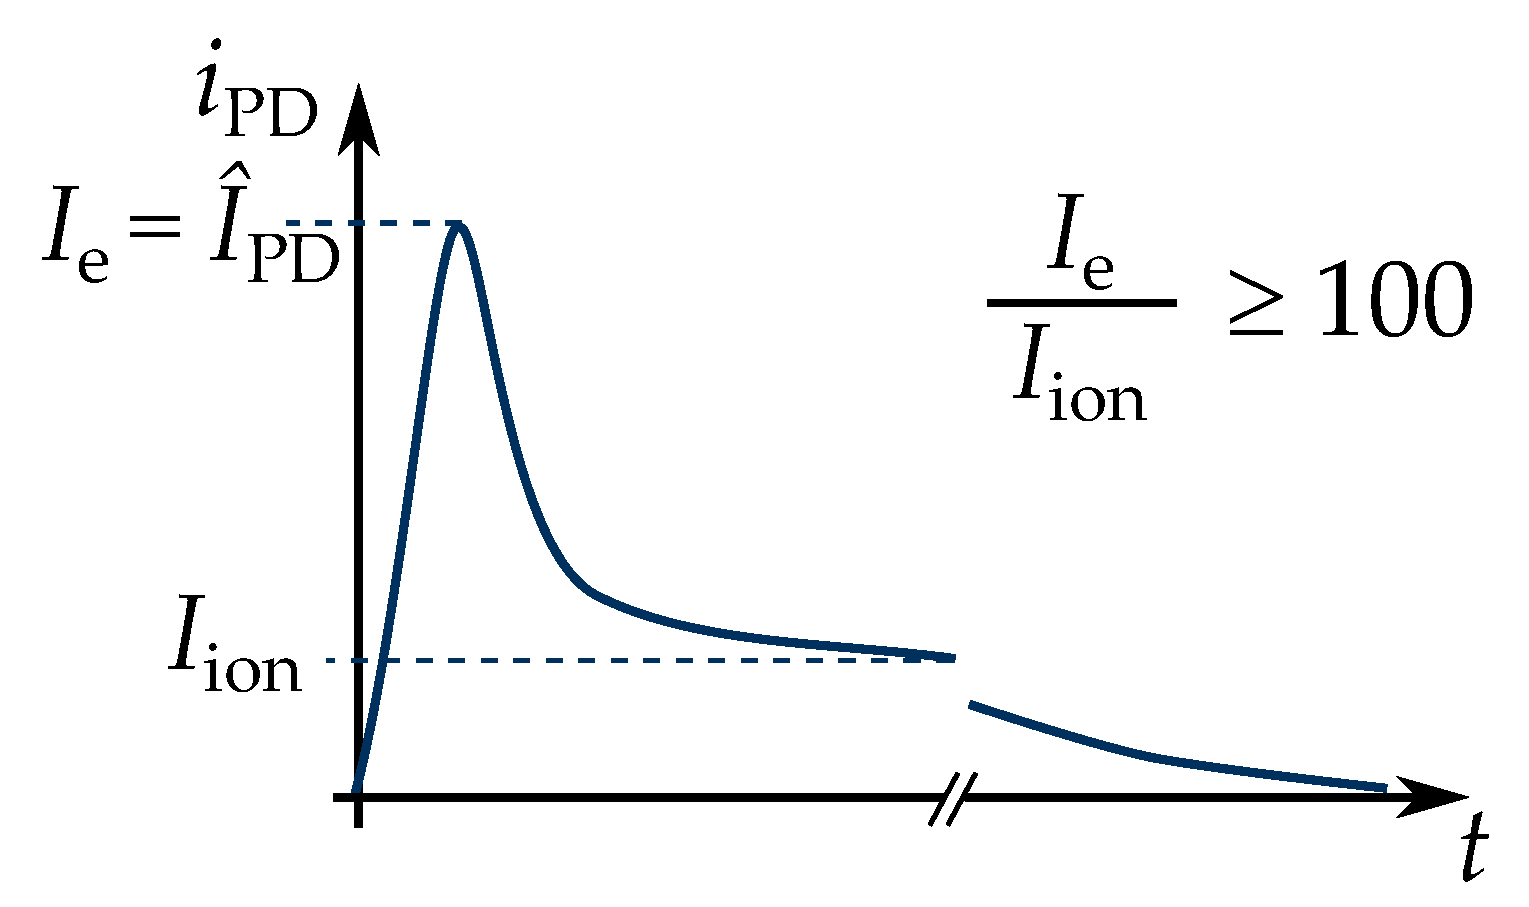
The described charge carrier movement in the electric field can be measured as a current (Figure 2). This current consists of a fast rising electron current , representing the growth of the electron avalanche, and a slow ion current , representing the ion drift. According to the literature [33,34], the electron current is significantly higher than the ion current.
To the authors’ knowledge, there is no comprehensive study of the partial discharge behavior of a protrusion in gas-insulated systems under DC voltage stress with respect to PD current measurements. For this reason, in this contribution, the electron current and the ion current are measured depending on the polarity, the applied voltage, and the gas pressure. It is expected that a classification of the occurring PD types can be derived from the measurements considering the current amplitudes and the time differences between subsequent discharge impulses. This classification would provide a basis for a meaningful interpretation of PD measurements in gas-insulated DC systems. A comparison of the results obtained in SF6 with measurements in pressurized synthetic air will give an outlook for future research focusing on alternative insulating gases under DC voltage stress.
3. Experimental Setup
The experimental setup was located in a completely shielded room in order to achieve a high signal-to-noise-ratio (SNR), necessary for the measurement of low currents.
3.1. Generation of High DC Voltage with Low Ripple
Investigating the discharge physics under DC voltage stress requires a DC voltage with low ripple. This is necessary because a ripple factor of a few percent can lead to a phase dependent concentration of PD impulses in the voltage maximum and would therefore influence the PD behavior significantly [35].
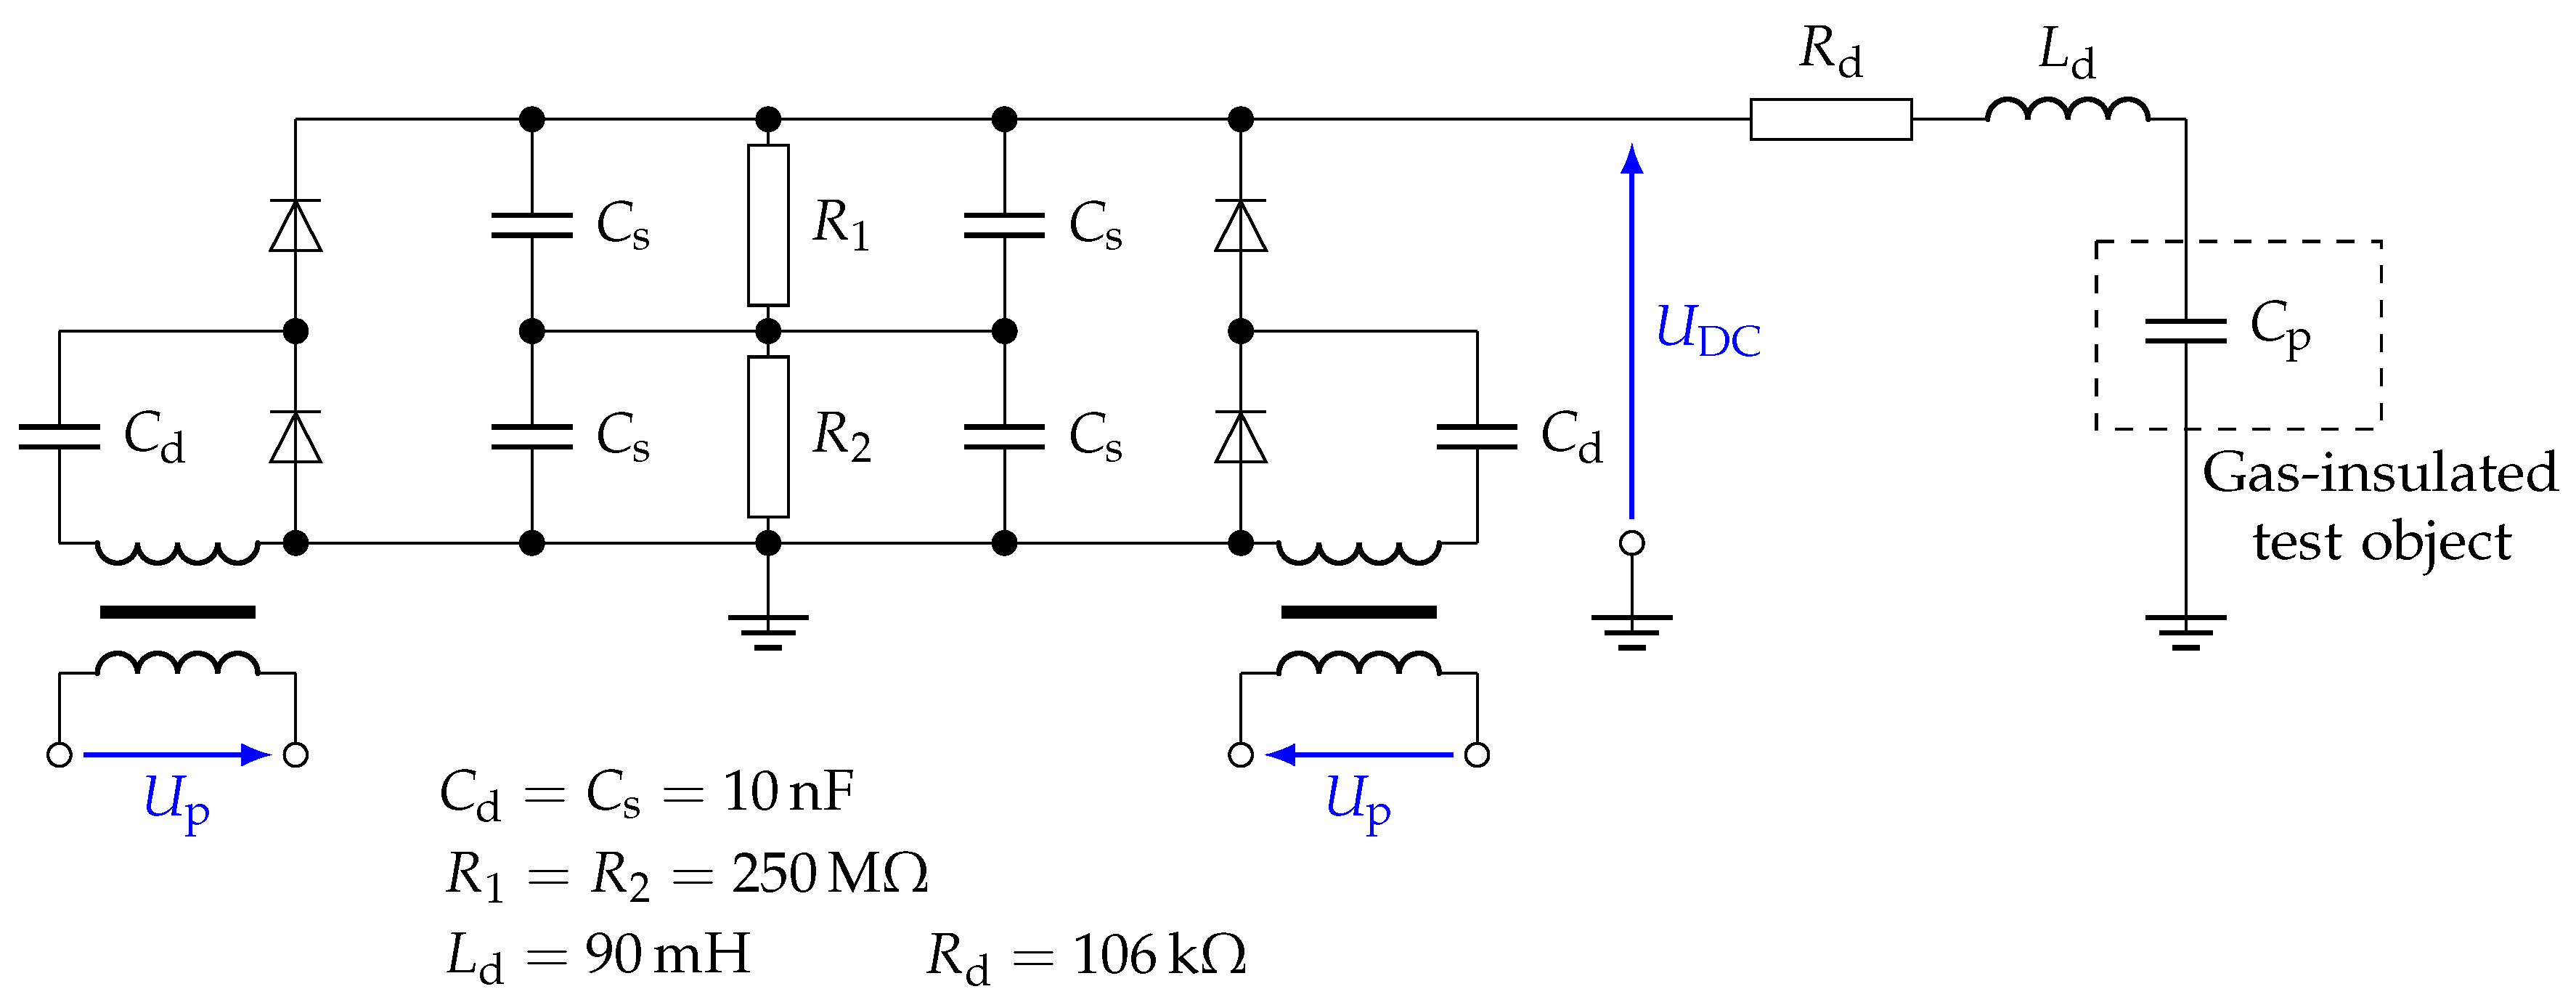
For this reason, a symmetric Greinacher voltage doubler circuit (Figure 3) was used to generate high DC voltages [4]. It was fed with a power frequency = 50 Hz and loaded by a current I. In contrast to common Greinacher circuits with a ripple of (Equation (4)), the smoothing capacitors were charged every half-cycle, leading to a lower ripple according to Equation (5).
Hence, the ripple could be reduced by a factor of two. In addition, a high smoothing capacitance was used to further reduce the voltage ripple. In contrast to usual realizations of the symmetric Greinacher circuit [4], two high voltage transformers with a primary voltage shifted by 180° were used in this investigation.
Due to the maximum reverse voltage of the rectifiers used, the maximum output voltage of this voltage doubler circuit was limited to = ±250 kV. The measured voltage ripple was approximately 250 V at its maximum ( ≤ 0.1%). The voltage measurement was performed using a calibrated ohmic voltage divider with a Highvolt MU17 peak voltmeter. A resistor and an inductance were placed in between the DC voltage supply and the test object in order to limit the current in case of a breakdown.
3.2. Electrode Arrangement and Test Vessel
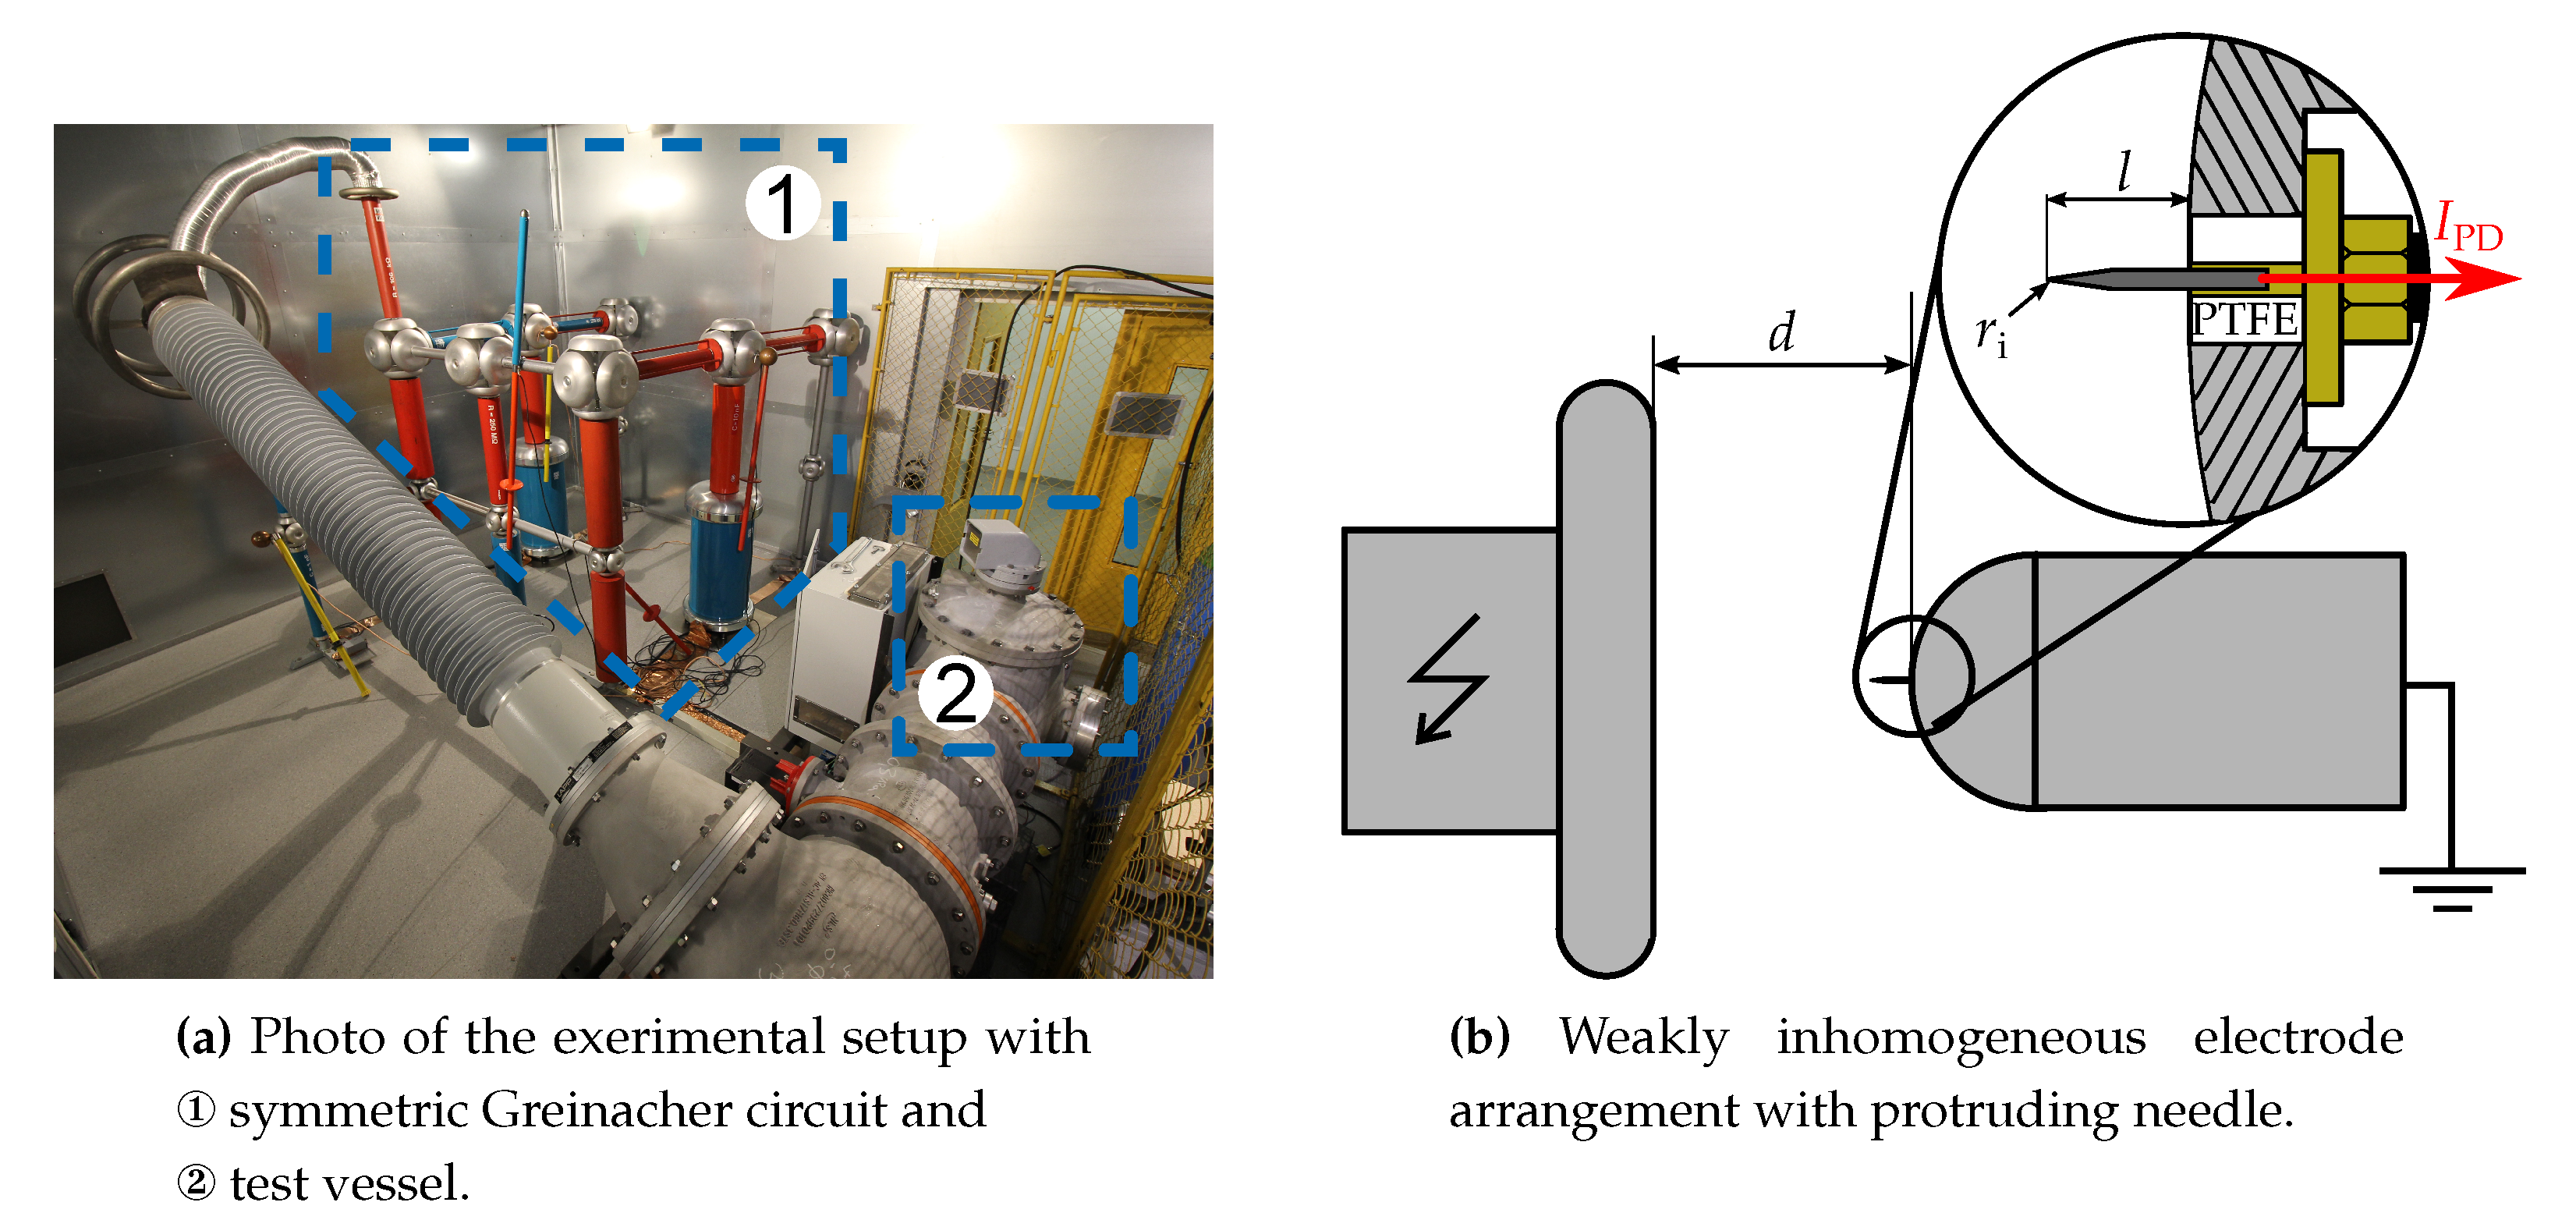
The high DC voltage supply was connected to the gas-insulated test vessel using a SF6-air bushing (Figure 4a). The test vessel used was a commercially available part of a 420 kV GIS with a sandblasted encapsulation. It allowed investigations up to an absolute gas pressure of 0.7 MPa.
In order to model the electric field of a real gas-insulated system, a weakly inhomogeneous electrode arrangement made of aluminum was placed inside the test vessel (Figure 4b). The gap distance between the half-sphere and the plate could be varied between = (0...100) mm. Hence, the degree of homogeneity could be varied from 0.88 to 0.37. For the investigations presented in this paper, the gap distance was fixed at = 60 mm. This resulted in , which was close to real applications [33]. In order to investigate the PD behavior of the insulating gases, a protrusion was placed in the middle of the half-sphere. The used needles were made of 100Cr6 steel and had a tip radius of ≈ 22 µm. The length of the needle was = 5 mm. To measure the partial discharge current , the needle was separated from the grounded sphere using an insulating PTFE ring and directly connected to an SMA adapter. The polarities mentioned in this investigation refer always to the polarity of the protrusion.
3.3. Measurement Setup
Since the expected PD current consisted of a pulseless current with superimposed impulse currents, the magnitude and frequency content of the whole signal were very broad. Hence, it was reasonable to use two different measurement setups.
3.3.1. Measurement of Impulse Currents
The measurements were performed using a high bandwidth oscilloscope-type Teledyne LeCroy WavePro 735 ZiA with an analogue bandwidth of 3.5 GHz, a maximum sample rate of 20 GS/s (using four channels), and a memory of 128 MSa per channel to allow long-term, high bandwidth measurements.
In order to get a deeper understanding of the partial discharge peak current and the time differences between subsequent impulses, a high frequency current measurement was necessary. Hence, the needle electrode was directly connected to the oscilloscope using a low loss coaxial cable and a terminating resistor = 50 Ω in parallel to the input impedance of the oscilloscope used . Even though the used measurement device had a high analogue bandwidth, the measurement circuit (Figure 5a) led to a frequency dependent measurement impedance, especially due to the capacitance of the coaxial cable used (Figure 5b).
Since the partial discharge current was calculated using Equation (6), the frequency dependence of the measurement circuit was not taken into account. This led to an amplitude error in the presented partial discharge peak currents, if their frequency content exceeded several megahertz. Due to the unknown frequency content of the partial discharge current, this approach seemed appropriate and was already used in other different publications [34,36]. Furthermore, one has to mention that the electrode arrangement influenced the measured PD current as well, mainly due to the stray capacitances between the protruding needle, the ground/high-voltage electrode, and the encapsulation of the test vessel [37]. Because the influence of these capacitances could not be easily quantified, they were neglected in this investigation.
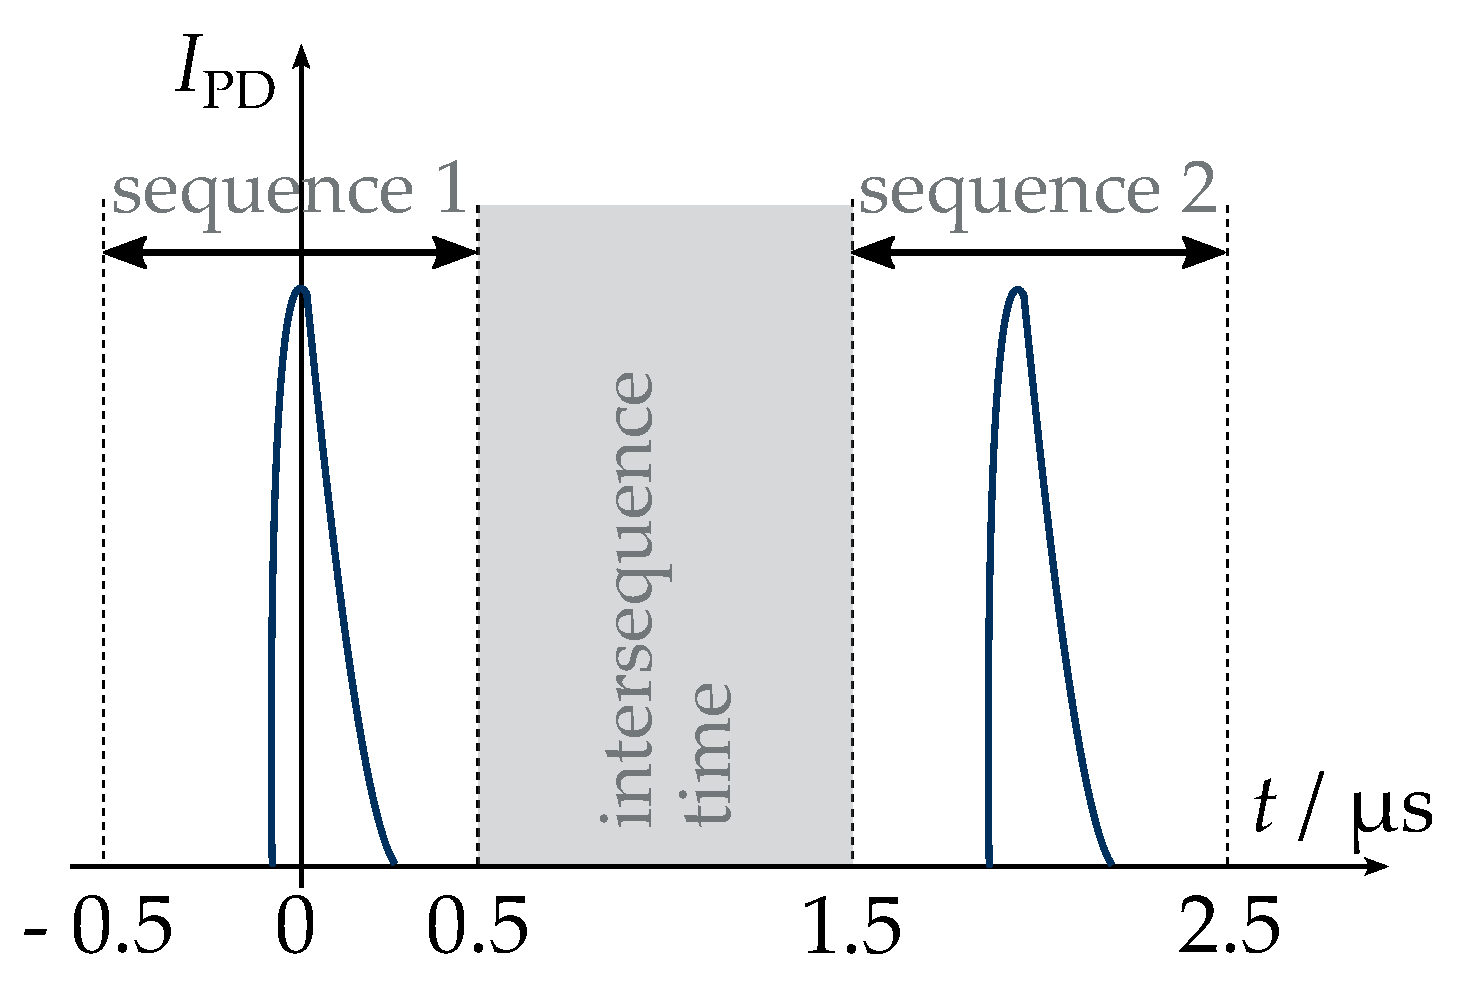
Each occurring PD impulse triggered a 1 µs long sequence. The minimum time difference between two subsequent sequences was = 1 µs according to the manufacturer. If a PD occurred in the dead time between two sequence recordings, it could not be detected.
Not only the partial discharge current amplitudes were investigated, but also the time differences between subsequent impulses. Since it was expected that they could occur with a rather high time difference of several milliseconds to seconds, the sequence mode of the oscilloscope was used (Figure 6) [38].
3.3.2. Measurement of Pulseless Currents
Even though the pulseless PD current could be measured with the oscilloscope as well, it was, in terms of the expected high amplitude differences between the impulse current and the pulseless current (Figure 2), reasonable to measure the smaller pulseless currents separately. Therefore, a transimpedance amplifier was connected to the needle electrode instead of the oscilloscope. Two low-pass filters with a cut-off frequency of approximately 4 Hz and two amplifiers allowed precise measurements of the pulseless PD current with a high SNR in the range from 0.1 nA to 100 µA. The data logger was connected via Bluetooth to the measurement computer and transmitted the mean value of the measured direct current every second. The operational readiness of this measurement device was already proven by other investigations [3,39].
4. Test Execution and Data Evaluation
4.1. Test Execution
In order to understand the partial discharge behavior in dependence of the electric field strength, the investigations were performed at different voltage levels, starting from the inception voltage. Due to the missing general accepted definition of the inception voltage [38,40], the voltage with the first measurable partial discharge current impulse was determined as inception voltage in this investigation (cf. Section 5.1). The investigations were performed at multiples of this voltage at absolute gas pressures of = 0.1 MPa, 0.5 MPa and 0.7 MPa. The dew point of the SF6 used was lower than −35 °C with a purity of at least 99%. The experiments in synthetic air were carried out at an absolute gas pressure of = 0.5 Mpa. The gas consisted of 20.5% oxygen (O2) in nitrogen (N2) according to the manufacturer. Its moisture content was less than 2.0 ppmmol.
Studying the impulse currents, the number of recorded sequences (each with a duration of 1 µs) depended on the time difference between subsequent impulses. For the measurements at inception voltage, five-hundred sequences were recorded and analyzed; if the applied voltage was higher than the inception voltage, 3000 to 4000 sequences were examined. An exception was the investigations at positive polarities of the protrusion at inception voltage: at higher gas pressures of = 0.5 MPa and = 0.7 MPa, only ten sequences could be recorded due to the long time difference between two impulses.
The studies of the pulseless partial discharge current were carried out with a stepped voltage rising test. At each step, the voltage was kept constant for 5 min, and the mean value of the PD current measured within this period was evaluated.
The needle electrodes used were changed after every test execution in order to avoid the influence of changing tip radii on the PD behavior. More precisely, one needle was used for the investigations at one polarity and one pressure value, but different voltage levels.
4.2. Data Evaluation
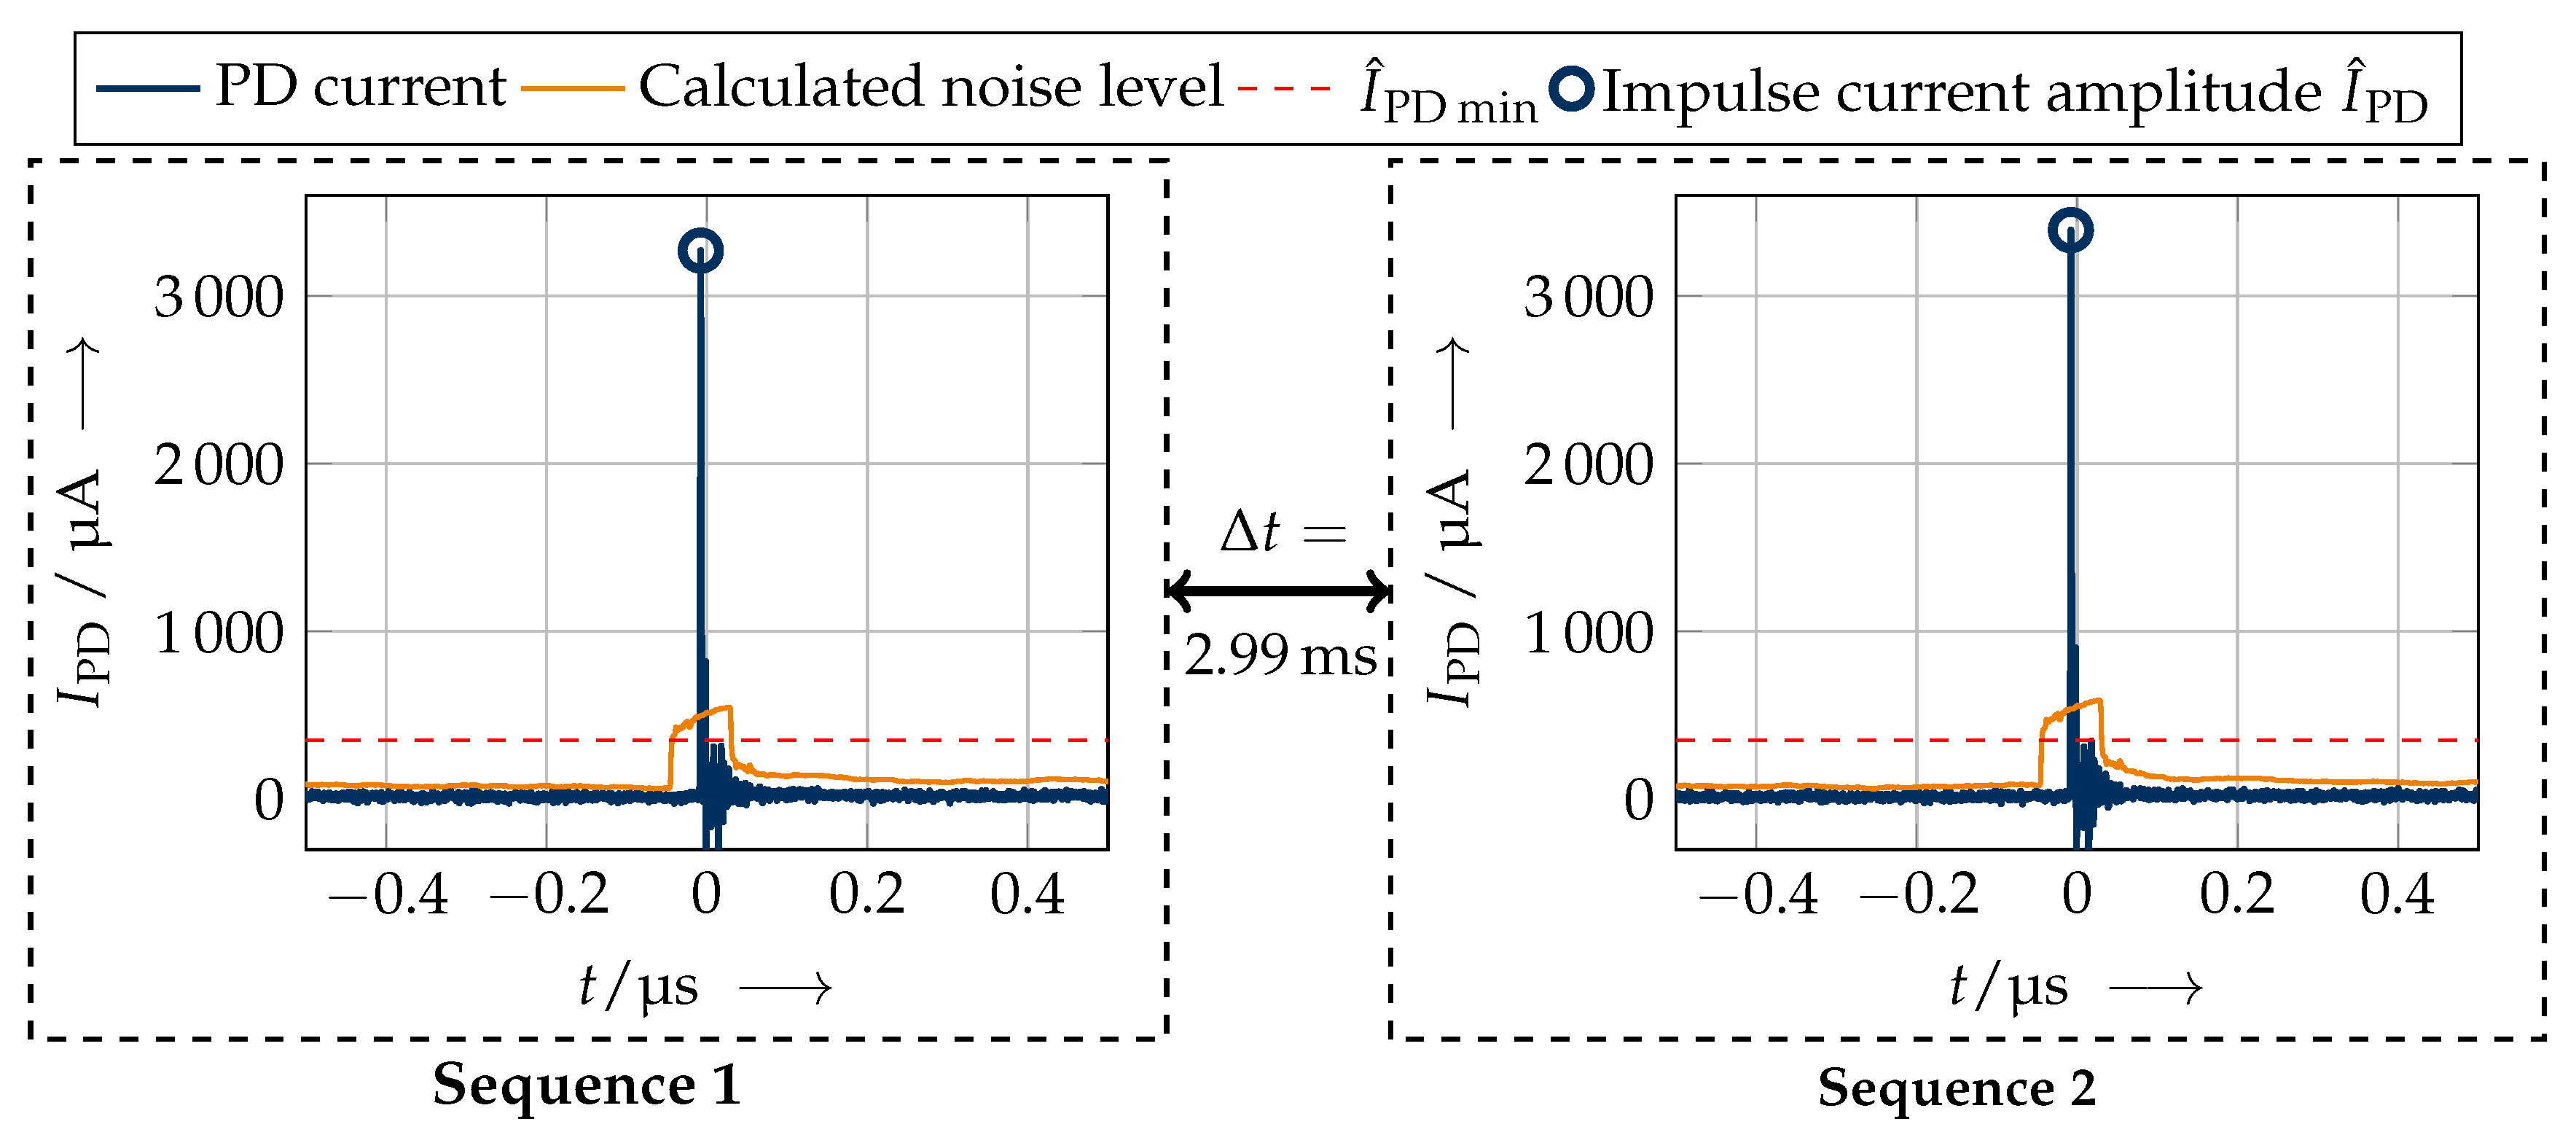
In the following, the evaluation of the data acquired using the oscilloscope is discussed, to make the presentation of the results more comprehensible. The recorded sequences with 20,000 data points each were evaluated individually in MATLAB® to determine the impulse current amplitude and the time difference between subsequent sequences (Figure 7). In this investigation, the time differences between two sequences were a measure for the time differences between subsequent impulses, since the length of one sequence of 1 µs was in most cases negligible with respect to the time difference >> 1 µs. If one sequence contained more than one partial discharge impulse, this would be evaluated separately.
To achieve a meaningful data evaluation, the following definitions were made and applied to every recorded sequence: A noise level was calculated with a moving average out of 1500 data points multiplied by a factor of five. A PD current impulse needed to be larger than this calculated noise level and higher than a defined minimum impulse amplitude to be evaluated as a PD event (Table 2).
The parameter was determined depending on the measured impulse current amplitudes, since the noise level was dependent on the chosen measurement range of the oscilloscope. If one sequence contained more than one single impulse, the definition of a minimum time difference between subsequent impulses in one sequence was necessary, to avoid the oscillations following an impulse being evaluated as another PD impulse.
5. Results
Following, the measurement results are presented. As a summary, a classification of the occurred partial discharge phenomena is derived that helps to improve the understanding and interpretation of PD measurement at a protrusion under DC voltage stress. Therefore, the impulse current amplitude , the time difference between two subsequent sequences , and the pulseless partial discharge current were analyzed in dependence of the gas pressure and the applied voltage.
5.1. Inception Voltage (Voltage Rising Test)
In order to determine the inception of current impulses and the pulseless PD current in dependence of the polarity of the protrusion and the gas pressure, a voltage rising test (VRT) was performed (Figure 8). The rate of voltage increase was set to 0.5 kV · s−1.
The measurements determined different voltages for the inception of impulse currents and pulseless PD currents. At a negative protrusion, these voltages were very similar. Only slight differences occurred due to measurement uncertainties and the statistical behavior of the discharge inception. At a positive protrusion, the inception of pulseless PD currents took place at higher voltages than the inception of current impulses. That led to the conclusion that a pulseless partial discharge current, probably a superposition of many small electron avalanches, was superimposed on the PD impulses and emerged in dependence of the polarity and the electric field strength.
The inception voltage of the current impulses at a positive protrusion was almost twice the inception voltage determined for a negative protrusion. These differences could be explained with the different supply of starting electrons in dependence of the polarity of the protrusion. Due to field emission processes from the cathode, more electrons were present in front of the negative protrusion [19]. The starting electrons at the positive protrusion had to be generated by collision detachment of negative ions close to the needle electrode [38]. Another fact influencing the growth of a PD impulse in the vicinity of a protrusion was the direction of movement of electrons and ions. Electrons at a positive protrusion were accelerated in the direction of the protrusion, whereas electrons at a negative protrusion were accelerated in the direction of the oppositely charged electrode. This underlined the polarity dependencies. The changing gas pressure had no influence on the described polarity effects.
An increased gas pressure led to an increased inception voltage for both polarities, which corresponded to the assumptions derived in the Physical Fundamentals Section. The effective ionization coefficient decreased with an increasing gas pressure (Figure 1).
In the following sections, the presented results always refer to the inception of PD current impulses for each polarity-pressure combination, which was thus determined as the inception voltage in this investigation.
5.2. Partial Discharge Impulse Current
In the following, the investigations of the PD current impulses, in particular the impulse current amplitude and the time difference between subsequent sequences , are described. The investigation of the positive protrusion could only be carried out with a limited voltage, since higher voltages were too close to the breakdown voltage with a high risk of damaging the measurement equipment.
5.2.1. Amplitude of Partial Discharge Impulses
The amplitude of the partial discharge impulses depended on the polarity of the protrusion, the gas pressure, and the electric field strength (Figure 9).
In principle, a higher gas pressure led to a lower amplitude of the impulse current. The amplitude of the impulse current was in the same range for both polarities. For negative polarity of the protrusion and high gas pressures ( ≥ 0.5 MPa), the partial discharge current amplitudes remained almost constant. At a gas pressure of 0.1 MPa, an increased voltage led to an increase of the amplitude of the impulse current in one order of magnitude. If the voltage was increased further up to a voltage of , no current impulses could be measured any longer, whereas the measurement with the transimpedance amplifier was still showing a pulseless current (cf. Section 5.3). Obviously, the partial discharge physics had changed. It could be assumed that a pulseless glow discharge built up at the protrusion. In the investigated pressure-voltage range, this behavior could only be observed under a gas pressure of 0.1 MPa and a negative polarity of the protrusion.
When increasing the voltage at a positive protrusion and a gas pressure of 0.5 MPa, a significant increase of the amplitude of the impulse current could be measured.
5.2.2. Time Difference between Subsequent Sequences
The observed time differences between subsequent sequences varied in a huge range between a few microseconds and several minutes (Figure 10). The scatter for almost every voltage-pressure constellation was rather high. Due to the breakdown danger, it was not possible to perform measurements at 0.7 MPa for a positive protrusion.
In general, the time differences between subsequent sequences at a positive protrusion were smaller than at a negative one, and a higher voltage led to a decreased time between subsequent sequences. At a gas pressure of 0.1 MPa, a higher voltage led to a higher time difference between subsequent impulses. The space charge in front of the protrusion became more stable, preventing the inception of further impulses. Above , no impulses could be measured any longer at the negative protrusion. As known from the measurements under Section 5.3, only a pulseless current occurred. No statement can be given for a positive protrusion above , since the voltage could not be increased further due to the danger of a breakdown. At a positive protrusion and a gas pressure of 0.5 MPa, a remarkable change of the PD behavior could be observed, when increasing the voltage from to : the amplitude of the impulse current increased by one order of magnitude (cf. Figure 9), whereas the time between subsequent sequences decreased by approximately seven orders of magnitude (Figure 10). Considering the time dependent PD current (Figure 11) at inception voltage, only one small current impulse could be measured per sequence (Figure 11a); whereas at , one high current impulse in the range of several milliamperes was followed by several small current impulses with an amplitude of several hundred microamperes (Figure 11b).
Every recorded current impulse was followed by smaller impulses. The time differences between the first high impulse and the subsequent smaller impulses was in the range of several hundred nanoseconds (Figure 11c); its minimum was defined according to Table 2. A higher gas pressure led to lower time differences. At a gas pressure of 0.7 MPa, these subsequent impulses already occurred at inception voltage, whereas at gas pressures of 0.1 MPa and 0.5 MPa, this behavior could only be observed at twice the inception voltage. At gas pressures of 0.1 MPa, only approximately 5% of the recorded sequences contained these subsequent impulses.
This transition from a streamer discharge to a streamer discharge with subsequent impulses was in accordance with the literature [6,32,33,38]. The subsequent impulses were probably generated in the discharge channel of the first discharge streamer. Due to the present space charge of the first discharge, the critical volume decreased, leading to a smaller amplitude of the subsequent impulses [32]. This behavior occurred mainly at a positive protrusion due to the different drift velocities of ions and electrons (cf. Table 1), resulting in a different space charge distribution compared to a negative protrusion.
At a negative protrusion and gas pressures ≥ 0.5 MPa, the time difference between subsequent sequences decreased by three orders of magnitude (Figure 10), and the amplitude of the impulses remained almost constant with increasing voltage (Figure 9). A behavior such as under positive voltage could only be observed for less than one percent of the recorded sequences at higher gas pressures ( ≥ 0.5 MPa). The occurrence of these subsequent impulses at a negative protrusion became more probable with higher voltages.
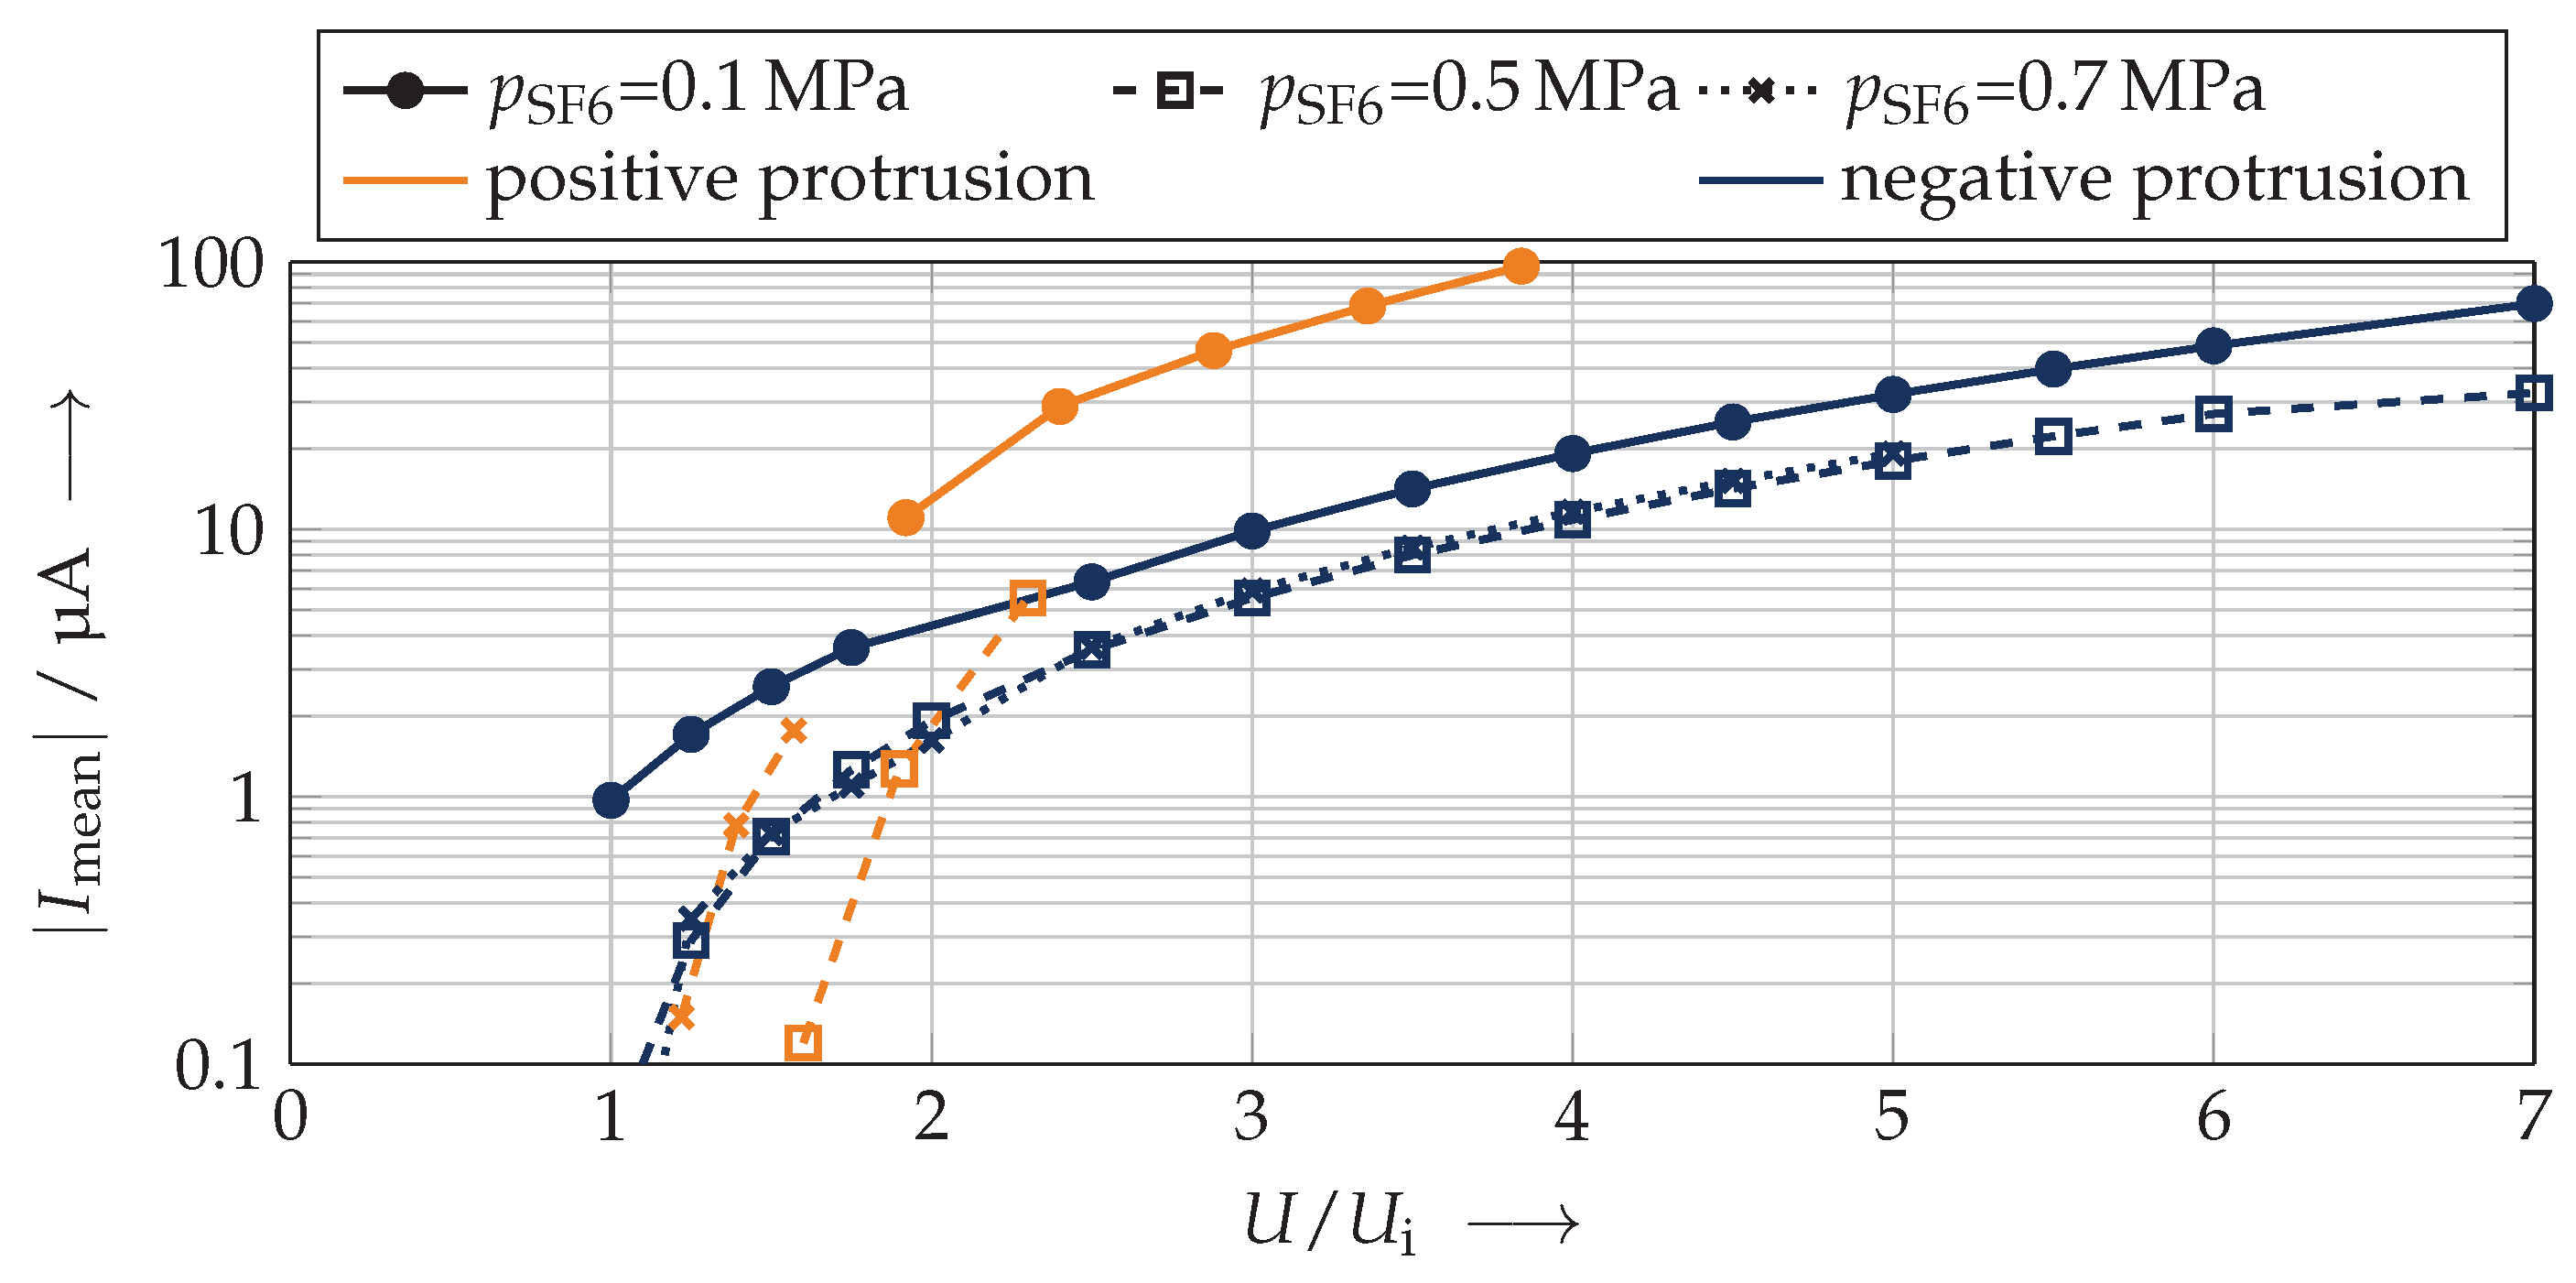
5.3. Pulseless Partial Discharge Current
Measurements with the transimpedance amplifier showed the pulseless direct current share of the discharges (Figure 12).
This current was mainly related to the movement of slow positive and negative ions, which drifted along the electric field lines. The amplitude of the pulseless PD current was magnitudes below the impulse current amplitudes. As described in Section 5.1, the inception of the pulseless current was dependent on the polarity of the protrusion. At a negative protrusion, pulseless currents and impulse currents incepted at once at the same voltage during a VRT; whereas at a positive protrusion, the pulseless current incepted at almost twice the inception voltage of the impulse current. An increased voltage led to a higher pulseless PD current, regardless of the polarity of the protrusion and the gas pressure. A higher gas pressure led to a lower pulseless partial discharge current, but the differences at a negative protrusion were less pronounced compared to a positive protrusion.
6. Discussion
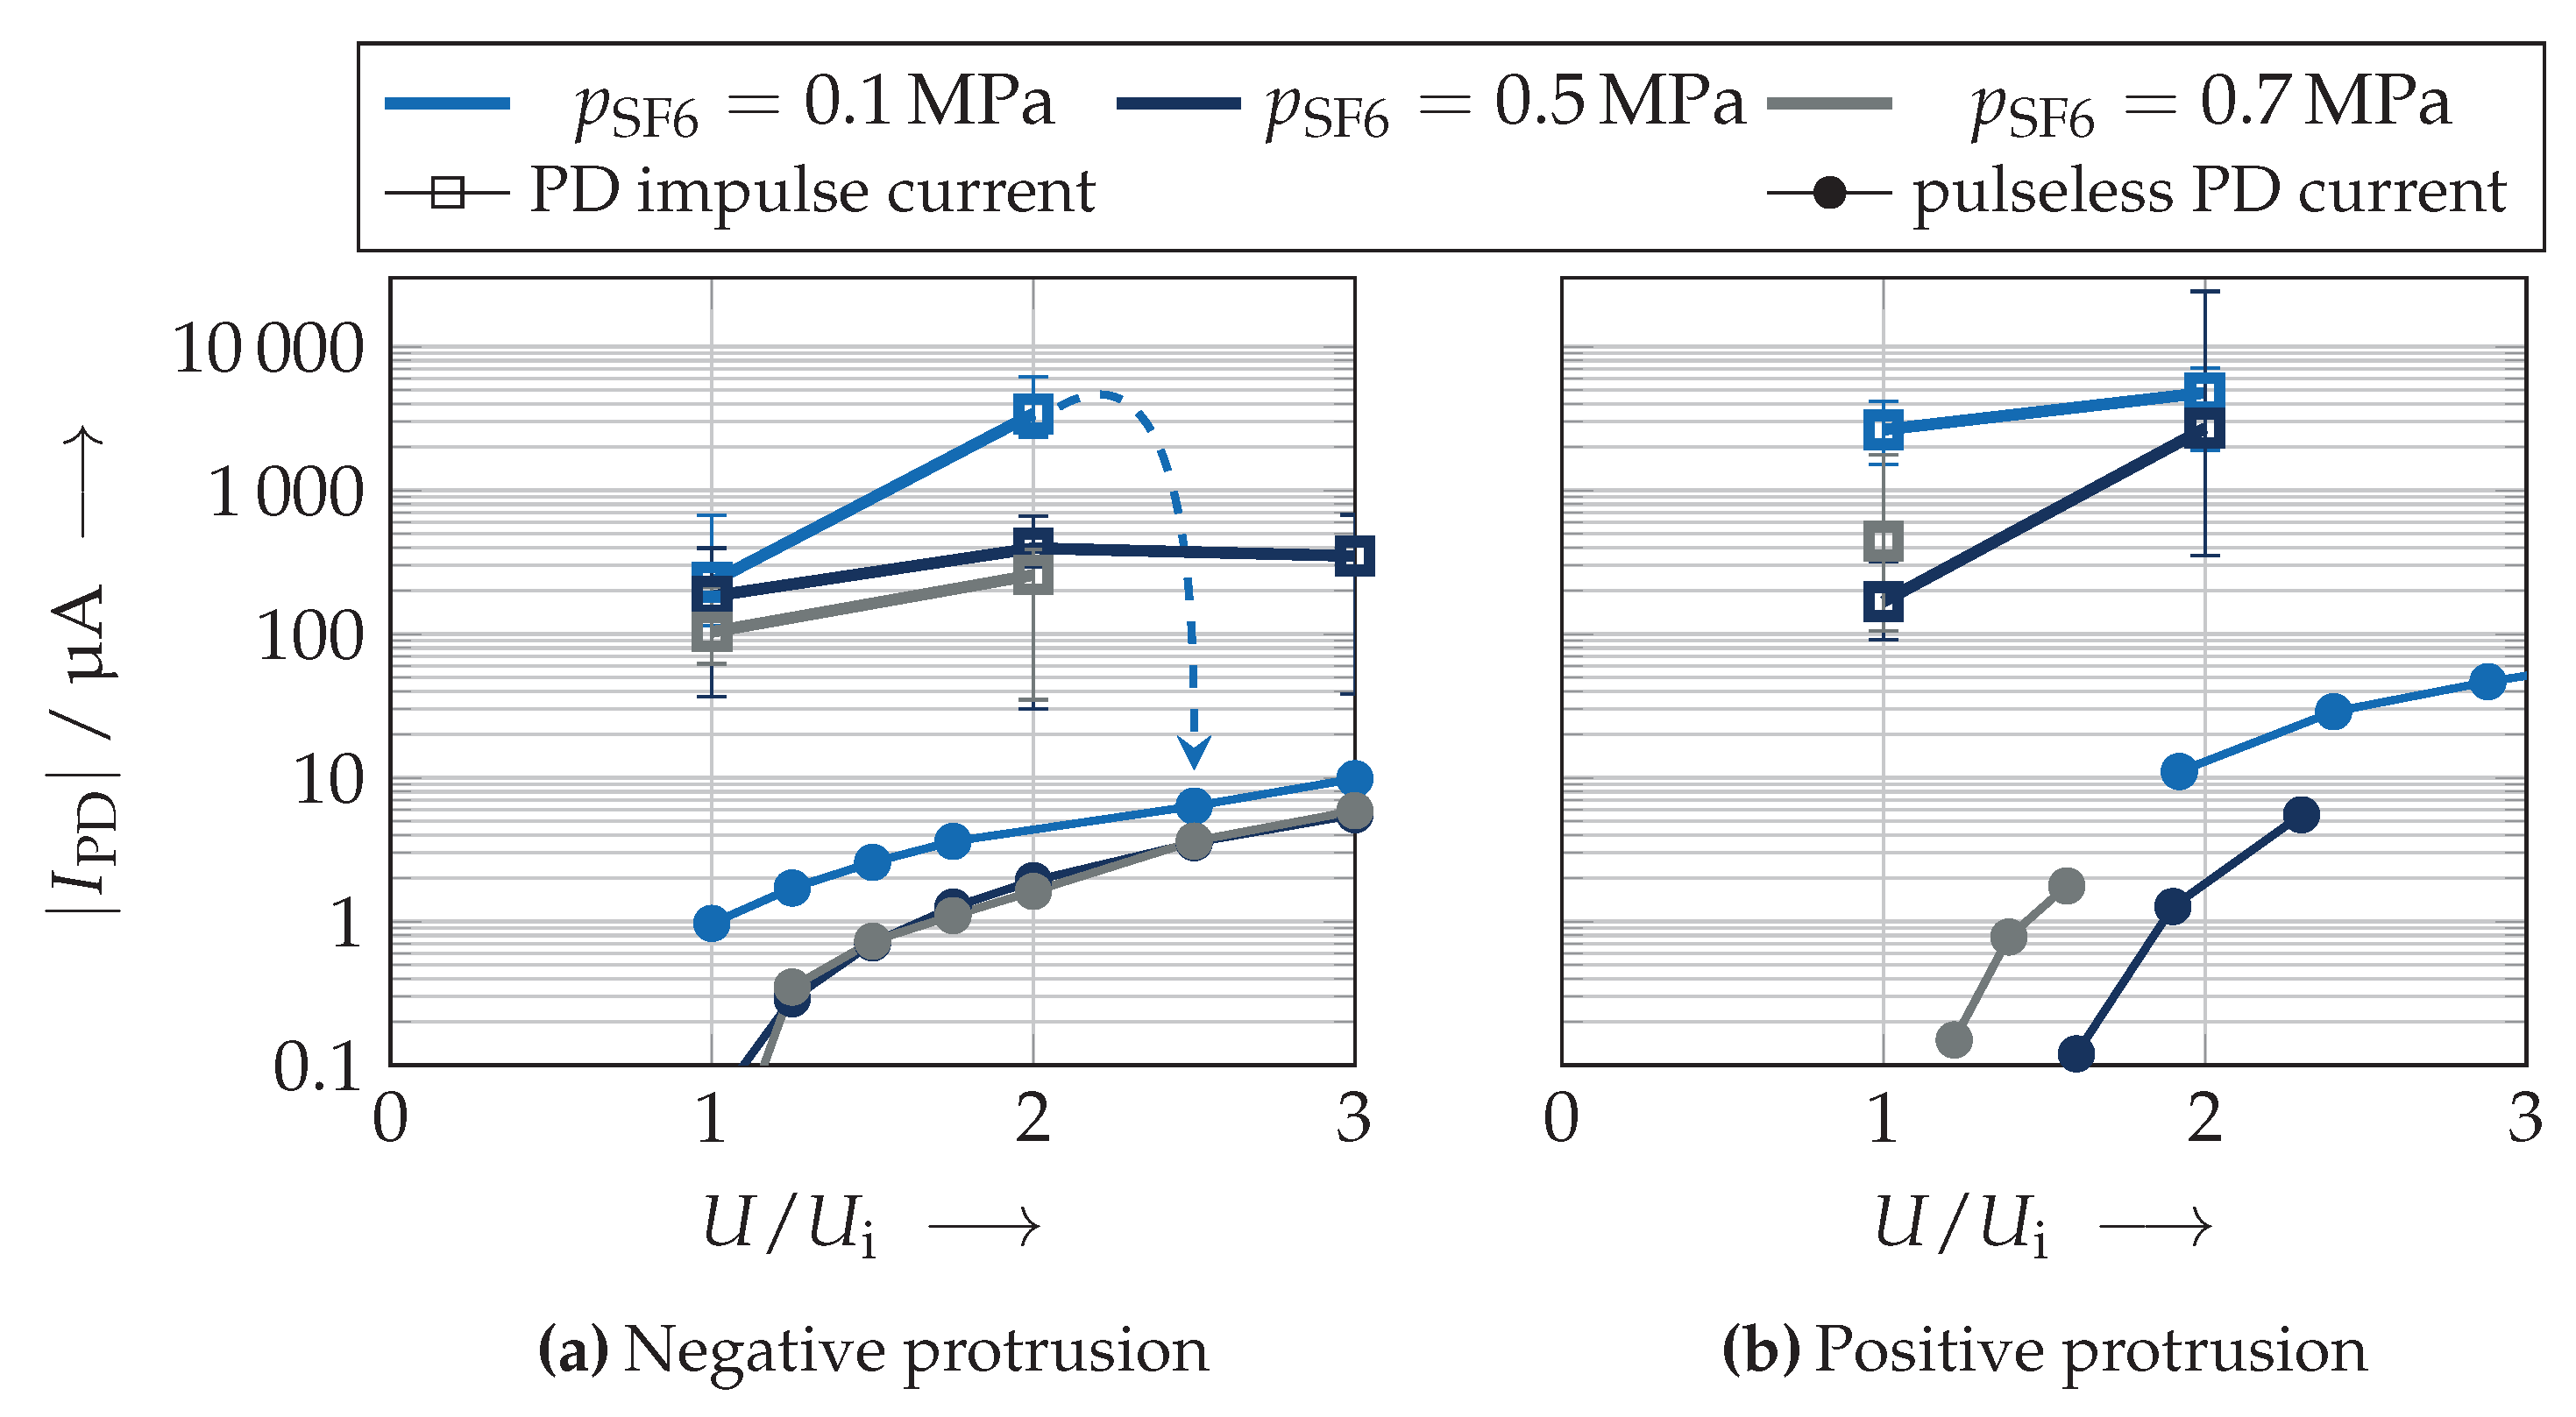
The results obtained by the analysis of the partial discharge impulse current amplitude, the time difference between subsequent discharge impulses (respectively sequences), and the pulseless partial discharge current allowed a classification of the PD types occurring in SF6-insulated systems under DC voltage stress.
One main factor for the determination of the discharge types was the share between pulseless PD currents and current impulses. As expected from the literature, the pulseless currents (caused by the slowly moving ions) were always lower than the current impulses (caused by the fast moving electrons) (cf. Figure 2). The dependency on the applied voltage was more pronounced for the pulseless currents (Figure 13). At a positive protrusion, the pulseless current incepted at higher voltages than the streamer impulses.
The pulseless current was already described by various authors for gas-insulated DC systems [10,11,21], but so far, no detailed description of the occurrence in dependence of the electric field strength, gas pressure, and voltage polarity in addition to the description of the impulse currents can be found. These pulseless discharges were caused by a permanent occurrence of avalanche discharges in front of the protrusion, which formed a stable space charge region. The parallel elapsing avalanche processes could not be measured separately, only the constant ion drift could be evaluated. If this space charge region became instable or an avalanche discharge turned over to a streamer discharge, additional current impulses could be measured. Therefore, these current impulses were superimposed on the pulseless current. Since more discharge avalanches could build up at higher voltages due to the increased critical volume, this space charge region and thus also the pulseless current increased.
According to the evaluation of the data, four different discharge types could be differentiated (Table 3).
The first type occurred at the inception voltage of the positive protrusion independently of the gas pressure; strong PD impulses could be measured, but no pulseless current was present. Hence, a streamer discharge generation took place at the protrusion. Due to the long time differences between subsequent impulses, no stable space charge region could be generated, and therefore, no pulseless discharge was superimposed on the streamer discharges.
The second one, PD current impulses superimposed on a pulseless PD current, could occur at various voltage-pressure-variations. This meant that the charges generated by the streamer impulses led to a stable space charge region in front of the protrusion, which affected the distribution of the electric field strength and therefore the size of the critical volume. In this region, continuous avalanche processes took place, and an equilibrium of charge generation and the drift of ions was reached. If this region became unstable, a streamer discharge could occur, superimposed on the glow discharge.
The third one was special for positive protrusions. A strong first discharge impulse changed the space charge region and therefore the electric field distribution significantly. Subsequent impulses with a minor amplitude took place in the first discharge channel as described in Section 2.
A PD behavior without any current impulses, so-called glow discharge, could only be determined under a gas pressure of 0.1 MPa at a negative protrusion in the investigated pressure-voltage range. This space charge region was very stable, and therefore, the generation and drift of ions were always in equilibrium. It could not be excluded that a pure glow discharge, as for low gas pressures, occurred close to the breakdown voltage even at higher gas pressures since the maximum applicable DC voltage was limited in this investigations.
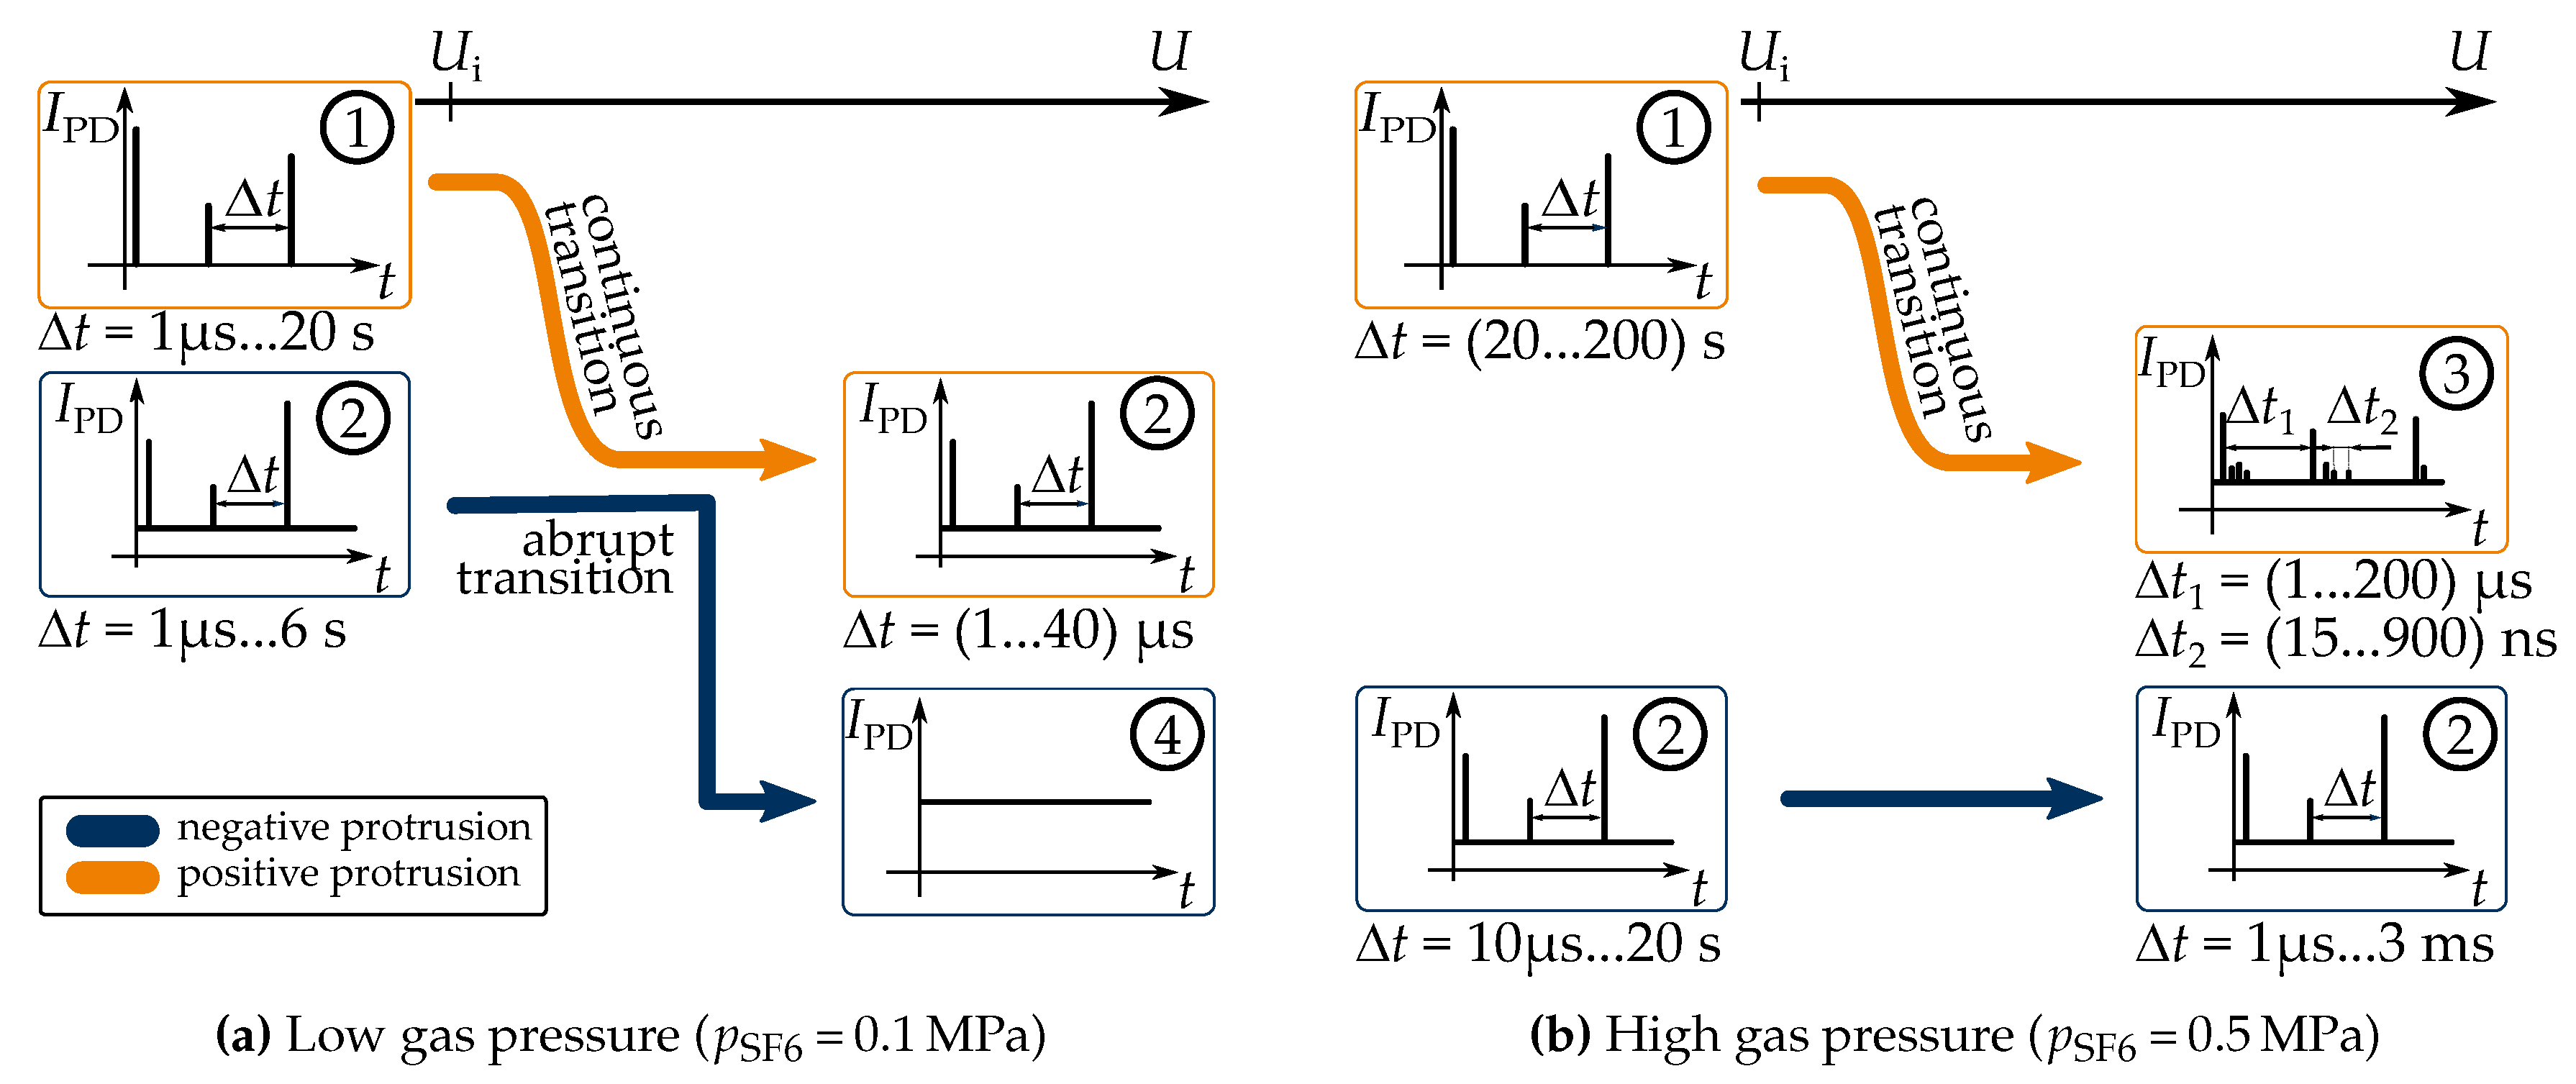
Combining the described data, a classification of the determined PD types was possible, as well as the description of the transition between different types (Figure 14).
At a positive protrusion, a continuous transition between the PD types took places. This could be a transition between pure impulse currents to impulses superimposed on a pulseless current at lower gas pressures (Figure 14a) or a transition to impulses with subsequent impulses superimposed on a pulseless current for higher gas pressures (Figure 14b). At a negative protrusion in a low pressure environment, the transition to a pulseless PD current was abrupt. No change in the PD behavior could be observed at a negative protrusion at high gas pressures.
Probably a more precise distinction would be possible considering more data points, especially at gas pressures of 0.3 MPa. A defined statement for 0.7 MPa was not possible due to the fact that the breakdown occurred close to the PD inception, and therefore, no measurements were possible at higher voltages than inception voltage in order to protect the measurement devices. However, the results obtained so far allowed us to assume that it was similar to the results obtained at 0.5 MPa.
Even though the presented effective ionization coefficient SF6 rose with enhanced electric field strength (Figure 1), the impulse amplitudes did not always rise in the same manner. Hence, the build-up of space charges influenced the formation of the streamer impulses due to a changing critical volume.
Looking at the gas pressures used in technical applications ( ≈ 0.5 MPa), it was evident that challenges arose during PD measurements under DC voltage stress. In principle, it seemed possible to identify a protrusion in gas-insulated DC systems with the well-known measurement principles based on IEC 60270 or by UHF measurements. it was difficult to distinguish between PD impulses and noise, e.g., due to the long time differences between subsequent impulses at a positive protrusion or low impulse amplitudes at a negative protrusion. Hence, a low noise environment must be established during PD measurements under DC, to achieve high sensitivity. Further challenges may arise in the precise evaluation of subsequent current impulses with low time differences [9]. It may be beneficial for a meaningful PD measurement to measure and evaluate the pulseless currents as well.
7. Outlook
The necessity to reduce the global greenhouse gas emissions leads to an intensified research and usage of alternative insulating gases with lower greenhouse potential [18,41]. One main challenge of the application of SF6 alternatives will remain: the safe and reliable operation of gas-insulated systems requires a decent knowledge of the partial discharge behavior in order to achieve a reliable risk analysis out of PD measurements. Therefore, the partial discharge physics, such as pulse amplitude and pulse distance, was compared between SF6 and one possible alternative for medium and high voltage equipment: synthetic air under higher gas pressures. The presented investigations were all carried out at a gas pressure of = 0.5 MPa. The aim of this section is to underline the applicability of the presented experimental procedure to other insulating gases and to give an outlook for future research. In contrast to the presented results of the impulse currents, these investigations will also include the pulseless currents.
7.1. Inception Voltage (Voltage Rising Test)
The inception voltages of current impulses determined with a VRT as described in Section 5.1 showed the differences expected from the comparison of the effective ionization coefficients between the two insulating gases (Figure 15). Due to the lower dielectric strength of synthetic air, its inception voltage is lower than in SF6. The differences in between both polarities of the protrusion are more prominent in SF6. This might be an effect of the differences in the electron affinity and the ionization energies. Since the starting electrons at a positive protrusion must be generated by detachment processes, a lower number of free electrons was present in the vicinity of the protrusion in SF6 compared to synthetic air. This could be justified comparing the ionization energies of both gases [26] and the low lifetime of free electrons in SF6 [21]. Hence, the voltage could increase further, and the differences in the discharge inception voltage at a positive protrusion were higher comparing both gases.
7.2. Amplitude of Partial Discharge Impulses
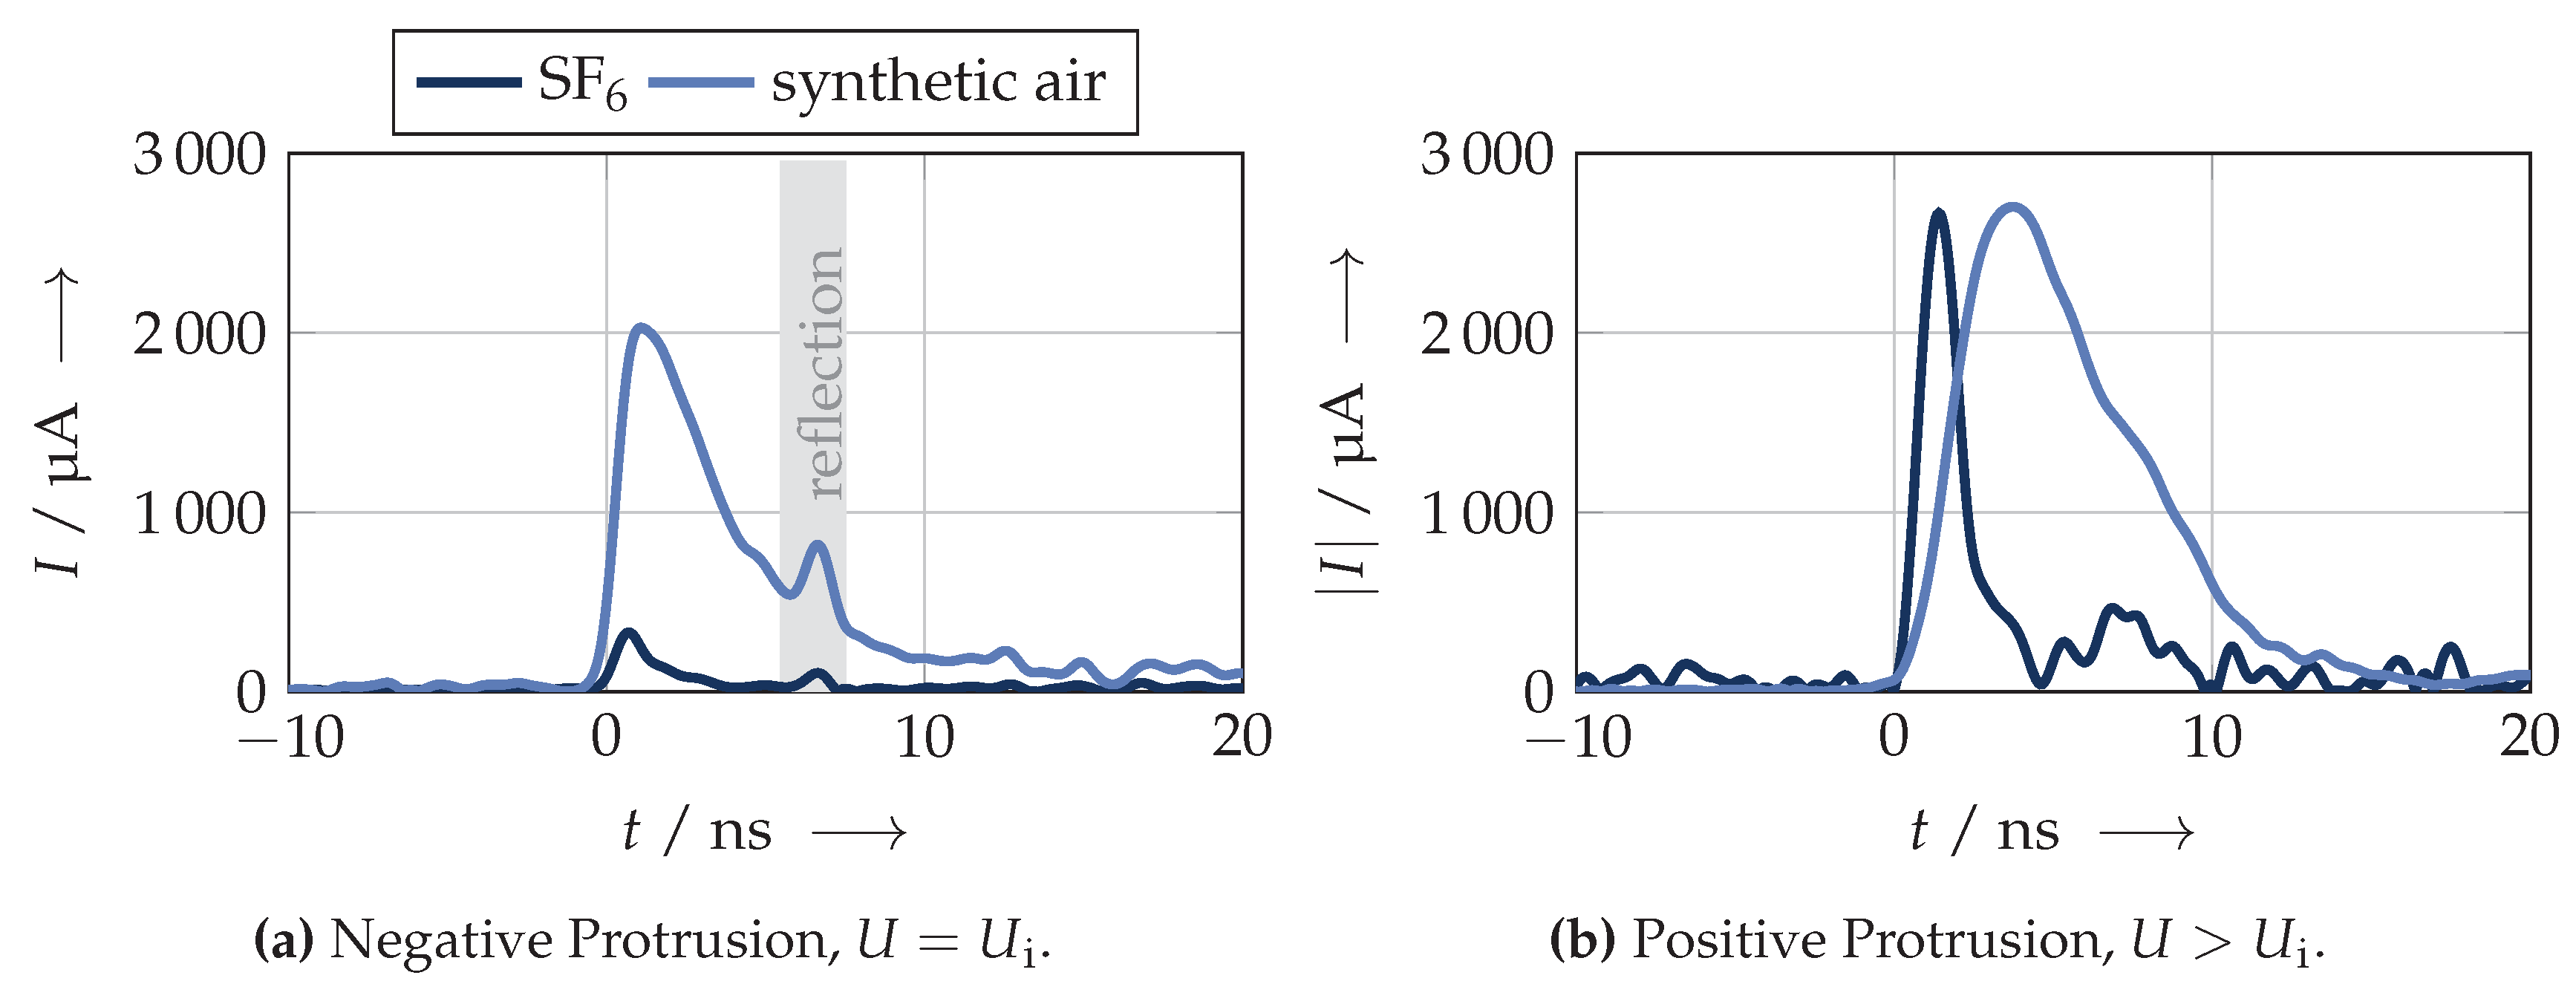
Comparing a single partial discharge impulse at inception voltage, it was evident that the PD behavior was significantly different (Figure 16a). Besides the higher PD amplitude at inception voltage, the time constants for the rise and decay of the impulses were different due to the significantly different effective ionization coefficients (Figure 16b).
This resulted in a higher converted charge for gases with a lower ionization coefficient. The comparison of Figure 16a,b may lead to the assumption that the rise times were dependent on the voltage polarity, especially for synthetic air as the insulating medium. This has to be evaluated in more detail during further investigations.
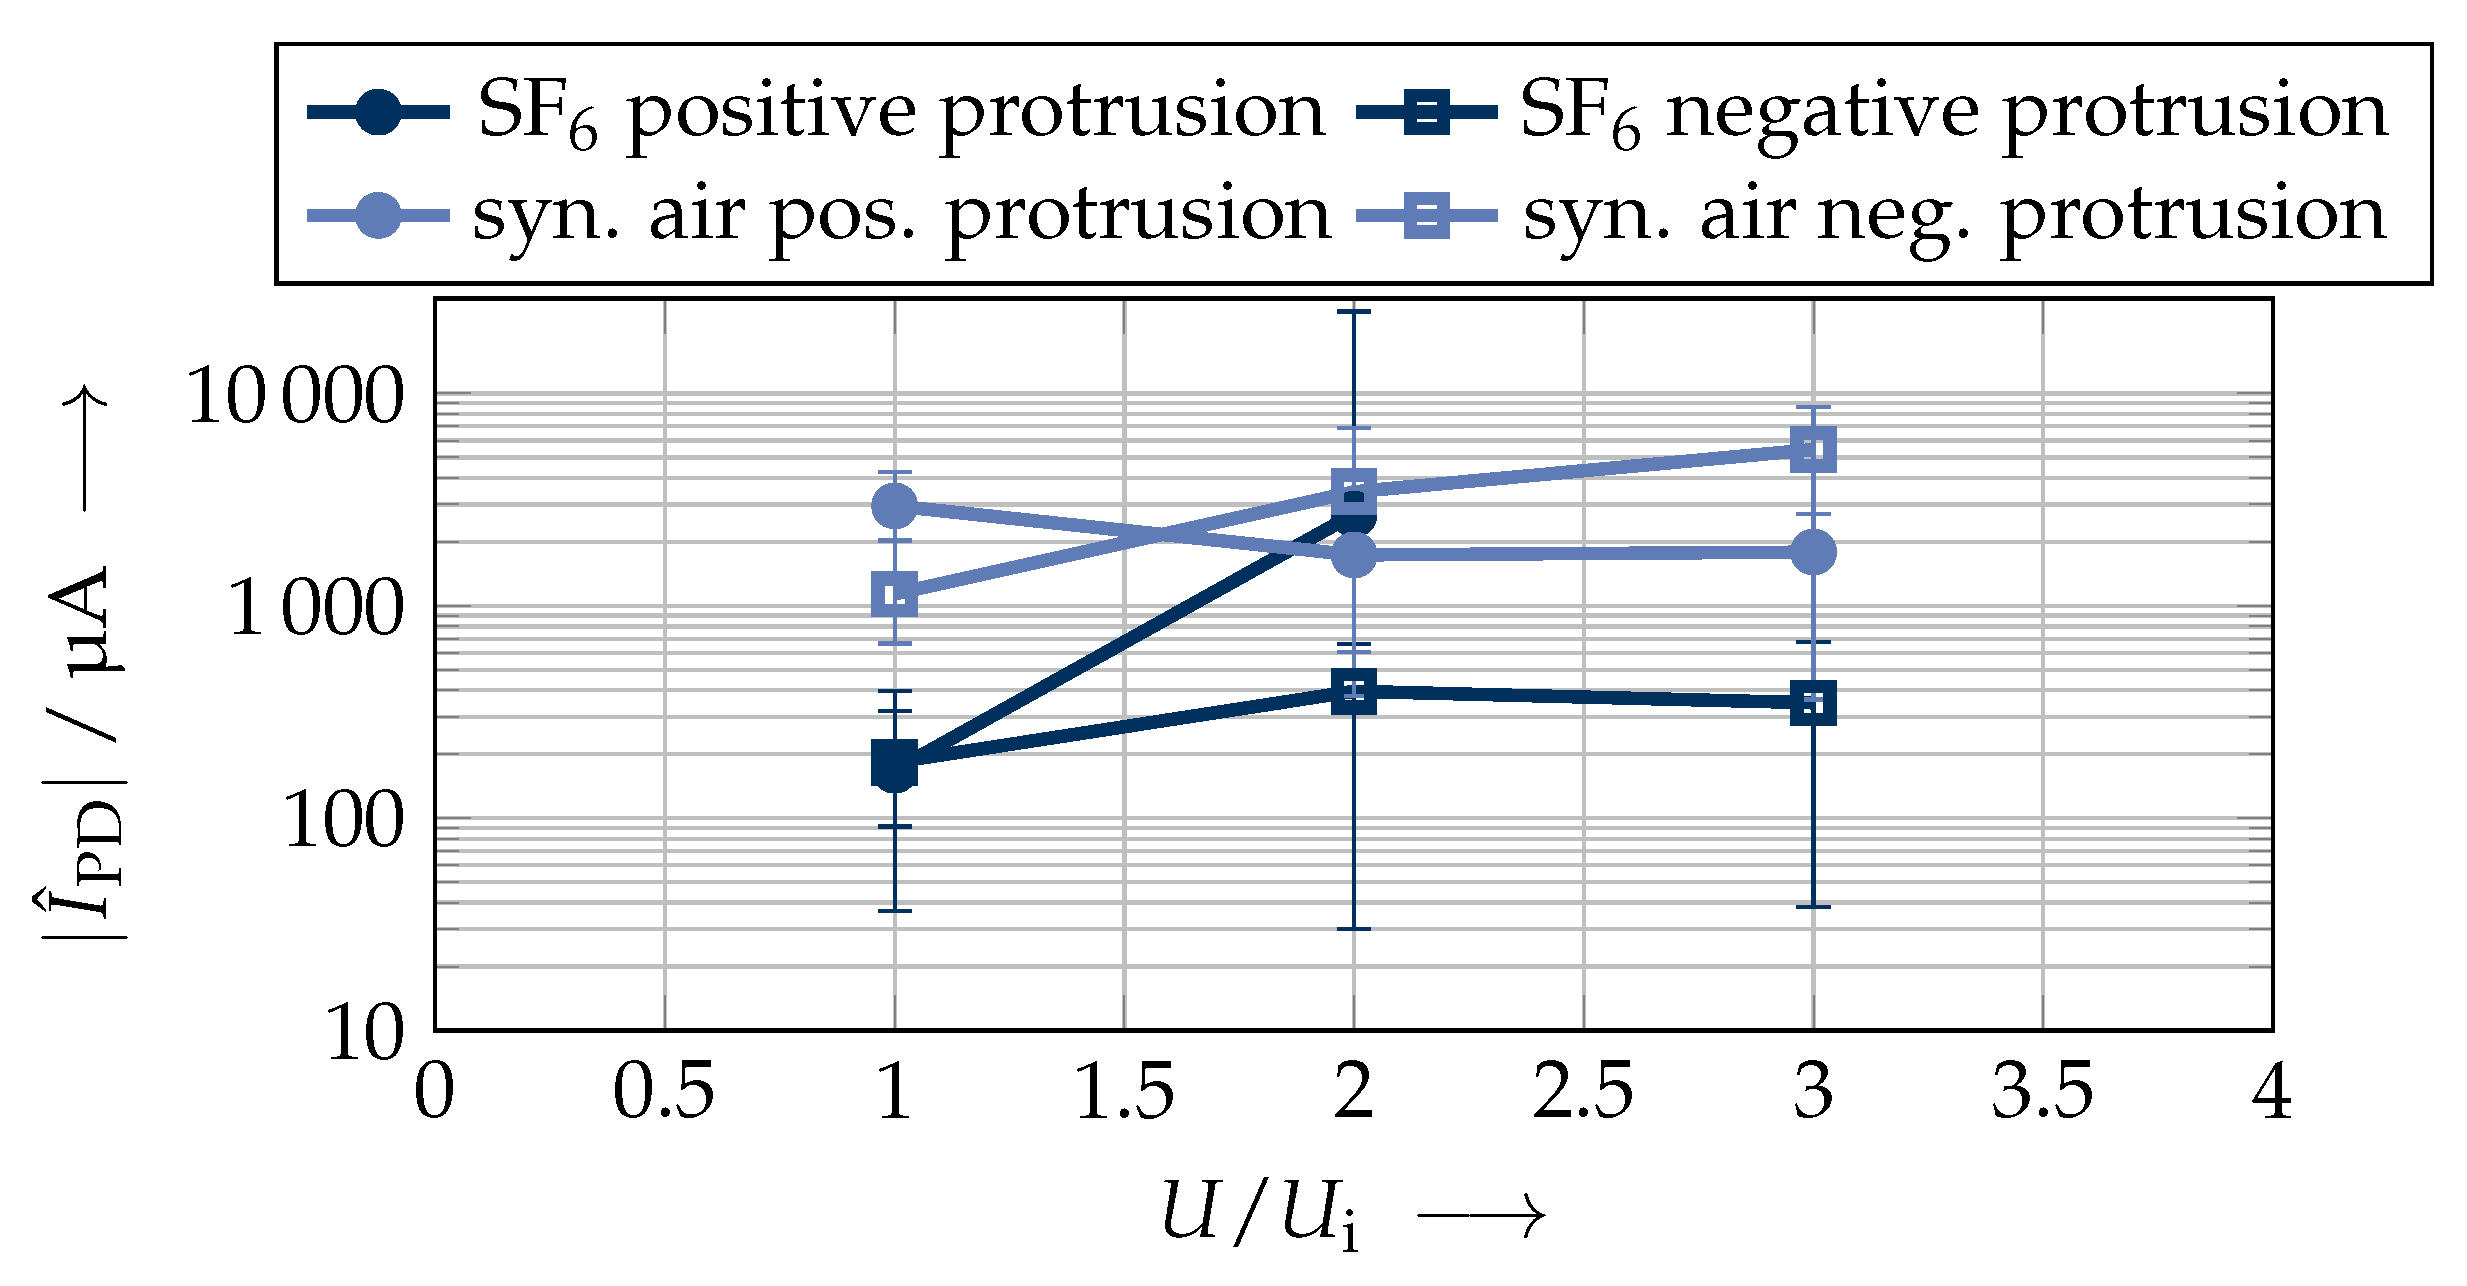
Besides the evaluation of a single PD impulse, the comparison of the peak values is of interest, because they can be an indicator for the detectability of PD with state-of-the-art PD measurement techniques [9]. PD impulses at a negative protrusion in synthetic air were approximately one order of magnitude higher than the impulses in SF6, despite the applied voltage (Figure 17). Whereas the peak current amplitude for a negative protrusion in SF6 was roughly constant, it increased in synthetic air with increasing electric field strength. At a positive protrusion, the peak currents increased significantly in SF6 with increasing voltage, as already described in Section 5.2.1. At twice the inception voltage, there was no significant difference between the impulse amplitude in SF6 and synthetic air. In contrast to SF6, the PD impulses at a positive protrusion in synthetic air were in the same order of magnitude as the ones at a negative protrusion. An increasing amplitude with increasing electric stress as in SF6 could not be observed. The described small subsequent current impulses in SF6 (Figure 11b) could not be observed in synthetic air. Hence, the partial discharge physics seemed to be different, and no change of the type of PD could be observed with varying electric stress.
7.3. Time Difference between Subsequent Sequences
Besides the investigated variations in the impulse current amplitudes, the time differences between subsequent sequences were analyzed. At inception voltage, the time differences in synthetic air were lower than the ones observed for SF6, independent of the voltage polarity (Figure 18).
Increasing the voltage led to lower time differences between subsequent impulses; the differences between the two investigated gases were less pronounced and in the range of several microseconds. Considering several PD impulses within one recorded sequence ( 1 µs), a significant amount could only be observed in SF6 for positive polarity (Figure 11). This behavior was only weakly developed in synthetic air and could only be observed for a few sequences at a negative protrusion at three times the inception voltage .
The comparison of SF6 with synthetic air at 0.5 MPa showed crucial differences in the discharge behavior. The different effective ionization coefficients, resulting from the different abilities of the gases to act as an electron scavenger, led to different PD current amplitudes, time differences between subsequent impulses, and time constants of the current impulses. This was explicitly shown by the comparison of single PD current impulse amplitudes (Figure 16).
It was confirmed that this type of investigation was not only applicable for SF6-insulated systems, but also for alternative insulating gases.
8. Conclusions
Current measurements are a promising technique for the investigation of the partial discharge behavior in gas-insulated systems under DC voltage stress. The evaluation of the measured electron and ion current increased the understanding of discharge processes at one common PD source in gas-insulated systems, a protrusion. The analysis of the measurement data allowed classifying four PD types depending on the polarity of the protrusion, the electric field stress, and the pressure of the insulating gas used. The results improved the interpretation of the measurement data gained during tests and provided therefore a basis for a meaningful and robust PD analysis.
Challenges during partial discharge measurement in gas-insulated DC systems may arise as a result of varying time differences between subsequent impulses, PD current amplitudes changing over orders of magnitude, and pulseless PD currents. The time differences could be in the range from several tens of nanoseconds to several minutes and require therefore PD measurement over a sufficiently long time and with high bandwidth of the measurement system in order to obtain a detailed analysis. The precise measurement of partial discharge current impulses with a low amplitude could be beneficial for the interpretation (at the conductor or enclosure) of a defect, due to the different behavior of positive and negative protrusion. The measurement of the pulseless PD direct current in addition to the well-established measurements according to IEC 60270 and in the UHF range could be used advantageously during laboratory tests to increase the knowledge about the defect.
To obtain a meaningful PD analysis, the applied voltage during PD measurements should not be fixed to a certain value or polarity, due to the fact that glow discharges could occur at negative protrusions, which are not detectable with the state-of-the-art measurement techniques.
The studies complement the knowledge necessary for safe and reliable operation of gas-insulated DC systems, since they contributed to a meaningful PD measurement and analysis for one common PD source, a protrusion. Future research is necessary to facilitate the changeover from the currently used insulating gas SF6 to more environmentally friendly gases like synthetic air or others.
Author Contributions
Conceptualization, T.G. and K.B.; methodology, T.G.; validation, T.G. and K.B.; formal analysis, T.G.; investigation, H.K. and T.G.; data curation, T.G. and H.K.; writing, original draft preparation, T.G.; writing, review and editing, T.G. and K.B.; visualization, T.G.; supervision, K.B.; funding acquisition, T.G. All authors read and agreed to the published version of the manuscript.
Funding
This research was funded by the Deutsche Forschungsgemeinschaft (DFG, German Research Foundation) Project Number 379542208. Open Access Funding by the Publication Fund of the TU Dresden.
Acknowledgments
The authors gratefully thank Joachim Speck, former leader of the high voltage group of the IEEH , for the valuable discussions during the funding acquisition, the construction of the experimental setup, and the interpretation of the results. Further, the authors would like to thank Maria Kosse for her continuous support and the discussions during the funding acquisition. The authors thank ABB Power Grids Switzerland Ltd. (Uwe Riechert) for providing the test vessel necessary for the execution of the experiments.
Conflicts of Interest
The authors declare no conflict of interest. The funders had no role in the design of the study; in the collection, analyses, or interpretation of data; in the writing of the manuscript; nor in the decision to publish the results.
Abbreviations
The following abbreviations are used in this manuscript:
| AC | Alternating current |
| AIS | Air-insulated System |
| CIGRE | Conseil International des Grands Réseaux Électriques (International Council of Large Electric Systems) |
| DC | Direct current |
| GIS | Gas-insulated System |
| GWP | Global warming potential |
| HV | High voltage |
| PD | Partial discharge |
| PRPD | Phase-resolved partial discharge pattern |
| PTFE | Polytetrafluoroethylene |
| SF6 | Sulfur-hexafluoride |
| SMA | SubMiniature Version A |
| SNR | Signal-to-noise ratio |
| UHF | Ultra-high frequency |
| VRT | Voltage rising test |
References
- CIGRE. GIS State of the Art 2008: TB 381; CIGRE WG B3.17; CIGRE: Paris, France, 2009. [Google Scholar]
- Gremaud, R.; Doiron, C.B.; Baur, M.; Simka, P.; Teppati, V.; Hering, M.; Speck, J.; Großmann, S.; Källstrand, B.; Johansson, K.; et al. Solid-Gas Insulation in HVDC Gas-Insulated System: Measurement, Modeling and Experimental Validation for Reliable Operation: D1-363; CIGRE Session: Paris, France, 2016. [Google Scholar]
- Hering, M.; Speck, J.; Großmann, S.; Riechert, U. Field Transition in Gas-insulated HVDC Systems. IEEE Trans. Dielectr. Electr. Insul. 2017, 24, 1608–1616. [Google Scholar] [CrossRef]
- Hauschild, W.; Lemke, E. High-Voltage Test and Measuring Techniques; Springer: Berlin/Heidelberg, Germany, 2014. [Google Scholar] [CrossRef]
- Hering, M.; Speck, J.; Großmann, S.; Riechert, U.; Neuhold, S. Detection of Particles on the Insulator Surface in Gas Insulated DC Systems; Highvolt Kolloquium’15; Steiner, T: Dresden, Germany, 2015. [Google Scholar]
- Takahashi, T.; Hayakawa, N.; Yuasa, S.; Okabe, S.; Okubo, H. Space charge behavior and corona stabilization effect in SF6 gas viewed from sequential generation of a dc partial discharge. J. Phys. D Appl. Phys. 2001, 34, 1878–1884. [Google Scholar] [CrossRef]
- Hering, M. Überschlagverhalten von Gas-Feststoff-Isoliersystemen unter Gleichspannungsbelastung. Ph.D. Thesis, Technische Universität Dresden, Dresden, Germany, 2016. [Google Scholar]
- Götz, T.; Linde, T.; Simka, P.; Speck, J.; Backhaus, K.; Gabler, T.; Riechert, U.; Großmann, S. Surface discharges on dielectric coated electrodes in gas-insulated systems under DC voltage stress. In Beiträge der Fachtagung VDE-Hochspannungstechnik; VDE e. V.: Berlin, Germany, 2018. [Google Scholar]
- Götz, T.; Wenger, P.; Beltle, M.; Backhaus, K.; Tenbohlen, S.; Riechert, U. Partial Discharge Analysis in Gas-Insulated HVDC Systems Using Conventional and Non-Conventional Methods: D1-109; CIGRE Session: Paris, France, 2020. [Google Scholar]
- Pirker, A.; Schichler, U. HVDC GIS/GIL—PD Identification by NoDi* Pattern. In Proceedings of the International Symposium on High Voltage Engineering (ISH), Buenos Aires, Argentinia, 27 August–1 September 2017. [Google Scholar]
- Ouss, E.; Zavattoni, L.; Beroual, A.; Girodet, A.; Vinson, P. Measurement and analysis of Partial Discharges in HVDC gas insulated substations. CIGRÉ Sci. Eng. 2018, 11, 62–68. [Google Scholar]
- Ouss, E.; Beroual, A.; Girodet, A.; Ortiz, G.; Zavattoni, L.; Vu-Cong, T. Characterization of partial discharges from a protrusion in HVDC coaxial geometry. IEEE Trans. Dielectr. Electr. Insul. 2020, 27, 148–155. [Google Scholar] [CrossRef]
- IEC 60270:2000. High-Voltage Test Techniques—Partial Discharge Measurements. Available online: https://webstore.iec.ch/publication/1247 (accessed on 14 June 2020).
- Abbasi, A.; Castellon, J.; Cavallini, A.; Fritsche, R.; Geissler, M.; Götz, T.; Hochbrückner, B.; Kharezy, M.; Kosse, M.; Küchler, A.; et al. Interim Report of WG D1.63: Progress on Partial Discharge Detection under DC Voltage Stress; CIGRE Joint Colloquium SCA2/SCB2/SCD1: Janpath/New Delhi, India, 2019. [Google Scholar]
- European Parliament and of the Council. Regulation (EU) No 517/2014 of the European Parliament and of the Council on Fluorinated Greenhouse Gases and Repealing Regulation (EC) No 842/2006. 2014. Available online: https://eur-lex.europa.eu/legal-content/EN/TXT/?uri=CELEX%3A32014R0517 (accessed on 14 June 2020).
- Diggelmann, T.; Tehlar, D.; Mueller, P. 170 kV Pilot Installation with a Ketone Based Insulation Gas with First Experience from Operation in the Grid; CIGRE Session: Paris, France, 2016. [Google Scholar]
- Kuschel, M.; Brandler, C.; Bütüner, C.; Hansen, L.; Mortensen, A.S.B.; Gaard, J. On-Site Experiences of 72.5 kV Clean-Air GIS for Wind-Turbine on- and Offshore Application: B3-115; CIGRE Session: Paris, France, 2018. [Google Scholar]
- CIGRE. Dry air, N2, CO2 and N2-SF6 Mixtures for Gas-Insulated Systems: TB 730; CIGRE WG D1.51; CIGRE: Paris, France, 2018. [Google Scholar]
- Fowler, R.H.; Nordheim, L. Electron emission in intense electric fields. In Proceedings of the Royal Society of London; Royal Society: London, UK, 1928. [Google Scholar]
- Kindersberger, J. The Statistical Time-Lag to Discharge Inception in SF6. Ph.D. Thesis, TU München, München, Germany, 1987. [Google Scholar]
- Mosch, W.; Hauschild, W. Hochspannungsisolierungen Mit Schwefelhexafluorid; VEB Verlag Technik: Berlin, Germany, 1979. [Google Scholar]
- Rabie, M. A Systematic Approach to Identify and Quantify Gases for Electrical Insulation. Ph.D. Thesis, ETH Zurich, Zurich, Switzerland, 2017. [Google Scholar] [CrossRef]
- Berger, S. Onset or breakdown voltage reduction by electrode surface roughness in air and SF6. IEEE Trans. Power Appar. Syst. 1976, 95, 1073–1079. [Google Scholar] [CrossRef]
- Naidu, M.S.; Prasad, A.N. Mobility and diffusion of negative ions in sulfur hexafluoride. J. Phys. D Appl. Phys. 1970, 3, 951–956. [Google Scholar] [CrossRef]
- Teich, T.H.; Sangi, B. Discharge Parameters for some Electronegative Gases and Emission of Radiation from electron avalances. In Proceedings of the International Symposium on High Voltage Engineering (ISH), Munich, Germany, 9–14 March 1972; pp. 391–395. [Google Scholar]
- Beyer, M. Hochspannungstechnik: Theoretische und Praktische Grundlagen für die Anwendung; Springer: Berlin/Heidelberg, Germany, 1992. [Google Scholar]
- Townsend, J.S. Electricity in Gases; Clarendon Press: Oxford, UK, 1915. [Google Scholar]
- Sirotinski, L.I. Hochspannungstechnik: Band 1: Teil 1: Gasentladungen; VEB Verlag Technik: Berlin, Germany, 1955. [Google Scholar]
- Kuffel, E.; Zaengl, W.S.; Kuffel, J. High Voltage Engineering: Fundamentals, 2nd ed.; Newnes Elsevier: Amsterdam, The Netherlands, 2008. [Google Scholar]
- Raether, H. Electron Avalanches and Breakdown in Gases; Butterworths: London, UK, 1964. [Google Scholar]
- Meek, J.M.; Craggs, J.D. Electrical Breakdown of Gases; Wiley: Chichester, UK, 1978. [Google Scholar]
- Hayakawa, N.; Hatta, K.; Okabe, S.; Okubo, H. Streamer and leader discharge propagation characteristics leading to breakdown in electronegative gases. IEEE Trans. Dielectr. Electr. Insul. 2006, 13, 842–849. [Google Scholar] [CrossRef]
- Wanninger, G. Ultrahochfrequente Teilentladungssignale in gasisolierten Schaltanlagen (GIS). Ph.D. Thesis, TU München, München, Germany, 1998. [Google Scholar]
- Herbst, I.; Pietsch, R. The fast and slow signal components of partial discharges in SF6 measurements of the electron and ion contributions to PD-signal. In Proceedings of the International Symposium on Electrical Insulation, Pittsburgh, PA, USA, 5–8 June 1994; pp. 283–287. [Google Scholar] [CrossRef]
- Dezenzo, T.; Betz, T.; Schwarzbacher, A. The different stages of PRPD pattern for positive point to plane corona driven by a DC voltage containing ripple. IEEE Trans. Dielectr. Electr. Insul. 2018, 25, 30–37. [Google Scholar] [CrossRef] [Green Version]
- Reid, A.J.; Judd, M.D. Ultra-wide bandwidth measurement of partial discharge current pulses in SF6. J. Phys. D Appl. Phys. 2012, 16. [Google Scholar] [CrossRef]
- Wetzer, J.M.; van der Laan, P. Prebreakdown currents: Basic interpretation and time-resolved measurements. IEEE Trans. Electr. Insul. 1989, 24, 297–308. [Google Scholar] [CrossRef]
- Van Brunt, R.; Misakian, M. Mechanisms for Inception of DC and 60-Hz AC Corona in SF6. IEEE Trans. Electr. Insul. 1982, EI-17, 106–120. [Google Scholar] [CrossRef]
- Gabler, T.; Backhaus, K.; Großmann, S.; Fritsche, R. Dielectric modeling of oil-paper insulation systems at high DC voltage stress using a charge-carrier-based approach. IEEE Trans. Dielectr. Electr. Insul. 2019, 26, 1549–1557. [Google Scholar] [CrossRef] [Green Version]
- Pirker, A.; Schober, B.; Schichler, U. PD Monitoring in HVDC GIS/GIL. In Proceedings of the CIGRE Symposium, Chengdu, China, 20–26 September 2019. [Google Scholar]
- Glaubitz, P.; Stangherlin, S.; Biasse, J.M.; Meyer, F.; Dallet, M.; Prüfert, M.; Kurte, R.; Saida, T.; Uehara, K.; Prieur, P.; et al. CIGRE Position Paper on the Application of SF6 in Transmission and Distribution Networks. Electra 2014, 274, 34–39. [Google Scholar]
Figure 1.
Effective ionization coefficient of air and SF6 in dependence of electrical field strength and gas pressure (according to Equations (1)–(3)).
Figure 1.
Effective ionization coefficient of air and SF6 in dependence of electrical field strength and gas pressure (according to Equations (1)–(3)).

Figure 2.
Partial discharge current consisting of electron current and ion current [33].
Figure 2.
Partial discharge current consisting of electron current and ion current [33].

Figure 3.
Circuit diagram of a symmetric Greinacher voltage doubler circuit for the generation of high DC voltage with low ripple.
Figure 3.
Circuit diagram of a symmetric Greinacher voltage doubler circuit for the generation of high DC voltage with low ripple.

Figure 4.
Test setup and electrode arrangement.

Figure 5.
Frequency dependence of the measurement circuit used.

Figure 6.
Sequence sampling mode.

Figure 7.
Sample sequences for the data evaluation (negative protrusion, = 0.1 MPa, ).

Figure 8.
Inception of current impulses and pulseless currents in dependence of gas pressure and the polarity of the protrusion in SF6.
Figure 8.
Inception of current impulses and pulseless currents in dependence of gas pressure and the polarity of the protrusion in SF6.

Figure 9.
Mean value and maximum/minimum of the amplitude of the impulse current in SF6 depending on the voltage polarity and the gas pressure.
Figure 9.
Mean value and maximum/minimum of the amplitude of the impulse current in SF6 depending on the voltage polarity and the gas pressure.

Figure 10.
Time differences between subsequent sequences in SF6 depending on the gas pressure and the applied voltage.
Figure 10.
Time differences between subsequent sequences in SF6 depending on the gas pressure and the applied voltage.

Figure 11.
Comparison of time dependent partial discharge current and time differences between subsequent PD events at a positive protrusion in SF6.
Figure 11.
Comparison of time dependent partial discharge current and time differences between subsequent PD events at a positive protrusion in SF6.

Figure 12.
Pulseless partial discharge current dependent on the voltage, the polarity of the protrusion, and the gas pressure (limit of the measureable current: 100 µA).
Figure 12.
Pulseless partial discharge current dependent on the voltage, the polarity of the protrusion, and the gas pressure (limit of the measureable current: 100 µA).

Figure 13.
Comparison of pulseless PD current and the peak value of current impulses (values from Figure 9 and Figure 12).

Figure 14.
Transition between partial discharge types in dependence of the gas pressure, voltage polarity, and the applied voltage.
Figure 14.
Transition between partial discharge types in dependence of the gas pressure, voltage polarity, and the applied voltage.

Figure 15.
Inception of partial discharge impulse currents depending on the polarity of the protrusion in synthetic air and SF6, = 0.5 MPa.
Figure 15.
Inception of partial discharge impulse currents depending on the polarity of the protrusion in synthetic air and SF6, = 0.5 MPa.

Figure 16.
Comparison of single PD impulses in SF6 and synthetic air = 0.5 MPa.

Figure 17.
Mean value of partial discharge peak current and minimum/maximum in dependence of the applied voltage and polarity at a gas pressure = 0.5 MPa.
Figure 17.
Mean value of partial discharge peak current and minimum/maximum in dependence of the applied voltage and polarity at a gas pressure = 0.5 MPa.

Figure 18.
Comparison of time differences between subsequent sequences in synthetic air and SF6 depending on the applied voltage and the polarity of the protrusion, = 0.5 MPa.
Figure 18.
Comparison of time differences between subsequent sequences in synthetic air and SF6 depending on the applied voltage and the polarity of the protrusion, = 0.5 MPa.


Table 1.
Mobility of ions and electrons in SF6 and air at approximately 0.1 MPa.
| in | in | ||
|---|---|---|---|
| SF6 | [21,24,25,26] | ||
| Air | [26,27,28,29] |
Table 2.
Parameters for the data evaluation.
| SF6 | Synthetic Air | ||||||||
|---|---|---|---|---|---|---|---|---|---|
| p/MPa | /µA at | /ns | /µA at | /ns | |||||
| positive protrusion | 0.1 | 350 | 350 | - * | 65 | - | - | - | - |
| 0.5 | 100 | 350 | - * | 15 | 350 | 350 | 350 | 15 | |
| 0.7 | 100 | - * | - * | 15 | - | - | - | - | |
| negative protrusion | 0.1 | 30 | 350 | - * | 65 | - | - | - | - |
| 0.5 | 30 | 30 | 30 | 65 | 350 | 350 | 350 | 15 | |
| 0.7 | 35 | 35 | - * | 65 | - | - | - | - | |
* No measurements possible because the measurement voltage was too close to breakdown voltage.
Table 3.
Classification of the determined PD types and their occurrence in the investigated experimental parameter range depending on the polarity of the protrusion, the applied voltage, and the gas pressure.
Table 3.
Classification of the determined PD types and their occurrence in the investigated experimental parameter range depending on the polarity of the protrusion, the applied voltage, and the gas pressure.
| Description | Schematic | Occurrence | |||
|---|---|---|---|---|---|
| Representation | Polarity | Voltage | Gas Pressure | ||
| ① | PD impulses |  | + | ≈ | MPa |
| ② | Pulseless PD current with superimposed PD impulses |  | +/− | ≥ | MPa |
| ③ | Pulseless PD current with superimposed PD impulsesand small subsequent impulses |  | + | ≥ ≥ | MPa 0.7 MPa |
| ④ | Pulseless PD current |  | − | ≳ | 0.1 MPa * |
* It could not be excluded that pulseless glow discharges occurred at higher pressures as well, because the measurement range (applied voltage) was limited in this investigation.
© 2020 by the authors. Licensee MDPI, Basel, Switzerland. This article is an open access article distributed under the terms and conditions of the Creative Commons Attribution (CC BY) license (http://creativecommons.org/licenses/by/4.0/).
Share and Cite
MDPI and ACS Style
Götz, T.; Kirchner, H.; Backhaus, K. Partial Discharge Behaviour of a Protrusion in Gas-Insulated Systems under DC Voltage Stress. Energies 2020, 13, 3102. https://0-doi-org.brum.beds.ac.uk/10.3390/en13123102
AMA Style
Götz T, Kirchner H, Backhaus K. Partial Discharge Behaviour of a Protrusion in Gas-Insulated Systems under DC Voltage Stress. Energies. 2020; 13(12):3102. https://0-doi-org.brum.beds.ac.uk/10.3390/en13123102
Chicago/Turabian StyleGötz, Thomas, Hannah Kirchner, and Karsten Backhaus. 2020. "Partial Discharge Behaviour of a Protrusion in Gas-Insulated Systems under DC Voltage Stress" Energies 13, no. 12: 3102. https://0-doi-org.brum.beds.ac.uk/10.3390/en13123102
Note that from the first issue of 2016, this journal uses article numbers instead of page numbers. See further details here.