Life Cycle Assessment of Classic and Innovative Batteries for Solar Home Systems in Europe
by
 , and
, and
Federico Rossi
1,2, 
Maria Laura Parisi
1,3,4 ,
,
Sarah Greven
5,
Riccardo Basosi
1,3,4 and
and
Adalgisa Sinicropi
1,3,4,*
1
R2ES Lab, Department of Biotechnology, Chemistry and Pharmacy, University of Siena, 53100 Siena, Italy
2
Department of Industrial Engineering, University of Florence, Via Santa Marta 3, 50139 Florence, Italy
3
CSGI—Consortium for Colloid and Surface Science, via della Lastruccia 3, 50019 Sesto Fiorentino, Florence, Italy
4
CNR-ICCOM, National Research Council—Institute for the Chemistry of OrganoMetallic Compounds, 50019 Sesto Fiorentino, Florence, Italy
5
ENSICAEN, Chimie Materiaux, 6 bd Maréchal Juin—CS 45053, F-14050 Caen CEDEX 4, France
*
Author to whom correspondence should be addressed.
Energies 2020, 13(13), 3454; https://0-doi-org.brum.beds.ac.uk/10.3390/en13133454
Submission received: 8 June 2020
/
Revised: 24 June 2020
/
Accepted: 30 June 2020
/
Published: 3 July 2020
(This article belongs to the Special Issue Life Cycle Assessment of Sustainable Energy System)
Abstract
:This paper presents an environmental sustainability assessment of residential user-scale energy systems, named solar home systems, encompassing their construction, operation, and end of life. The methodology adopted is composed of three steps, namely a design phase, a simulation of the solar home systems’ performance and a life cycle assessment. The analysis aims to point out the main advantages, features, and challenges of lithium-ion batteries, considered as a benchmark, compared with other innovative devices. As the environmental sustainability of these systems is affected by the solar radiation intensity during the year, a sensitivity analysis is performed varying the latitude of the installation site in Europe. For each site, both isolated and grid-connected solar home systems have been compared considering also the national electricity mix. A general overview of the results shows that, regardless of the installation site, solid state nickel cobalt manganese and nickel cobalt aluminium lithium-ion batteries are the most suitable choices in terms of sustainability. Remarkably, other novel devices, like sodium-ion batteries, are already competitive with them and have great potential. With these batteries, the solar home systems’ eco-profile is generally advantageous compared to the energy mix, especially in on-grid configurations, with some exceptions.
1. Introduction
This work addresses the issue concerning the choice of the most suitable in terms of sustainability battery energy storage systems (BESSs) for specific applications, namely the so-called solar home systems (SHSs). These systems belong to a larger category of residential installations that allow energy users to produce and exchange energy with the grid, thus becoming prosumers [1], and share their management to create grid-connected or isolated communities and microgrids [2,3,4].
SHSs are composed of a PV system, a converter named charge controller (CC), an inverter (In) and a BESS. The choice of the battery is particularly complex because many factors are involved simultaneously and contribute to the environmental and energy performance: manufacturing processes, raw materials consumption, operative parameters, working conditions, and waste management are those that mainly affect the overall performance. Furthermore, the most sustainable solution is intrinsically dependent on the geographical site, as one installation might not be the best one in a different context, or it could have a different effectiveness. For all these reasons, designing SHSs to be competitive with the national electricity mix can be challenging, especially if innovative technologies are considered. The aim of this work is to approach such an issue from a broader perspective that could support in the definition of the best BESSs for SHSs by evaluating their environmental performances and including a sensitivity analysis of the installation site.
Life cycle assessment (LCA) has a crucial role in the methodological approach presented in this paper because it allows to consider the whole life cycle of the SHS, from cradle to grave. LCA, standardized by the ISO family of rules [5,6], is one of the most recognized methods for environmental impact evaluation. The life cycle perspective of LCA allows to consider the raw material consumption and the emissions to the environment occurring during the whole life cycle of a product, process, or service. LCA has been widely used in the field of renewable energies whose greenhouse gases direct emissions might be null or, at least, be much more limited than for fossil fuels-based power systems. On the other hand, they may have remarkable environmental impacts due to their production and end of life disposal. For instance, the scientific literature provides examples of LCA applied to solar energy-based systems such as collectors [7] or traditional and novel PV systems [8,9,10].
Currently lithium-ion batteries (LIBs) represent the most mature storage devices on the market [11], but they still have some technical, environmental and economic drawbacks pushing scientific research to find alternative types of BESSs. Many LCA studies are available in the literature, most of them collected and harmonized in the work of Peters and Weil [11]. In this paper, the following batteries are considered: nickel cobalt aluminium (NCA) [12] nickel cobalt manganese (NCM) [13,14]; lithium manganese oxide (LMO) [15], lithium iron phosphate (LFP) [14,16] and lithium iron titanate (LTO) [12]. Recently, new types of LIBs have been designed like lithium manganese nickel oxide (LMNO), molybdenum-disulfide NCM (NCM-MoS2) and lithium cobalt phosphate (LCP). The eco-profile of such LIBs has been assessed by Cusenza et al. [17], Deng et al. [18] and Raugei and Winfield [19], respectively. Another interesting development in LIBs is the replacement of the liquid electrolyte with a solid one [20], thus moving towards solid state lithium-ion batteries (SSLIBs). Troy et al. [21] and Lastoskie and Dai [22] proposed an interesting environmental assessment of SSLIBs that showed them to be competitive with classic LIBs. Regardless of the electrode materials, LIBs are intrinsically affected by the availability of lithium that is quite limited [19]; moreover cobalt, used in the cathodes of most of LIBs to increase the energy density, is even more rare and expensive than lithium [23]. Indeed, lithium-cobalt oxide (LCO) batteries, whose LCA is performed by Grimsmo et al. [24], are the most widely used devices, but the impact of cobalt extraction in the Congo represents a major contribution to the overall environmental burden. For these reasons, research is focusing on the study of novel cobalt-free batteries working with the same principle of LIBs but replacing lithium-ions with sodium, magnesium or aluminium. The environmental assessment of sodium-ion batteries (SIBs) and aluminium-ion batteries (AIBs) has been performed by Peters et al. [25] and Delgado et al. [26], respectively. According to these studies SIBs already display good performance whereas AIBs are still at a laboratory level and far from industrial scale up. From the same perspective, other solutions to obtain lithium- and cobalt-free BESSs are sodium-nickel chloride batteries, named ZEBRA [27], and vanadium redox flow batteries (VRFBs). Some LCA studies [28,29] have demonstrated that these batteries have a very interesting potential to improve the environmental performance of stationary installations. Scientific and industrial research is focusing on high energy density batteries to make BESSs smaller and lighter: some of them have lithium metal as anodic material, like lithium-sulfur batteries (LiSBs) or lithium-air batteries. Environmental assessments of these devices have already been performed by Deng et al. [30] and Zackrisson et al. [31], who concluded that their potential is remarkable, but the fast degradation due to several ageing mechanisms at the moment hinders their diffusion in the market. The same kind of conclusions have been drawn by LCA studies of sodium sulphur [32], magnesium-sulphur [33] and zinc-air [34] batteries aiming to replace lithium.
The literature analysis shows that the environmental impact of batteries represents a very interesting research topic many authors have addressed. Nevertheless, all the abovementioned studies are performed at the components level and are focused on the production phase and, only in some cases, on the end of life stage of BESSs. The operation phase is usually neglected or modelled in a simplified way which does not really allow one to determine the effect of the BESS operative parameters on the results. Some detailed environmental analyses of BESSs applications do however exist and were reviewed by Tian et al. [35]. For instance, grid-connected SHSs economic and environmental feasibility, including LCA, have been assessed by Nagapurkar and Smith [36]. On the other hand, Wang et al. [37] analyzed a standalone battery system for an electric grid installed in Hong Kong. Solar systems assisted by batteries are also discussed by Longo et al. [38] who developed a new tool, based on LCA, to estimate the eco-profile of these systems. Kabakian et al. [39] compared a 1.8 kW PV system assisted by a BESS with the Lebanese electricity grid eco-profile underlining the substantive environmental merits of PV. All these studies at the system level are valuable but lack in analyzing how the different batteries can change the eco-profile of the system depending on the installation site.
Thus, it is possible to assert that there is a gap in the scientific literature concerning studies giving insights on how to choose the best battery to improve the environmental performance of SHSs. Ultimately, in the context highlighted by such a scientific study overview, comparative LCA studies about the effects of the components, in particular the batteries, on the overall system performances and eco-profiles are, to the best of our knowledge, not found in the literature. Indeed, this kind of analysis requires one to merge a detailed environmental assessment of batteries at the component level and a careful evaluation of the performances of SHSs depending on the batteries’ operative parameters. In order to do this, we proposed a three-steps methodology in our previous papers [40,41] including the design, the operative parameter simulation and the LCA of SHSs equipped with LIBs in Italy. In this work, our approach is employed for its application to a larger number of case studies in several European countries. Moreover, a larger group of batteries is analyzed including LIBs and novel BESSs. Much effort has been done to extend the methodology, initially valid for LIBs, to be applicable to every BESS and thus investigate the differences among them. Remarkably, the improvement of the three-steps methodology [40,41] allowed us to perform the comparison of different batteries and installation sites for SHSs eco-profiles evaluation.
2. Methodology
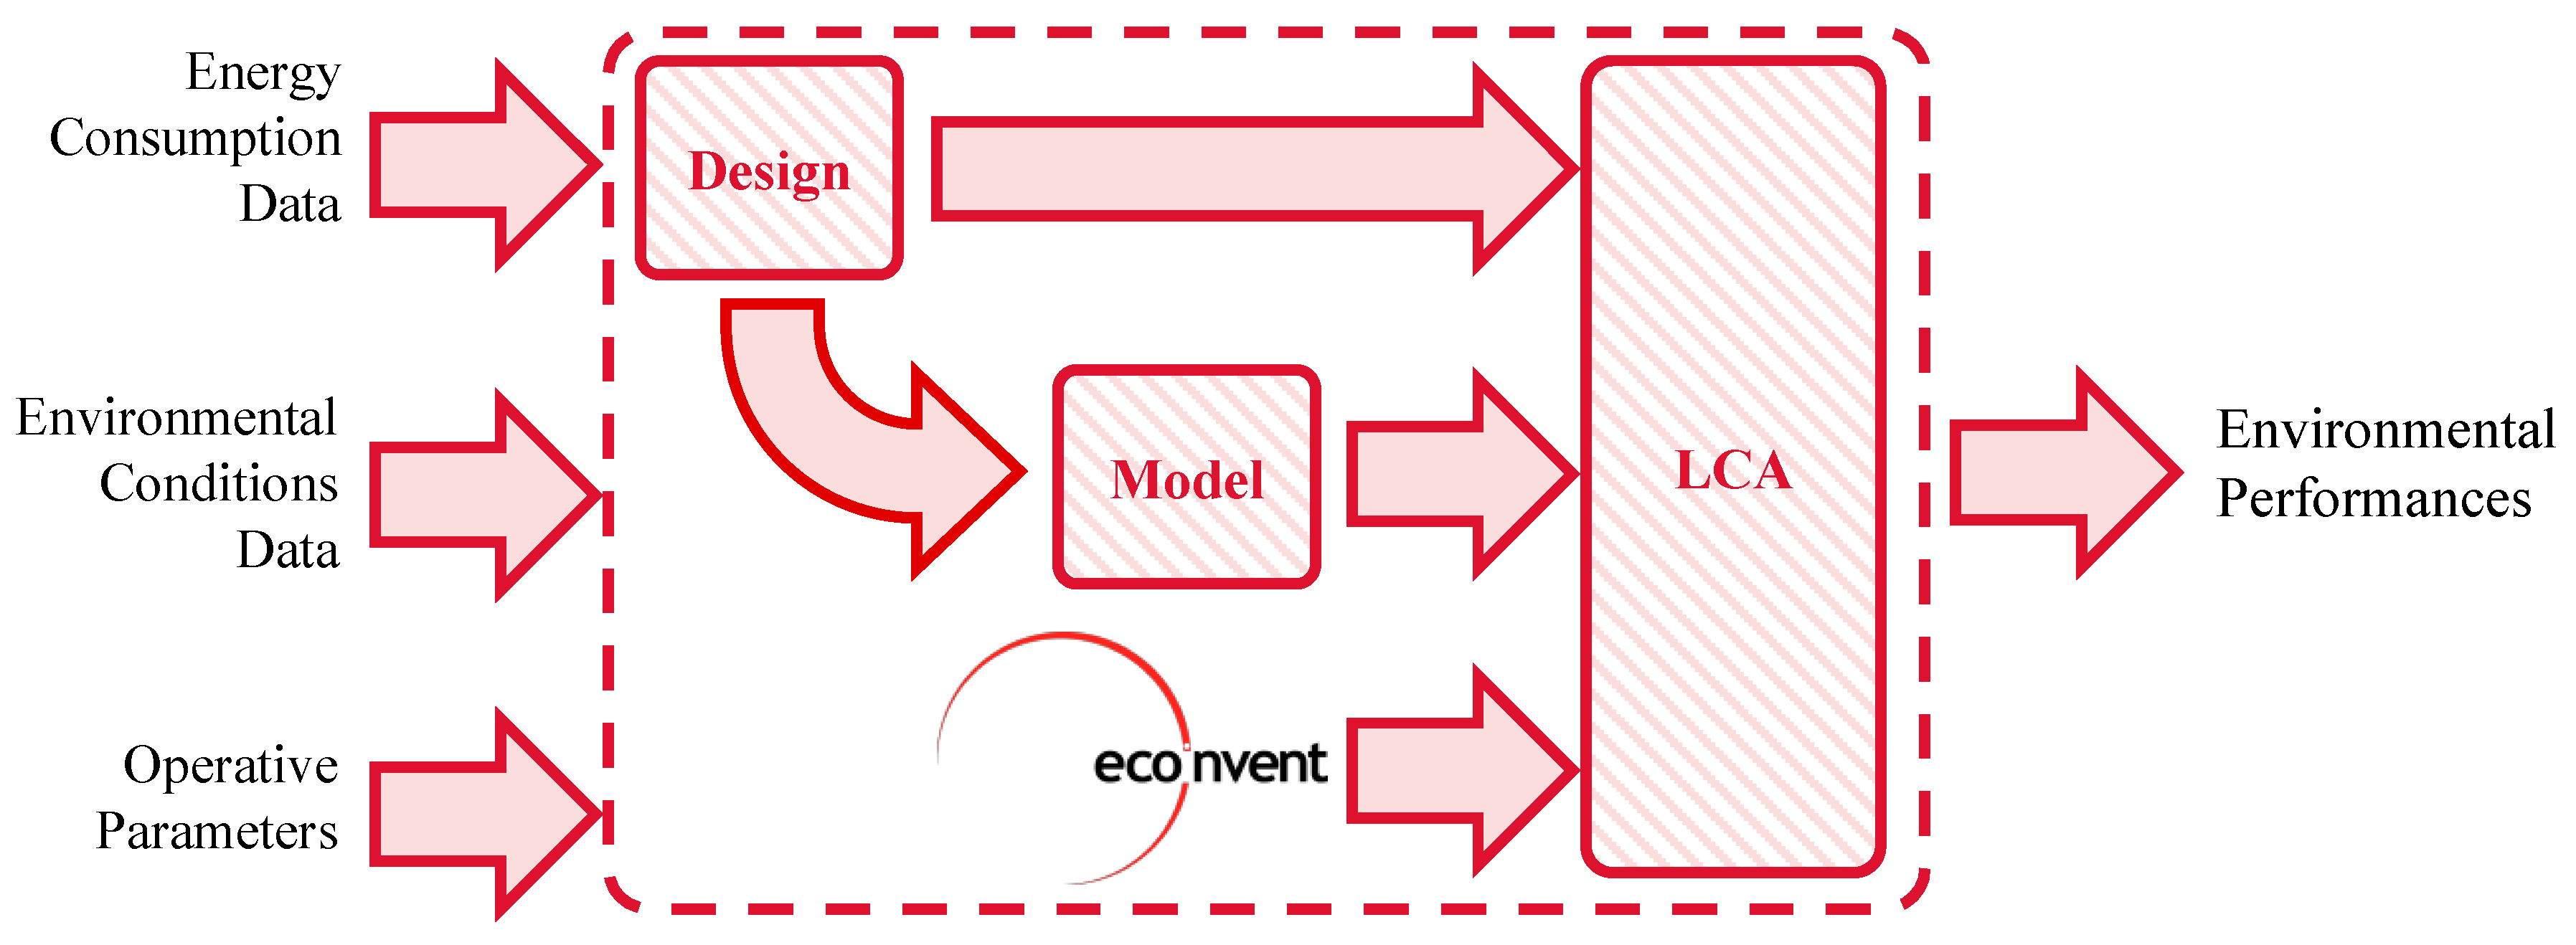
As described in the Introduction, SHSs are composed of a PV plant, a BESS, an In and a CC. When SHSs are configured as isolated installations, a generator provides backup energy to the user whereas grid-connected SHSs can exchange energy with the electric utility [40]. The methodology used to evaluate the eco-profile of both types of SHSs is composed of three steps:
- The design phase, in which the calculation of the components’ capacity is addressed.
- The modelling phase, which provides the dynamic simulation of the SHSs performances.
- The LCA for the SHSs environmental impact calculation.
A summary of BESSs is presented before the description of the abovementioned methodology steps and a flowchart illustrating such an approach is depicted in Figure 1.
2.1. Batteries Description
The operative parameters of the examined batteries are summarized in Table 1 which collects their construction materials, the energy density, the lifespan, the depth of discharge (DoD) and the efficiency.
LIBs are electrochemical devices where lithium-ions move from the anode to the cathode during discharge, and back when charging. Traditional LIBs include an organic liquid electrolyte (like ethylene carbonate or ethylene glycol dimethyl ether [42]) where lithium salts are dissolved. SSLIBs represent a development of classic LIBs where the liquid electrolyte is replaced by a solid crystalline one, namely LiPON, allowing one to double the energy density [22]. Thus, the energy density of the SSLIBs has been estimated multiplying with a factor of two the values of the corresponding LIBs. Several types of LIBs are available nowadays, differing in the electrode materials and consequently their energy density, efficiency and lifespan values [40].
Even though LIBs are the most diffused BESSs, several other batteries with different levels of maturity are available on the market. Based on the data availability in the literature, some alternative BESSs (aBESSs) have been selected to perform their environmental assessment in this work.
Peters’ devices (SIBs) [25] work similarly to LIBs because sodium-ions are exchanged by the electrodes with the same mechanism of lithium-ions in LIBs; indeed they belong to the same category named metal-ion batteries [43]. Sodium ions move from a sodium nickel manganese magnesium titanium oxide (NMMT) cathode to a hard carbon anode through a liquid electrolyte where sodium hexafluorophosphate (NaPF6) is dissolved [25]. These batteries are studied in the perspective of replacing lithium with sodium, much more abundant on the Earth. Nevertheless, according to a recent scientific report published by Yusoff et al. [43], the effects of the different size of sodium-ions are a lower cyclability, a lower capacity (and consequently energy density) and a lower power rate. Indeed Table 1 shows that SIBs energy density and cyclic lifespan are respectively 102 Wh/kg and 2000 cycles whereas in LIBs they can be significantly higher. In the literature there is lack of information about SIBs’ natural lifespan but, as Yusoff et al. [43] do not stress any difference for this parameter, the same value assumed by LIBs has been assumed.
Deng batteries (LiSBs) have metal lithium as anodic material whereas sulphur is present in the cathode mixed with a graphene structure [30]. They can reach a high energy density although the electrolyte is liquid and composed of a solution of lithium bistrifluoromethanesulfonimidate (LiTFSI), dimethyl glycol (DME), dioxolane (DOL) and lithium nitrate (LiNO3). The main drawback of this battery chemistry is the very fast cyclic degradation due to several chemical and physical ageing mechanisms [30,44]. Few data are available about their natural lifespan because research is meanly focused on studying the cyclic degradation that is the dominant effect. Deng et al. [30] estimate that, similarly to LIBs, LiSBs lifespan can reach 10 years that is set as reference value for the natural lifespan.
Eco (ZEBRA) [46] batteries contain sodium composites in the electrolyte and in the anode, whereas nickel represents the main cathodic material [38]. Differently from the others, these devices operate at high temperatures, over 270 °C [28], and therefore they require a heating system to be constantly in operation [45]. The cyclic lifespan and the energy density is comparable to some types of LIBs but the natural lifespan is longer [45]. Among the alternative batteries analyzed in this study, ZEBRA batteries present the highest maturity level.
Weber systems (VRFBs) [29] are significantly different from the other devices: they are flow batteries where two vanadium-based liquid electrolytes are stored in two storage tanks which determine the capacity of the battery. The liquids are pumped through a piping system to a stack where they are separated by a proton exchange membrane that, together with polyacrylonitrile (PAN) carbon felt electrodes, allows the development of the reaction; the surface of the membrane determines the power of the battery [29]. Therefore, the strength of VRFBs is the possibility to design separately the storage tanks (devoted to store energy) and the stack (devote to exchange power) according with the needs of the user. Moreover, it is possible to recycle the electrolyte completely and to achieve a very long lifespan. Indeed, the natural lifespan of the electrolyte is 20 years, that of the stack is 10 years whereas the cyclic ageing is negligible [29]. The main drawback of VRFBs is the very low energy density which might be solved finding new types of electrolytes in the future.
2.2. SHS Design
The design equations [40] applied to evaluate the PV power () and the BESSs nominal capacity () for a daily energy storage are defined as follows (1) and (2):
where is the daily energy consumption, is the electric efficiency of the SHS set to 72% [40], is the minimum equivalent daily full power operation time (expressed as hours) of the PV system (estimated using the online tool PV-GIS [47]) and is the depth of discharge (80%) [40]. The nominal voltage of the BESS () is set to 48 V [40].
The role of the CC is to connect the PV system and the BESS guaranteeing a match among their electrical characteristics; the In has to provide to the user the maximum power required by the load (), evaluated analyzing the users demand profile in time [48]. To this scope, the size of the CC () and of the In () can be defined (3) and (4). Considering the design of the VRFB, its power is not physically correlated to its capacity, thus the BESS is designed to work with a power rate of 0.5 h−1, typical of stationary applications [49] (5):
2.3. SHS Modelling
After the SHS is designed, its performances are estimated by a dynamic simulation model. A discretization of the time variable () is necessary to perform the simulation, and a time step = 1 h is defined. The outputs of the simulation are the amounts of missing () and exceeding () energy during the BESS lifespan (). The SHS model is composed of three parts:
- The PV productivity profiles (), calculated with PV-GIS [47].
- The power demand profiles (), provided by Quoilin et al. [48].
- The BESS model that uses and as inputs to evaluate the missing ( and exceeding () power of the SHSs. and are calculated integrating and in time and an ageing model allows to estimate
In our previous work [40] the BESS operation has been modelled using a Matlab/Simulink block only valid for LIBs [50]. Therefore, this model is not adequate to describe all the batteries considered in this study and, thus, a flexible BESS model has been implemented here using the parameters collected in Table 1.
The power flowing through the BESS during the charge () and discharge () phases is assessed by the following balances (6) and (7):
where and are the BESS charge and discharge efficiency values, both equal to the squared root of the overall Coulombic efficiency (Table 1). The actual power flowing through the BESS () is equal to during the charge phase () and to during the discharge phase (). Additionally, some constraints are necessary:
- if the battery capacity is totally full (= 1), the BESS cannot be furtherly charged and the exceeding power is exported to the grid or, in off-grid SHSs, it is dumped.
- if the battery capacity has reached the minimum level (=), the BESS cannot be furtherly discharged and, in that case, the backup source intervenes.
The power rate (), representing the charge and discharge velocity [51], is defined as (8):
Every type of BESS has a maximum power rate allowed, but it will be demonstrated that it doesn’t represent a limiting factor as usual in stationary applications [21,40,49]. At this point, the current BESS state of charge () can be calculated using (9):
where the BESS state of health () is assessed using an ageing model. Cardoso et al. [49] proposed a capacity fade model for the assessment of a generic battery using (10), evaluating the BESS capacity loss () as the sum of the cyclic ageing and the natural degradation.
where:
- is the solution of (8).
- is the capacity of a reference battery (712.9 Wh).
- is the voltage of the reference battery (5 V).
- is the activation energy of the reaction of the reference battery (24,500 J ∙ mol−1).
- is the constant of gases.
- , , , , , are the ageing coefficients, calibrated to match with the values in Table 1 in nominal conditions ( = 298 K and = 1 h-1).
The ageing parameters, calibrated grounding on the data provided by Cardoso et al. [49], are collected in Table 2.
Concluding, is calculated using Equation (11):
All these equations are implemented in Matlab/Simulink [52] and when the is equal to 0.8, the simulation is stopped and is calculated.
A further consideration must be done for VRFBs. Like every flow battery, the VRFBs electrolyte is pumped inside the cell consuming energy that is provided by the backup source. The power absorbed by the pump (), is calculated by (12) to overcome the pressure losses in the system () [53]:
where is the efficiency of the pump (90%), can be calculated using well known fluid-dynamics equations and the electrolyte flow rate () is calculated using Equation (13) [53].
where the oversizing factor is set to 7.5, is the number of electrons involved in the reaction (1 electron), is the Faraday constant and is the vanadium concentration (1.6 mg/L) [53].
2.4. LCA
The last phase of the three-steps methodology is the implementation of the LCA. According to the ISO standards [5,6] four steps are necessary to perform correctly this analysis:
- Goal and scope definition: the objectives of the study are defined, thus the reference flow (RF) and the functional unit (FU) of the product system are set accordingly. Moreover, the system boundaries are drawn to choose which processes are included in the analysis and which ones are left outside.
- Life cycle inventory (LCI): all the input and output flows of matter and energy involved in the system boundaries are collected and quantified.
- Life cycle impact assessment (LCIA): in this step all the flows collected in the LCI are classified and multiplied for characterization factors to calculate the environmental impact indicators value.
- Interpretation: the results obtained should be carefully evaluated to point out possible improvements of the product system in accordance with the scope and goal of the assessment and, eventually, to modify and implement the LCA system model.
2.4.1. Goal and Scope Definition
The goal of the study is estimating and comparing the environmental performances of several SHSs equipped with different types of BESSs to identify the most sustainable one. In this perspective, the effects of the installation site variation on the results are assessed through a sensitivity analysis. The comparison with the national electricity mixes allows us to estimate the SHSs environmental effectiveness in every country. The function of SHSs is producing useful electricity, therefore in off-grid systems the RF is equal to the user energy demand whereas in on-grid configurations it is the sum of the load and the electricity dispatched to the grid. In both cases the FU is 1 MWh. A cradle to grave approach encompassing the construction (CO), operation (OP) and end of life (EoL) of SHSs is implemented. The impact of the components’ transportations to the installation sites have not been included to focus the attention only on the SHS site-specific performances.
2.4.2. Life Cycle Inventory (LCI)
The LCI has been built using the Ecoinvent database v3.4 [46]. First of all, all the inventories have been modelled at a component level. Reproducible data for the CO of all the batteries are available in the scientific literature [11,25,29,30,44] except for SSLIBs. Therefore, it is necessary to convert LIBs to SSLIBs replacing the same amount of liquid electrolyte with LiPON, whose LCI is reported in Table 3.
According to Senevirathne et al. [20], LiPON precursors are lithium oxide, phosphorous pentoxide and triphosphorous pentanitride with a mass ratio 1 : 0.2 : 0.3.
- Phosphorous pentoxide inventory has been approximated to phosphoric acid having a similar structure.
- Triphosphorous pentanitride is prepared from ammonia and phosphorus pentachloride [54].
Furthermore, LiPON powder is heated for 10 h with a temperature rate of 5 °C/min [20]; the energy consumption for the production of 1 kg of LiPON is estimated considering lithium powder specific heat as a proxy (0.85 cal/g/K) [55].
The inventories of SIBs, VRFBs and LiSBs have been faithfully reproduced using detailed LCIs available in the literature [25,29,30] whereas a complete LCI for ZEBRA batteries is available in Ecoinvent v 3.4 (market for battery, NaCl—GLO) [46].
Deng et al. [30] and Weber et al. [29] describe the EoL inventory for LiSBs and VRFBs as well as the CO. Contrarily, LIBs waste treatment is not considered by Peters and Weil [11], but Huang et al. [56] clearly describes that each part of these BESSs can be recycled with an efficiency of about 90%. During the EoL, the battery pack is disassembled and then, after a thermal treatment for the evaporation of the liquid electrolyte, the main CO materials can be recovered: a pyrometallurgical process is necessary if cobalt is present in the battery, otherwise a hydrometallurgical process is preferred. On the other hand, plastic materials and LiPON are supposed to be incinerated. Therefore, after the evaluation of the mass contribution of each part of the battery pack, the inventory for LIBs and SSLIBs waste treatment has been modeled (Table 4) including the recovered materials. The same approach has been used also for Peters (SIB) EoL.
Moving to the system level, a complete LCI of the SHS valid for all the installation sites is collected in Table 5. The PV system and the wires are supposed to be recycled (with efficiency 90%), whereas the plastic materials are incinerated; the EoL of converters and electronics (like the In and CC) are modeled using a specific Ecoinvent [46] process.
A complete LCI is provided as Supplementary Materials. The lifespan of the SHS () is set to 25 years and responds to that of the most long-living component (the PV plant) of the system. All the components lifespan values are collected in Table 6.
2.4.3. Life Cycle Impact Assessment (LCIA)
In this work the ReCiPe Endpoint (H) 2016 method, considering 17 impact categories with weighting set Europe H/A person/year specifically calibrated for the European context, is employed. LCIA results have been characterized both at the midpoint and endpoint level. The further aggregation of the endpoint results in single scores, measured as eco-points per MWh (Pts/MWh) allows an effective overview of the global environmental performances of the SHSs and a more concise discussion. For instance, fossil fuels based power systems may be concerned mostly about global warming potential and fossil resources depletion whereas PV or BESSs metals depletion may be more reasonable [62].
3. Case Studies
In this section, the above described three-steps methodology will be applied to some case studies. Different from our previous work [40], where a SHS was presumed to be installed in Siena (central Italy), this work is focused on the assessment of the SHSs eco-profile working at different installation sites [62]. This allows to evaluate how the SHS environmental performances respond to different operative conditions and to estimate its effectiveness with respect to the national electricity mixes. Eight different European countries, already considered by Quoilin et al. [48] for a statistic analysis of SHS energy consumption, have been selected for the analysis. To assess the environmental conditions of the installation sites, each country is represented by the respective capital city. The installation sites are the following: Denmark (DK)—Copenhagen, Spain (ES)—Madrid, France (FR)—Paris, Greece (GR)—Athens, Hungary (HU)—Budapest, Italy (IT)—Rome, Portugal (PT)—Lisbon and Romania (RO)—Bucharest.
According to the procedure described in Section 2, the design parameters need to be defined. and have already been specified in Section 2 and they don’t depend on the installation site; contrarily, and are different and their values are collected in Table 7. Their estimate is based on the daily average energy consumption of a family composed of three people [63] and PV-GIS [47].
Concerning the modelling phase, the productivity profile of the PV plant, whose configuration is defined in the design phase, has been assessed using PV-GIS [47]. Furthermore, among the power demand profiles proposed by Quoilin et al. [48], the one whose integral is the closest to average energy consumption value over one year [63] has been chosen and scaled proportionally to match exactly with that value. At the beginning of the simulation, the BESS is supposed to be totally charged and to be installed in a controlled environment having a temperature of 25 °C.
4. Results and Discussion
4.1. Design Phase Results
The outputs of the design phase are the SHSs components capacity values, namely , , and , that are collected in Table 8 for every installation site.
Analyzing the results in Table 8, it is possible to observe that large PV systems are required in DK and FR, as results of the combination of low solar radiation and high energy consumption (Table 7). Contrarily, smaller installations are required where the solar irradiance is elevated (IT, ES, PT) or the energy consumption is low (RO). As a consequence of the high peak power, in FR and DK the use of a large size In is required. Concerning the BESS, the size depends on the battery type and particularly on the DoD (Table 1): a big difference among the installation sites exists in relation to the different energy demand.
4.2. Modelling Phase Results
In this subsection the results of the modelling phase are described and discussed: the SHSs designed in the first step of the analysis are modelled and their performances are simulated in order to calculate , and . These results have been evaluated for each battery type and every installation site. Table 9 summarizes the results collecting the maximum and minimum values assumed by the model outputs. The lifespan of the VRFB is not present in Table 9 because, according to the assumptions used to model the ageing, it is equal to 20 years in any case. A full summary of the modelling phase results is provided as Supplementary Materials.
As expected, Deng batteries (LiSBs) have the shortest lifespan among the considered BESSs because of the low number of cycles that can be performed; contrarily, ZEBRA batteries result to have the longest lifespan thanks to their long calendar life. For these reasons, the most and the less long-living batteries are the same regardless of the installation site. Nevertheless, their lifetime values can be slightly different; indeed, the different operative power rates, determined by the combination of the PV productivity and load profiles, can stress the BESS differently in each country.
Focusing on the energy flows evaluation, generally the use of Weber devices (VRFB) requires more backup energy than the others and have the lowest amount of surplus energy. This is due to the low efficiency of this BESS (Table 1) and to the power demand of the pumps. Contrarily Ell batteries (NCM), thanks to their high efficiency, require less backup energy than the others, whereas the surplus energy is the most elevated. Nevertheless, there are some exceptions; indeed, certain combinations of power production, demand, and state of health of the battery can change the ranking (like in DK, ES and FR).
Comparing the installation sites, remarkable variations in terms of imported and exported energy exist as effect of the different sizes of the SHSs components and of the seasonal distribution of the solar radiation. Indeed, in southern installation sites, the solar radiation is more constant than in northern Europe, where variability is higher. Therefore, in FR and DK there is a remarkable difference between the summer and the winter in terms of PV productivity and, as the systems are designed for winter conditions, the missing and surplus energy are in respect to an optimum balance, higher than in the other sites.
Another piece of information provided by the simulation model is the operative BESS power rate that, as assumed preliminarily, is not a limiting factor as the maximum values are about 0.35 h−1. Indeed, all the BESSs can reach maximum rates of at least 0.7 h−1 [64] whereas VRFBs are designed to reach 0.5 h−1.
4.3. LCA Results
In this section the results of the environmental assessment are illustrated: first the results will be depicted using midpoint indicators and then as single score impact values summarizing all the 17 impact categories proposed by ReCiPe for every SHSs and every installation site.
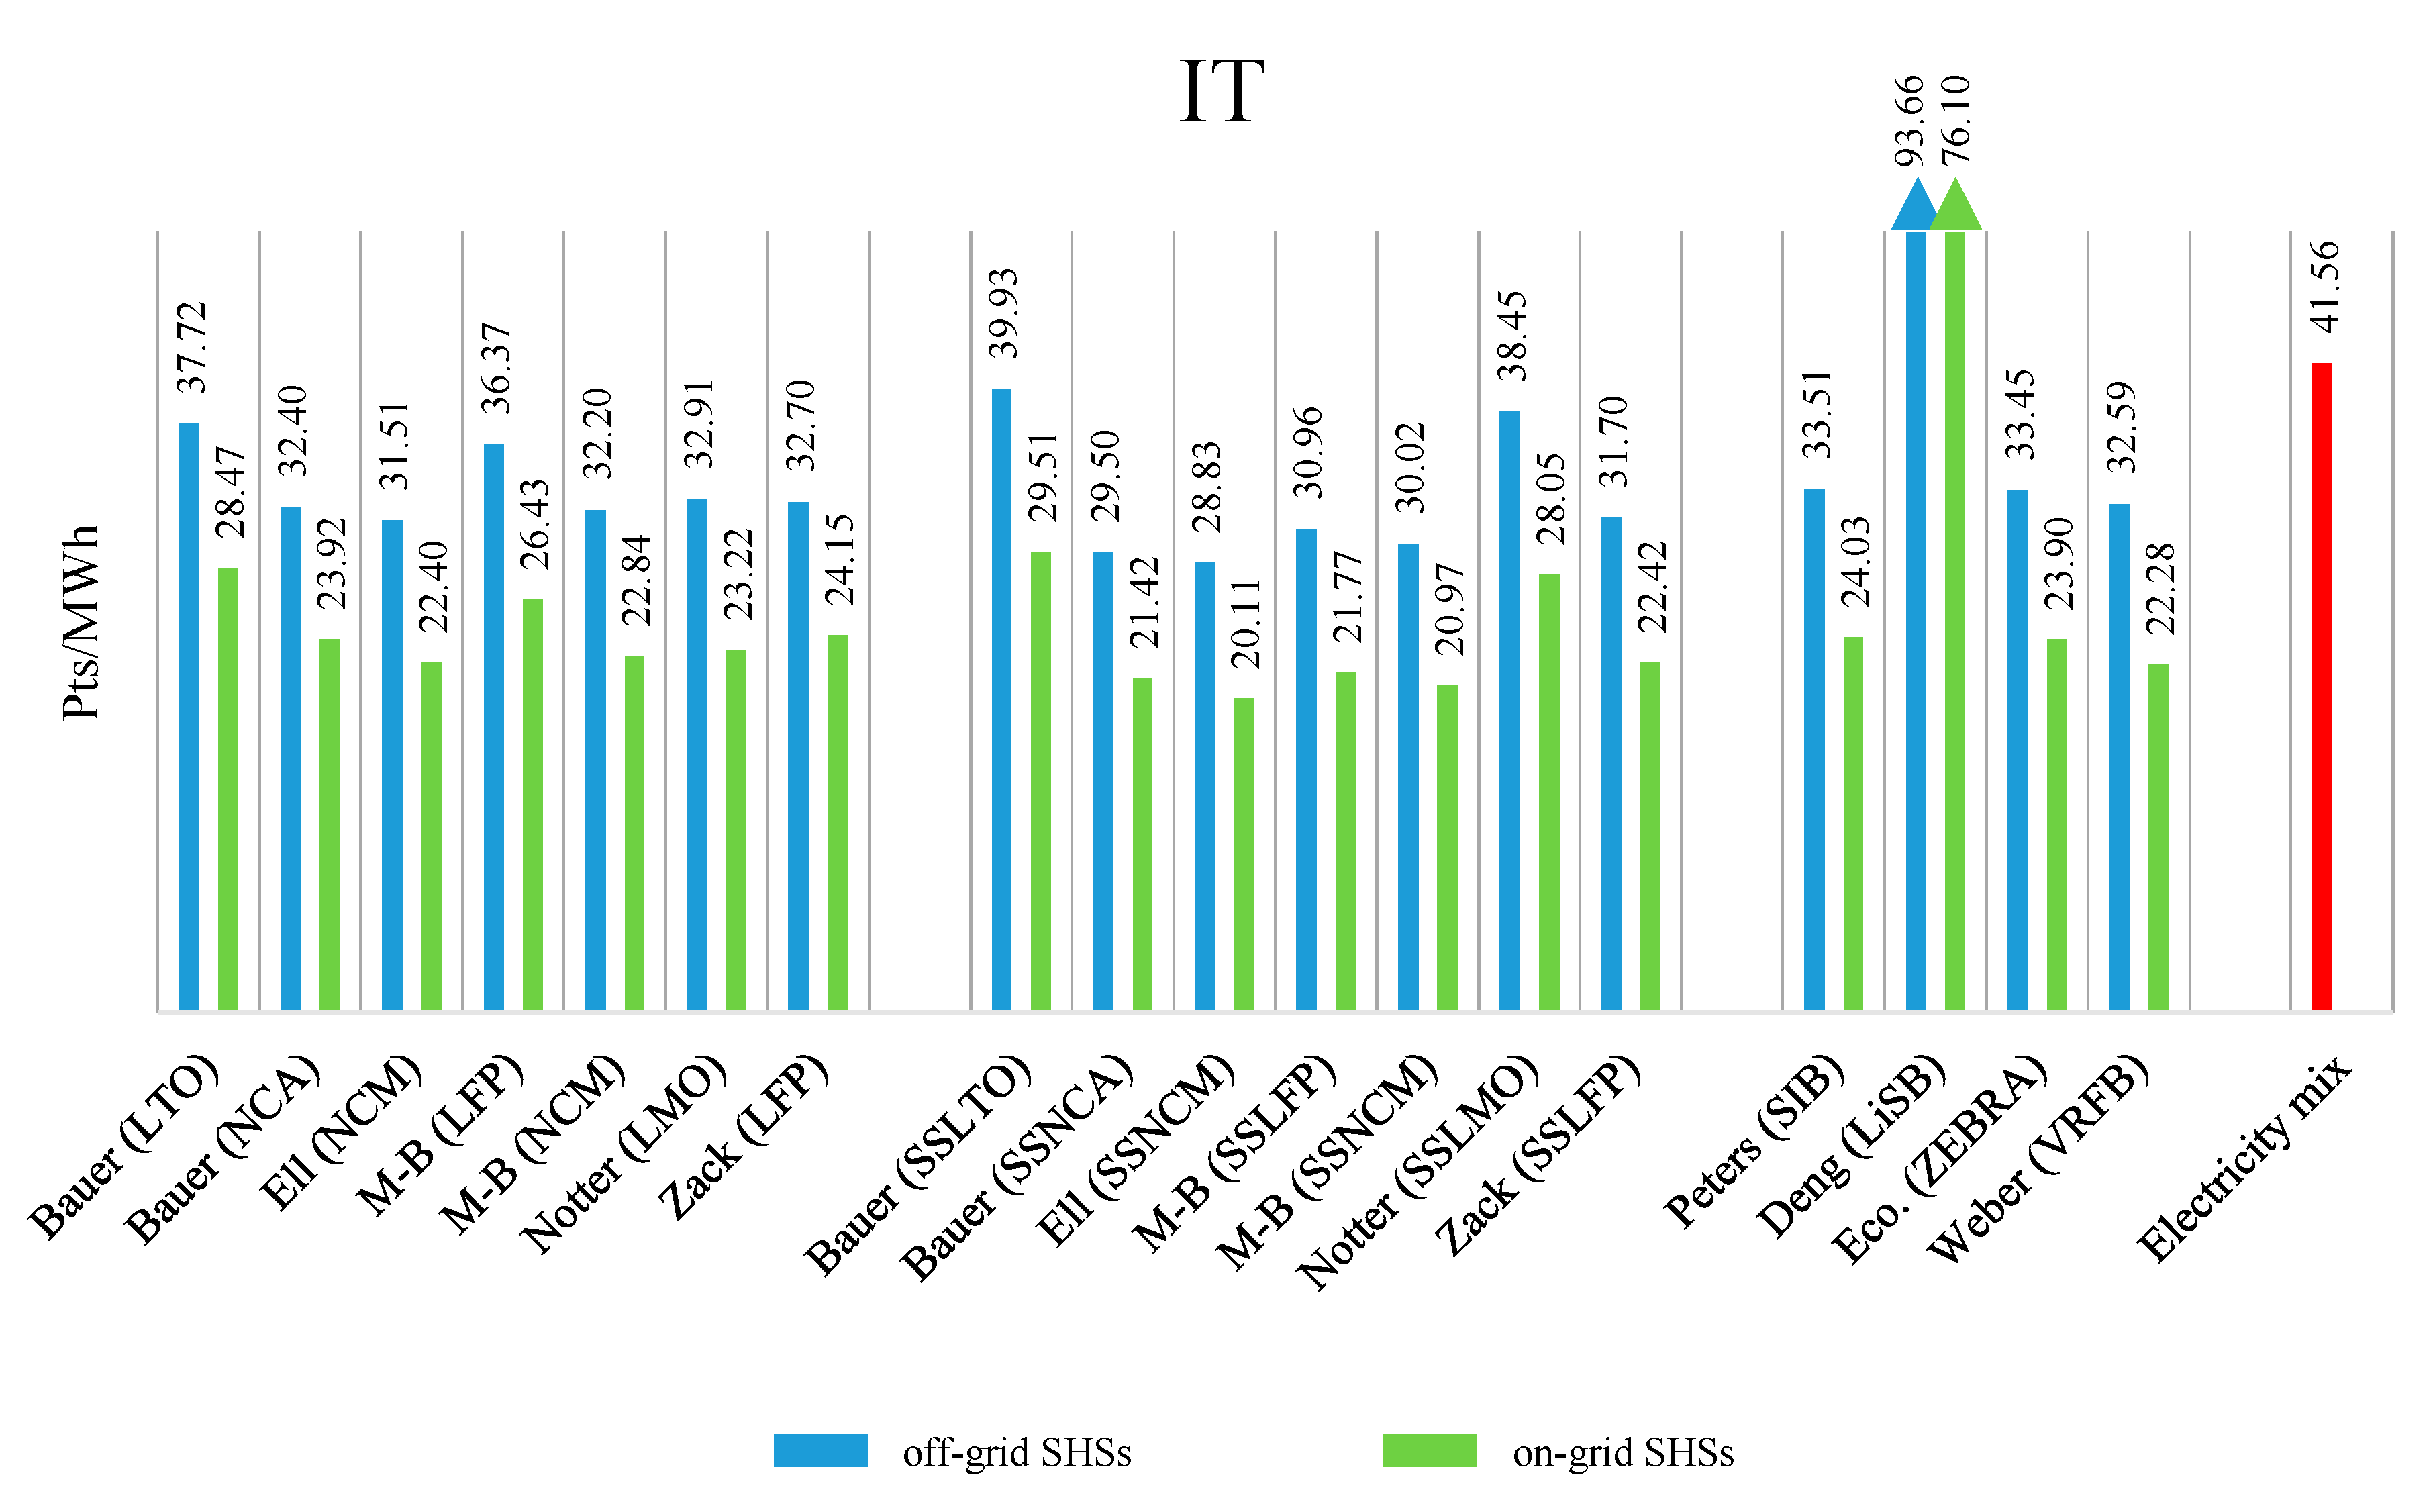
To provide a synthetic description of SHSs midpoint environmental performances, their eco-profiles will be focusing on a single installation site and three midpoint indicators. Similarly to our previous paper [40], Italy has been selected as reference location for SHSs whereas those indicators representing the highest contributions to the total environmental impact have been chosen: climate change, human toxicity and fossil fuel depletion.
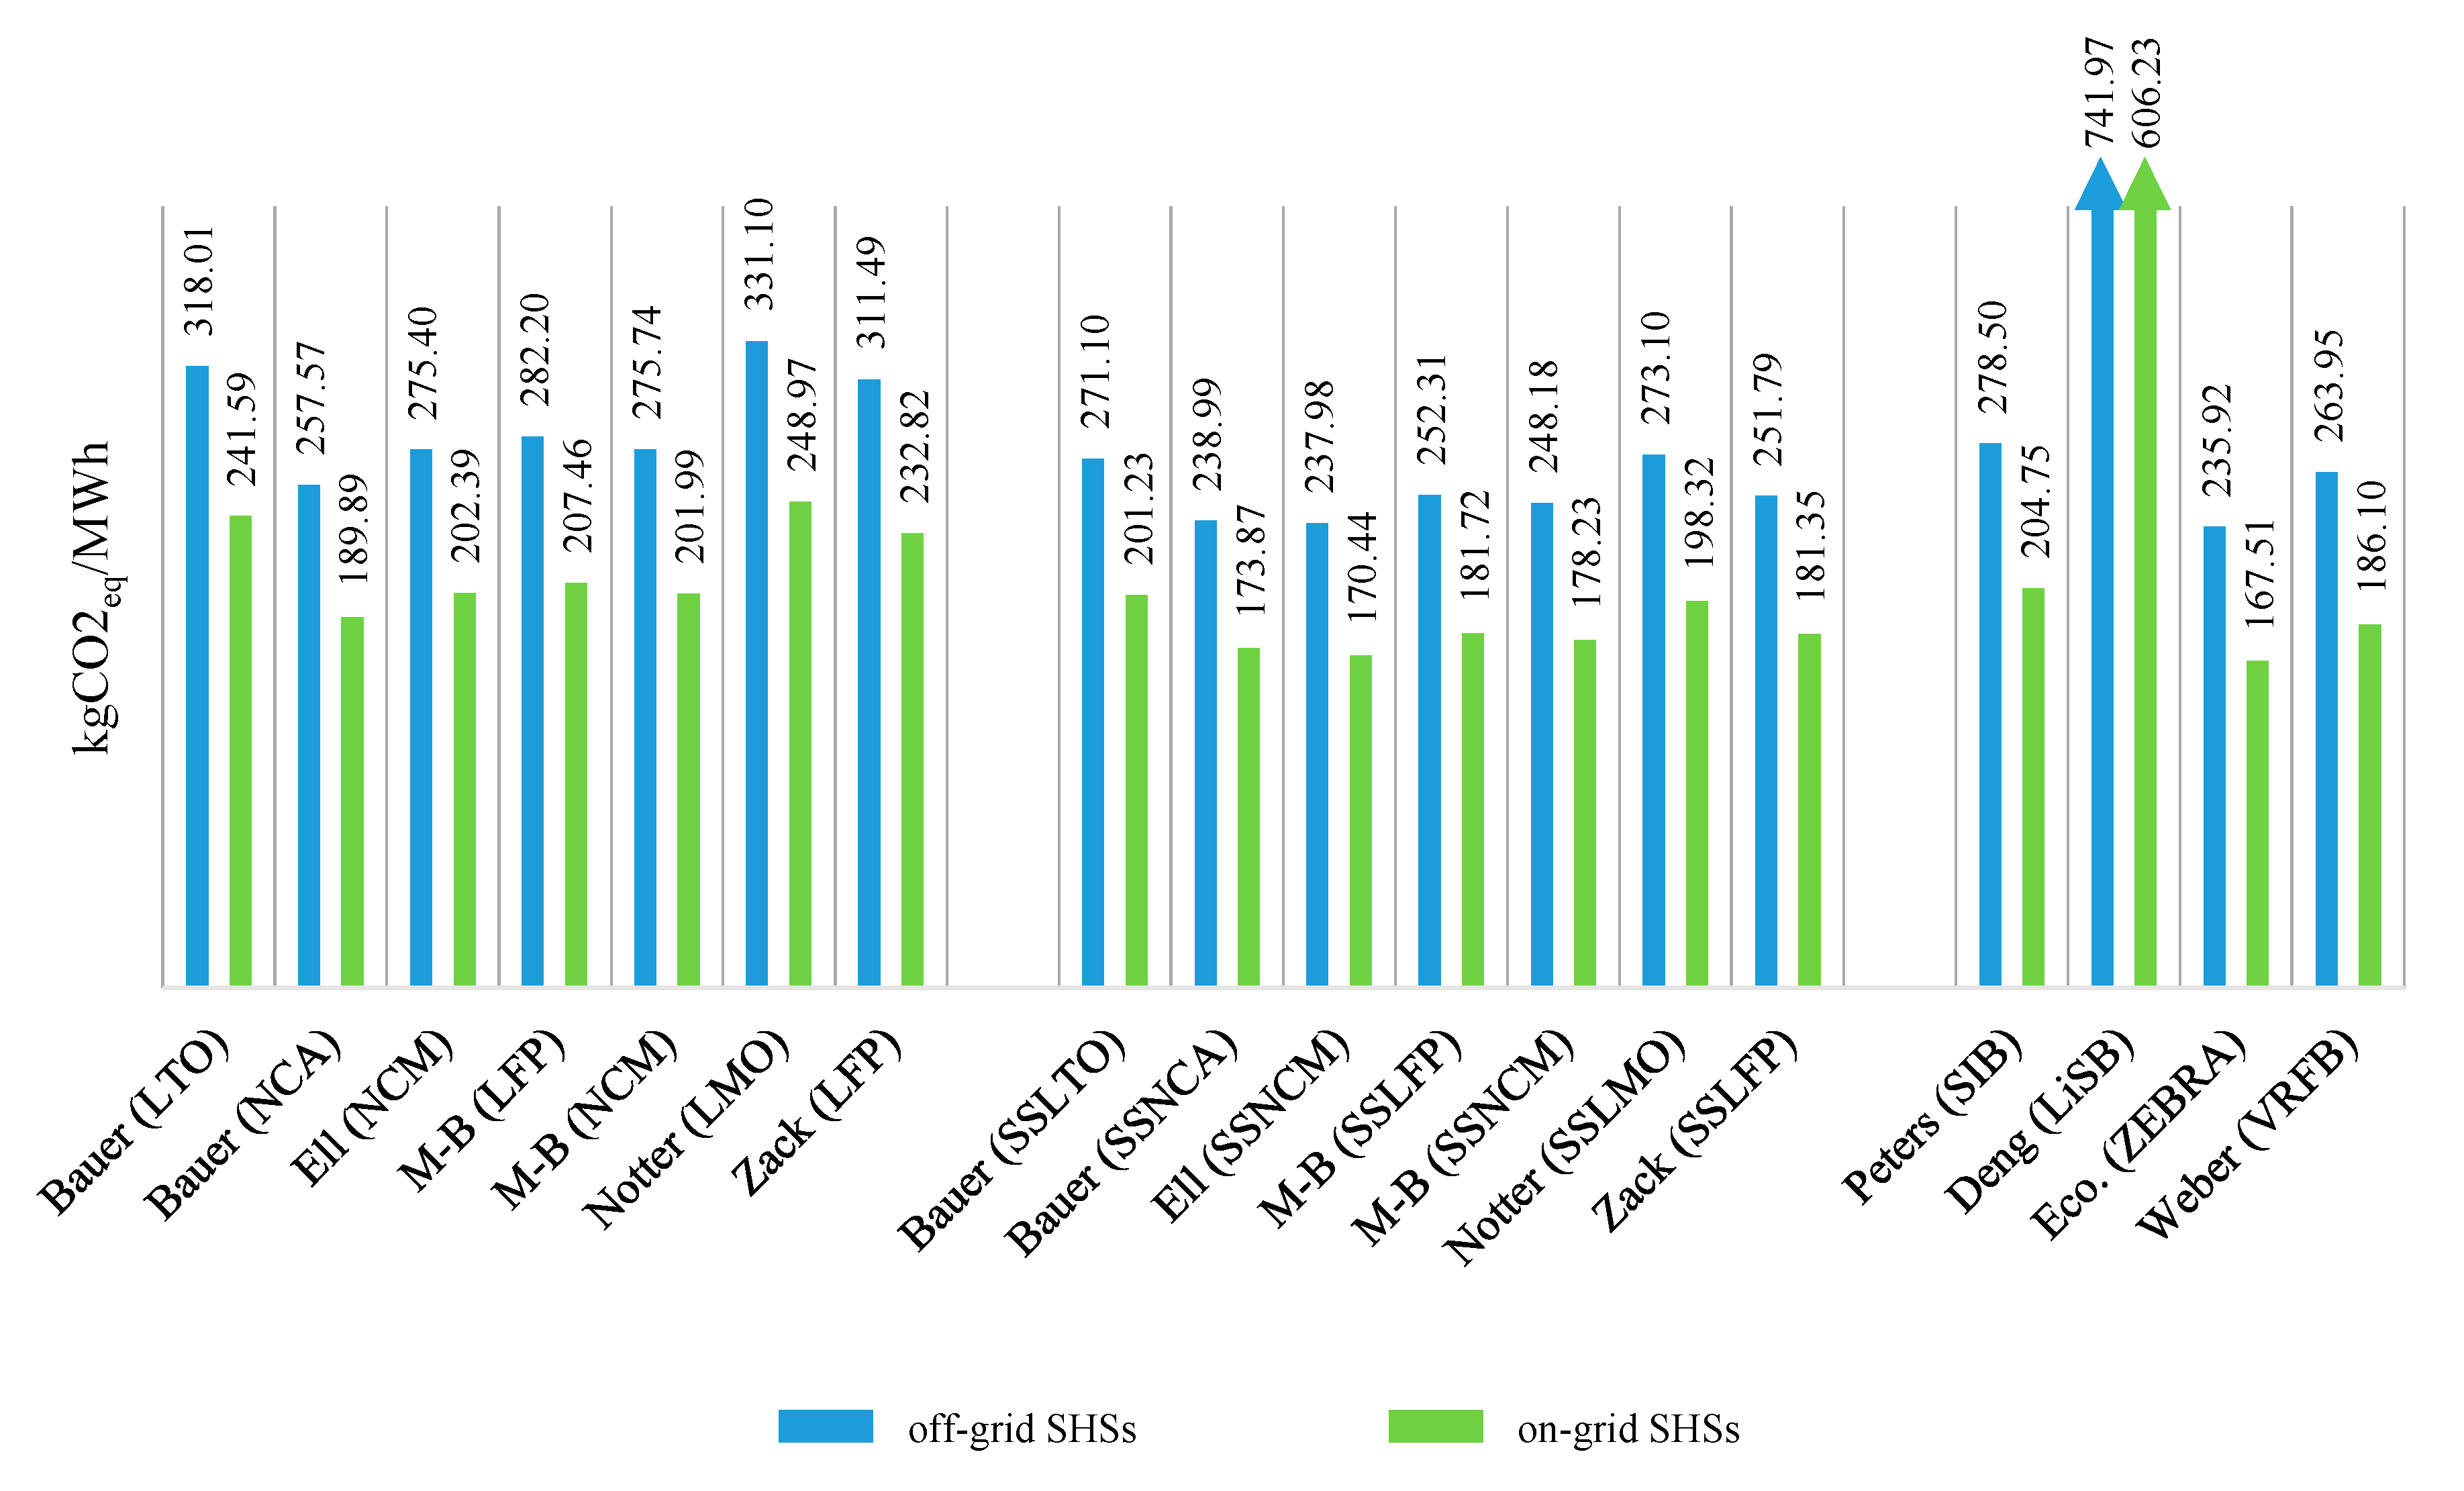
The climate change indicator represents the amount of greenhouse gases emitted during SHSs’ life cycles expressed as carbon dioxide equivalents (kgCO2eq/MWh) and is illustrated in Figure 2.
The results underline that installing Ell (SSNCM) batteries allows one to minimize the climate changes burden: in on-grid systems, 61% of this burden is due to the energy embedded in the PV panels production, whereas the BESS accounts for 15% of the total. The impact of off-grid systems is clearly higher than grid-connected ones because of the contribution of the backup energy that increases from 15% to 30% whether the grid is replaced by a diesel generator. Contrarily Deng batteries (LiSBs) are by far the most impactful BESS because of their very short lifespan, indeed in both configurations it represents more than 70% of the total contribution.
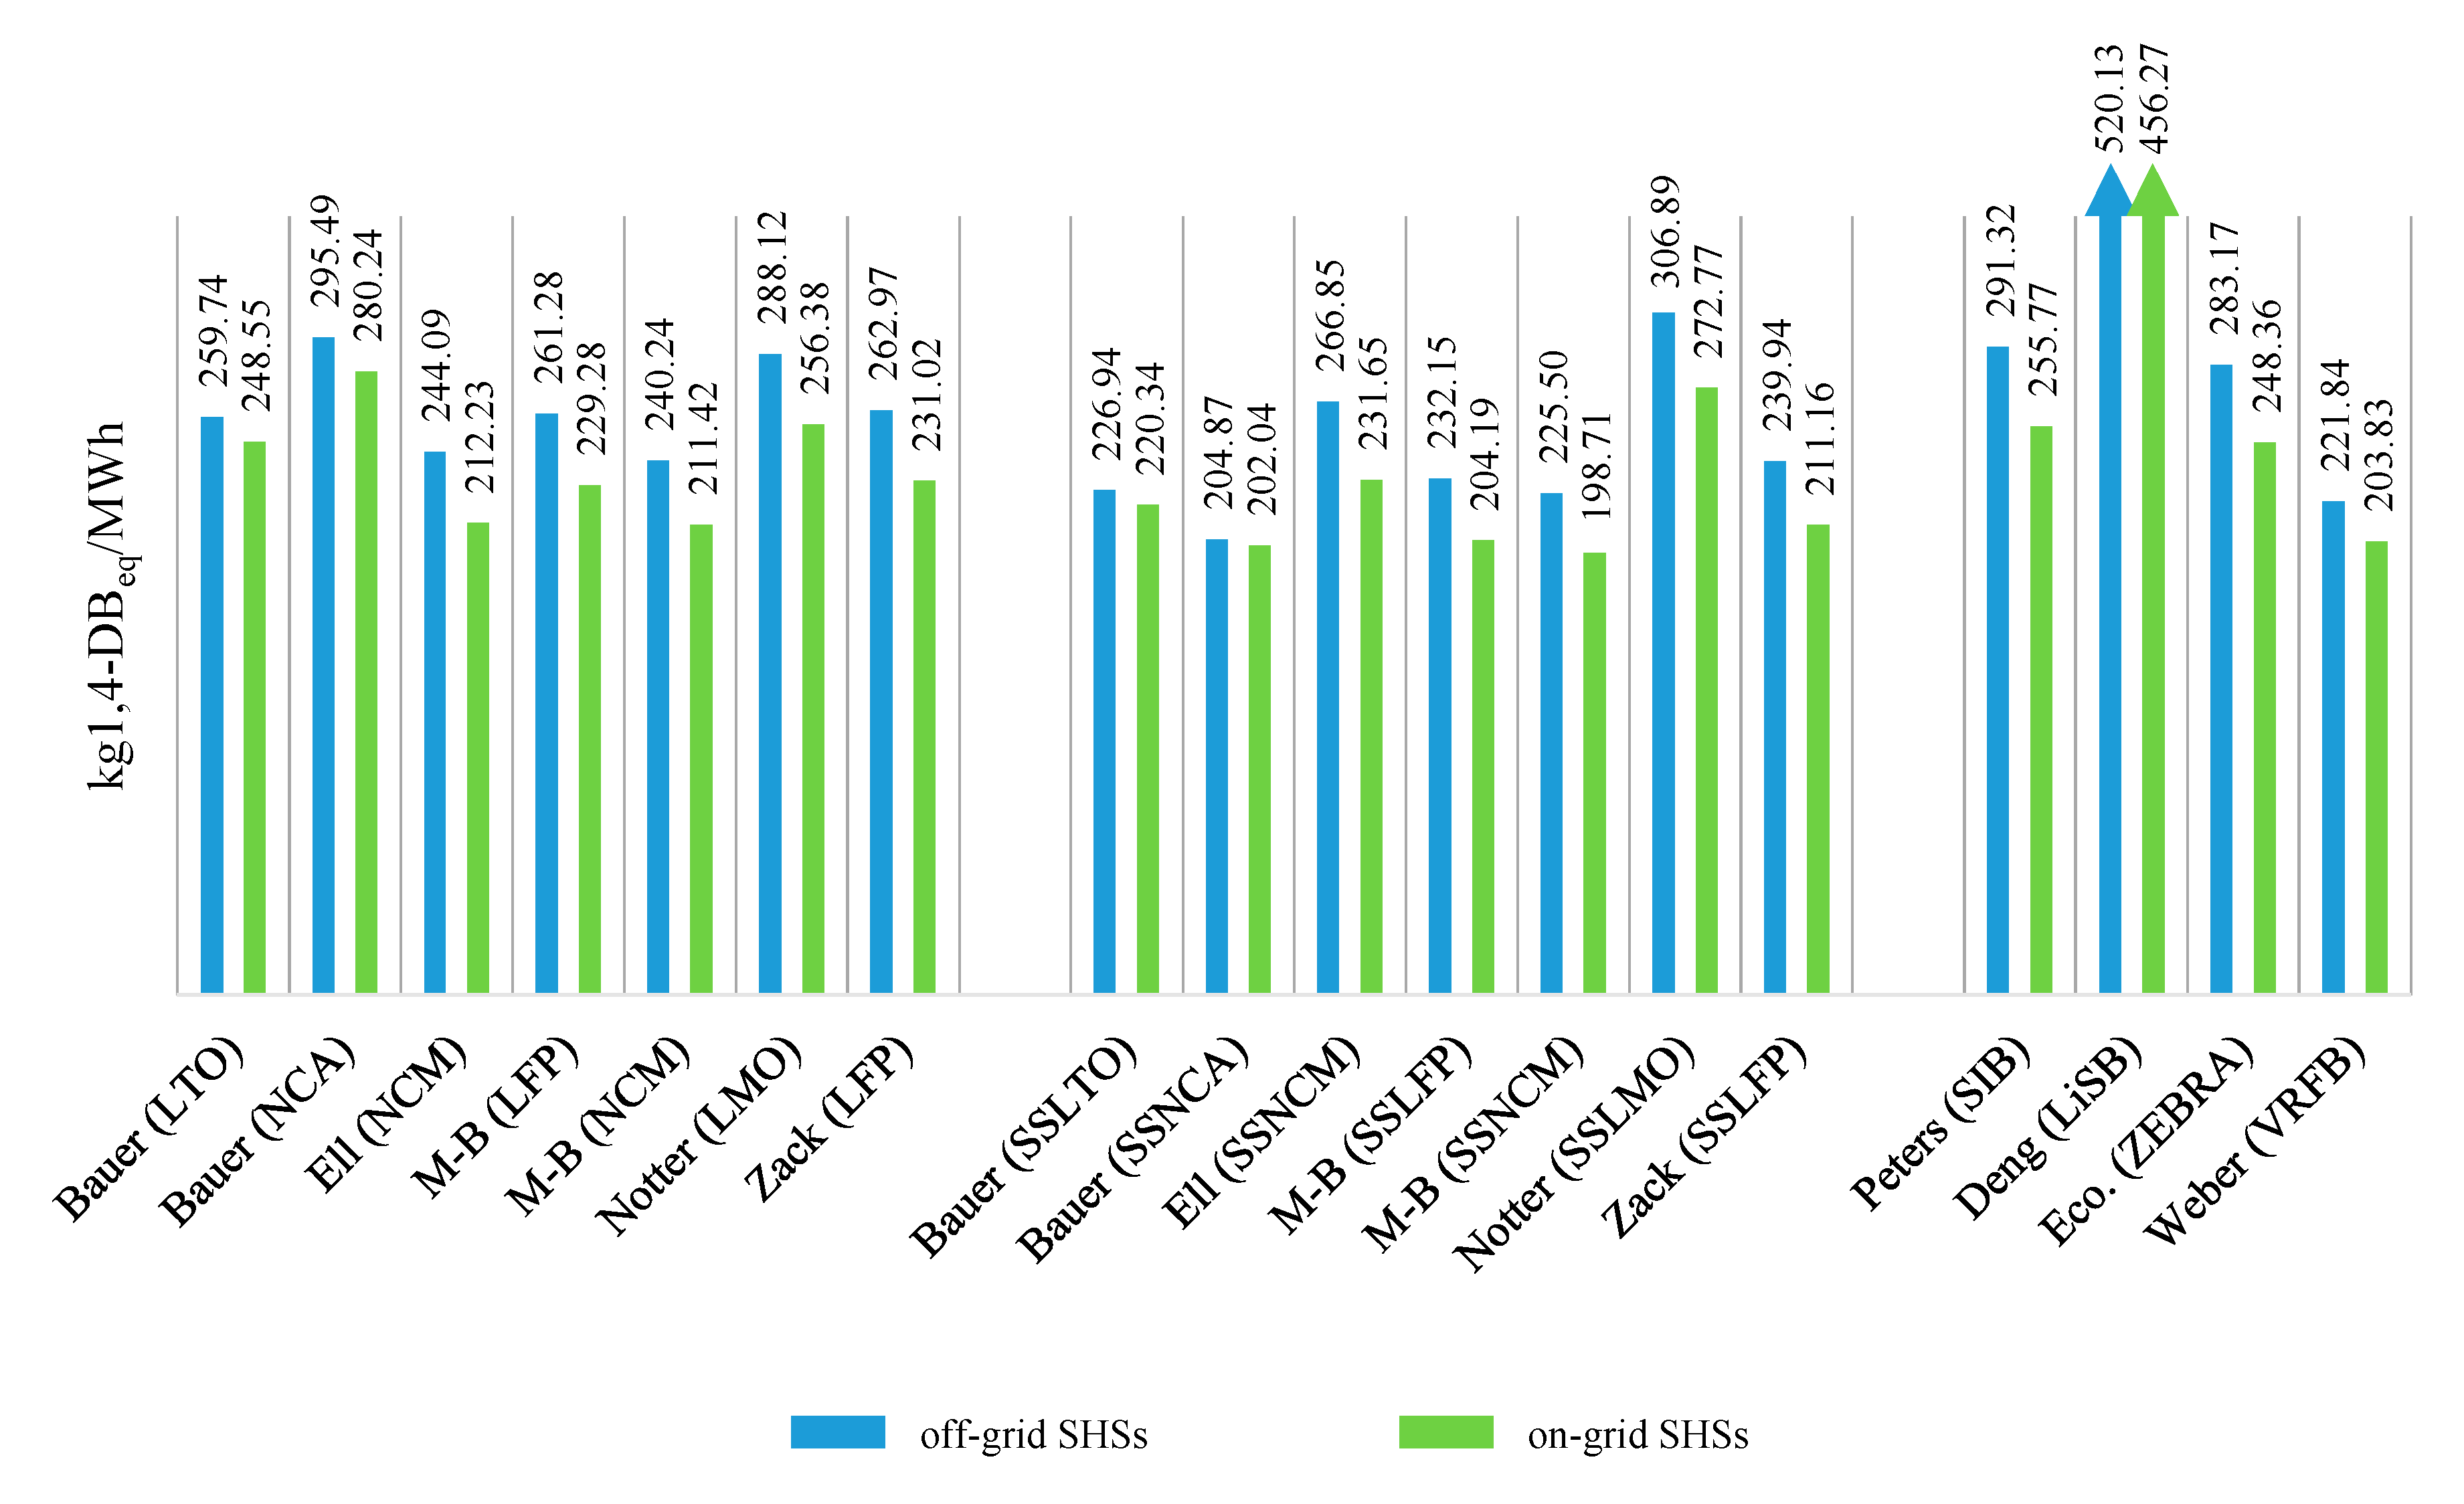
Concerning the human toxicity, measured as equivalent 1,4-dichlorobenzene (kg 1,4-DB/MWh), similar considerations can be made: Figure 3 shows that M-B (SSNCM) are the most sustainable choice for this category. Like in the discussion of climate change indicator, the PV system is the main factor responsible for this burden accounting for about 50% of the total in both SHS configurations. Recycling copper and other metals is fundamental to lower the BESS from 30% to 10% of the total human toxicity impact. Also concerning this indicator, Deng batteries (LiSBs) have the worst eco-profile and their contribution to the SHS impact is higher than 60%.
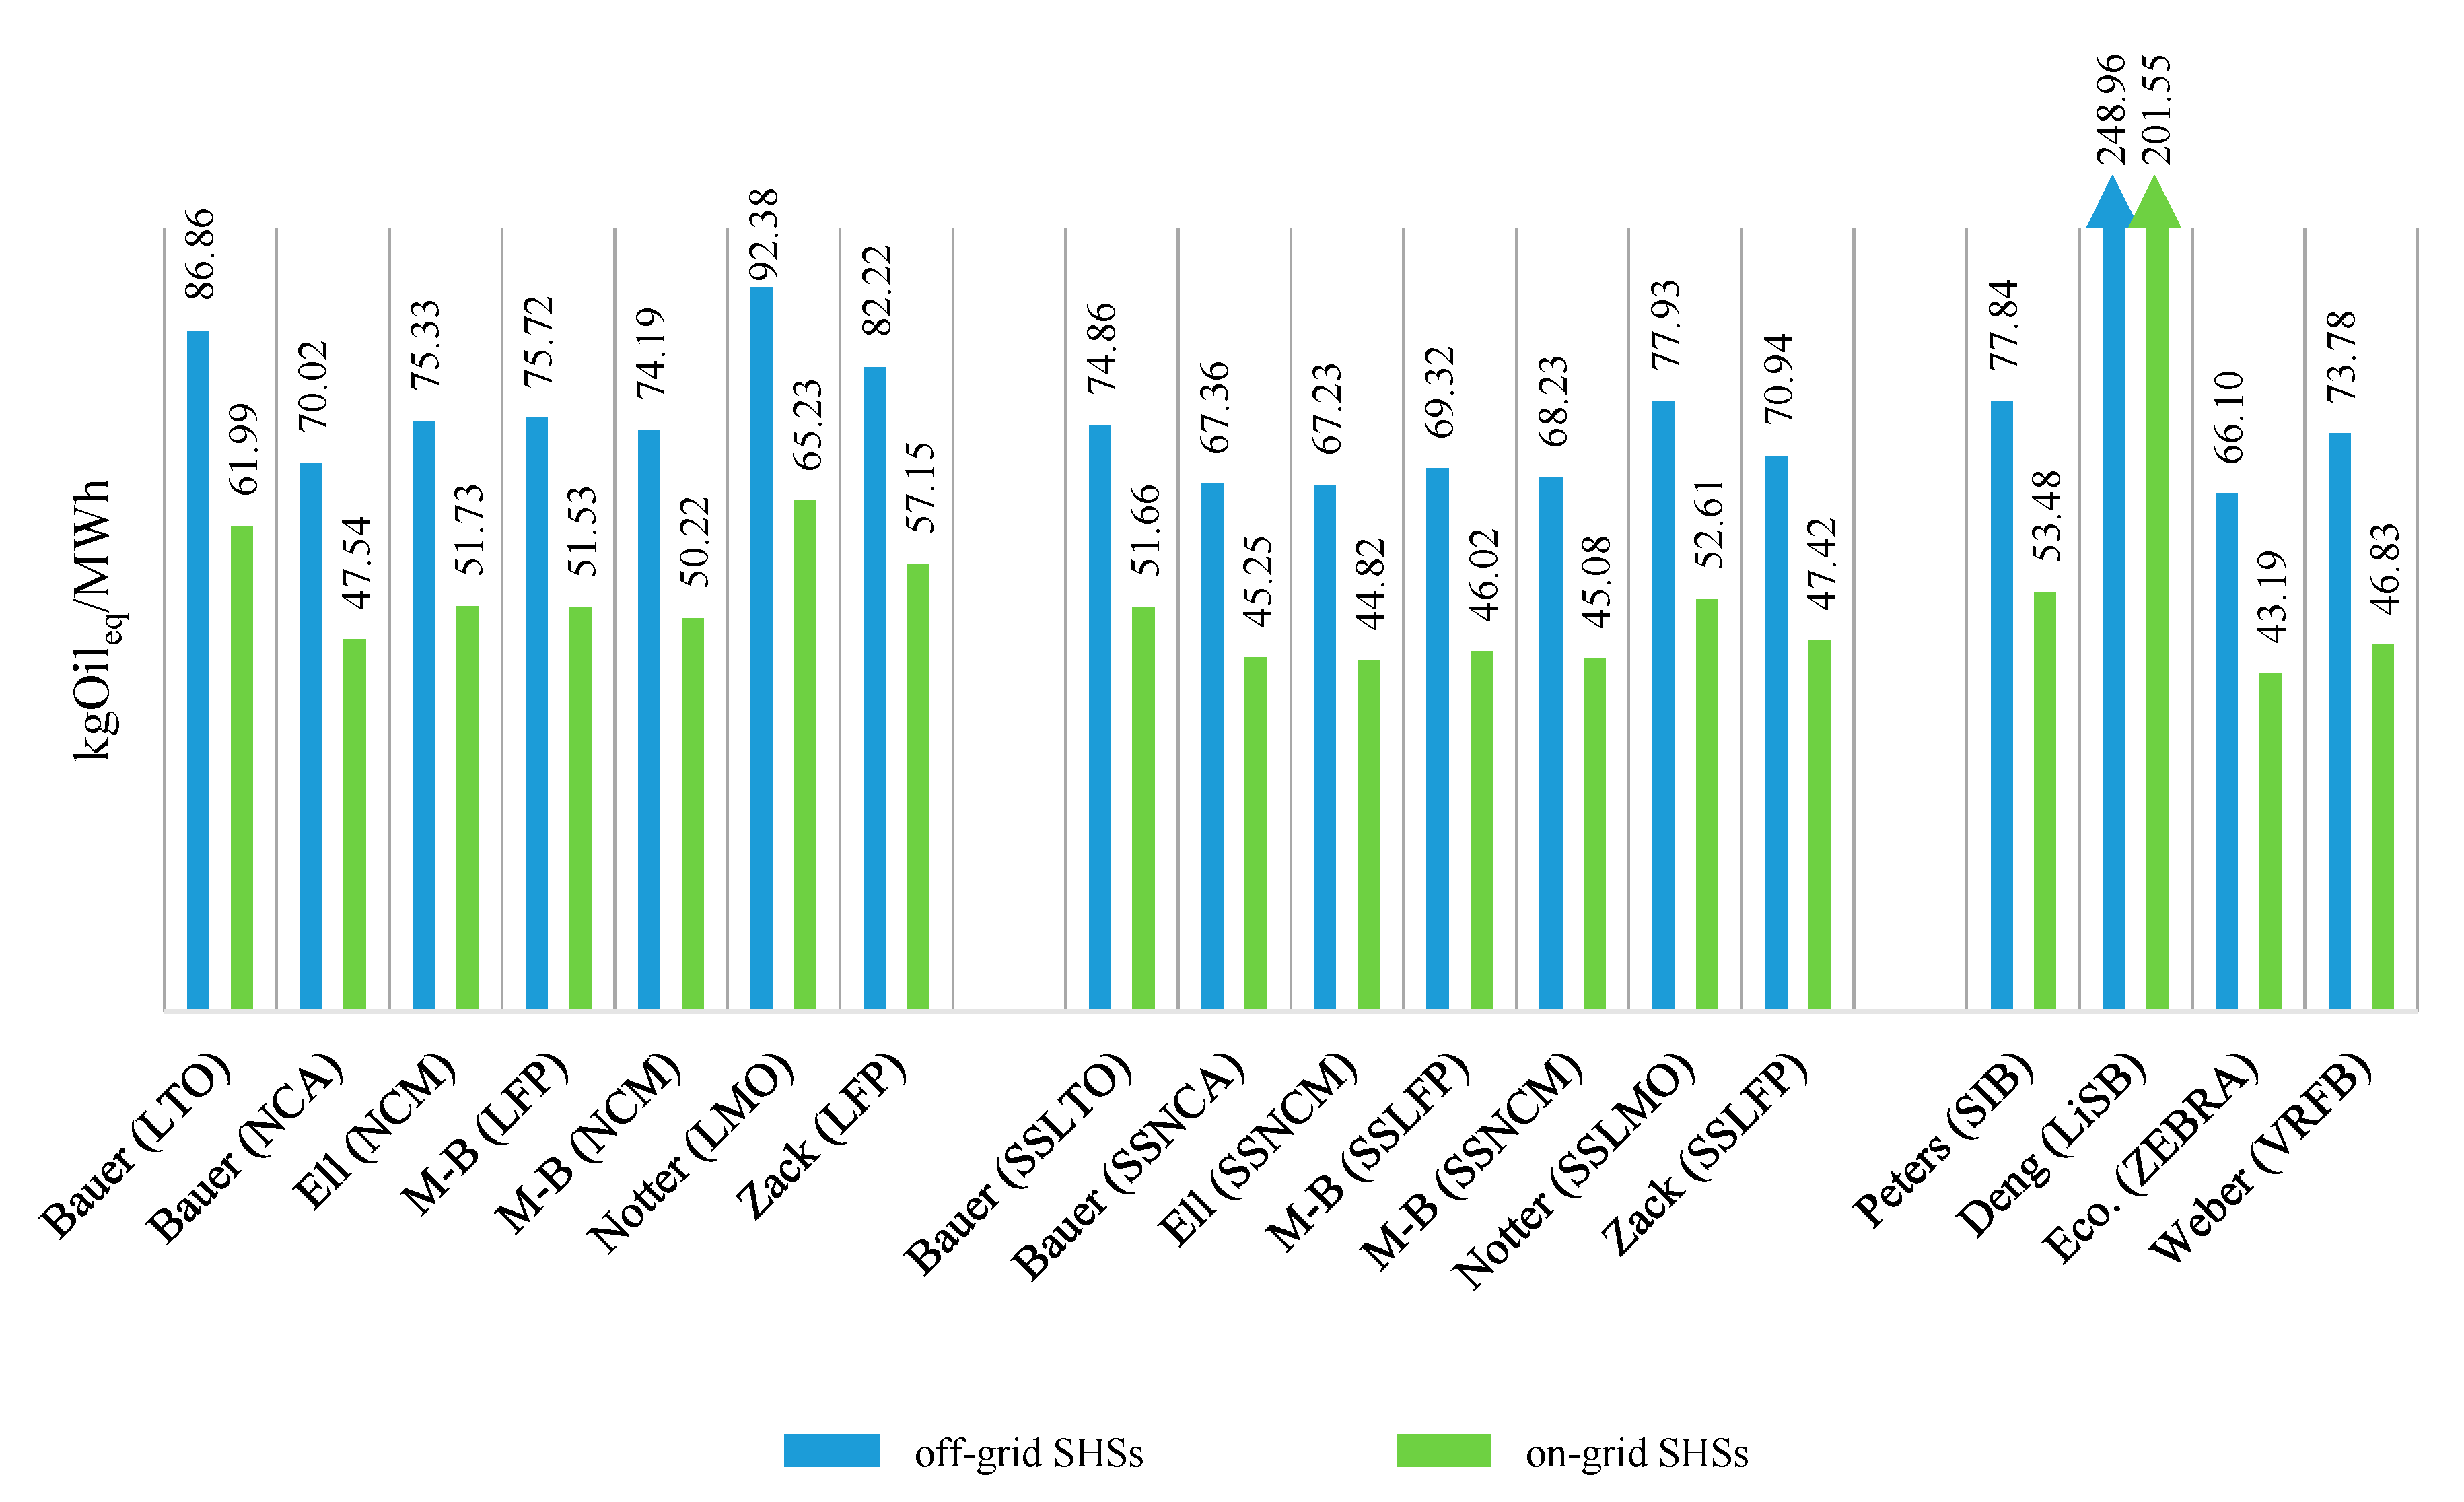
The last considered midpoint indicator is the fossil-fuel depletion: it is important to stress that SHSs’ impact on fossil resources is more than on the metal because of the positive effects of BESS recycling. This impact category is evaluated as the equivalent amount of oil consumed over the product system life cycle (kgOileq/MWh) and the results are illustrated in Figure 4.
The most sustainable battery type is, in this case, Eco. (ZEBRA): its percentage contribution is 8% in off-grid systems and 10% in on-grid ones. In both configurations the PV system production represents the main feature responsible for this indicator as the percentage burden is 47% in off-grid and 60% in on-grid SHSs. The remarkable impact difference between these arrangements is due to the backup energy, representing 37% of the total impact whether provided by diesel and 18% in case on off-grid systems. The same considerations concerning Deng devices’ (LiSBs) effects on climate changes and human toxicity are valid for fossil-fuel depletion as good and the BESS percentage burden is over 70% of the SHS one. The above midpoint indicators evaluated for all the other installation sites are provided as Supplementary Materials.
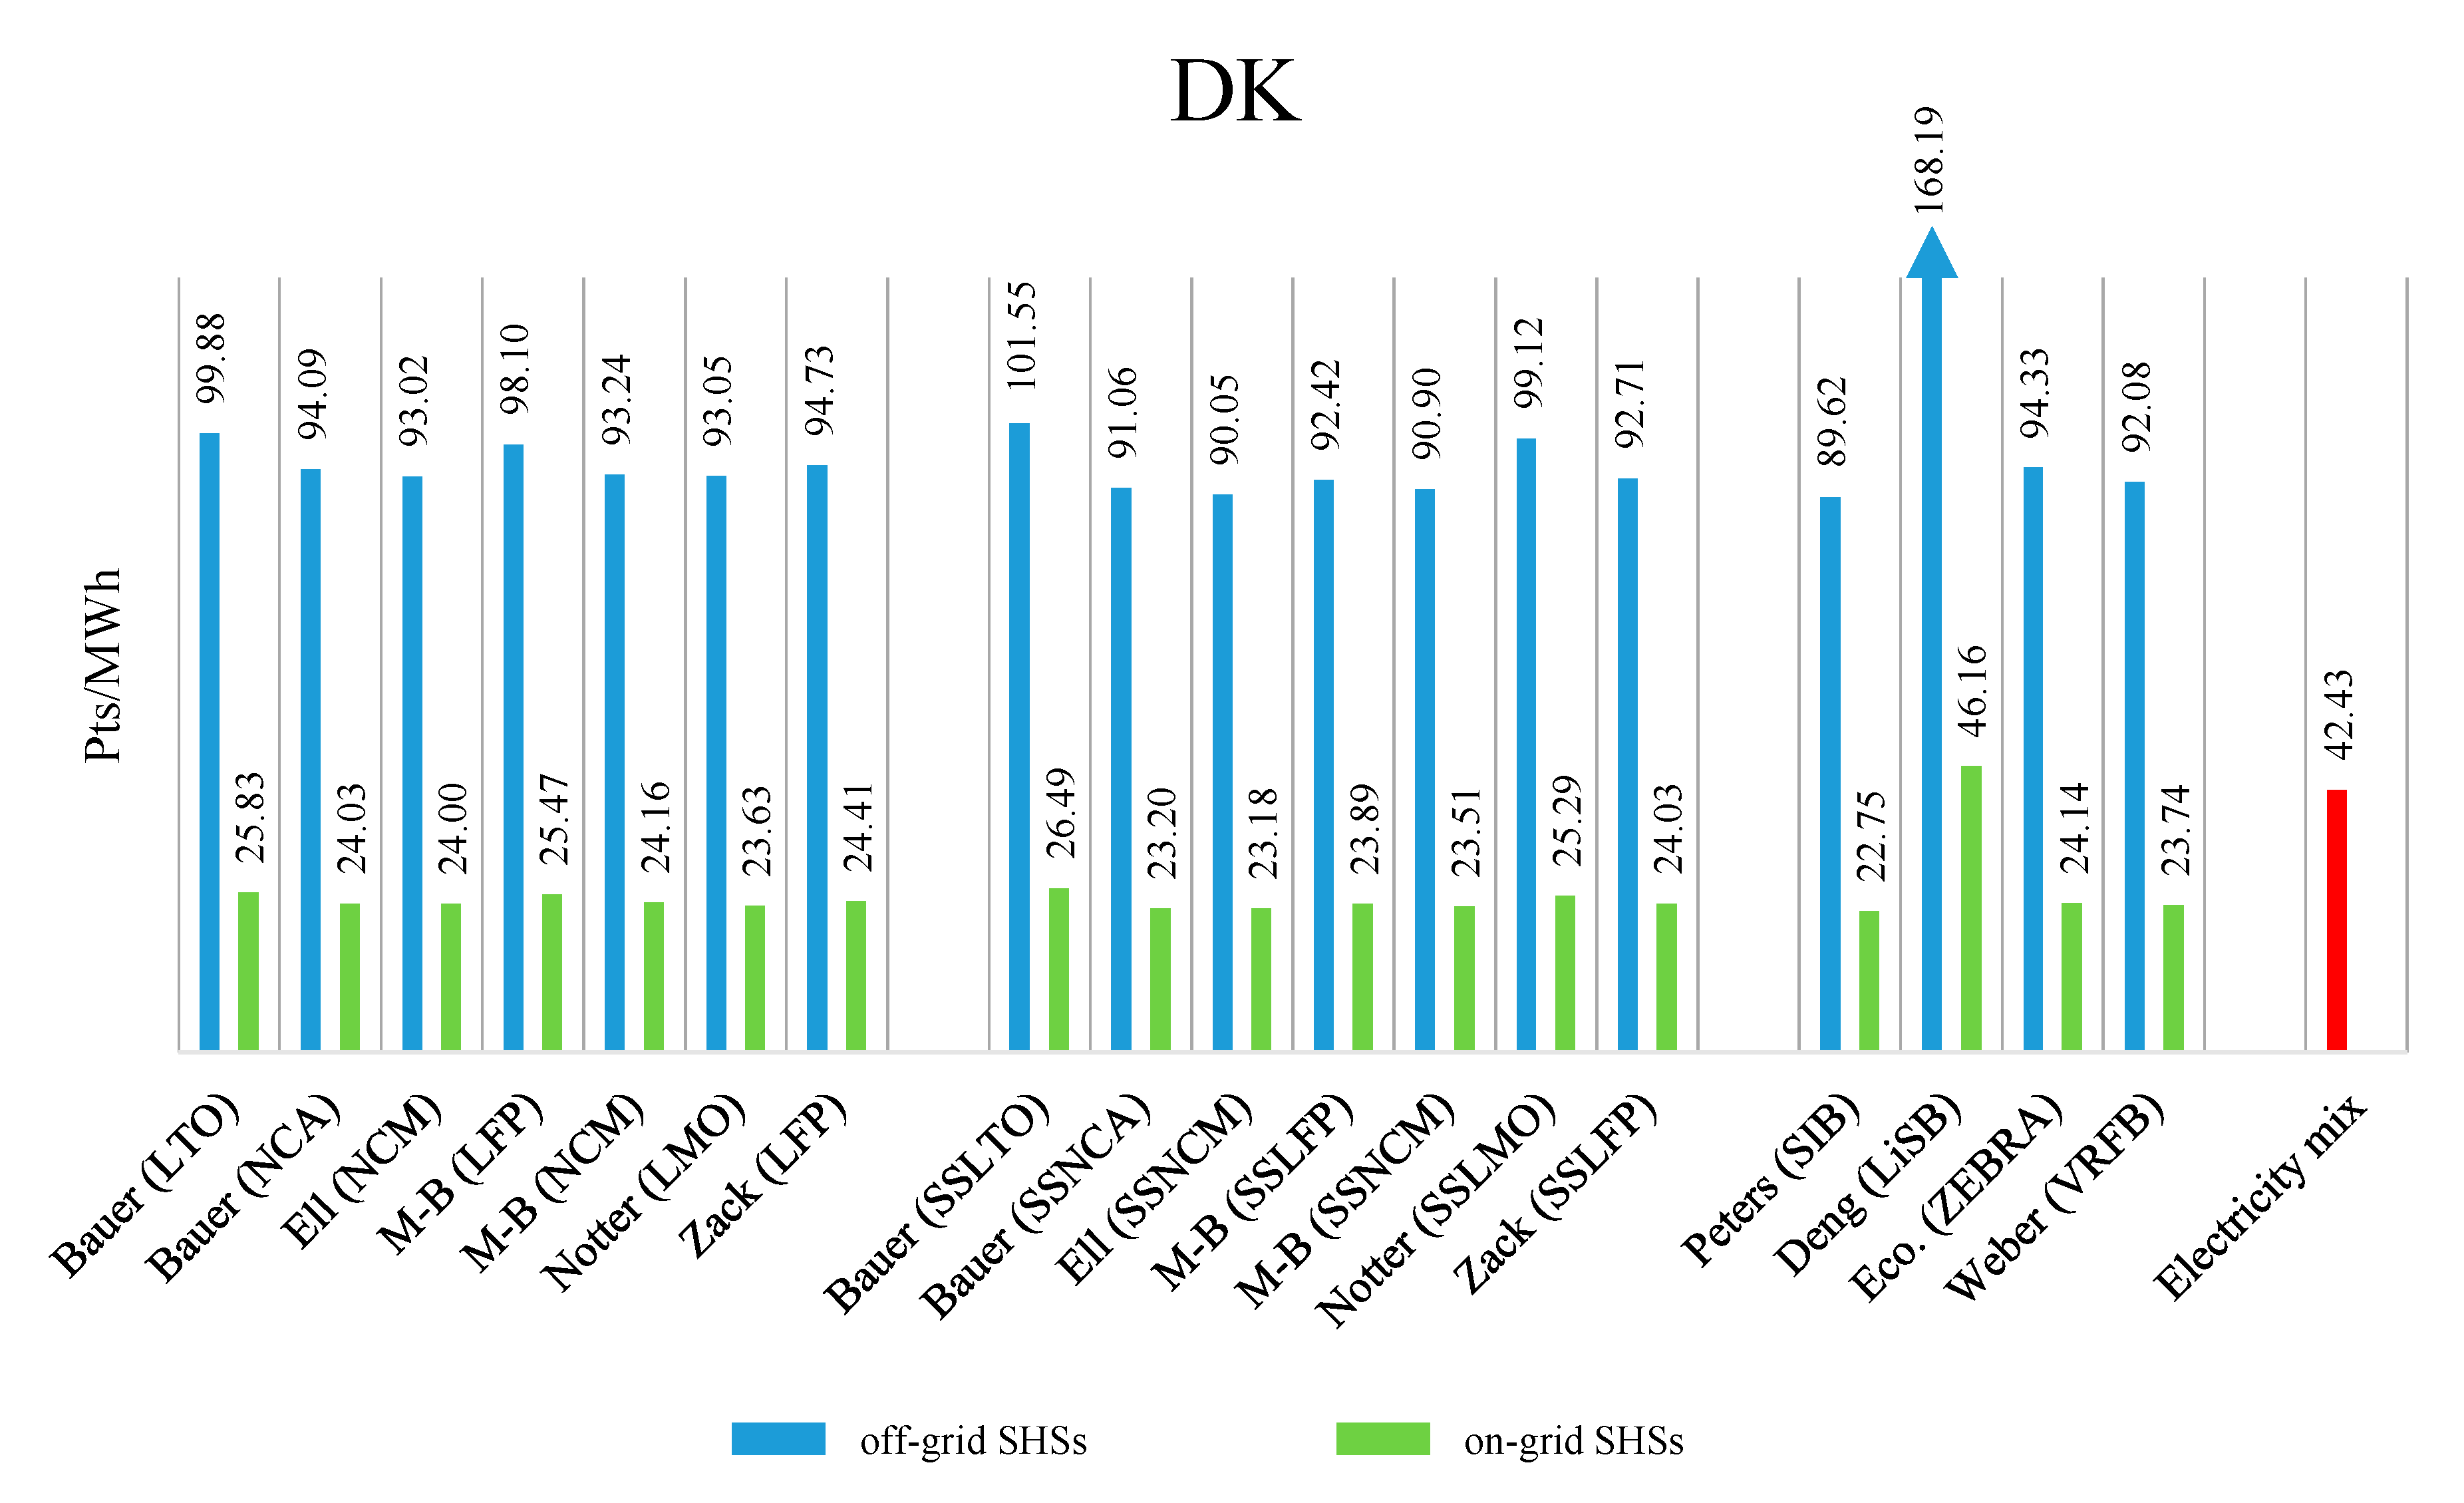
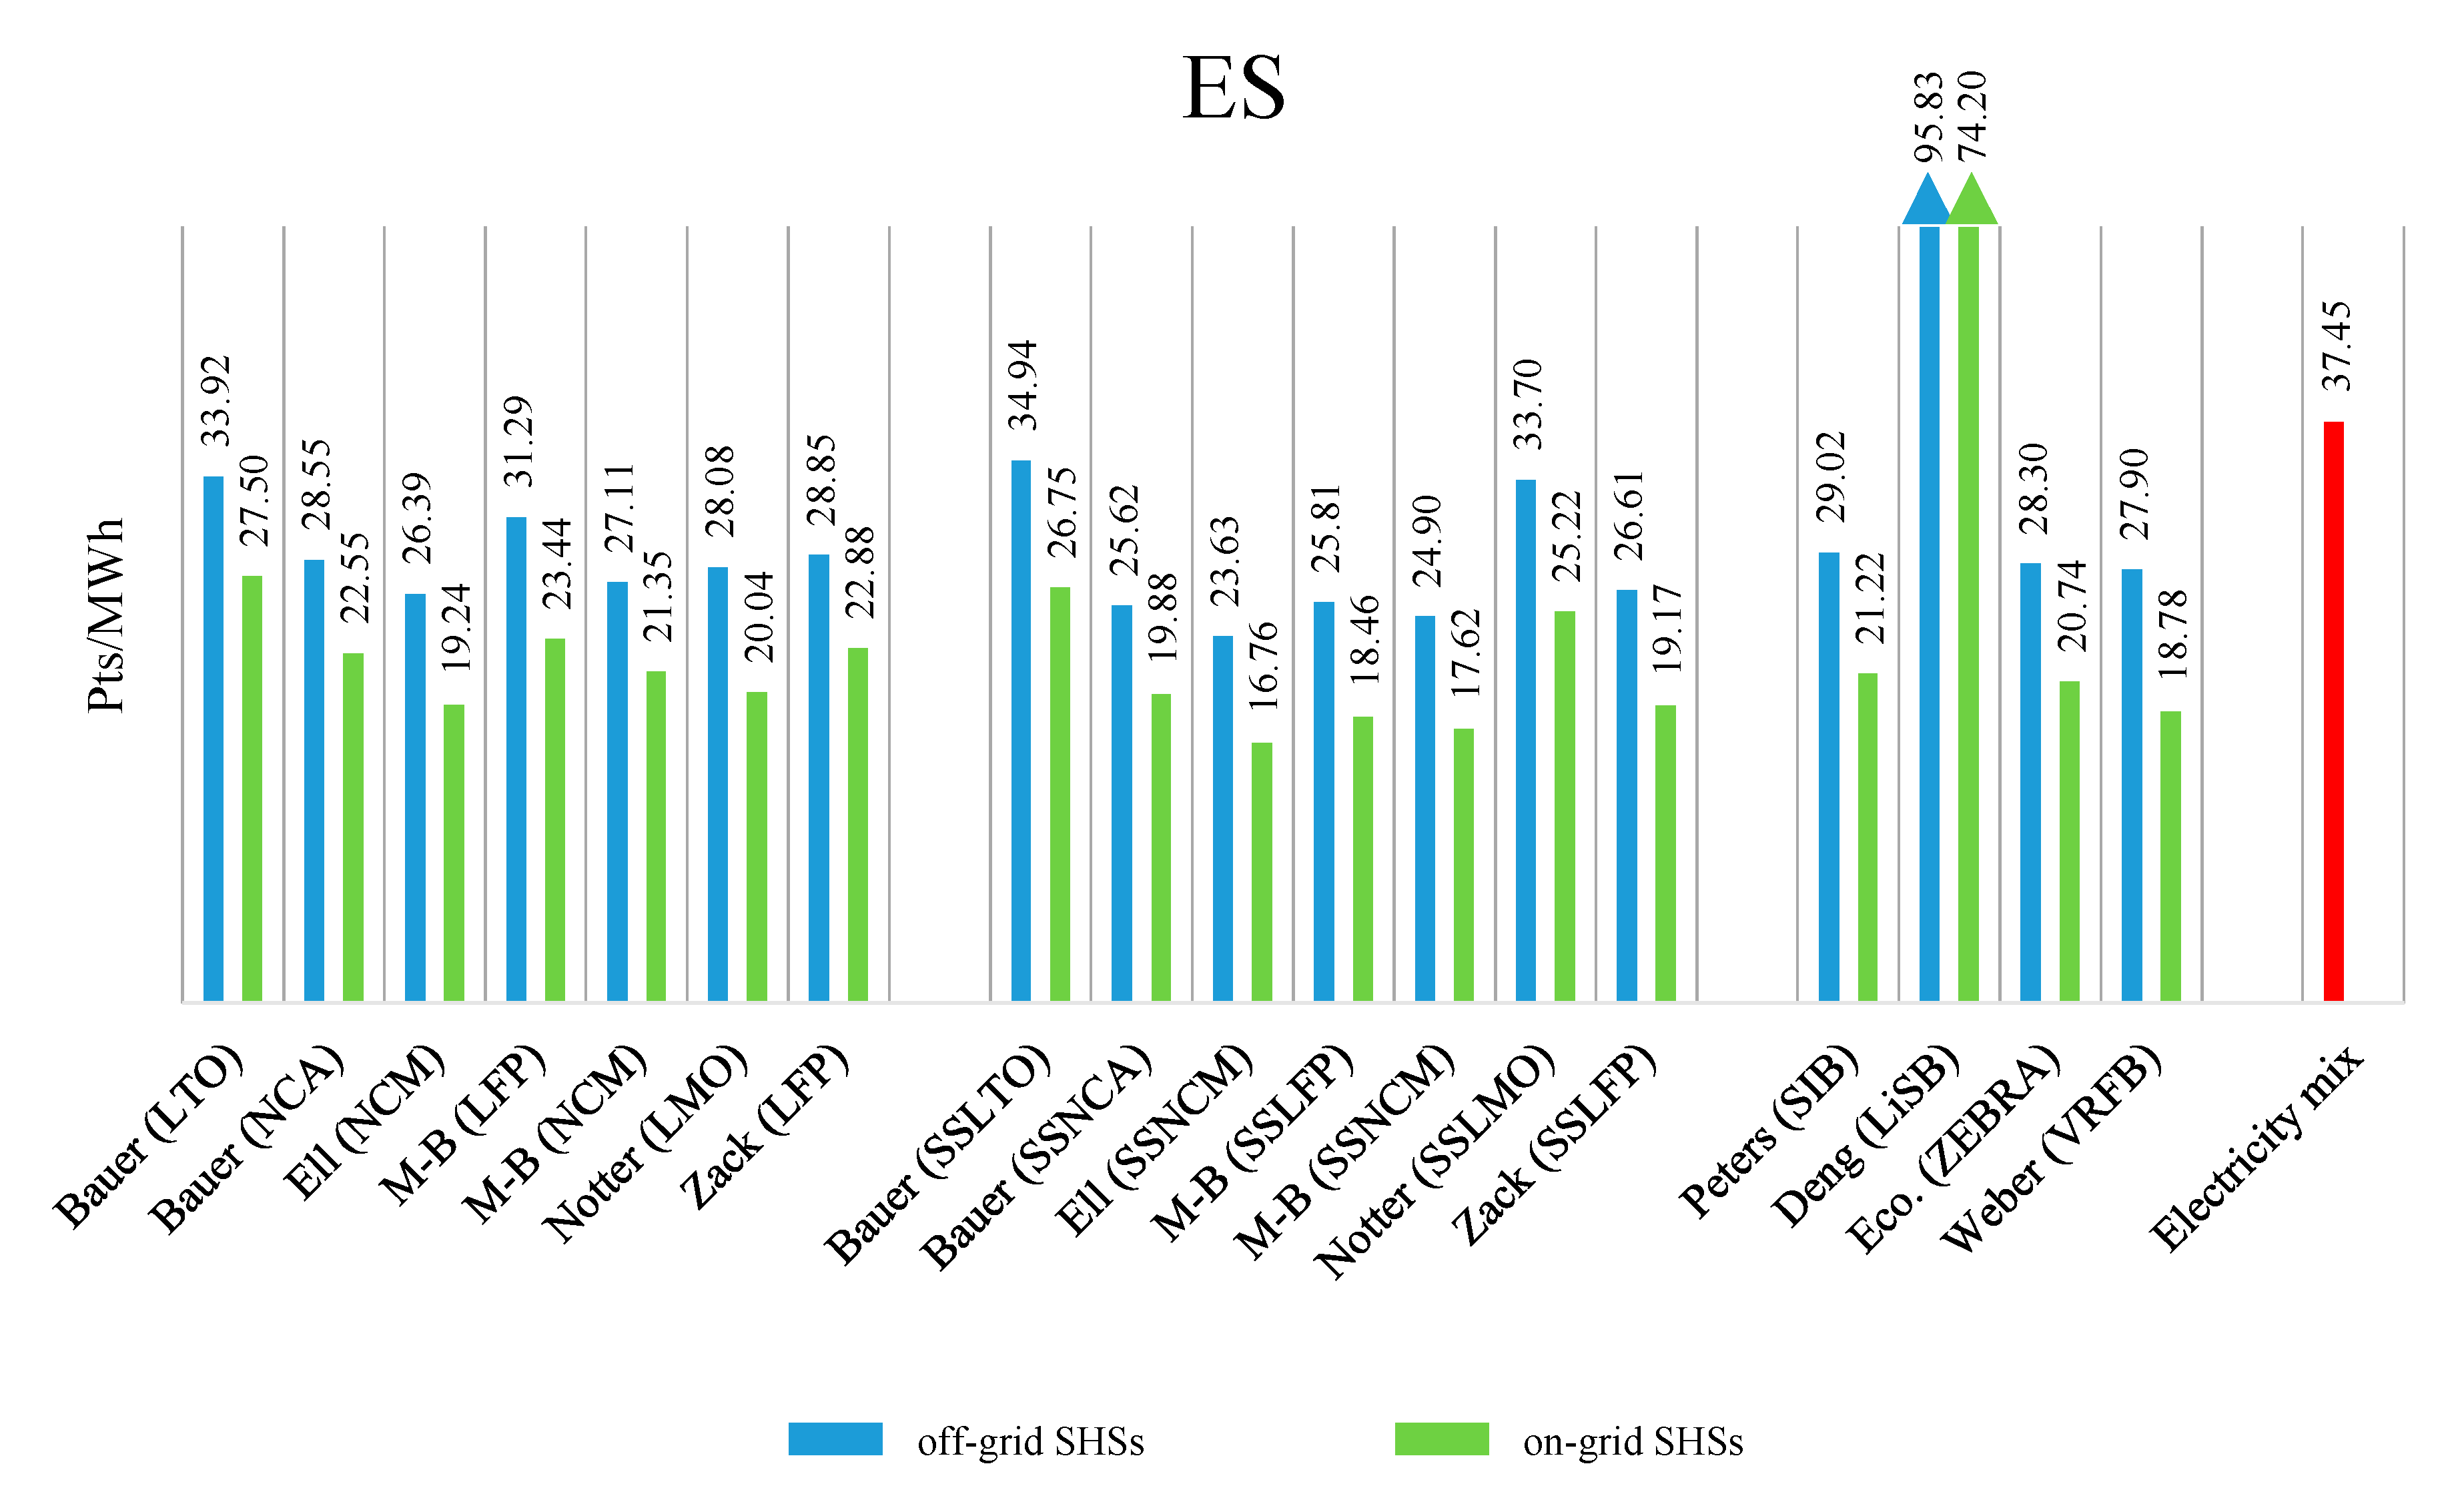
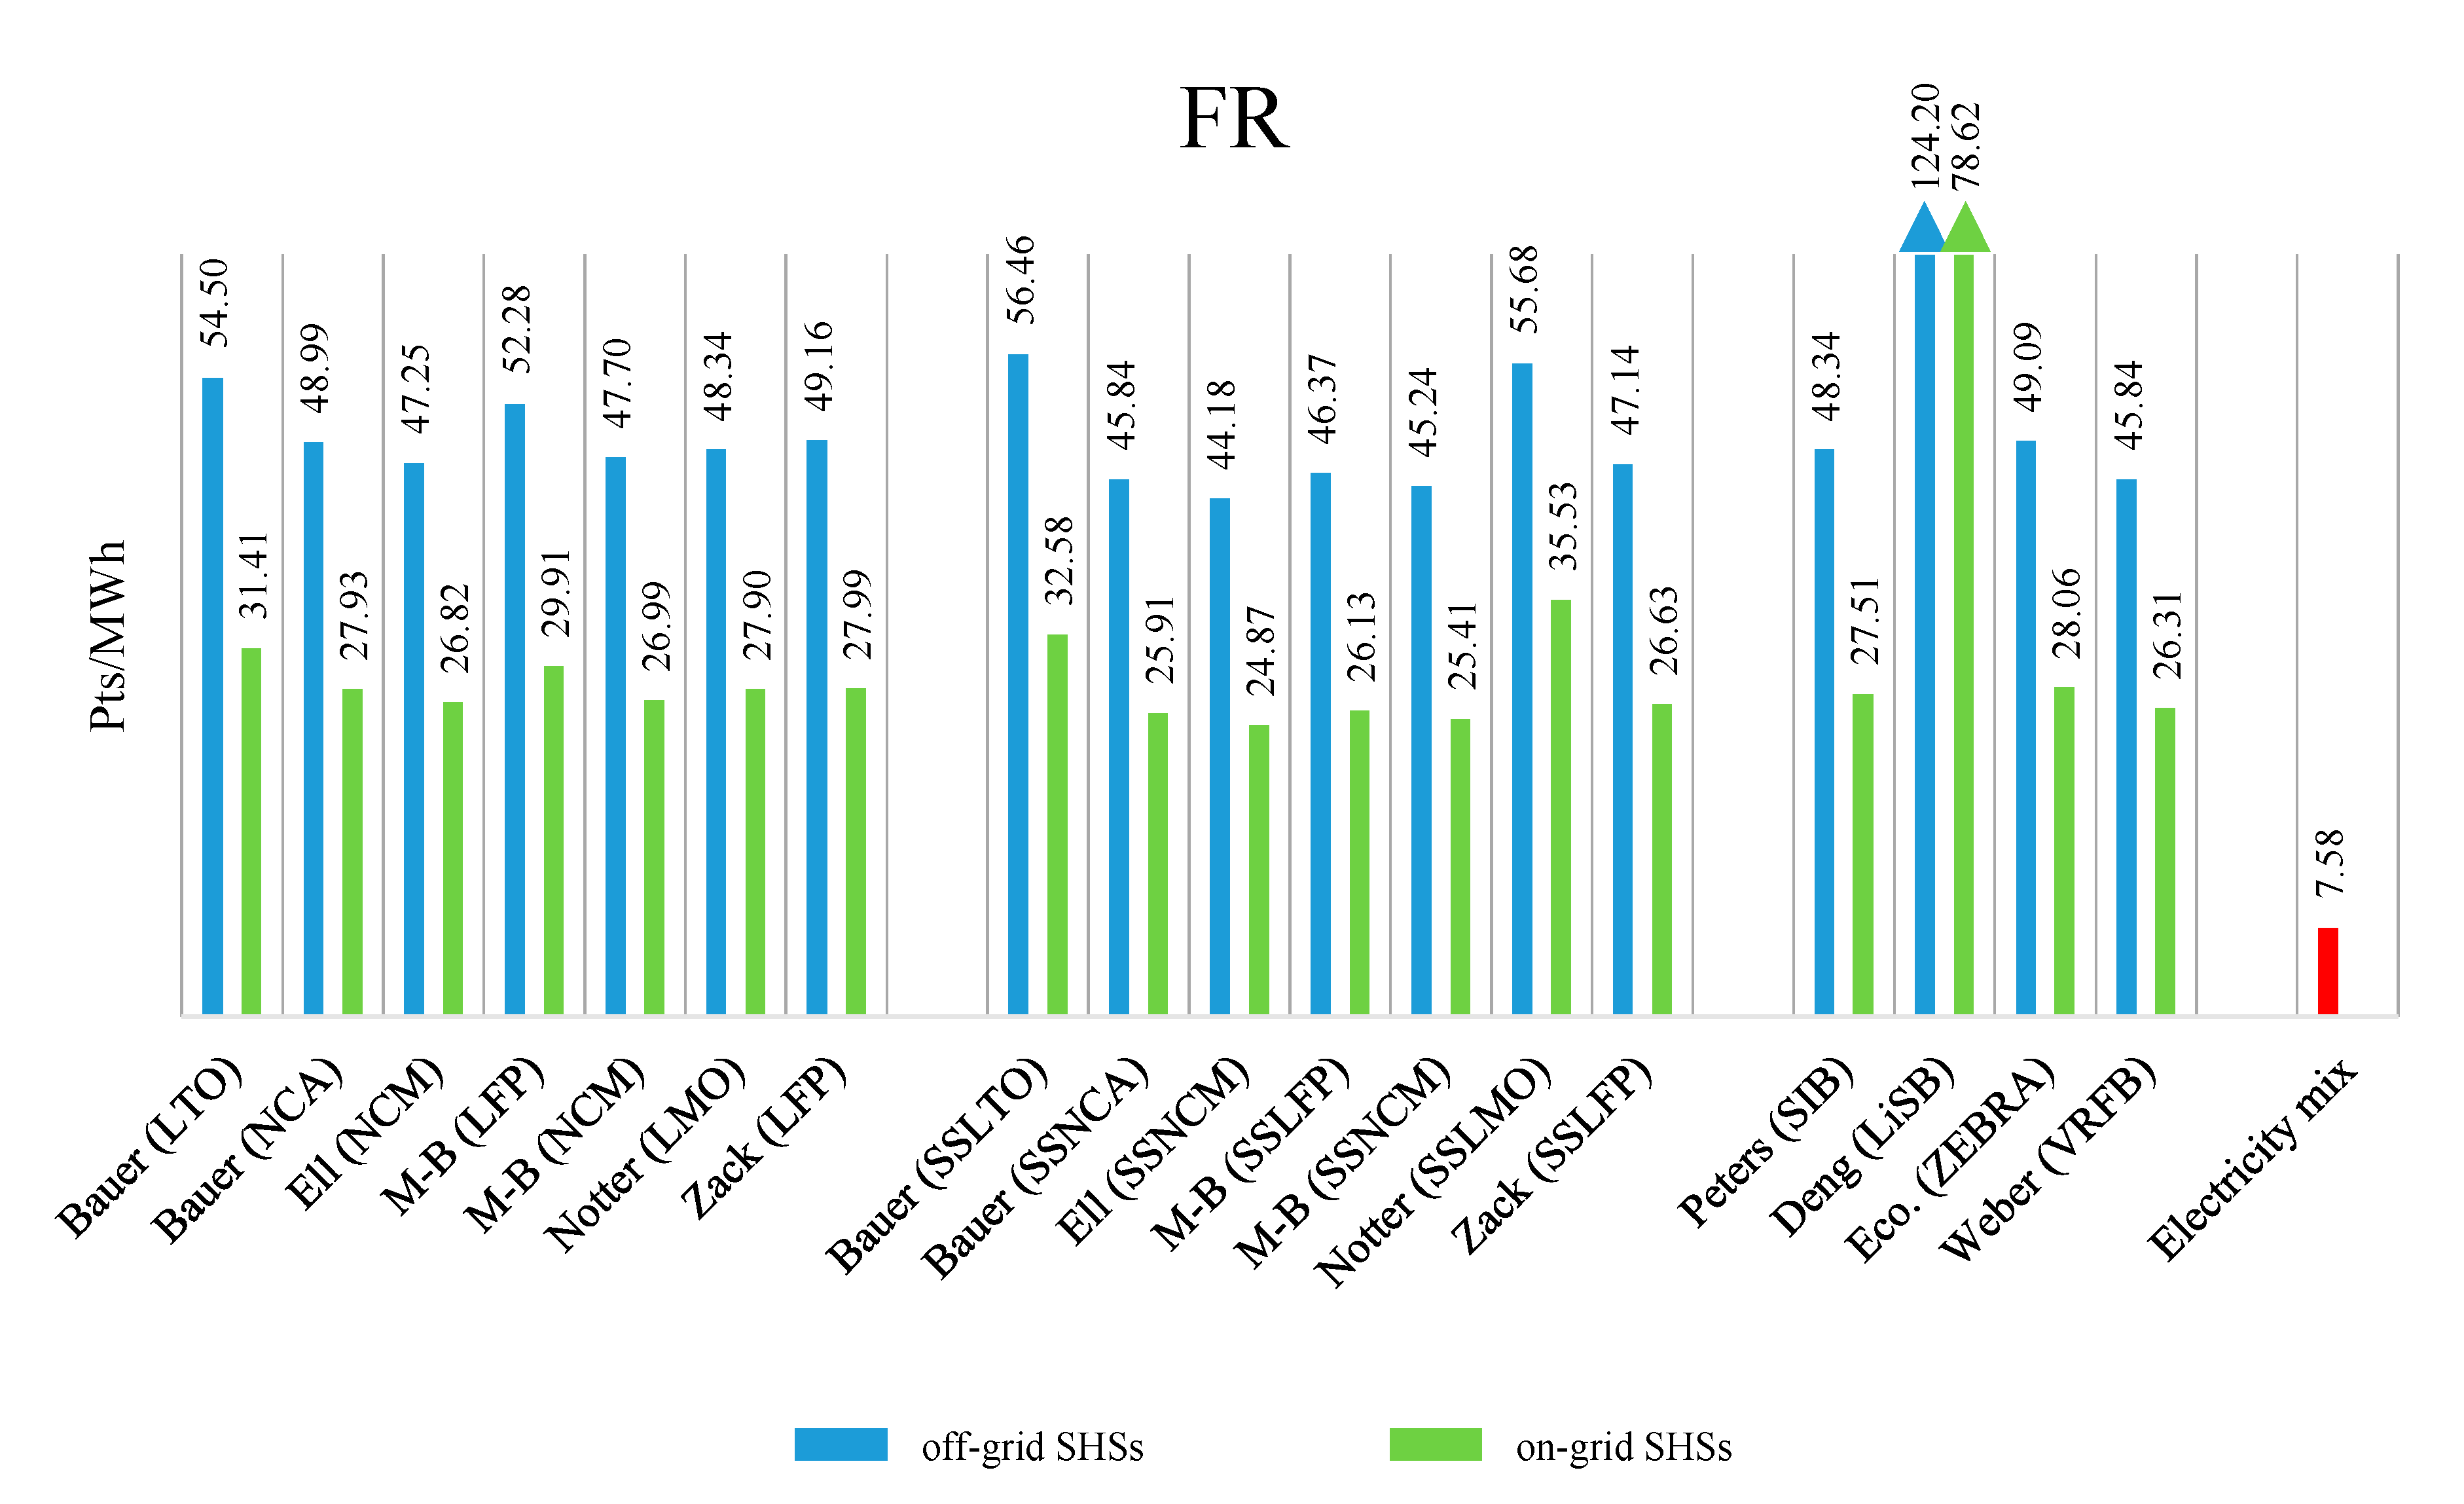
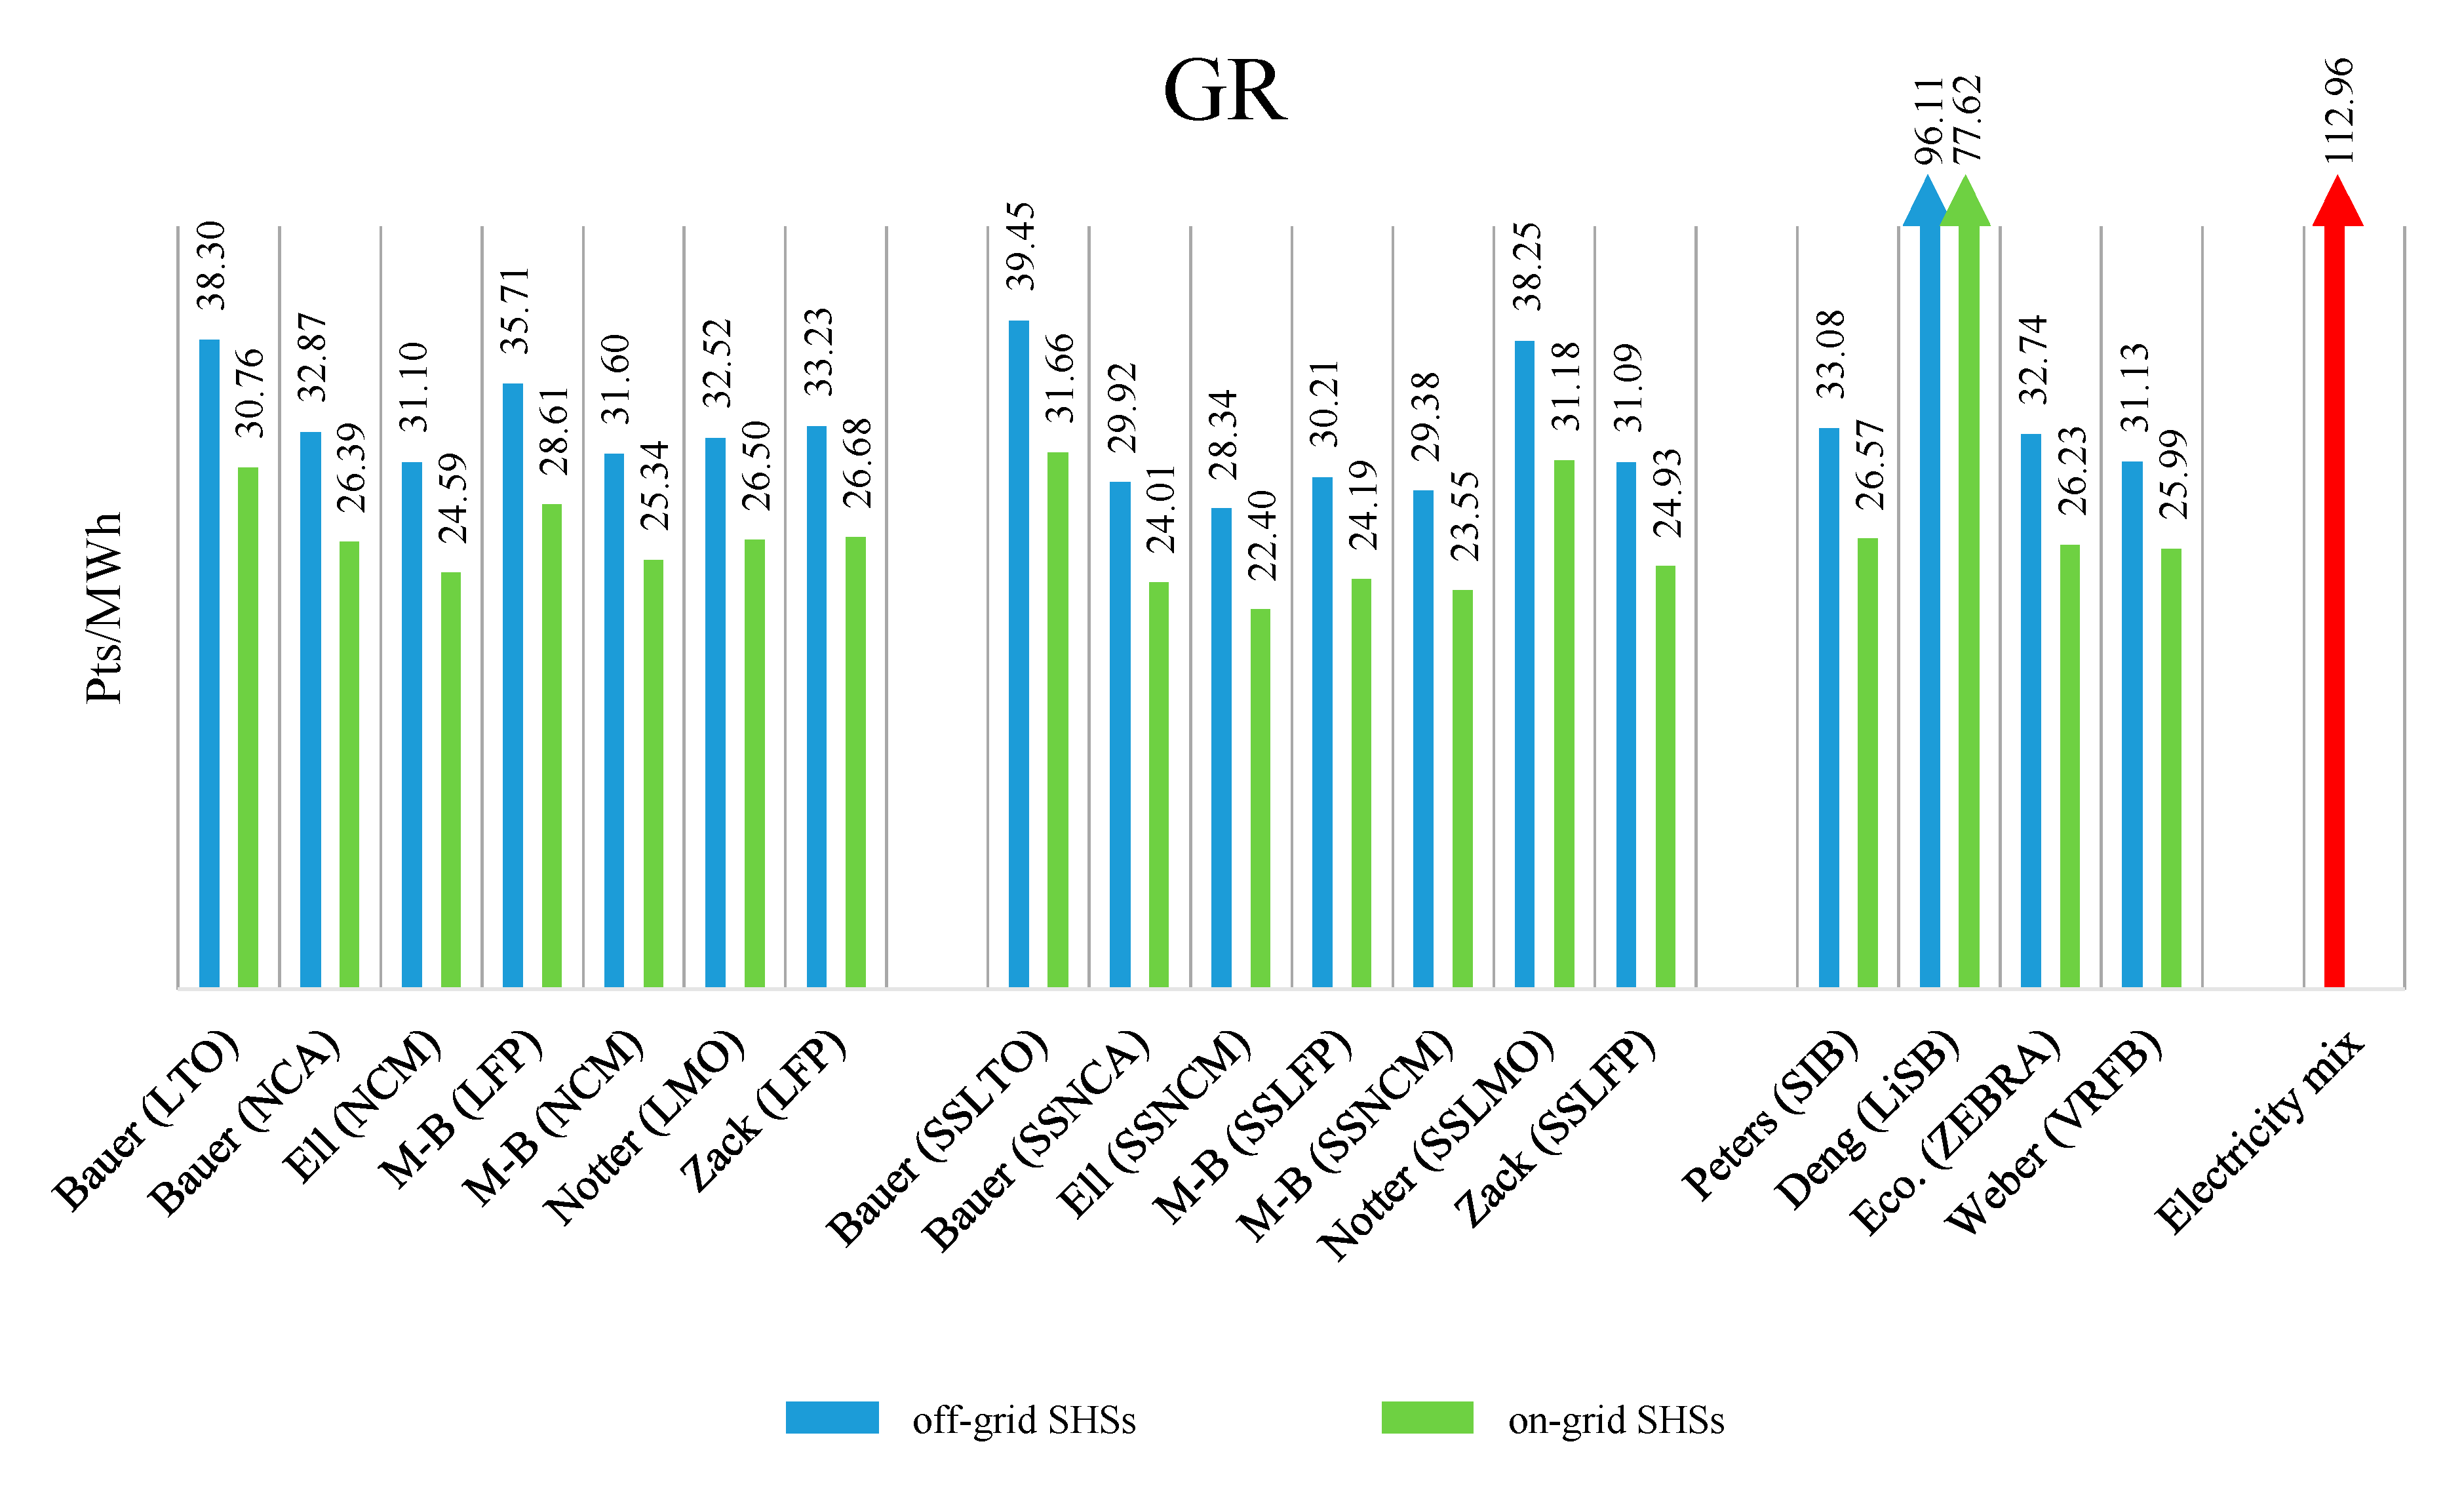
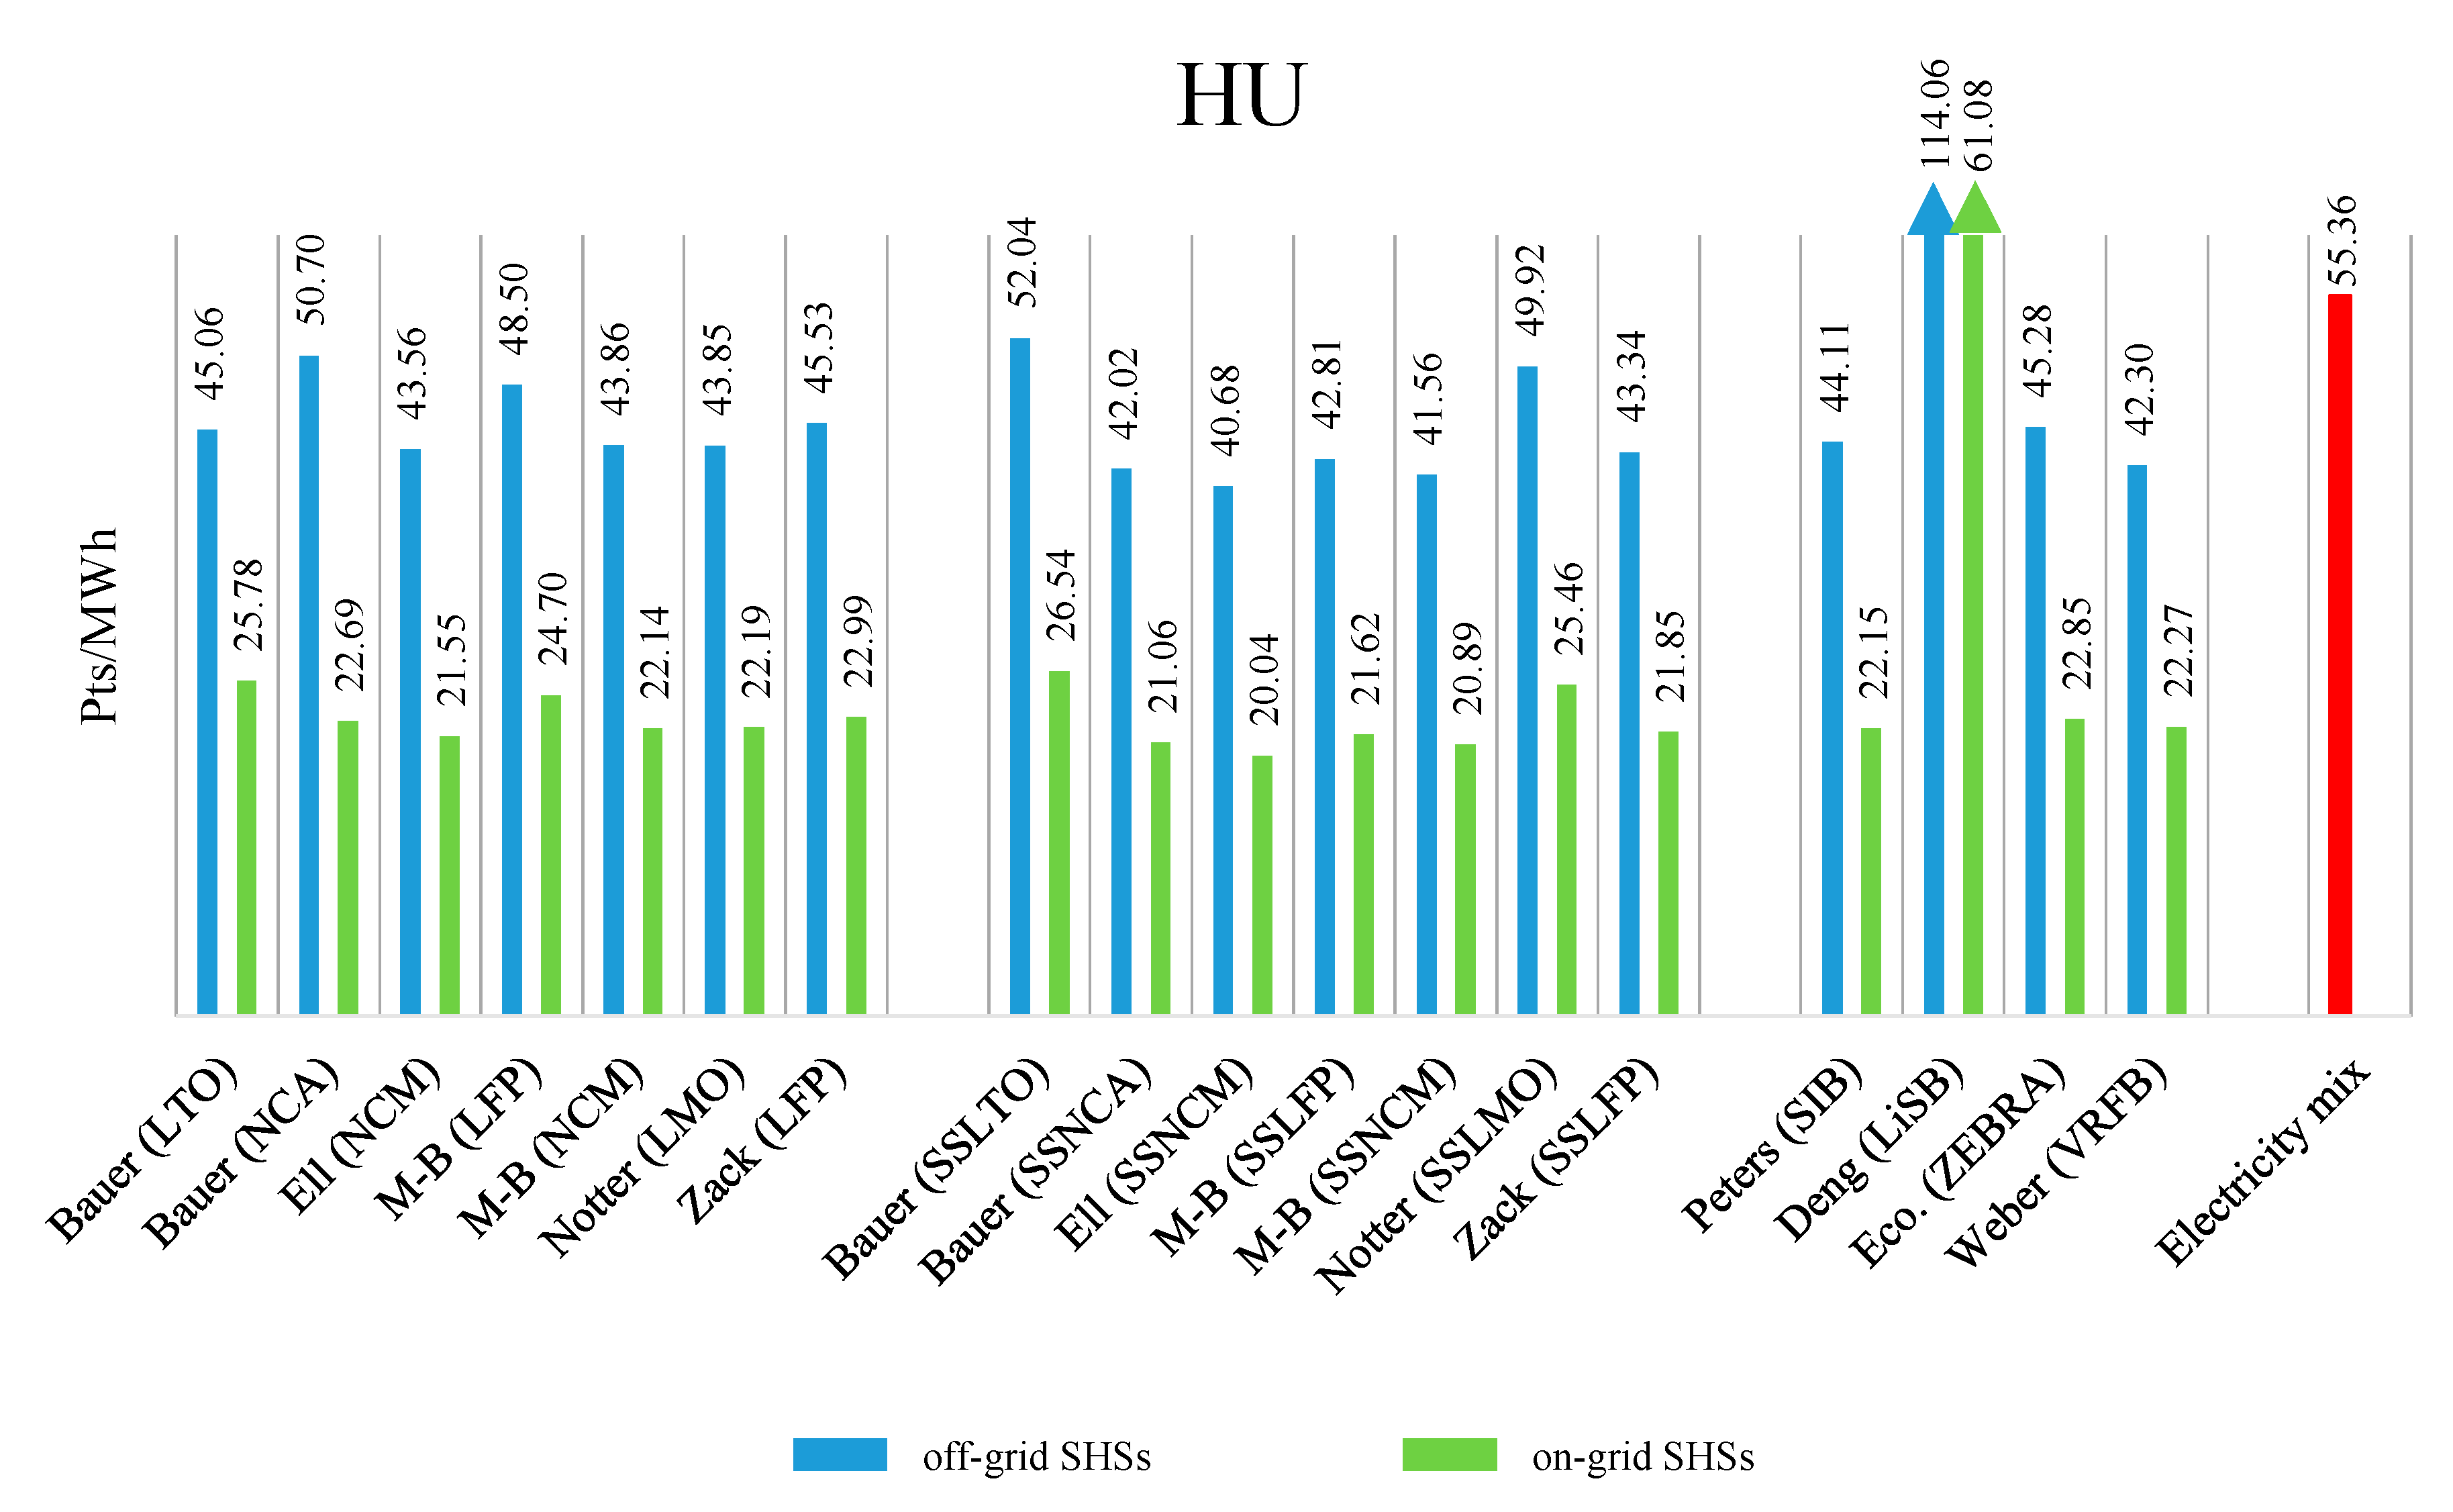
Differently from midpoint indicators, single score results allow a global comparison of all the SHSs. Table 10 collects the most sustainable SHSs for each battery group (LIBs, SSLIBs and aBESSs), Table 11 shows the contribution analysis of the components and Figure 5, Figure 6, Figure 7, Figure 8, Figure 9, Figure 10, Figure 11 and Figure 12 provide further details about all the SHSs. Indeed, the environmental impact of all the batteries has been depicted together with the corresponding national electricity mix for an easy and immediate comparison. Both on-grid and off-grid configurations are reported. The red columns represent the environmental impacts of the national electricity mixes.
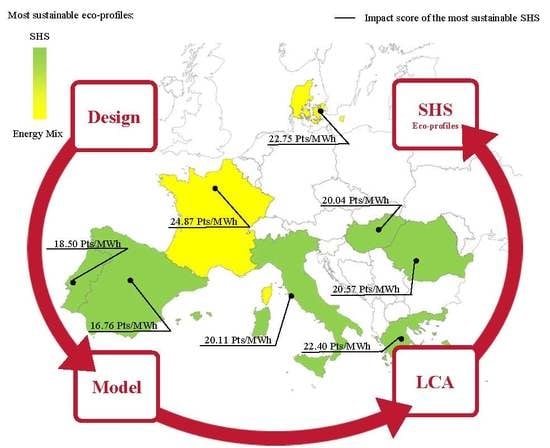
From the results presented in Table 10, it is possible to observe that among LIBs, Ell (NCM) batteries allow us to minimize the SHS environmental impact values thanks to a good combination of efficiency, energy density, materials availability, and lifespan. For the same reasons, Ell (SSNCM) represents the most sustainable choice among SSLIBs. The best aBESS varies with the installation site as Peters (SIB) represents the best solution in DK and HU whereas Weber (VRFB) is assessed as the best in the other countries. A general comparison including all the BESSs categories shows that SHSs equipped with Ell (SSNCM) have the most sustainable environmental performance in every installation site, except for DK, where Peters (SIBs) results to be the best configuration. These results underline that solid electrolytes have an environmental benefit because their impact is comparable to the liquid ones, but a double energy density allows to halve the weight of the battery as well as their contribution to the total SHS impact. Particularly, moving from Ell (NCM) to Ell (SSNCM) the SHS environmental burden is reduced of a remarkable percentage.
Concerning the environmental impact values, different considerations can be done for on-grid and off-grid SHSs. The burdens of grid-connected systems are included in a quite narrow range (16.76 Pts/MWh–24.87 Pts/MWh in case of Ell (SSNCM) installation) depending on the installation site. In northern countries a low solar radiation value imposes the use of large power plant thus representing a major contribution to the overall impact (Table 11). Nevertheless, in these conditions, the amount of energy exceeding the batteries’ capacity is relevant and the possibility to inject it to the grid (Table 9) mitigates the environmental impact per MWh. On the contrary, in off-grid SHSs this possibility does not exist, and the surplus energy must be dissipated. For such reason, the environmental impact per MWh increases, especially in northern installation sites, and the range of values assumed by the SHSs impact is much larger (23.63 Pts/MWh–90.05 Pts/MWh in case of Ell (SSNCM) installation). Therefore off-grid SHSs are more impactful than on-grid configurations and the diesel generator contribution, higher than that of the electricity imported from the grid, strengthens this difference. The only exception is GR, where most of the electricity is produced by coal and its burden is comparable with that of SHSs.
Concerning the national electricity mixes eco-profiles, that of FR is particularly low because of the high nuclear energy contribution to the electricity mix. However, a detailed discussion about the FR electricity mix sustainability is beyond the scope of this paper. This value will be just used as a reference for comparison. In this context, on-grid systems are more sustainable than the electricity mix in all the installation sites except for FR whereas off-grid systems are not competitive with the grid in DK and FR. The batteries recycling phase has an important role in the SHS environmental impact mitigation: indeed, the best BESSs have a percentage contribution in the order of 10%, but without an adequate recycling of the raw materials this percentage could be over 25%.
The previous considerations have been done analyzing the best BESSs for every battery group. Histograms reported in Figure 4, Figure 5, Figure 6, Figure 7, Figure 8, Figure 9, Figure 10 and Figure 11 are used to provide a more general overview about all the others SHSs. These figures show that many SHSs, although not the best, are effective to produce more sustainable electricity than the energy mix thanks to their BESS. Among LIBs, Bauer (NCA), M-B (NCM), Ell (NCM) have similar environmental performances; the same considerations can be done for Bauer (SSNCA), M-B (SSNCM), Ell (NCM) and Zack (LFP). The worse batteries are the Notter (LMO), Zack (LFP), Bauer (LTO) and the respective SSLIBs, whose low energy density compromise their environmental performances. The obtained results are coherent with those of our previous work [40] where Bauer (NCA) was assessed as the best solution. Indeed, in both cases Bauer (NCA) and Ell (NCM) environmental performances are very close to each other. This means that, although the simulation model and some input data have been slightly changed and a BESS recycling model has been improved, the best solutions can be obtained mixing cobalt with other more common metals.
In the perspective of replacing LIBs with alternative BESS, Deng (LiSB) is currently very far from the performances of the other batteries because, despite its high energy density, its lifespan is too low to be competitive with the others. Contrarily the Peters (SIBs), Eco. (ZEBRA) and Weber (VRFB) proposals all have good environmental performances; their impact is similar to that of Ell (SSNCM) ones. Considering the operative parameters in Table 1, these devices can improve in terms of energy density. Particularly, Peters batteries (SIB) are still at a research level and the number of cycles which can be performed will probably increase as well as the energy density and, considering that they are already competitive with LIBs stationary batteries, the potential is very large. It’s important to stress that LiSBs, despite currently presenting a high environmental impact, should not be under-evaluated because they have some very good characteristics like their energy density, but it’s very important to improve strongly their lifespan and the recycling processes in order to be competitive with the other devices.
5. Conclusions
In this paper the environmental sustainability assessment of SHSs equipped with different types of batteries is performed through a three-steps methodology including design, modelling and LCA. Some of these batteries, namely LIBs, currently represent a benchmark in the market whereas others have a lower maturity. A sensitivity analysis of the installation site is proposed considering different European countries, at different latitude, represented by their capital city.
From the results it is possible to draw conclusions concerning three major points:
- Geographical dependencies on the variation of battery types: the choice of the most sustainable BESSs does not change significantly with the installation site. Regardless of the solar radiation profile and energy demand curves, Ell (SSNCM) batteries are assessed as the best in almost every country (16.76–24.87 Pts/MWh). M-B (SSNCM) (17.62–23.41 Pts/MWh), M-B (SSLFP) (18.46–26.13 Pts/MWh), Peters (SIB) (21.22–27.51 Pts/MWh) and Weber (VRFB) (18.38–26.31 Pts/MWh) environmental performances are all close to Ell (SSNCM).
- Structural properties and operative characteristics of batteries: the main strength of the mentioned SSLIBs is in having a high energy density. Peters (SIB) devices instead take great advantage of the low impact on natural resources consumption as sodium is more abundant on the Earth’s surface whereas Weber (VRFB) batteries have a very long lifespan. Even though SSLIBs guarantee an important improvement compared to simple LIBs and currently they have the most sustainable eco-profile, Peters systems (SIBs) probably have the lowest maturity level among the cited BESSs, therefore the highest potential for the future. Deng batteries (LiSBs), penalized by their short lifespan, are by far the most impactful battery whereas all the others have an intermediate environmental impact.
- SHSs’ environmental advantages and batteries contributions to their eco-profiles in the various European countries: extending the overview to the overall SHS, it is possible to conclude that the choice of the batteries affects the results in southern Europe countries where the percentage contribution is the most relevant, whereas in northern Europe they have a minor contribution. Considering the best batteries, their impact is usually of the order of 10% of the total thanks to the materials recovery in the EoL, while without this percentage it could be more than double. Grid-connected SHSs are always more profitable compared to the off-grid ones, especially in northern countries, thanks to the possibility to inject more electricity to the grid avoiding the use of a diesel generator. Both types of SHSs are generally more sustainable than the national electricity mix, except for FR where the grid electricity is estimated to have a very low impact, and DK where off-grid configuration is more impactful.
Supplementary Materials
The following are available online at https://0-www-mdpi-com.brum.beds.ac.uk/1996-1073/13/13/3454/s1, Supplementary Materials provide all the results of the SHS modelling, complete life cycle data inventories and midpoint LCA results for all the installation sites.
Author Contributions
Conceptualization, F.R., M.L.P., R.B. and A.S.; Investigation, F.R., M.L.P. and S.G.; Supervision, R.B. and A.S.; Writing–original draft, F.R., R.B. and A.S.; Writing–review & editing, F.R., M.L.P., S.G., R.B. and A.S. All authors have read and agreed to the published version of the manuscript.
Funding
This research received no external funding.
Acknowledgments
F.R., M.L.P., R.B. and A.S. acknowledge MIUR Grant—Department of Excellence 2018-2022. FR is grateful for the Ph.D. grant within the “Progetto Pegaso” funded by Regione Toscana.
Conflicts of Interest
The authors declare no conflict of interest.
Abbreviations
| aBESS | Alternative Battery Energy Storage System |
| AIB | Aluminium-ion Battery |
| BESS | Battery Energy Storage System |
| CC | Charge Controller |
| CO | Construction |
| DK | Denmark |
| DME | Dimethyl Glycol |
| DoD | Depth of Discharge |
| DOL | Dioxolane |
| EoL | End of Life |
| ES | Spain |
| FU | Functional Unit |
| FR | France |
| GR | Greece |
| HU | Hungary |
| In | Inverter |
| IT | Italy |
| ISO | International Organization for Standardization |
| LCA | Life Cycle Assessment |
| LCI | Life Cycle Inventory |
| LCIA | Life Cycle Impact Assessment |
| LCO | Lithium Cobalt Oxide |
| LCP | Lithium Cobalt Phosphate |
| LFP | Lithium Iron Phosphate |
| LIB | Lithium-ion battery |
| LiPON | Lithium Phosphorous Oxy-Nitride |
| LiSB | Lithium-sulphur Battery |
| LiTFSI | Lithium Bistrifluoromethanesulfonimidate |
| LMNO | Lithium Manganese Nickel Oxide |
| LMO | Lithium Manganese Oxide |
| LTO | Lithium Iron Titanate |
| NCA | Nickel Cobalt Aluminium |
| NCM | Nickel Cobalt Manganese |
| NMMT | Nickel Manganese Magnesium Titanium Oxide |
| OP | Operation |
| PON | Polyacrylonitrile |
| PT | Portugal |
| PV | Photovoltaic |
| PV-GIS | Photovoltaic Geographical Information System |
| RF | Reference Flow |
| RO | Romania |
| SHS | Solar Home System |
| SIB | Sodium-ion Battery |
| SOC | State of Charge |
| SOH | State of Health |
| SSLFP | Solid State Lithium Iron Phosphate |
| SSLIB | Solid State Lithium-ion Battery |
| SSLMO | Solid State Lithium Manganese Oxide |
| SSLTO | Solid State Lithium Iron Titanate |
| SSNCA | Solid State Nickel Cobalt Aluminium |
| SSNCM | Solid State Nickel Cobalt Manganese |
| VRFB | Vanadium Redox Flow Battery |
| ZEBRA | Zero Emissions Batteries Research Activity |
References
- Liu, N.; Cheng, M.; Yu, X.; Zhong, J.; Lei, J. Energy-Sharing Provider for PV Prosumer Clusters: A Hybrid Approach Using Stochastic Programming and Stackelberg Game. IEEE Trans. Ind. Electron. 2018, 65, 6740–6750. [Google Scholar] [CrossRef]
- Bashir, A.A.; Pourakbari-Kasmaei, M.; Contreras, J.; Lehtonen, M. A novel energy scheduling framework for reliable and economic operation of islanded and grid-connected microgrids. Electr. Power Syst. Res. 2019, 171, 85–96. [Google Scholar] [CrossRef]
- Pourakbari-Kasmaei, M.; Asensio, M.; Lehtonen, M.; Contreras, J. Trilateral Planning Model for Integrated Community Energy Systems and PV-Based Prosumers—A Bilevel Stochastic Programming Approach. IEEE Trans. Power Syst. 2020, 35, 346–361. [Google Scholar] [CrossRef] [Green Version]
- Mohammadi, S.; Soleymani, S.; Mozafari, B. Scenario-based stochastic operation management of MicroGrid including Wind, Photovoltaic, Micro-Turbine, Fuel Cell and Energy Storage Devices. Int. J. Electr. Power Energy Syst. 2014, 54, 525–535. [Google Scholar] [CrossRef]
- International Standards Organization. EN ISO 14040:2006—Valutazione del ciclo di vita Principi e Quadro di Riferimento; International Standards Organization: Geneva, Switzerland, 2010; p. 14040. [Google Scholar]
- International Standards Organization. UNI EN ISO 14044:2006—Gestione Ambientale—Valutazione del ciclo di vita—Requisiti e Linee Guida; International Standards Organization: Geneva, Switzerland, 2006. [Google Scholar]
- Rossi, F.; Parisi, M.L.; Maranghi, S.; Manfrida, G.; Basosi, R.; Sinicropi, A. Environmental impact analysis applied to solar pasteurization systems. J. Clean. Prod. 2019, 212, 1368–1380. [Google Scholar] [CrossRef]
- Bravi, M.; Parisi, M.L.; Tiezzi, E.; Basosi, R. Life Cycle Assessment of advanced technologies for photovoltaic panels production. Int. J. HEAT Technol. 2010, 28, 133–140. [Google Scholar] [CrossRef]
- Maranghi, S.; Parisi, M.L.; Basosi, R.; Sinicropi, A. Environmental Profile of the Manufacturing Process of Perovskite Photovoltaics: Harmonization of Life Cycle Assessment Studies. Energies 2019, 12, 3746. [Google Scholar] [CrossRef] [Green Version]
- Parisi, M.L.; Maranghi, S.; Sinicropi, A.; Basosi, R. Development of dye sensitized solar cells: A life cycle perspective for the environmental and market potential assessment of a renewable energy technology. Int. J. Heat Technol. 2013, 31, 143–148. [Google Scholar] [CrossRef]
- Peters, J.F.; Weil, M. Providing a common base for life cycle assessments of Li-Ion batteries. J. Clean. Prod. 2018, 171, 704–713. [Google Scholar] [CrossRef]
- Bauer, C. Okobilanz Von Lithium-Ionen Batterien; Paul Scherrer Institut, Labor für Energiesystem-Analysen (LEA): Villingen, Switzerland, 2010. [Google Scholar]
- Ellingsen, L.A.; Majeau-Bettez, G.; Singh, B.; Srivastava, A.K.; Valøen, L.O.; Strømman, A.H. Life Cycle Assessment of a Lithium-Ion Battery Vehicle Pack. J. Ind. Ecol. 2014, 18, 113–124. [Google Scholar] [CrossRef] [Green Version]
- Majeau-bettez, G.; Hawkins, T.R.; Strømman, A.H. Life Cycle Environmental Assessment of Lithium-Ion and Nickel Metal Hydride Batteries for Plug-In Hybrid and Battery Electric Vehicles. Environ. Sci. Technol. 2011, 45, 4548–4554. [Google Scholar] [CrossRef] [PubMed]
- Notter, D.A.; Gauch, M.; Widmer, R.; Patrick, W.A.; Stamp, A.; Zah, R.; Althaus, R.G. Contribution of Li-Ion Batteries to the Environmental Impact of Electric Vehicles. Environ. Sci. Technol. 2010, 44, 6550–6556. [Google Scholar] [CrossRef] [PubMed]
- Zackrisson, M.; Avellán, L.; Orlenius, J. Life cycle assessment of lithium-ion batteries for plug-in hybrid electric vehicles e Critical issues. J. Clean. Prod. 2010, 18, 1519–1529. [Google Scholar] [CrossRef]
- Cusenza, M.A.; Bobba, S.; Ardente, F.; Cellura, M.; di Persio, F. Energy and environmental assessment of a traction lithium-ion battery pack for plug-in hybrid electric vehicles. J. Clean. Prod. 2019, 215, 634–649. [Google Scholar] [CrossRef]
- Deng, Y.; Li, J.; Li, T.; Zhang, J.; Yang, F.; Yuan, C. Life cycle assessment of high capacity molybdenum disulfide lithium-ion battery for electric vehicles. Energy 2017, 123, 77–88. [Google Scholar] [CrossRef]
- Raugei, M.; Winfield, P. Prospective LCA of the production and EoL recycling of a novel type of Li-ion battery for electric vehicles. J. Clean. Prod. 2019, 213, 926–932. [Google Scholar] [CrossRef] [Green Version]
- Senevirathne, K.; Day, C.S.; Gross, M.D.; Lachgar, A.; Holzwarth, N.A.W. A new crystalline LiPON electrolyte: Synthesis, properties, and electronic structure. Solid State Ionics 2013, 233, 95–101. [Google Scholar] [CrossRef]
- Troy, S.; Schreiber, A.; Reppert, T.; Gehrke, H.G.; Finsterbusch, M.; Uhlenbruck, S.; Stenzel, P. Life Cycle Assessment and resource analysis of all-solid-state batteries. Appl. Energy 2016, 169, 757–767. [Google Scholar] [CrossRef]
- Lastoskie, C.M.; Dai, Q. Comparative life cycle assessment of laminated and vacuum vapor-deposited thin fi lm solid-state batteries. J. Clean. Prod. 2015, 91, 158–169. [Google Scholar] [CrossRef]
- U.S. Department of the Interior, U.S. Geological Survey. Mineral Commodity Summaries 2018; U.S. Geological Survey: Washington, DC, USA, 2018.
- Grimsmo, B.; Strømman, A.H.; Ellingsen, L. Life Cycle Assessment LCA of Li-Ion Batteries for Electric Vehicles. Available online: https://ntnuopen.ntnu.no/ntnu-xmlui/handle/11250/2400819 (accessed on 18 February 2020).
- Peters, J.; Buchholz, D.; Passerini, S.; Weil, M. Life cycle assessment of sodium-ion batteries. Energy Environ. Sci. 2016, 9, 1744–1751. [Google Scholar] [CrossRef] [Green Version]
- Delgado, M.A.S.; Usai, L.; Ellingsen, L.A.W.; Pan, Q.; Strømman, A.H. Correction: Comparative Life Cycle Assessment of a Novel Al-Ion and a Li-Ion Battery for Stationary Applications. Materials 2019, 12, 3270. [Google Scholar] [CrossRef] [PubMed] [Green Version]
- Hosseinifar, M.; Petric, A. High temperature versus low temperature Zebra (Na/NiCl 2) cell performance. J. Power Sources 2012, 206, 402–408. [Google Scholar] [CrossRef]
- Longo, S.; Antonucci, V.; Cellura, M.; Ferraro, M. Life cycle assessment of storage systems: The case study of a sodium/nickel chloride battery. J. Clean. Prod. 2014, 85, 337–346. [Google Scholar] [CrossRef]
- Weber, S.; Peters, J.F.; Baumann, M.; Weil, M. Life Cycle Assessment of a Vanadium Redox Flow Battery. Environ. Sci. Technol. 2018, 52, 10864–10873. [Google Scholar] [CrossRef] [PubMed]
- Deng, Y.; Li, J.; Li, T.; Gao, X.; Yuan, C. Life cycle assessment of lithium sulfur battery for electric vehicles. J. Power Sources 2017, 343, 284–295. [Google Scholar] [CrossRef] [Green Version]
- Zackrisson, M.; Fransson, K.; Hildenbrand, J.; Lampic, G.; O’Dwyer, C. Life cycle assessment of lithium-air battery cells. J. Clean. Prod. 2016, 135, 299–311. [Google Scholar] [CrossRef]
- Hiremath, M.; Derendorf, K.; Vogt, T. Comparative life cycle assessment of battery storage systems for stationary applications. Environ. Sci. Technol. 2015, 49, 4825–4833. [Google Scholar] [CrossRef]
- Montenegro, C.T.; Peters, J.F.; Zhao-Karger, Z.; Wolter, C.; Weil, M. CHAPTER 13 Life Cycle Analysis of a Magnesium–Sulfur Battery. In Magnesium Batteries; The Royal Society of Chemistry: London, UK, 2020; pp. 309–330. [Google Scholar] [CrossRef]
- Santos, F.; Urbina, A.; Abad, J.; López, R.; Toledo, C.; Romero, A.J.F. Environmental and economical assessment for a sustainable Zn/air battery. Chemosphere 2020, 250, 126273. [Google Scholar] [CrossRef]
- Tian, J.; Xiong, R.; Shen, W. A review on state of health estimation for lithium ion batteries in photovoltaic systems. eTransportation 2019, 2, 100028. [Google Scholar] [CrossRef]
- Nagapurkar, P.; Joseph, D.S. Techno-Economic Optimization and Environmental Life Cycle Assessment (LCA) of Microgrids located in the US using Genetic Algorithm. Energy Convers. Manag. 2018, 181, 272–291. [Google Scholar] [CrossRef]
- Wang, R.; Lam, C.; Hsu, S.; Chen, J.; Engineering, E.; Hong, T.; Polytechnic, K.; Kong, H. Life cycle assessment and energy payback time of a standalone hybrid renewable energy commercial microgrid: A case study of Town Island in Hong Kong. Appl. Energy 2019, 250, 760–775. [Google Scholar] [CrossRef]
- Longo, S.; Beccali, M.; Cellura, M.; Guarino, F. Energy and environmental life-cycle impacts of solar-assisted systems: The application of the tool “ELISA”. Renew. Energy 2020, 145, 29–40. [Google Scholar] [CrossRef]
- Kabakian, V.; McManus, M.C.; Harajli, H. Attributional life cycle assessment of mounted 1.8kWp monocrystalline photovoltaic system with batteries and comparison with fossil energy production system. Appl. Energy 2015, 154, 428–437. [Google Scholar] [CrossRef] [Green Version]
- Rossi, F.; Parisi, M.L.; Maranghi, S.; Basosi, R.; Sinicropi, A. Environmental analysis of a Nano-Grid: A Life Cycle Assessment. Sci. Total Environ. 2019, 700, 134814. [Google Scholar] [CrossRef]
- Rossi, F.; Parisi, M.L.; Maranghi, S.; Basosi, R.; Sinicropi, A. Life Cycle Inventory datasets for nano-grid configurations. Data Br. 2020, 28, 104895. [Google Scholar] [CrossRef]
- Ease, EERA, European Energy Storage Technology Development; European Association for Storage of Energy (EASE): Brussels, Belgium, 2017.
- Yusoff, N.F.M.; Idris, N.H.; Din, M.F.M.; Majid, S.R.; Harun, N.A.; Rahman, M.M. Investigation on the Electrochemical Performances of Mn2O3 as a Potential Anode for Na-Ion Batteries. Sci. Rep. 2020, 10, 9207. [Google Scholar] [CrossRef]
- Wolff, D.; Casals, L.C.; Benveniste, G.; Corchero, C.; Trilla, L. The effects of lithium sulfur battery ageing on second-life possibilities and environmental life cycle assessment studies. Energies 2019, 12, 2440. [Google Scholar] [CrossRef] [Green Version]
- Bignucolo, F.; Coppo, M.; Crugnola, G.; Savio, A. Application of a simplified thermal-electric model of a sodium-nickel chloride battery energy storage system to a real case residential prosumer. Energies 2017, 10, 1497. [Google Scholar] [CrossRef] [Green Version]
- Ruiz, E.M.; Valsasina, L.; Brunner, F.; Symeonidis, A.; Fitzgerald, D.; Treyer, K.; Bourgault, G.; Wernet, G. Documentation of Changes Implemented in the Ecoinvent Database v3.4 (2018.08.23). Available online: https://www.ecoinvent.org/files/change_report_v3_4_20171004_1.pdf (accessed on 20 March 2020).
- Joint Research Center (JRC). Photovoltaic Geographical Information System (PVGIS). Jt. Res. Cent. (n.d.). Available online: http://re.jrc.ec.europa.eu/pvgis/ (accessed on 5 May 2019).
- Quoilin, S.; Kavvadias, K.; Mercier, A.; Pappone, I.; Zucker, A. Quantifying self-consumption linked to solar home battery systems: Statistical analysis and economic assessment. Appl. Energy 2016, 182, 58–67. [Google Scholar] [CrossRef]
- Cardoso, G.; Brouhard, T.; DeForest, N.; Wang, D.; Heleno, M.; Kotzur, L. Battery aging in multi-energy microgrid design using mixed integer linear programming. Appl. Energy 2018, 231, 1059–1069. [Google Scholar] [CrossRef]
- Tremblay, O.; Dessaint, L. Experimental Validation of a Battery Dynamic Model for EV Applications. World Electr. Veh. J. 2009, 3, 289–298. [Google Scholar] [CrossRef] [Green Version]
- MIT Team Electric Vehicle Team. A Guide to Understanding Battery Specifications; MIT: Cambridge, MA, USA, 2008. [Google Scholar]
- Mathworks. Matlab/Simulink 2019b Software. 2018. Available online: https://it.mathworks.com/ (accessed on 20 March 2019).
- Tang, A.; Bao, J.; Skyllas-kazacos, M. Studies on pressure losses and fl ow rate optimization in vanadium redox fl ow battery. J. Power Sources 2014, 248, 154–162. [Google Scholar] [CrossRef]
- Tanifuji, T.; Nasu, S. Heat capacity and thermal decomposition of lithium peroxide. J. Nucl. Mater. 1979, 87, 189–195. [Google Scholar] [CrossRef]
- Amrical Elements. Lithium Powder Properties; Amrical Elements: Los Angeles, CA, USA, 2020. [Google Scholar]
- Huang, B. Recycling of lithium-ion batteries: Recent advances and perspectives. J. Power Sources 2018, 399, 274–286. [Google Scholar] [CrossRef]
- Bekkelund, K. A Comparative Life Cycle Assessment of PV Solar Systems. Master’s Thesis, Norwegian University of Science and Technology (NTNU), Trondheim, Noruega, 2013. 243p. Available online: https://ntnuopen.ntnu.no/ntnu-xmlui/bitstream/handle/11250/235329/654872_FULLTEXT01.pdf?sequence=1 (accessed on 11 February 2020).
- Mastervolt. SCM60 MPPT-MB Datasheet, (n.d.). Available online: https://www.mastervolt.it/conversione/ (accessed on 5 May 2019).
- Mastervolt. Mass Combi Ultra 48/3500-50 (230 V) Datasheet, (n.d.). Available online: https://www.mastervolt.it/conversione/ (accessed on 5 May 2019).
- Tenka Solar. MONO CRYSTALLINE MODULE 300–330 Watt Technical Datasheet. 2017. Available online: http://www.tenkasolar.com/ (accessed on 20 March 2019).
- Latunussa, C.E.L.; Ardente, F.; Blengini, G.A.; Mancini, L. Life Cycle Assessment of an innovative recycling process for crystalline silicon photovoltaic panels. Sol. Energy Mater. Sol. Cells 2016, 156, 101–111. [Google Scholar] [CrossRef]
- Rossi, F.; Parisi, M.L.; Maranghi, S.; Basosi, R.; Sinicropi, A. Environmental effectiveness of the Solar Home Systems based on LCA. In Proceedings of the Atti Del XIII Convegno Della Rete Italiana LCA-VIII Convegno Dell’Associazione Rete Italiana LCA Roma, Rome, Italy, 13–14 June 2019; pp. 132–139. Available online: https://www.enea.it/it/seguici/pubblicazioni/pdf-volumi/2019/atti_lca_roma-2019.pdf (accessed on 10 March 2020).
- European Commission. Eurostat. 2017. Available online: https://ec.europa.eu/eurostat/web/gisco/geodata/reference-data (accessed on 1 February 2020).
- Buchamann, I. Batteries in a Portable World, 4th ed.; Cadex Electronics Inc.: Richmond, BC, Canada, 2016. [Google Scholar]
Figure 1.
Flowchart of the three-steps methodology implemented in this work.

Figure 2.
LCA impact values of SHSs in Italy for the climate change indicator.

Figure 3.
LCA impact values of SHSs in Italy for Human Toxicity indicator.

Figure 4.
LCA impact values of SHSs in Italy for the fossil depletion indicator.

Figure 5.
LCA impact values of SHSs in Denmark as single scores.

Figure 6.
LCA impact values of SHSs in Spain as single scores.

Figure 7.
LCA impact values of SHSs in France as single scores.

Figure 8.
LCA impact values of SHSs in Greece as single scores.

Figure 9.
LCA impact values of SHSs in Hungary as single scores.

Figure 10.
LCA impact values of SHSs in Italy as single scores.

Figure 11.
LCA impact values of SHSs in Portugal as single scores.

Figure 12.
LCA impact values of SHSs in Romania as single scores.


Table 1.
Batteries operative parameters (a).
| LIBs/SSLIBs | aBESS | ||||||||||
|---|---|---|---|---|---|---|---|---|---|---|---|
| M-B (LFP) (1) | Zack (LFP) (2) | Bauer (LTO) (3) | Notter (LMO) (4) | Bauer (NCA) (5) | Ell (NCM) (6) | M-B (NCM) (7) | Peters (SIBs) (8) | Deng (LiSBs) (9) | Eco. (ZEBRA) (10) | Weber (VRFBs) (11) | |
| Cathode | LiFePO4 (b) | LiFePO4 | LiFePO4 | LiMn2O4 (c) | LiNiCoAlO2 (d) | LiNiMnCoO2 (e) | LiNiMnCoO2 (e) | NMMT | Graphene-sulfur composite | Nickel chloride | PAN |
| Anode | Graphite | Graphite | Li4Ti5O12 (f) | Graphite | Graphite | Graphite | Graphite | Hard carbon | Lithium metal | Sodium chloride | PAN |
| Electrolyte | LiPF6 (g) LiPON (j) (SS) | LiCl (h) LiPON (j) (SS) | NaBF4 (i) LiPON (j) (SS) | LiPF6 (g) LiPON (SS) | NaBF4 (i) LiPON (SS) | LiPF6 (g) LiPON (SS) | LiPF6 (g) LiPON (SS) | NaPF6 | LiTFSI, DOL, DME, LiNO3 | Sodium aluminium chloride | Vanadium, sulfuric acid, phosphoric acid, water |
| Energy Density [Wh/kg] | 109.3 218.6 (SS) | 82.9 165.8 (SS) | 52.4 104.8 (SS) | 116.1 232.2 (SS) | 133.1 266.2 (SS) | 130.3 260.6 (SS) | 139.1 278.2 (SS) | 102 | 220 | 116 | 28 |
| Lifespan [Cycles] | 6000 | 3000 | 10,000 | 1000 | 5000 | 2000 | 3000 | 2000 | 400 | 4500 | - |
| Lifespan [years] | 10 | 10 | 10 | 10 | 10 | 10 | 10 | 10 | - | 15 | 20 |
| DoD | 80% | 80% | 80% | 80% | 80% | 80% | 80% | 80% | 85% | 80% | 95% |
| Efficiency | 90% | 90% | 90% | 85% | 90% | 95% | 90% | 90% | 85% | 90% | 75% |
(a) Parameters taken from [11,25,26,29,30,45]; (b) lithium-iron phosphate; (c) lithium manganese oxide; (d) lithium nickel cobalt aluminum oxide; (e) lithium nickel cobalt manganese oxide; (f) lithium titanate oxide; (g) lithium hexafluorophosphate; (h) lithium chloride; (i) sodium tetrafluoroborate; (j) lithium phosphorous oxy-nitride; (1) LFP battery proposed by Majeau-Bettez et al. [14], (2) LFP battery proposed by Zackrisson et al. [16]; (3) LTO battery proposed by Bauer et al. [12]; (4) LMO battery proposed by Notter et al. [15]; (5) NCA battery proposed by Bauer et al. [12]; (6) NCM battery proposed by Ellingsen et al. [13]; (7) NCM battery proposed by Majeau-Bettez et al. [14]; (8) SIB proposed by Peters et al. [25]; (9) LiSB proposed by Deng et al. [30]; (10) ZEBRA battery proposed by Ecoinvent 3.4 [46]; (11) VRFB proposed by Weber et al. [29].
Table 2.
Ageing parameters of BESSs.
| BESS | ||||||
|---|---|---|---|---|---|---|
| [Ah-1 ∙ K-2] | [Ah-1 ∙ K-1] | [Ah-1] | [h K-1] | [h] | [s-0.5] | |
| Bauer (LTO, SSLTO) | 2.95 × 10⁻⁷ | −1.76 × 10⁻⁴ | 2.61 × 10⁻² | −6.70 × 10⁻³ | 2.35 × 100 | 1.93 × 101 |
| Bauer (NCA, SSNCA) | 5.91 × 10⁻⁷ | −3.51 × 10⁻⁴ | 5.23 × 10⁻² | −6.70 × 10⁻³ | 2.35 × 100 | 1.93 × 101 |
| Ell (NCM, SSNCM) | 1.48 × 10⁻⁶ | −8.78 × 10⁻⁴ | 1.31 × 10⁻¹ | −6.70 × 10⁻³ | 2.35 × 100 | 1.93 × 101 |
| M-B (LFP, SSLFP) | 4.92 × 10⁻⁷ | −2.93 × 10⁻⁴ | 4.35 × 10⁻² | −6.70 × 10⁻³ | 2.35 × 100 | 1.93 × 101 |
| M-B (NCM, SSNCM) | 9.84 × 10⁻⁷ | −5.85 × 10⁻⁴ | 8.71 × 10⁻² | −6.70 × 10⁻³ | 2.35 × 100 | 1.93 × 101 |
| Notter (LMO, SSLMO) | 2.95 × 10⁻⁶ | −1.76 × 10⁻³ | 2.61 × 10⁻¹ | −6.70 × 10⁻³ | 2.35 × 100 | 1.93 × 101 |
| Zack (LFP, SSLFP) | 9.84 × 10⁻⁷ | −5.85 × 10⁻⁴ | 8.71 × 10⁻² | −6.70 × 10⁻³ | 2.35 × 100 | 1.93 × 101 |
| Peters (SIB) | 7.38 × 10⁻⁶ | −4.39 × 10⁻³ | 6.53 × 10⁻¹ | −6.70 × 10⁻³ | 2.35 × 100 | 1.93 × 101 |
| Deng (LiSB) | 3.04 × 10⁻⁷ | −1.81 × 10⁻⁴ | 5.81 × 10⁻² | −3.11 × 10⁻³ | 2.35 × 100 | 1.57 × 101 |
| Eco. (ZEBRA) | 1.48 × 10⁻⁶ | −8.78 × 10⁻⁴ | 1.31 × 10⁻¹ | −6.70 × 10⁻³ | 2.35 × 100 | 1.93 × 101 |
| Weber (VRFB) | 0.00 × 100 | 0.00 × 100 | 0.00 × 100 | 0.00 × 100 | 0.00 × 100 | 1.36 × 101 |
Table 3.
LCI for the LiPON electrolyte production.
| Figure | Process | Amount | Unit |
|---|---|---|---|
| Inputs | |||
| Heat | market for heat, district or industrial, natural gas—Europe without Switzerland | 0.23 | kWh |
| Hydrogen peroxide | market for hydrogen peroxide, without water, in 50% solution—GLO | 2.28 | kg |
| Lithium hydroxide | market for lithium hydroxide–GLO | 1.60 | kg |
| Outputs | |||
| Lithium oxide | Lithium oxide production | 1.00 | kg |
| Inputs | |||
| Ammonia | market for ammonia, liquid—RoW | 0.52 | kg |
| Phosphorus pentachloride | market for phosphorus pentachloride—GLO | 3.84 | kg |
| Outputs | |||
| Triphosphorous pentanitride | triphosphorous pentanitride production | 1.00 | kg |
| Inputs | |||
| Lithium oxide | Lithium oxide production | 0.67 | kg |
| Phosphorous pentoxide | market for phosphoric acid, industrial grade, without water, in 85% solution APOS, S—GLO | 0.13 | kg |
| Triphosphorous pentanitride | triphosphorous pentanitride production | 0.20 | kg |
| Heat | market for heat, district or industrial, natural gas—Europe without CH | 2.96 | kWh |
| Outputs | |||
| LiPON | LiPON production | 1 | kg |
Table 4.
LIBs, SSLIBs and Peters (SIB) inventory for EoL.
| Bauer (LTO) | Bauer (NCA) | Ell (NCM) | M-B (LFP) | M-B (NCM) | Notter (LMO) | Zack (LFP) | Peters (SIBs) | ||
|---|---|---|---|---|---|---|---|---|---|
| Inputs | |||||||||
| Waste BESS | 1 | kg | |||||||
| Treatment of used Li-ion battery, hydrometallurgical GLO | 0.49 | 0.00 | 0.00 | 0.5 | 0.00 | 0.61 | 0.53 | 0.47 | kg |
| Treatment of used Li-ion battery, pyrometallurgical GLO | 0.00 | 0.52 | 0.6 | 0.00 | 0.5 | 0.00 | 0.00 | 0.00 | kg |
| Market for hazardous waste, for incineration Europe without CH | 0.44 | 0.4 | 0.35 | 0.41 | 0.41 | 0.39 | 0.39 | 0.14 | kg |
| Market for waste electric and electronic equipment GLO | 0.05 | 0.05 | 0.05 | 0.05 | 0.05 | 0.05 | 0.05 | 0.06 | kg |
| Market for scrap steel—Europe without CH | 0.02 | 0.02 | 0.02 | 0.02 | 0.02 | 0.02 | 0.02 | 0.35 | kg |
| Market for inert waste, for final disposal RoW | 0.23 | 0.14 | 0.14 | 0.26 | 0.15 | 0.16 | 0.30 | 0.14 | kg |
| Market for diesel, burned in building machine GLO | 0.1 | MJ | |||||||
| Market for electricity, medium voltage Europe without CH | 0.01 | kWh | |||||||
| Outputs (Avoided Products) | |||||||||
| Market for lithium hexafluorophosphate GLO | 19 (l) 0 (s) | 15 (l) 0 (s) | 13 (s) 0 (s) | 16 (l) 0 (s) | 16 (l) 0 (s) | 15 (l) 0 (s) | 16 (l) 0 (s) | 0 | mg |
| Sodium hexafluorophosphate production | 0 | 0 | 0 | 0 | 0 | 0 | 0 | 12 | mg |
| Market for lithium GLO | 10 | 8 | 9 | 12 | 8 | 6 | 15 | 20 | mg |
| Market for sodium GLO | 0 | 0 | 0 | 0 | 0 | 0 | 0 | 3 | mg |
| Market for cobalt GLO | 0 | 67 | 75 | 0 | 70 | 0 | 0 | 0 | mg |
| Market for copper GLO | 9 | 125 | 179 | 116 | 116 | 185 | 49 | 0 | mg |
| Market for aluminium scrap, new RER | 107 | 94 | 46 | 55 | 55 | 115 | 25 | 54 | mg |
| Market for nickel, 99.5% GLO | 0 | 67 | 75 | 0 | 70 | 0 | 0 | 8 | mg |
| Market for manganese GLO | 0 | 0 | 70 | 0 | 65 | 101 | 0 | 76 | mg |
| Market for steel, unalloyed GLO | 0 | 0 | 0 | 0 | 0 | 0 | 0 | 308 | mg |
| Market for iron ore, beneficiated, 65% Fe GLO | 79 | 0 | 0 | 95 | 0 | 0 | 119 | 0 | mg |
| Market for titanium, primary GLO | 167 | 0 | 0 | 0 | 0 | 0 | 0 | 7 | mg |
| Market for graphite GLO | 0 | 148 | 121 | 94 | 111 | 162 | 134 | 210 | mg |
Table 5.
LCI of the SHS.
| Process | Amount | Unit | Description |
|---|---|---|---|
| Inputs | |||
| Market for photovoltaic slanted-roof installation, 3 kWp, single-Si, panel, mounted, on roof—GLO (inverter considered separately) | items | CO of the PV system, mounting system; the In has been excluded. | |
| Market for cable, unspecified cable, unspecified —GLO | 0.1 | kg | CO of cables for a 0.17 kW/m2 PV system [57]. |
| Market for tube insulation, elastomere—GLO | 0.06 | kg | CO of plastic wires coating for a 0.17 kW/m2 PV system [57]. |
| Market for inverter, 2.5kW—GLO | items | - | |
| Market for charger, electric passenger car—GLO | 1.53 | kg | CO of a DC/DC converter weighting 1.53 kg/kW [58]. |
| BESS | kWh | CO of the BESS [25,29,30,42,44]. | |
| VRFB stack | 10.02 | kg | In case of VRFB [29]. |
| VRFB periphery | 5.13 | kg | In case of VRFB [29]. |
| Market for electricity, low voltage | MWh | In case of grid-connected SHSs. | |
| Market for diesel, burned in diesel-electric generating set, 18.5kW—GLO | MWh | In case of off-grid SHSs. | |
| Market for waste electric wiring—GLO | −0.1 ∙10% | kg | EoL of cables for a 0.17 kW/m2 PV system supposing 90% recycling efficiency [57]. |
| Market for used cable—GLO | −0.1 ∙90% | kg | EoL of cables for a 0.17 kW/m2 PV system supposing 90% recycling efficiency [57]. |
| Market for waste wire plastic—GLO | −0.06 | kg | EoL of plastic wires coating for a 0.17 kW/m2 PV system [57]. |
| Market for waste electric and electronic equipment—GLO | −1.53 | kg | EoL of a DC/DC converter weighting 1.53 kg/kW [40,58]. |
| Market for waste electric and electronic equipment—GLO | −4.37 | kg | CO of a DC/AC converter weighting 4.37 kg/kW [40,59]. |
| Market for auxiliary heating unit, electric, 5kW—GLO | 0.001 | items | Number of electric heaters considering an energy supply of 6.67W per kWh of capacity [46] |
| Outputs | |||
| Electricity (RF) | MWh | In case of grid-connected SHS. | |
| MWh | In case of off-grid SHS. | ||
| Exhausted BESS, waste treatment | kWh | CO of a DC/AC converter weighting 4.37 kg/kW [40,59]. | |
| Exhausted PV, waste treatment | 4.29 | kg | EoL of PV modules weighting 4.29 kg/kW [40,60,61]. |
| Market for cable, unspecified—GLO | 0.1 ∙90% | kg | Avoided product, from cables recycling. |
Table 6.
Expected lifespan of the components.
| Component | Lifespan | Unit | ||
|---|---|---|---|---|
| PV | 25 | yr | [62] | |
| BESS | - | yr | [62] | |
| In | 10 | yr | [62] | |
| CC | 11 | yr | [62] | |
| Wiring | 10 | yr | [62] | |
| VRFB stack | 10 | yr | [29] | |
| VRFB periphery | 10 | yr | [29] | |
| ZEBRA battery heater | 10 | yr | [45] |
Table 7.
Input data for the design of the SHSs in several countries.
| Parameter | DK | ES | FR | GR | HU | IT | PT | RO |
|---|---|---|---|---|---|---|---|---|
| 5.4 | 4.5 | 7.2 | 5.6 | 3.3 | 3.2 | 3.8 | 1.8 | |
| 0.7 | 3.3 | 1.2 | 2.9 | 1.0 | 2.8 | 3.3 | 1.6 |
Table 8.
Results of the design phase.
| LIBs, SSLIBs, SIBs, ZEBRA | LiSBs | VRFBs | ||||
|---|---|---|---|---|---|---|
| DK | 32.03 | 4.53 | 32.03 | 18.53 | 17.44 | 17.61 |
| ES | 4.33 | 2.55 | 4.33 | 15.41 | 14.51 | 12.98 |
| FR | 16.86 | 17.44 | 16.86 | 24.54 | 23.10 | 20.67 |
| GR | 6.52 | 5.64 | 6.52 | 19.05 | 17.93 | 16.04 |
| HU | 8.22 | 2.21 | 8.22 | 11.45 | 10.77 | 9.64 |
| IT | 3.82 | 3.56 | 3.82 | 10.89 | 10.25 | 9.17 |
| PT | 4.27 | 4.43 | 4.27 | 13.00 | 12.24 | 10.95 |
| RO | 4.01 | 1.55 | 4.01 | 6.27 | 5.90 | 5.28 |
Table 9.
Results of the modelling phase, minimum and maximum values, excluding the lifespan of VRFB.
Table 9.
Results of the modelling phase, minimum and maximum values, excluding the lifespan of VRFB.
| Min | Max | Min | Max | Min | Max | |||||||
|---|---|---|---|---|---|---|---|---|---|---|---|---|
| DK | 1.63 | Deng (LiSB) | 8.31 | Eco. (ZEBRA) | 11.31 | Ell (NCM) | 13.93 | Weber (VRFB) | 337.73 | Deng (LiSBs) | 361.76 | Peters (SIB) |
| ES | 1.89 | Deng (LiSB) | 8.95 | Eco. (ZEBRA) | 7.30 | Ell (NCM) | 13.02 | Deng (LiSBs) | 6.21 | Weber (VRFB) | 19.28 | Deng (LiSBs) |
| FR | 1.59 | Deng (LiSB) | 8.13 | Eco. (ZEBRA) | 8.30 | Ell (NCM) | 11.67 | Notter (LMO) | 66.55 | Notter (LMO) | 103.48 | M-B (NCM) |
| GR | 1.86 | Deng (LiSB) | 8.86 | Eco. (ZEBRA) | 10.16 | Ell (NCM) | 13.54 | Weber (VRFB) | 26.74 | Weber (VRFB) | 36.24 | Ell (NCM) |
| HU | 1.72 | Deng (LiSB) | 8.52 | Eco. (ZEBRA) | 3.64 | Ell (NCM) | 4.90 | Weber (VRFB) | 62.16 | Weber (VRFB) | 75.35 | Ell (NCM) |
| IT | 1.97 | Deng (LiSB) | 9.06 | Eco. (ZEBRA) | 5.75 | Ell (NCM) | 8.31 | Weber (VRFB) | 9.60 | Weber (VRFB) | 13.64 | Ell (NCM) |
| PT | 1.71 | Deng (LiSB) | 8.52 | Eco. (ZEBRA) | 4.45 | Ell (NCM) | 6.31 | Weber (VRFB) | 11.23 | Weber (VRFB) | 16.57 | Ell (NCM) |
| RO | 1.86 | Deng (LiSB) | 8.88 | Eco. (ZEBRA) | 2.93 | Ell (NCM) | 3.67 | Weber (VRFB) | 29.86 | Weber (VRFB) | 34.14 | Ell (NCM) |
Table 10.
LCIA results of the most sustainable batteries by categories and by installation sites.
| Best SHS, with LIBs [Pts/MWh] | Best SHS, with SSLIBs [Pts/MWh] | Best SHS, with aBESS [Pts/MWh] | Mix | |||||||
|---|---|---|---|---|---|---|---|---|---|---|
| On-Grid | Off-Grid | On-Grid | On-Grid | Off-Grid | BESS | On-Grid | On-Grid | BESS | [Pts/MWh] | |
| DK | 24.00 | 93.02 | Ell (NCM) | 23.18 | 90.05 | Ell (SSNCM) | 22.75 | 89.62 | Peters (SIB) | 42.43 |
| ES | 19.24 | 26.39 | 16.76 | 23.63 | 18.78 | 27.90 | Weber (VRFB) | 37.45 | ||
| FR | 26.82 | 47.25 | 24.87 | 44.18 | 26.31 | 45.84 | Weber (VRFB) | 7.58 | ||
| GR | 24.59 | 31.10 | 22.40 | 28.34 | 25.99 | 31.13 | Weber (VRFB) | 112.96 | ||
| HU | 21.55 | 43.56 | 20.04 | 40.68 | 22.15 | 44.11 | Peters (SIB) | 55.36 | ||
| IT | 22.40 | 31.51 | 20.11 | 28.83 | 22.28 | 32.59 | Weber (VRFB) | 41.56 | ||
| PT | 20.95 | 28.12 | 18.50 | 25.23 | 20.02 | 27.36 | Weber (VRFB) | 39.53 | ||
| RO | 22.32 | 42.65 | 20.75 | 39.91 | 22.67 | 46.36 | Weber (VRFB) | 56.83 | ||
Table 11.
Components contribution analysis of the most sustainable SHSs by categories and by installation sites.
Table 11.
Components contribution analysis of the most sustainable SHSs by categories and by installation sites.
| PV | BESS | In | CC | |||||||
|---|---|---|---|---|---|---|---|---|---|---|
| On-Grid | Off-Grid | On-Grid | Off-Grid | On-Grid | Off-Grid | On-Grid | Off-Grid | On-Grid | Off-Grid | |
| DK | 83.24% | 77.63% | 9.76% | 9.11% | 2.46% | 2.30% | 0.29% | 0.27% | 4.25% | 10.69% |
| ES | 60.70% | 47.86% | 13.39% | 10.57% | 7.49% | 5.90% | 5.37% | 4.24% | 13.05% | 31.43% |
| FR | 70.50% | 45.14% | 7.11% | 6.31% | 15.25% | 13.54% | 6.24% | 5.54% | 0.90% | 29.47% |
| GR | 48.79% | 48.61% | 8.86% | 8.83% | 8.82% | 8.79% | 4.32% | 4.30% | 29.21% | 29.47% |
| HU | 75.85% | 71.06% | 6.85% | 6.41% | 4.26% | 3.99% | 6.71% | 6.29% | 6.33% | 12.25% |
| IT | 59.93% | 48.99% | 10.33% | 8.44% | 11.69% | 9.55% | 5.30% | 4.34% | 12.75% | 28.68% |
| PT | 60.84% | 52.38% | 12.04% | 10.37% | 13.21% | 11.38% | 5.39% | 4.64% | 8.52% | 21.23% |
| RO | 71.04% | 64.43% | 6.83% | 6.20% | 5.77% | 5.24% | 6.29% | 5.73% | 10.07% | 18.40% |
© 2020 by the authors. Licensee MDPI, Basel, Switzerland. This article is an open access article distributed under the terms and conditions of the Creative Commons Attribution (CC BY) license (http://creativecommons.org/licenses/by/4.0/).
Share and Cite
MDPI and ACS Style
Rossi, F.; Parisi, M.L.; Greven, S.; Basosi, R.; Sinicropi, A. Life Cycle Assessment of Classic and Innovative Batteries for Solar Home Systems in Europe. Energies 2020, 13, 3454. https://0-doi-org.brum.beds.ac.uk/10.3390/en13133454
AMA Style
Rossi F, Parisi ML, Greven S, Basosi R, Sinicropi A. Life Cycle Assessment of Classic and Innovative Batteries for Solar Home Systems in Europe. Energies. 2020; 13(13):3454. https://0-doi-org.brum.beds.ac.uk/10.3390/en13133454
Chicago/Turabian StyleRossi, Federico, Maria Laura Parisi, Sarah Greven, Riccardo Basosi, and Adalgisa Sinicropi. 2020. "Life Cycle Assessment of Classic and Innovative Batteries for Solar Home Systems in Europe" Energies 13, no. 13: 3454. https://0-doi-org.brum.beds.ac.uk/10.3390/en13133454
Note that from the first issue of 2016, this journal uses article numbers instead of page numbers. See further details here.