1. Introduction
Societal improvements will increasingly become apparent as electric vehicle (EV) uptake levels rise. These will range from reductions in transport-related carbon emissions, to the use of EV battery systems for the provision of grid services. Such benefits have been recognized by many governments globally, as regulations have been issued to incentivize the electrification of vehicle markets [
1]. However, the increased charging loads caused by high levels of EV uptake are expected to burden electricity networks. For distribution networks, concerns primarily focus on asset capacity limitations and voltage stability issues.
Previous work has shown a need for distribution transformers to accommodate for the highly variable nature of EV charging loads by design [
2]. However, the unpredictable and volatile nature of EV charging demand under many circumstances means some form of charging control may be required. Many studies have been devoted to the use of charge scheduling to reduce overloading distribution transformers and other network assets [
3,
4,
5,
6,
7]. One example particular to distribution transformers and that employs a fuzzy logic controller (FLC) is given in [
8]. This approach comprises four main inputs, including the EV battery state of charge (SOC), required SOC for the next trip, estimated time of EV departure, and customer comfort level. The resulting output is a performance index to be used by distribution system operators (DSOs) to determine whether to delay the charging of a given EV. This approach was shown to be successful in mitigating against transformer loss of life and hazard of failure. However, a drawback is the centralized nature of the system, as charging requests and transformer loading information are all sent to the DSO. For DSOs with very large numbers of transformers in urban areas, such control approaches will introduce difficulties, as significant data processing capability will be needed [
9]. An improvement in that respect is the system described in [
9]. For this system, control features are implemented and located at the distribution transformer, along with communication features, inside a transformer terminal unit. This allows for the direct control of Photovoltaic (PV) systems and other loads within residences supplied by a transformer and based on the transformer’s loading and condition. In [
9], a focus was placed on the control of PV inverters and the mitigation of voltage violation issues. With regard to EV charging loads it was stated that increased levels of EV penetration in future networks will require transformer management systems to solve transformer overloading problems. However, a transformer-based control technique suited to EV charging load control was not presented. Therefore, a solution is proposed in this paper.
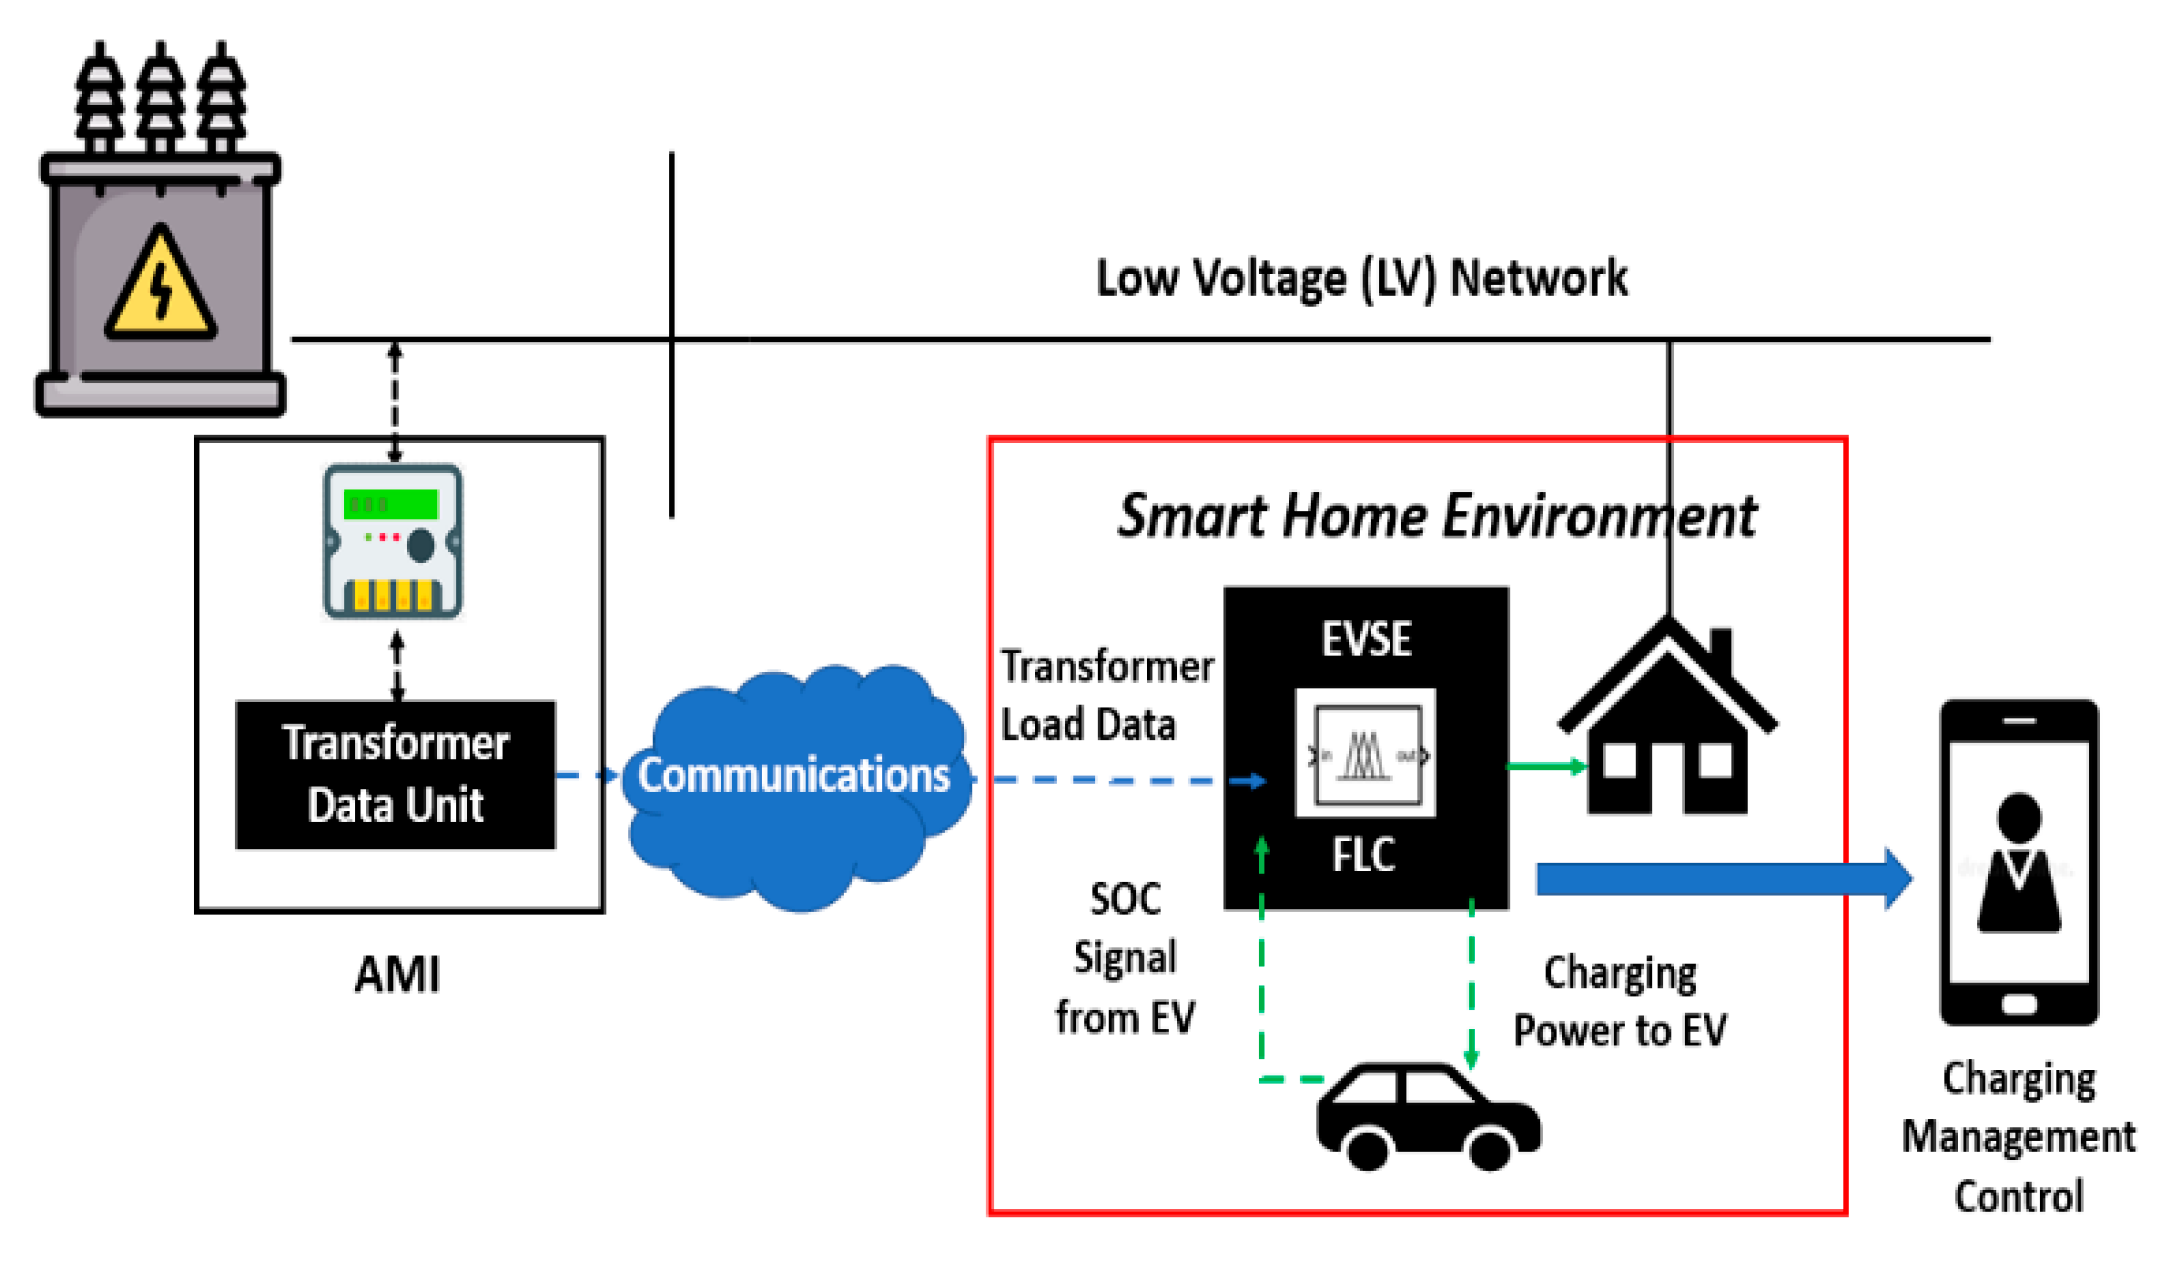
In this paper, an approach to realize smart charging control of the EV charging loads to prevent distribution transformer overloading is proposed. This is achieved using an FLC that accepts the local distribution transformer loading level as a primary input. The embedding of the FLC within the EVSE allows the economic cost of implementing charging control to be shared with consumers and suits a smart home setting. Sending loading level information on distribution transformers directly from transformers to FLCs reduces the need DSO input, thus reducing the communications requirements. The proposed approach is general in terms of applicability, and its effectiveness is demonstrated through a case study on a distribution network in Jakarta, Indonesia. The case study is based on realistic conditions, as electric car and motorcycle loading is considered and modeled for local travel patterns. The inclusion of electric motorcycles is important, given the popularity of this form of transport in Indonesia. The FLC employed has inputs comprising the battery SOC, the distribution transformer per-unit loading level, and discount time. A Monte Carlo simulation approach predicts EV loading levels, as the factors considered include daily traveling mileage, charging mode, and charging location.
Section 2 describes the proposed FLC, and its implementation in a distribution network setting.
2. The FLC and Smart Charge Scheduling Implementation
FLC utilizes multivalued logic for which variables can belong by several membership functions at the same time. Importantly, it allows for a linguistic representation of rules, obviating the need to develop a mathematical model of the system [
10]. For distribution networks with large numbers of EVs, this is a significant advantage, and eases control design issues. The FLC allows for EV charging in large numbers, while minimizing the impact on a distribution network in terms of complying to transformer rating limitations and improving voltage stability. It uses Mamdani fuzzy interference and is centroid based for defuzzification.
The FLC has three inputs: Transformer load, SOC, and discount price. In real time, the transformer load can be measured using advanced meter infrastructure (AMI) installed on the distribution transformer. The structure of the smart charging using the FLC is given in
Figure 1.
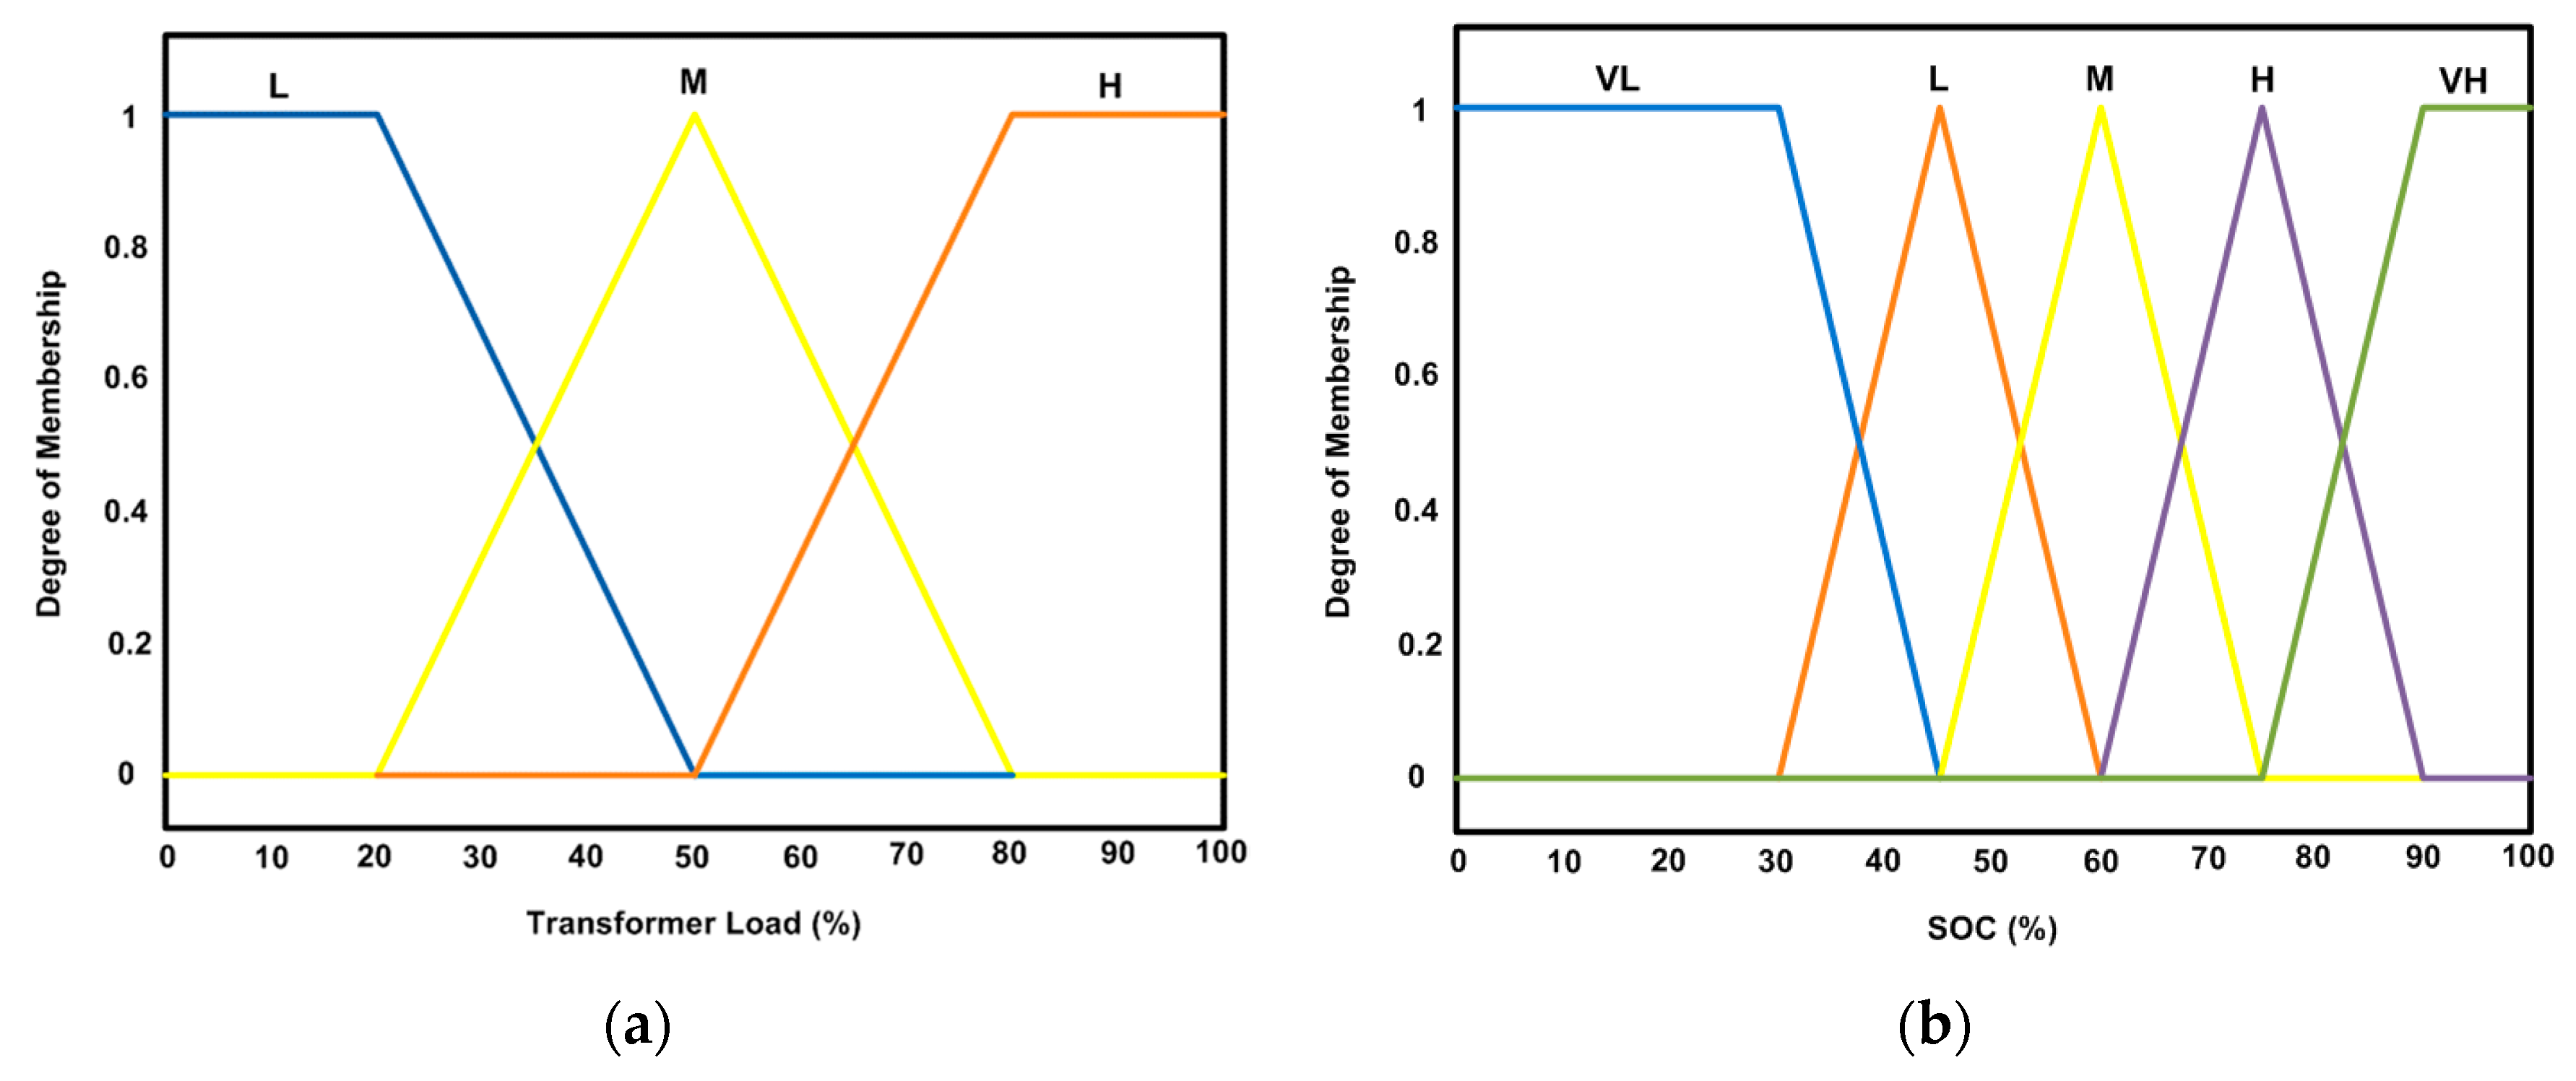
When the transformer load is high, it will reduce the EV charging power allowed. For case study relevancy, the high load limit was set at 0.8 p.u., in compliance with the Indonesian utility policy. The FLC input for the transformer load is categorized into three membership functions (MFs), which are low (L), medium (M), and high (H). Another input is the EV SOC, which is divided into MFs, which are very low (VL), low (L), medium (M), high (H), and very high (VH). This allows those EVs with a lower SOC to be given preference to charge with higher power.
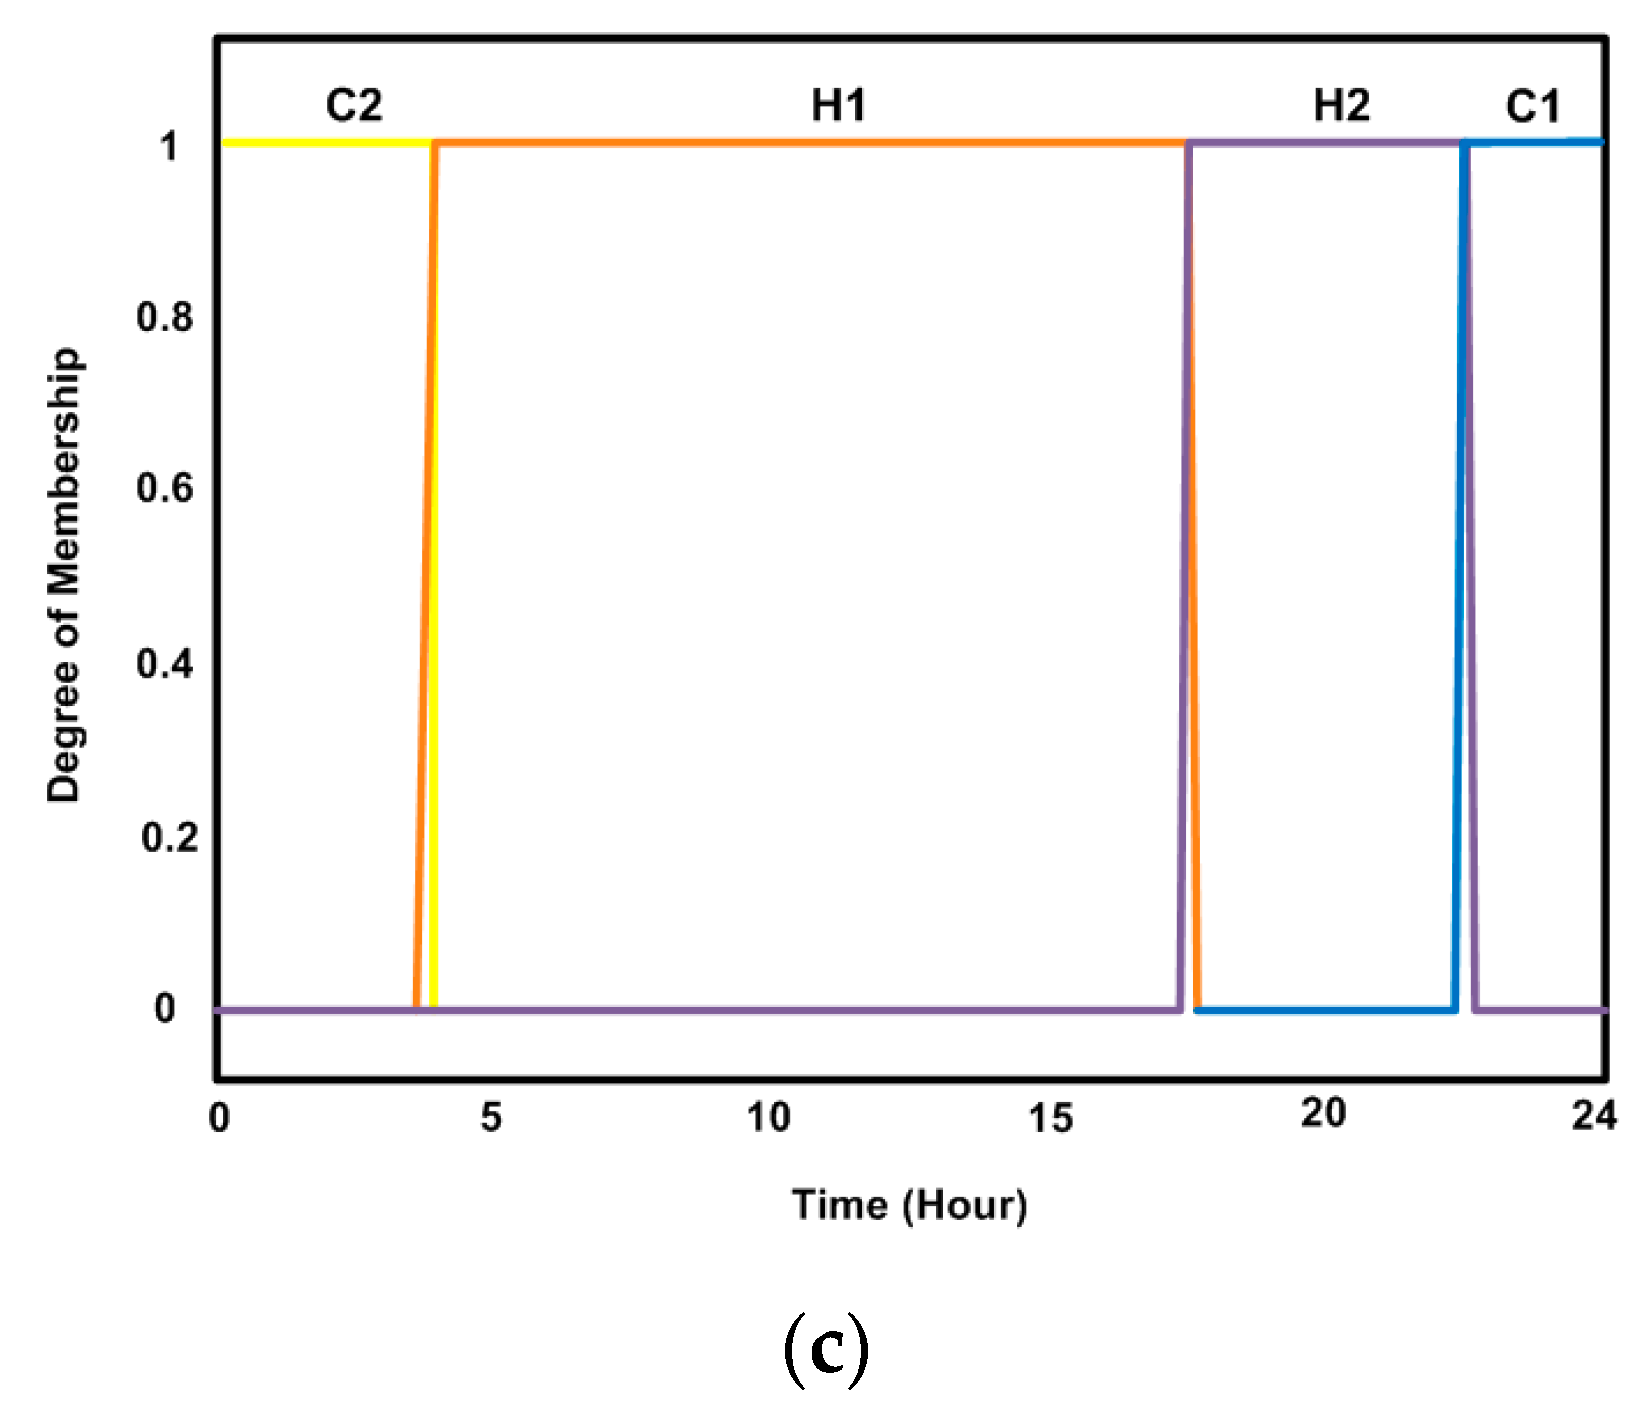
To incentivize the transition to Evs in Indonesia, a 30% discount to the electricity tariff is offered for charging between 22.00 to 04.00 h. Thus, discount pricing is given based on EV plug-in time, and is a mechanism to shift the charging demands to off-peak periods. The discount price input to the FLC is divided into four MFs, which are cheap 1 (C1), cheap 2 (C2), expensive 1 (H1), and expensive 2 (H2).
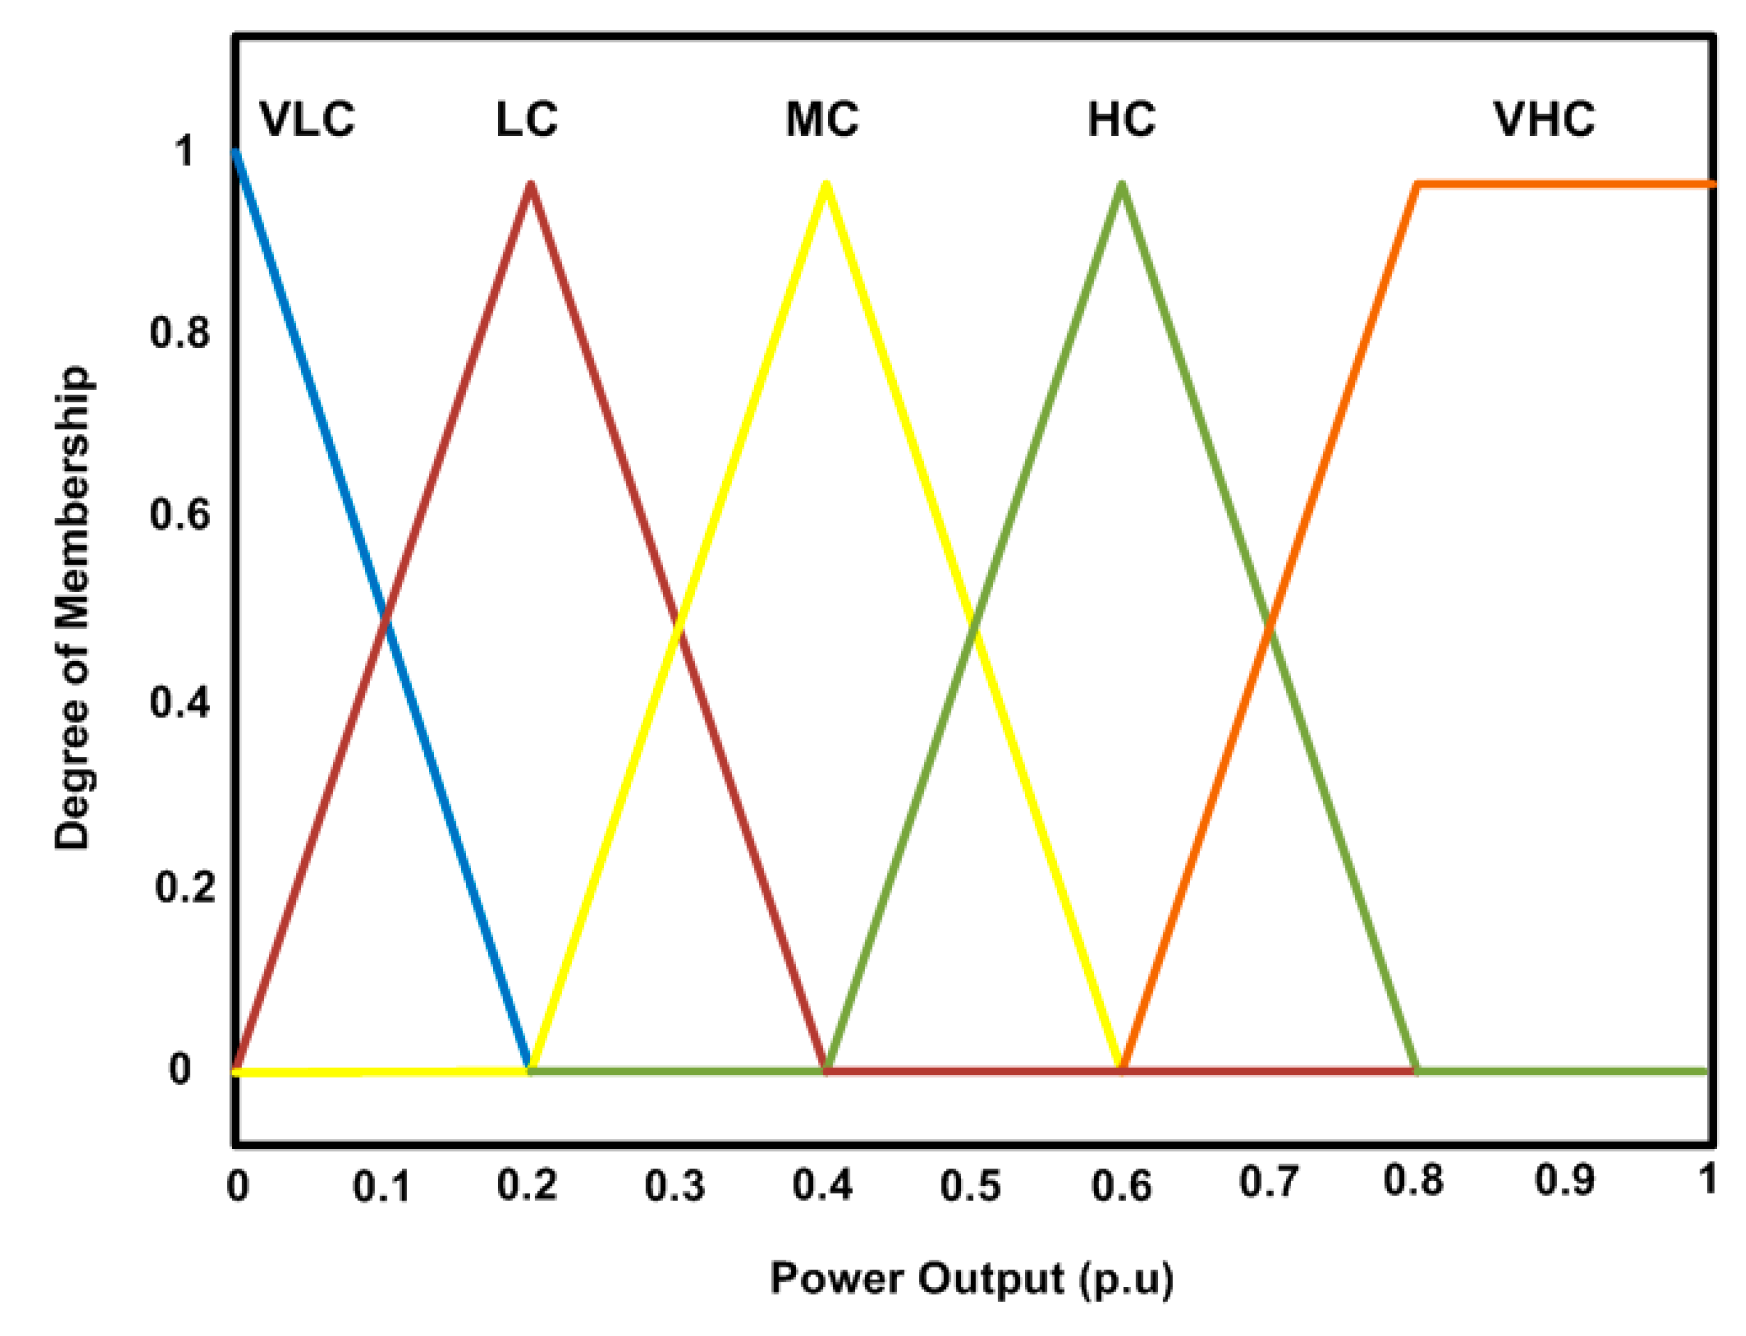
The output of the FLC is the charging level allowed (p.u.). Multiplication with the charger rating gives the charging power. The maximum charging power for an electric car is assumed to be 3.7 kW, and for an electric motorcycle it is 0.5 kW. The output of the FLC is divided into five MFs, which are very low charging (VLC), low charging (LC), medium charging (MC), high charging (HC), and very high charging (VHC). The FLC inputs and outputs are shown in
Figure 2 and
Figure 3, respectively.
In
Section 3, EV load modelling is presented, allowing the charging demand patterns to be developed to which the smart charging will be applied.
3. EV Load Modelling
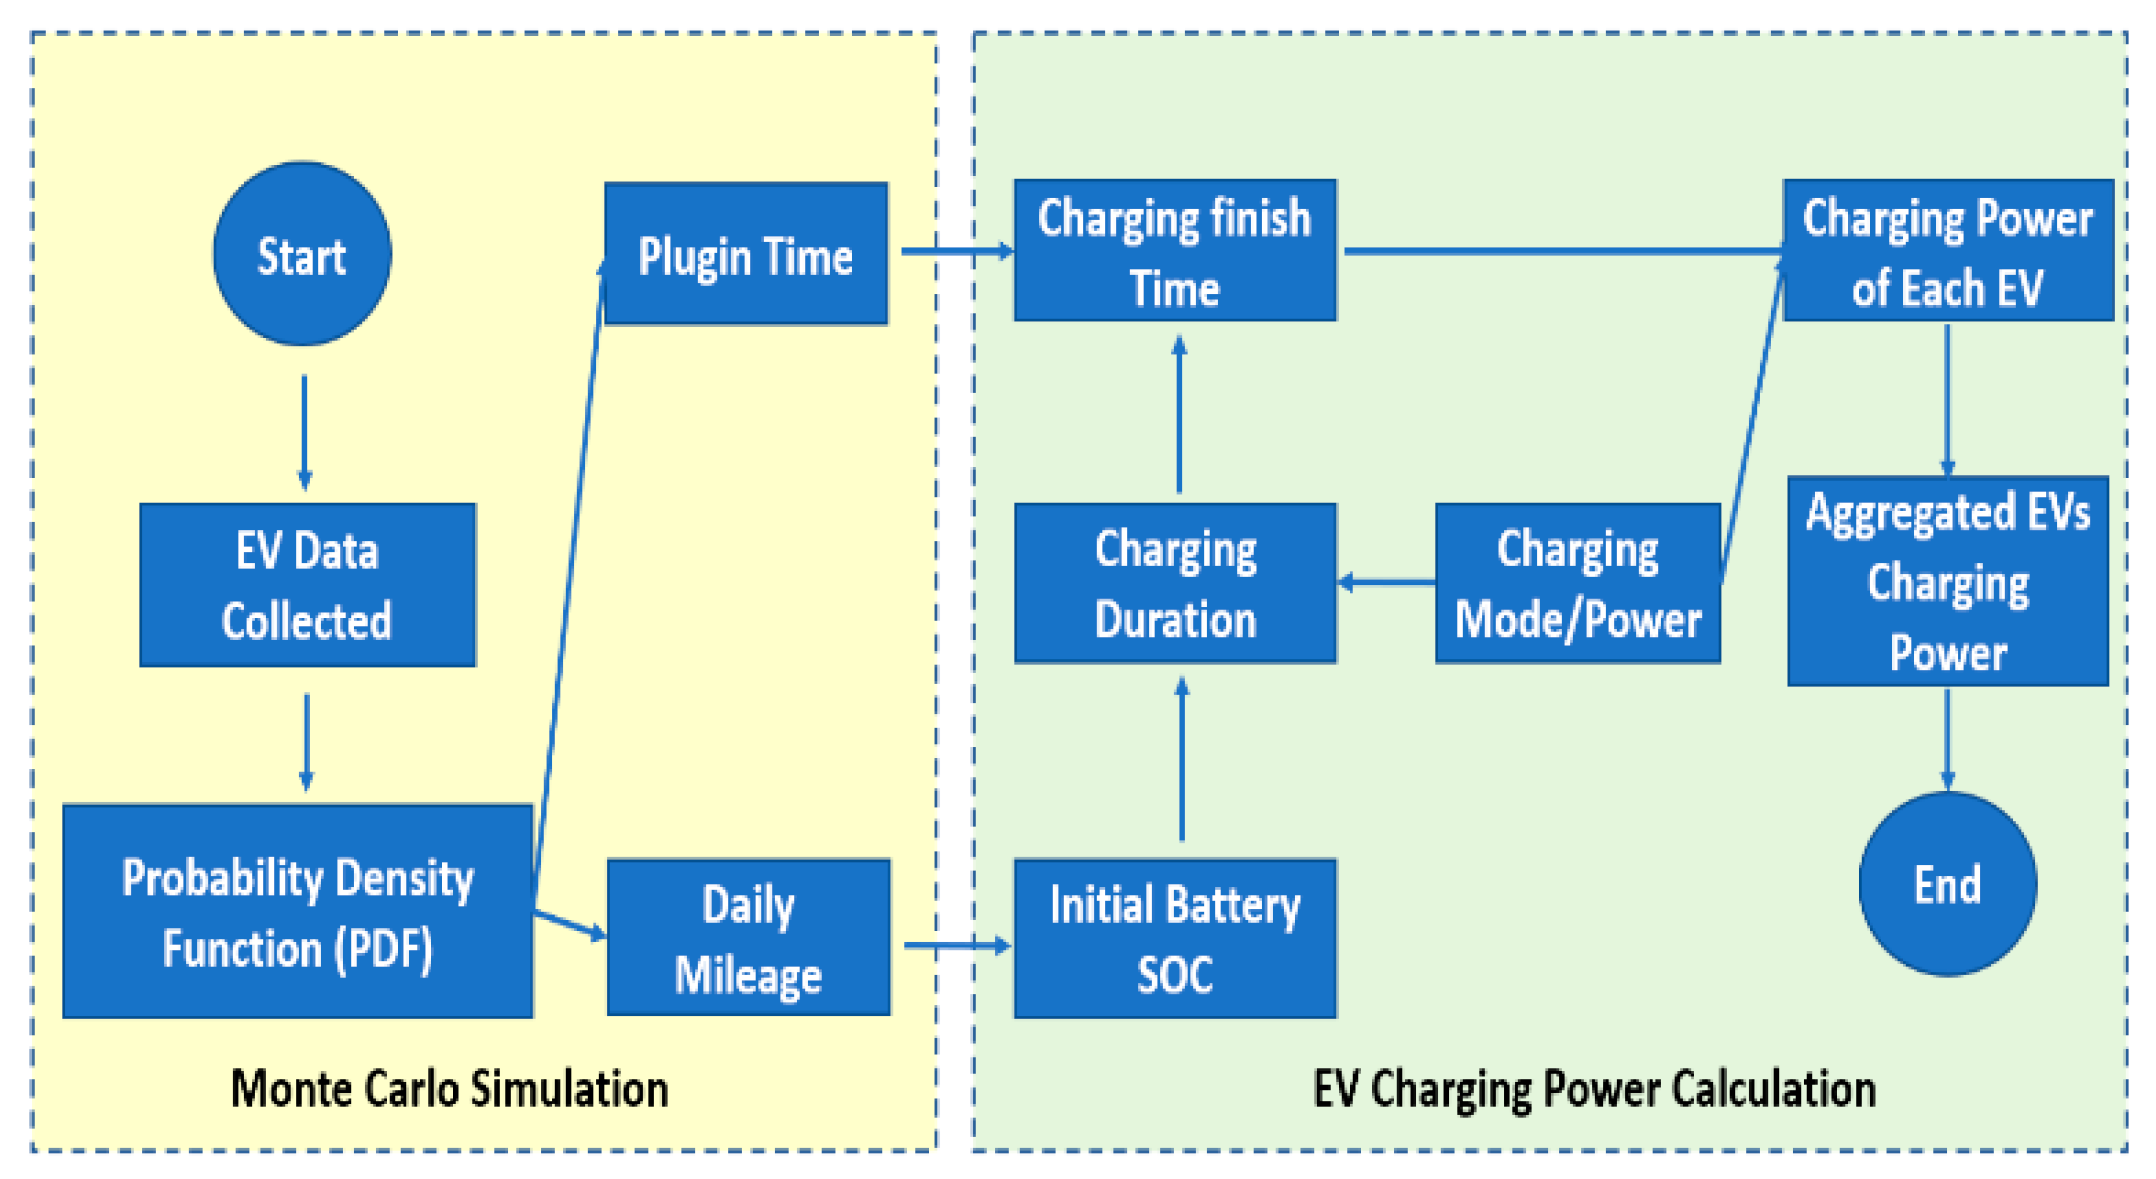
To model EV charging loads, a Monte Carlo simulation (MCS) approach was used. It is based on deriving probability density functions (PDFs) of EV daily travelling mileage (
r) and plug-in times (
to calculate EV SOC and charging finish times (
). With knowledge of the number of EVs that are connected to any particular distribution transformer, this allows the total overnight charging load on the transformer to be predicted. A smart charging approach through FLC can then be applied to minimize the impact of the charging load on the distribution transformer, while also improving voltage stability. The MCS approach used is summarized in
Figure 4.
In
Section 3.1, the types of EVs are considered, and used to develop PDFs of the daily travelling mileage (
r), of each EV type. In
Section 3.2, the SOC of EV batteries is determined, along with the
, charging duration time (
), and
. In
Section 3.3, the EV charging load that can be connected to a distribution transformer is determined.
3.1. Types of Vehicles
Based on data obtained from Indonesian Central Bureau of statistics in 2018 [
11], almost 40% of the total vehicles are in Jakarta. Primarily, these vehicles are small cars and motorcycles. Accordingly, the types of EVs considered are the Nissan Leaf (car) [
12] and the Gesits (motorcycle) [
13]. The EV specifications are used to model key parameters, including the battery capacity, and are given in
Table 1 (fast charging is not allowed for the motorcycle). Along with the daily travel distance, this allows the battery SOC to be determined.
The daily distance travelled by an EV must account for standard travelling patterns in Jakarta. Accordingly, and based on data obtained from the user’s guide for the transportation sector and the Indonesia 2050 pathway calculator [
14], the daily mileage for vehicles is given in
Table 2.
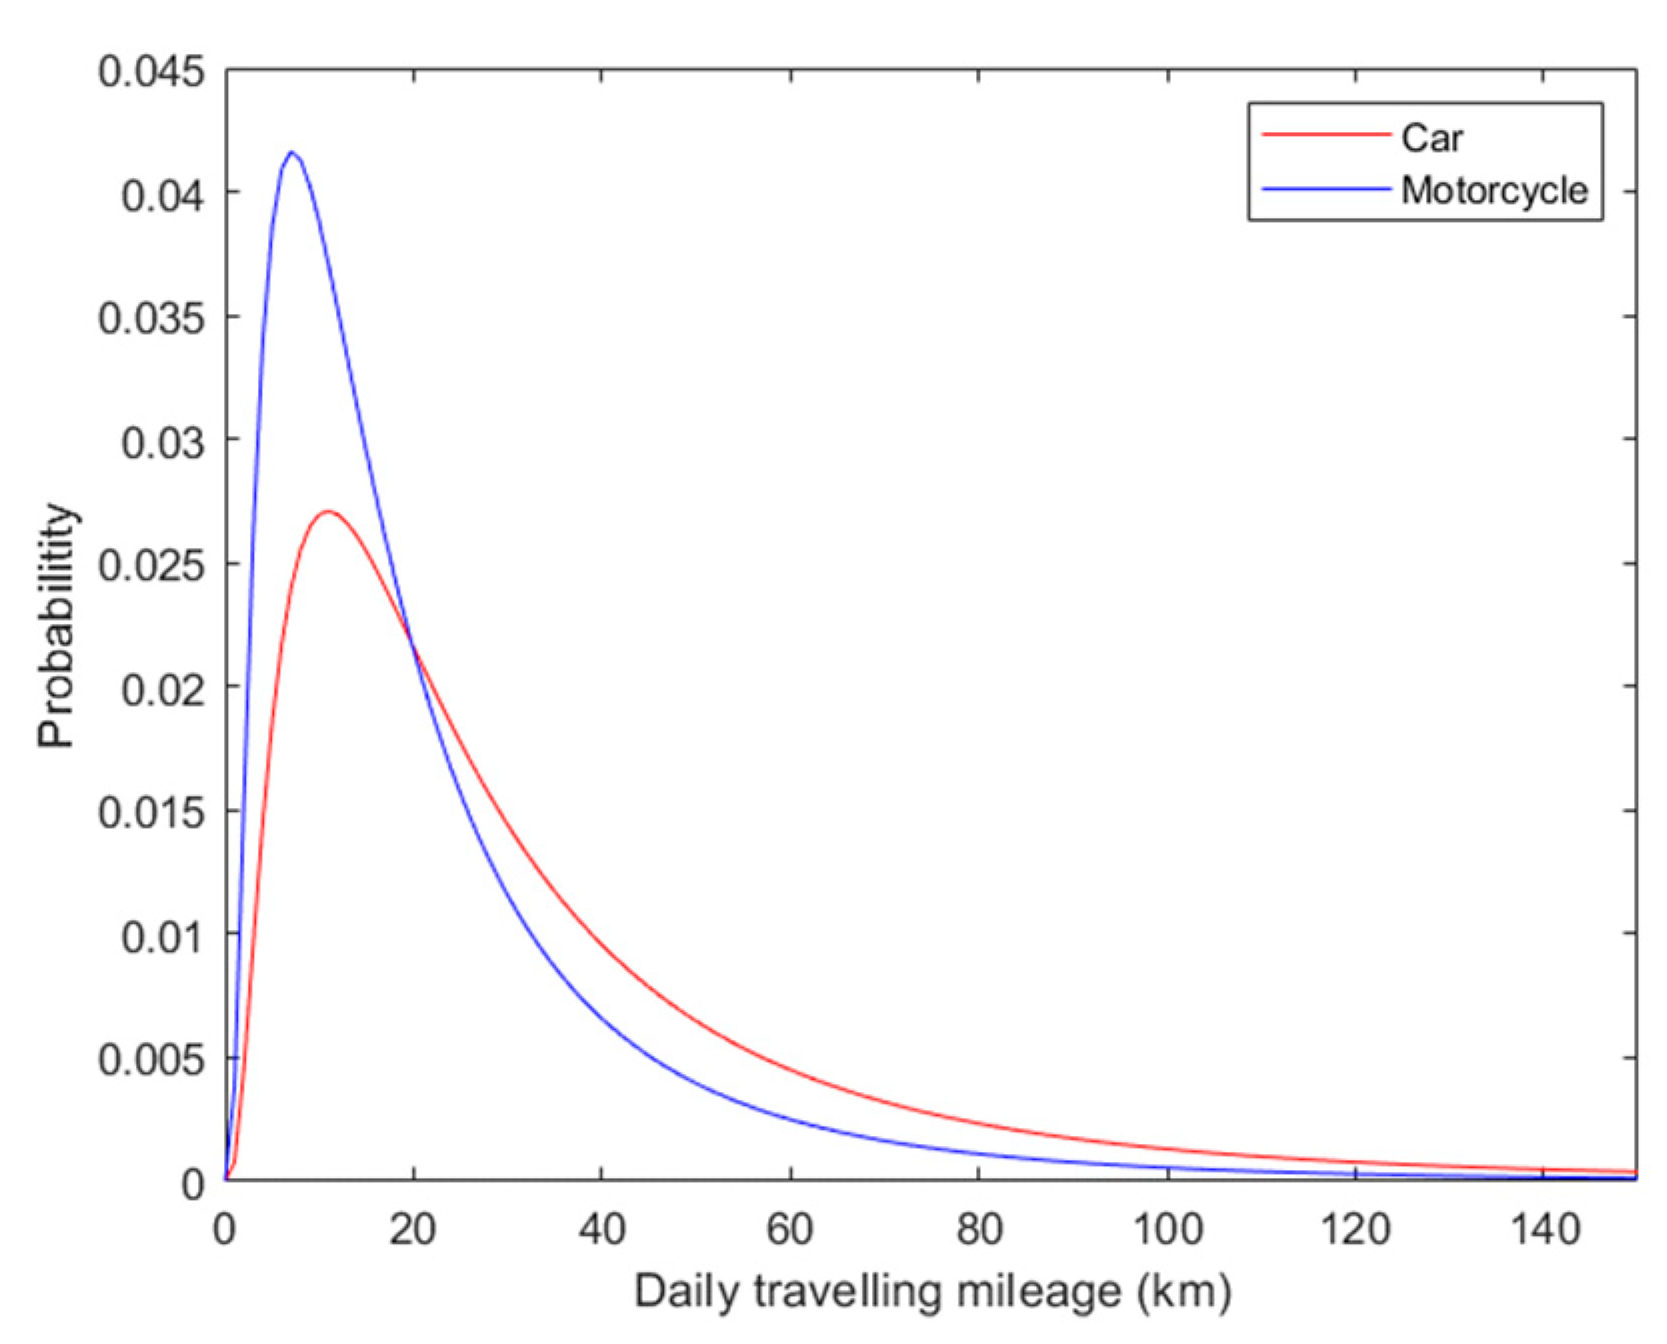
The probability density function (PDF) of the daily travelling mileage is used to account for variations. A lognormal distribution [
15] is assumed, with the PDF given by:
where
is the daily traveling mileage (km),
is the daily travelling mileage mean value, and
is the daily travelling mileage standard deviation.
Based on calculations using (1), the probability distribution of car and motorcycle daily traveling distances is given in
Figure 5.
3.2. State of Charge (SOC)
It is expected for EVs that batteries must be fully charged, after plug-in. The charging load this presents is dependent on the battery SOC. From the daily traveling mileage data of each vehicle obtained from (1), the remaining SOC of each vehicle can be calculated using:
where
d is the daily traveling distance (km) of each vehicle generated randomly from (1),
D is the full endurance mileage (km), and
is set at 0.95 and relates to the charging efficiency [
16].
As well as being dependent on battery SOC, the nature of charging loads is dependent on the plug-in time and duration. The plug-in time for each EV depends on where the EV will charge. In Indonesia, the average working hours are from 08.00 until 16.00 h. Given high traffic congestion in the afternoon, the travel time to go home generally takes between one to two hours. Thus, it is assumed that people will arrive at home at around 18.00 h. At installation control points (ICPs), vehicle owners will charge their cars overnight between 18.00 and 07.00 h [
17]. The plug-in time for each EV can be determined using:
where
is the plug-in time,
is the plug-in time mean value, and
is the plug-in time standard deviation. For different EV types, values of
and
can be derived from
Table 3.
Charging duration is affected by the battery SOC and the charging power used. The maximum charging power used is assumed to be 3.7 kW, which is expected to be that most commonly used within residential distribution networks. For electric motorcycles, lower charging power is used, which reflects the smaller 5-kWh capacity of motorcycle batteries. It is assumed that batteries must be fully charged at the end of each charging cycle. The charging duration can be calculated using:
for each vehicle,
is the charging finish time for each EV,
Cap is the full capacity of the battery (kWh),
is the charging power (kW) defined in
Table 1, and
is the efficiency of the charger of 0.95.
(hours) is the charging duration to reach the full capacity of the SOC battery.
The additional load on a distribution transformer due to EV integration is obtained by aggregating the power charging demand of each EV for 24 h. This is done in
Section 3.3 under various EV penetration scenarios.
3.3. Charging Power Demand
For this paper, four EV penetration scenarios were considered based on
Table 4. For each scenario, the EV penetration level is defined as the ratio of EVs owned to the total number of vehicles in an area.
To aid in determining the number of EVs in any given area served by a distribution transformer, the ratio of vehicle ownership to the number of electricity consumers in that area can be used (
VORi), as given by:
where
Total Vehiclei is the summation of all vehicles (cars and motorcycles) at all ICPs supplied by the distribution transformer under consideration,
i = {1,2} is the type of vehicle (1: car, 2: motorcycle), and total electric consumers is the number of ICPs supplied by the distribution transformer.
To determine the charging power demands on a distribution transformer, the daily travelling mileage must be used to estimate EV SOC at the beginning of overnight charging. By knowing the number of ICPs in an area supplied from one distribution transformer, the number of EVs of each type can be obtained as:
where
EVi is the number of EVs (of each type
i = 1, or 2) connected to a distribution transformer, and
PL is the EV penetration level.
The results of the power demand for each EV are aggregated using (8) for various points in time, so that the charging power demand vs. time profile for all vehicles is obtained:
where
is the total charging load of
N EVs (kW).
With knowledge of the charging power demand vs. time profile, smart charging methods can be employed to assure overnight charging demands do not cause distribution transformer ratings to be exceeded.
4. Results and Discussion
The distribution network served by the Setiabudi substation in Jakarta was used as the test case. This network has urban characteristics, including a 20-kV grid spindle system that uses an underground network. The specified voltage at the feeding points at the substation is 1.02 p.u and the power factor assumed for residential loading is 0.95.
In order to perform a 24-h simulation, a typical daily load profile for the urban medium voltage grid was used. The load profile was obtained by aggregating different types of Jakarta consumers. The residential, commercial, and industrial consumers’ loads were obtained considering the proportion of installed power related to each type of these consumers. The peak power for the distribution transformer at load 38 under consideration is 383 kW, which occurs at night. The number of EVs used in the test system was modeled using (6) and (7).
Four EV penetration level scenarios were investigated to determine the impact of EV integration on the distribution system based on
Table 5. EV charging demand modeling and the FLC algorithm were run on MATLAB/SIMULINK software. The output from the modeling was entered into the DIgSILENT software to perform load flow studies.
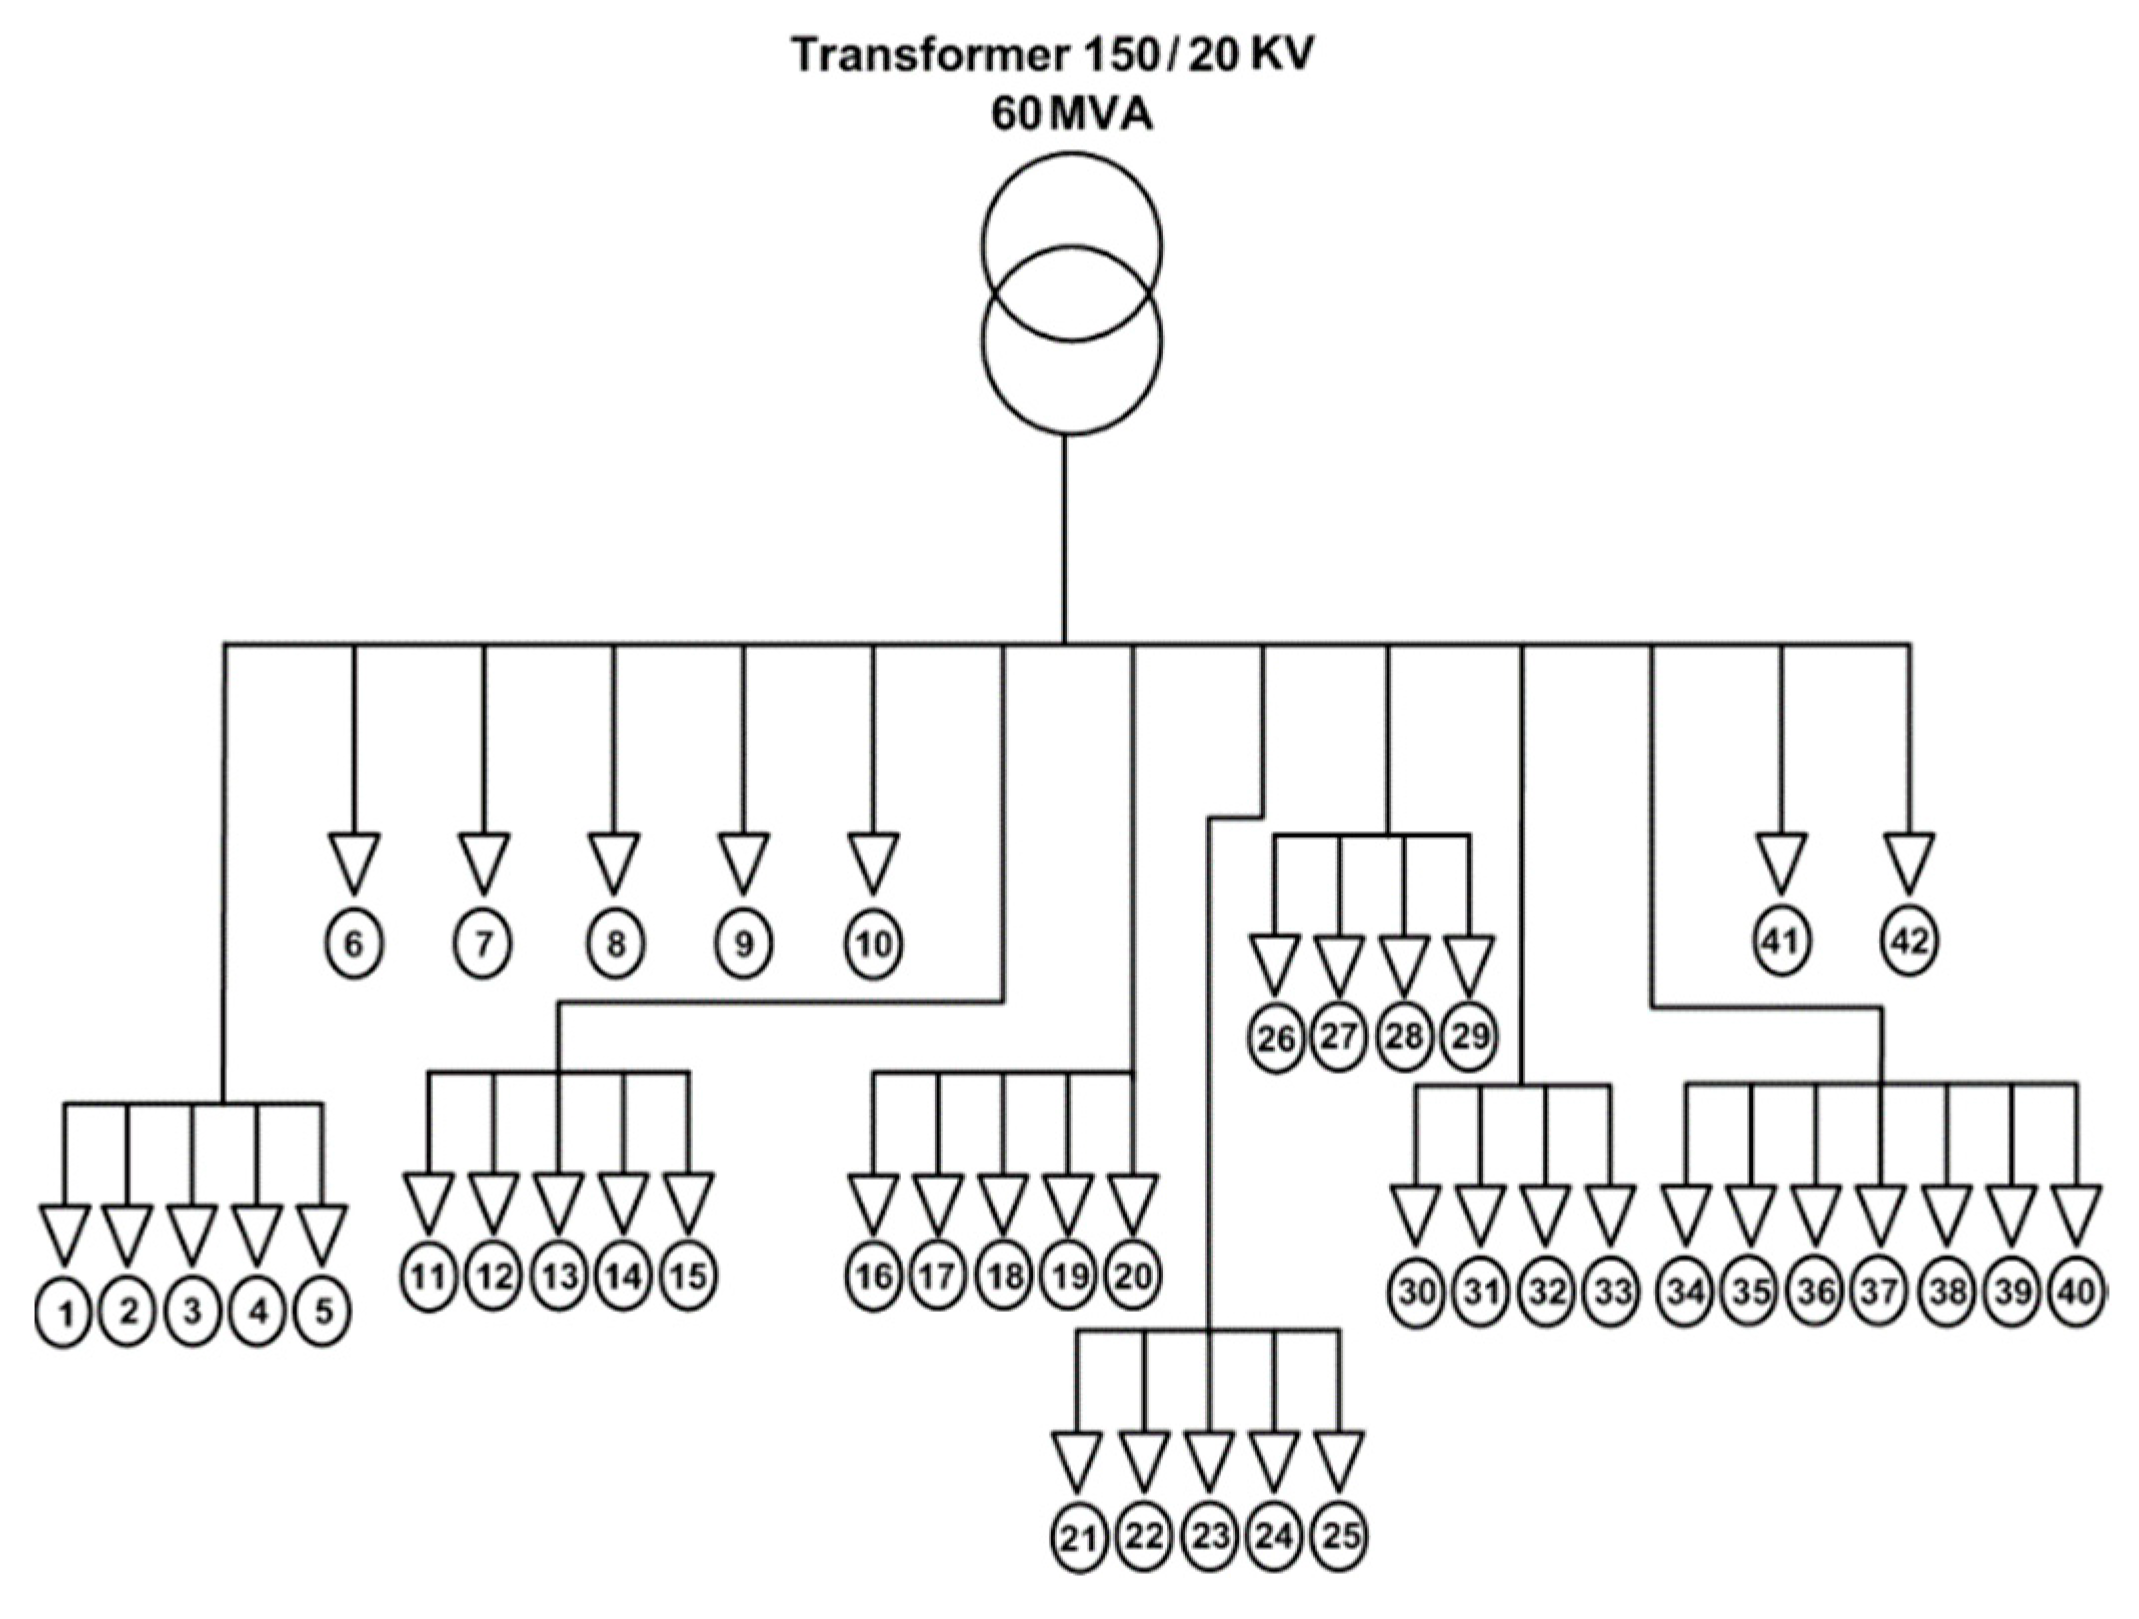
Figure 6 shows a simplified 20 kV distribution network model, comprising 14 feeders and 42 loads. Numbers 1 to 42 are nodes defining loads in different locations. Points of observation were taken in this simulation on a distribution transformer at load 38.
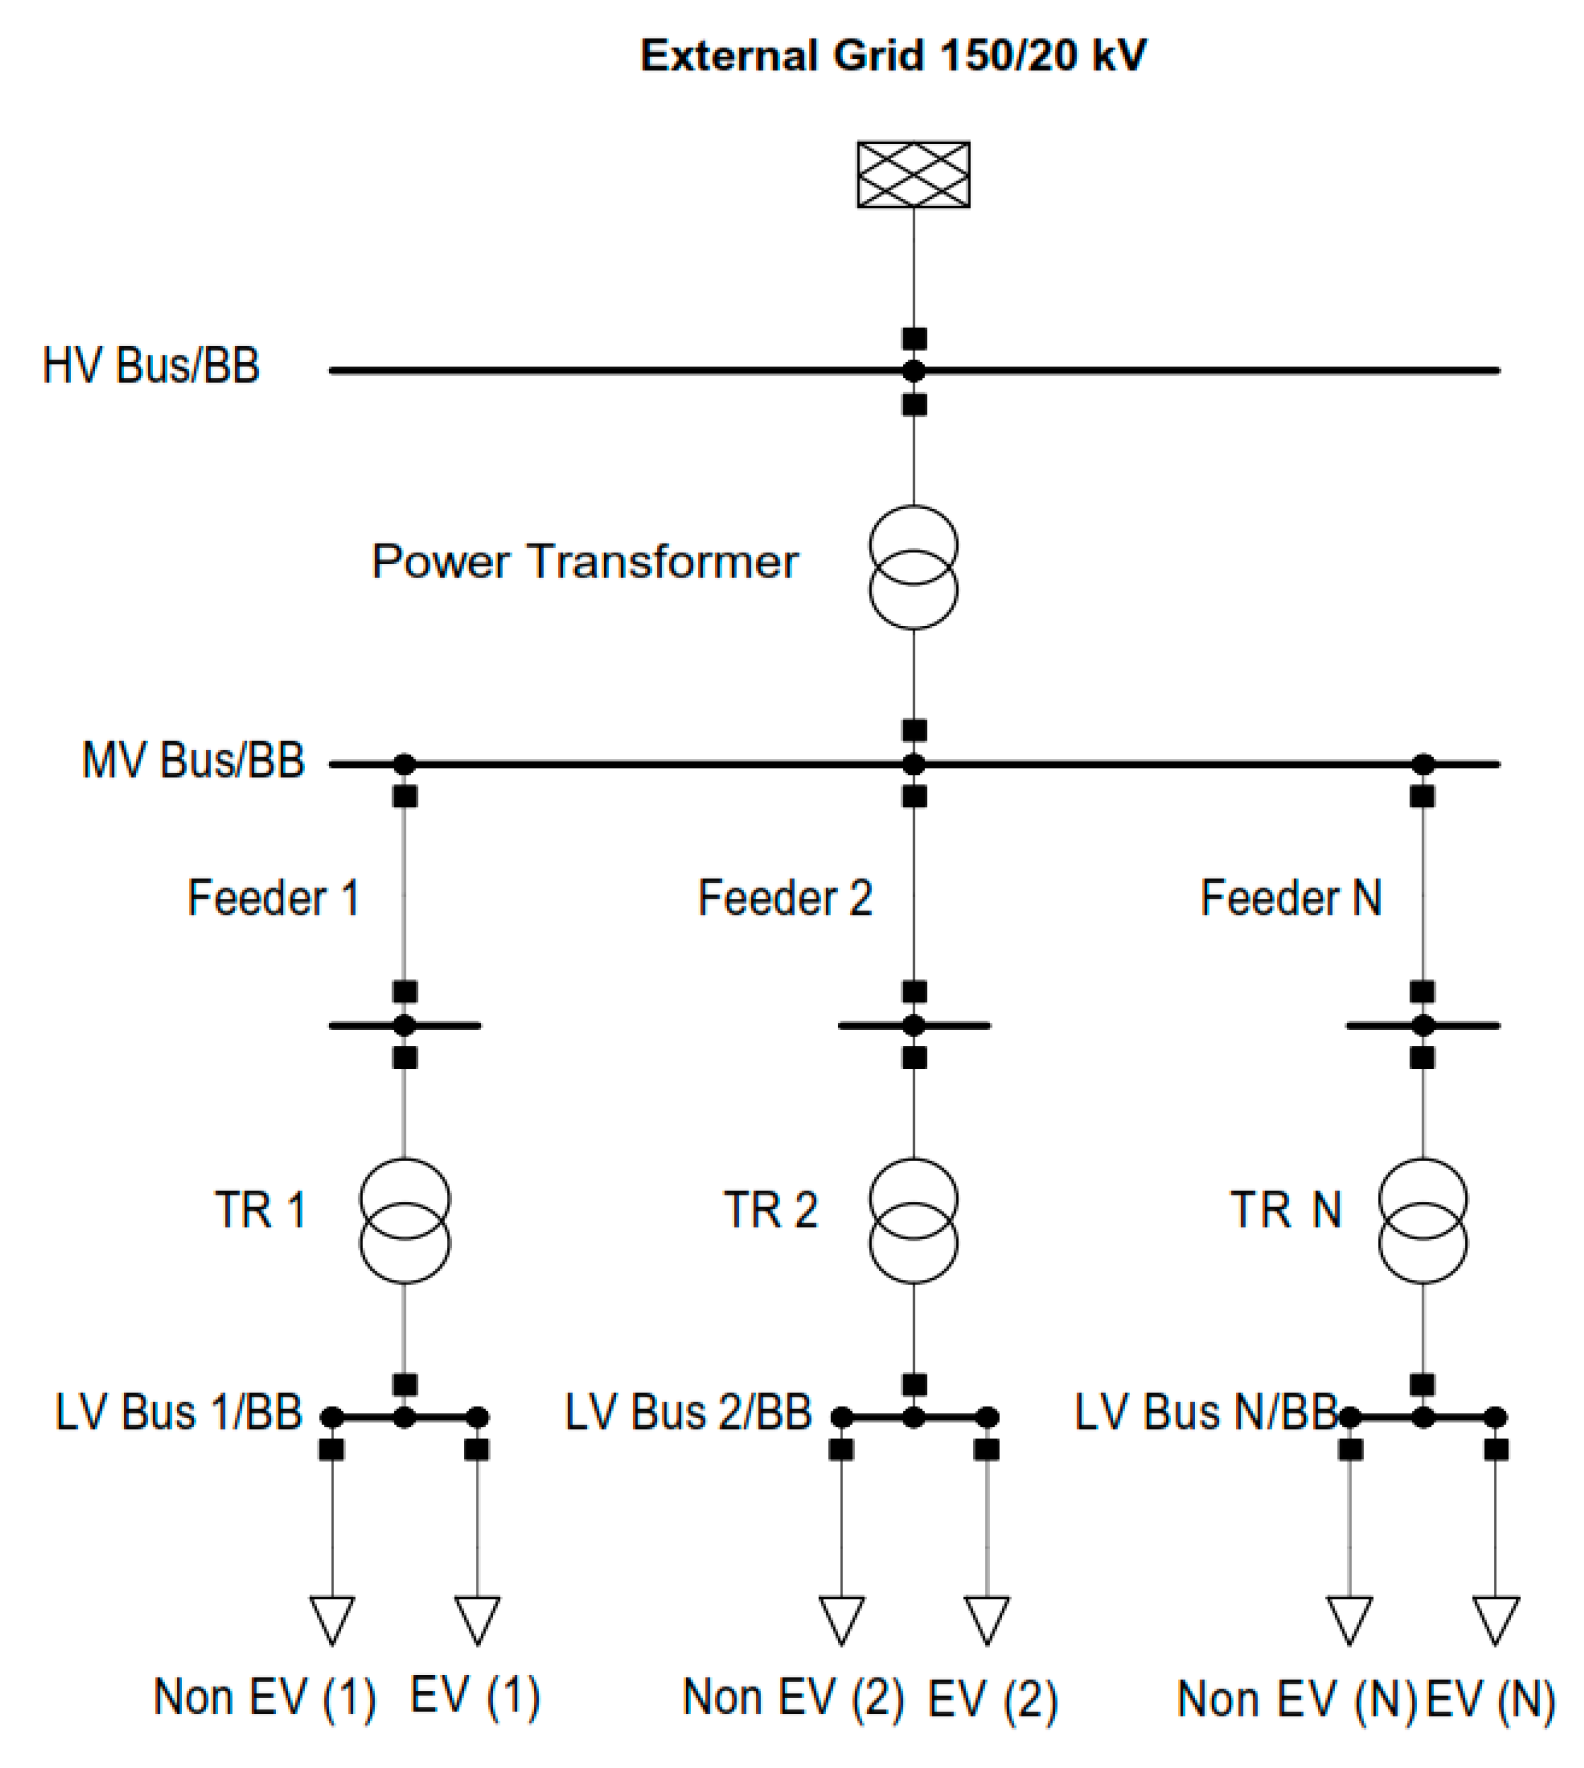
Distribution network modeling was undertaken using DIgSILENT software. For the modeling, non-EV (NEV) and EV load types were considered to give a total load. The load due to EV charging was calculated using (8) and by aggregating the total EV charging power per hour. The Monte Carlo simulation results were used to determine the EV plug-in time. The EV load was assumed to be deferable, within charging time limits. The distribution network was supplied by a 150-kV external grid connected to a 20-kV medium voltage network through a power transformer. The low-voltage network operates at 380 V, line. The low-voltage network and transformer losses were calculated using Digsilent software every hour. The length of the low-voltage network is 3910 m comprising eight lines serving customers that use overhead lines 3 × 70 + 50 mm (for neutral) made from aluminum. A system model is given in
Figure 7.
4.1. Uncontrolled Charging
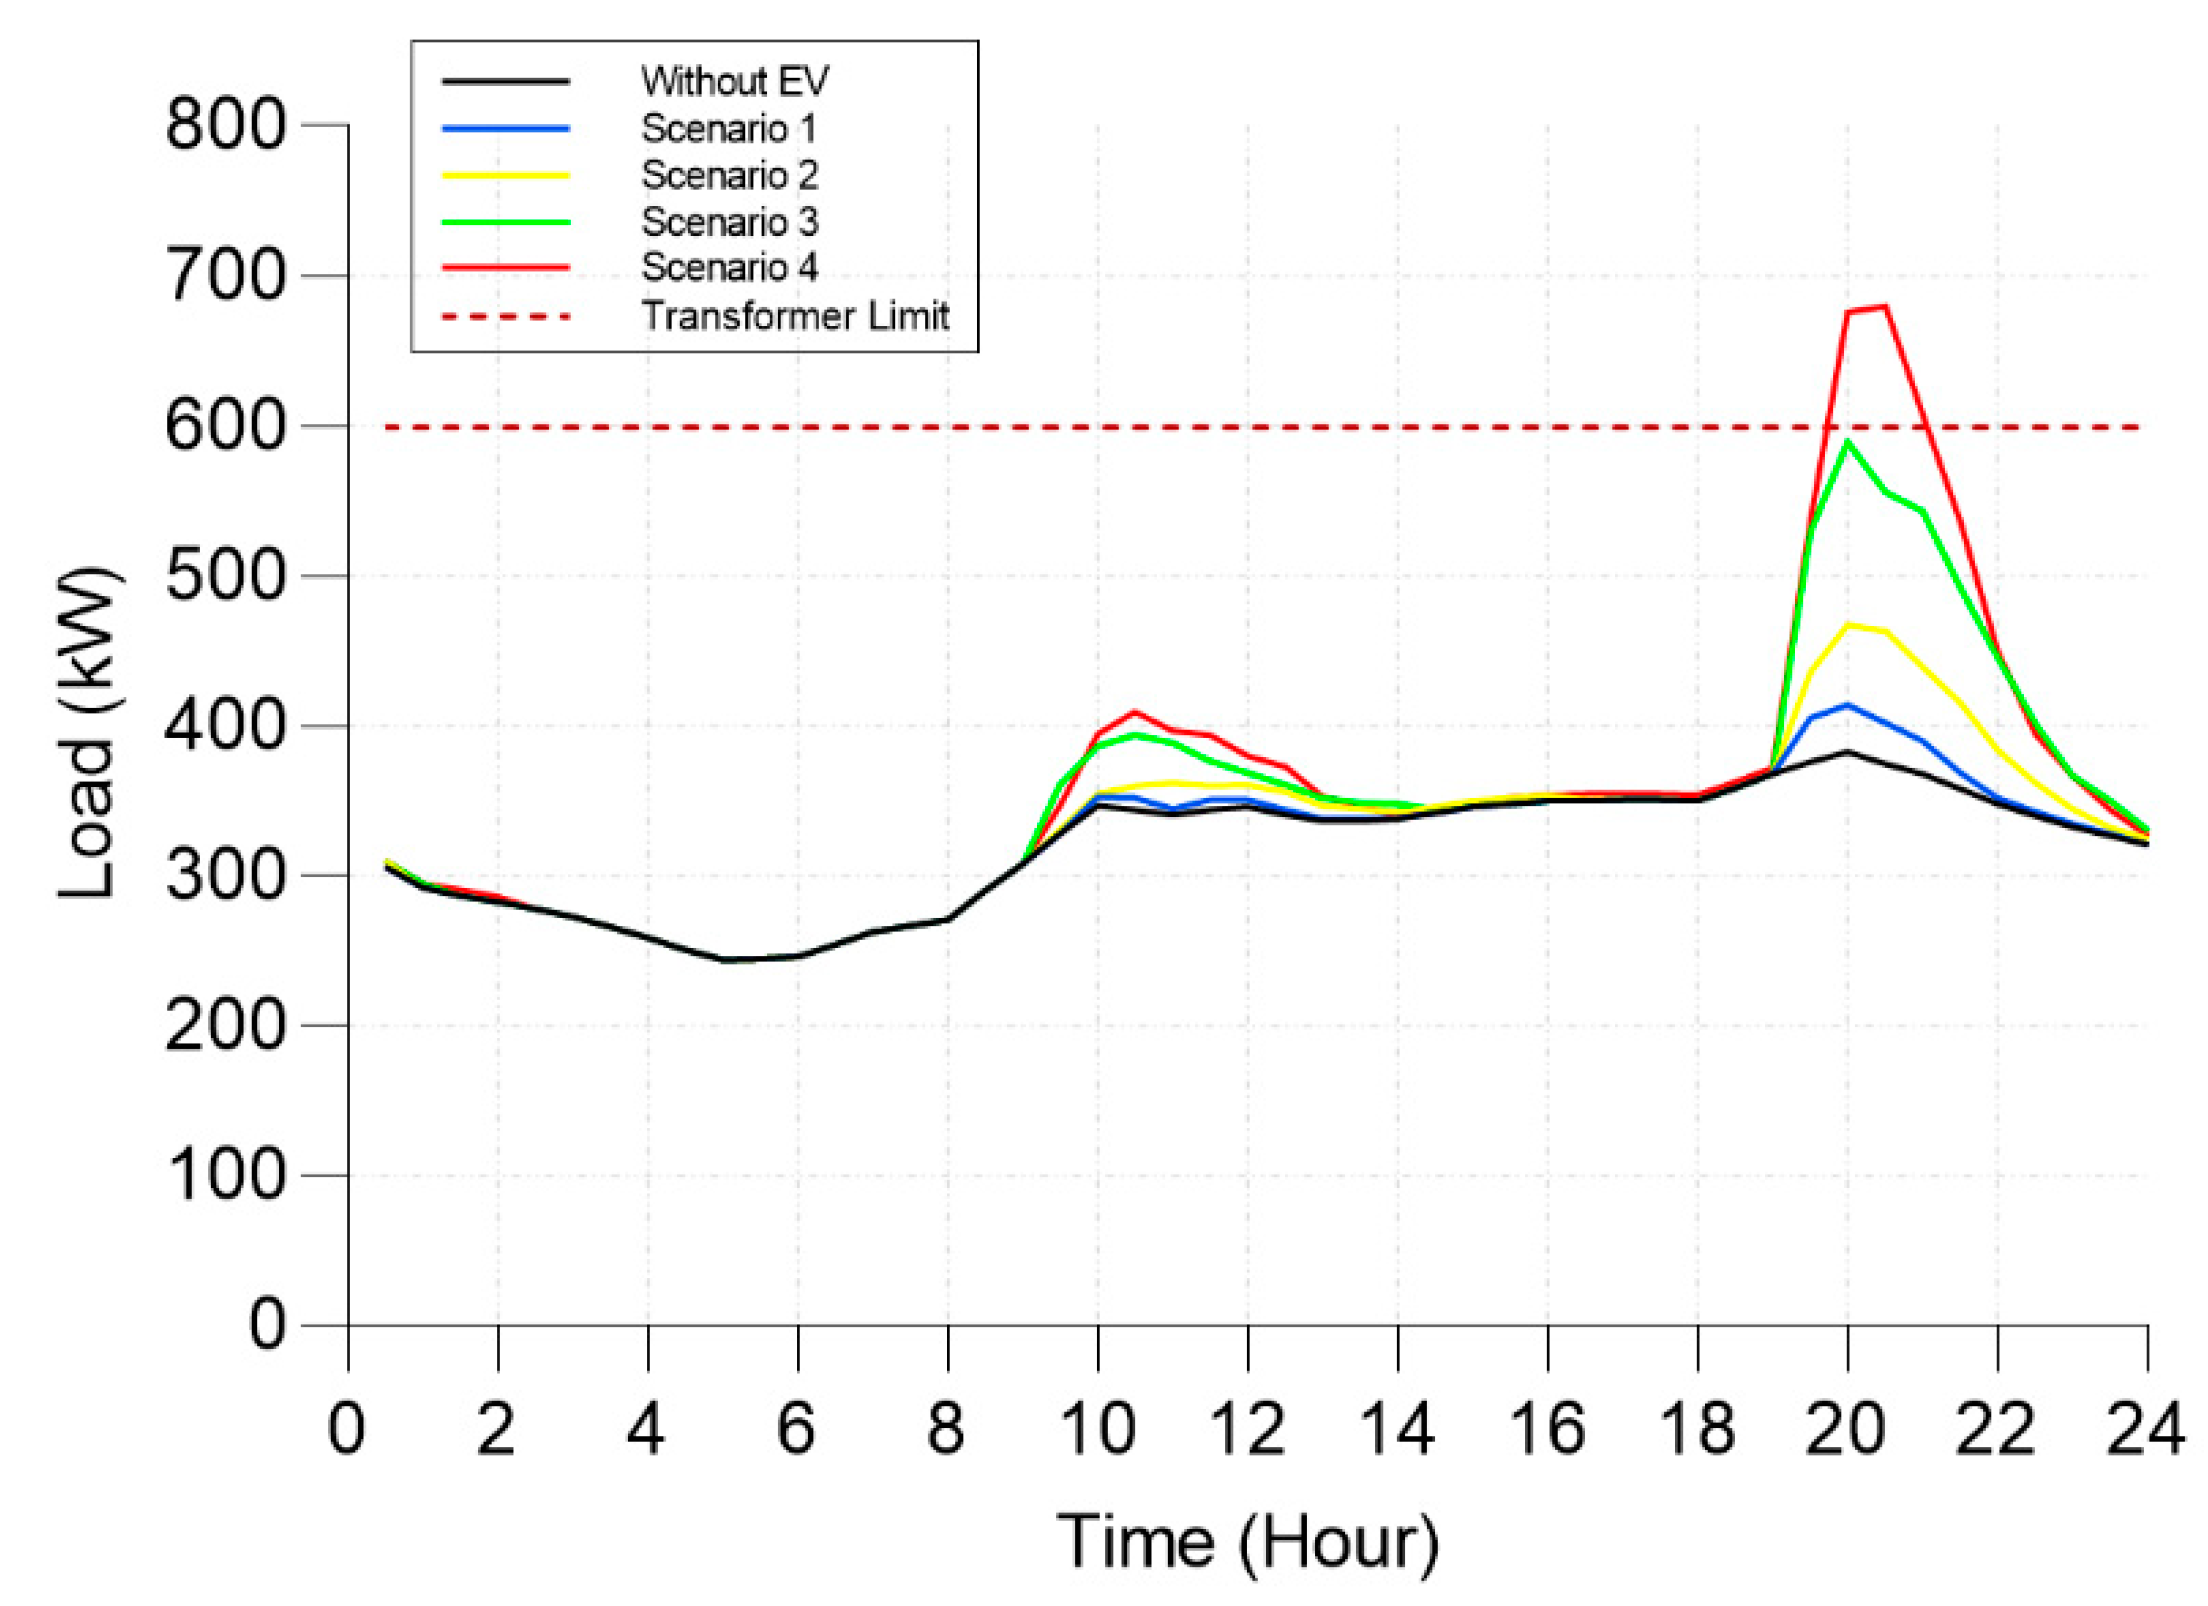
For the case of uncontrolled charging, every customer charges their EV at night at maximum power and immediately upon arriving at home. No control on EV charging is applied, as the average plug-in time will be 19:00 h and charging will last until early morning. In this simulation, the distribution transformer capacity is 630 kVA, with 450 ICPs. The simulation results can be seen in
Figure 8. For scenarios 1 and 2, the peak load that occurs at night is still below the load rating of the distribution transformer. However, for scenarios 3 and 4, the transformer load rating is exceeded with the peak load for scenario 4 at 680 kW. The load rating is not exceeded during the day.
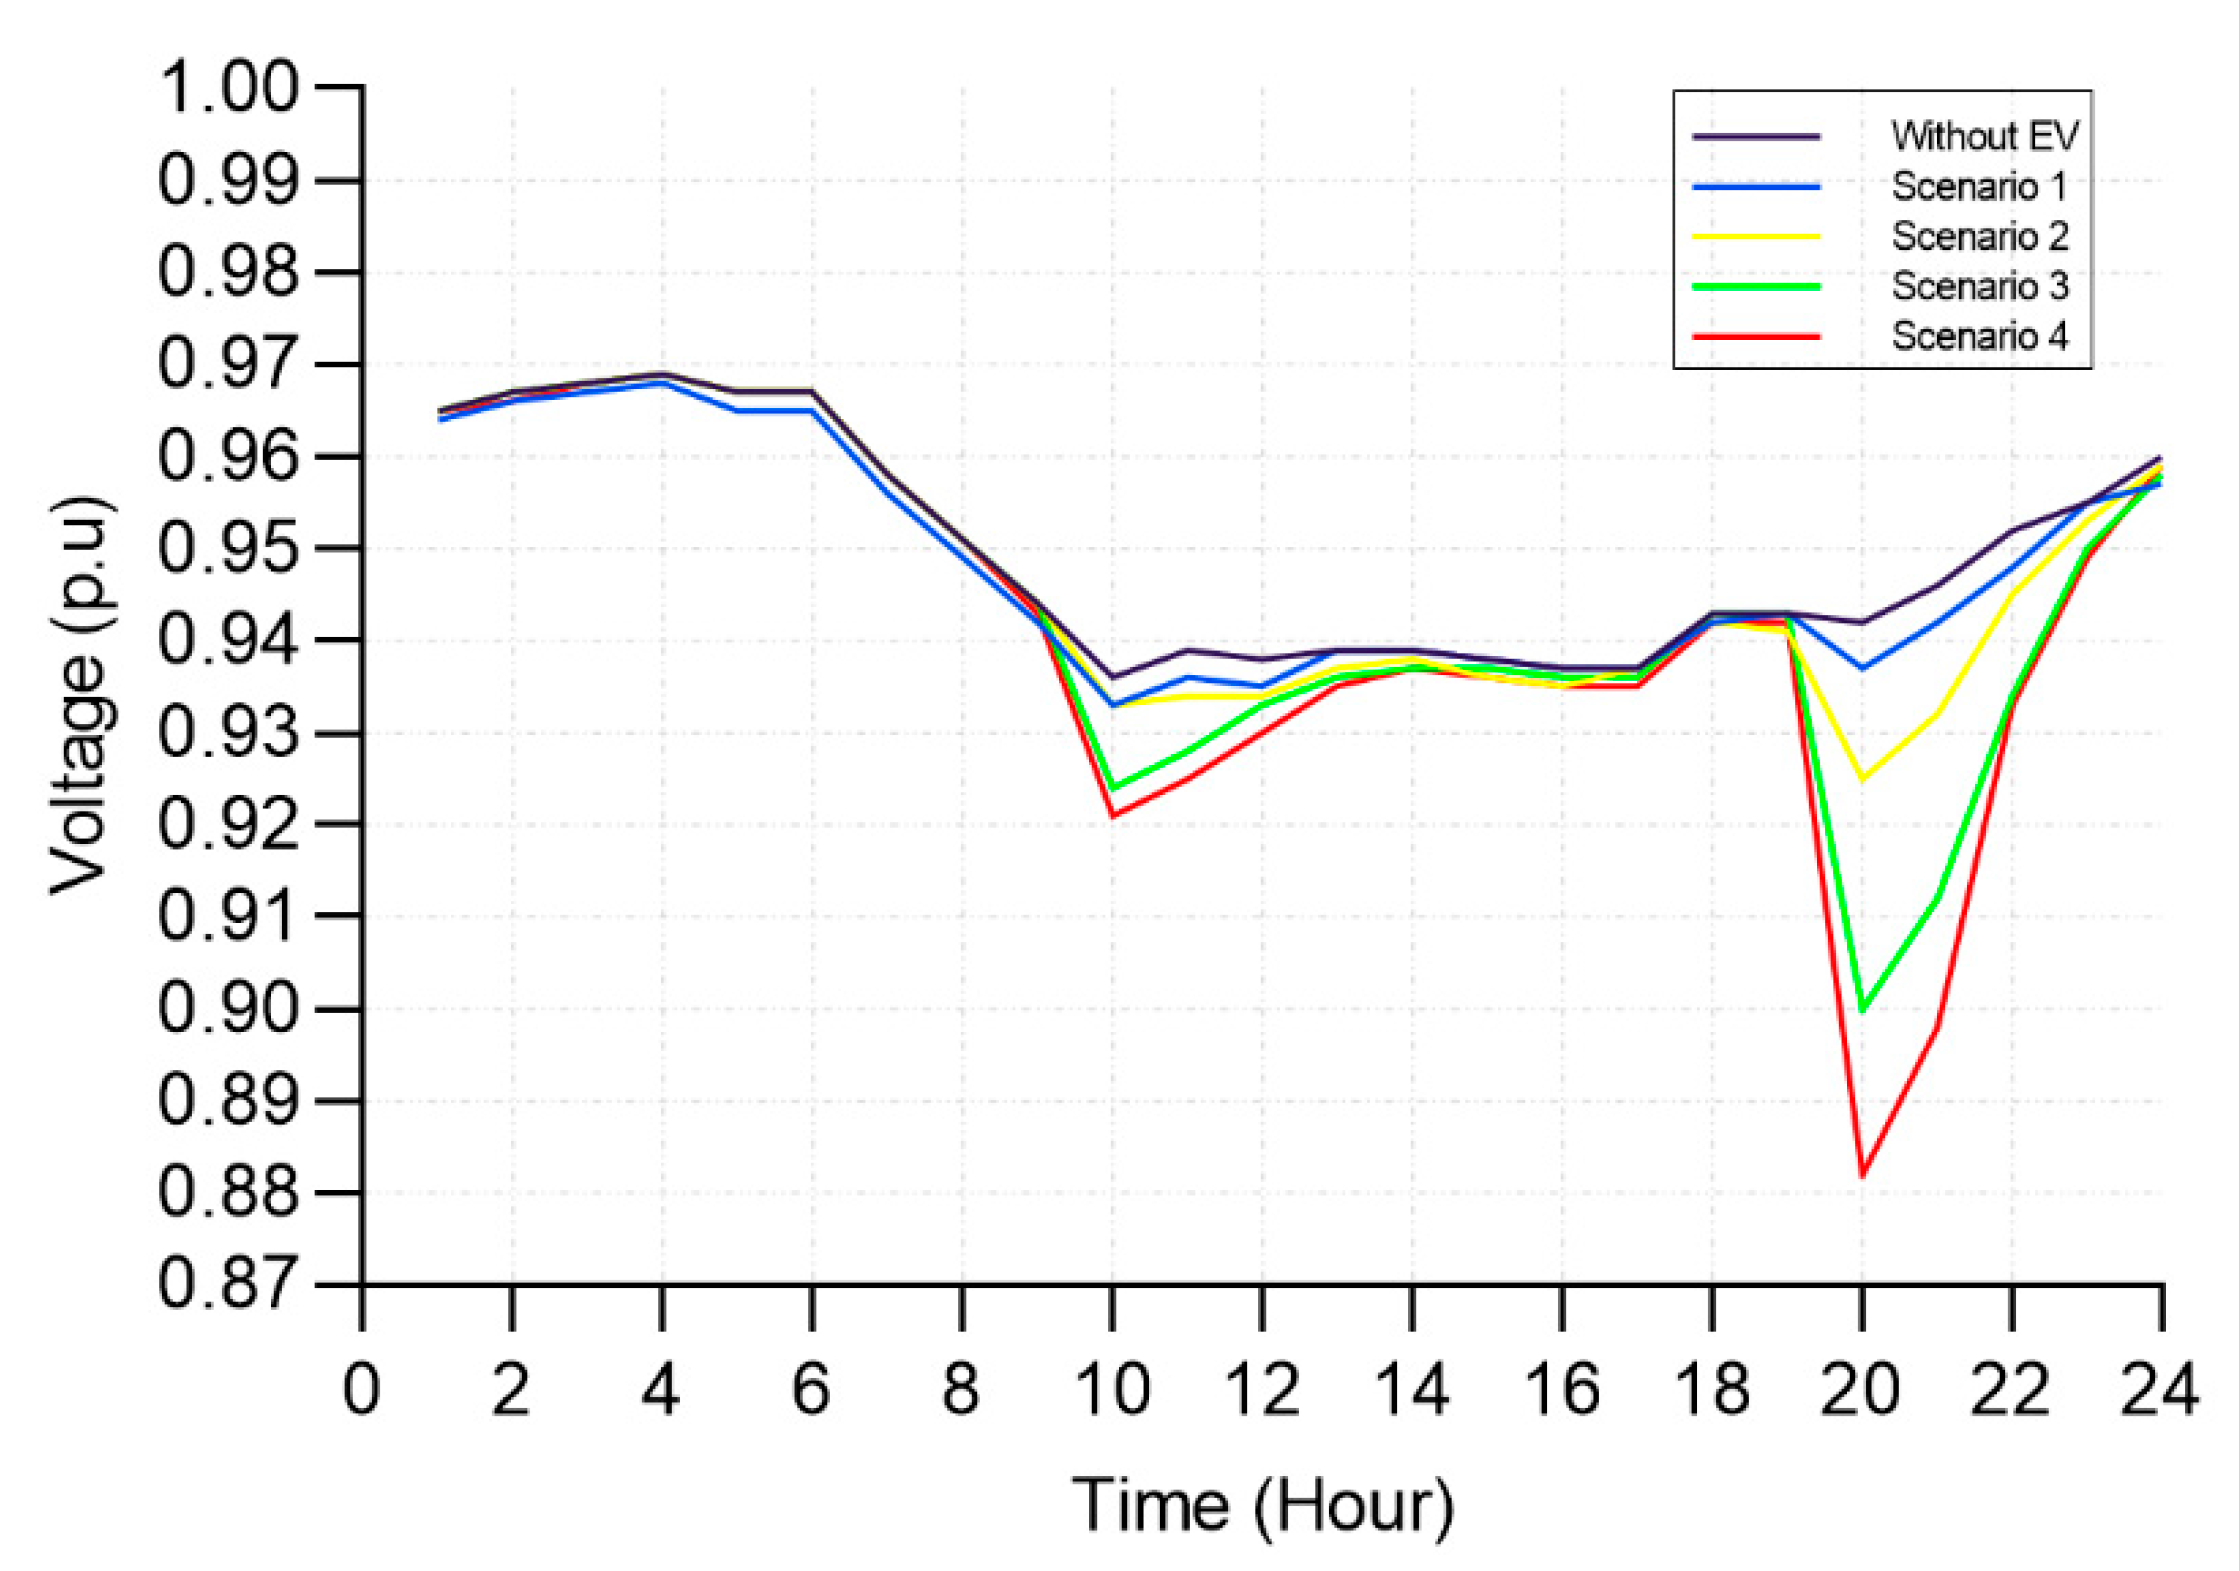
The voltage profile due to uncontrolled charging can be seen in
Figure 9. This voltage was measured at the end of the low-voltage network, giving worst-case conditions. From this graph, it can be seen that at the baseload without EVs, the voltage received by the consumer is 0.942 p.u at night. Due to the integration of EVs, the voltage received by the consumer gradually decreases. The greatest voltage drop occurs under scenario 4, falling to 0.882 p.u. This value exceeds the allowable voltage standard according to the Indonesian distribution grid code, +5 and −10% [
21].
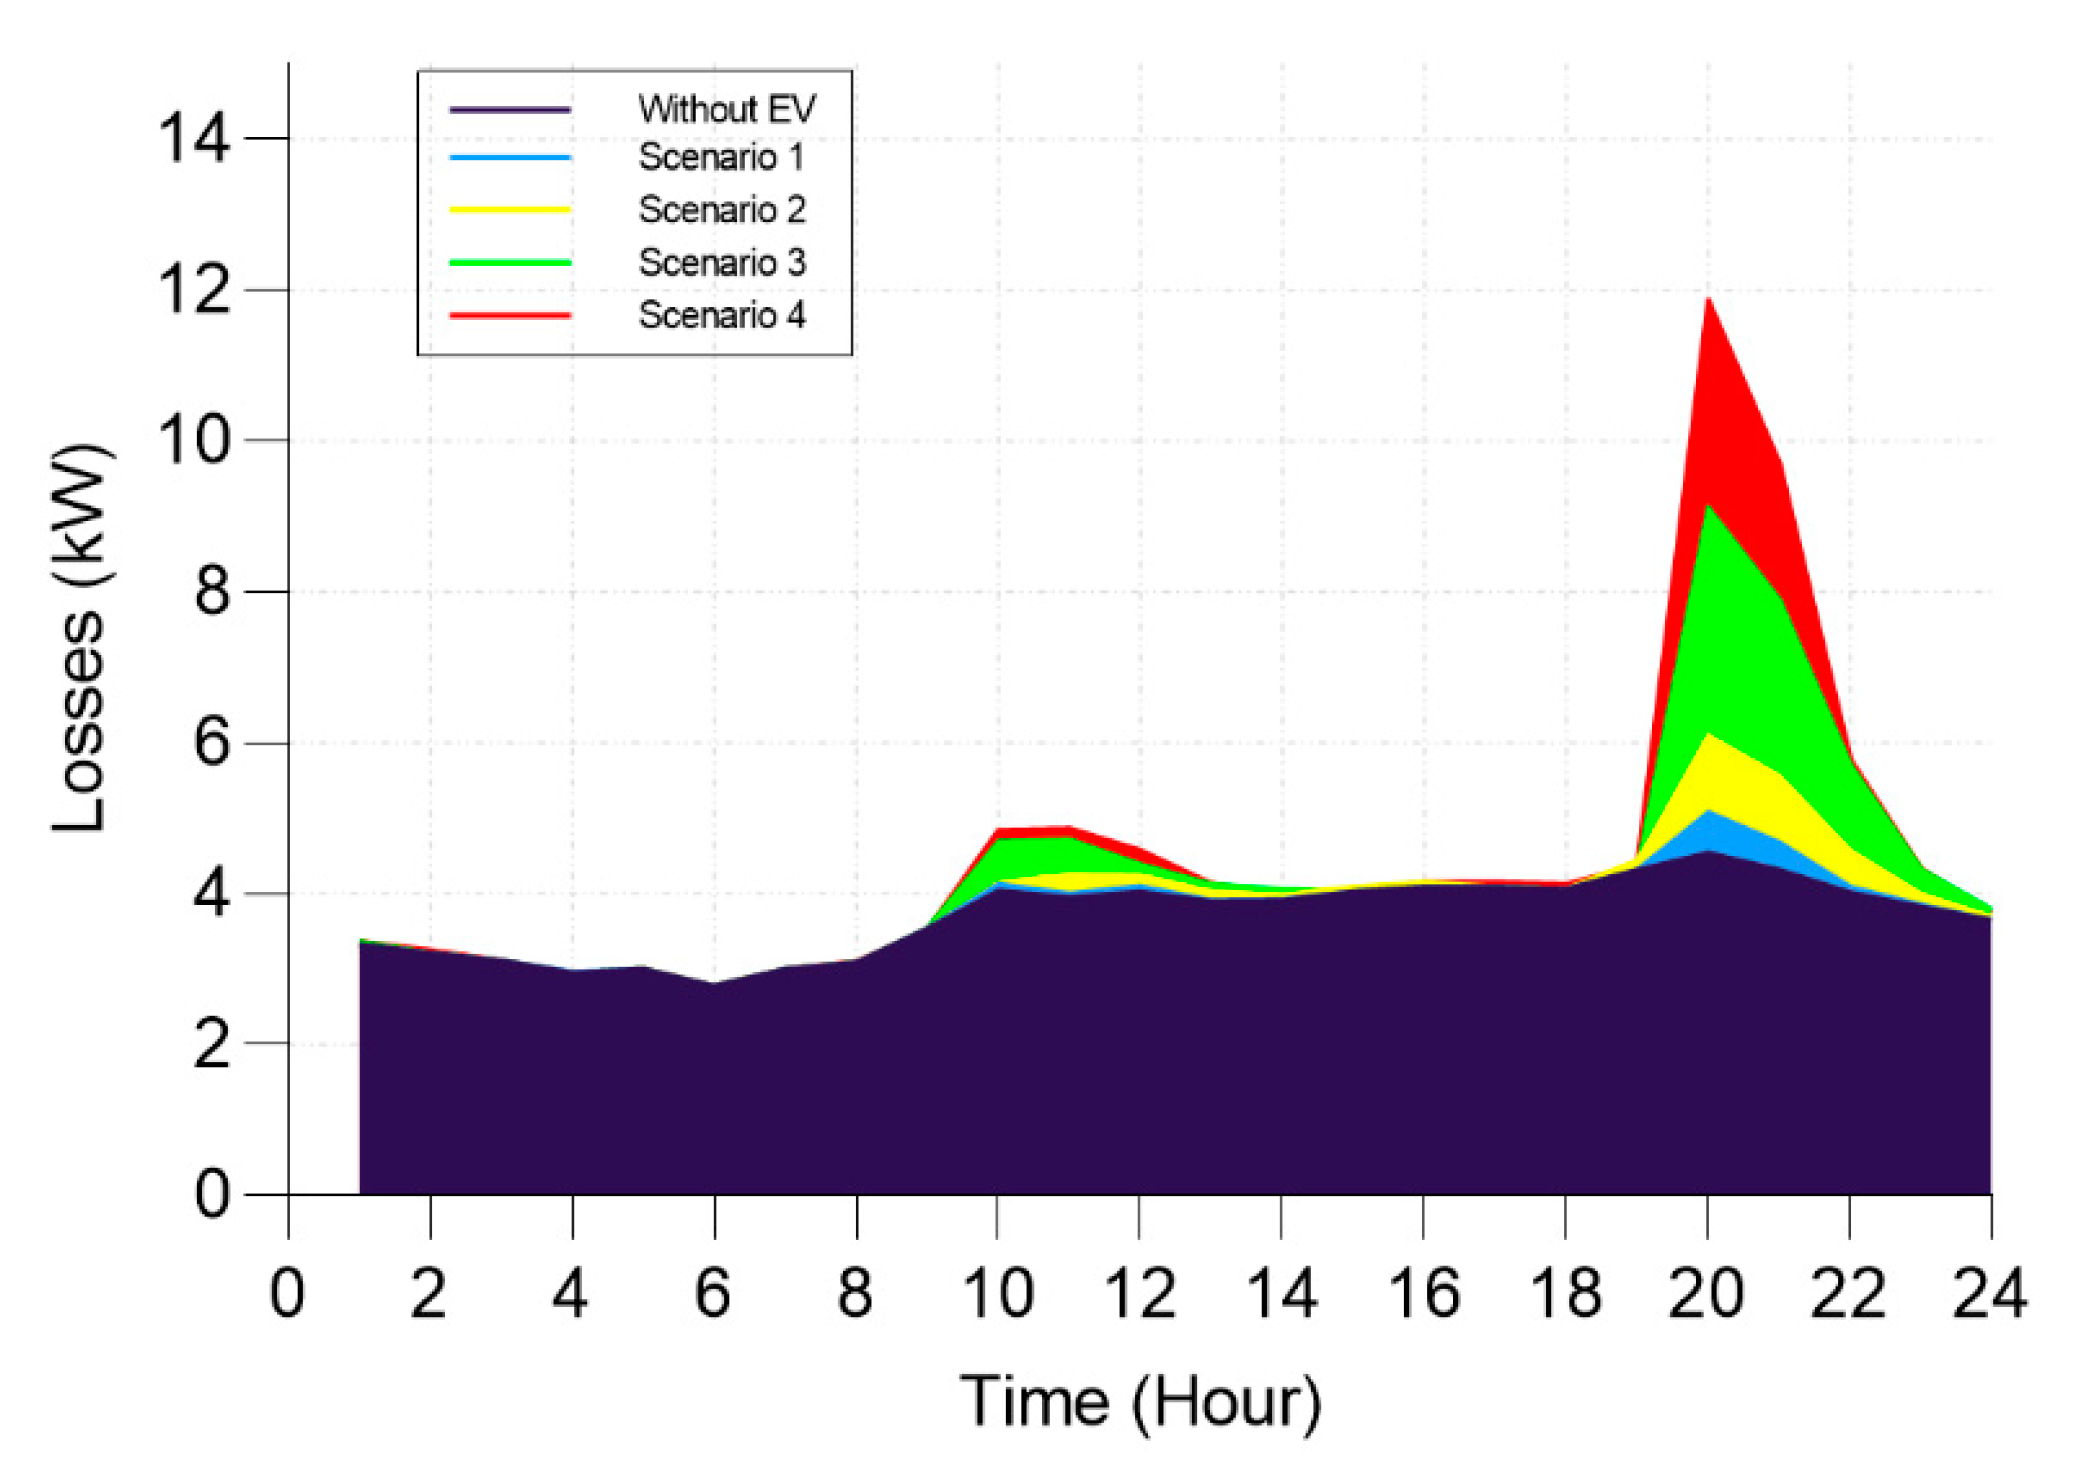
Figure 10 shows the power losses for the uncontrolled charging scenario with different EV penetration levels. Scenario 4 gives the highest low-voltage network losses compared to other scenarios. At peak time, network losses increase from 4.55 kW at the baseload without EVs to 11.86 kW in scenario 4.
4.2. Smart Charging
For the smart charging method proposed, EV charging is controlled using an FLC embedded in the EVSE. Every 15 min, the AMI measures the transformer loading levels in real time, which is sent to an FLC embedded in EVSE supplied from the transformer. The FLC processes the transformer and SOC load data from vehicles to obtain the amount of charging power for each EV. This data is updated every 15 min. This system suits the smart home concept, and allows EV owners to monitor and stop charging, if needed, or desired, remotely.
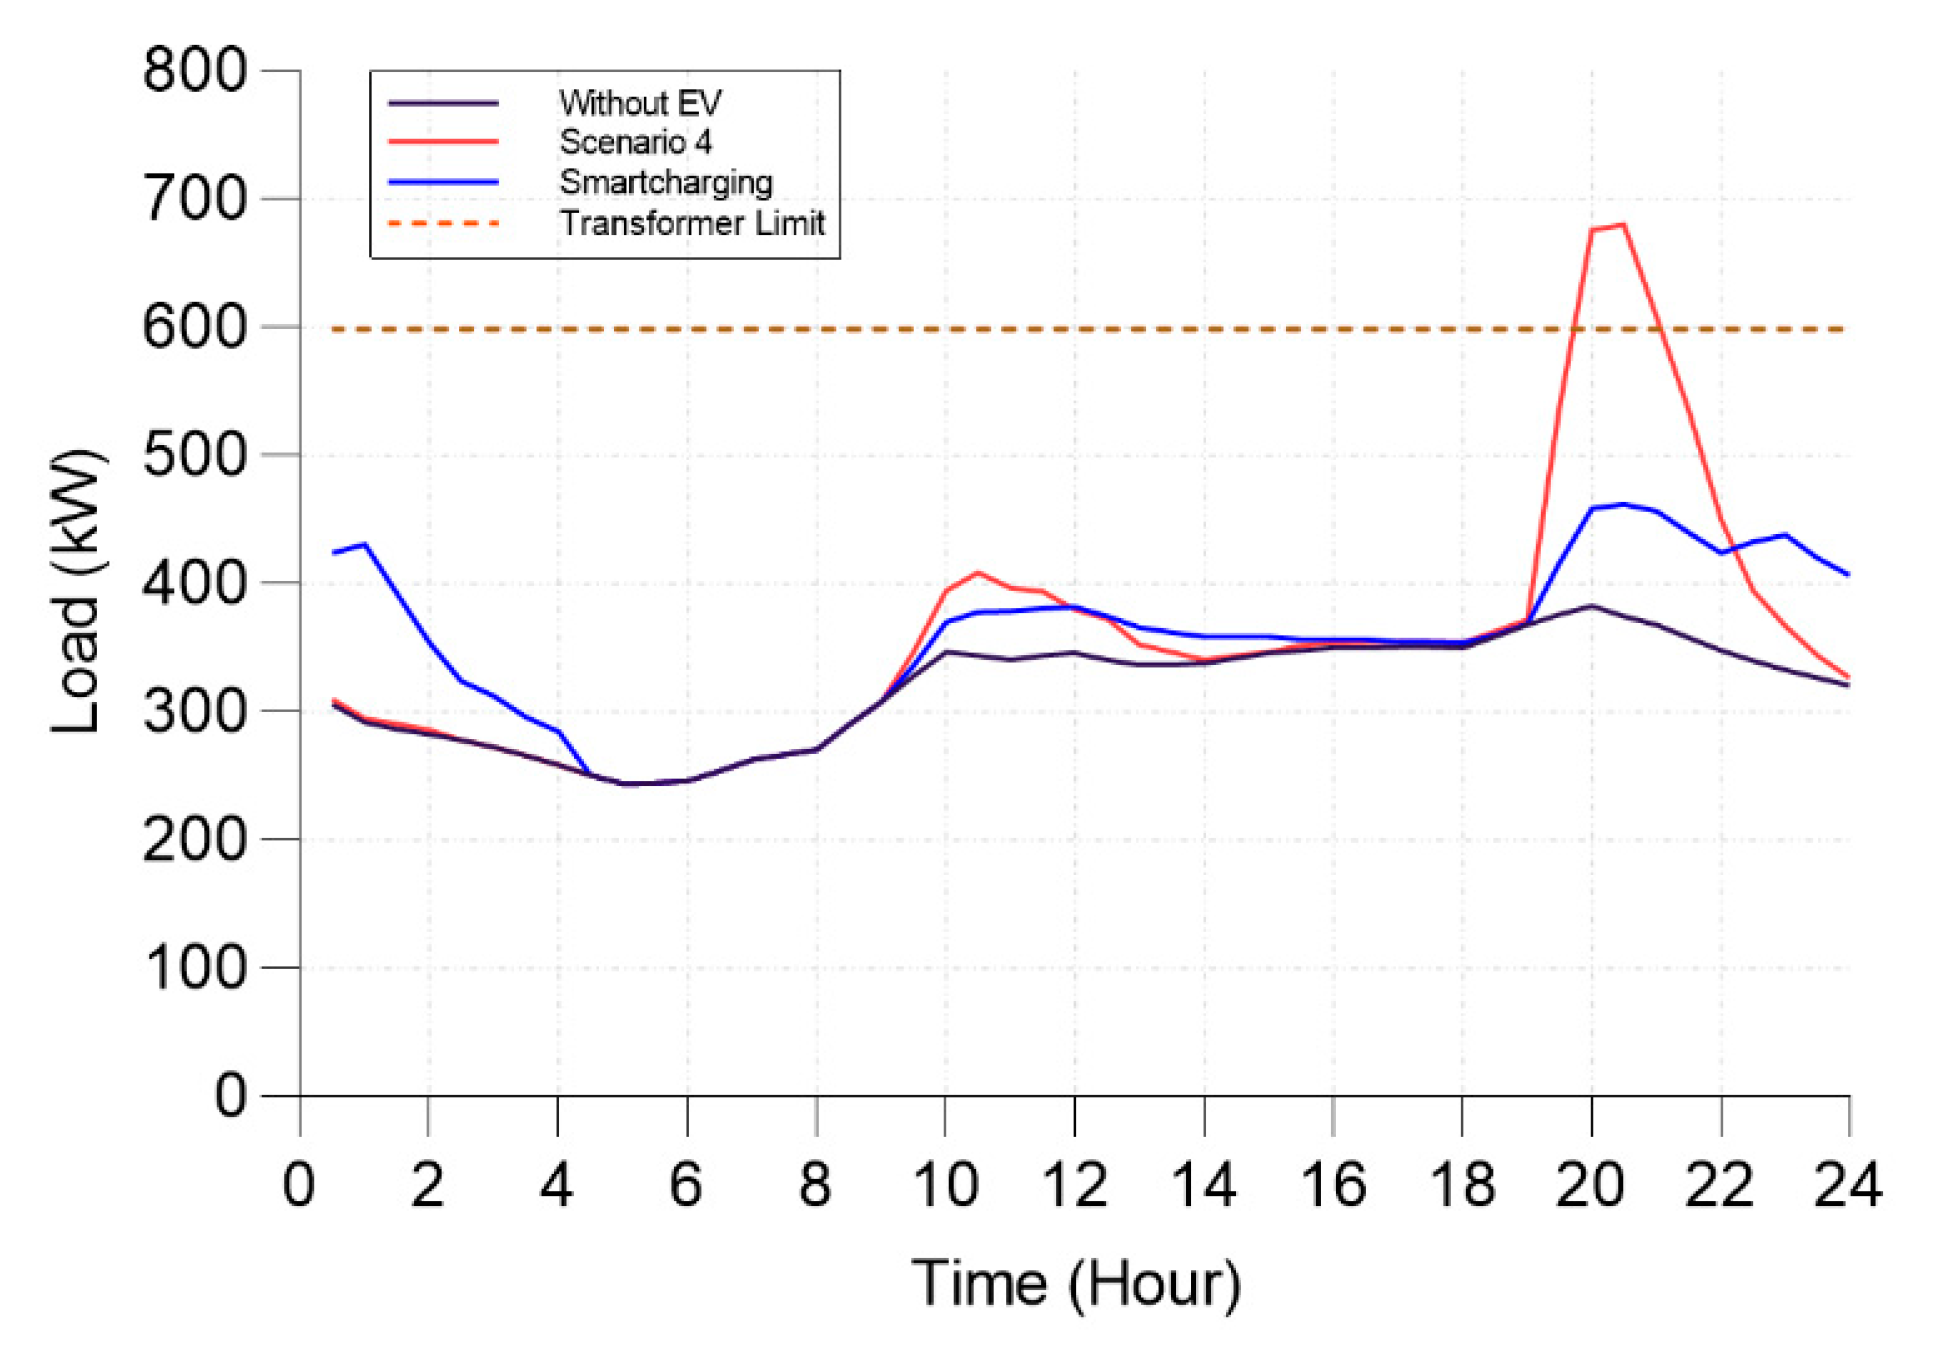
Simulation results are given in
Figure 11. Scenario 4 is used as a comparison to profiles without EVs and with EVs and smart charging. The peak load that occurs with smart charging is 459 kW, which is 221 kW lower than that with uncontrolled charging under scenario 4. The lower peak loading level is achieved because when the transformer load is high while the SOC is high and charging occurs when the electricity price is high, the FLC on the EVSE will provide medium-level charging power. Conversely, if the transformer load conditions are low while the SOC is also low and charging occurs when the electricity price is low, the EVSE will provide high-level charging power.
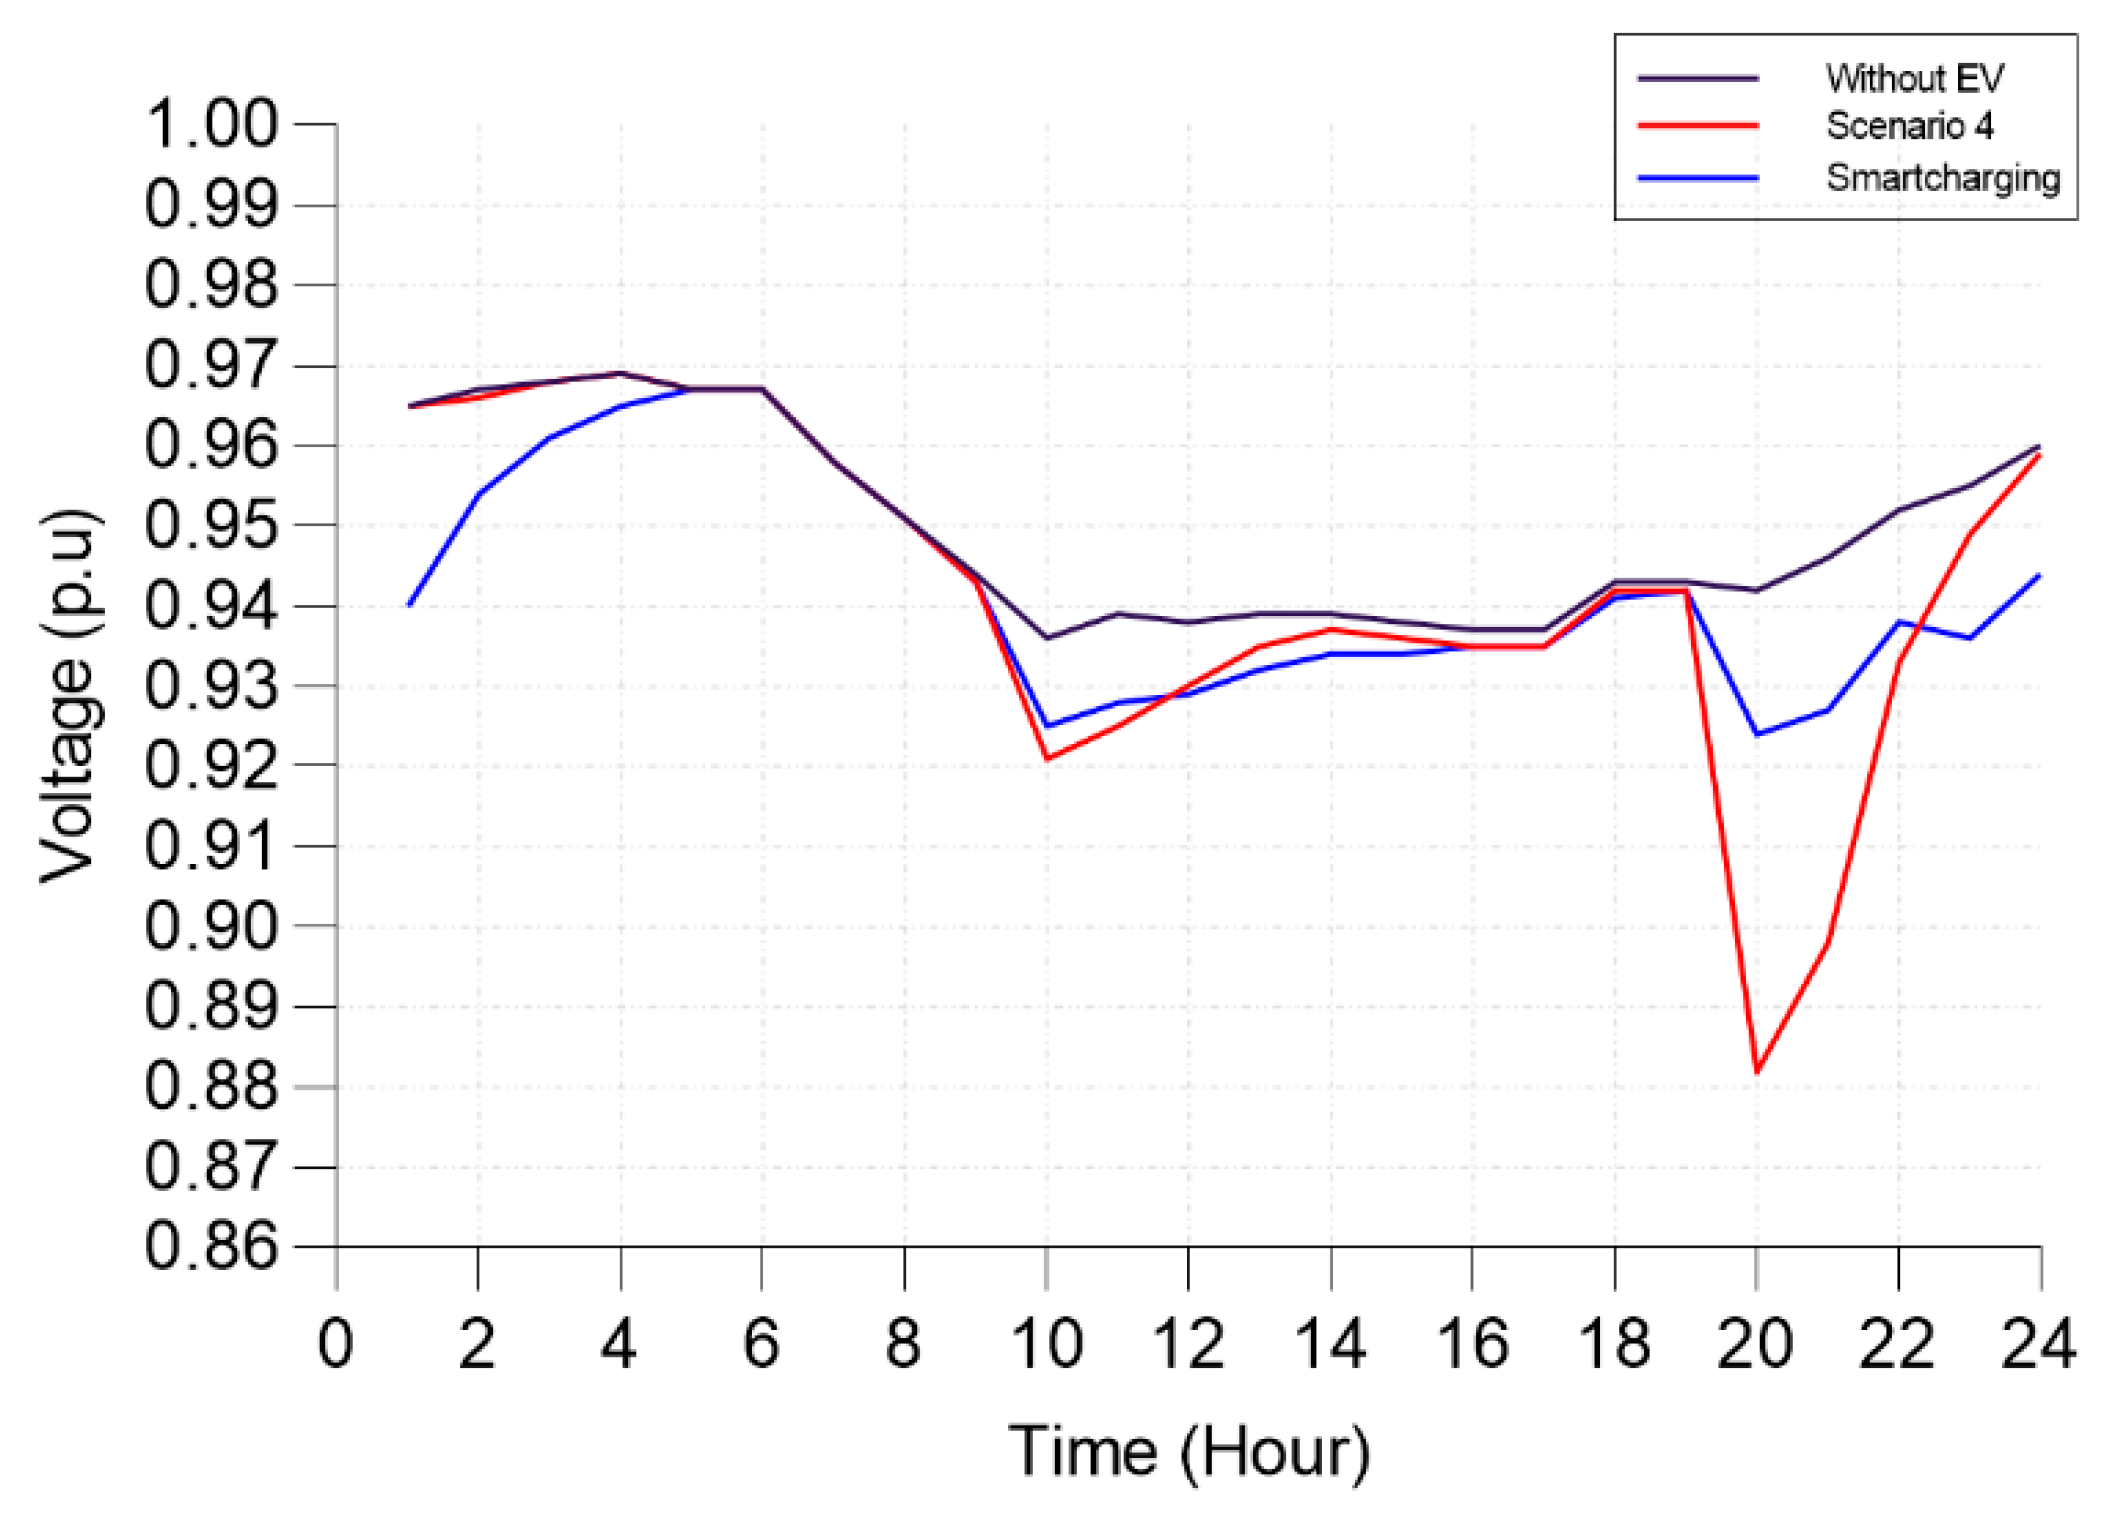
The voltage profile at the distribution transformer can be seen in
Figure 12. Uncontrolled charging for scenario 4 has the worst voltage profile when compared to the basic load without EV penetration. The smart charging method has a better voltage profile, with voltage ranging from 0.961 to 0.991 p.u. The smart charging can improve the voltage profile from 0.958 to 0.971 p.u at night for scenario 4. In this case, a voltage drop occurs during the day because the peak load on Setiabudi substation occurs during the day.
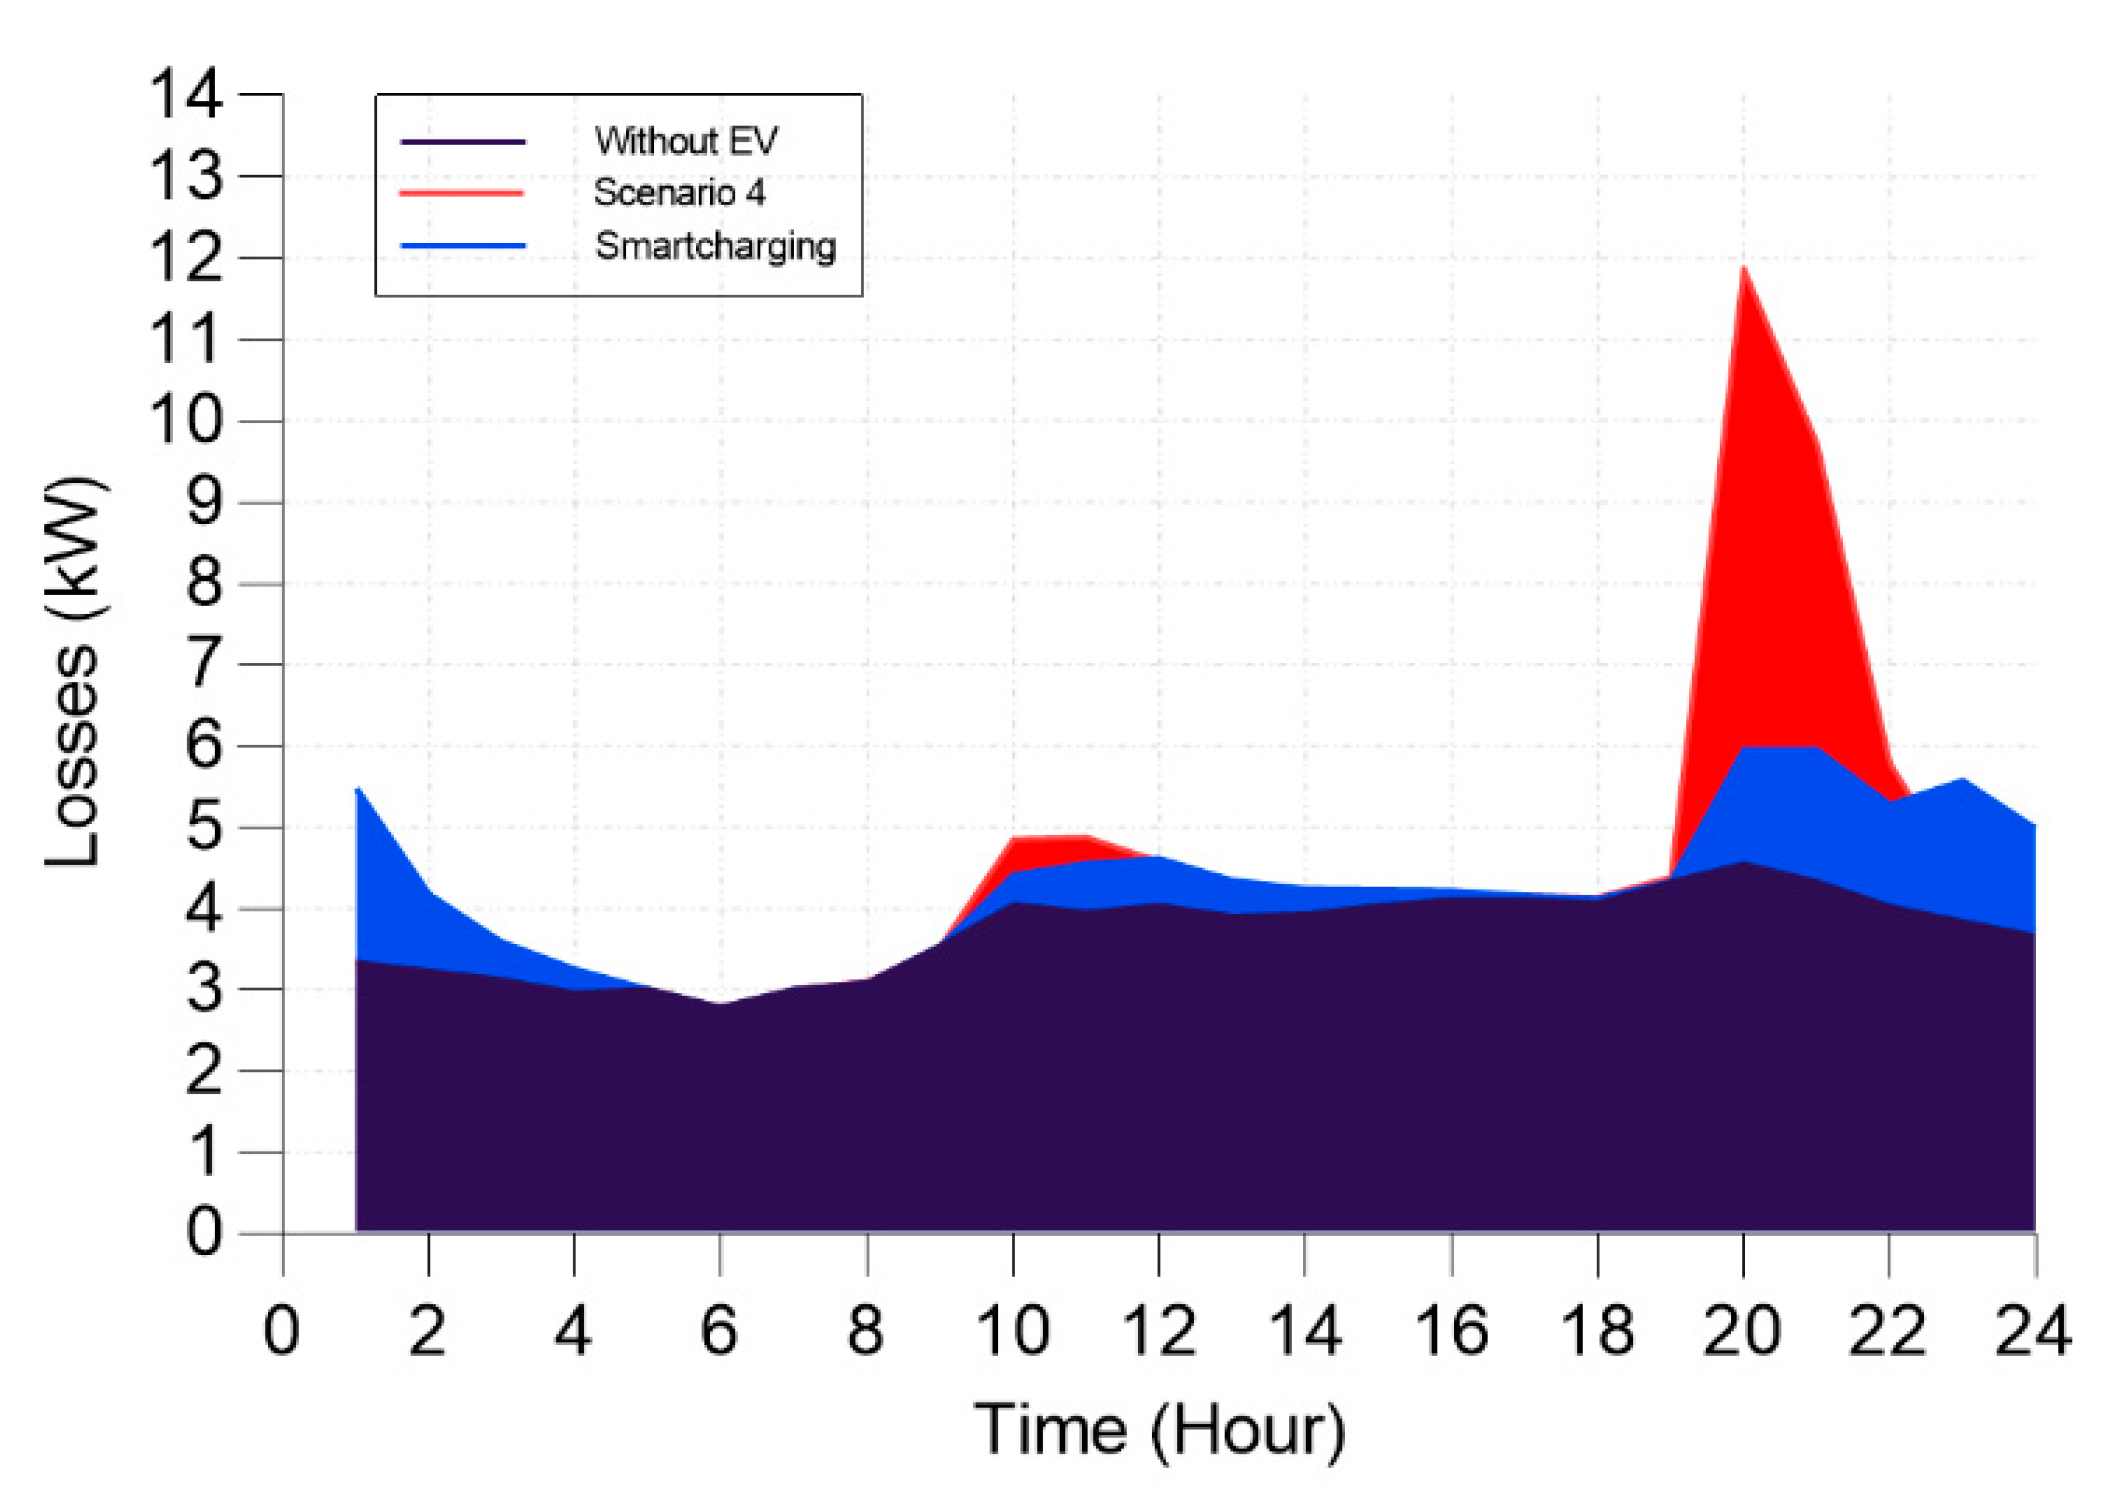
Figure 13 shows the loss profile with several charging methods. For uncontrolled charging, losses at peak loads at night reach 11.81 kW, while for the smart charging scenario, the losses drop to 5.91 kW. This decrease in loss is due to a decrease in the peak load and voltage improvement when using smart charging.
A comparison of the measurement results can be seen in
Table 6. Peak load, energy, voltage, and losses are compared between scenarios without EV penetration, and under scenario 4 with uncoordinated charging and smart charging. From this table, it can be seen that smart charging with FLC provides the best results.
5. Conclusions
In this paper, smart EV charge scheduling using an FLC approach was demonstrated to overcome low distribution network voltage and high distribution transformer loading issues under high EV penetration level scenarios. The four scenarios investigated were realistic, as specific attention was given to matters relevant to the area under study, including government policies and the types of EVs likely to be used. The investigations were undertaken on a distribution network in Jakarta. The results showed that the voltage stability and distribution transformer loading levels can be maintained within grid code and utility limits, respectively, even under the worst-case scenario considered, if the proposed approach is adopted. By contrast, stability and operation within the loading limits was not achieved with uncoordinated charging. Future work will consider integrating the proposed approach within a larger charge scheduling approach that also incorporates transmission system operation considerations.
Author Contributions
Conceptualization, T.K., U.K.M., and C.A.B.; methodology, T.K., U.K.M., C.A.B., S., and N.H.; software, T.K., and Y.A.; validation, T.K.; formal analysis, T.K., C.A.B.; investigation, T.K., C.A.B., and Y.A.; writing—original draft preparation, T.K.; Writing—review and editing, C.A.B.; Supervision, U.K.M., C.A.B., S., and N.H.; All authors have read and agreed to the published version of the manuscript.
Funding
External funding was provided by PT.PLN (Persero).
Conflicts of Interest
The authors declare no conflict of interest.
References
- Indonesian Government. Peraturan Presiden Republik Indonesia No 55 Tahun 2019; Ministry of State Secretariat: Jakarta, Indonesia, 2019. [Google Scholar]
- Bunn, M.; Das, B.P.; Seet, B.C.; Baguley, C. Empirical Design Method for Distribution Transformer Utilization Optimization. IEEE Trans. Power Deliv. 2019, 34, 1803–1813. [Google Scholar] [CrossRef]
- Alonso, M.; Amaris, H.; Germain, J.G.; Galan, J.M. Optimal Charging Scheduling of Electric Vehicles in Smart Grids by Heuristic Algorithms. Energies 2014, 7, 2449–2475. [Google Scholar] [CrossRef]
- Morsy Nour, C.F.; Said, S.M.; Ali, A. Smart Charging of Electric Vehicles According to Electricity Price. In Proceedings of the 2019 International Conference on Innovative Trends in Computer Engineering (ITCE’2019), Aswan, Egypt, 2–4 February 2019; pp. 432–437. [Google Scholar] [CrossRef]
- Dubey, A.; Member, S.; Santoso, S. Electric Vehicle Charging on Residential Distribution Systems: Impacts and Mitigations. IEEE Access 2015, 3, 1871–1893. [Google Scholar] [CrossRef]
- Faddel, S.; Mohamed, A.A.S.; Mohammed, O.A. Fuzzy logic-based autonomous controller for electric vehicles charging under different conditions in residential distribution systems. Electr. Power Syst. Res. 2017, 148, 48–58. [Google Scholar] [CrossRef] [Green Version]
- Mattlet, B.; Maun, J.C. Optimal bilevel scheduling of electric vehicles in distribution system using dynamic pricing. In Proceedings of the 2016 IEEE Power and Energy Society General Meeting (PESGM), Boston, MA, USA, 17–21 July 2016; pp. 6–9. [Google Scholar] [CrossRef]
- Soleimani, M.; Kezunovic, M. Mitigating Transformer Loss of Life and Reducing the Hazard of Failure by the Smart EV Charging. IEEE Trans. Ind. Appl. 2020, 9994, 1. [Google Scholar] [CrossRef]
- Ku, T.T.; Chen, C.S.; Lin, C.H.; Hsu, C.T.; Chuang, H.J. Transformer management system for energy control of customer demand response and pv systems. IEEE Trans. Ind. Appl. 2019, 55, 51–59. [Google Scholar] [CrossRef]
- Singh, M.; Kumar, P.; Kar, I. Implementation of Vehicle to Grid Infrastructure Using Fuzzy Logic Controller. IEEE Trans. Smart Grid 2012, 3, 565–577. [Google Scholar] [CrossRef]
- Statistics Indonesia. Land Transportation Statistiscs 2018; Statistics Indonesia: Central Jakarta, Indonesia, 2018. [Google Scholar]
- Nissan. Nissan LEAF—Electric Car of New-Generation|Nissan New Zealand. Available online: https://www.nissan.co.nz (accessed on 10 April 2020).
- Gesit. GESITS. Available online: https://www.gesits.co.id/ (accessed on 10 April 2020).
- Indonesian Ministry of Energy and Mineral Resource. Indonesia 2050 Pathway Calculator; Indonesian Ministry of Energy and Mineral Resource: Jakarta, Indonesia, 2015. [Google Scholar]
- Tehrani, N.H.; Wang, P. Probabilistic estimation of plug-in electric vehicles charging load profile. Electr. Power Syst. Res. 2015, 124, 133–143. [Google Scholar] [CrossRef]
- Wu, J.; Liang, J.; Ruan, J.; Zhang, N.; Walker, P.D. Efficiency comparison of electric vehicles powertrains with dual motor and single motor input R. Mech. Mach. Theory 2018, 128, 569–585. [Google Scholar] [CrossRef]
- New Zealand Centre for Advanced Engineering. Electric Vehicles Impacts on New Zealand’s Electricity System. December 2010. Available online: https://ir.canterbury.ac.nz/handle/10092/11575 (accessed on 1 July 2020).
- Indonesian Government. Peraturan Pemerintah Republik Indonesia Nomor 22 Tahun 2017 about National Energy Plan; Ministry of State Secretariat: Jakarta, Indonesia, 2017.
- Tempo. 2025, Pemerintah Targetkan Impor 400 Ribu Mobil Listrik. 2017. Available online: www.tempo.co.id (accessed on 1 July 2020).
- Economic Research Institute for ASEAN and East Asia. An Analysis of Alternative Vehicles Potential and Implications for Energy Supply Industries in Indonesia. 2018. Available online: https://www.eria.org/research/an-analysis-of-alternative-vehicles-potential-and-implications-for-energy-supply-industries-in-indonesia/ (accessed on 1 July 2020).
- Indonesian Government. Peraturan Menteri Energi dan Sumber Daya Mineral Nomor 04 tahun 2009 Tentang Aturan Distribusi Tenaga Listrik; Indonesian Ministry of Energy and Mineral Resource: Jakarta, Indonesia, 2009. [Google Scholar]
© 2020 by the authors. Licensee MDPI, Basel, Switzerland. This article is an open access article distributed under the terms and conditions of the Creative Commons Attribution (CC BY) license (http://creativecommons.org/licenses/by/4.0/).

 ,
, 


