1. Introduction
With the apparition of new trends in electricity production and consumption, the development of optimal energy management strategies is an emerging field of research. These strategies, which must accomplish the new regulatory policies, might be evaluated by means of different metrics like self-consumption or self-efficiency, reporting the share of energy that is directly consumed in a building’s grid-connected photovoltaic (PV) system [
1]. A review of the different PV self-consumption criteria in residential buildings is presented in [
1], where energy storage and load management arise as the main strategies to increase the self-consumed energy.
With the development of smart grids and the establishment of an advanced communications infrastructure, users can have the opportunity to manage the electrical energy consumed, with the aim of reducing costs in energy consumption [
2]. Electric companies in different countries are adopting different prices for the value of electric energy at different times, with the aim that users can have their own energy resources [
3], which generates and: (a) reduces the cost of energy consumption, and (b) decreases load peaks [
4]. Electric power prices are usually high during peak hours, especially early in the evening, when most users turn on the lights and their appliances. On the other hand, in off-peak hours (lower demand, especially in the early morning hours), energy prices are the lowest of the day.
Different types of components, such as hardware, algorithms, software, communications, sensors, and so on, are requirements to collaborate with each other, in order to provide different services in a smart building. Since electric energy cannot be charged in large quantities, the prices of such energy in the energy market, due to competition between generators, for example, usually fluctuate between days and between hours of low demand and hours of high consumption. Thus, it is widely studied in energy management in smart buildings, with the aim of (1) adapting the prices of the kilowatt hour to a lower price established at different times of the day, so that the end user decreases the value of the electric bill, which (2) allows the end user to manage their resources and loads. Consequently, the peak of electricity demand in the hours of high consumption in electricity grids is also reduced. As an additional aspect, with an increase in the use of electric vehicles, building energy management systems (BEMS) becomes crucial, in relation to the response to demand, helping to control and reduce peaks in demand, which have major problems in electrical grids, such as overloading on distribution transformers. Thus, it is necessary to develop a methodology for the proper performance of energy management in smart buildings.
This work presents an alternative approach to that we developed in [
5], which illustrated the control strategy aimed at efficient management of micro-grids, by using a rule-based controller in charge of managing the power flows between the different elements that compose a micro-grid, including an electric vehicle. The aim of this work was to develop a model for building energy management strategies involving a PV system with energy storage, and a plug-in fully electric vehicle. The proposed model in this work replaced the rule-based controller presented in [
5], which manages the power flows. A controller based on a mathematical algorithm was at the core of each strategy, which directly acted on a relay board managing the interconnection between the different elements that compose a micro-grid. The selected testbed focused on a single laboratory, although the proposed methodology was applicable to the entire building. The rest of the paper is structured as follows,
Section 2 deals with the state of the art.
Section 3 presents the attached problem. In
Section 4, the proposed methodology is presented.
Section 5 describes the case study input dates.
Section 6 deals with the result analysis. Finally, conclusions are provided in
Section 7.
2. State of the Art
The role of smart buildings is crucial for the proper use of energy. Due to automation systems, smart buildings can save important information about the habits of their occupants and, therefore, their energy consumption. On the other hand, smart buildings can interact automatically and dynamically with the distribution grids, achieving a reduction in grid energy consumption, thanks to load management, and it supplements supplying energy to the grid, if possible, when they have their own generation sources [
6].
A smart building usually incorporates renewable energy sources, namely solar panel systems or small wind generation systems. The BEMS can then take these own generation systems into account, when carrying out an energy management [
7]. Our work in [
8] describes the basic architecture in a smart residential building.
To obtain a total economic benefit within the dynamic energy-pricing scheme, it is imperative that the different devices in smart buildings incorporate automatic connection–disconnection mechanisms, which require minimal human operation. With this goal, smart connectors are being developed [
9]. A smart socket can be installed between devices (energy store system (ESS), electrical loads, PV system, etc.) along with power outlets, which monitors the energy use in the building. These elements should also communicate with the operators and smart meters that can monitor the electrical state of different devices.
Modern buildings are now equipped with digital control systems in their infrastructure. This allow users to benefit from dynamic energy rates, controlling each piece of equipment that is either producing, consuming, or storing energy in their electrical system. Modern control in smart buildings is aimed at performing optimal control of household appliances, control of the maximum load demanded, supervision for the improvement of the lighting system, control of the window blinds, and measurement and disaggregation of energy use, among other applications. Model predictive control is widely used in microgrid and smart building management [
10]. Compared with other heuristic techniques, it was proved to be more efficient in applications like comfort control and natural ventilation [
11]. In this field, in which the model accuracy plays an important role for optimal control, the use of transfer neural network arises as an interesting alternative, for solving the problem of dealing with such an extremely complex model and reducing the number of required data for the network training [
12]. The suitability of reinforcement learning for operation optimization in smart microgrids is demonstrated in [
13]. As optimization tools, genetic algorithms were proven to be effective under similar scenarios [
14]. Examples of control architectures for smart buildings, which are operated by a BEMS, are illustrated in the works of [
15,
16]. A BEMS is designed for the optimal monitoring and operation of household appliances and other loads installed in smart buildings. The BEMS must program the use of household appliances, in association with smart meters, smart appliances, electric vehicles, small-distributed generation units, and ESS. The work in [
17] illustrates a compilation of technologies and components for BEMS. This work also performs an analysis of various solutions for the BEMS, considering measurement infrastructure, types of connectors for electrical loads, and display systems for users. A wireless control system for the BEMS is illustrated in [
16].
Different algorithms were developed to operate the BEMS, depending on different factors, like user requirements, user comfort, environmental and social restrictions, etc. The work in [
2] describes an extensive compilation of related works on demand management from the user’s point of view. Various hardware applications for BEMS are proposed in [
18] and [
19]. Several works in the technical literature focus on BEMS modeling through linear and non-linear programming, as illustrated in [
20,
21,
22]. Several studies illustrate the programming of energy resources through heuristic methods, mostly with high computational development, as shown in [
23,
24,
25]. Several works point to the reduction of energy costs considering the price dynamics in the grid [
17,
22,
25], whereas other works consider user requirements, comfort, and external, environmental, and social variables [
23,
26].
3. The Attached Problem
The analyzed case-study corresponds to the CIESOL smart building. This bioclimatic building (schematized in
Figure 1) was designed and built for renewable energy research purposes. It is located at the University of Almería, Spain, and its coordinates are 36.83N, 2.40W. Here the annual average sunshine duration is close to 3000 h. Hence, the CIESOL smart building, which incorporates both active solar heating and cooling [
27], is a very suitable building for solar energy applications. Several previous works analyzed and characterized the overall power consumption of the building [
28,
29]. However, this work dealt with the control and optimization of a single laboratory, while the extrapolation of the proposed methodology to the entire building was straightforward. The normalized profile of demand, previously determined in [
30], was considered as the model input. This consumption corresponded to artificial lighting, computers, and other laboratory instruments.
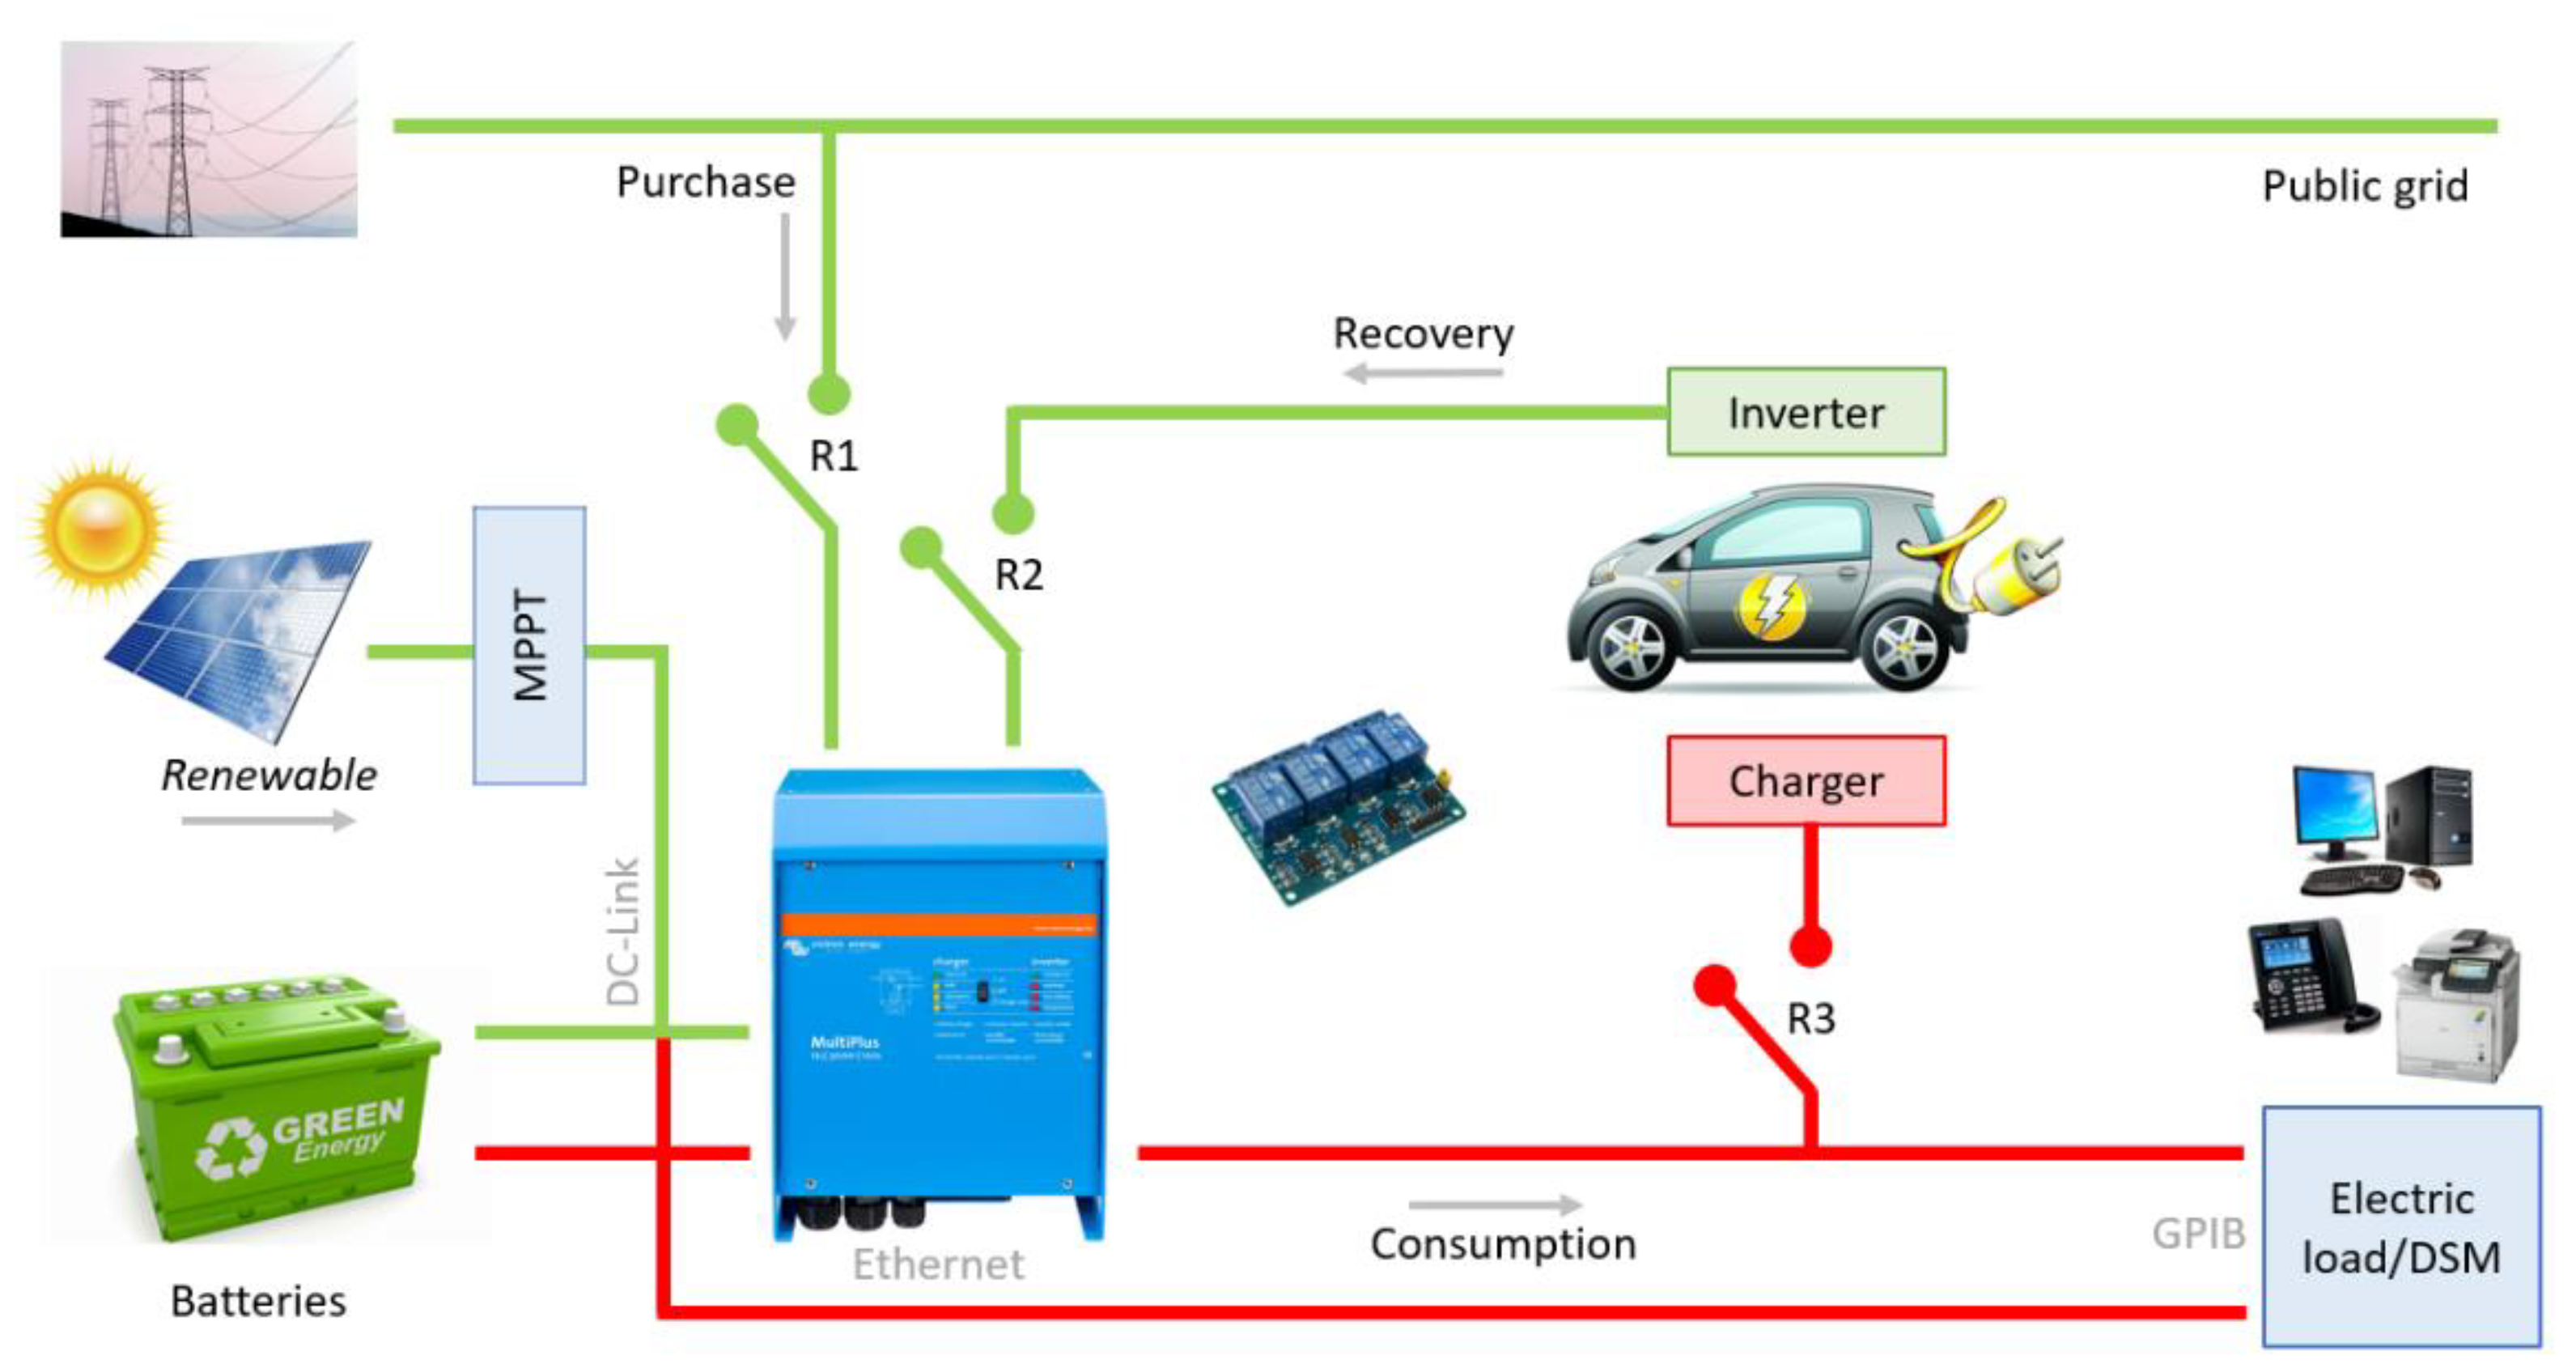
The laboratory under study in the CIESOL smart building could be configured both as a stand-alone and grid-tied installation, by simply acting on interrupts. When operating in a grid-tied mode, the power obtained from the public grid was to be minimized. The battery was connected before the DC/AC converter (as can be seen in
Figure 2), where the input power was represented by green bonds. These inputs come from the public grid, as well as from the electric vehicle, the photovoltaic panels, and the batteries. To achieve this, the output power provided by the charger/inverter was represented by red bonds and comprised the energy consumed in balancing the demand and charging both the batteries and the electric vehicle (EV). Moreover, the MPPT (maximum power point tracking) element in
Figure 2 was in charge to obtain the maximum power from the solar panels; this allowed them to always work at the point of maximum power. On the other hand, a general-purpose instrumentation bus (GPIB) was used to exchange data between the micro-grid and the electronic devices and, finally, the board circuit at the center of the figure was in charge to activate/deactivate the different relays.
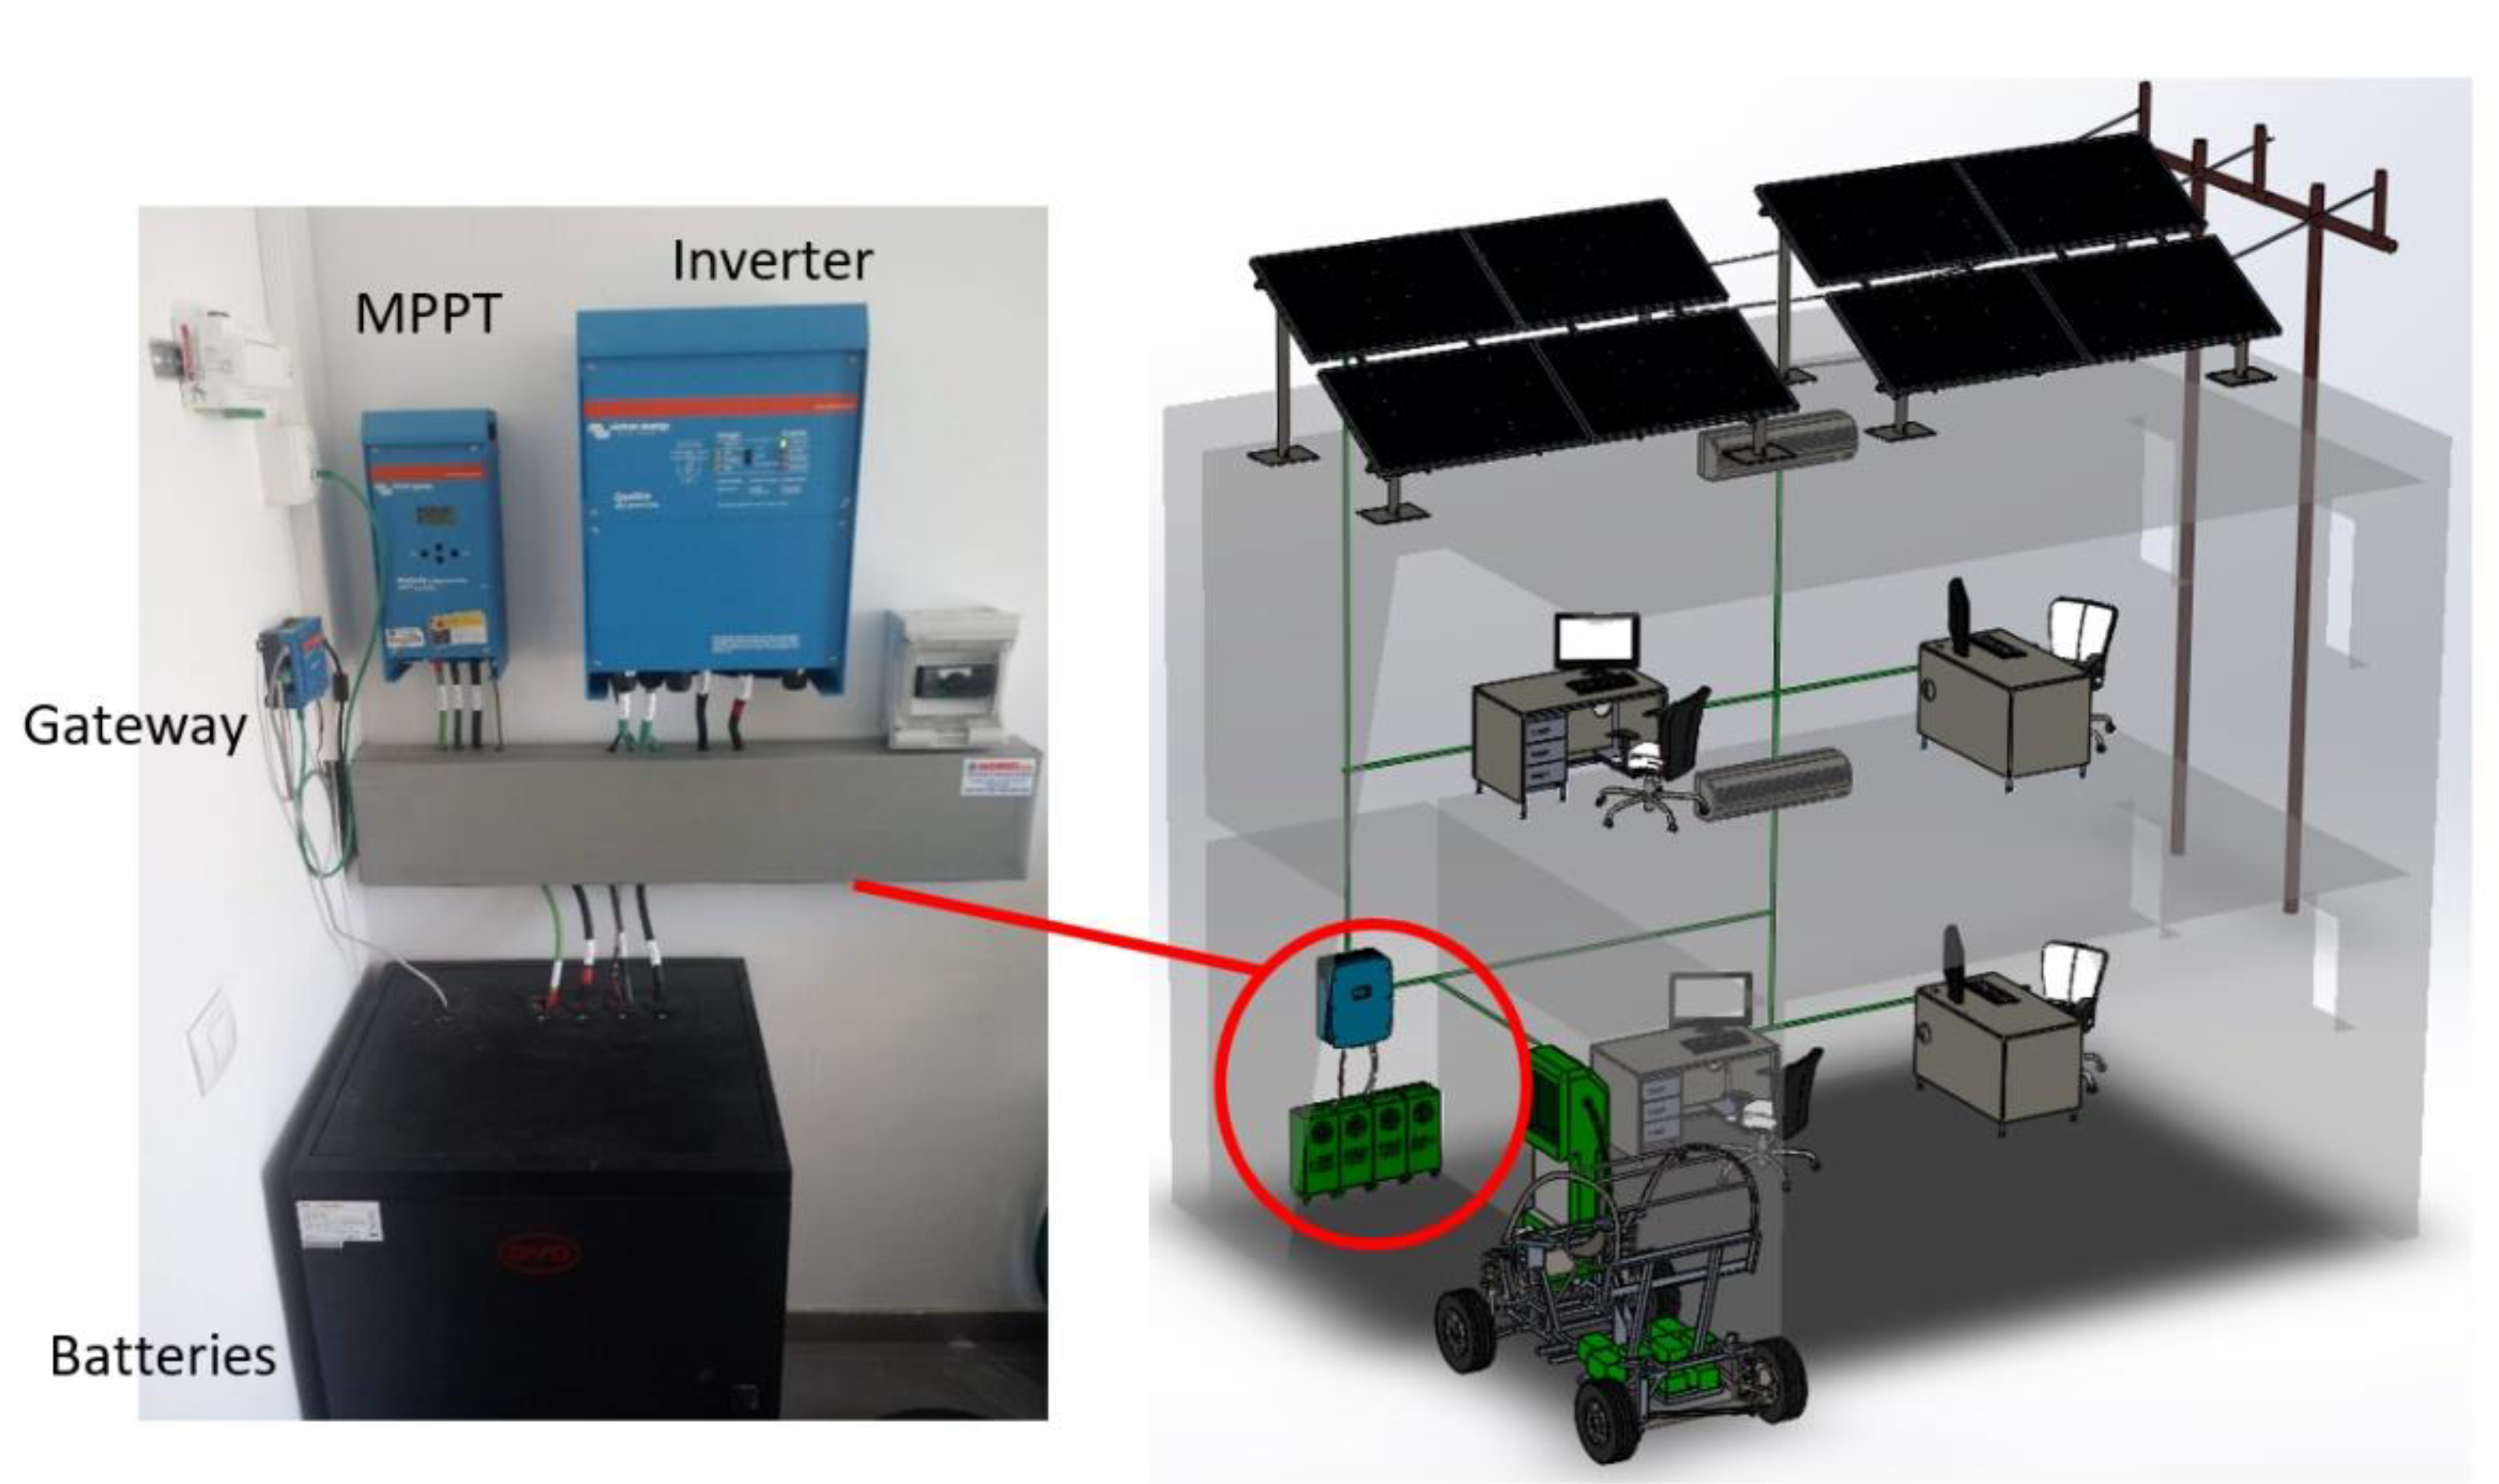
The CIESOL smart building is composed of four photovoltaic panels performing a nominal power of 260 W each, controlled by a maximum power point tracker connected to a DC link, along with two modules of stationary LiFePO4 batteries, with a rated capacity of 4.9 kWh. A grid-connected inverter with a nominal power of 5000 W was in charge of extracting or providing energy to the DC link, exchanging energy with the public grid, and supplying the AC loads. For the sake of ensuring accuracy in the experiments, these loads might be either the real building consumption or that simulated by a programmable AC electronic load. Finally, the electric vehicle might provide or consume energy according to the desired energy control strategy. It incorporates a pack of batteries, with a capacity of 210 Ah. Regarding the communications, a gateway was used to manage the different devices through the controller area network (CAN) bus and the VE-direct bus, and published all collected information by using the Modbus protocol.
As was pointed out previously, thanks to the development of a dedicated software architecture, it was possible to get real-time access to the data provided by the sensors incorporated on the different devices of the micro-grid, by using the Modbus protocol. While the manufacturer provides a gateway in charge of registering these data and publishing them in a web server, it was necessary to count with our own data monitoring, consequently ensuring the robustness, synchronization, and accuracy of this information on the precise time interval, for control purposes.
Regarding the power flows priority management, it was decided to rescind from the default modes implemented in the gateway. This made it possible to take our controller in charge of making the decision on the operating devices, by using the relays.
The load was connected to the output of the charger/inverter, which could be connected or disconnected from the public grid by means of a relay, referred to as R1 in
Figure 2. Parallel to the electronic load, another power line fed an EV charging station, controlled by a second relay (R2 in
Figure 2). Finally, another power line connected to the inverter’s second AC input, which enabled an EV to inject energy to the micro-grid when needed, by acting on a third (R3 in
Figure 2). Moreover, the MPPT (maximum power point tracking) element in
Figure 2 was in charge of obtaining the maximum power from the solar panels, which allowed them to always work at the point of maximum power. On the other hand, a general-purpose instrumentation bus (GPIB) was used to exchange data between the micro-grid and the electronic devices and, finally, the board circuit at the center of the figure was in charge of activating/deactivating the different relays.
The attached problem consisted of minimization of the energy costs associated with consumption from the public grid. This was achieved by means of an energy management strategy, based on a mathematical algorithm which would set the state of the relays labeled in
Figure 2 as R1, R2, and R3, taking into account the PV production, the instantaneous demand, the ESS, the electricity costs and others details about the smart building, which are provided in
Section 4.
4. Outline of the Methodology
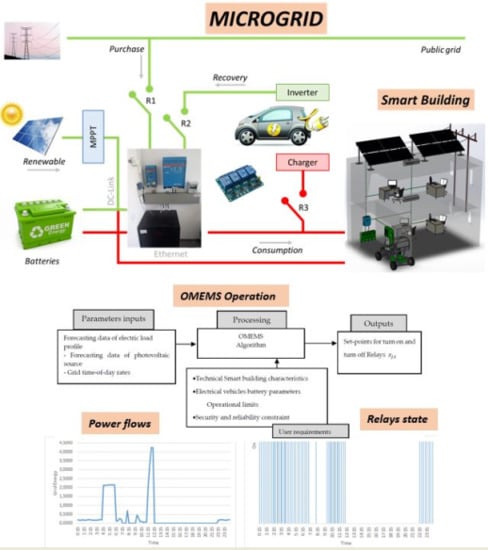
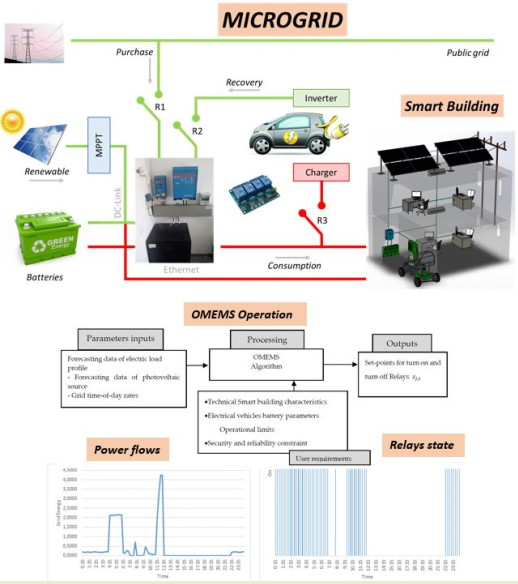
In order to know the correct operation of the relays R1, R2, and R3, we developed the optimal model for energy management strategy (OMEMS), which took real input data as it was, and (a) forecasted data of the electrical load profile as input (carried out through the neural network models developed previously for the CIESOL building in [
29,
30]), (b) forecasted data of the photovoltaic source, and (c) the grid electricity prices. The OMEMS considered different parameters like, (a) technical smart building characteristics, (b) operational limits, (c) security and reliability constraints, (d) user requirements, and (e) device models installed in smart buildings, among others. In technical smart building characteristics, we took the energy storage system parameters into consideration, like (a) maximum power injection, (b) injection efficiency, (c) maximum capacity of stored energy (d) maximum power recharge, (e) recharging efficiency, and the (f) self-discharge rate. The above parameters were also defined for the electrical vehicles battery. As an output, the OMEMS delivered an answer for each time of the day identified for each of the relays, in terms of whether it should be turned on or off, as illustrated in
Figure 3. This allowed us to look for one important challenge to maximize the use of renewable energy. This objective was reached by taking full advantage of the building storage sources and using the electrical vehicle battery, as an energy source for the building’s load.
As mentioned above, the task of the proposed methodology was to minimize the power supplied by the grid, in order to reduce the total cost of the energy consumed by the smart building, Equation (1). The total energy cost could be calculated as the sum of the energy purchased from the grid and the renewable generation cost. This made it possible to compare the costs of the grid, as well as the costs of the renewable energies installed in smart buildings, selecting the most economical option. We define very low costs for renewable energies, with the aim of privileging these technologies. The optimization model proposed in this work was adapted to take into account the various periods of time in a day (we took a sample time of 15 min).
Thus, the optimization problem could be formulated as follows:
where
Equation (2) was used to calculate the power of the renewable energy sources available in the smart building,
. This equation illustrates the sum of the photovoltaic power,
, and the wind power, which in our micro-grid was equal to zero, since it did not include this kind of renewable energy source,
, which could be installed in an intelligent building. Equation (3) provided the typical power balance, where in the left side we have the sum of the available photovoltaic power,
, the available wind power,
, the power supplied by the grid,
, the power that could be obtained from the ESS,
, and the power that could be obtained from the electric vehicle battery,
. This sum was equal to the power demanded by the smart building,
, the power to recharge the ESS,
, and the power to recharge the electric vehicle battery,
. Equations (1)–(3) represent the classical approach to this type of problem studied in many works, such as [
31]. However, in this paper, a set of original new considerations is provided, namely (i) a new approach to solve the problem for the optimal operation of the relays R1, R2, and R3, based on the classical optimization tools; (ii) modeling of ESS in smart building; (iii) EV batteries with large storage capacity, and (iv) use of commercial optimization solvers and mathematical programming languages. These features are explained in the following subsections.
4.1. The Methodology to Solve the Problem
The proposed OMEMS defined the appropriate time to connect an electrical relay, in order to meet a specific objective. The model analyzed whether or not a certain electrical relay (R1, R2, or R3) should be connected for each period
t. The binary decision variable
related for each relay
j, was defined as the output of the proposed optimization model. Therefore,
could have a value of zero (0) or one (1); a zero value meant that the relay
j must be turned off (disconnected) at time
t, whereas a value of one meant that relay
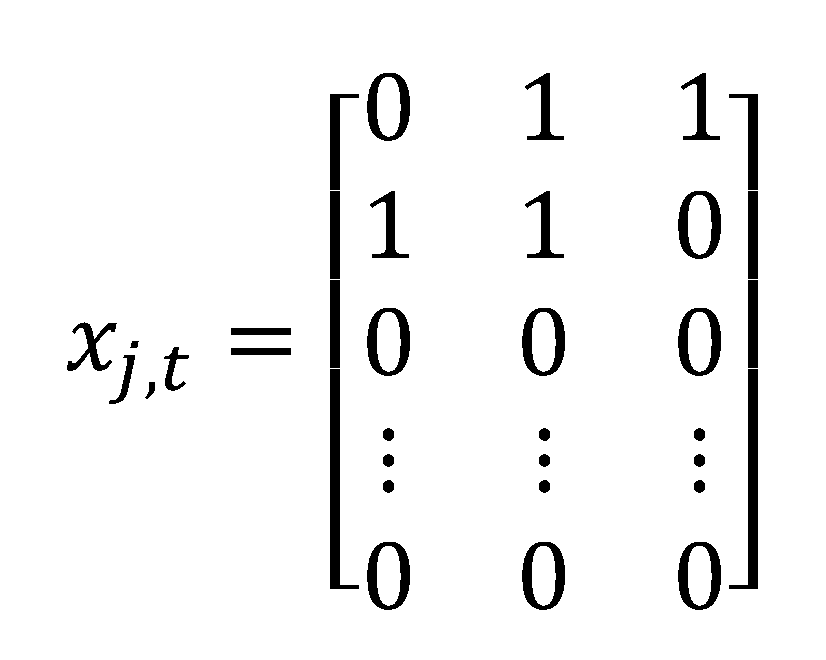
j must be turned on (connected). The model output contained a binary matrix with
values for each period
t, where a value of one meant the period of operation for each relay
j, e.g.,
;
; etc. as illustrated in
Figure 4. The use of binary variables together with continuous ones required a simple model that allowed the optimization model to deliver solutions in a short time.
4.2. Energy Storage Systems with Large Storage Capacity
In general, batteries are the most common choice for short-term energy storage systems in smart building; in this work, the ESS was composed of a bank of lead-acid batteries. Its main function was to reduce the variability of the storage energy systems and the renewable resources; then, it could be used during periods when the energy supplied by the grid had a higher cost. This work included states where the ESS was recharged and other states where the ESS supplied energy, considering factors like (1) high capacity storage, (2) maximum and minimum power recharging, (3) maximum and minimum power supply, (4) supply efficiency, (5) recharging efficiency, and (6) self-discharge rate. To model the ESS, the methodology proposed in [
32] was used. For the scenarios studied in this paper, the ESS parameters showed in
Table 1 were used.
The ESS modeling must consider the feasibility in which the energy stored at each moment of the day is considered. The OMEMS model calculated the energy of the ESS, considering (a) the energy stored in ESS in the time analyzed immediately before, (b) the recharge energy obtained from the micro-grid (where the ESS recharge efficiency was taken into account), (c) the energy supplied by the ESS that was delivered to the micro-grid (where the ESS supply efficiency was considered), and (d) the ESS self-discharge energy, which took into account the ESS discharge rate, as illustrated in Equation (4). The feasibility should also consider the established value of both the maximum energy and the minimum energy stored in ESS, as illustrated in Equation (5).
To perform the correct ESS mathematical modeling, it was necessary to set the binary variable
, which had a value of 0 when the ESS system was in a state of charge, whereas
had a value of 1 when ESS was in a power supply state. ESS modeling must consider the technical limits of the maximum and minimum recharge power. These parameters are modeled using Equations (6)–(9).
4.3. Electrical Vehicles Batteries with Large Storage Capacity
With the increased use of EVs, it is necessary to analyze its impact on the smart building. In this work, we consider obtaining the energy stored in the EV through the action of relay 3, to be supplied to the micro-grid, according to what was illustrated in
Section 3. Therefore, the battery of each available EV was considered to be one more source of ESS. Agreeing to
Section 4.2, the procedure used by the OMEMS for the modeling of the ESS, was also used for the EV battery. Therefore, the OMEMS model calculated the energy of the EV battery considering (a) the energy stored in EV battery in the time analyzed immediately before, (b) the recharge energy obtained from the micro-grid, where the EV battery recharge efficiency was taken into account, (c) the energy supplied by the EV battery that was delivered to the micro-grid, where the EV battery supply efficiency was considered, and (d) the EV battery self-discharge energy, which took into account the EV battery discharge rate, as illustrated in Equation (10). The feasibility should also consider the established value of both the maximum energy and the minimum energy stored in ESS, as illustrated in Equation (11).
In this work, we considered additional factors to improve the real conditions in a smart building, such as (1) hours available to recharge the car batteries according to a schedule when the vehicle is at building, (2) use of maximum power charging to maximize recharge during the time when the vehicle is at building, and (3) maximized storage capacity of the battery. As established by Equation (12), in which
ρ defined the percentage of battery storage for the end of the period, if
ρ = 100, the algorithm must schedule the battery to be fully charged at end of period
evf, because the EV would be used immediately after this period.
For the scenarios studied in this paper, we used the EV battery parameters shown in
Table 2.
To perform the correct EV battery mathematical modeling, it was necessary to set the binary variable
, which had a value of 0 when the system was in a state of charge whereas
had a value of 1 when the EV battery was in a power supply state. EV battery modeling must consider the technical limits of the maximum and minimum recharge power. These parameters were modeled using Equations (13)–(16).
4.4. Use of Classical Optimization Techniques which Give an Optimal Solution
One option for solving the OMEMS problem was to employ heuristic methods to find a feasible and good solution, but not necessarily optimal ones, as shown in [
33]. In this work, a model that used classical convex optimization methods, which guarantee the optimal solution, was developed. As mentioned previously, an optimization model with binary and continuous variables require a simple code that delivers solutions in a short time. Therefore, the model was implemented using the mathematical programming language (AMPL) [
34] and solved via a commercial solver (CPLEX) [
35], where all equations used were linear.
Therefore, OMEMS dealt with a mixed-integer linear programming (MILP) problem, which involved continuous variables used for modeling the power flow and integer variables, in this case, binary ones, used to define the state of the relays. This kind of problems comprises challenging tasks in the field of mathematical optimization and do not lead to a unique procedure for its resolution. In our case, the use of AMPL for modeling the problem allowed us to deal with complex mathematical problems, which could be extended to large-scale mathematical problems. Thus, a mix of imperative and declarative programming style could be used. This allowed the formulation of optimization models to be addressed through the elements of declarative language, like sets, scalar and multidimensional parameters, decision variables, and objects and constraints, which allow a concise description of a vast majority of the problems involved in the field of mathematical optimization. Once the problem is formulated by using AMPL, it is solved by means of CPLEX, which receives its name from the fact that it implements the simplex method in the C language. This optimizer allows the resolution of high complexity MILPs. This ensures that an optimal solution can be found, which even if it was not the global optimal solution, would be suitable enough in all cases, considering the constraints. As a result, OMEMS takes into account optimization issues that are not implemented by simple rule-based controllers.
4.5. Other Technical Smart Building Characteristics
The OMEMS establishes other additional features, as well as the limit of active power that can be taken from the electrical grid. This value was the limit established by the feeder of the building electrical connection, illustrated in Equation (17) as
FL. Since the electric grid was taken as an infinite power source, it was very important to set the
FL value to bring the model close to reality, as much as possible. We established this value at 15 kW, according to the characteristics of the case study.
5. Case Study Input Dates
The OMEMS considered the following inputs, forecasting data of the electric load profile, forecasting data of the photovoltaic source and grid time-of-day rates, as discussed in
Section 4 (
Figure 1).
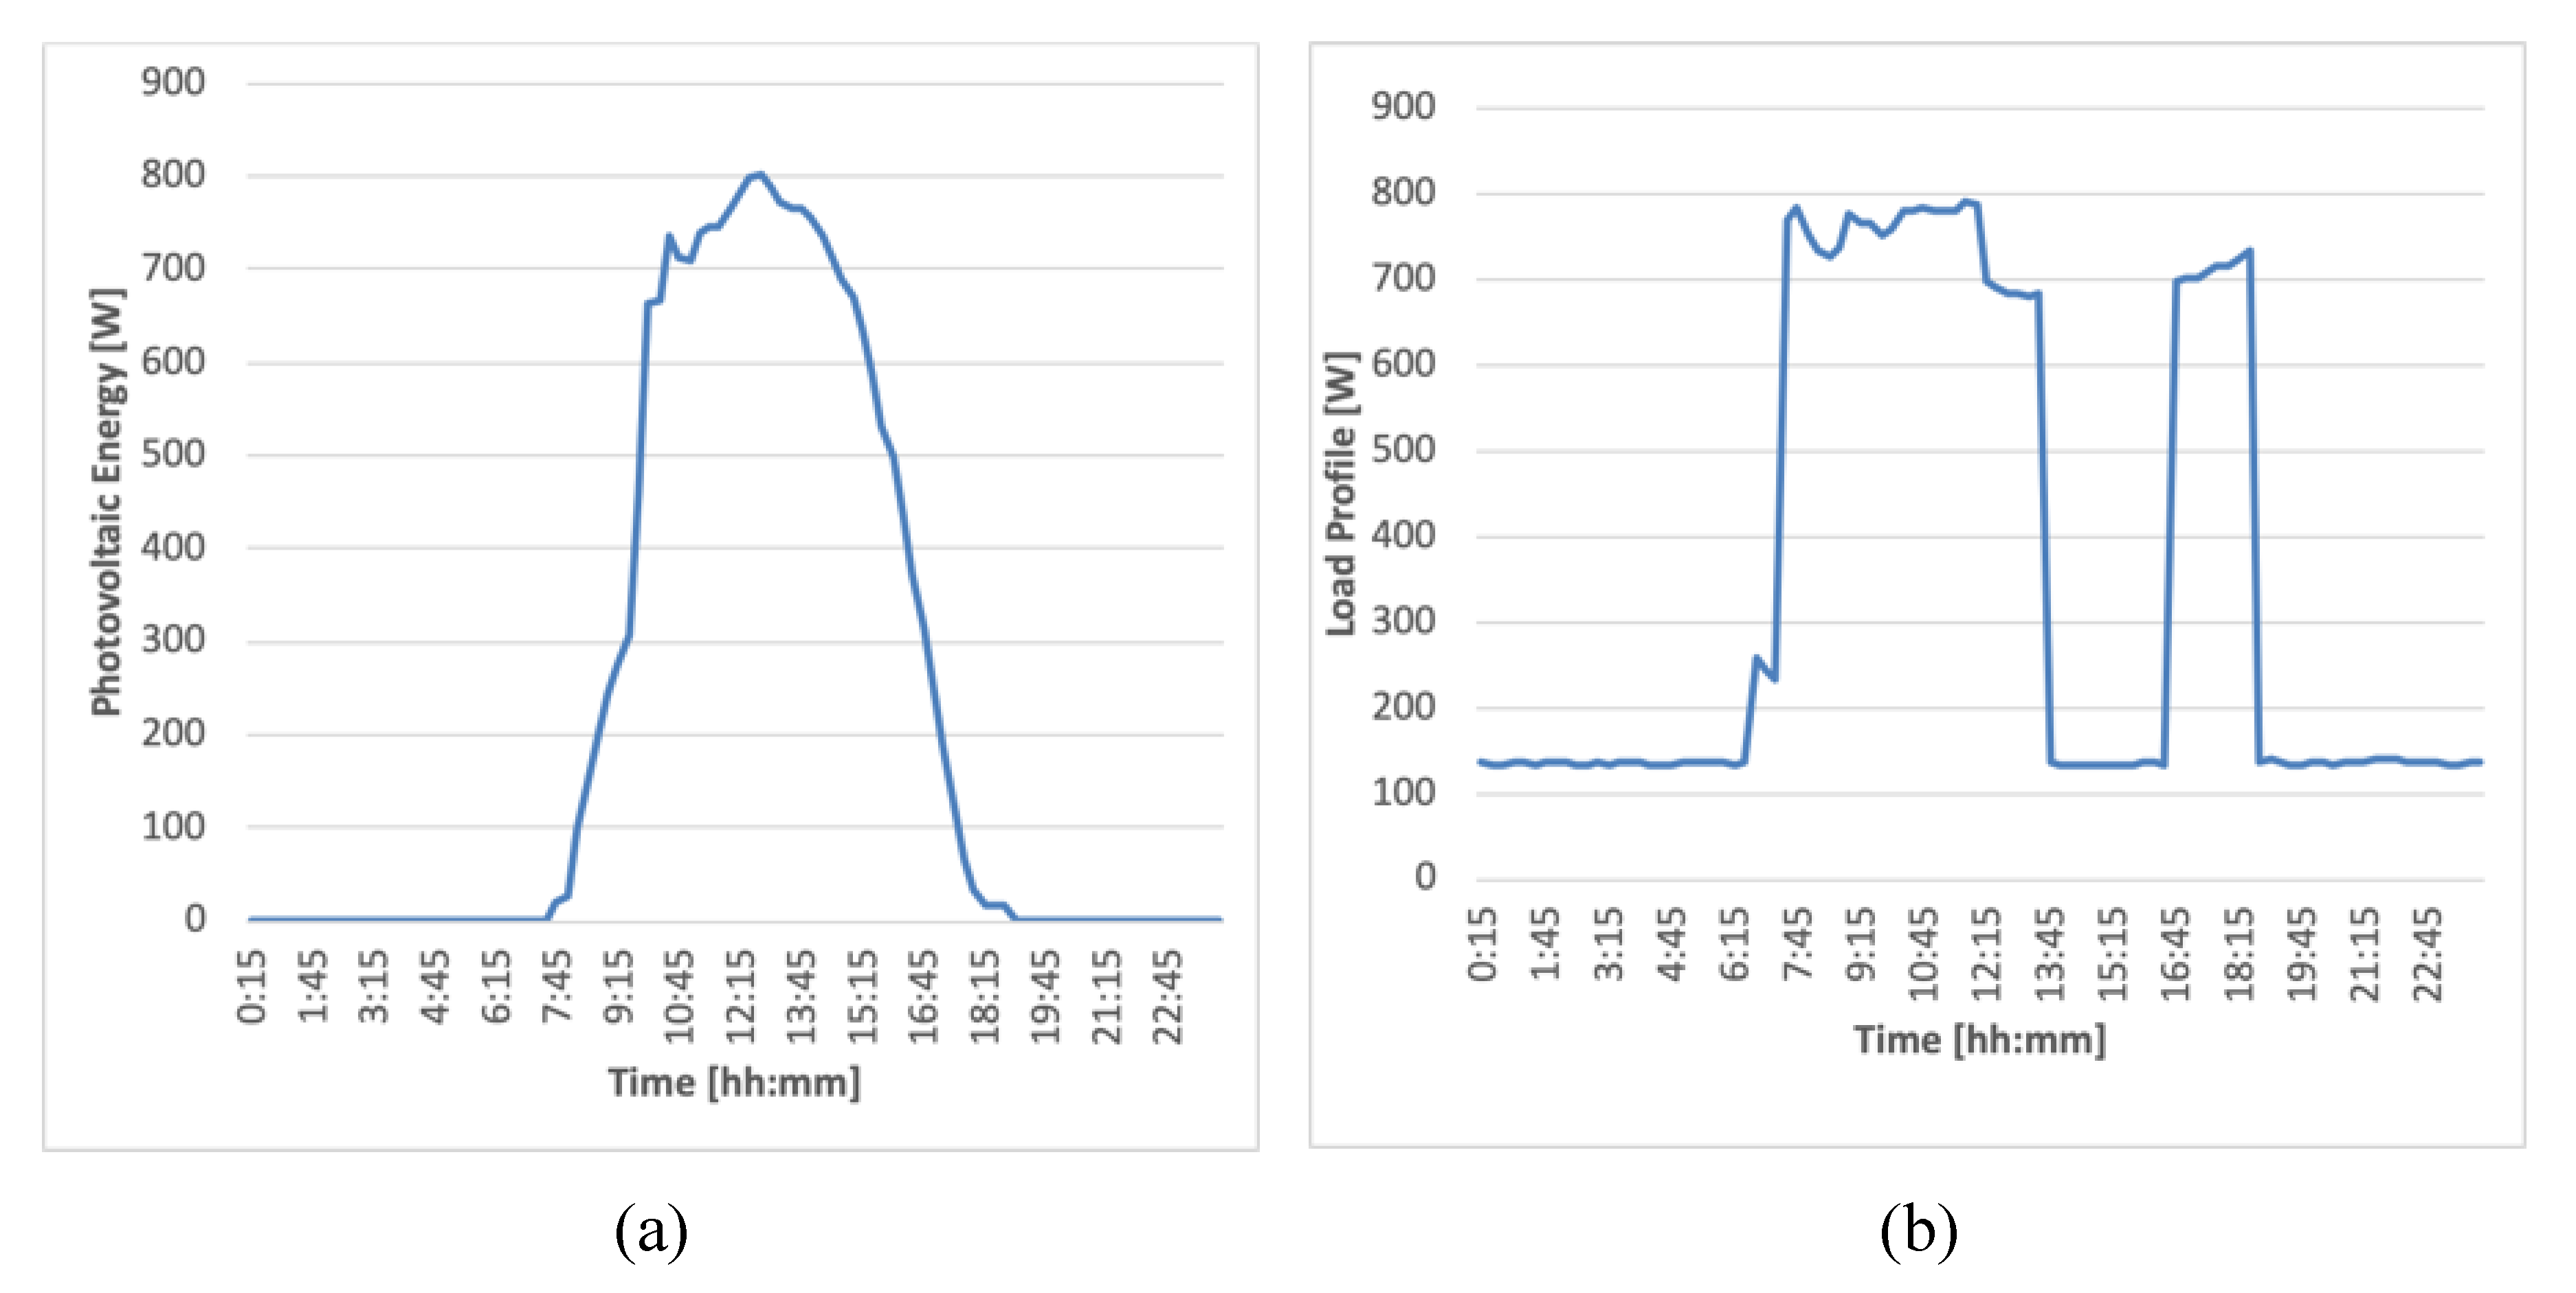
Figure 5a shows the power profile of the PV system in CIESOL on 11 December 2019.
Figure 5b illustrates the demand curves, also for 11 December 2019. The proposed optimization model was adapted to consider a sample time of 15 min, along a day.
The law 24/2013 published in the Spanish Official State Gazette on 26 December [
36] had the purpose of establishing the regulation of the electricity sector, in order to guarantee the supply of electricity, and to adapt it to the needs of consumers in terms of safety, quality, efficiency, objectivity, and transparency, at minimum cost. The main novelties of the law concern the economic and financial balance of the electricity sector and the remuneration of production, grids, and marketing activities.
One of these novelties is the economic and financial sustainability of the power electric system as a guiding principle of the actions of the public administrations and other subjects included in the scope of the law application. Thus, a time-of-use pricing scheme was established, where the price of electricity was tied to specific time-periods, aiming to reduce the energy consumption in the peak hours and to encourage the management of demand. According to this law, different periods could be identified as (i) peak and (ii) off-peak. The day-ahead price (DAP) of the electricity for the Spanish market was supplied by Iberian energy market operator (OMIE). OMIE is a company that manages the entirety of the electricity markets (daily and intraday) for the Iberian Peninsula [
37]. The operating model provided by OMIE was similar to the one that can be found in several other European markets. Therefore, from its website the data of an hourly-based mean energy price for the Spanish market could be collected.
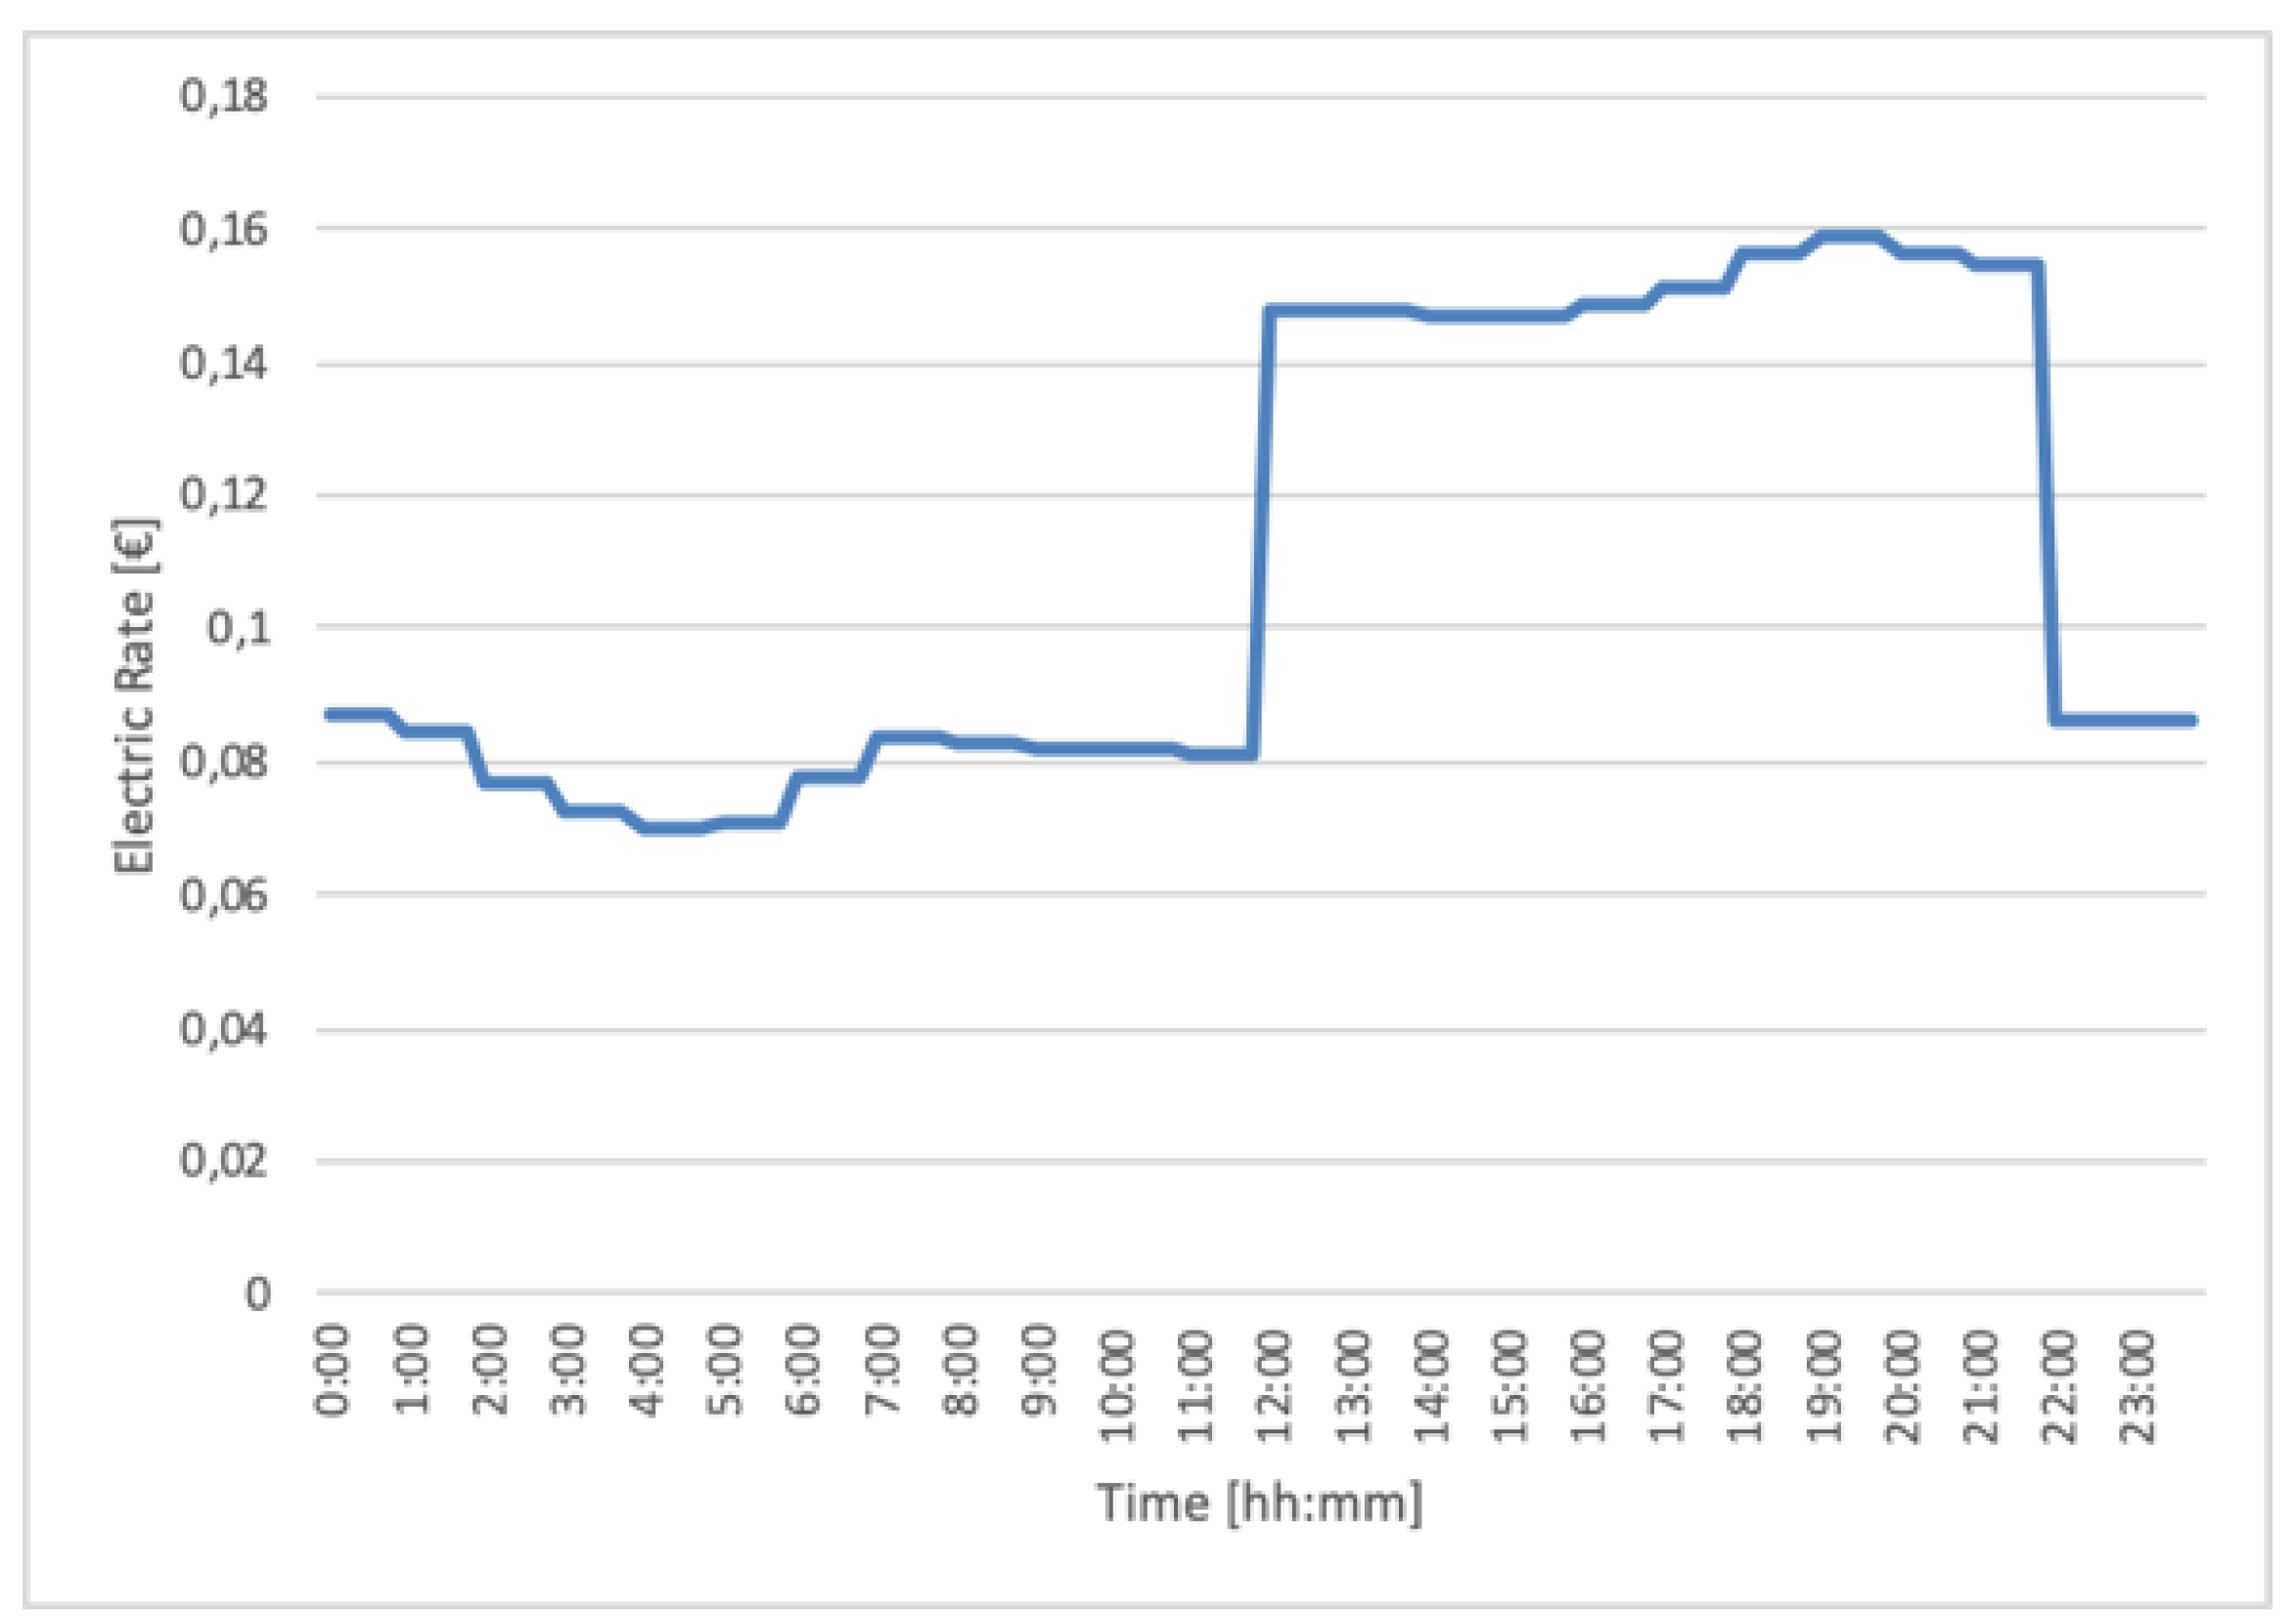
For the simulation of different scenarios, we used the data on the used cost of energy, illustrated in
Figure 6, which corresponded to the price defined by one of the utilities in Almeria city [
38].
6. Result Analysis
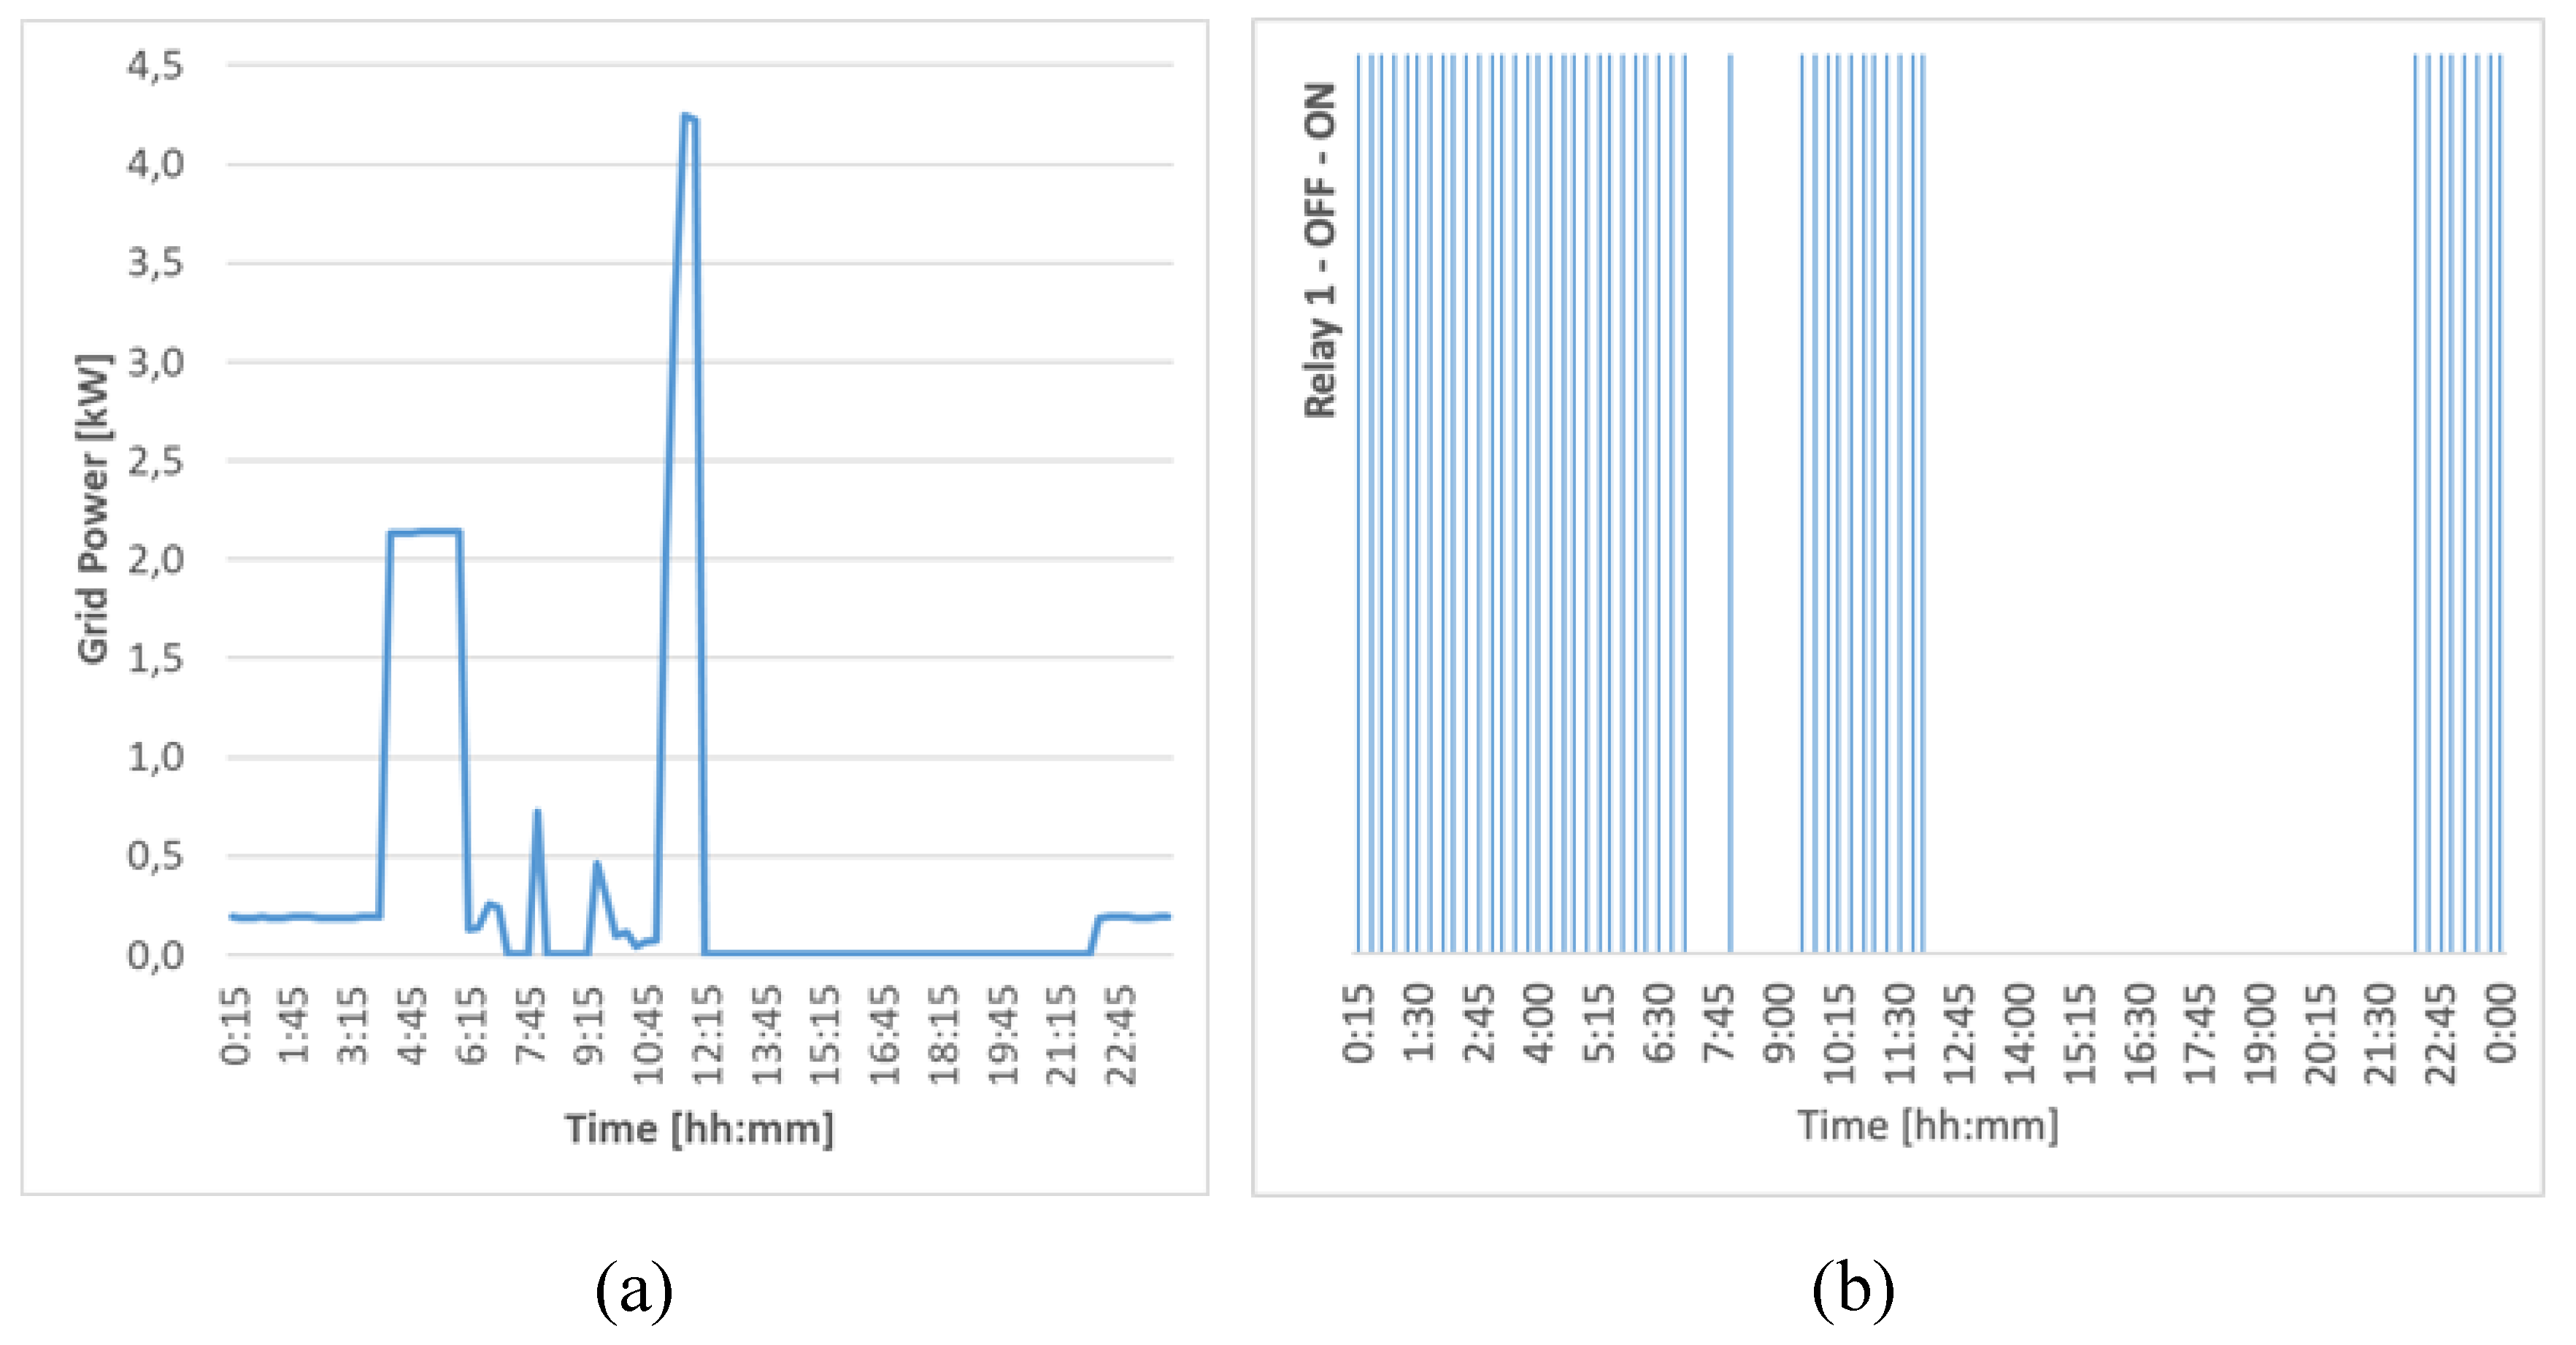
For the case study, the operation of relay 1 (which allowed the connection to the grid), is illustrated in
Figure 7b. It was obtained as the OMEMS output, as discussed in
Section 4 (
Figure 1).
Figure 7a illustrates the active power supplied from the grid for each time of day. In
Figure 7a, it can be seen that greatest power from the grid was obtained in periods where the grid electricity rate was cheaper. For example, between 04:00 and 06:00, energy was taken from the grid to recharge the batteries, at their maximum recharge capacity, as in this period, the cost per kWh was the lowest. In this way, the batteries were recharged considerably, to be used later. In the period between 11:00 and 12:00 h, the maximum peak from the grid was reached, to recharge not only the ESS, but also the batteries of the electric vehicle, as well as the loads connected in that period. This period saw the highest demands in the smart building. This action was justified because not only does the price of grid energy skyrocket after 12:00, but also because it was the closest period to the use of both the ESS and electric vehicles as energy sources. In periods where the cost of energy from the grid was higher, the OMEMS avoided obtaining energy from that grid.
Figure 7b illustrated that the relay 1 was turned-off between 12:00 and 22:15, as the price of the grid energy was expensive in this period. In the period between 22:15 and 0:15 of the next day, the smart building obtained power from the grid as little as possible, not only for low demand during these hours, but to also keep the batteries charged at the minimum value that the user was assigned, which in this study case was 10 kWh.
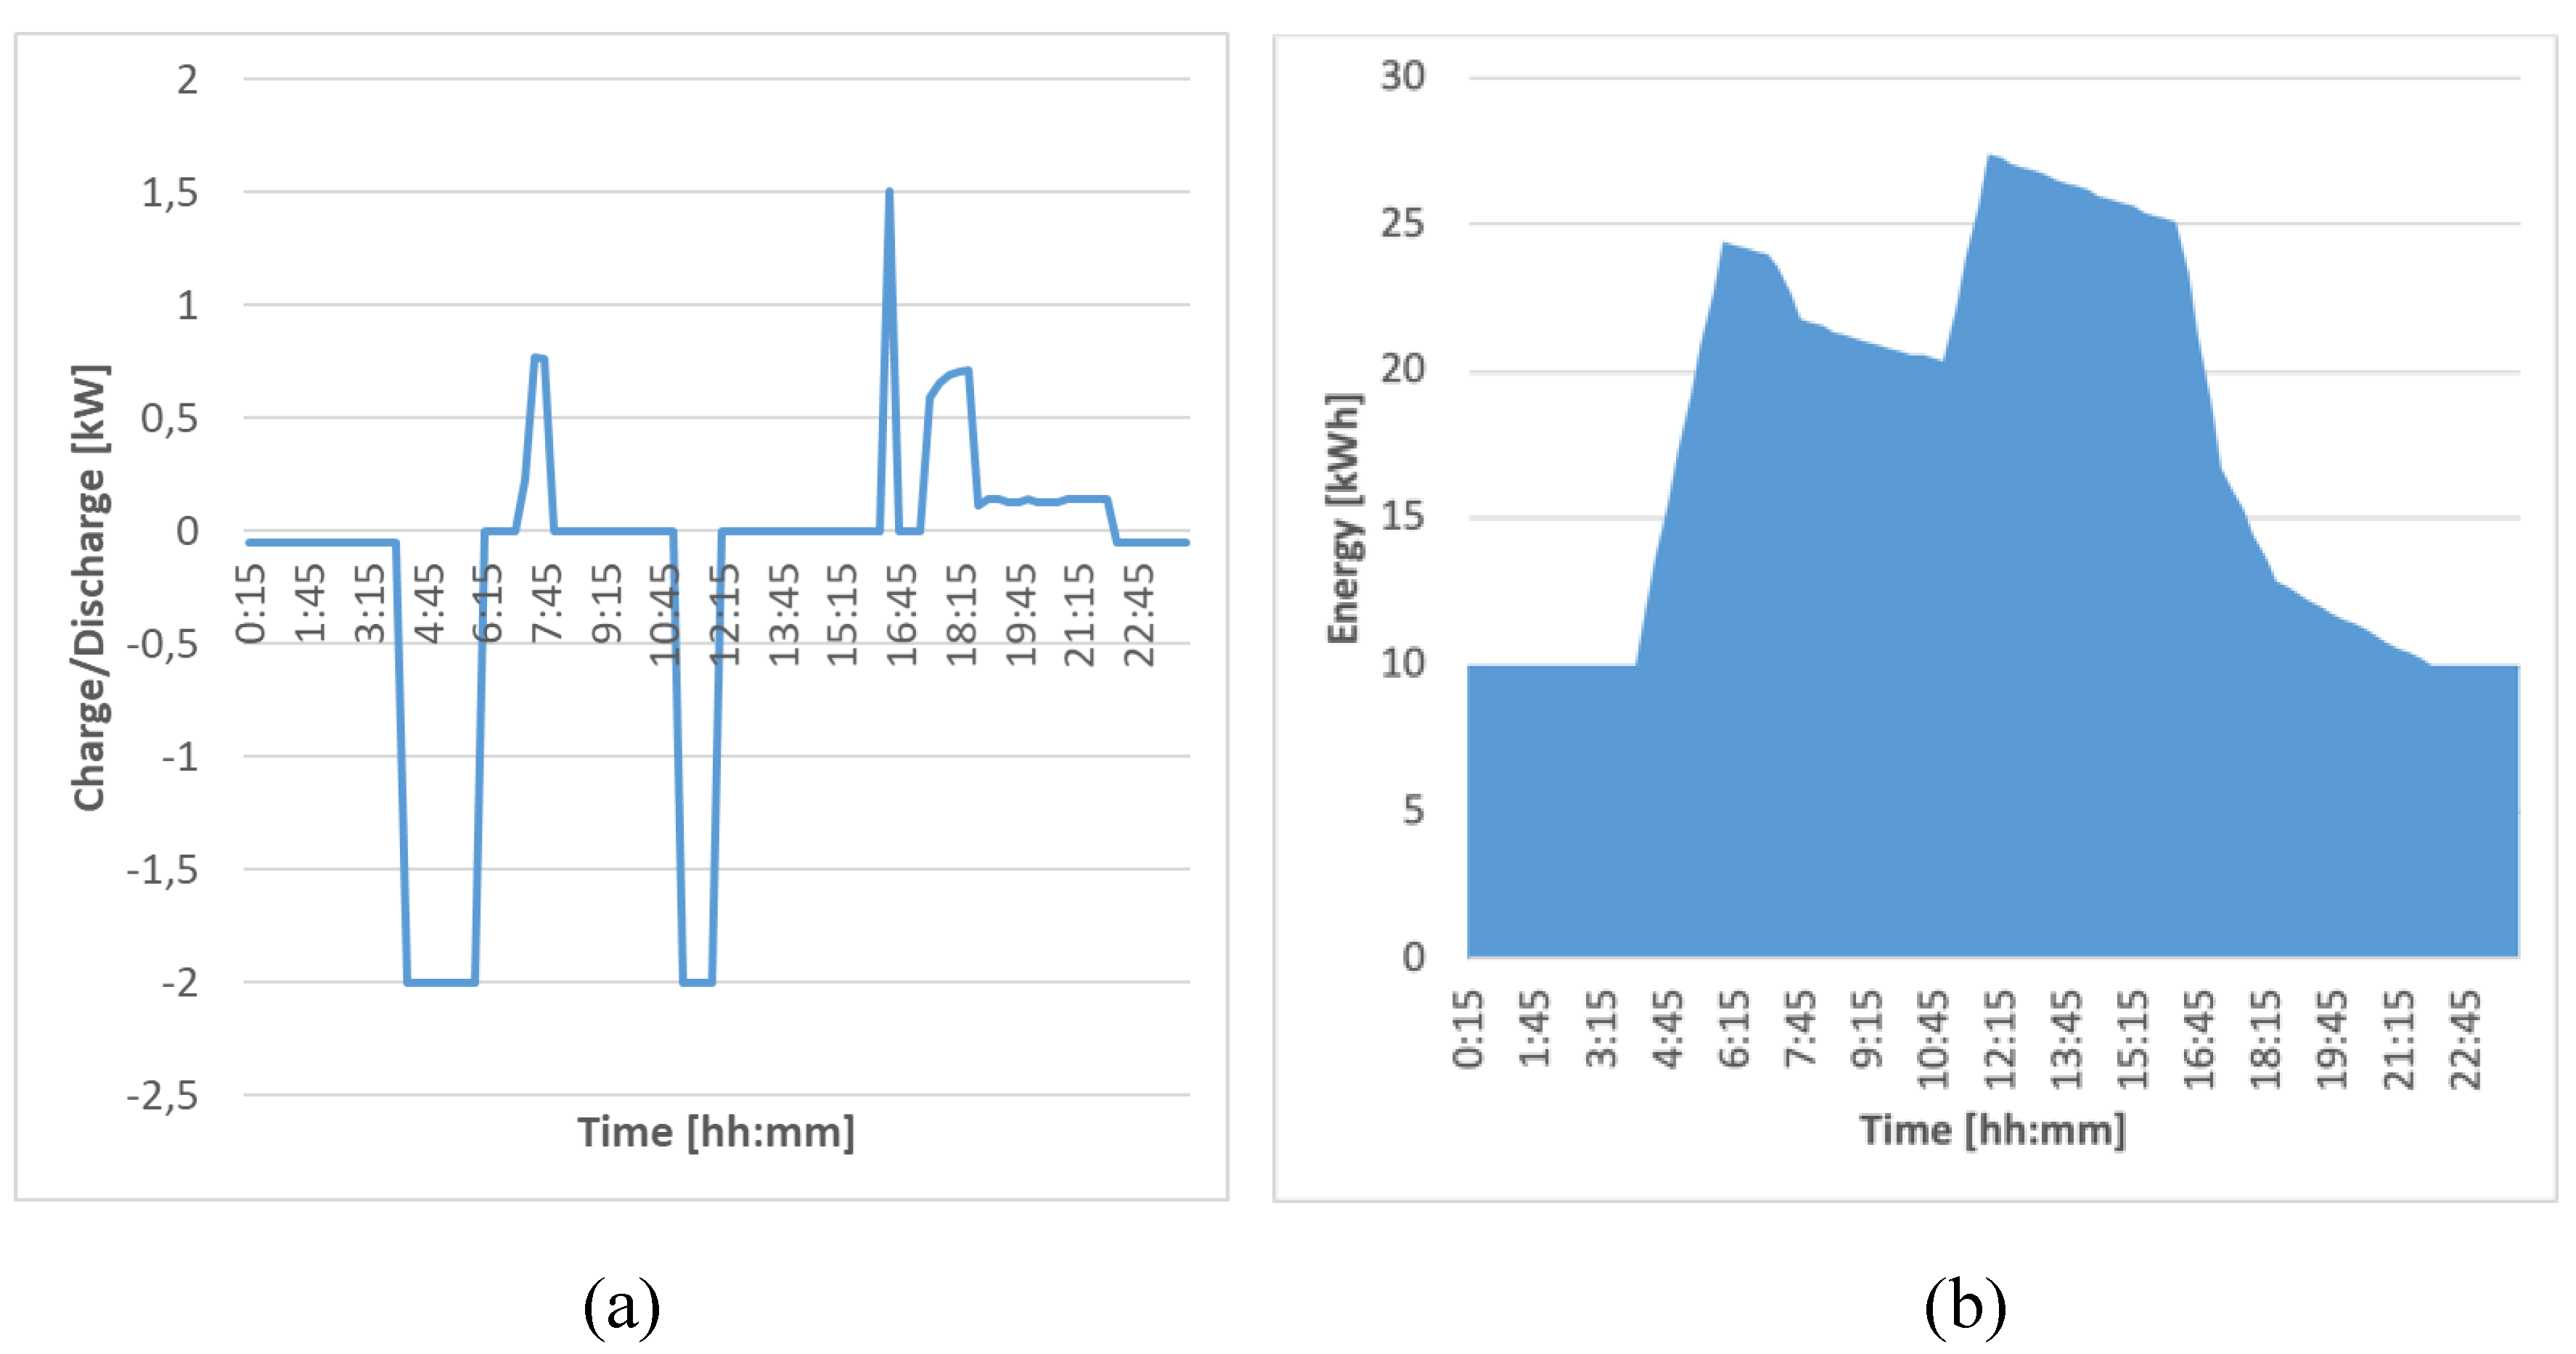
Figure 8a shows the operation of the ESS, in which it can be seen that ESS was only charged in the hours when the energy cost from the grid was low-priced. Additionally, in this figure it was possible to highlight that, the energy stored in the ESS was mostly extracted at times when the cost of energy from the grid was more expensive.
Figure 8b illustrates the ESS state of charge, in which the optimal modeling of the ESS was verified, since the energy of the storage system in some determined period must respect the state of the energy in the previous period. In other words, a battery cannot supply power that it did not have stored, nor can it charge energy beyond its storage capacity.
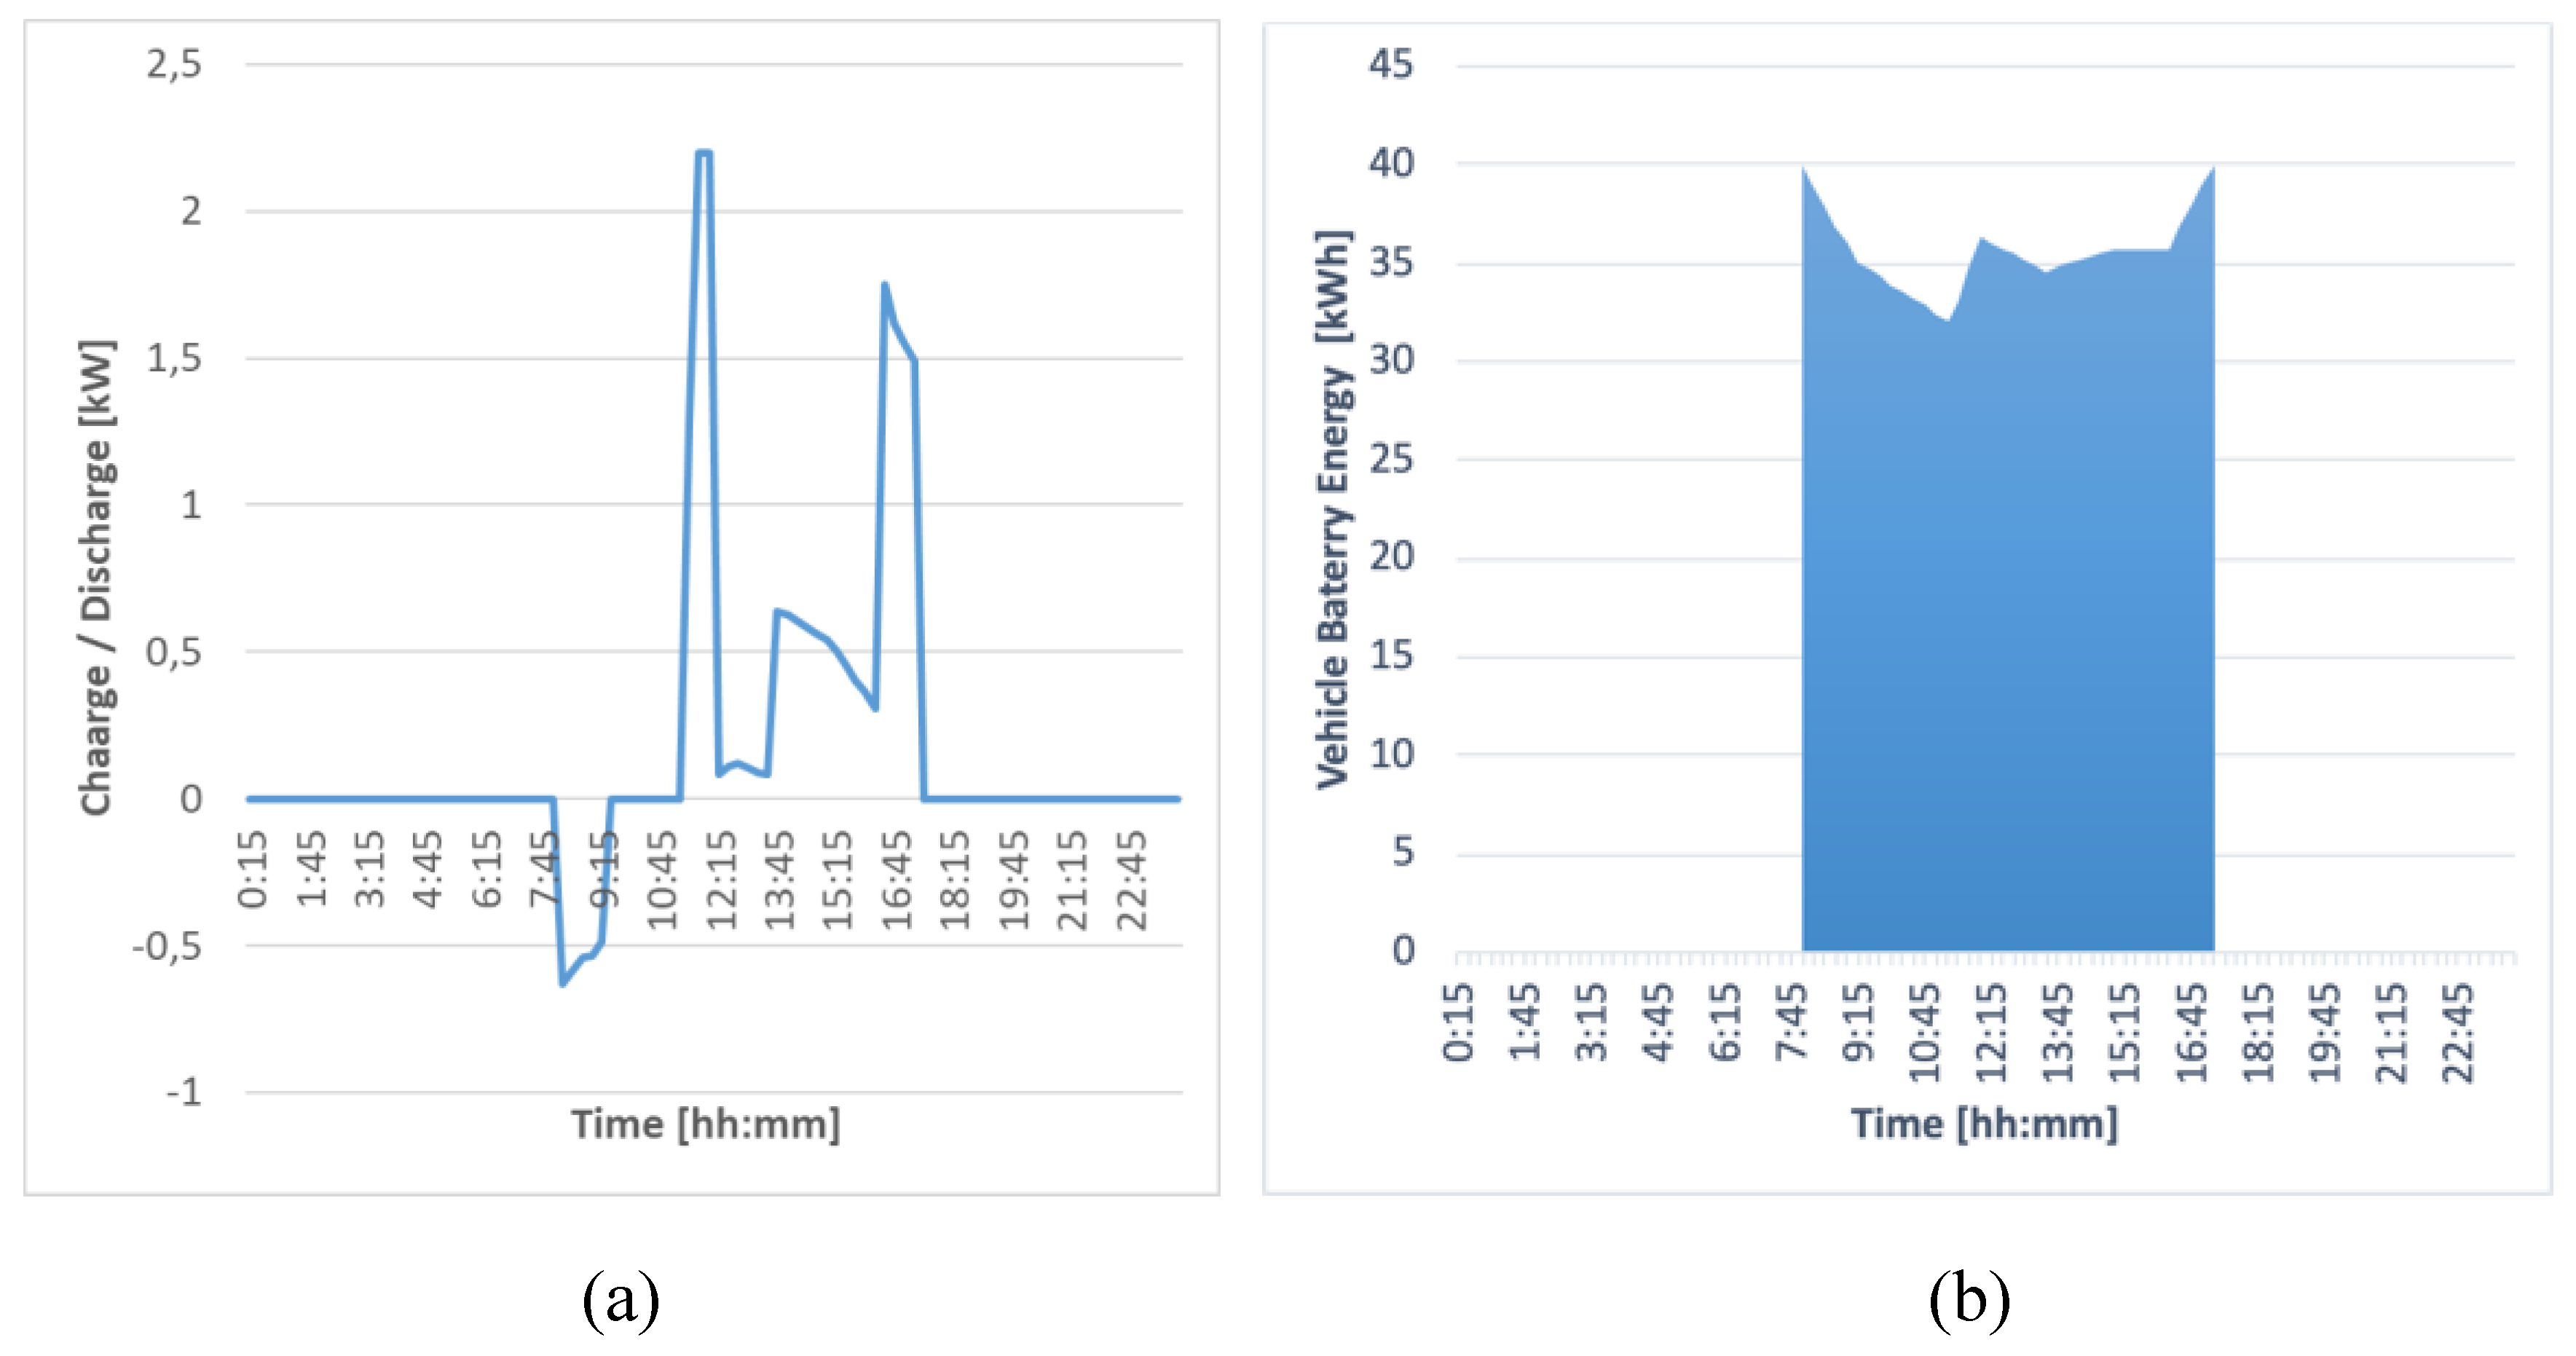
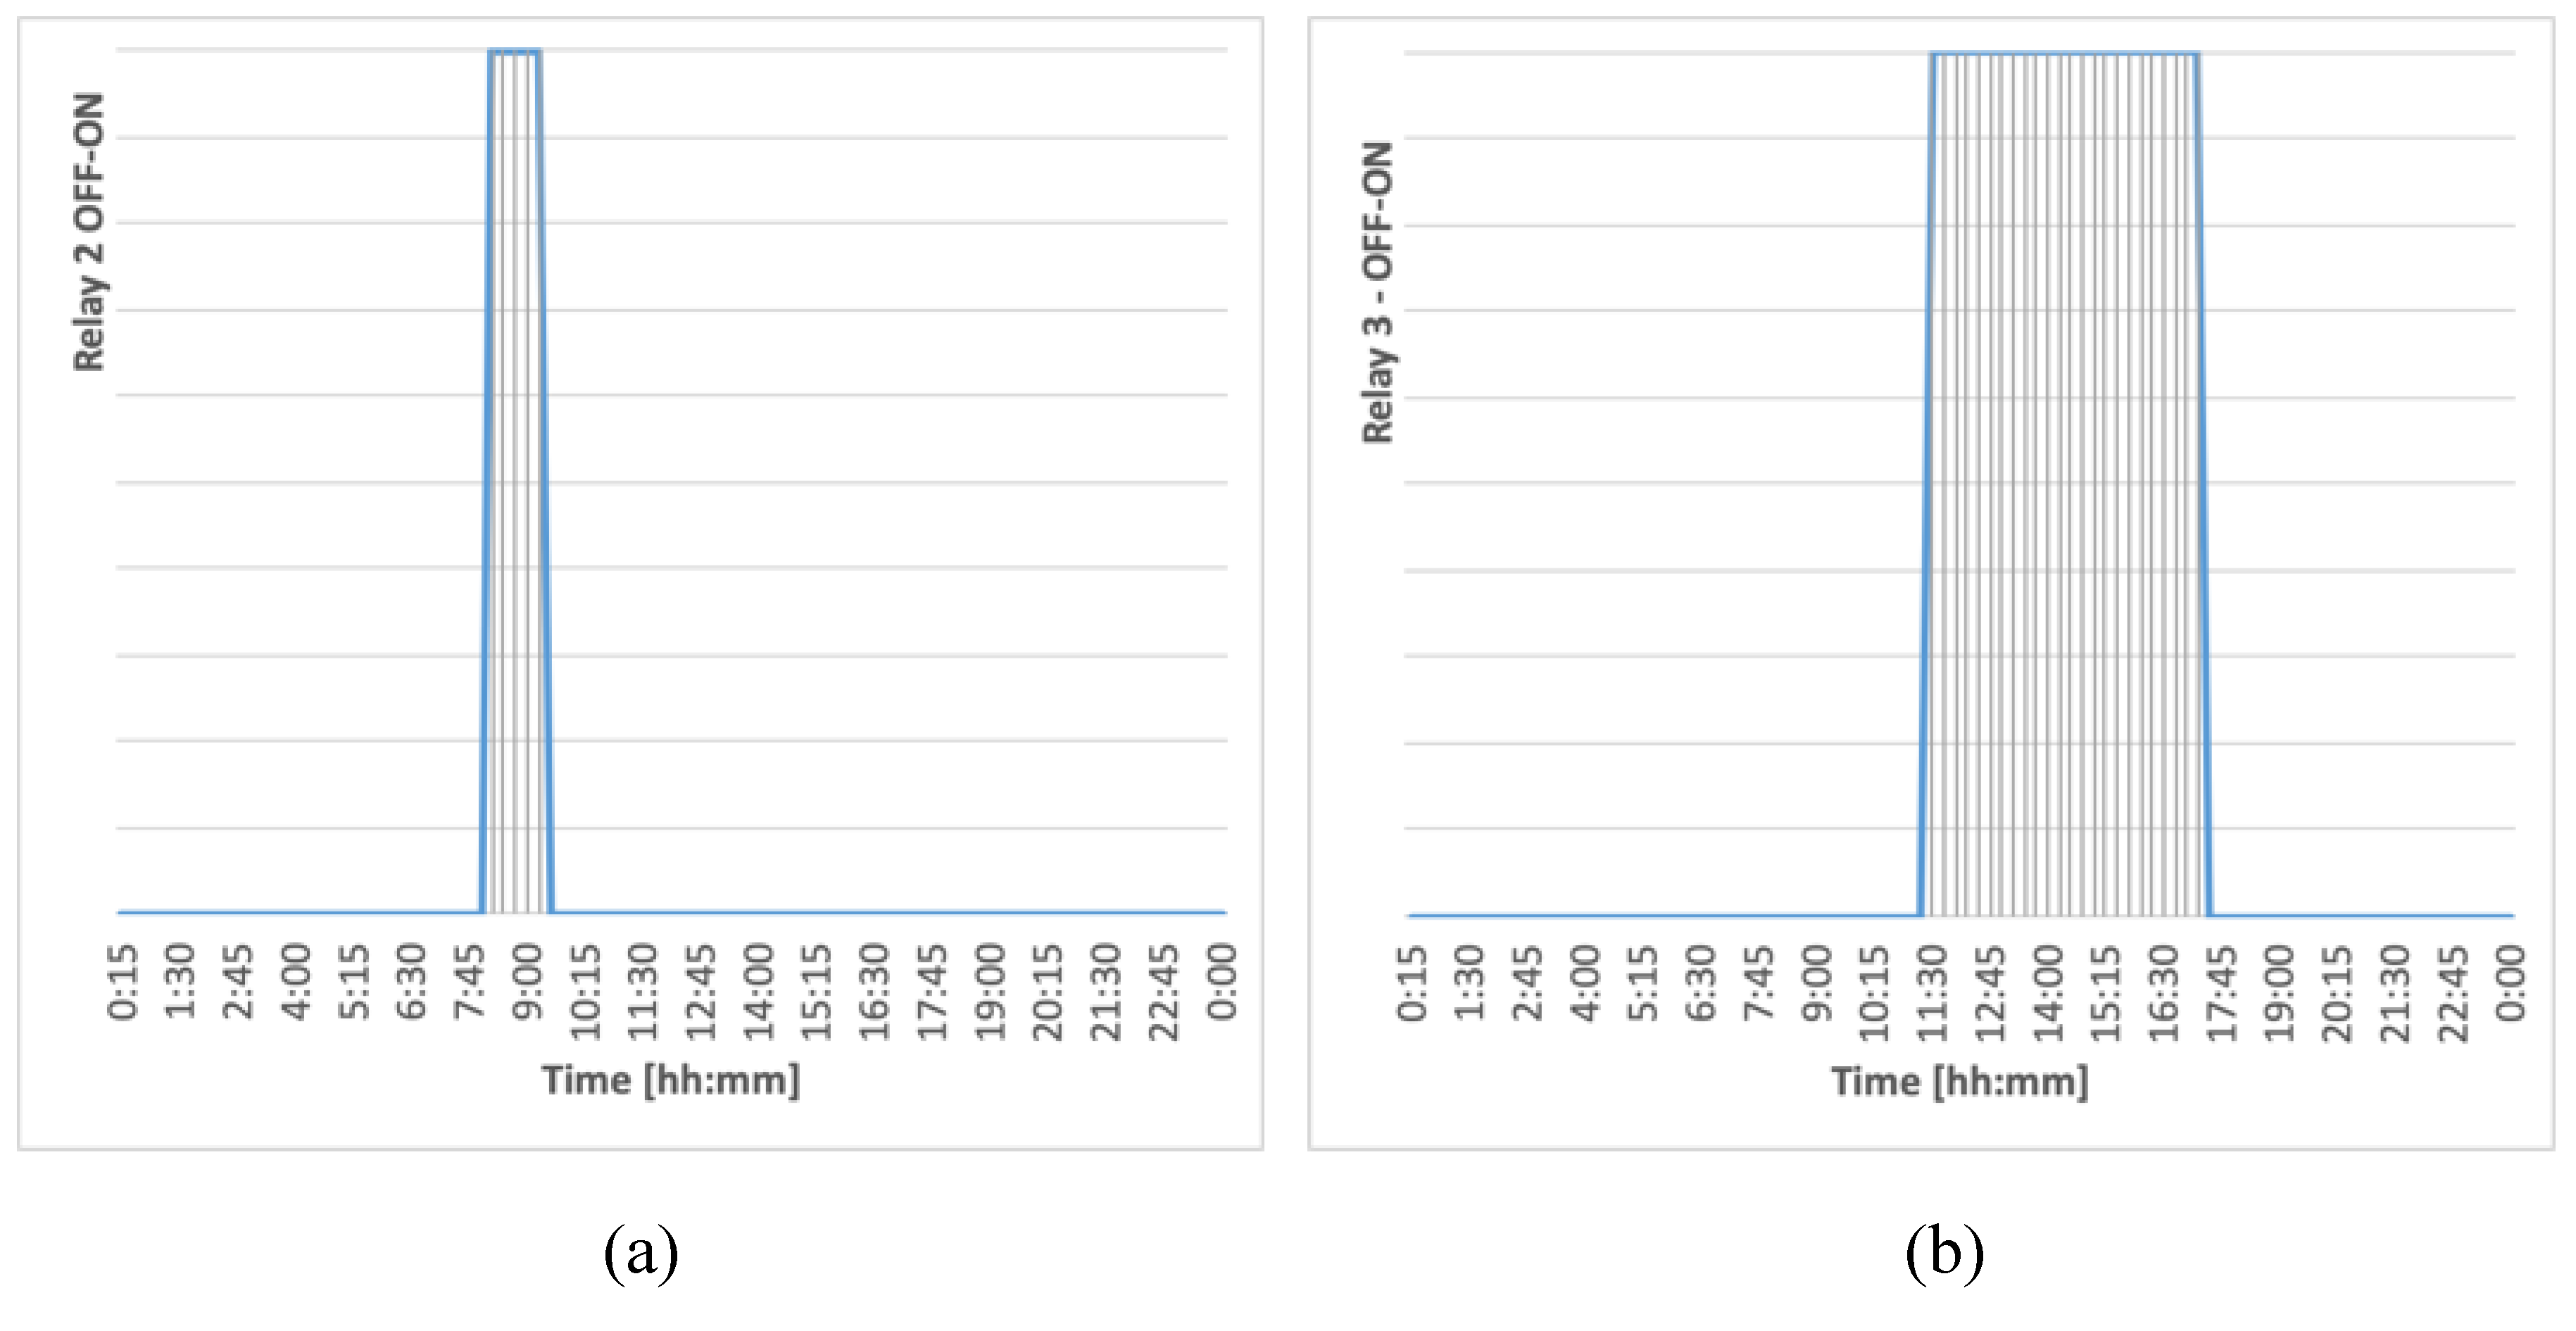
Figure 9a illustrates the operation of the EV battery. In this figure, it is possible to verify that battery was charged in periods when the grid price was low, and also that energy was obtained from the EV battery in the periods when the grid rates were high. It is important to highlight that, the EV battery was only available when the EV vehicle was plugged into the building grid, i.e., during working hours, from 8:15 AM to 5:15 PM, since it was used to take the building’s user to his/her home. This was the reason for the sudden increase in the morning when the user arrived at the building and the EV was available, and the drop in the afternoon, when the user left the building driving the EV to his/her home. In accordance with the above,
Figure 10a illustrates the operation of relay 2, which allowed connection for charging the EV battery.
Figure 9b illustrates the state of charge of the EV battery, confirming the correct modeling in this device, since it was observed that, for each period analyzed, the state of charge in a given period, respected the state of previous charge. In accordance with the above,
Figure 10b shows the operation of Relay 3, which allowed the connection to obtain the energy stored in the EV battery.
The OMEMS determined the consumption from the public grid, considering the hourly tariff, which allowed the obtainment of energy at off-peak hours. This can be seen in
Figure 7a, where the consumption peak occurred around noon. This consumption allowed charging both the ESS and the EV battery, before a significant increase of the tariff, as illustrated in
Figure 6. According to the results shown in
Figure 7a, the electricity cost of the analyzed period was €0.72, considering the value for a 24-h period in 11 December 2019. With regards to the hypothetical case of obtaining energy without considering the off-peak cost reduction, the electricity cost would be €1.51 (considering a tariff of €0.159/kWh). Hence, the OMEMS was able to reduce the electricity cost by 48.1%.
In contrast, the rule-based controller developed in [
5] was based on the assignment (in each time step) of the power flow needed to satisfy the demand, and in case of excess of power, to charge the batteries. This was achieved by means of control structures, which compared the resource states and the power demand. The sequence of these comparisons was carried out as follows, first, if the photovoltaic power exceeded the demand, this demand was entirely satisfied by using the photovoltaic power and the excess was designated to charge the ESS. If this excess was greater than the maximum charging power, or its state of charge (SOC) was above its maximum value, the remaining power was designated to charge the EV battery. If this power was greater than the maximum charging power or its batteries had plenty of charge, the remaining power was sold to the public grid. This sequence was invariable and hence, the controller did not consider issues like the feed-in tariff or the possible benefits of charging the EV within a given period of time. For its part, if the photovoltaic power was not able to entirely satisfy the demand, the deficit was provided by the ESS, when its SOC is above the minimum. When needed, an extra power is provided by the EV battery, if its SOC was above the minimum. If all these sources were not able to satisfy the demand, the power deficit was obtained from the public grid. Again, these rules were invariable and did not consider the possibility of prioritizing the use of grid energy over the batteries during off peak periods, in order to minimize the total energy costs throughout a given time horizon.
Therefore, after taking a look at the results obtained with the proposed OMEMS, it was possible to conclude that, the OMEMS was an alternative to the rule-based controller methodology that we previously developed in our work in [
5]. Specifically, these methods differed in the following aspects:
The methodology based on a rule controller was a mere approximation to the solution of the problem. OMEMS works based on classical simplex optimization, which allows finding an exact answer to solve the problem.
The OMEMS use binary variables, which required a simple algorithm with less code development and a reduction in the computational cost that delivers solutions in a short time.
Both, the modeling of the EV battery like the modeling of the ESS, were much closer to reality, since it considered variables like self-discharge rate, efficiency in the charging phase, efficiency in the energy injection phase, minimum values of stored energy, and the maximum capacity of stored energy.
The OMEMS used a time-of-use pricing scheme, where the price of electricity was tied to specific time periods, aiming to reduce the energy consumption in the peak hours and to encourage management of demand.
OMEMS can include the use of other energy renewable technologies like wind, as illustrated in Equation (2). This technology was not included in this work since the CIESOL smart building did not yet have a wind turbine.
The user could assign a percentage value of the charge of the EV battery for a specific one, indicating the amount of energy stored for the following day, or in case the user wanted to use the EV (it should be charged preferably to its maximum capacity). In
Figure 9b, it can be seen that at the end of the work hours, the EV battery was fully charged.
7. Conclusions
In this work, the development of an optimization model with binary and continuous variables is shown. This model required a simple code that delivered solutions in a short time. The CIESOL smart building, a bioclimatic building located at the University of Almería (Spain), was used a case-study to test the goodness of the proposed optimization model.
Analysis of the simulation results showed the stability of the OMEMS, when solving the problem. Maximization of the use of renewable energy was achieved, as well as minimization of the use of the grid, which also led to a reduction in electricity costs.
The OMEMS successfully scheduled relay 1, relay 2, and relay 3, improving the optimization process, achieving all objectives and surpassing the current state-of-the-art methodologies. Minimizing the total cost of the energy consumed by the smart building, in order to use less power supplied by the grid was carried out by using the methodologies described in this work, highlighting the use of a simple model that provided a better performance than the current state–of-the-art methodologies.
The OMEMS demonstrated the advantages of using classical optimization techniques to solve this specific optimization problem, compared to a rule-based controller. The linear modeling was capable of producing a simple algorithm with less code development and a reduction in the computational cost.


