Article

Study of Energy Compensation Techniques in Photovoltaic Solar Systems with the Use of Supercapacitors in Low-Voltage Networks

1
Department of Electrical, Electronics and Telecommunications Engineering (DEET), Universidad de Cuenca, Cuenca 010107, Ecuador
2
Department of Electrical Engineering, Universidad de Málaga, 29017 Málaga, Spain
*
Author to whom correspondence should be addressed.
Submission received: 11 June 2020 / Revised: 13 July 2020 / Accepted: 15 July 2020 / Published: 22 July 2020
(This article belongs to the Special Issue Photovoltaic Systems: Modelling, Control, Design and Applications)

Abstract

:
The power generated by photovoltaic solar systems is exposed to high variability of irradiance mainly due to weather conditions, which cause instability in the electrical networks connected to these systems. This study shows the typical behavior of solar irradiance in an Andean city, which presents considerable variations that can reach up to 63% of the nominal power of the photovoltaic system, at time intervals in the order of seconds. The study covers the application of 3 techniques to reduce power fluctuations at the point of common coupling (PCC), with the incorporation of energy storage systems, under the same irradiance conditions. Supercapacitors were used as the storage system, which were selected for their high efficiency and useful life. A state of charge control is also applied by means of a hysteresis band. The three algorithms studied show similar behaviors; however, the ramp control technique has the best performance. The storage system was dimensioned based on the photovoltaic system’s nominal power and the desired rate of change in the PCC, whose capacity can be estimated from Pnom/12 [kWh] and a maximum power that can reach up to 0.63 Pnom. The study determines that based on the storage capacity and the irradiance characteristics under study, the storage system could use at least 5.76 daily charge/discharge cycles. In the study, it is possible to reduce the rate of change of the photovoltaic energy injected into the PCC about 6.66 times with the use of the proposed energy storage system.

1. Introduction

Energy plays a fundamental role in the development of countries and regions. However, at the same time, it is one of the most polluting sectors. In the last decade, society’s energy needs and environmental pollution have increased steadily. Global primary energy consumption went from 11,540 × 106 toe in 2009 to 13,865 × 106 toe in 2018 [1], with a fossil fuel contribution (oil, natural gas, and coal) higher than 85%. In that same period, CO2 emissions went from 31,532 Mt to 36,573 Mt. At least 30% of these emissions correspond to electricity generation [2]. This fact has prompted many countries to make use of renewable energy as sources of electricity generation, reducing the use of fossil fuels. Among the most important renewable sources of electricity generation, in terms of capacity, is hydroelectricity, with 54% of total renewable sources and a growth rate of 2.4% per year [3]. However, the lead of hydropower could change soon due to the high growth rates of non-conventional renewable energy sources, such as wind power and solar photovoltaic energy. The latter has experienced the highest sustained growth in the last 5 years with a rate of approximately 25% per year [4]. In the last decade, these unconventional renewable energies have taken a leading role in the generation of electrical energy in the world, not only for their environmental benefits, but also for the marked reduction in electricity generation costs, improving their competitiveness compared to other conventional sources [5].
Photovoltaic (PV) energy has experienced sustained growth since a high number of photovoltaic solar farms are being installed to provide energy to both local and remote loads in several high energy consumption countries, such as China, the USA, Spain, and Germany [6]. The size of these systems can vary according to the generation capacity, from a few Kilowatts to tens of Megawatts [7]. Additionally, the development of distributed PV systems for residences, commercial buildings, and industries has been notorious, tripling its capacity since 2014 [8].
Despite the benefits of PV generation regarding its renewable origin and fully scalable character, considerable penetration can cause different kinds of problems in the electricity grid [9]. In this sense, dynamic and impact studies are necessary at specific time intervals that allow us to know the incidence of fluctuations of PV power in the network [7] since, without the typical mechanical inertia of conventional electromechanical generators, variations in voltage and frequency can occur in the system. Case studies indicate that the optimal level of penetration of a PV system at a node, defined as the ratio between the generation of photovoltaic energy connected to a node over the energy load capacity at the node, could be close to 40% in order to avoid stability problems in the system [10]. Although most of the studies are related to high-capacity systems, also in the case of small PV systems connected to low-voltage networks, power quality problems can occur depending on various factors, such as atmospheric conditions of radiation and cloudiness, as well as the location of PV systems within the low-voltage network [11].
This problem of PV systems’ power quality arises mainly from the non-deterministic nature of solar radiation, which can show variations in the order of hours, minutes, and even drastic changes in seconds, causing fluctuations in the output power of the photovoltaic systems [6]. The problem of power fluctuations in photovoltaic systems can be addressed from various points of view, such as: control techniques that make the power converters operate in a certain way, incorporation of more effective meteorological prediction techniques, or the incorporation of temporary energy storage systems that help reduce power variations at the point of common coupling (PCC) [12]. In the case of the use of control techniques on DC/AC converters, it is possible to establish energy management algorithms that prioritize the rate of change of output power, making the variations of the energy injected into the grid to have a lower slope. These algorithms would replace the commonly used maximum power point tracking (MPPT) algorithms, but the overall efficiency of the system would be reduced.
Recent studies reveal that the efficiency of photovoltaic solar systems can be improved by various methods. For example, with the incorporation of solar concentration systems such as those studied in [13] or solar-tracking systems with bifacial panels that can increase efficiency by up to 35% [14] and achieve a lower energy price in most of the world. However, it is important to note that if systems with greater efficiency are available, they are also subject to fluctuations in solar irradiance. To reduce power fluctuations in the PCC these systems could sacrifice their overall efficiency. This efficiency issue, which is outside the scope of this paper, requires a rigorous techno-economic study that justifies the investment.
In the case of real-time irradiance prediction systems, studies such as [15] allow the determination of the behavior of cloud cover near the sun, and thus anticipate its impact by reducing fluctuations in power generation. Finally, the most studied solutions incorporate energy storage systems that allow fluctuations to be reduced without a significant decrease in the efficiency of generating PV solar energy. However, this solution has disadvantages that must be evaluated from the economic point of view as it incorporates equipment that has considerable costs and affects efficiency in the energy storage process.
From a regulatory point of view, fluctuations in the energy of a PV solar system can cause instability in the grid, and several countries have established policies that limit the technical aspects of the use of these systems. One of the measures considers setting limits to the rate of power variation when solar systems are connected to the interconnected power system. These variations, commonly called ramp-rate, can be defined as a percentage of the PV plant nominal capacity, or power limits in minute or second intervals can also be set. For example, the Irish Electric Company (EirGrid) sets a ramp of up to 30 MW/min, the Hawaii Electric Company (HECO) sets a ramp of ± 2 MW/min, and the Puerto Rico Electric Power Authority (PREPA) considers a maximum ramp of 10%/min of the nominal power of the plant. Other regulations limit variations in the order of seconds; this is the case of Denmark, which allows a maximum power of 100 kW/s [12,16]. Taking into account the case of Puerto Rico, for example, the power variations present a time base of 1 min. However, the control actions must be carried out at smaller intervals in order to meet the desired rate of change.
Regardless of how fluctuations are to be reduced, stationary energy storage systems will increasingly play a leading role. In fact, energy storage is a dominant factor in the integration of renewable sources, which plays an important role in maintaining a robust and reliable modern electrical system [17]. In this sense, the storage systems may play different roles. For example, time shift energy storage systems, which store energy in periods of excess generation of renewable energy to be used in times of increased demand, will be able to fulfill system stability functions simultaneously.
Some research has been carried out to reduce fluctuations in the energy delivered to the grid with electrochemical-type energy storage systems, for example: lead-acid and lithium-ion batteries, as in [18] for their cost advantage. Recently, the integration of lithium-ion types electrochemical batteries with supercapacitors (SC) has also been studied, due to the life cycle characteristics and efficiency the latter present [6].
Other studies related to the improvement of energy quality due to the fluctuation of solar irradiance suggest the use of hybrid systems with photovoltaic solar systems and concentrated solar systems, which allow the generation of heat and then electricity, reducing fluctuations in power injected into the PCC [19]. Although these systems allow for considerable improvement in power quality, they belong to a currently emerging technology and have been tested in non-compact applications in the hundreds of megawatt range, so that they are economically profitable, in addition to having mobile parts for pumping systems. These systems could have a shorter useful life, which could still be at a disadvantage compared to solutions based on supercapacitors with a longer useful life. The solution proposed in this study allows for smaller scale systems within the framework of a distributed generation with greater scalability and considerable economic benefits.
This study presents an evaluation of the dynamic behavior of the energy produced by a solar PV system in the face of changes in irradiation caused by the typical cloudiness of the Andean mountains. For this, the application of techniques to reduce power fluctuations in the PCC is shown with the incorporation of an SC energy storage system, in which 3 control techniques to the power converters of the energy storage system are studied. The unique contributions of this paper are:
(a)
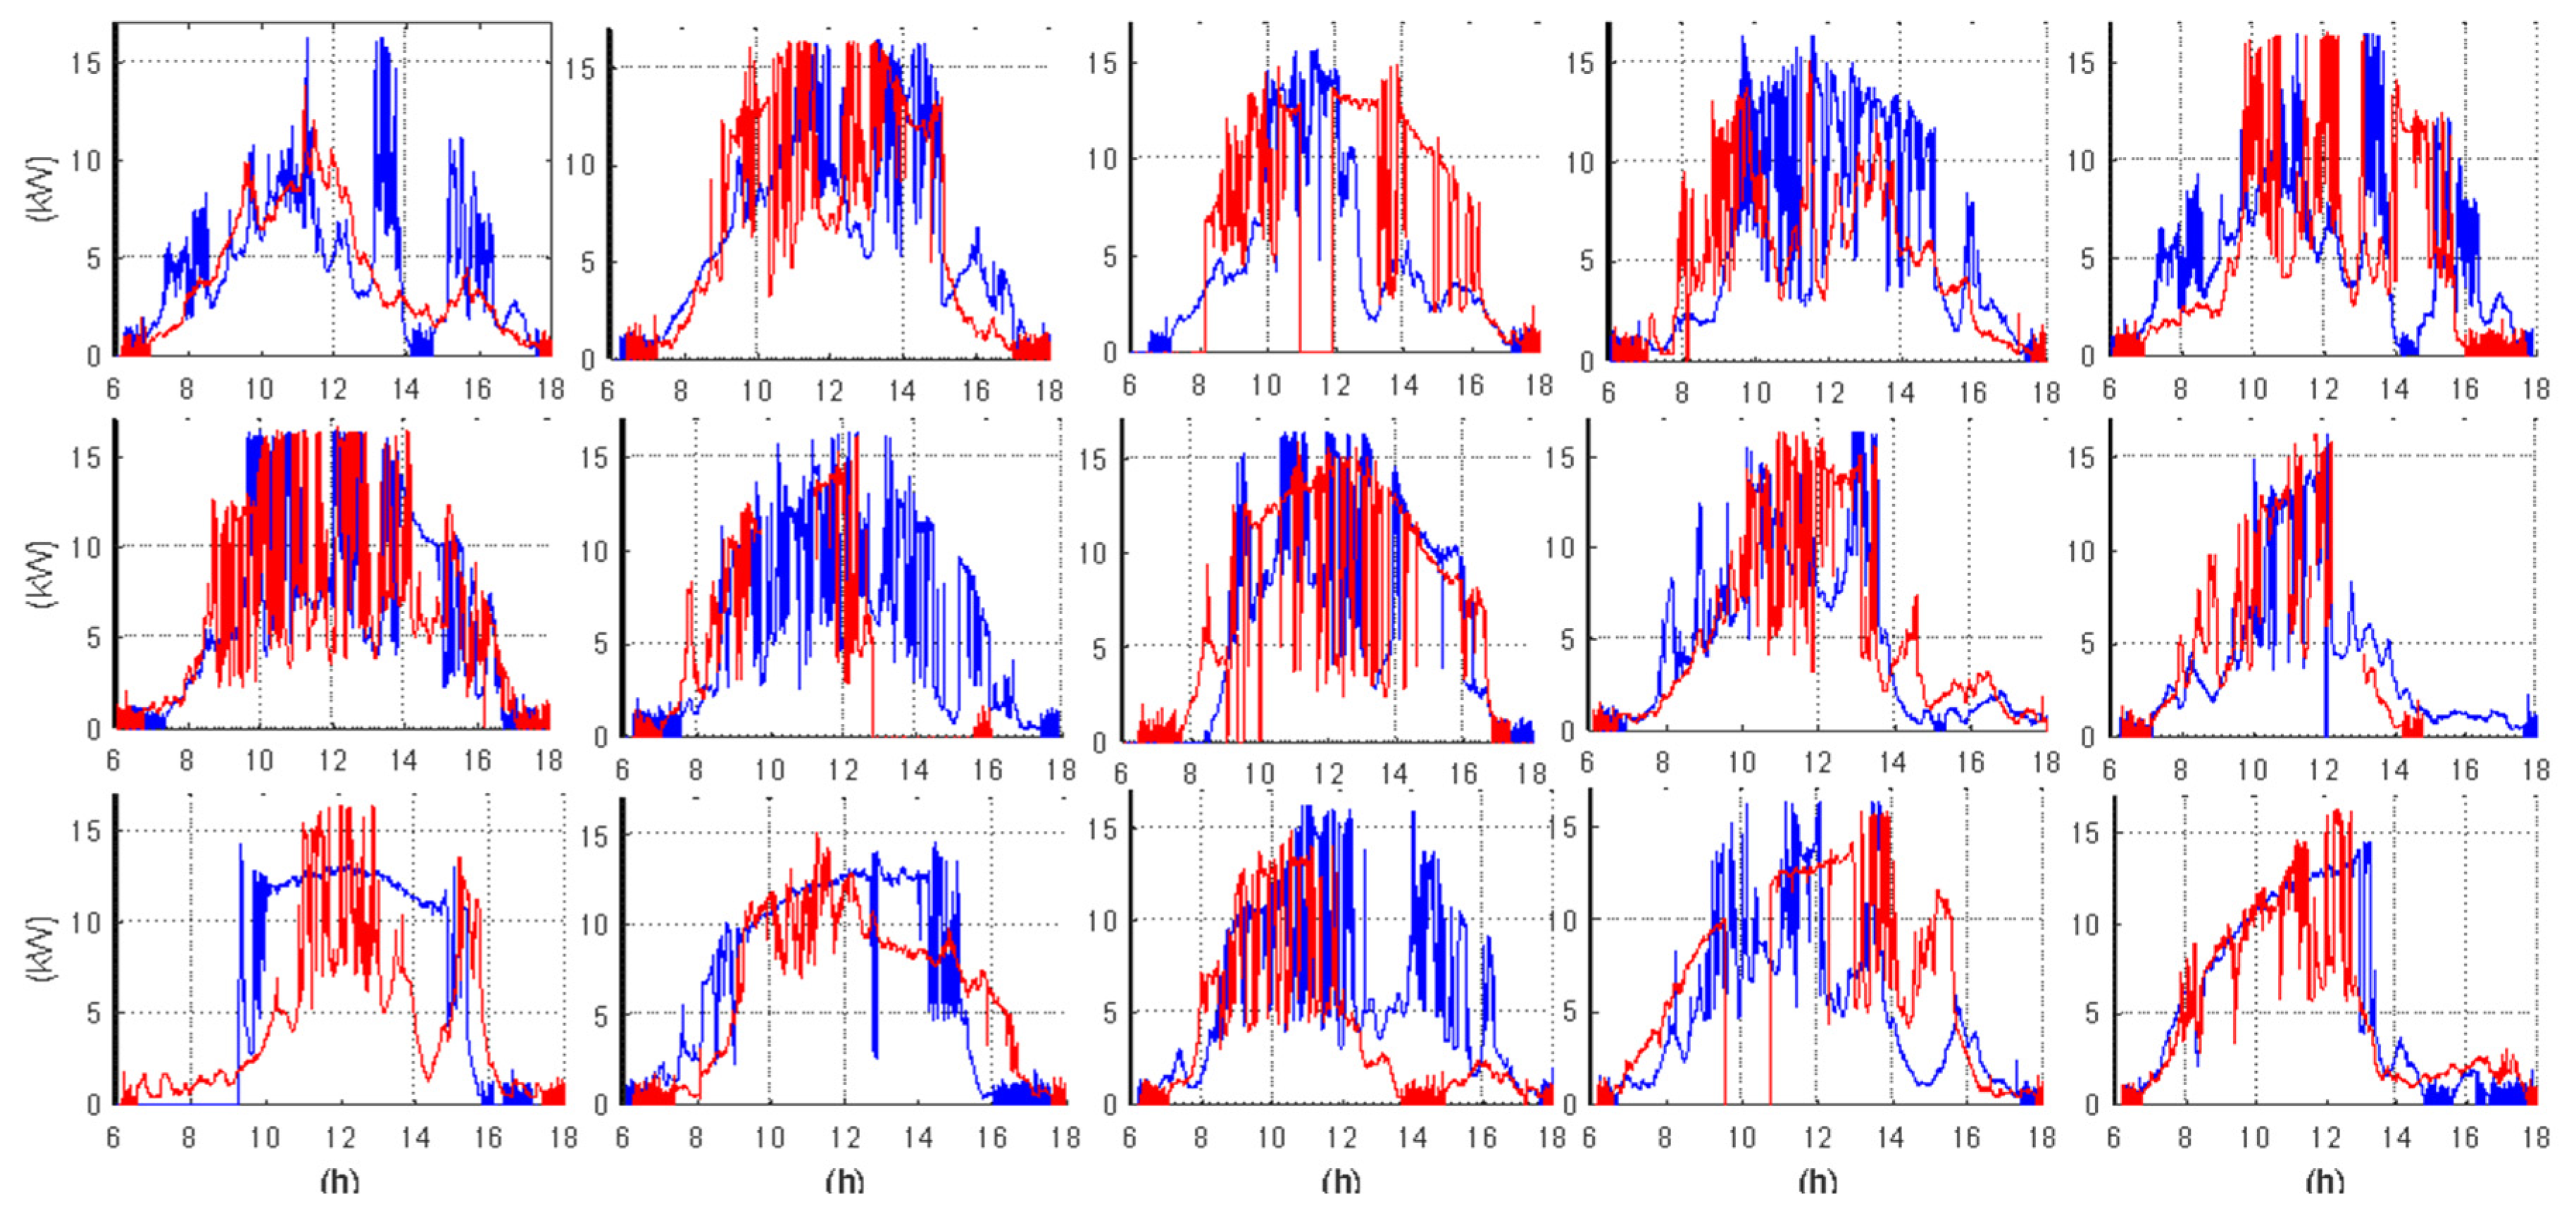
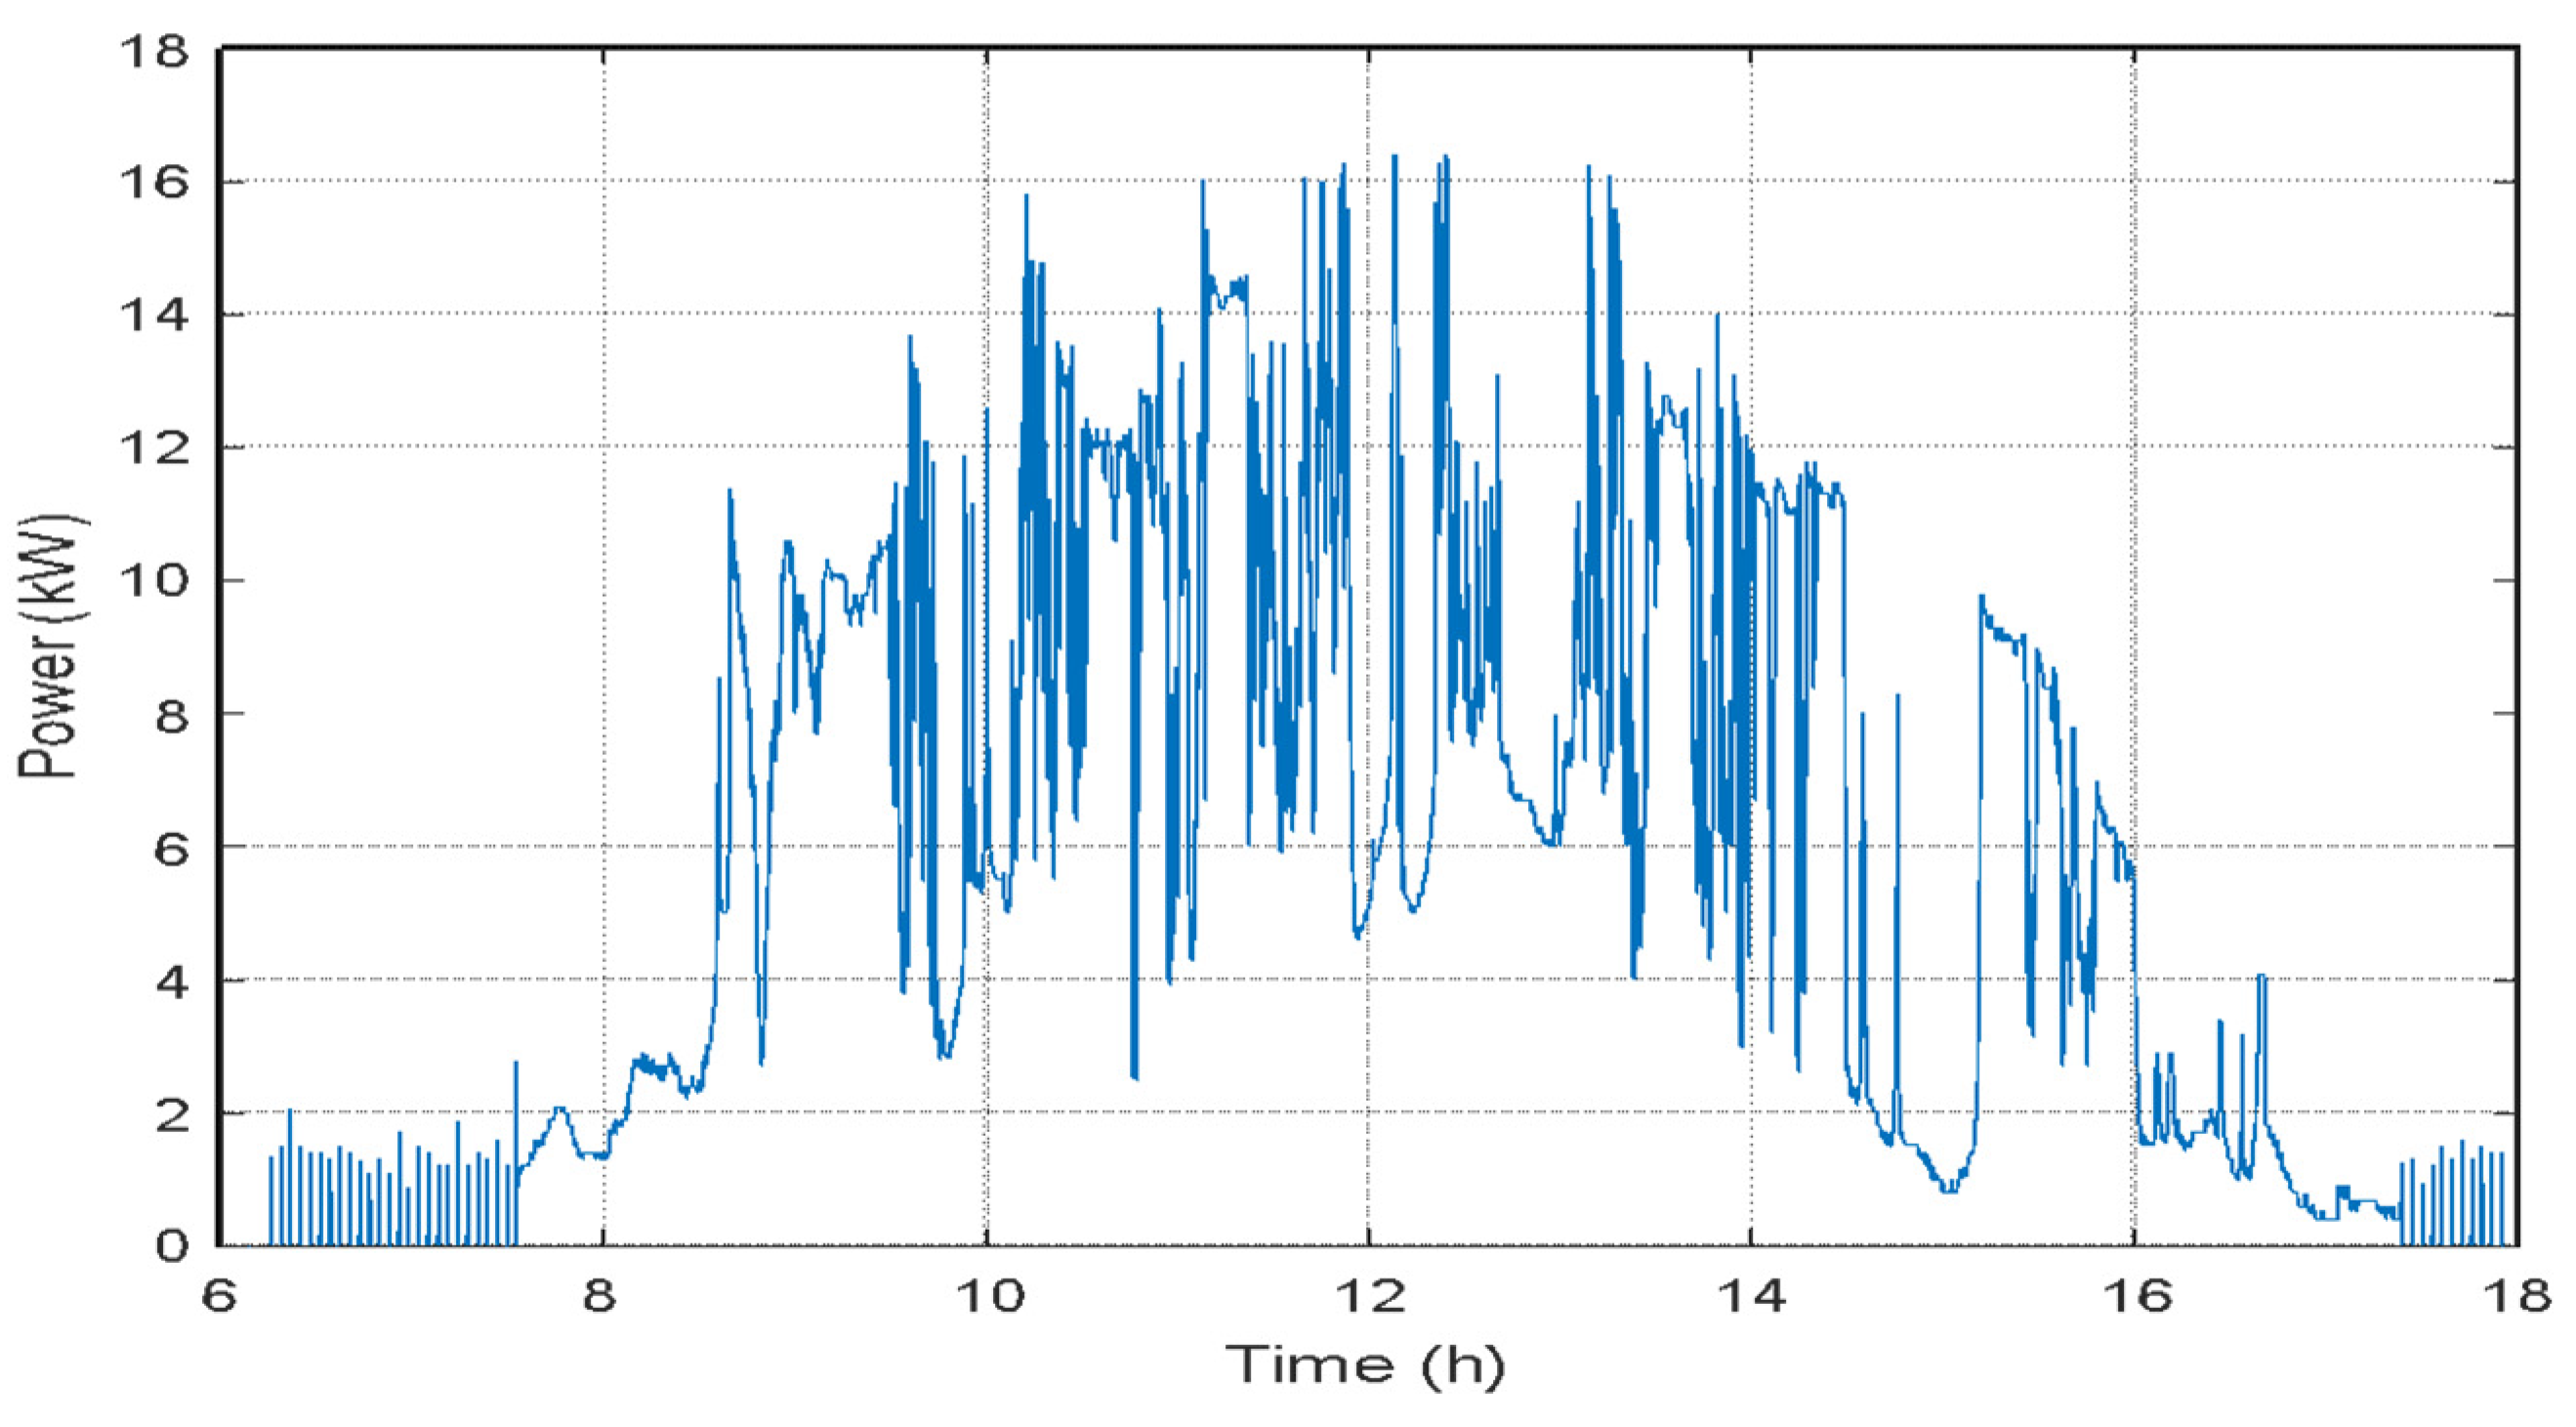
Study of the dynamic behavior of solar irradiance in the Andean city.
(b)
Determination of the energy storage capacity with the algorithms proposed for Ecuador’s case study.
(c)
Application of a slow control system to control the state of charge (SOC) of the Supercapacitors.

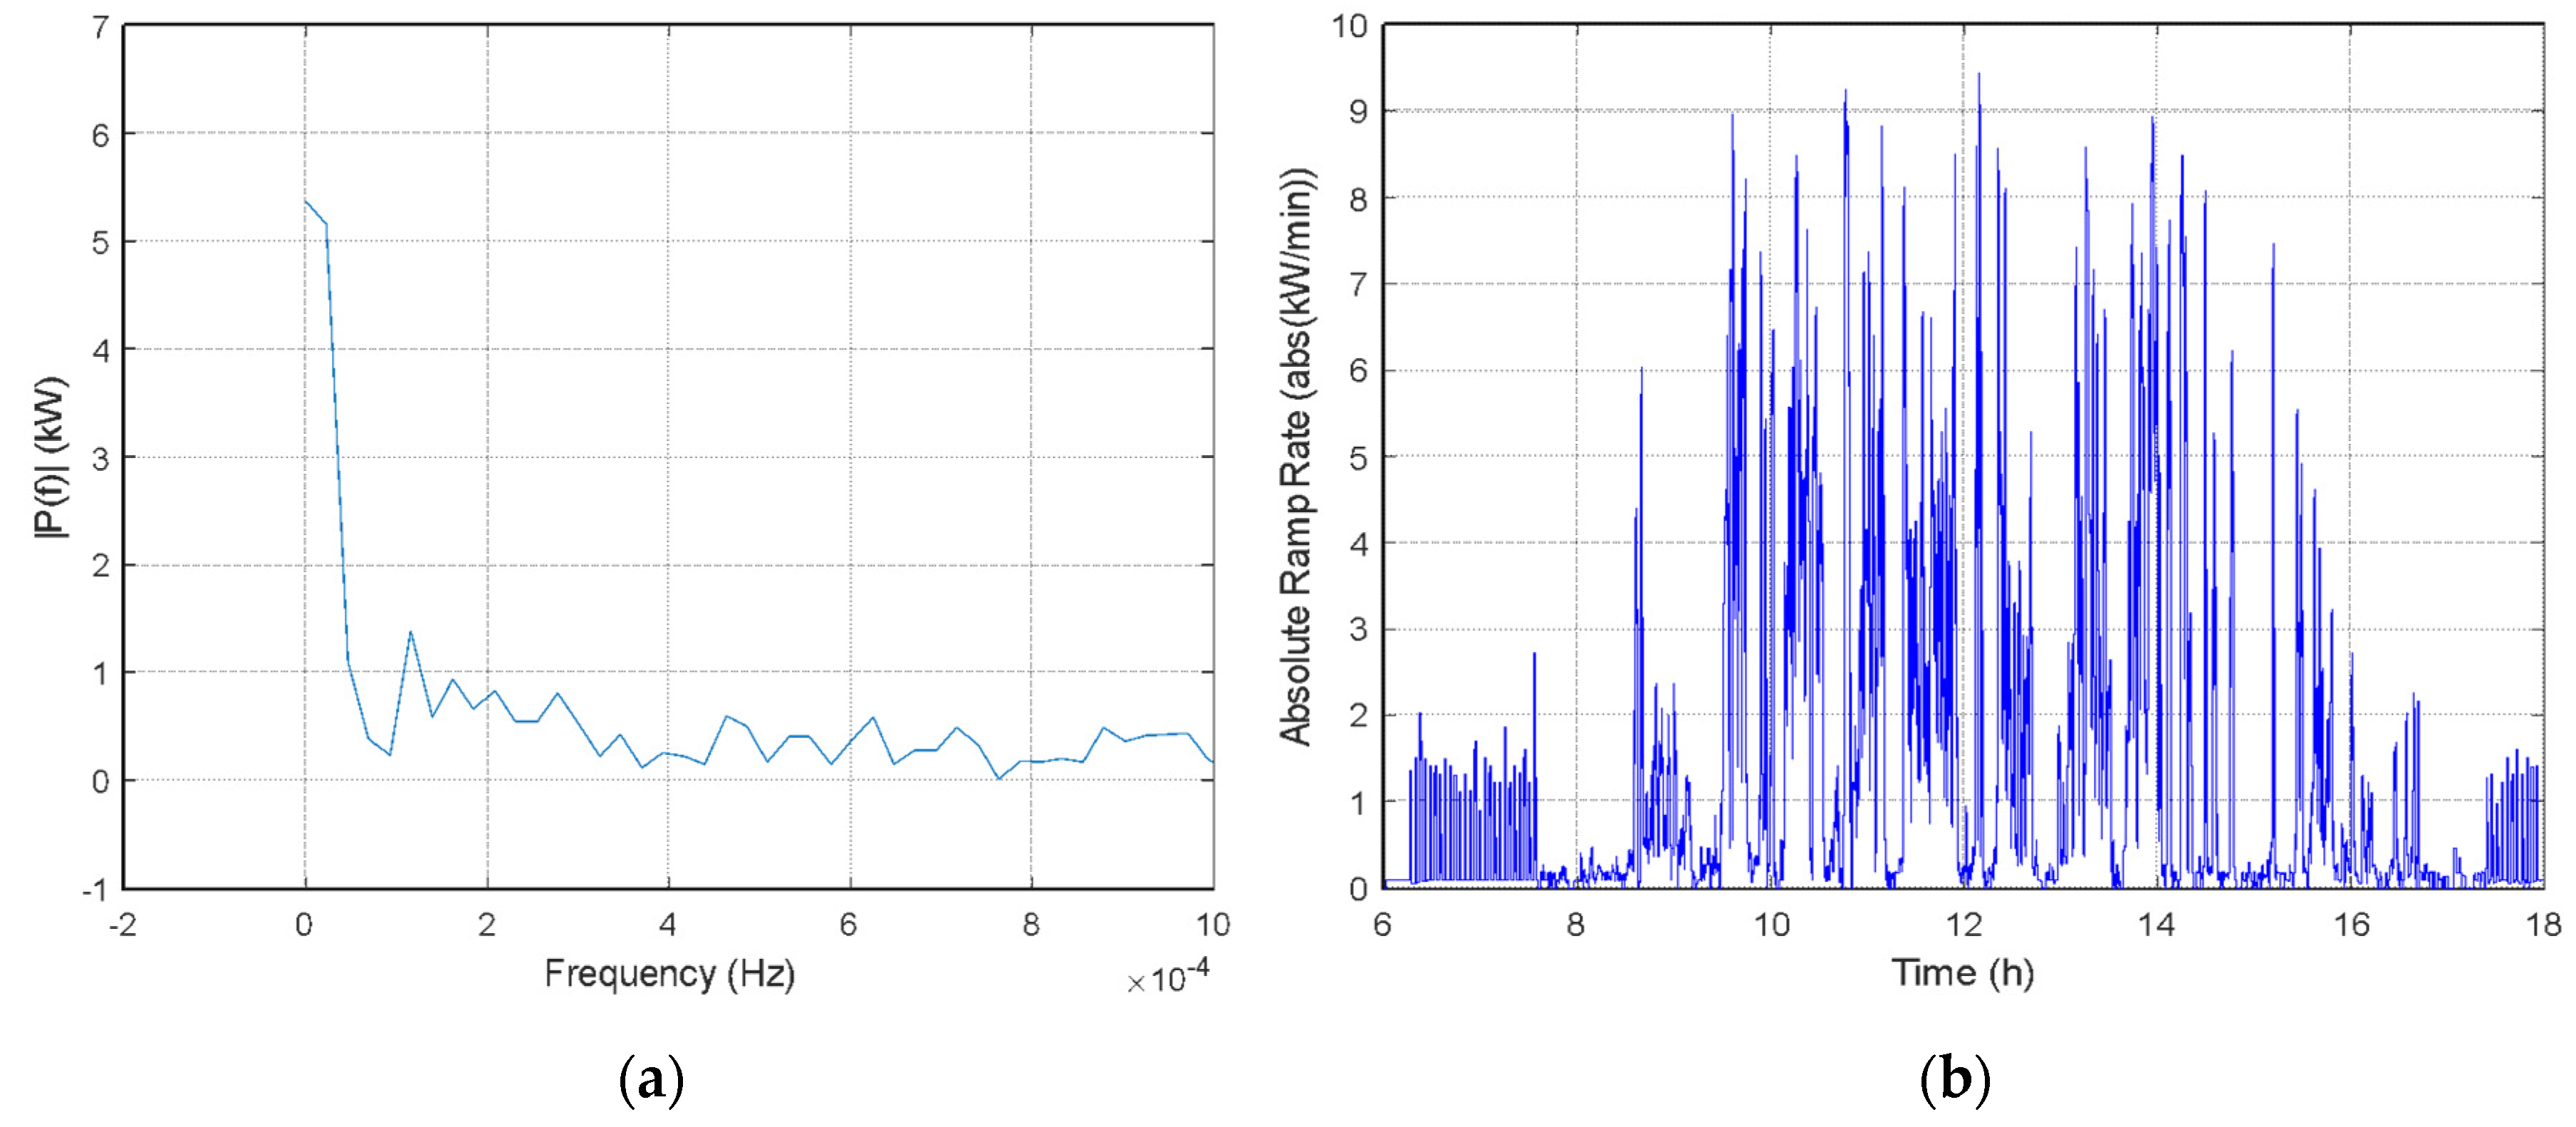
2. Photovoltaic Power Fluctuations

PV systems transform solar radiation into electricity. These systems present a correlation between the radiation incident on the surface of the solar panels and the power generated by them. The main factor that causes fluctuations in the output power is related to the atmospheric conditions, mainly the density of the cloudiness present between the surface of the panel and the sun [7].
The energy that can be extracted from a photovoltaic solar energy system depends on multiple factors, among which the point of operation of the solar panels within the characteristic curve I–V stands out. To extract the maximum power from the array (PV Module + DC/AC Converter), it is necessary to use maximum power point tracking (MPPT) techniques. This method seeks to extract the maximum energy from the system in the face of variations in weather conditions [20].
There are different MPPT algorithms, such as: perturb and observe (P&O), incremental conductance, fractional open circuit voltage, fractional short circuit current, fuzzy logic control, among others. Although these methods are implemented for the same purpose, they differ markedly in complexity, speed of convergence, steady-state oscillations, cost, effectiveness, and flexibility [20].
Today, the most widely used MPPT algorithms are P&O and incremental conductance due to their simplicity and effectiveness. In practice, these algorithms can achieve an efficiency higher than 98% [20]. The dynamic behavior of the irradiance on the collection surface can fluctuate with periods in the order of hours, minutes, or seconds. This depends fundamentally on the opacity, size, and speed of the clouds, with non-typical behaviors such as those shown in Figure 1. Herein, the daily behavior of the irradiance in the interval between 6:00 and 18:00 during 28 days of study is observed. These data come from the weather station available at the University of Cuenca’s microgrid laboratory (Campus Balzay) [21], located in the city of Cuenca, Ecuador, in the Andean mountain range at an altitude of 2625 m.a.s.l. with coordinates (−2.892009, −79.038481).
The typical meteorological behavior of Cuenca, as an Andean city, presents considerable weather changes with two rainy seasons (March–April, and October–November), and the dry season between June and July, which influence the behavior of irradiation and temperature [22]. From the point of view of variation in cloudiness and wind speed, August presents the highest proportion of partially cloudy conditions and the highest wind speed [23], an aspect that significantly affects irradiance variations. Figure 2 shows the behavior of the photovoltaic solar generation of the system under study, which has a nominal capacity of 15 kWp. The behavior shown presents a wide range of continuous variations throughout the day due to the high cloudiness typical of the Ecuadorian Andean zone. This information has been chosen to apply fluctuation reduction techniques.
Studies regarding the dynamic behavior of daily solar irradiance indicate that the high-frequency spectrum can be between (0.001 Hz < f < 0.05 Hz) [24], an aspect of special interest since these high frequency dynamics are responsible for the abrupt energy variations injected into electrical networks. These studies have been carried out with classical frequency analysis techniques such as Fourier series, wavelet series, and wavelet transform [25]. Figure 3a shows the spectral behavior of the energy of the photovoltaic solar system shown in Figure 2, where the spectral component reflects that the highest energy is found for frequencies less than fc < 0.0002 Hz, a value considerably lower than that studied in [24]. However, the spectral behavior of the present study shows similarities to the spectrum found under real conditions in [26]. Figure 3b shows the rate of change of the dynamics under study, which can reach up to 9.5 kW, which constitute considerably high variations in intervals less than 15 s.

3. Methodology

This research is based on the modeling and simulation of a PV energy generation system and a bank of supercapacitors available at [21], integrated by an algorithm that reduces the power fluctuations of the system in the face of the dynamic behavior of solar irradiance in the study area. In the present work, 3 control techniques studied in [27,28] are compared and they are applied to the power converters of the storage system, in order to reduce the variation of power fluctuations within pre-established limits. The techniques studied are: (1) the Ramp Speed Control algorithm, (2) the reference technique based on the Low Pass Filter (LPF), and (3) the fluctuation reduction based on the Moving Average algorithm. To make the comparison, the algorithms were tested against the typical behavior of solar irradiation of the study area. The modeling was developed using the software Psim®, from actual behavior of available equipment.

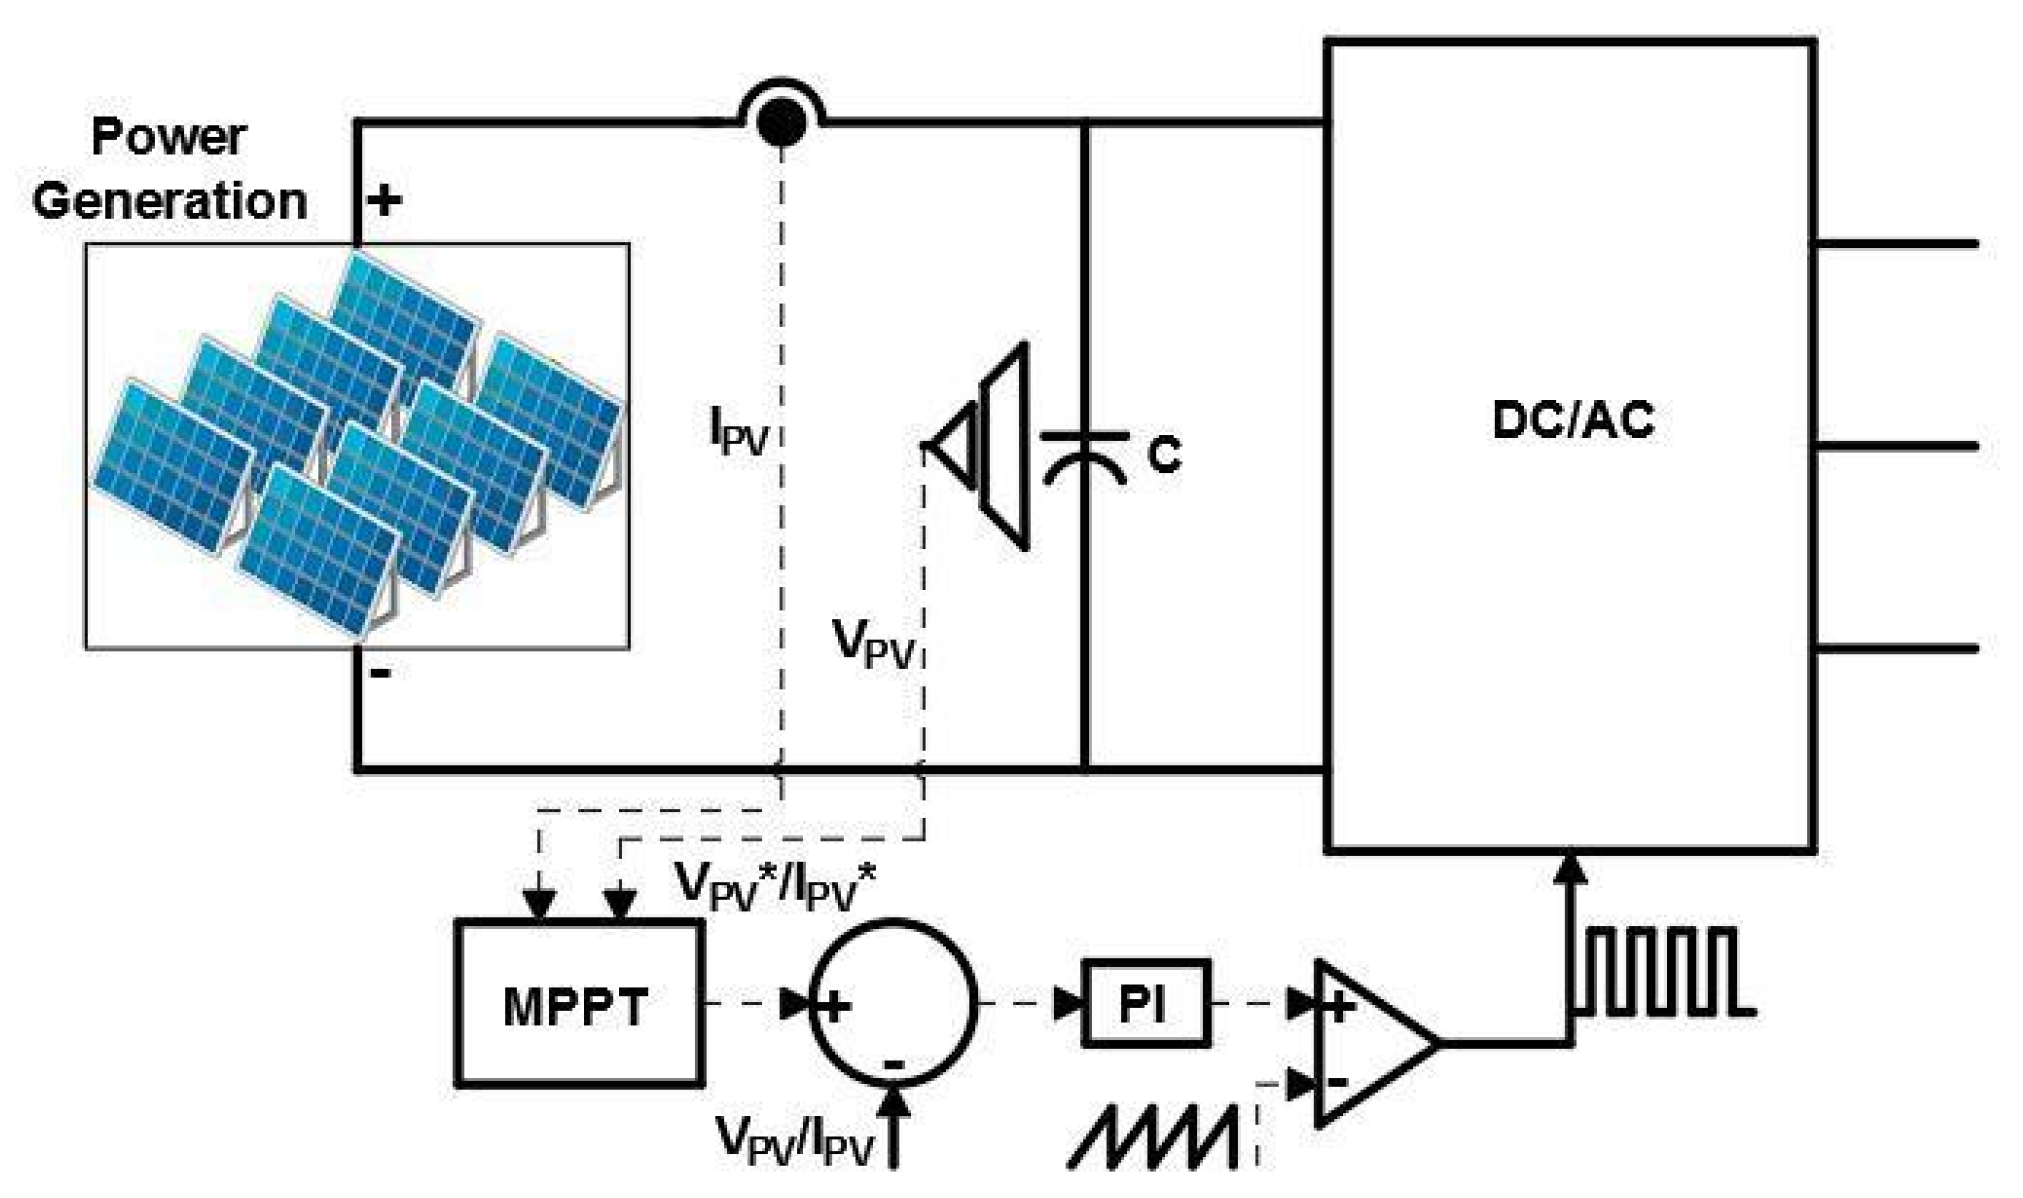
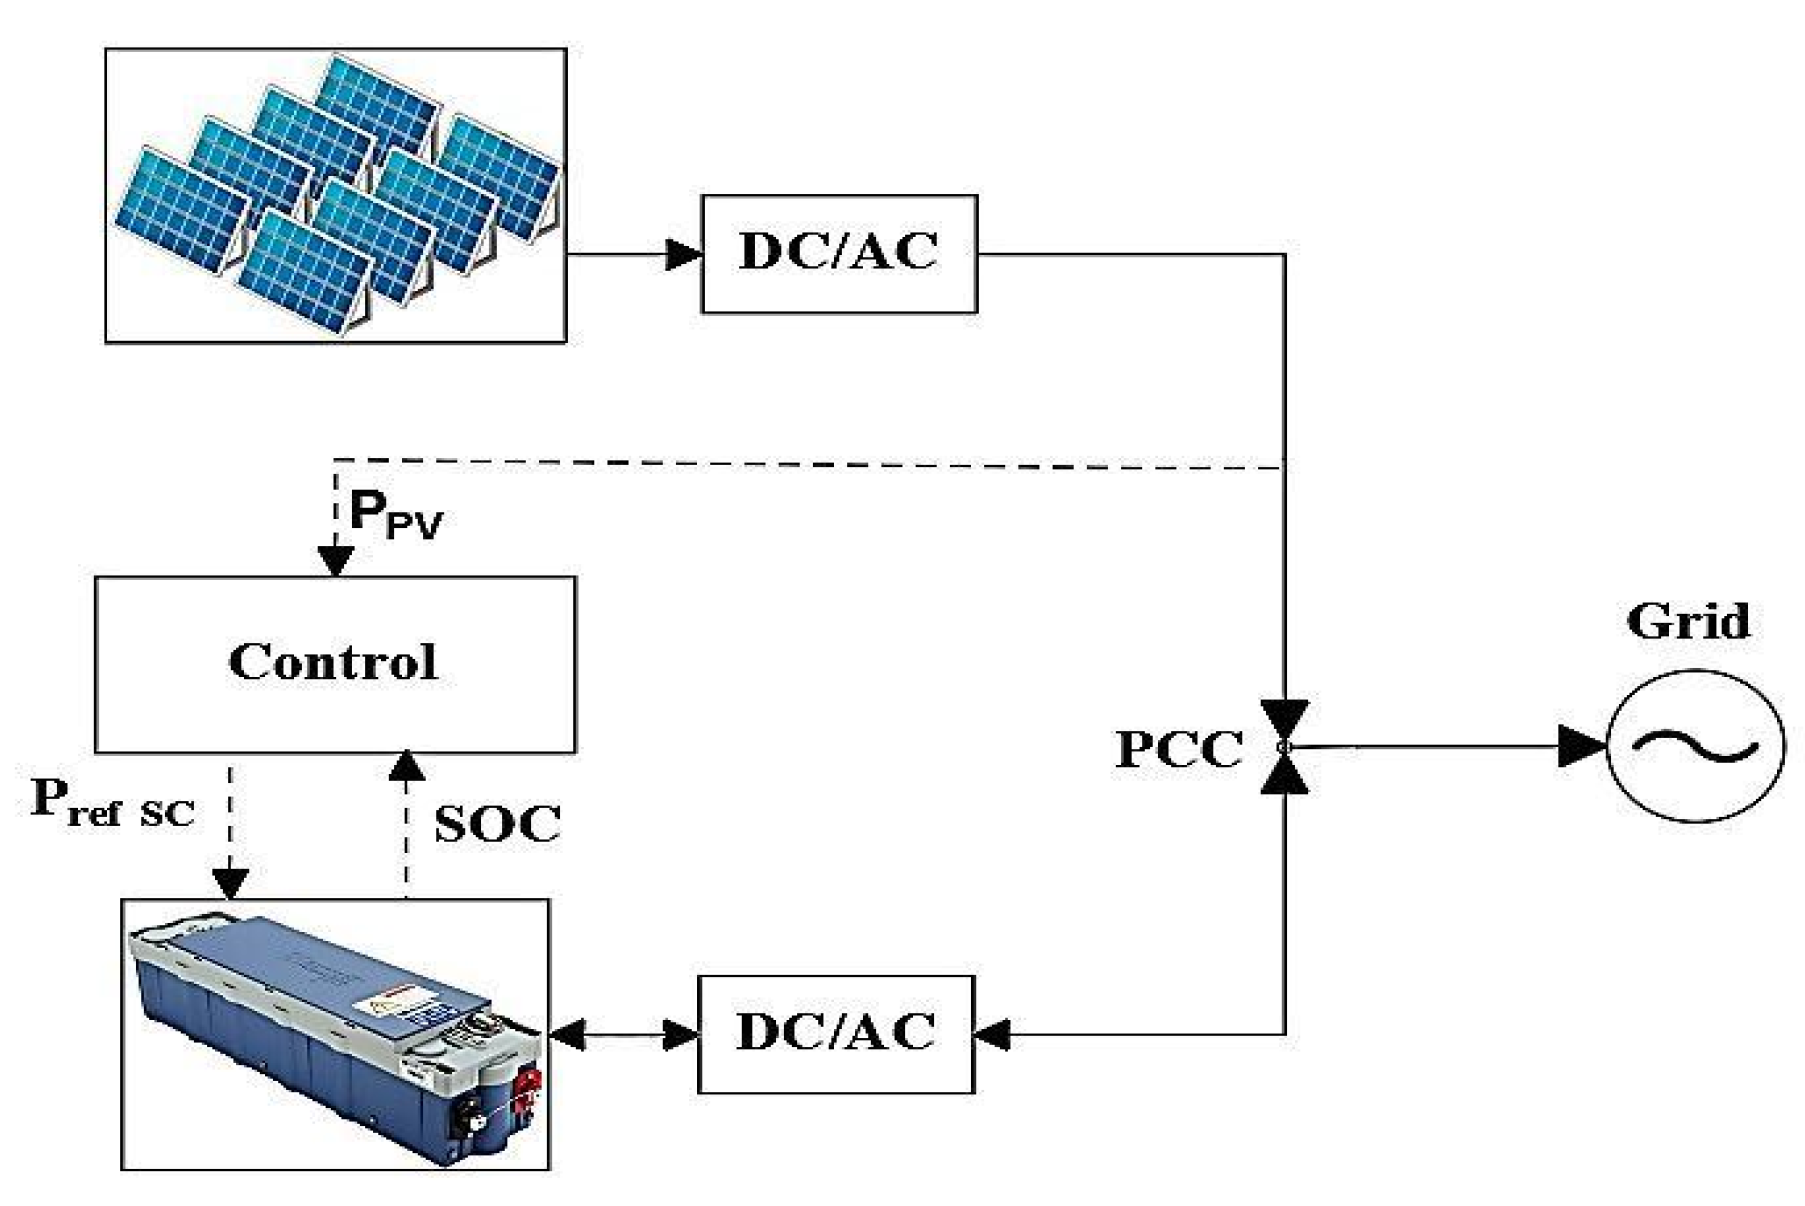
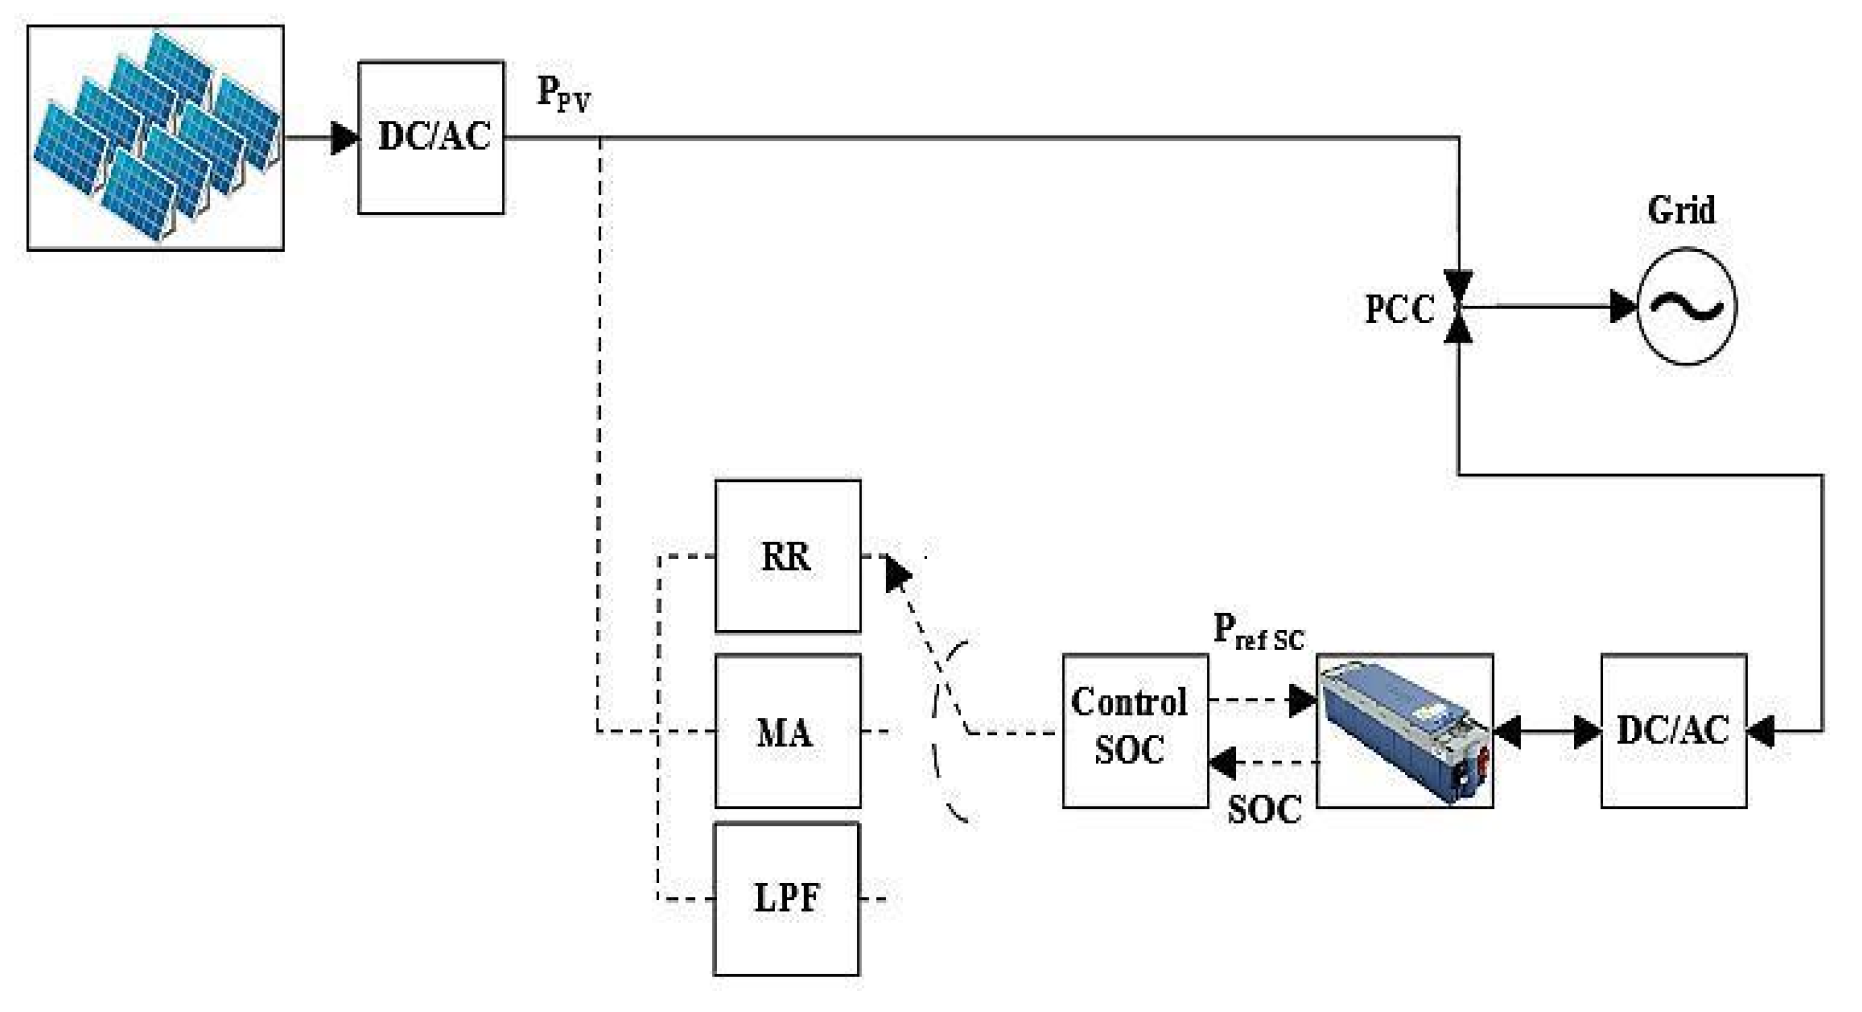
Description of the System under Study

In relation to the photovoltaic solar generation system under study, the equipment used is that which is available in the University of Cuenca´s microgrid laboratory [21]. The PV system has 4 strings of 15 panels in series of the poly-Si type, each panel with a nominal power of 250 Wp, model A250P from manufacturer Atersa, to reach a nominal power of 15 kW for the system. The array is driven by a 3-phase, 2-level DC/AC converter with pulse-width modulation (PWM). Figure 4 shows the system’s operating diagram, which delivers power to the PCC.
In relation to the storage system to be used, the present study applies the techniques for reducing energy fluctuations in the PCC with the use of electric-type storage systems with supercapacitors. Among the most important characteristics of supercapacitors are a superior useful life and higher efficiency than electrochemical batteries, an aspect that in this application is of special interest due to the continuous power variations of the PV system in the PCC. In comparative terms, supercapacitors have a useful life of more than 1 million charge–discharge cycles [29], representing a value considerably higher than that offered with lead acid battery systems, which can reach about 1500 cycles or LiFePO4 batteries between 3000 and 5000 cycles also used in this type of application [30].
The bank of supercapacitors used has a capacity of 39 F and is sized in Section 4.4.1. It is built with 3 parallel strings, and each string has 10 supercapacitor modules connected in a series of 130 F of the Maxwell model BMOD0130. In the bank, the maximum operating voltage is 650 V and the usable energy is limited by a range of voltages managed by the DC/AC converter, which is 440 V < VSC < 600 V. The lower limit is subject to the amplitude modulation index of the converter to operate in a linear regime and the upper limit governed by the maximum voltage allowed by the set of supercapacitors. In this operating range, a useful energy of 901 Wh is obtained, out of the 1.95 kWh that in theory can be used if working in the range 0 V < VSC < 650 V. The energy storage system (Supercapacitor Bank + DC/AC Converter) has a capacity of 30 kW and an energy processing performance of over 90% [31]. Regarding operation dynamics, the control system presents a response time close to 0.5 s, subject to the typical delay of communication and information processing in the available control system. In this case, if the solar generation capacity is 15 kWp, the maximum rate of change used in this study reaches |RR| < 1.5 kW/min.
This study compares the 3 algorithms indicated above that seek to mitigate the rate of change. The algorithms have been adjusted so that the power variations do not exceed the desired limits under the premise of avoiding a change greater than 10%/min of the system’s nominal power. This criterion is in accordance with the regulations adopted by PREPA, since the Republic of Ecuador has no regulations in this regard. To the system previously described and shown in Figure 4, the supercapacitors storage system has been incorporated, which has the function of absorbing or supplying the energy necessary to reduce instantaneous variations in the energy injected into the network. All the methods studied supply a reference signal to the storage system, as represented by the scheme shown in Figure 5. Reference power (PSCref) manages the power injected by the storage system; the power of the SC (PSC) is related to the power generated by the photovoltaic system (PPV) using Equation (1), obtaining the power injected into the network (Piny).
P I n y = P P V + P S C

4. Algorithms of Power Fluctuation Reduction in the PCC for PV Systems

4.1. Strategy Based on a Power Ramp Control Algorithm

The ramp speed algorithm, which is used to control fluctuations in power output in a photovoltaic plant, consists of sensing the power generated by the PV solar system (PPV) and from this value estimating the dynamic variations of the injected power based on the desired rate of change (0.1Pnom/min). If the fluctuations are less than the maximum allowed, the storage system does not take any action; otherwise, it injects or absorbs the energy necessary to meet the desired rate of change. The technique limits the rate of change or slope of the power injected when the previously established limit is exceeded. The algorithm is used in [28,32], which applies a Pref SC = 0 if the rate of change of power PPV is within the desired limits. Otherwise, the algorithm generates a Pref SC such that PSC + PPV present a rate of change within the desired range. In the case of this study, since the sampling frequency of the control system is 1 s, the algorithm has been designed so that the power reference is updated every 5 s, so a ramp limiting constant of 125 W/5 s is used.

4.2. Control Strategy Based on a First Order Low Pass Filter (LPF)

The Low Pass Filter (LPF) method is used to determine the high frequency components that must be mitigated by the energy storage system. In this technique, the filter with unit gain and a time constant are parameters that allow the establishment of the reference PSC ref. [27]. Equation (2) presents the transfer function of a first order LPF filter.
H ( s ) = 1 T f s + 1 ,
where Tf is the filter time constant and is essential in determining the reduction in power variations. If the Tf value is high, the smoothing effect will be more evident [33]. This study uses a Tf = 10 min.
The algorithm filters solar photovoltaic generation PPV by the LPF, and its output is the reference signal Pref, which is limited by a dead band function in order to avoid tracking small variations in the Pref, which are considered insignificant. This procedure improves the robustness of the control system to the parameters of the bank of supercapacitors [34].

4.3. Control Strategy based on a Moving Average Algorithm

The Moving Average (MA) strategy is one of the most common smoothing methods. Its operation is based on the calculation of the moving average of the current and previous photovoltaic power for a given time window T, as observed in Equation (3) [32].
P M A ( t ) = 1 T t T t P P V ( t ) d t
Depending on the size of the time window T, the filtering of power variations PPV(t) will be more or less significant. Several studies with this strategy have verified that the time window is independent of the section of the photovoltaic plant, and that it only depends on the maximum limits allowed according to current regulations [32].
The algorithm applies Equation (4) to the photovoltaic power PPV, which will be processed for a time window T. PPV is subtracted from the control module output signal and the Pref follows the same procedure explained in the LPF method [28]. In this strategy, once the moving average is determined, it is necessary to subtract the PPV, resulting in PSC ref. The time used in the moving average in this study is T = 5 min.

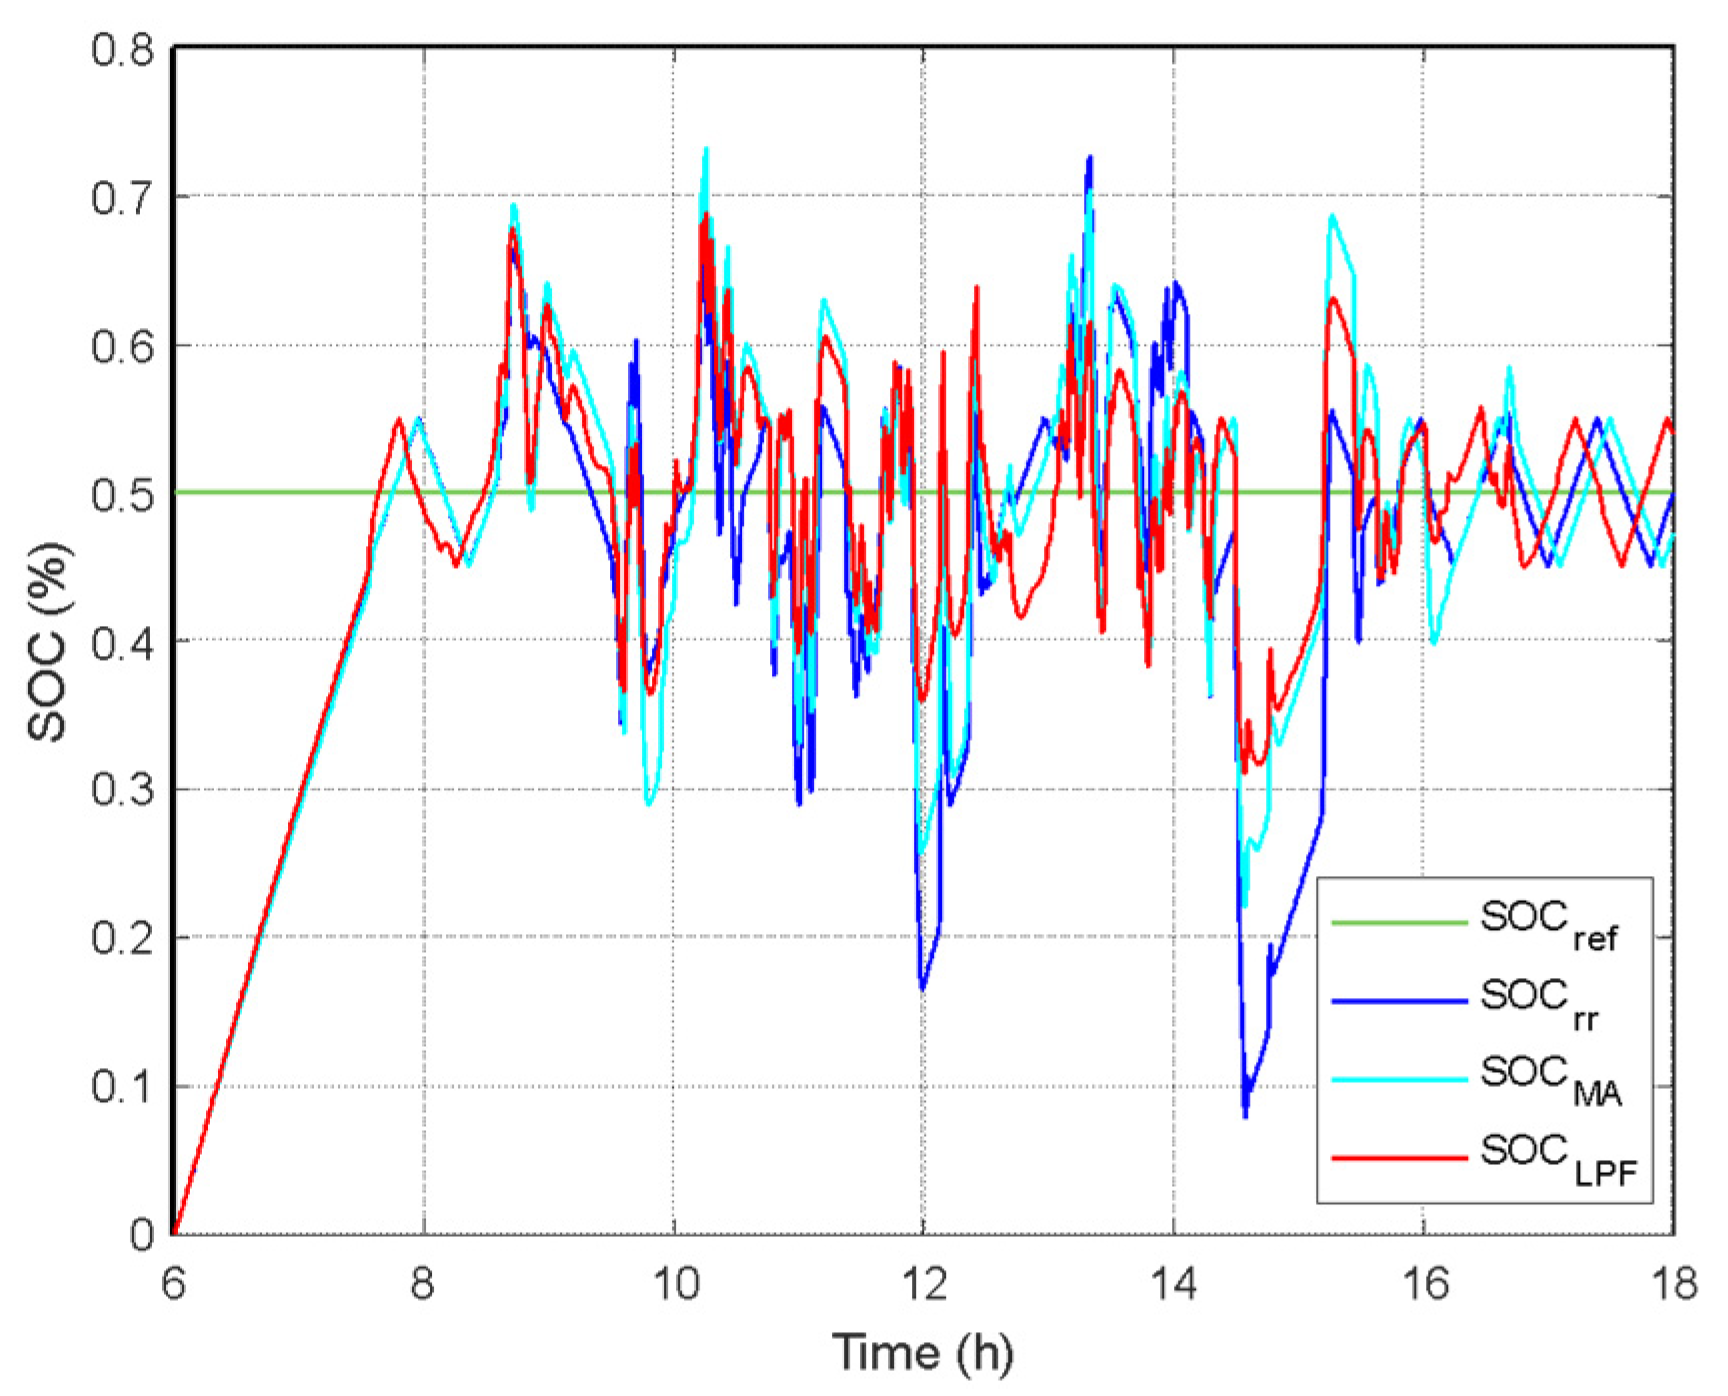
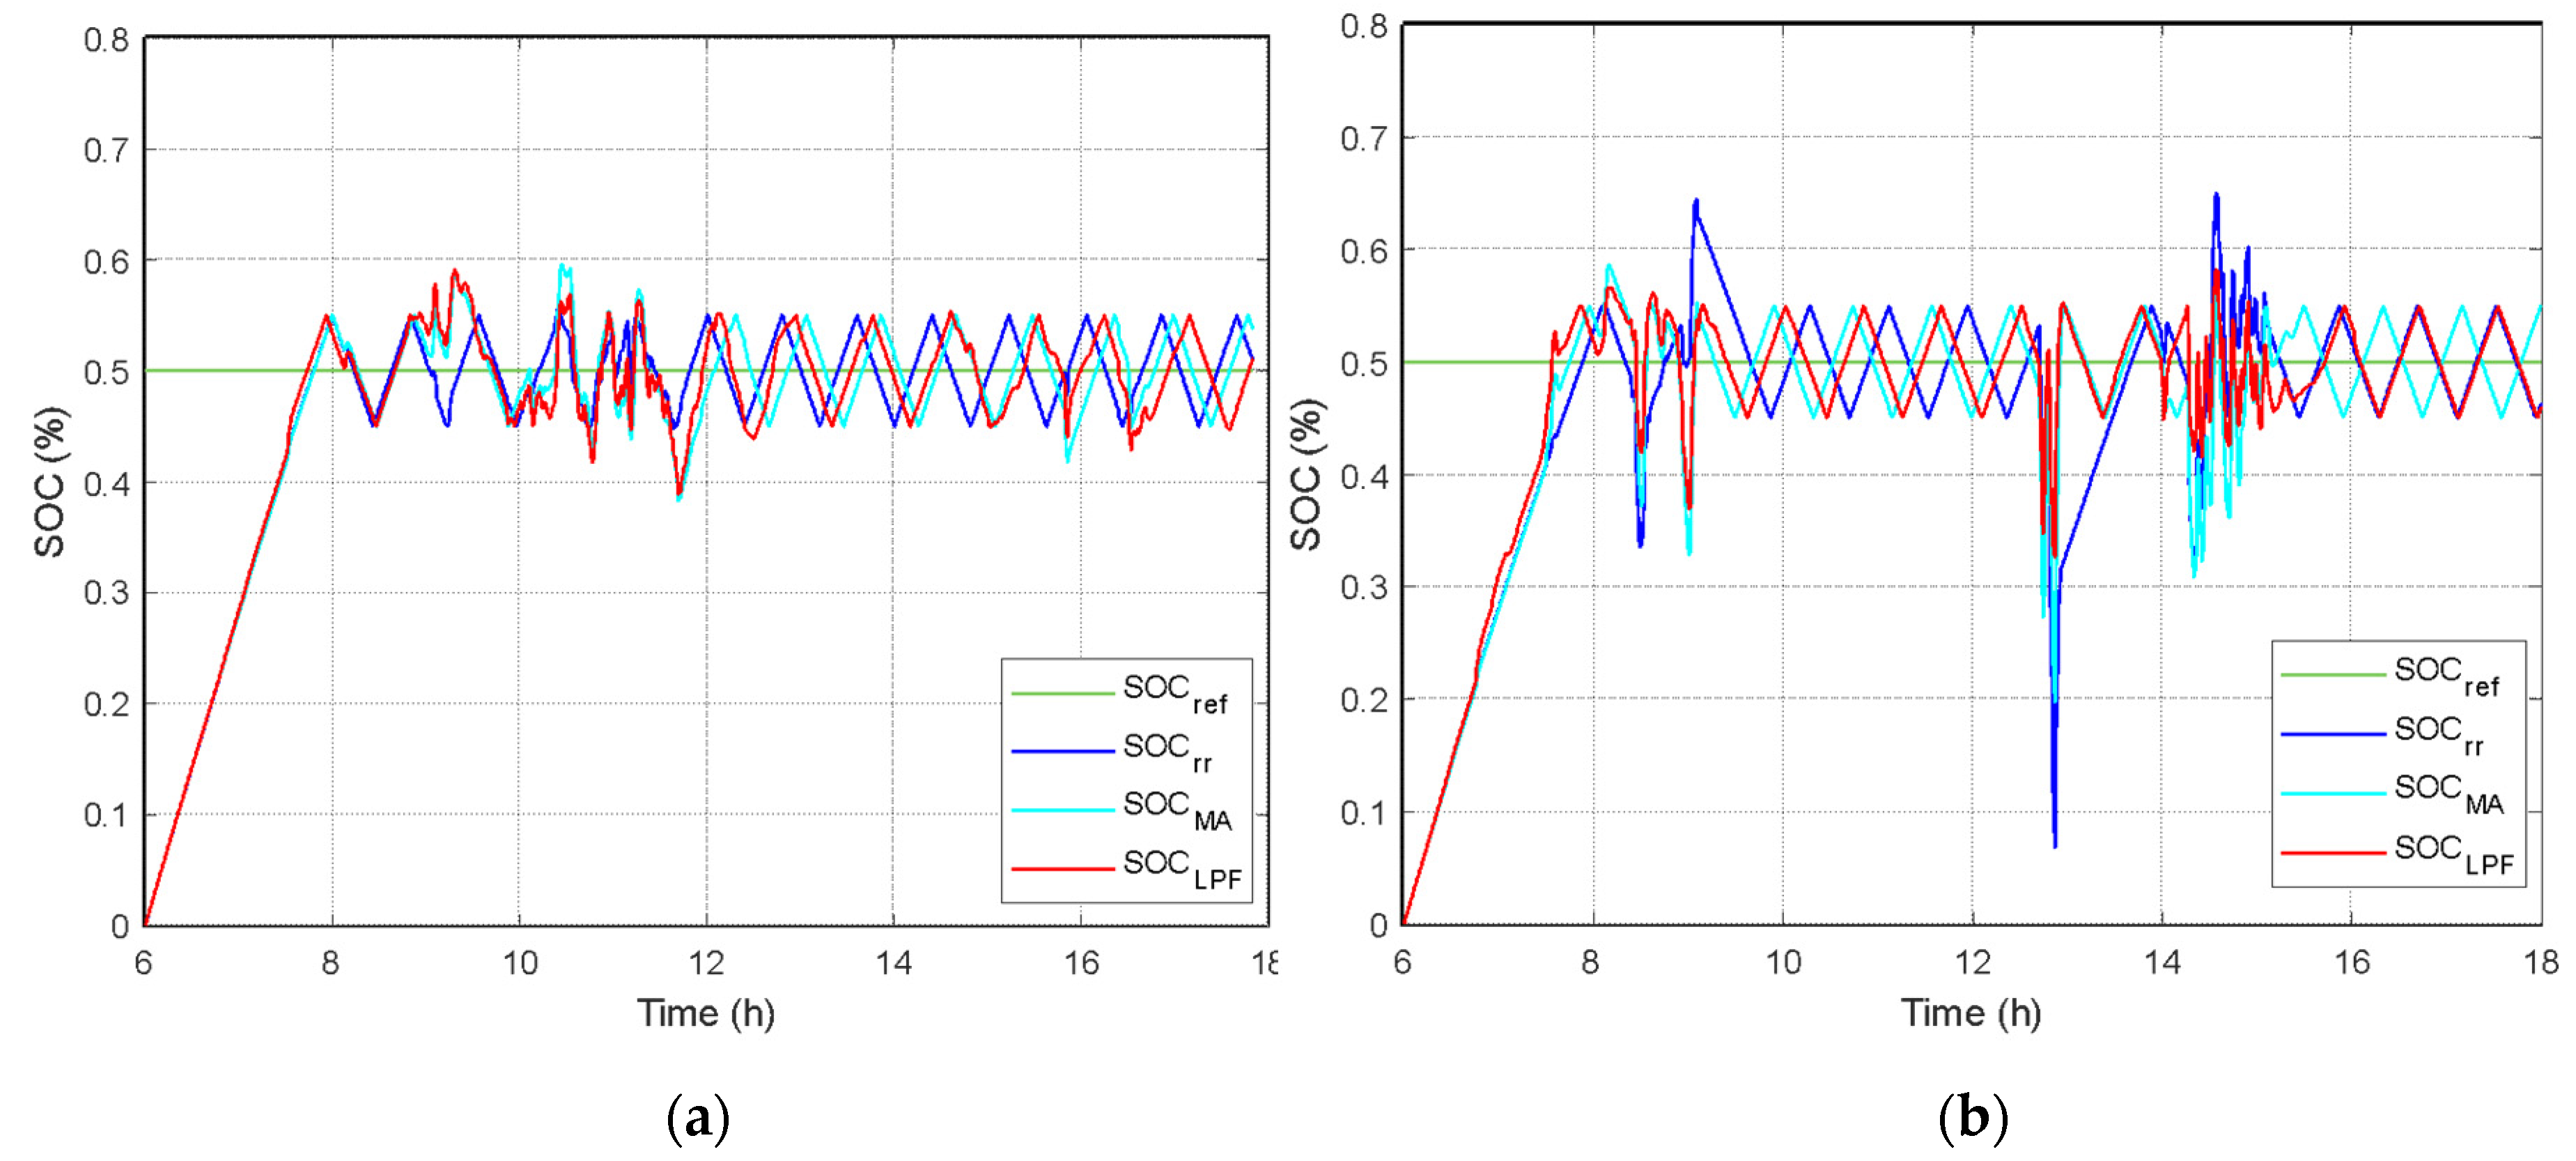
4.4. State of Charge Control (SOC) in the Bank of Supercapacitors

Regardless of the fluctuation reduction technique to be used, it is necessary to control the state of charge (SOC) of the storage system, since the techniques studied presuppose that this system has the necessary energy to feed the PCC or, failing that, it can absorb all the energy necessary to meet Pref SC. In this sense, in cases where the SCs have to deliver energy into the PCC and are discharged or the SCs have to absorb energy from the PCC and are fully charged, the storage system will not be able to provide/absorb energy, respectively. Hence the need to have control of the SOC that allows the algorithm to work, optimizing the storage system. In the case of supercapacitors, the normalized SOC is directly and exclusively related to the equipment voltage, and it is estimated using Equation (4).
S O C = V S C V m i n V m a x V m i n ,
where Vmax represents the maximum voltage (600 V), Vmin the minimum voltage (440 V), and VSC is the instantaneous operating voltage of the SC. These values are subject to the technical conditions of the bank of supercapacitors and the associated power converter.
In order to operate the storage system at a point that allows meeting the need of mitigating power fluctuations, a control loop called “slow control” is proposed that operates when power fluctuations are within the allowed limits. Figure 6 shows the fluctuation control system with the incorporation of the SOC control. This control operates in parallel to known algorithms and has a reference SOCref based on an hourly range, which is defined according to the typical variations of daily irradiance. The SOCref can be close to SOCmax for the hour range where commonly there is higher irradiance, since only a decrease in radiation could be present. Then the SC would deliver enough energy to reduce the variation of PPV. On the other hand, the SOCref may be near the SOCmin in the hour range where there is commonly less irradiance. Since only an increase in irradiance can occur, then the SC absorbs the excess PV power. In this study, the reference SOC has been set to SOCref = 0.5 and controlled under a hysteresis band control with a constant power of PSC_SOC = 250 W if SOC > 0.55 y PSC_SOC = −250 W if SOC < 0.45. This power PSC_SOC allows an oscillation around the desired operating point with a frequency of FOSC_SOC = 3.5 × 10⁻³ Hz, frequency less than the desired rate of change at the output of the PV system.

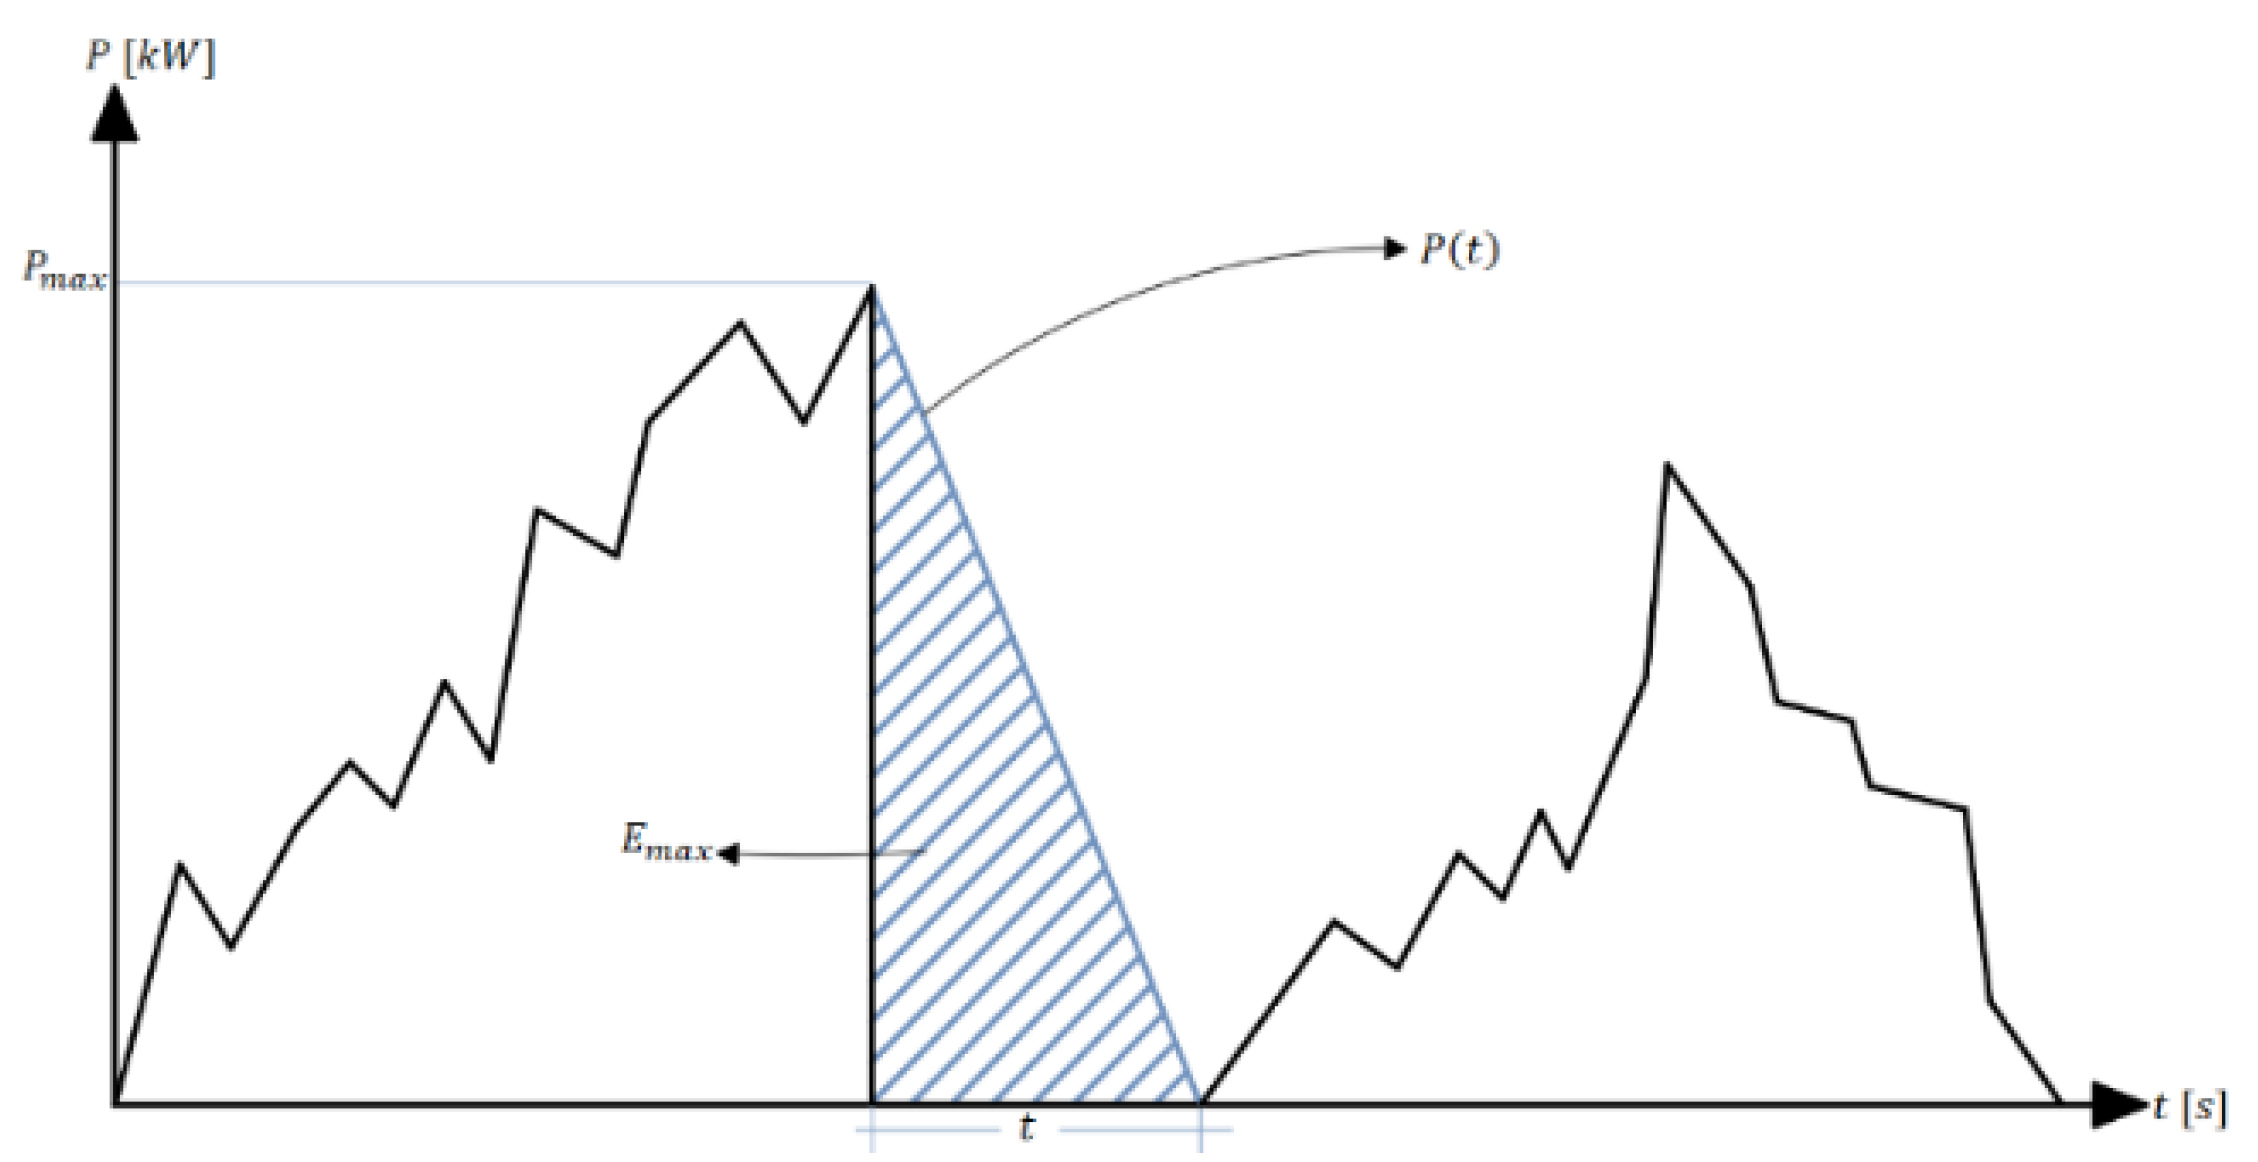
4.4.1. Sizing of the Storage System
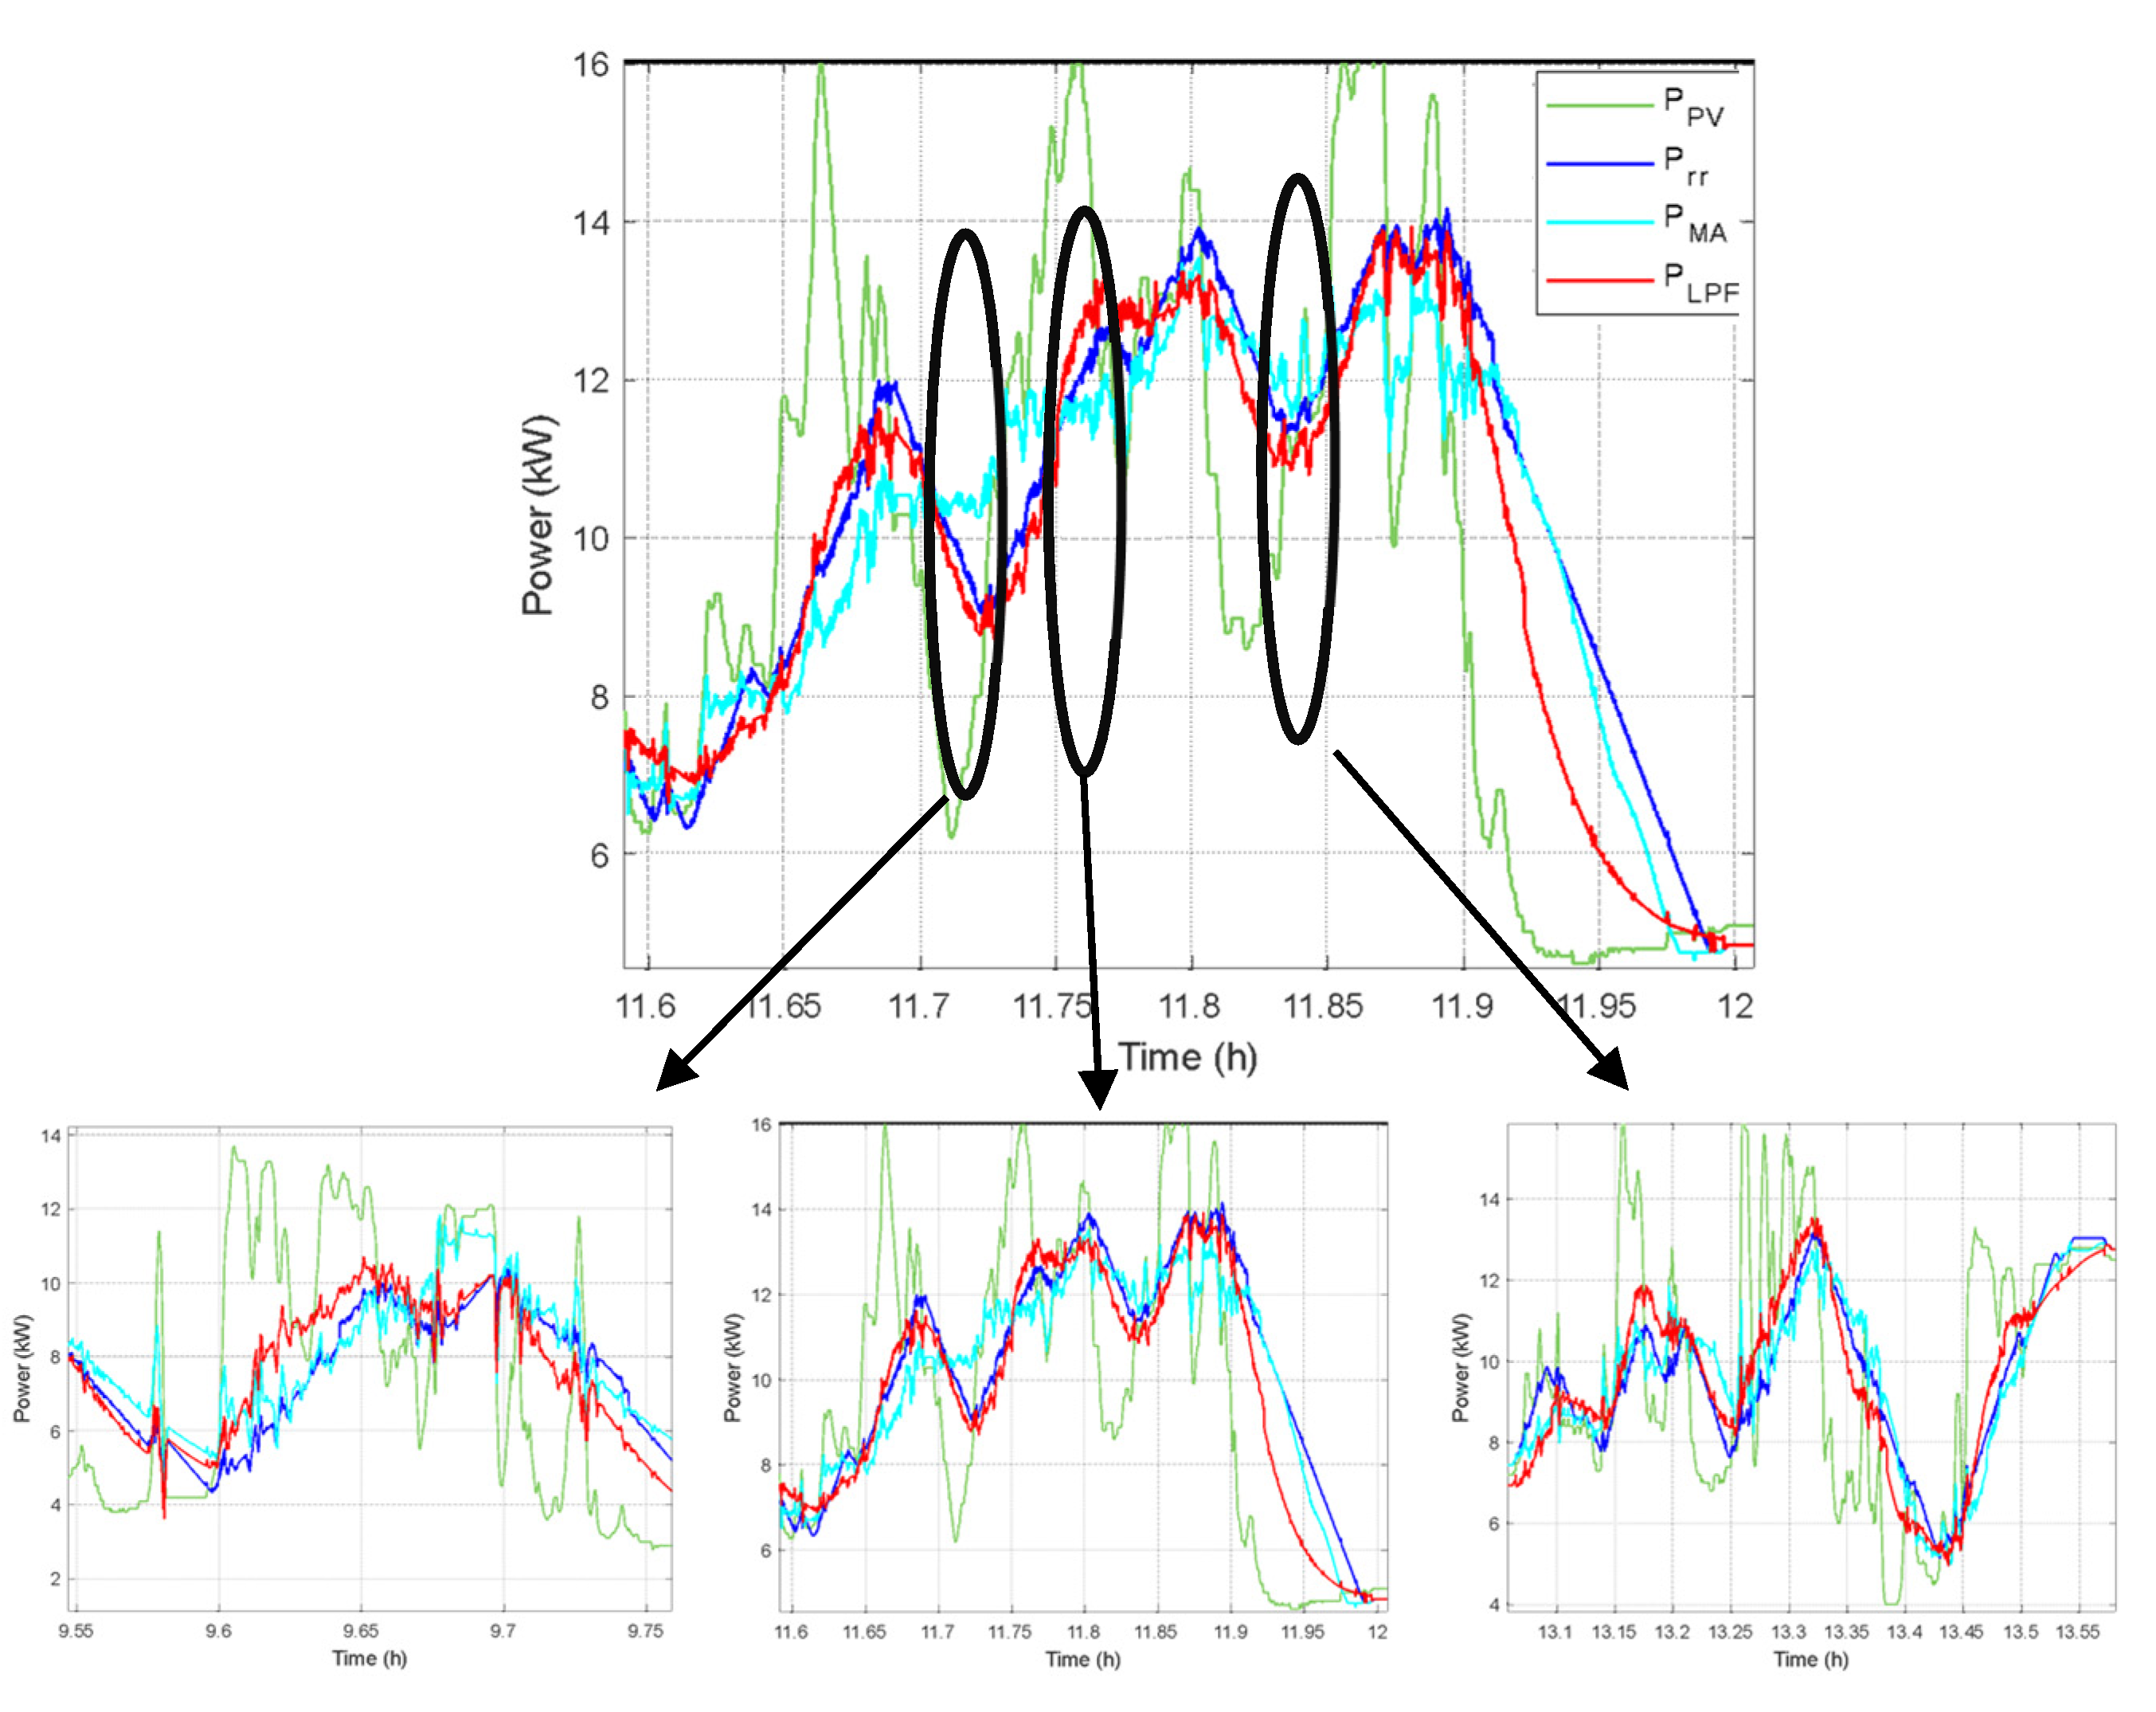
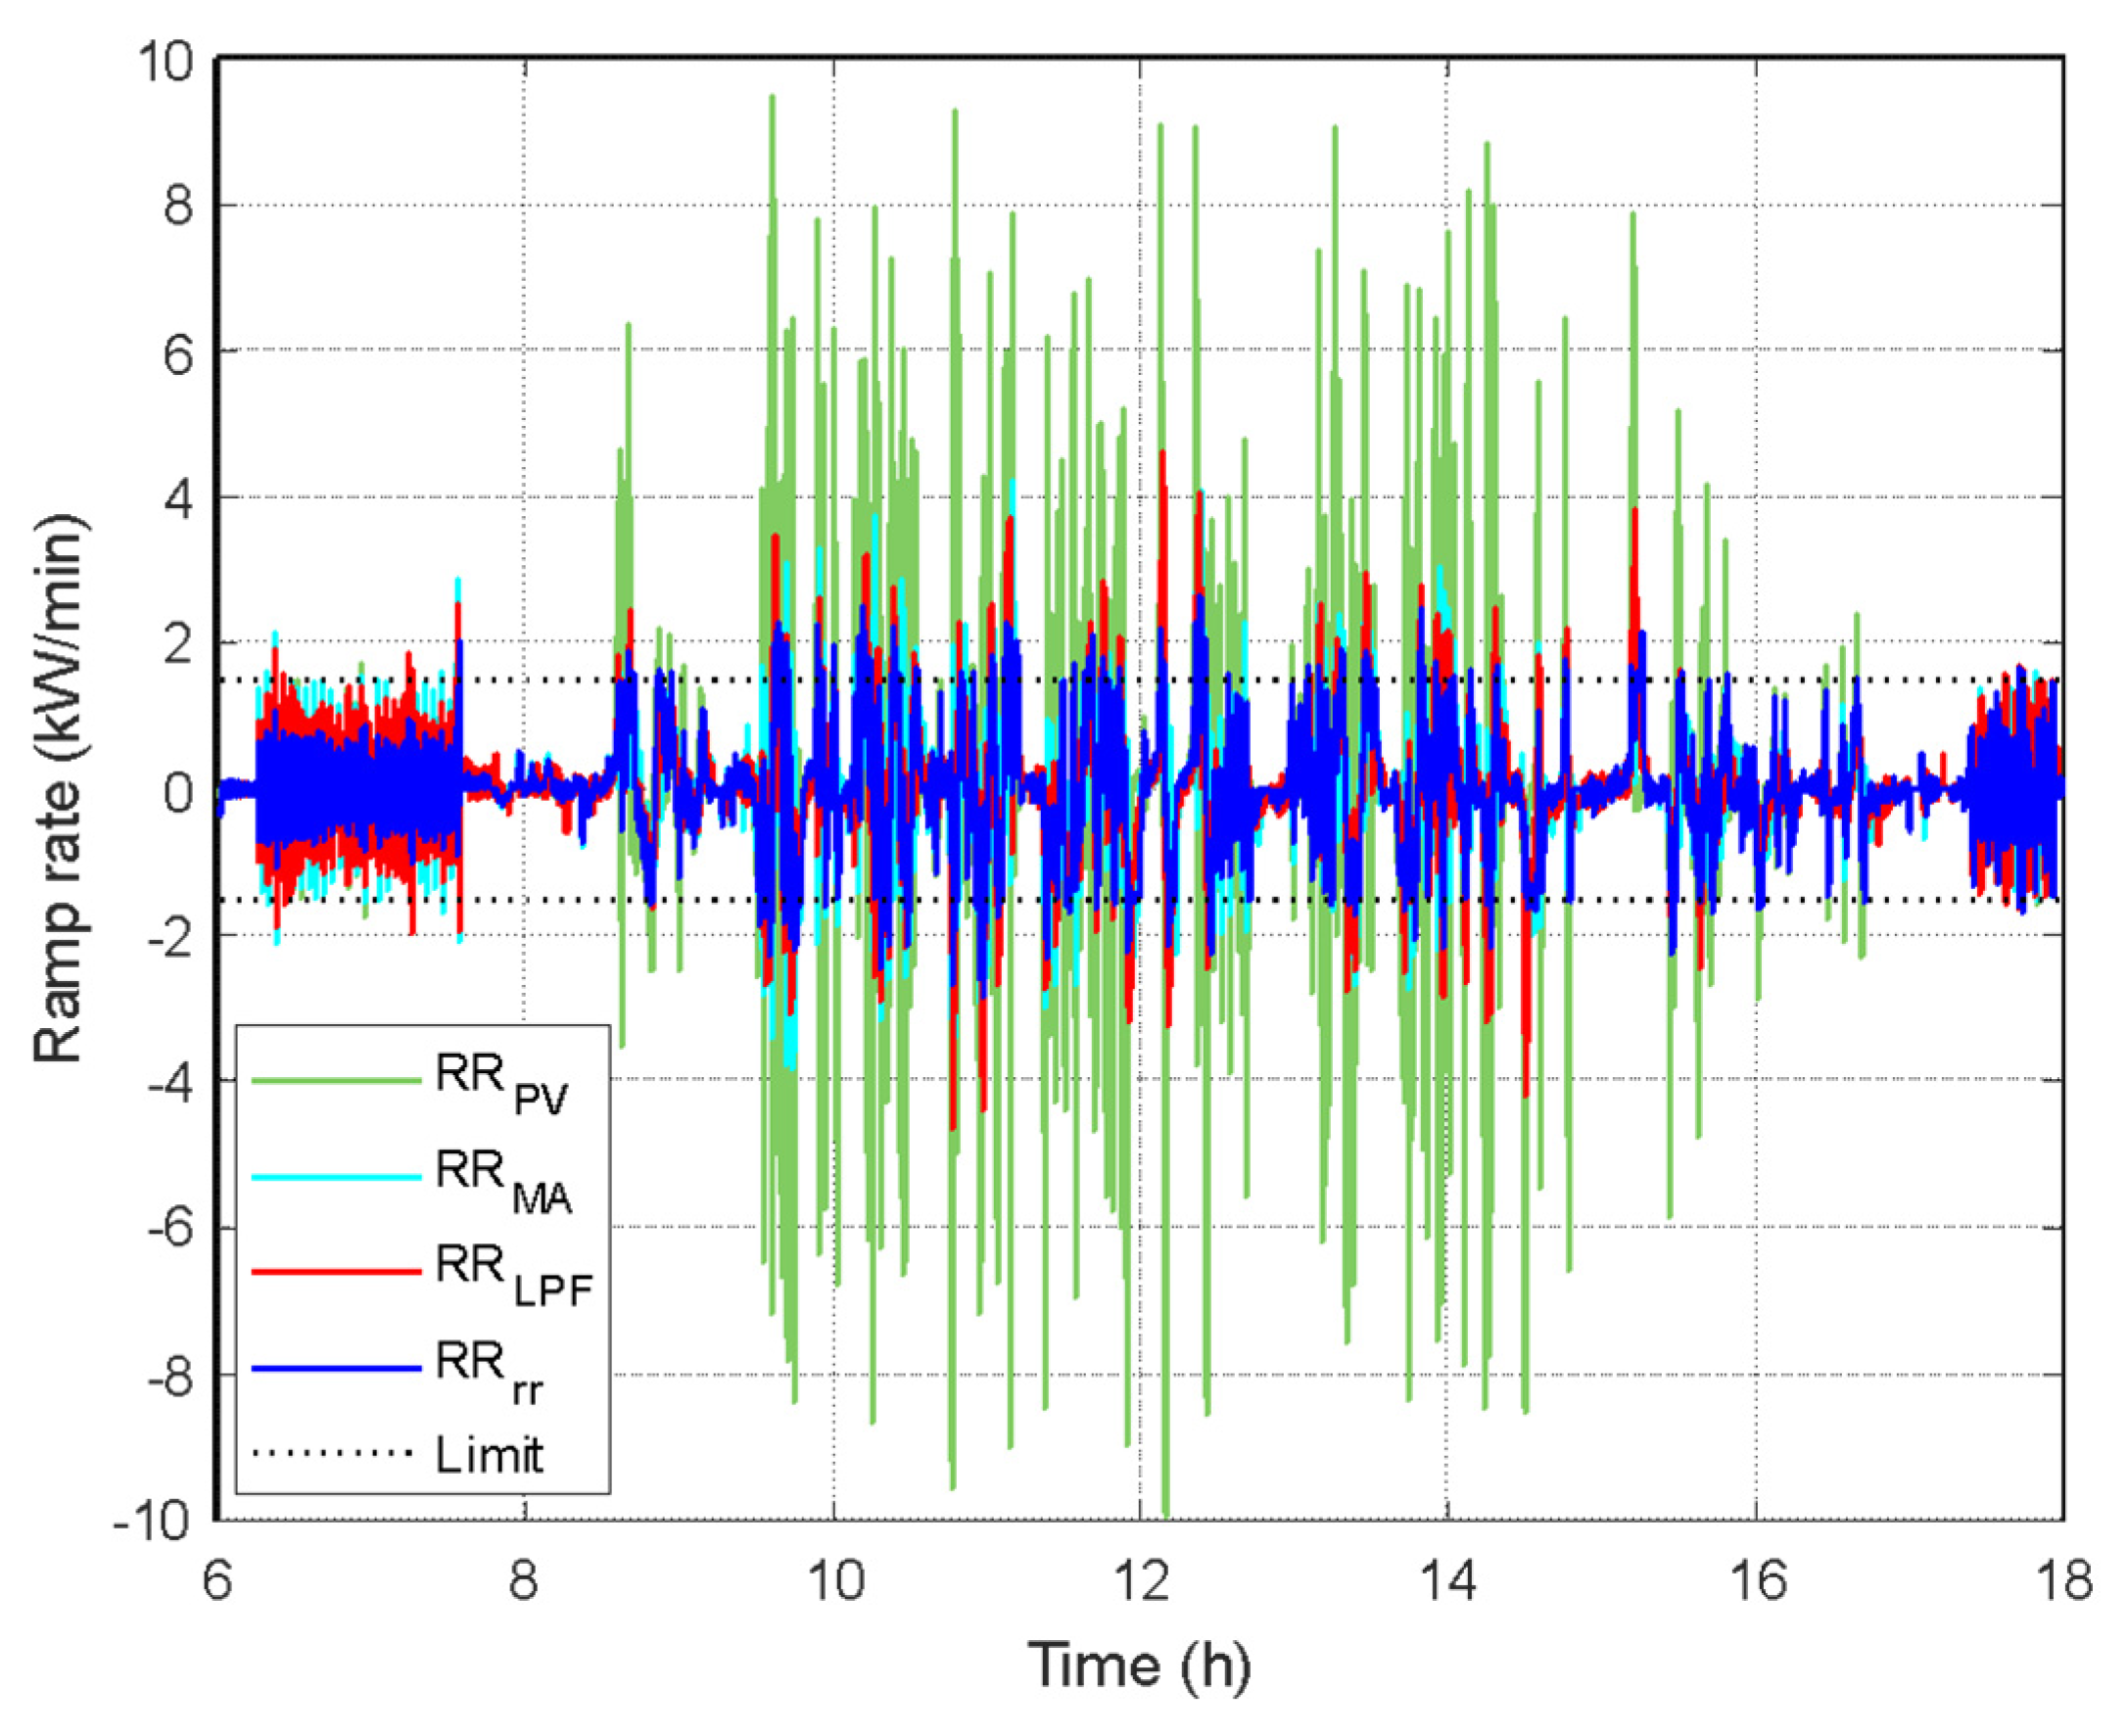
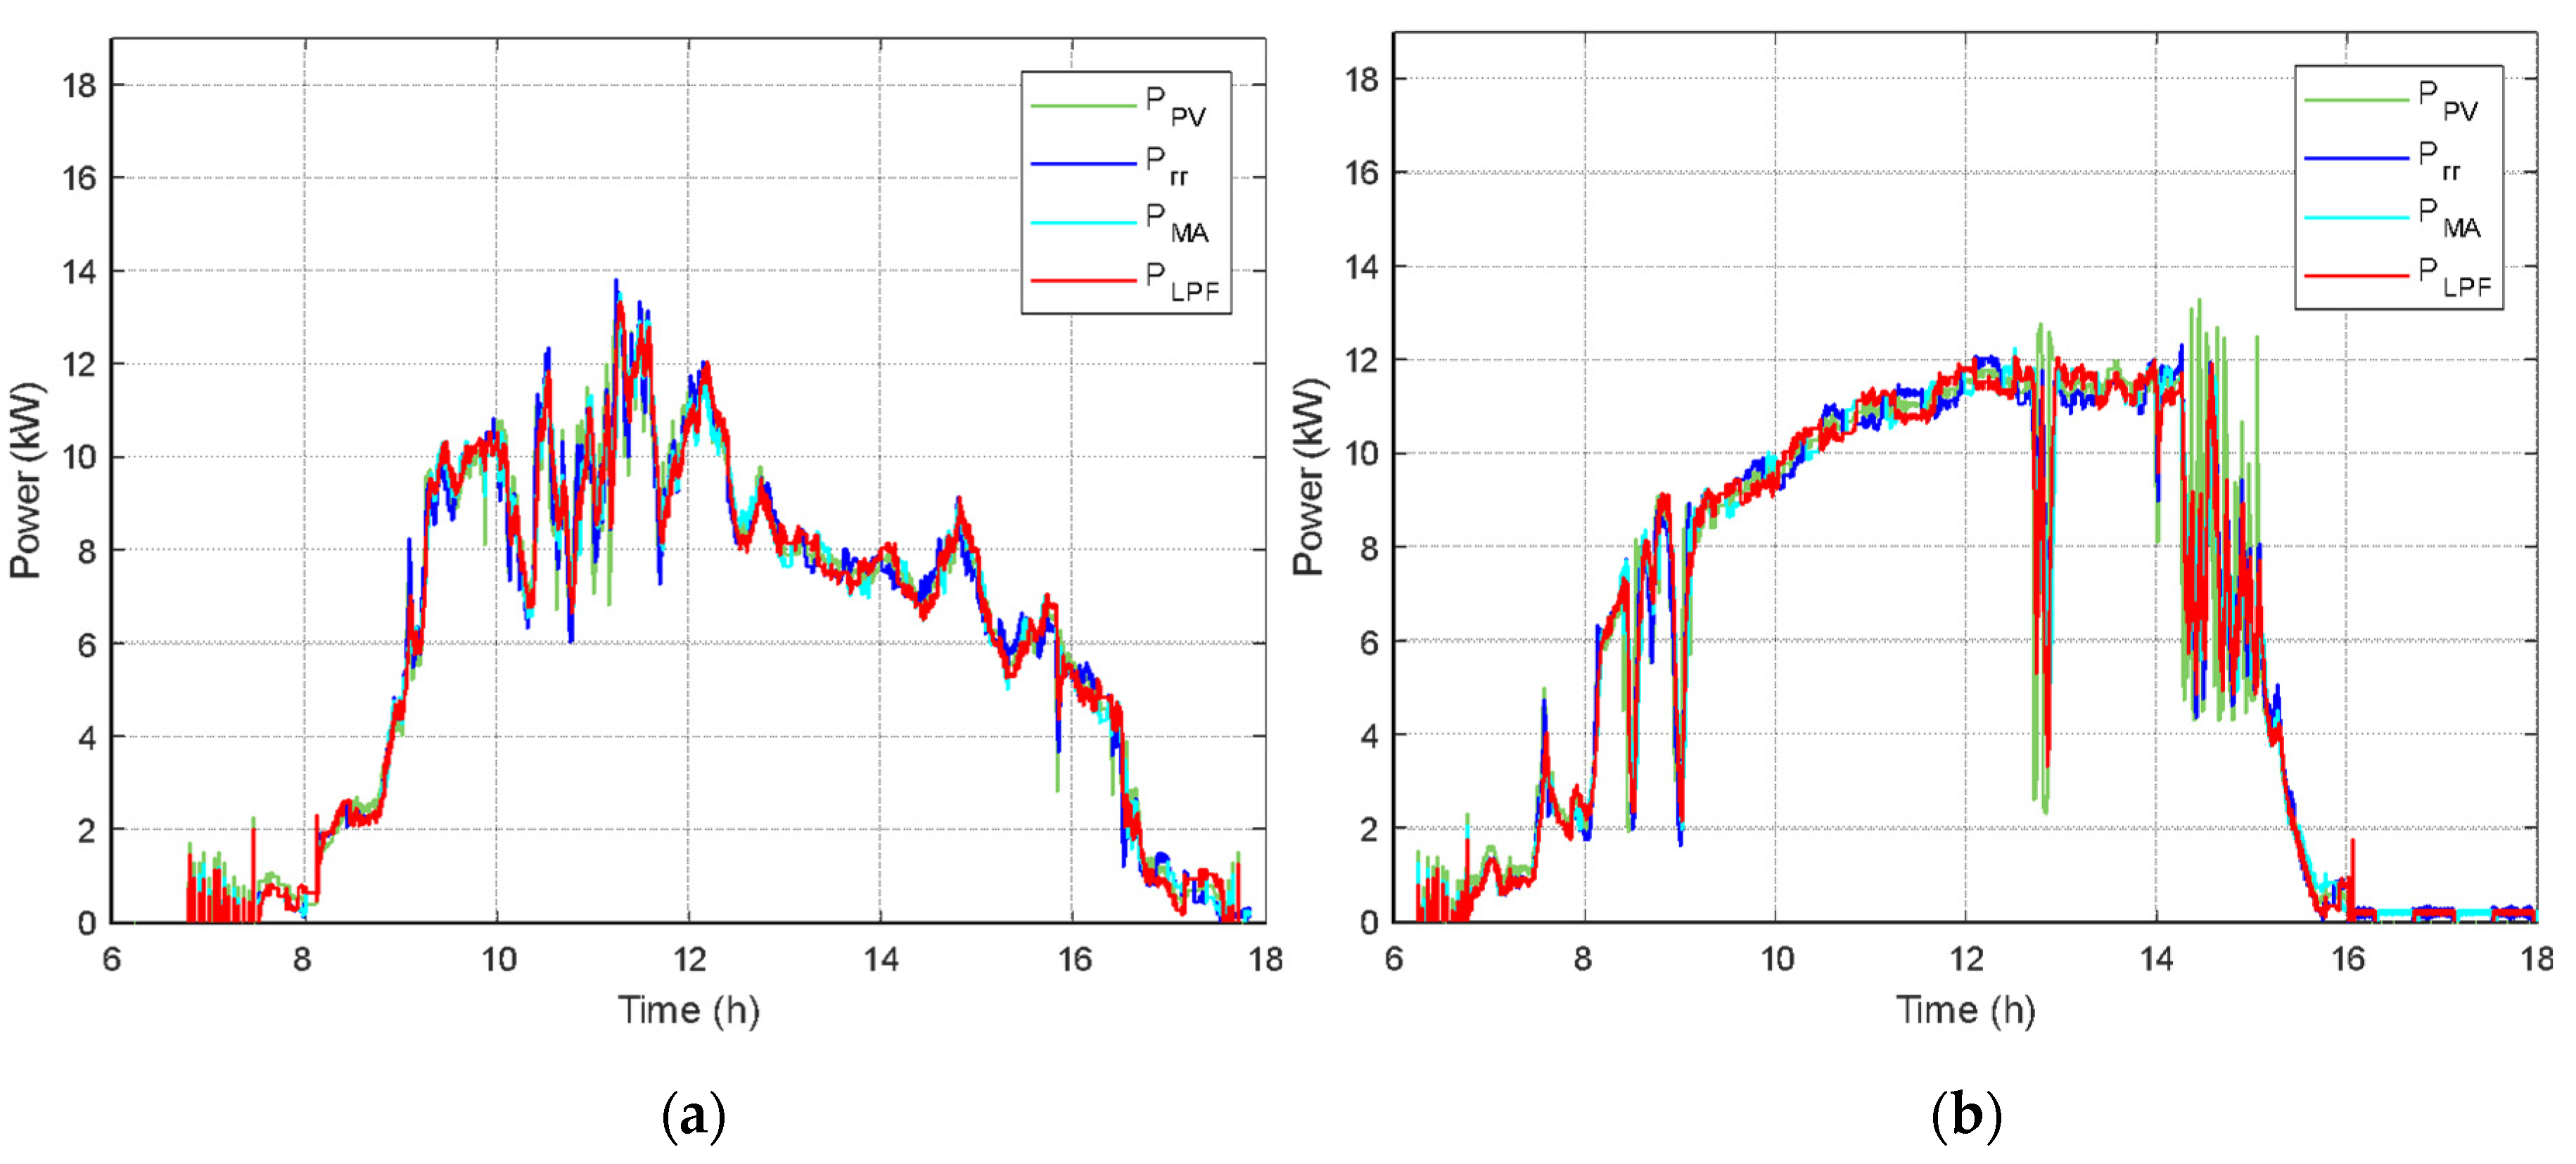
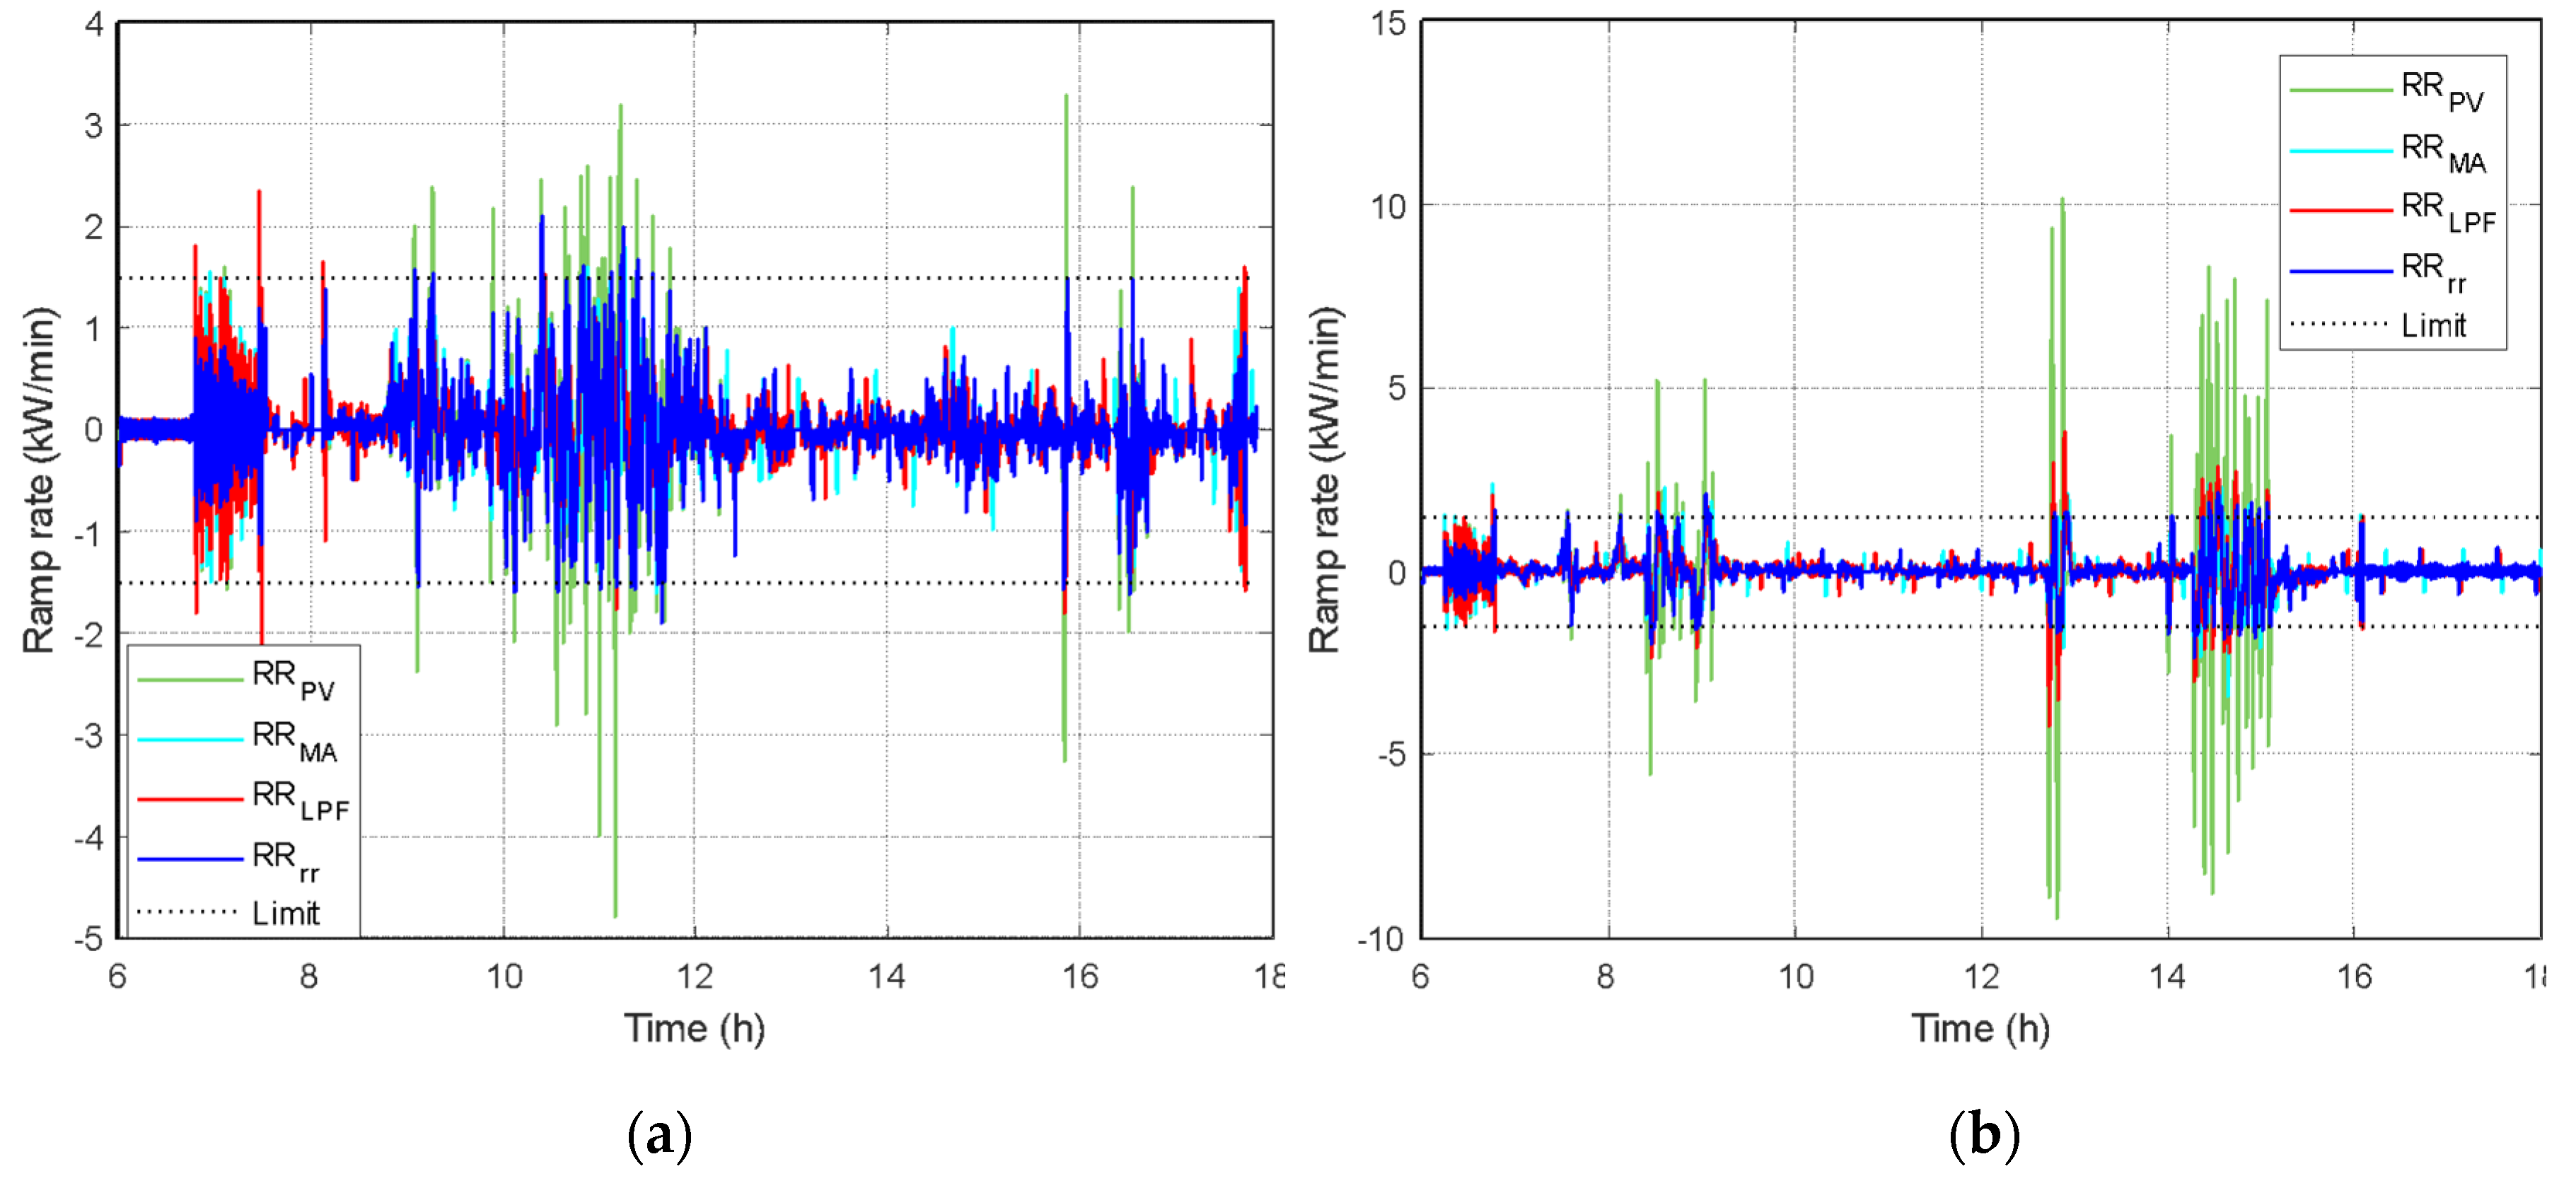
The energy storage system is one of the most important aspects to reduce fluctuations in grid-connected solar energy. The capabilities of this type of system depend exclusively on the degree of attenuation required to inject power into the PCC.
Studies such as [35] determine the capacity of the storage system from the nominal power of the PV system, the efficiency of the storage system, the time constant of cloudy days, and the desired rate of change in [%/min]. Under this procedure, the storage capacity for the case study is in the order of 2.13 kWh; however, the worst case analysis can be studied from Figure 7, where a sudden variation is observed from Pmax up to 0 kW. Under this circumstance the storage system must supply the energy Emax, to meet the desired slope (0.1Pnom/min). In this sense, under a linear approximation, the power P(t) can be determined by Equation (5).
P ( t ) = α t + β ,
where α is the slope of the line and its value is given by Equation (5), and β represents the instantaneous power at the origin; as worst case it is the maximum power Pmax.
In the case of α = 0.1 Pmax/min, then P(t) is represented by Equation (6).
P ( t ) = 0.1 P m a x m i n t + P m a x ,
where the time in which P(t) = 0 is t = 1/6 h and the maximum energy required in the event of a sudden change in generation is Emax = Pmax/γ, where γ represents the storage coefficient, and in this case it is γ = 12 kW/kWh. In the case study, with a generation system with a nominal capacity of 15 kWp, and α = 1.5 kW/min with the consideration indicated above, the storage system under the worst case must be greater than 1.25 kWh. According to the behavior present in the study area, the typical variations on days with high cloudiness, in a window of 10 min, ranges lower than ΔP < 9.5 kW according to what was observed in Figure 3b. This variation represents ΔP < 0.63 Pmax and to meet the desired rate of change, and considering an SOCref = 0.5, energy is given by E u s e d = P 2 60 α , which for the case study represents E u s e d = 1   kWh . In this study, the energy used in the simulation is 901 Wh for the 3 parallel chain circuits of 10 series capacitors.

5. Results

For the analysis of the 3 control strategies, a day with high power variations was considered. Figure 8 shows the power of the PV solar system (PPV) and the power injected into the grid with compensation with the ramp control (Prr), Low Pass Filter (PLPF), and Moving Average (PMA) algorithms. In the figure, three different areas are enlarged in which the comparison of the smoothing methods can be better appreciated. A similar behavior is observed in the three cases; however, the ramp control technique is the one that presents more fixed slopes with greater frequency, due to the fact that this technique imposes a known rate of change. Figure 8 emphasizes the most critical cases of the day under study. To quantify the performance of the algorithms under study, Figure 9 shows the rate of change of the generation of the PV system, which far exceeds the desired rate of change by almost 6.6 times, reaching 10 kW/min. In Figure 9 it is observed that the techniques applied present similar behaviors; however, the ramp control technique is the one with the lowest rate of change, whose limit is 1.5 kW/min.
In relation to the energy storage system, Figure 10 shows the SOC of the bank of supercapacitors in each algorithm used, where it is observed that no algorithm takes full advantage of the storage capacity, although the ramp control algorithm is the one that used it the most. Regarding SOC control, in all cases hysteresis control maintains the SOC around the SOCref = 0.5. In the case under study, the storage system managed a total capacity of Err = 11.25 kWh, ELPF = 10.31 kWh, and EMA = 10.26 kWh, representing charge/discharge cycles 5.76, 5.28, 5.26, respectively for a day with high variation in irradiance. Given this rate of charge and discharge cycles for supercapacitor technology, the impact on its long service life can be considered negligible.
Similar behaviors are observed in the study with other two profiles of solar irradiance. In both cases the PV energy fluctuations injected to the PCC is considerably reduced. November 23 and 24 have been used as the days with intermediate and low fluctuation in solar irradiance. In Figure 11a,b, the behavior of PPV is observed during November 23 and 24, respectively.
In Figure 12a the rate of change is observed on 23 November, where its peak amplitude is the lowest of all days studied, while Figure 12b shows the behavior during 24 November, presenting a lower degree of variations in its irradiance, that is, the day where the least energy storage capacity is necessary. However, between 12:00 and 14:00 a change is observed in Figure 12a that reaches 10 kW/min, an abrupt change, such as those observed in Figure 9. Regarding the energy managed by the supercapacitors system, this is in the order of 5.7 kWh and 3.45 kWh for November 23 and 24, respectively, representing 2.92 and 1.76 charge/discharge cycles for a day of intermediate and low fluctuation of solar irradiance. In all cases, the charge status control of the storage system allows the SOC to be close to the SOCref as shown in Figure 13a. In cases of high fluctuations, it is possible to effectively reduce power fluctuations in the PCC, as is the case observed in Figure 11b, between 12:00 and 14:00. In this situation, the discharge from the storage system reached 6%, a critical situation if before this disturbance the SOC of the supercapacitor had not been close to SOCref.

6. Conclusions

The study shows the typical behavior of solar irradiance in an Andean city, which presents considerable variations that can reach up to 63% of the system’s nominal power in time intervals in the order of seconds. From the irradiance behavior with high fluctuations that affect the production of the PV system, the need to incorporate systems that reduce these fluctuations is observed. The paper presents an analysis of the most common methods to reduce these fluctuations in the PCC using the ramp control, Moving Average, and Low Pass Filter algorithms. The study incorporates an energy storage system from supercapacitors, and the algorithms are compared under the same irradiance conditions and random behavior of the PV system. In the study, a state of charge control is applied by means of a hysteresis band that allows operating around SOCref = 0.5. The algorithms studied present similar behaviors; however, the ramp control technique presents the best performance. The storage system was dimensioned based on the nominal power of the PV system and the desired rate of change in the PCC. Based on the maximum power of the PV system, the study allows the determination of power and capacity of the storage system in a simple way. As a result, it is determined that the capacity can be estimated at Pnom/12 [kWh]. Additionally, it is determined that based on the storage capacity and irradiance characteristics in the study area, the storage system could use at least 5.76 daily charge/discharge cycles. In the study, it is possible to reduce the rate of change of the energy injected into the PCC about 6.66 times with the use of an energy storage system based on SC.

Author Contributions

L.G.G. and J.E. conceived and wrote the paper; R.C., B.D. and D.B. analyzed the data and contributed analysis tools. All authors have read and agreed to the published version of the manuscript.

Funding

This research received no external funding.

Conflicts of Interest

The authors declare no conflict of interest.

References

  1. Intenational Energy Agency. Global CO2 Emissions in 2019 Data & Statistics—IEA. 2020. Available online: https://www.iea.org/data-and-statistics?country=WORLD&fuel=Energy supply&indicator=Total primary energy supply (TPES) by source (accessed on 24 May 2020).
  2. Intenational Energy Agency. Electricity Generation and Power Sector CO2 Emissions in Advanced Economies, 1971–2019—Charts—Data & Statistics—IEA. 2020. Available online: https://www.iea.org/data-and-statistics/charts/electricity-generation-and-power-sector-co2-emissions-in-advanced-economies-1971-2019 (accessed on 24 May 2020).
  3. Global Hydropower Market “to See Compound Growth Rate of 2.4% Until 2030”—Energy Live News. Available online: https://www.energylivenews.com/2019/10/29/global-hydropower-market-to-see-compound-growth-rate-of-2-4-until-2030/ (accessed on 29 April 2020).
  4. What Are the Most Used Renewable Energy Sources in the World? Available online: https://www.power-technology.com/features/featurethe-worlds-most-used-renewable-power-sources-4160168/ (accessed on 29 April 2020).
  5. Intenational Energy Agency. Power—Renewables 2019—Analysis—IEA. Available online: https://www.iea.org/reports/renewables-2019/power (accessed on 17 May 2020).
  6. Ma, W.; Wang, W.; Wu, X.; Hu, R.; Tang, F.; Zhang, W. Control strategy of a hybrid energy storage system to smooth photovoltaic power fluctuations considering photovoltaic output power curtailment. Sustainability 2019, 11, 5. [Google Scholar] [CrossRef] [Green Version]
  7. Omran, W.A.; Kazerani, M.; Salama, M.M.A. A study of the impacts of power fluctuations generated from large PV systems. In Proceedings of the 1st IEEE-PES/IAS Conference on Sustainable Alternative Energy, Valencia, Spain, 28–30 September 2009. [Google Scholar] [CrossRef]
  8. Solar PV—Analysis—IEA. Available online: https://www.iea.org/reports/solar-pv (accessed on 9 June 2020).
  9. Mansouri, N.; Lashab, A.; Sera, D.; Guerrero, J.M.; Cherif, A. Large Photovoltaic Power Plants Integration: A Review of Challenges and Solutions. Energies 2019, 12, 3798. [Google Scholar] [CrossRef] [Green Version]
  10. Ghaffarianfar, M.; Hajizadeh, A. Voltage stability of low-voltage distribution grid with high penetration of photovoltaic power units. Energies 2018, 11, 1960. [Google Scholar] [CrossRef] [Green Version]
  11. Aziz, T.; Ketjoy, N. PV Penetration Limits in Low Voltage Networks and Voltage Variations. IEEE Access 2017, 5, 16784–16792. [Google Scholar] [CrossRef]
  12. Rahimi, K.; Mohajeryami, S.; Majzoobi, A. Effects of Photovoltaic Systems on Power Quality. In Proceedings of the NAPS 2016—48th North American Power Symposium, Denver, CO, USA, 18–20 September 2016. [Google Scholar] [CrossRef]
  13. Sahin, F.E.; Yilmaz, M. High concentration photovoltaics (HCPV) with diffractive secondary optical elements. Photonics 2019, 6, 68. [Google Scholar] [CrossRef] [Green Version]
  14. Rodríguez-Gallegos, C.D.; Liu, H.; Gandhi, O.; Singh, J.P.; Krishnamurthy, V.; Kumar, A.; Stein, J.S.; Wang, S.; Li, L.; Reindl, T.; et al. Global Techno-Economic Performance of Bifacial and Tracking Photovoltaic Systems. Joule 2020. [Google Scholar] [CrossRef]
  15. Sukič, P.; Štumberger, G. Intra-minute cloud passing forecasting based on a low cost IoT sensor—A solution for smoothing the output power of PV power plants. Sensors 2017, 17, 1116. [Google Scholar] [CrossRef] [PubMed] [Green Version]
  16. Vahan, G.; Booth, S. Review of PREPA technical requirements for interconnecting wind and solar generation. Natl. Renew. Energy Lab. Tech. Rep. 2013. [Google Scholar] [CrossRef] [Green Version]
  17. Amrouche, S.O.; Rekioua, D.; Rekioua, T.; Bacha, S. Overview of energy storage in renewable energy systems. Int. J. Hydrogen Energy 2016, 41, 20914–20927. [Google Scholar] [CrossRef]
  18. Kolcun, M.; Vojtek, M.; Mikita, M.; Čonka, Z. Smoothing the Power Output of Photovoltaic Plant Using a Battery Energy Storage System Control. In Proceedings of the 8th International Scientific Symposium on Electrical Power Engineering, Stará Lesná, Slovakia, 16–18 September 2015; Available online: https://www.researchgate.net/publication/283858397_Smoothing_the_power_output_of_photovoltaic_plant_using_a_battery_energy_storage_system_control (accessed on 17 May 2020).
  19. Ju, X.; Xu, C.; Hu, Y.; Han, X.; Wei, G.; Du, X. A review on the development of photovoltaic/concentrated solar power (PV-CSP) hybrid systems. Sol. Energy Mater. Sol. Cells 2017, 161, 305–327. [Google Scholar] [CrossRef]
  20. Ishaque, K.; Salam, Z. A review of maximum power point tracking techniques of PV system for uniform insolation and partial shading condition. Renew. Sustain. Energy Rev. 2013, 19, 475–488. [Google Scholar] [CrossRef]
  21. Espinoza, J.L.; Gonzalez, L.G.; Sempertegui, R. Micro Grid Laboratory as a Tool for Research on Non-Conventional Energy Sources in Ecuador. In Proceedings of the 2017 IEEE International Autumn Meeting on Power, Electronics and Computing, Ixtapa, Mexico, 8–10 November 2017; Volume 1, pp. 1–6. [Google Scholar] [CrossRef]
  22. Campozano, E.S.L.; Célleri, R.; Trachte, K.; Bendix, J. Rainfall and Cloud Dynamics in the Andes: A Southern Ecuador Case Study. Adv. Meteorol. 2016, 2016, 15. [Google Scholar] [CrossRef] [Green Version]
  23. Clima Promedio en Cuenca, Ecuador, Durante Todo el Año—Weather Spark. Available online: https://es.weatherspark.com/y/19348/Clima-promedio-en-Cuenca-Ecuador-durante-todo-el-año (accessed on 17 May 2020).
  24. Bel, G.; Bandi, M.M. Geographic dependence of the solar irradiance spectrum at intermediate to high frequencies. Phys. Rev. Appl. 2019, 12, 024032. [Google Scholar] [CrossRef] [Green Version]
  25. Vilani, M.T.; Sanches, L.; Pinto, O.B.; Nunes, G.M. Wavelets and Fourier Coefficients for Theanalysis of Solar Radiation in Varioustypologies of Occupation. 2017. Available online: https://www.revistaespacios.com/a17v38n14/17381426.html (accessed on 27 April 2020).
  26. Olama, M.; Sharma, I.; Kuruganti, T.; Dong, J.; Nutaro, J.; Xue, Y. Spectral Analytics of Solar Photovoltaic Power Output for Optimal Distributed Energy Resource Utilization. In Proceedings of the IEEE Power and Energy Society General Meeting, Chicago, IL, USA, 16–20 July 2017; Volume 2018, pp. 1–5. [Google Scholar] [CrossRef]
  27. Martins, J.; Spataru, S.; Sera, D.; Stroe, D.-I.; Lashab, A. Comparative Study of Ramp-Rate Control Algorithms for PV with Energy Storage Systems. Energies 2019, 12, 1342. [Google Scholar] [CrossRef] [Green Version]
  28. Sukumar, S.; Marsadek, M.; Agileswari, K.R.; Mokhlis, H. Ramp-rate control smoothing methods to control output power fluctuations from solar photovoltaic (PV) sources—A review. J. Energy Storage 2018, 20, 218–229. [Google Scholar] [CrossRef]
  29. Maxwell Technologies. Maxwell Technologies 48 Volt Modules—With New, Advanced DuraBlue Technology. 2020. Available online: https://www.maxwell.com/products/ultracapacitors/48v-module-with-durablue/documents (accessed on 9 May 2020).
  30. Keshan, H.; Thornburg, J.; Ustun, T.S. Comparison of Lead-Acid and Lithium Ion Batteries for Stationary Storage in Off-Grid Energy Systems. IET Conf. Publ. 2016, 2016, 30–37. [Google Scholar] [CrossRef]
  31. Benavides, D.; Arévalo, P.; Gonzalez, L.G.; Aguado, J.A. Analysis of different Storage Systems in the Energy Management of Microgrids. In Proceedings of the 5th International Conference on Advances on Clean Energy Research, Barcelona, Spain, 24–26 April 2020. [Google Scholar]
  32. Sánchez, M.C. Estrategias de Control Para la Atenuación de Fluctuaciones de Potencia Mediante Sistemas de Almacenamiento en Una Planta Fotovoltaica, Trabajo Fin de Grado; Public University of Navarre: Navarra, Spain, 2015; p. 102. [Google Scholar]
  33. Liu, H.; Peng, J.; Zang, Q.; Yang, K. Control Strategy of Energy Storage for Smoothing Photovoltaic Power Fluctuations. IFAC-PapersOnLine 2015, 48, 162–165. [Google Scholar] [CrossRef]
  34. Ellis, A.; Schoenwald, D.; Hawkins, J.; Willard, S.; Arellano, B. PV Output Smoothing with Energy Storage. In Proceedings of the Conference Record of the IEEE Photovoltaic Specialists Conference, Austin, TX, USA, 3–8 June 2012; pp. 1523–1528. [Google Scholar] [CrossRef] [Green Version]
  35. Moghaddam, I.N.; Chowdhury, B. Battery Energy Storage Sizing with Respect to PV-Induced Power Ramping Concerns in Distribution Networks. In Proceedings of the IEEE Power and Energy Society General Meeting, Chicago, IL, USA, 16–20 July 2017; 2018, pp. 1–5. [Google Scholar] [CrossRef]
Figure 1. Daily solar irradiance, November 2018, Campus Balzay, Cuenca.
Energies 13 03755 g001
Figure 2. Typical behavior of power generation in the photovoltaic (PV) system under study (13 November 2018).
Energies 13 03755 g002
Figure 3. (a) Spectral behavior of power generation and (b) dynamic behavior of power generation of the PV system under study.
Energies 13 03755 g003
Figure 4. Block diagram of PV generation with the maximum power point tracking (MPPT) technique.
Energies 13 03755 g004
Figure 5. Photovoltaic solar system and supercapacitors connection diagram.
Energies 13 03755 g005
Figure 6. Diagram of state of charge (SOC) control + fluctuations PPV.
Energies 13 03755 g006
Figure 7. Behavior of the worst scenario of the PV solar system.
Energies 13 03755 g007
Figure 8. Photovoltaic power and injected power applying the three strategies under study during the most critical day.
Energies 13 03755 g008
Figure 9. Rate of change of the energy injected into the point of common coupling (PCC), most critical day.
Energies 13 03755 g009
Figure 10. State of charge (SOC) of the storage system, the most critical day.
Energies 13 03755 g010
Figure 11. Photovoltaic power and injected power applying the three strategies under study: (a) the intermediate fluctuation day (23 November 2018) and (b) the day with less fluctuation irradiance (24 November 2018).
Energies 13 03755 g011
Figure 12. Rate of change of the energy injected into the PCC: (a) the intermediate fluctuation day (23 November 2018) and (b) day with less fluctuation irradiance (24 November 2018).
Energies 13 03755 g012
Figure 13. State of charge (SOC) of the storage system, the most critical day: (a) the intermediate fluctuation day (23 November 2018), and (b) day with less fluctuation irradiance (24 November 2018).
Energies 13 03755 g013

