A Bibliometric Analysis of Carbon Labeling Schemes in the Period 2007–2019


1
Faculty of Geosciences and Environmental Engineering, Southwest Jiaotong University, Chengdu 611756, China
2
Department of Business and Economics, University of Catania, 95131 Catania, Italy
*
Author to whom correspondence should be addressed.
Energies 2020, 13(16), 4233; https://0-doi-org.brum.beds.ac.uk/10.3390/en13164233
Submission received: 23 June 2020
/
Revised: 10 August 2020
/
Accepted: 14 August 2020
/
Published: 16 August 2020
(This article belongs to the Special Issue Circular Economy in Low-Carbon Transition)
Abstract
:Carbon labeling schemes enable consumers to be aware of carbon emissions regarding products or services, to help change their purchasing behaviors. This study provides a bibliometric analysis to review the research progress of carbon labeling schemes during the period 2007–2019, in order to provide insight into its future development. Number of publications, countries of publications, authors, institutions, and highly cited papers are included for statistical analysis. The CiteSpace software package is used to visualize the national collaboration, keywords co-appearance, and aggregation. The results are given as follows: (1) there are 175 articles published in the pre-defined period, which shows a gradual increase, with a peak occurred in 2016; (2) carbon labeling schemes are mainly applied to grocery products, and gradually emerged in construction and tourism. (3) Existing studies mainly focus on examination of utility of carbon labeling schemes, by conducting surveys to investigate individual perception, preference, and willingness to pay. (4) Future research will include the optimization of life cycle assessment for labeling accreditation, improvement of labeling visualization for better expression, and normalization of various environmental labels to promote sustainable consumption.
1. Introduction
Greenhouse gas (GHG) emissions have given rise to global warming, which has aroused world concerns to adopt mitigation strategies to promote sustainable development [1]. Since the Paris Climate Summit in 2015, more than 160 countries have formulated policies regarding sustainable consumption and production to achieve emission reduction targets [2]. Among them, carbon labeling scheme is an insightful policy tool, by revealing lifecycle-based carbon emissions of a product or service, to encourage transition of low carbon consumption and production [3]. The first carbon labeling scheme was designed in 2006 by UK Carbon Trust [1]. One of its essential measures is to alleviate the impact of carbon emissions on the UK’s sectors of production and services [4]. More than 2000 products with over 90 international brands have been issued by Carbon Trust to implement the scheme [5]. Since then, a number of developed countries (such as the U.S., France, Switzerland, Japan, and Canada) adopted such a policy to reveal information of environmental impact regarding a product or service [6]. Such scheme is intended to help consumers be conscious of climate change, to change their purchasing behaviors [7]. Consumer pro-environmental purchasing behavior is an important factor to promote decarbonization [8]. Over 80% of online surveyed consumers from eight countries admitted that they support carbon labeling policy as a useful tool to mitigate climate change [9]. Recent surveys further identified that consumers prefer purchasing carbon labeled products, and they are willing to pay a premium of up to 20% of the original price [10]. However, purchasing behavior is a complex decision-making process, which may differ significantly from gender, age, education, and income level, to result in unintended consequences on market demand of carbon labeled products [7,11,12]. Whether the carbon labeling scheme triggers consumers to take pro-environmental purchasing actions lays room for future studies.
In addition, carbon labeling is a voluntary behavior for enterprises or organizations [13]. One of the main motivations about carbon labeling regards marketing strategies, but carbon labeling may enhance consumption behavior towards environmental sustainability. Although such a scheme provides an opportunity to take a holistic carbon accounting on product supply chain and improve its green performance, there is a lack of sufficient incentives to drive its implementation [14]. Since most of the enterprises are driven by profitable motivation, they may be unwilling to attempt carbon labeling due to cost and benefit consideration, including the certification cost, market risk, governmental policy orientation, etc. [15,16]. For instance, China currently has not put a carbon labeling policy into wide practice, which exerts limited influences on market prospect [11,17].
In such context, it is implied that the carbon labeling scheme is still in dispute. A comprehensive review regarding its progress is essential, through which the research hotspots can be identified to lay out foundation for future study. Common literature review is based upon deliberate screening, which may not fully address the advances in a specific research area [18]. This study provides a holistic review on the research progress of carbon labeling schemes in the period 2007–2019 by using a bibliometric analysis. A number of selected indicators, e.g., number of publications, countries, authors, institutions, highly cited papers, and keywords have been incorporated into the analysis to highlight the research hotspots. Moreover, CiteSpace software package is employed to visualize the structures and connections in the retrieved scientific literatures [19]. The scope of this work is to define a comprehensive and holistic review on the development of carbon labeling schemes, through which research hotspots can be identified to lay out a foundation for future study. It is expected that this study may provide insight into the future development of carbon labeling schemes. The specific contributions of this study are: providing an alternative approach to review the research progress of carbon labeling based on bibliometrics, identifying the research trends through an analysis of descriptive statistics on the bibliometric indicators, laying out a foundation for future development of carbon labeling schemes.
The rest of the paper is given as follows: Section 2 introduces the data sources and method for data cleaning, Section 3 presents the results regarding bibliometric indicators, including number of publications, countries, subject categories, published journals, distribution of institution, highly cited papers, and keywords. Section 4 summarizes the paper, discusses the challenges towards carbon labeling schemes, and presents implications.
2. Data and Methods
The literature data were obtained by a predefined information retrieval from the Web of Science (WOS) Core Collection database in the period of 2007–2019, specifically from the sub-databases of Science Citation Index Expanded, Social Sciences Citation Index, and Arts and Humanities Citation Index. The predefined entries were wet based upon the “carbon label*” and the highlighted words in its associated definition, e.g., environmental impact, life cycle assessment, product, service, etc. There were 2016 records at the retrieval time 14/5/2020, and their document types were confined to Article or Review in English, as shown in Table 1. However, most of the publications focus on analytical chemistry, physical chemistry, biochemistry molecular biology, microbiology, etc., which are apparently not conform to the research topic. After removal of the duplicated and irrelevant publications, there were 175 articles finally identified for further bibliometric analysis.
The retrieval results were performed by descriptive statistics corresponding to a set of bibliometric indicators, such as number of publications, country, category, journal, institution, authors, highly cited papers, and keywords, to investigate the attentions to the carbon label related studies. Specifically, Microsoft Excel and bibliometric online analysis platforms were applied to implement the statistical analysis. The values corresponding to journal impact factors were from Journal Citation Reports in 2018. CiteSpace software package was used to visualize the underlying connections among keywords by generation of a co-occurrence network.
3. Results
3.1. Number of Publications
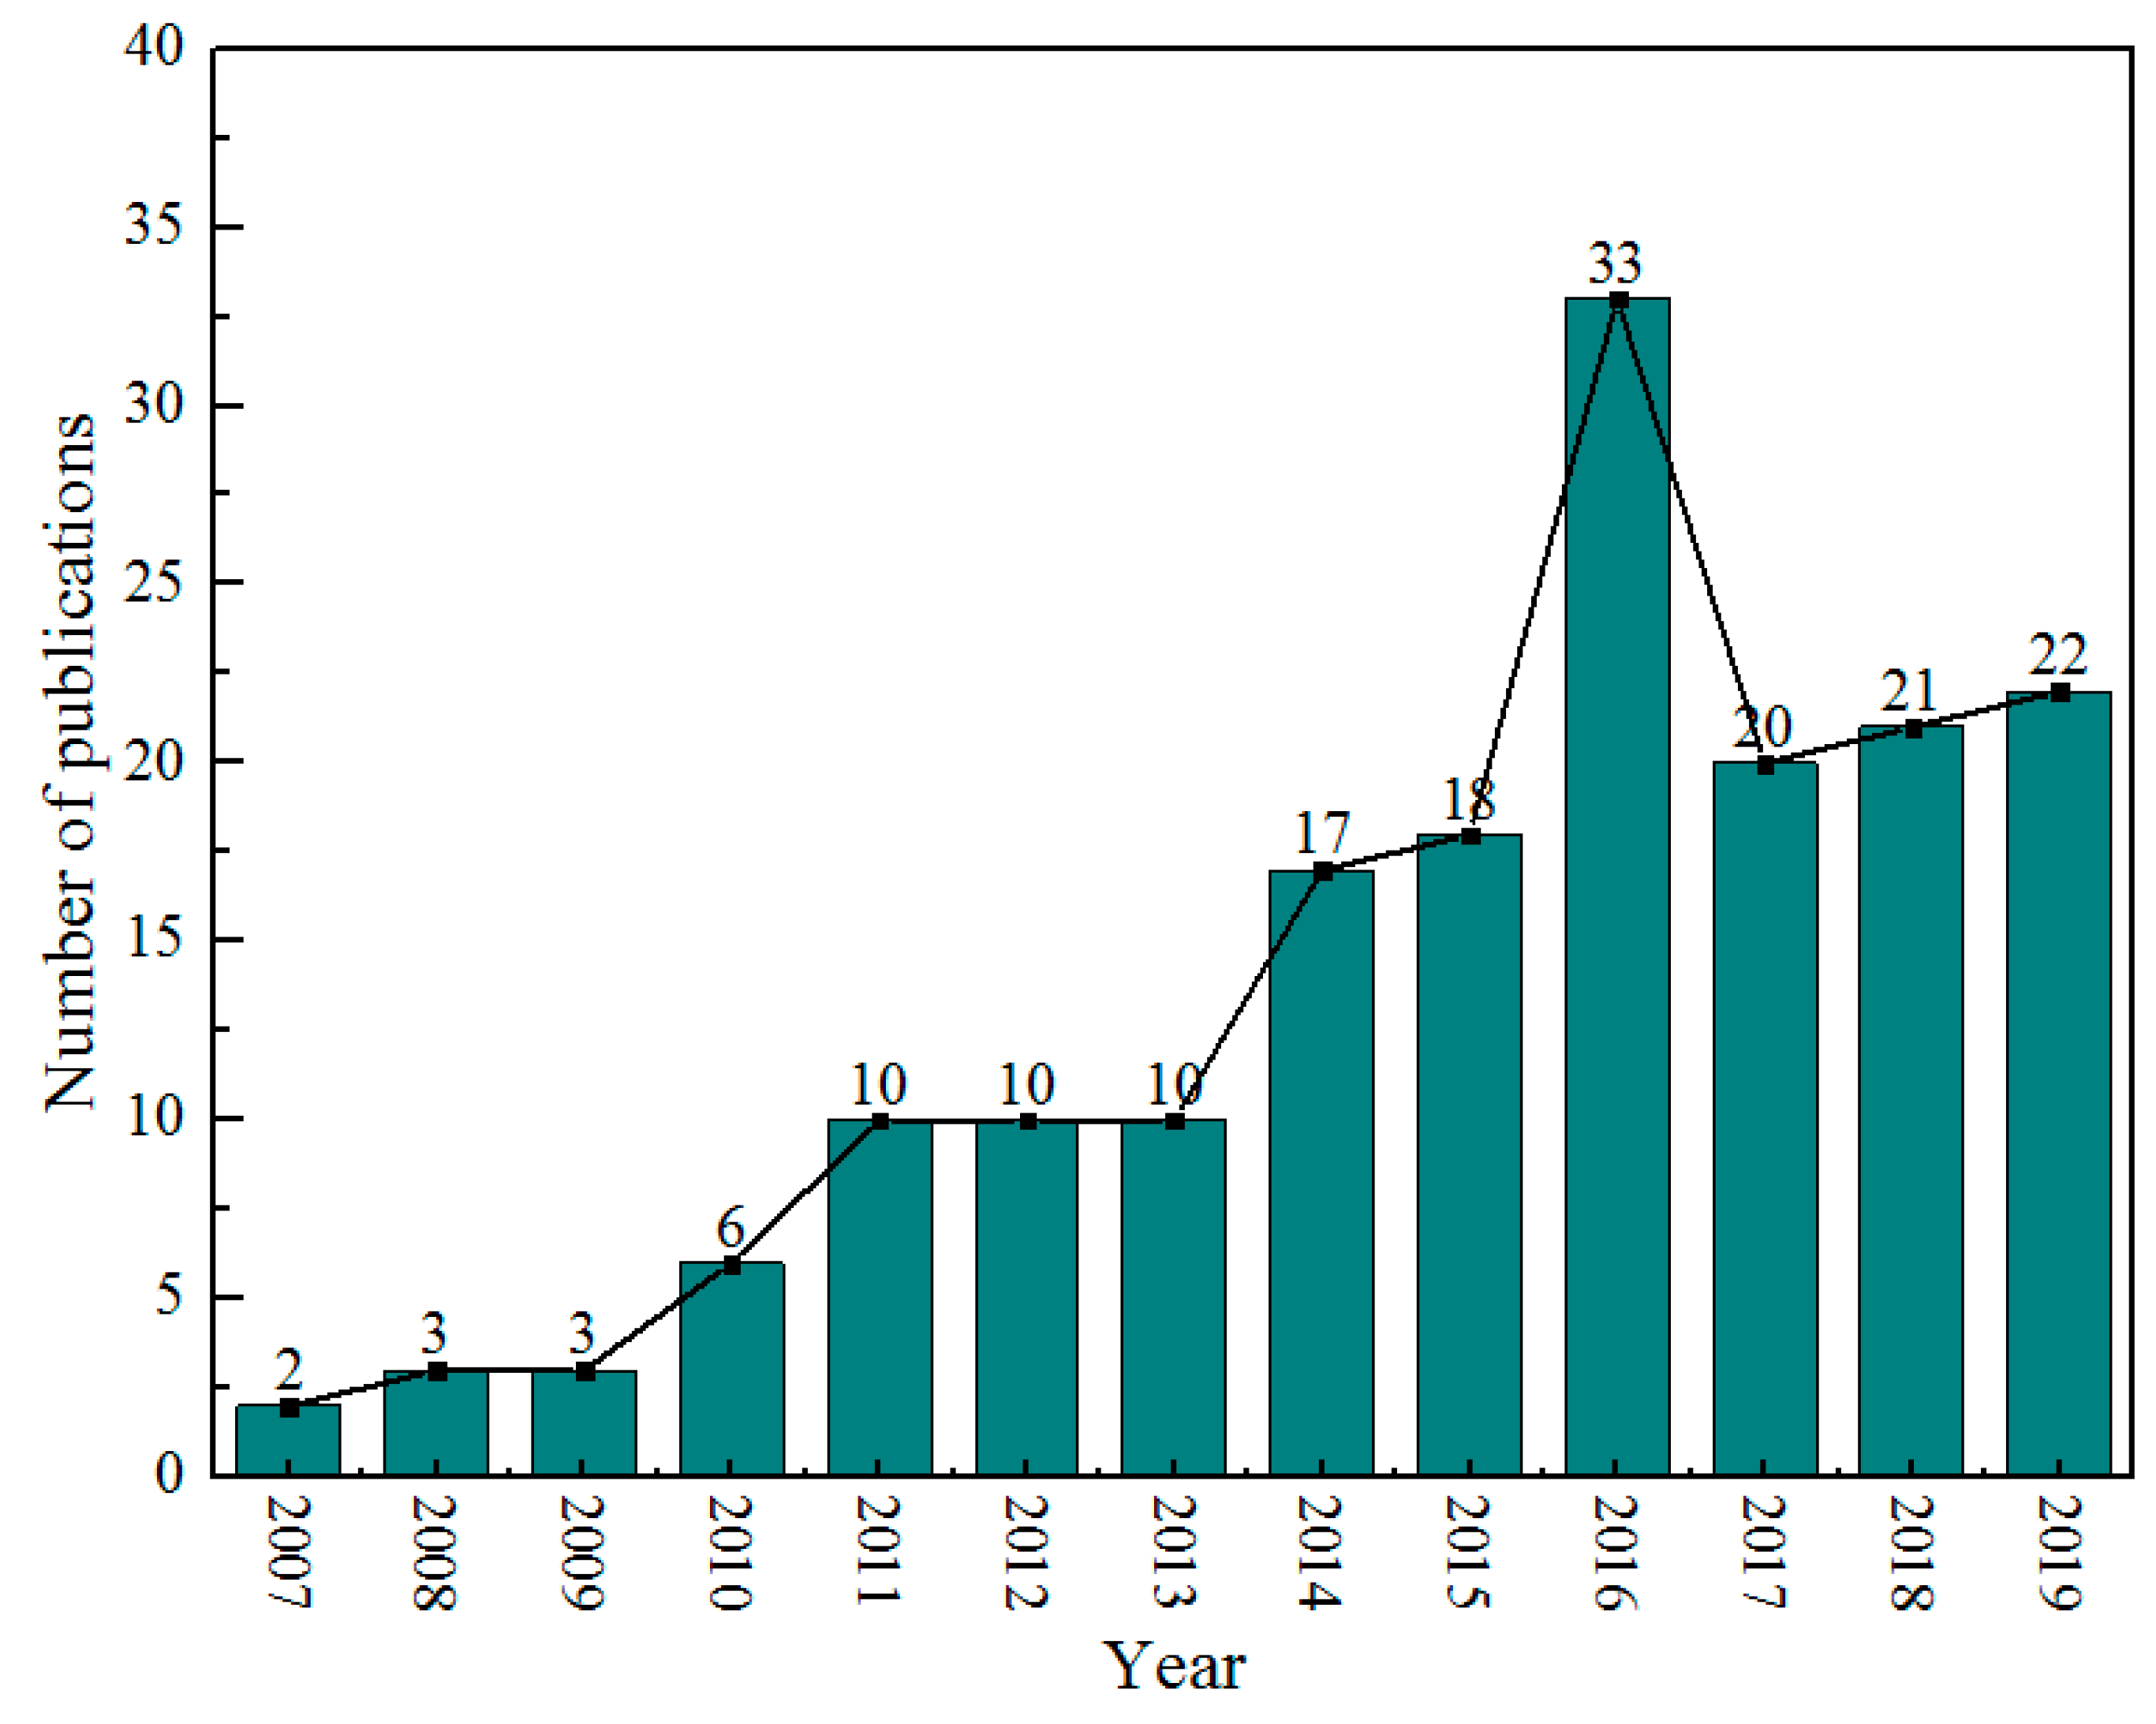
As shown in Figure 1, there were 175 publications in the period of 2007–2009 with a gradual increase. Particularly, there was a peak in 2016. Less than five papers published annually during the period of 2007 to 2009, which highlighted the infancy of carbon labeling scheme, as it was firstly issued by UK in 2006. From 2009 to 2011, the number of publications increased rapidly. During 2011–2013, it had remained unchanged as 10 publications annually. From 2014, the growth was significant towards a peak in 2016, which had an increase of 15.5 times comparing with the publications in 2007. A possible reason might be that the Paris Climate Agreement drives structural transformation of the global carbon markets, which calls for effective market-based policy tools, e.g. carbon labeling schemes, eco-labeling schemes, carbon trade mechanisms, to promote emissions reduction and energy transformation [20,21,22]. Since 2017, the number of publications had decreased to 20 and remained at a slow growth until 2019.
3.2. Countries of Publications
A total of 43 countries have contributed articles in carbon labeling related research areas. Table 2 shows the top 10 countries in terms of their publications during 2007–2019. It is apparent that U.S. ranks first, China as second, followed by UK, Germany, Australia, and Italy. In particular, European Union (EU) countries contributed most of the publications, indicating a regional spillover effect due to their close collaborations in economics and politics.
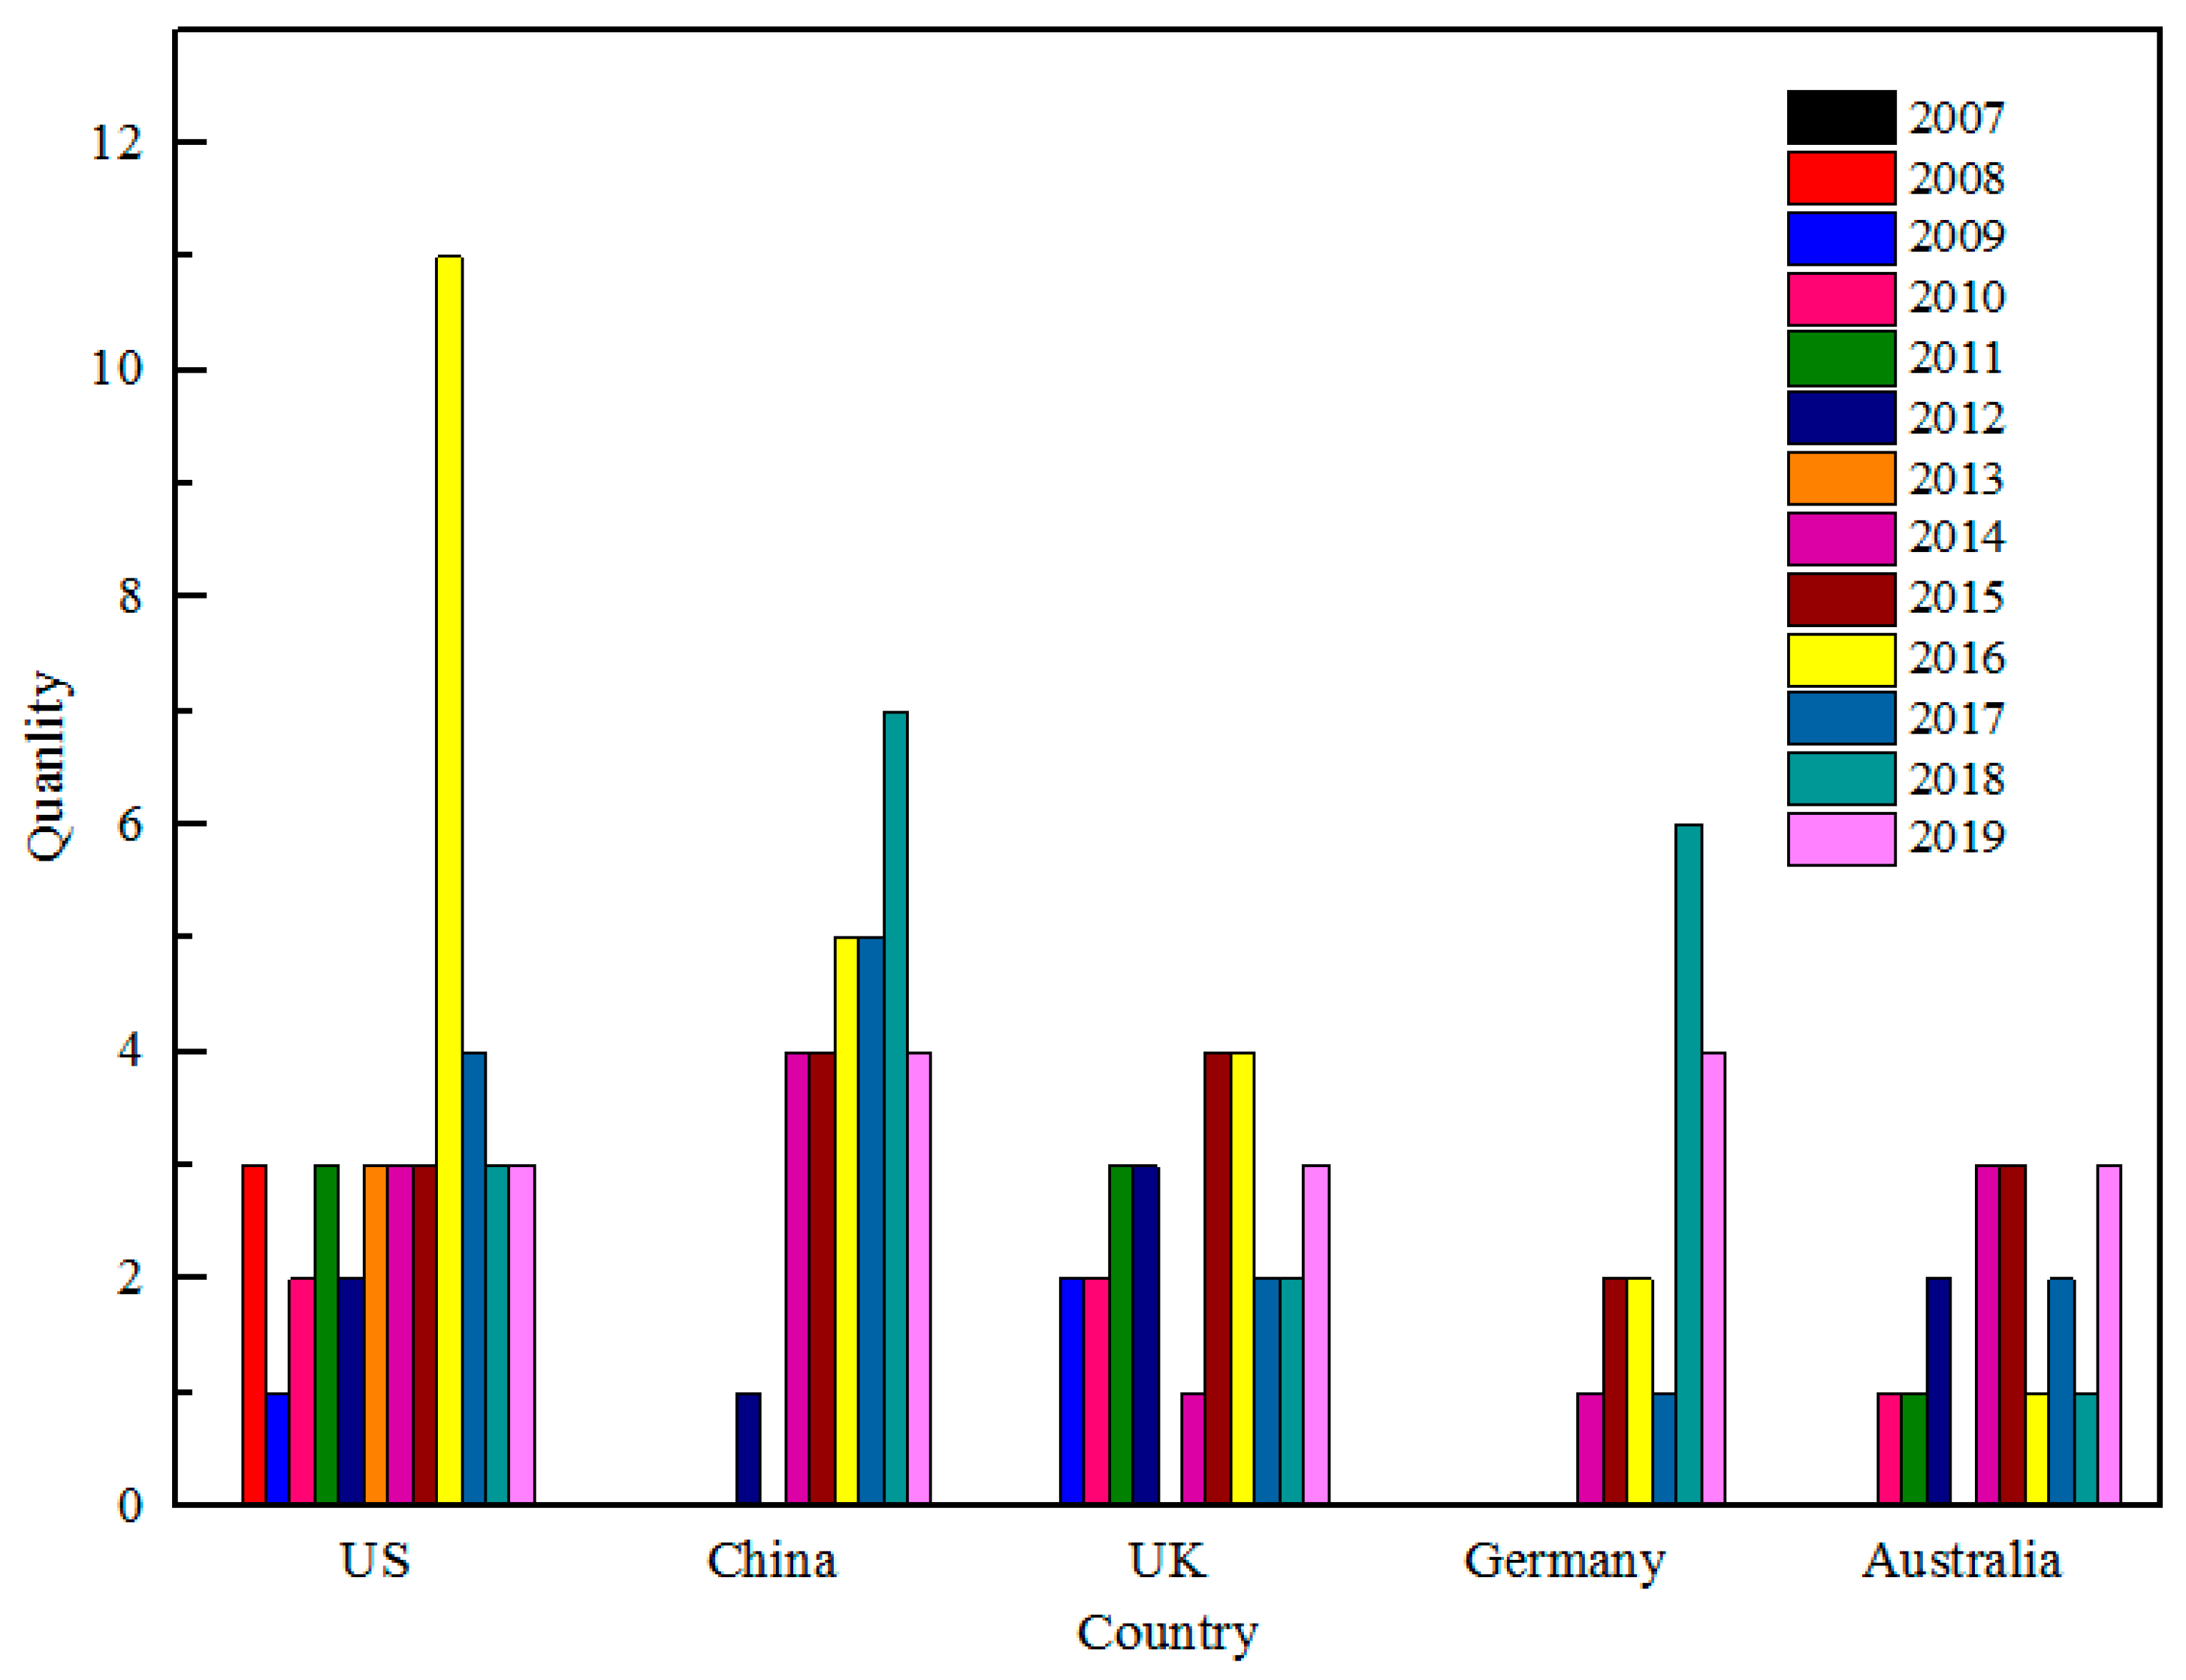
Figure 2 shows the variation of publications regarding the top five countries, where there is a peak occurred between 2015 and 2018. United Kingdom and United States are the pioneers of carbon labeling schemes and have been involved in such studies for 12 years, indicating a remarkable spillover effect in policy design on low-carbon consumption and production. Carbon label related studies were still in progress in developing entities, e.g., China engaged in such issues until 2012. However, China makes great contribution in low-carbon development due to great pressure on its energy structure [23]. In such context, China calls for such a labeling system to change the consumption patterns while upgrading the supply chain to further improve product/service quality [24].
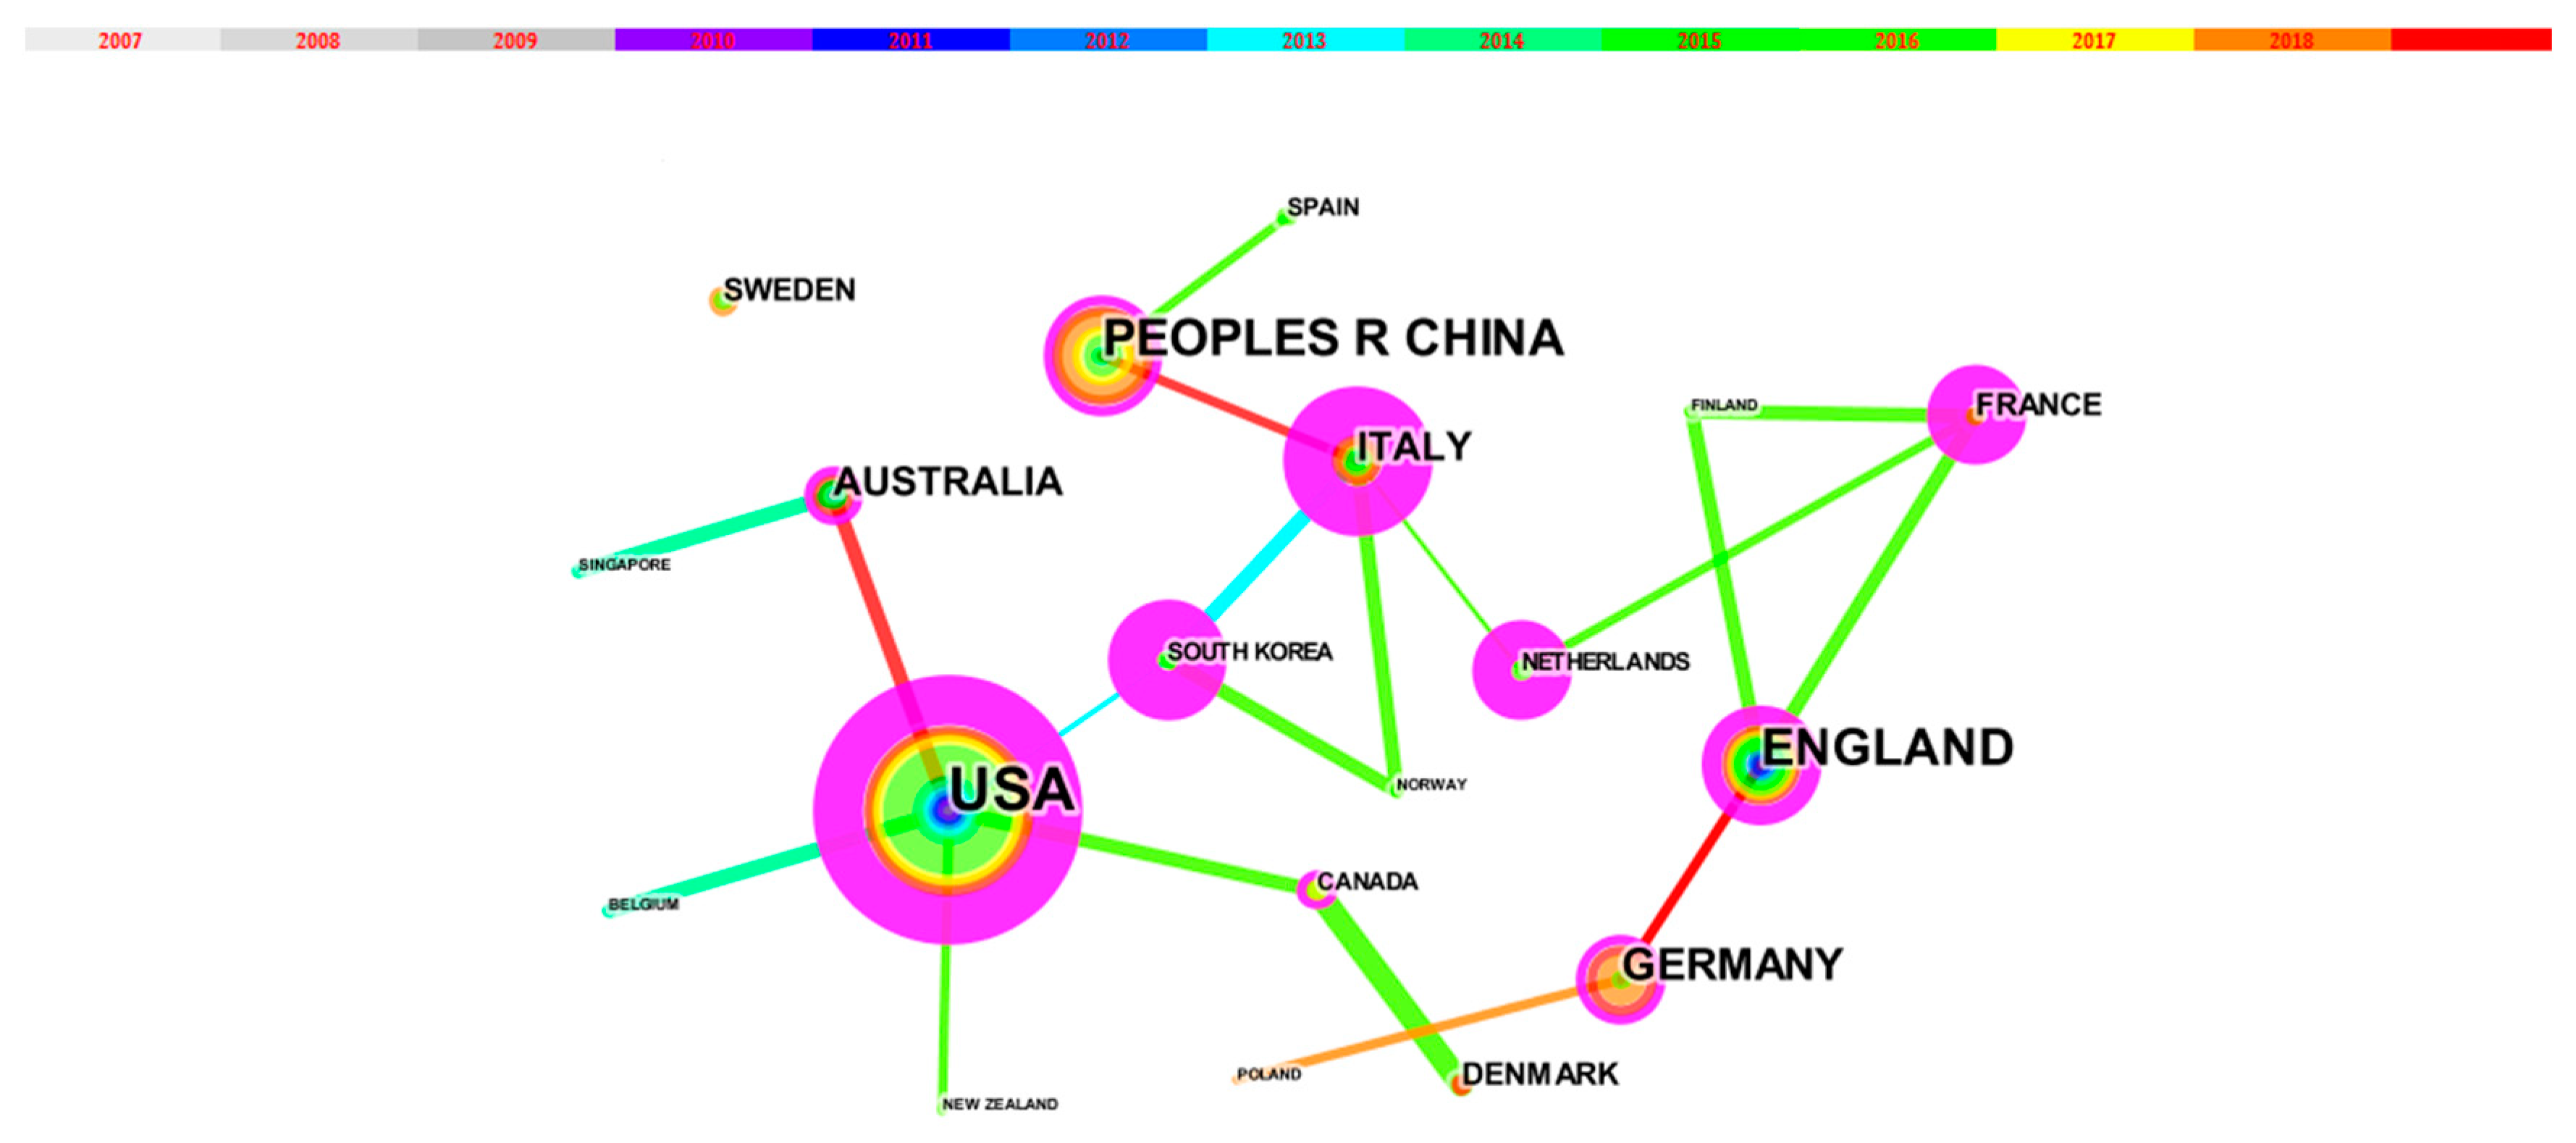
The national collaboration provides a new perspective to assess the academic impact of countries in carbon label related studies. Figure 3 shows the network of national collaboration, in which each country is denoted by a circle. The size of the circle represents the frequency of collaboration. The higher the frequency, the larger the circle. The thickness of the purple circle represents the centrality. The higher the centrality, the thicker the purple circle. The centrality is used to indicate the international status of a country in the carbon labeled studies. The US has the largest degree of centrality (0.98), implying a comparative high international influence in this research field. Italy, in spite of only 13 articles being published, its centrality ranks the second (0.92), indicating great potential in development of international cooperation. For instance, there were at least two authors from other countries in these 13 published papers. China, whilst ranked as the second in the number of publications, its centrality was relatively low, which further required reinforcement of international cooperation to share the research findings.
3.3. Subject Categories and Published Journals
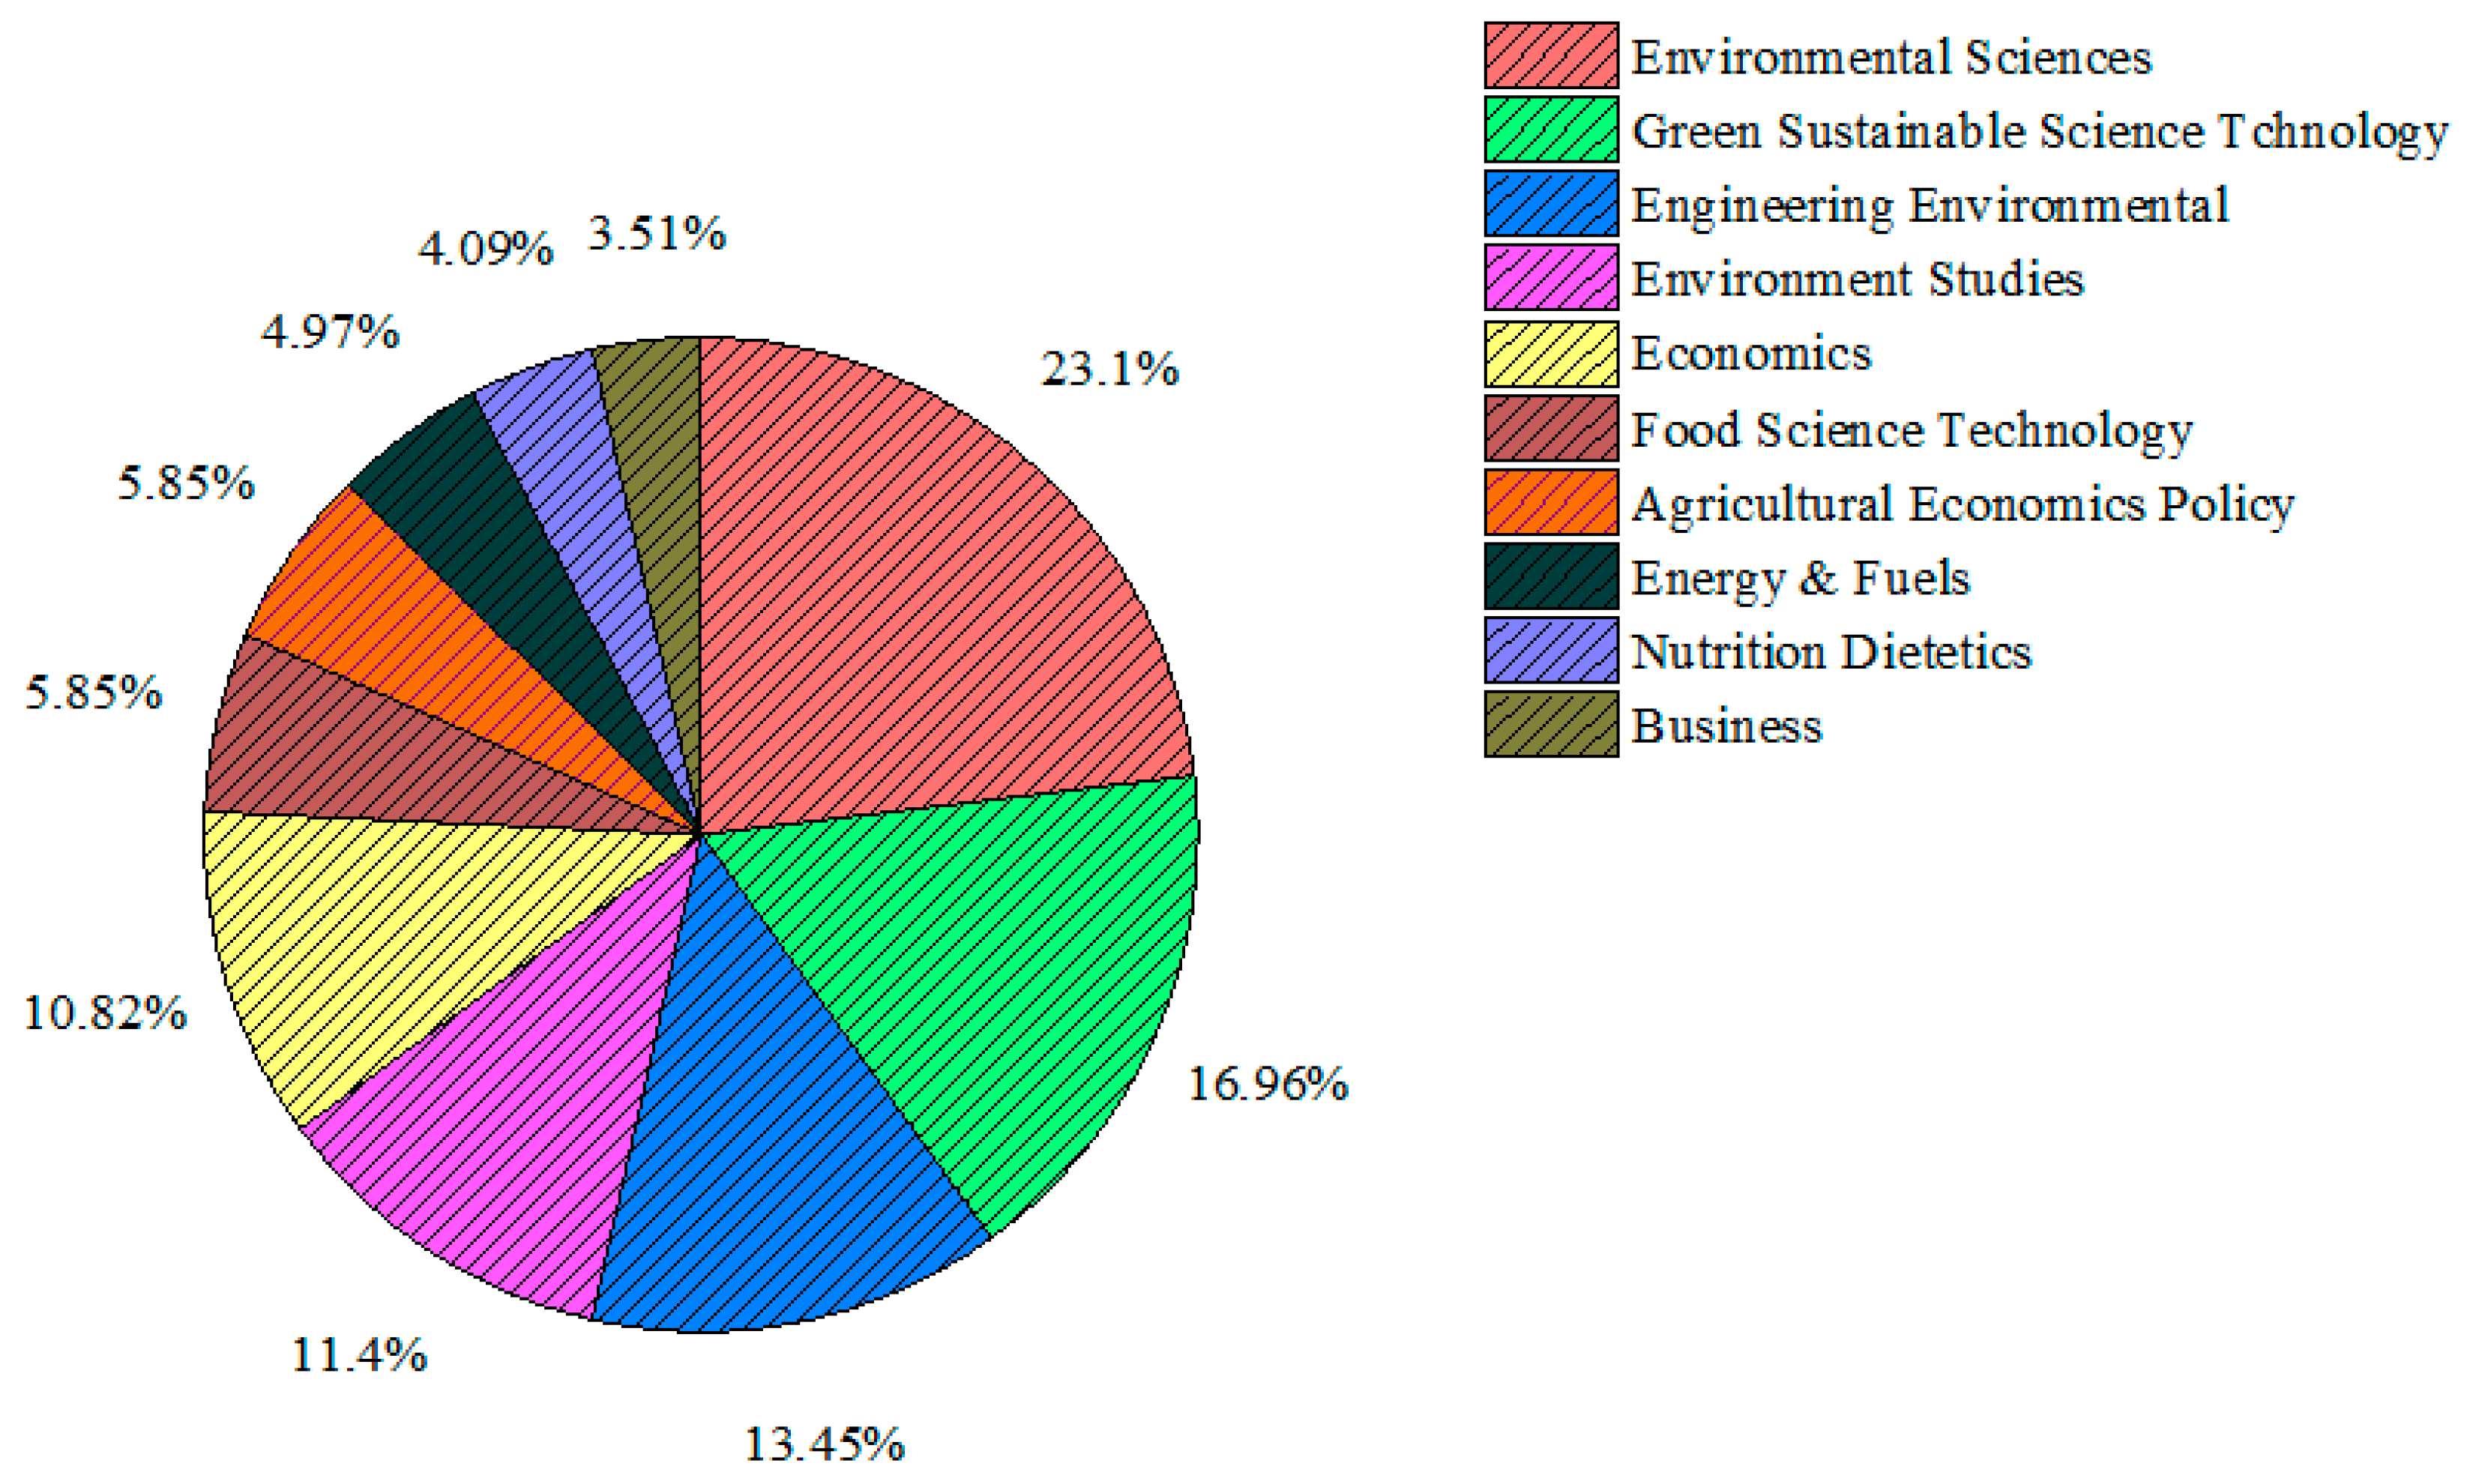
There are wide topics involved in the studies of carbon labeling schemes during the period 2007–2019, which are subject to 44 categories. Figure 4 shows the top 10 categories, and the most common category is “Environmental Sciences”, accounting for 23.1%. The subject categories are mainly related to environment, economy, food, and business, which demonstrate that carbon labeling related studies have a multidisciplinary field.
Carbon label related studies were published in 85 journals. Table 3 shows the top 10 journals, where 86 articles are published, accounting for 49.14%. Most of the journals were from the publisher Elsevier. The Journal of Cleaner Production is highlighted by both of the maximum publications and the total citations. The Journal of Renewable and Sustainable Energy Reviews has the highest impact factor, and the Journal of Food Policy has the highest average number of citations.
3.4. Distribution of Institutions
Table 4 shows the top five institutions ranked by their affiliated first author’s publications. There were 287 institutions involved in the carbon label related studies during 2007–2019. Southwest Jiaotong University was identified as the institution where most of the publications contributed, followed by Central Queensland University, Swedish University of Agricultural Sciences, Eidgenössische Technische Hochschule Zürich (ETH), and Korea University. Southwest Jiaotong University published six papers in the area, where it mainly focused on application of system dynamics and game theory to investigate the interaction among consumer, enterprises, and government in implementation of the carbon labeling scheme to provide insightful policy implications on sustainable consumption and production [25,26]. Central Queensland University proposed carbon labeling scheme as an indicator to reflect the environmental impact of building materials in order to promote green design [27,28]. Swedish University of Agricultural Sciences was ranked as the fourth, where they paid close attention to measurement of uncertainties in carbon labelled food product [29,30]. ETH and Korea University gave emphasis on consumers’ preferences and willingness to pay for carbon labeled products, by which the possible influencing factors were explored [31,32,33].
3.5. Highly Cited Papers
The top 10 highly cited papers in the field of carbon labeling schemes during the period 2007–2019 are given in Table 5. These papers were distributed in seven journals, and three of the highly cited papers were published on Journal of Food Policy. The article published by Grunert et al. [34] was ranked the first with 267 citations. In these highly cited papers, some focused on comparing utilities of various sustainable labeling schemes, including carbon, environmental, and ethical labels [31,35]. Most of the citations related to these highly cited papers were mainly from methodological perspectives, focusing on public attitudes towards organic foods, by means of choice experiments, structured interviews, and questionnaire survey [36,37]. The co-citations were highlighted by exploration of consumer preferences and willingness to pay for organic foods by using Schwartz’s value theory combined with the planned behavior theory [38,39]. However, several studies firmly believed that carbon labels may provide a signal to help consumers change their purchasing behaviors if they can fully understand the associated labeling information [40,41]. In such context, Rugani et al. [42] argued if the underlying method for carbon labeling, i.e., the life cycle assessment, could be improved to be more transparency. In summary, these highly cited papers had addressed the challenges in application of carbon labeling schemes, to lay out a foundation for their future development.
3.6. Keywords
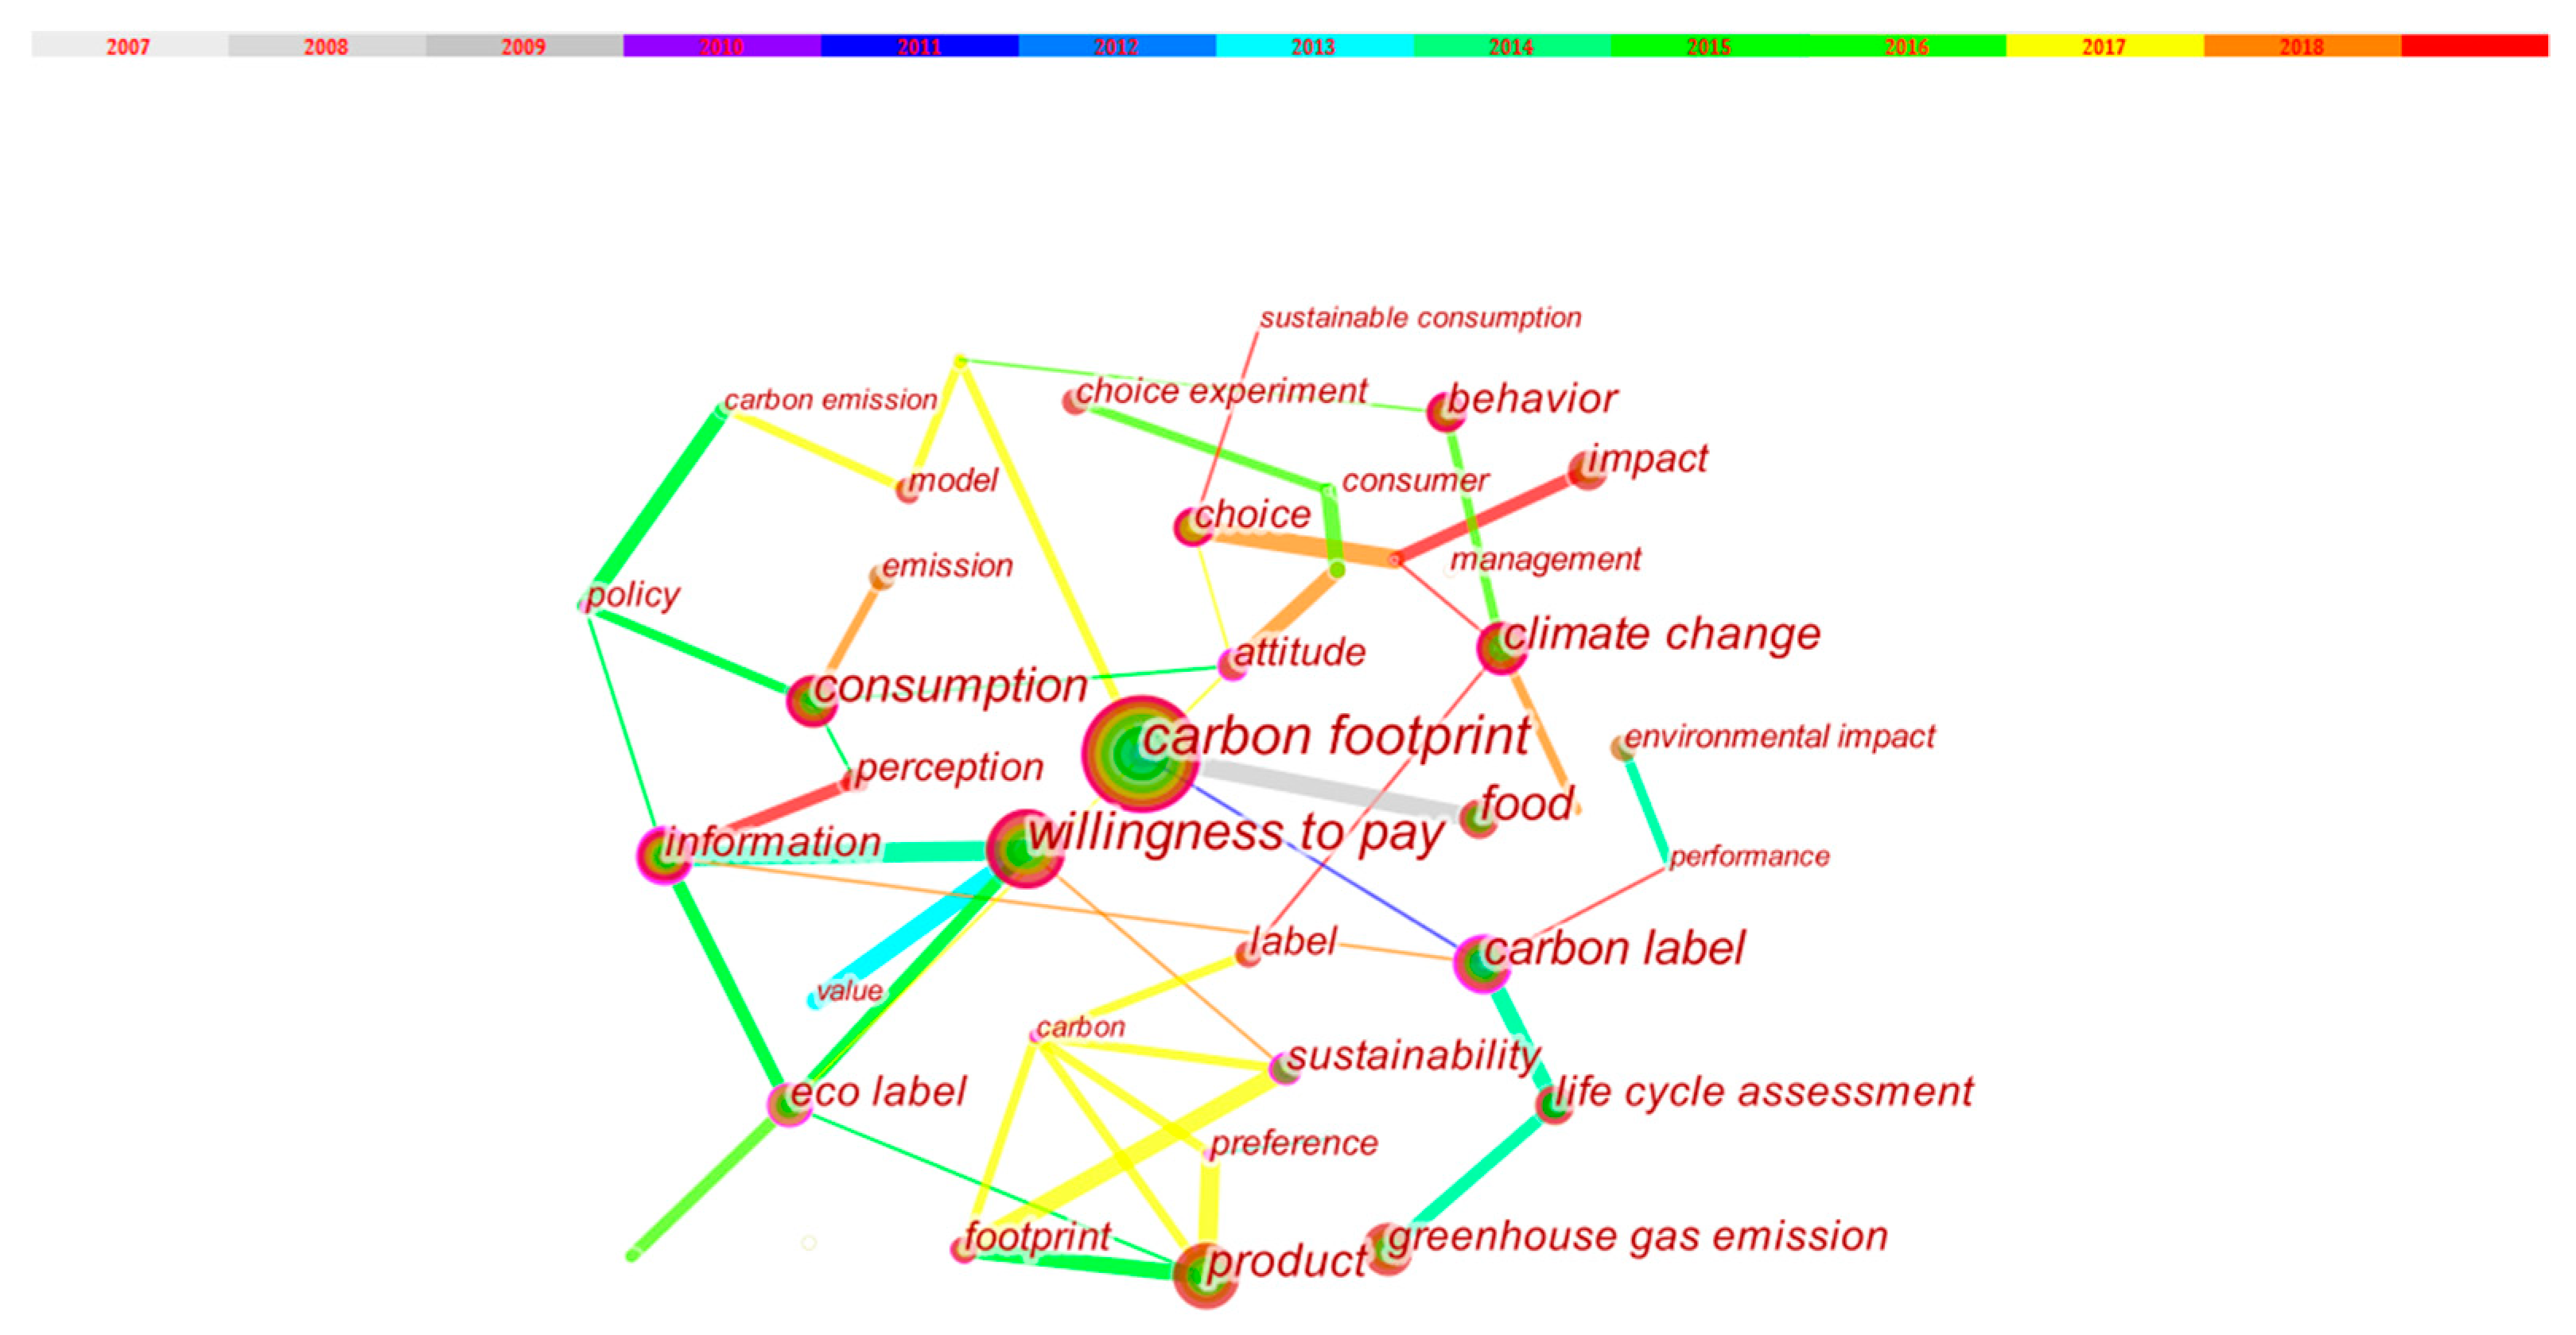
Keywords can be used to reflect the hotspots and topics of research interest in a certain time period [18]. CiteSpace software package was employed to produce a keywords co-occurrence network [43]. In such a process, a number of synonymous keywords were sorted by merging, such as “Carbon label” and “Carbon labeling”, “greenhouse gas” and “GHG”, “life cycle assessment” and “LCA”, etc. Table 6 shows the frequency regarding the keywords occurred during 2007 to 2019. There were 98 keywords obtained, among which 22 keywords appeared above 10 times. During the time period of retrieval, “carbon footprint”, “willingness to pay”, and “food”, were the top three keywords, indicating that surveys on consumer attitudes towards carbon labeled products had aroused widely academic concerns in the past 12 years.
Figure 5 shows the keywords co-occurrence network. The size of the circle represents the occurrence frequency. The lines between the nodes denote their connections. The thicker the lines, the stronger the connection. The lines between nodes are bright in color, indicating that there are a number of research hotspots derived in recent years. The largest circle is “carbon footprint”, by which “carbon label,” “willingness to pay,” “food,” and “attitude” are closed linked. The node with the highest centrality is “carbon label”, by which there are six nodes connected, including “carbon footprint,” “information,” “life cycle assessment,” “performance,” etc. Such phenomenon may imply that life cycle-based assessment is fundamental to the performance of carbon labeling schemes, through which various forms of carbon footprint information is provided. Besides, consumer behavior towards a carbon labeling scheme is full of academic research interests. Consumers are receptors of carbon labeled products or services, and their purchase intentions are critical to implementation of the labeling policy [11,44].
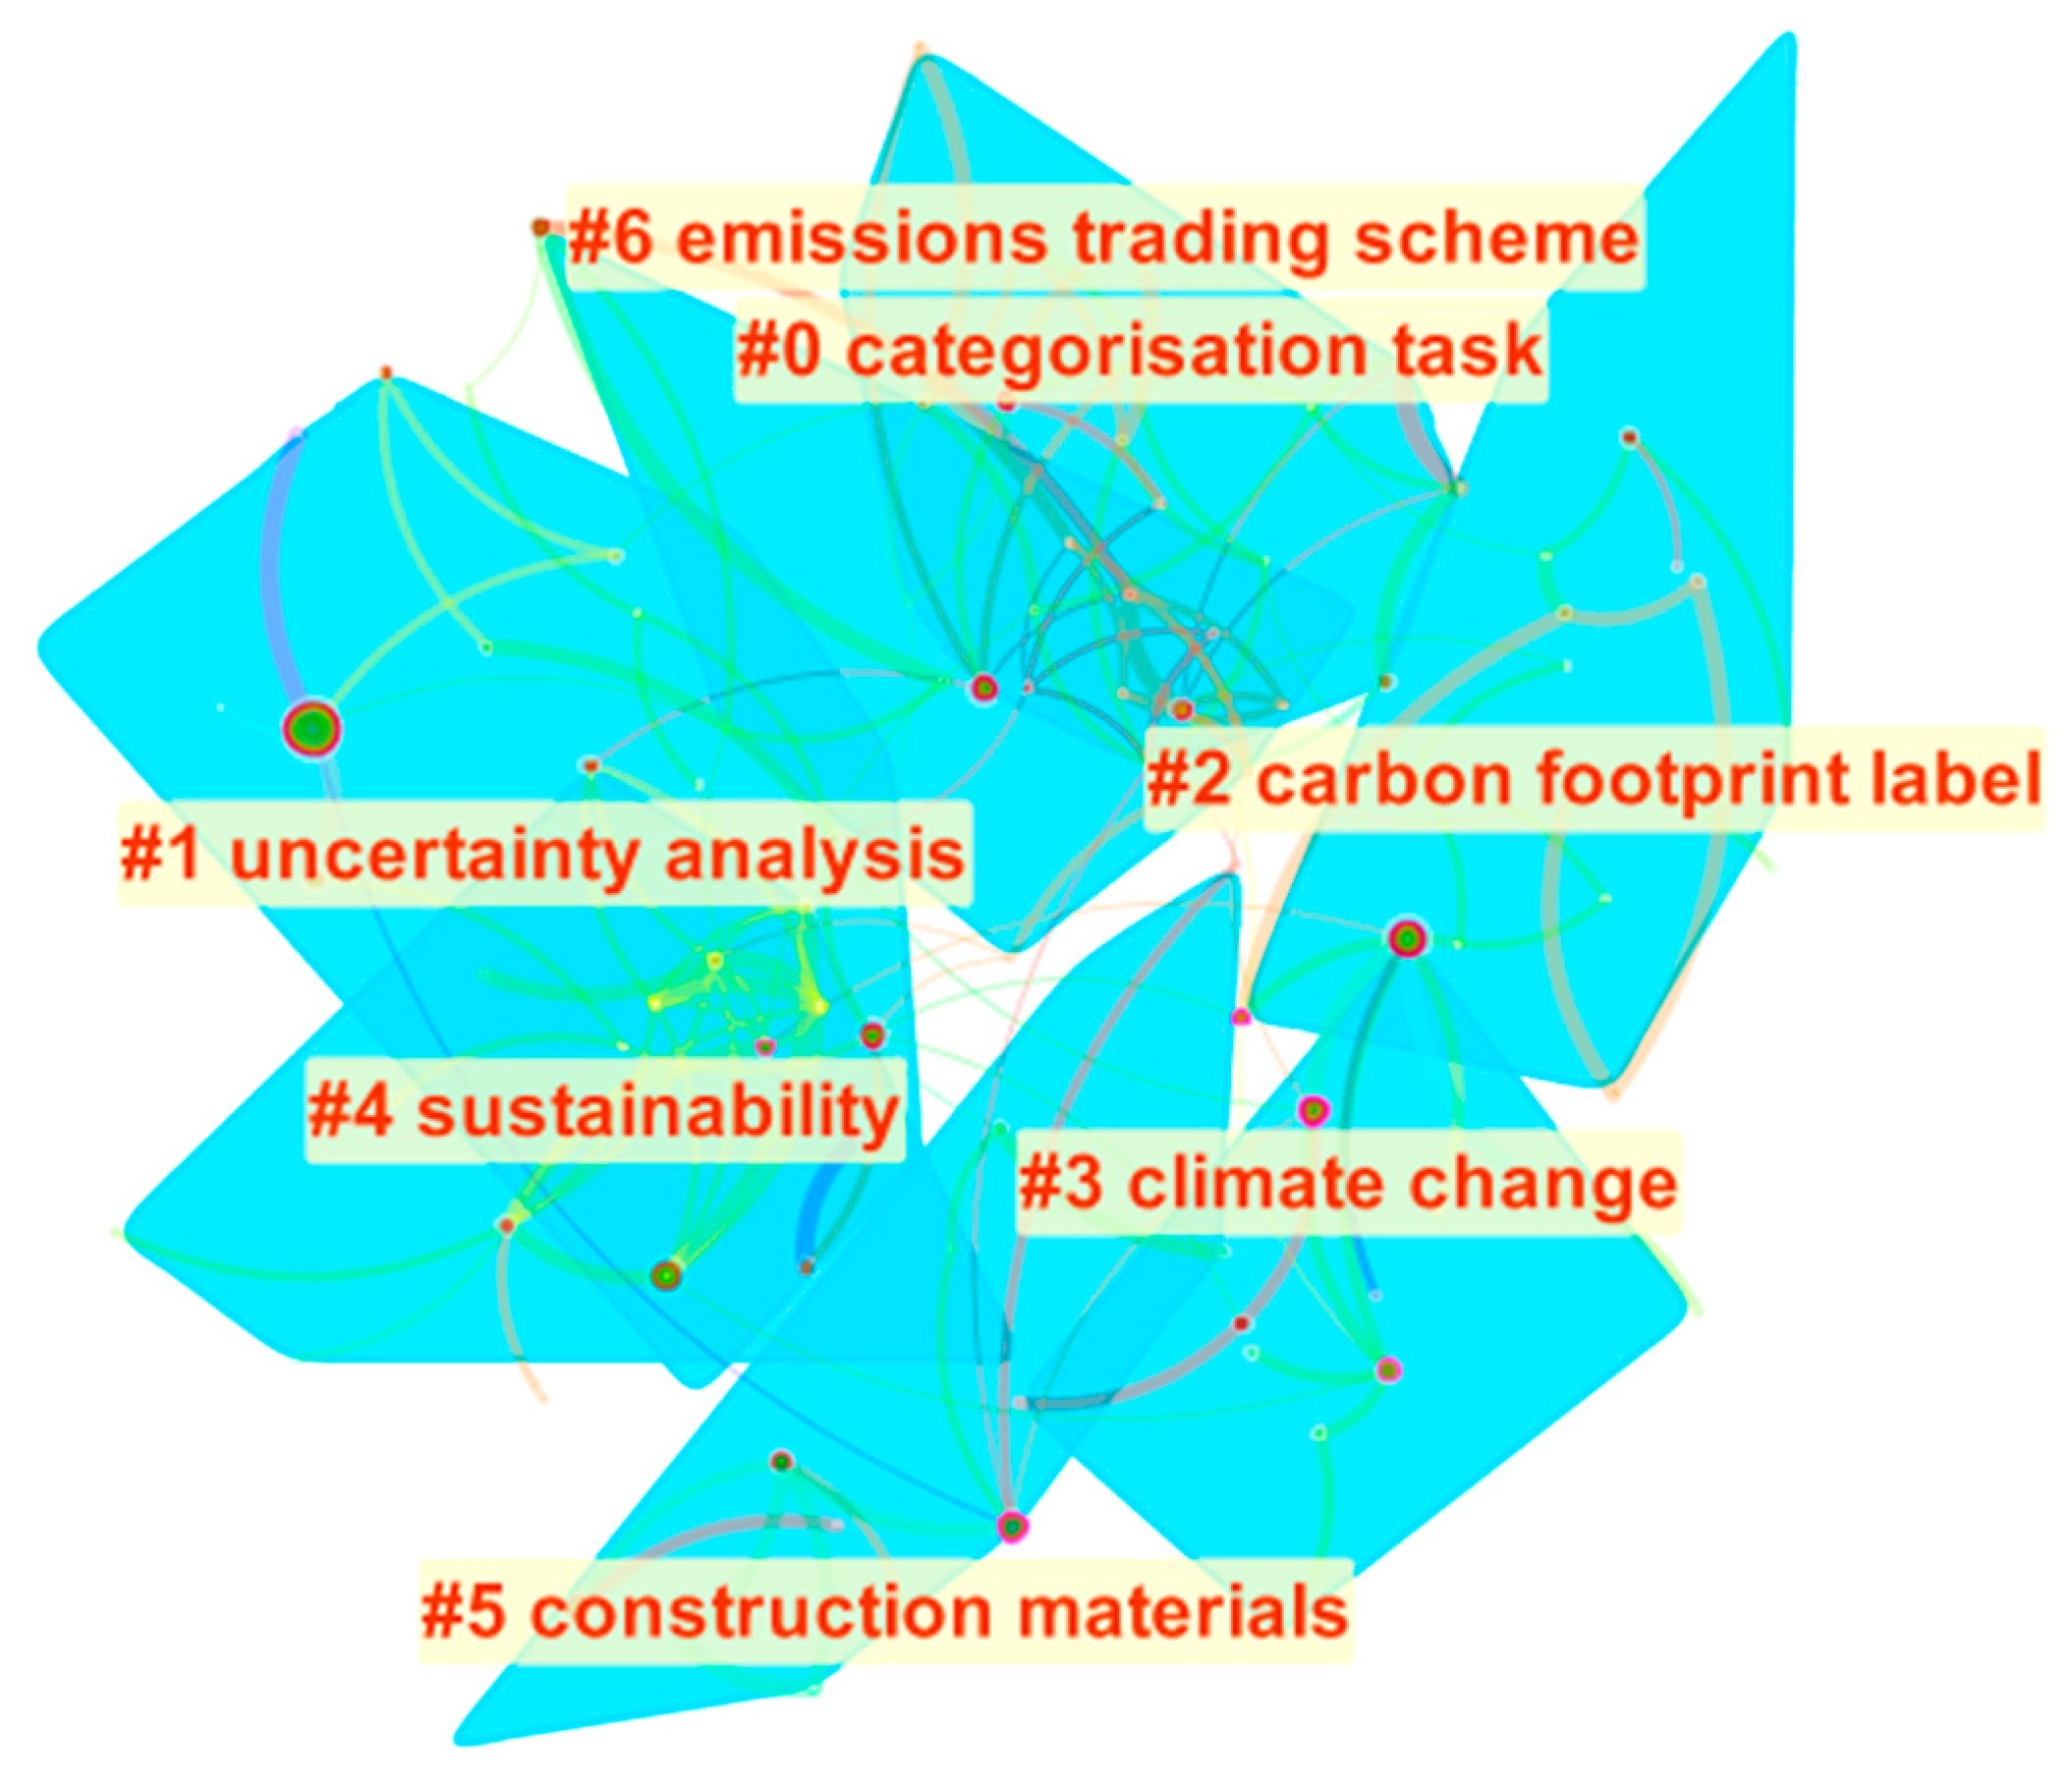
Keywords clustering was conducted to identify the research frontiers of carbon label related studies. There were seven clusters identified, and their corresponding silhouette values were above 0.7 (if above 0.5, the cluster is considered to be reasonable), as shown in Figure 6. The largest cluster (#0) was entitled “categorisation task”, which put emphasis on application of classification to ensure reliable comparisons among similar products with different carbon emissions. The second cluster (#1), was given as “uncertainty analysis”, focusing on uncertainty regarding carbon footprint assessment. The third cluster (#2), as “carbon footprint label”, mainly paid attention to its relative performance, e.g., the environmental impact, energy efficiency etc. The cluster (#3), as “climate change”, indicating public awareness of the implication of carbon labeling scheme.
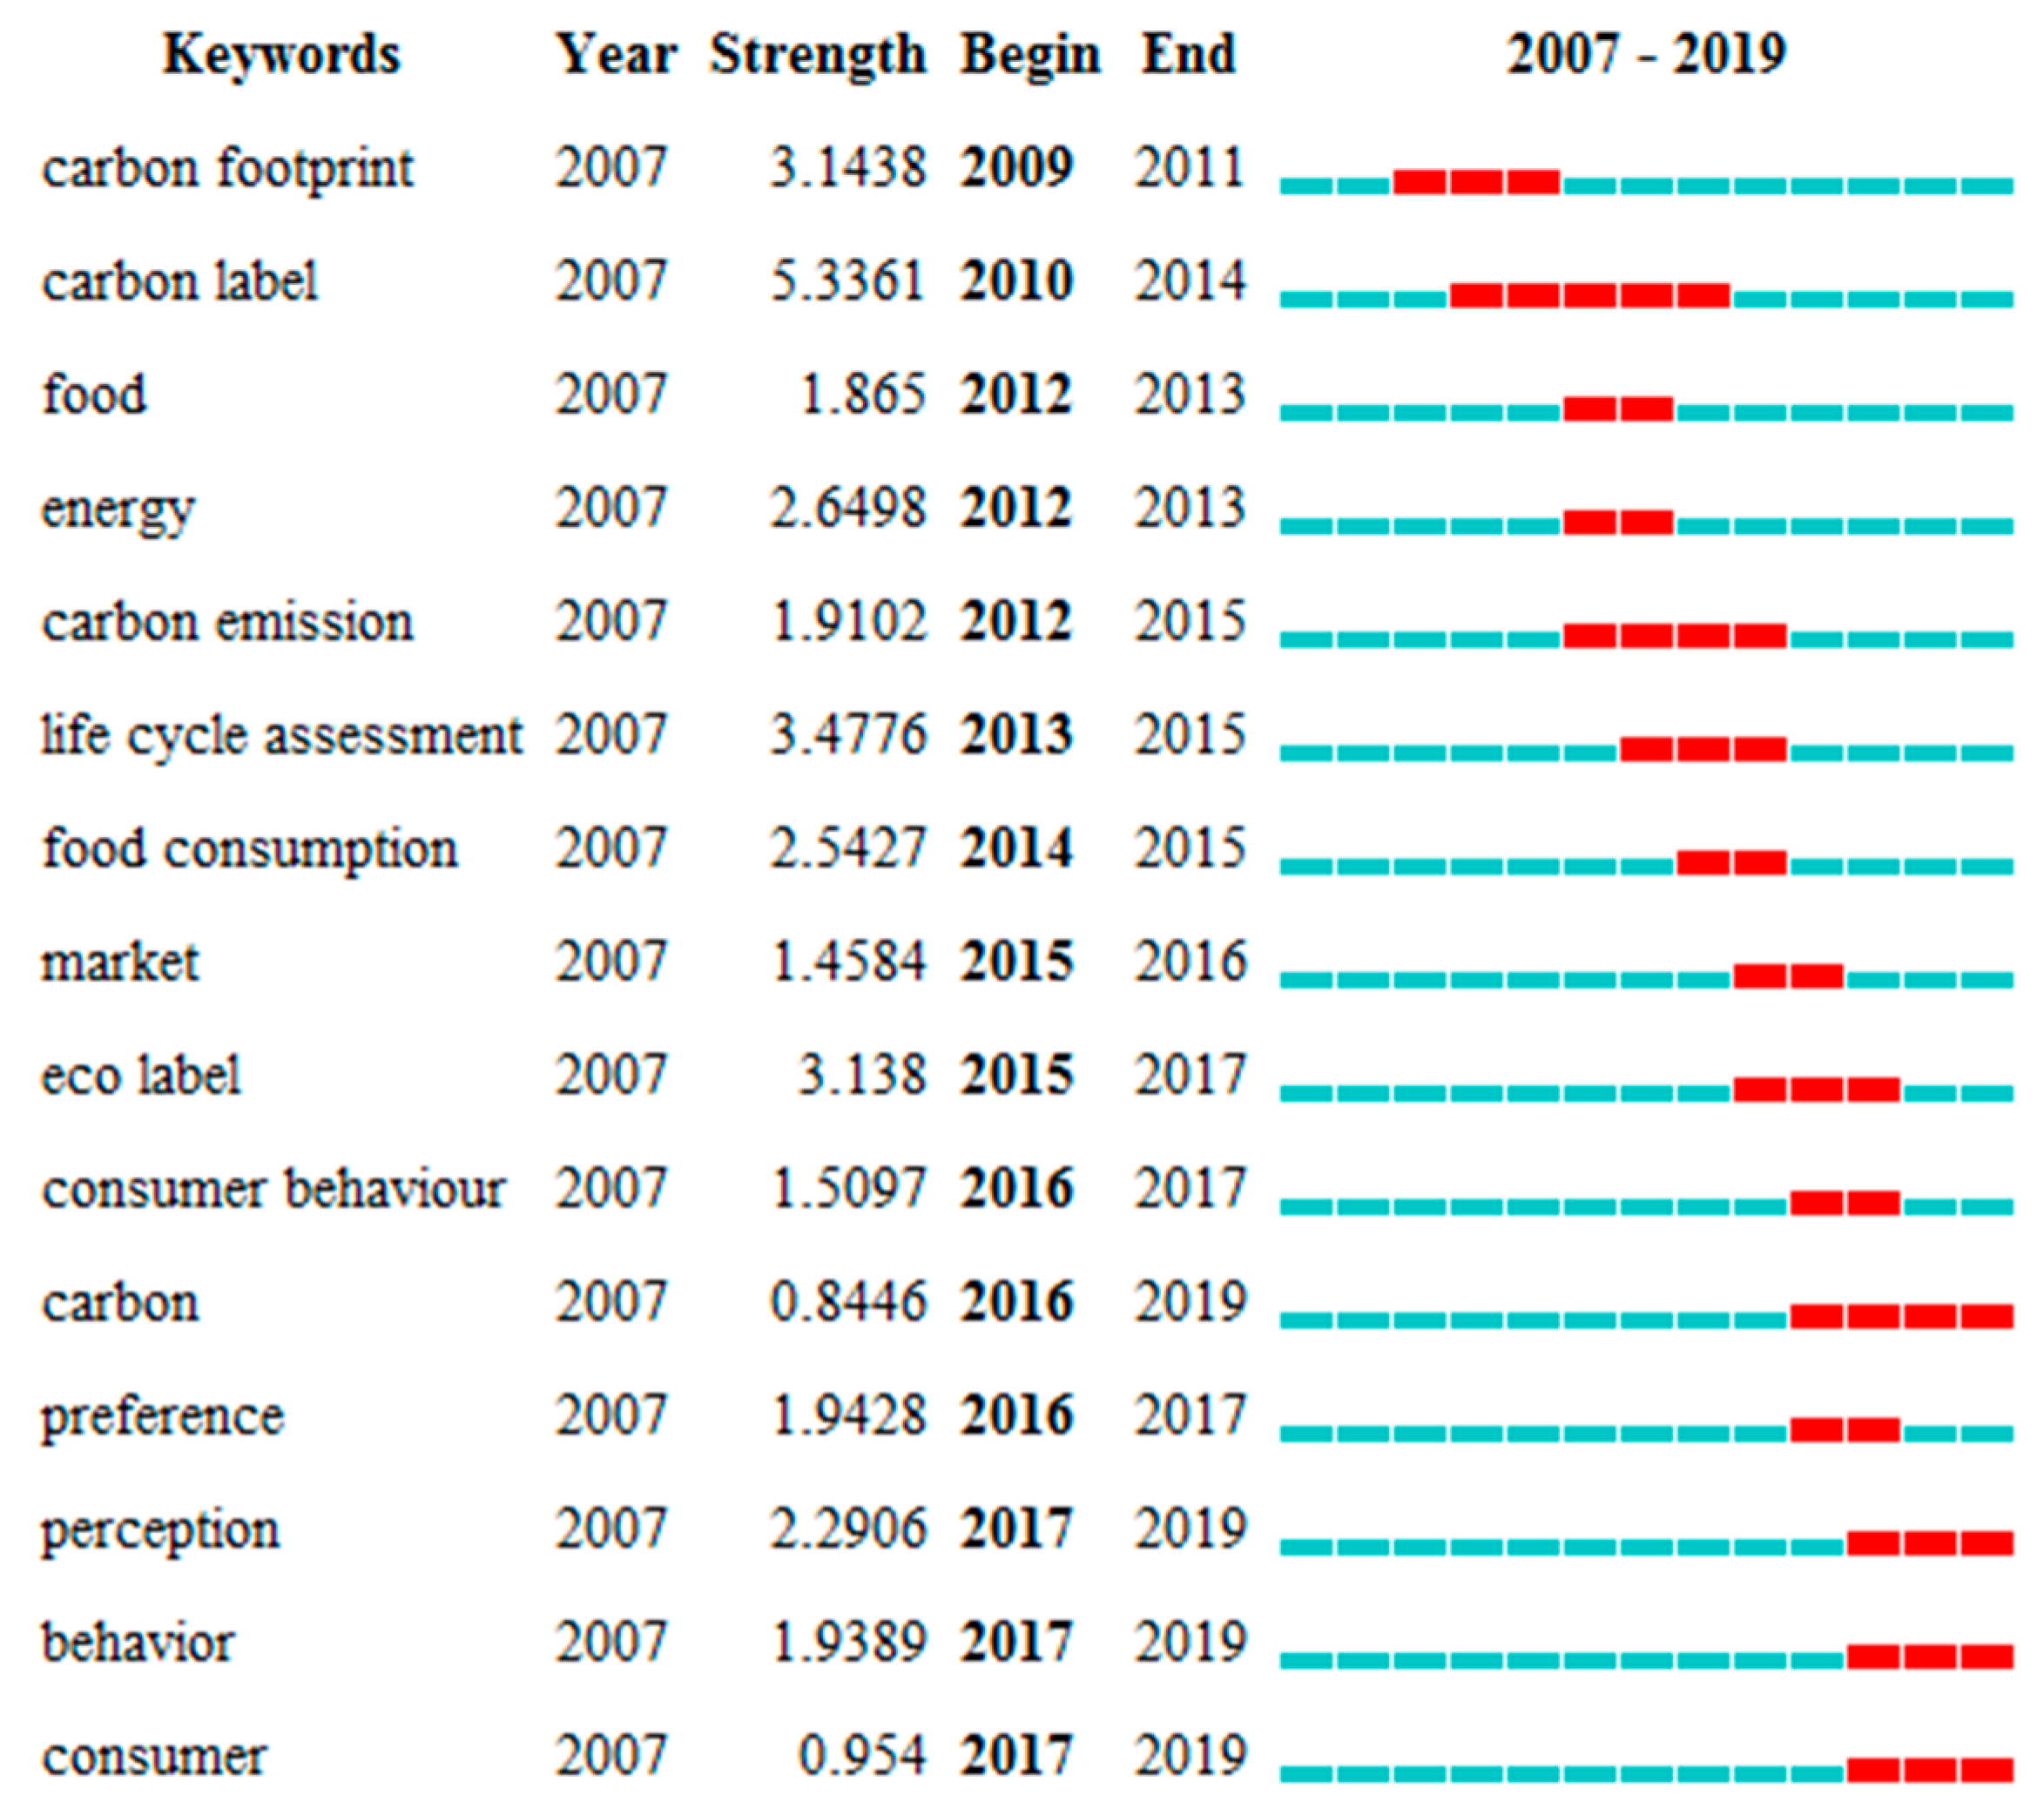
Burst detection was used to determine if any change occurred at the research hotspots [45]. The bursting words refer to the keywords that have suddenly emerged or increased significantly in a short period of time, which may provide insight into identification of future research interests [46]. It is detected by an algorithm proposed by Kleinberg (2002), which generates a list of important words in terms of their frequencies in a finite duration of time [45]. The frequency of the word changes implies possible state transition, indicating as burst [47].
In Figure 7, the red rectangle indicates the strongest bursts, since the corresponding keywords have multiple occurrences in the specific time nodes. “Strength” shown in Figure 7, indicates the bursting words that have been mentioned frequently than any other words in a specific time period [19]. There are 15 keywords with apparent bursts in this study. Such phenomenon implies that the carbon labeling studies have been distinguished by three stages: first from 2007 to 2012, as the carbon labeling scheme was in its infancy, and the burst keywords mainly contained carbon footprint, carbon label, carbon emission, food, and energy. In particular, the labeling policy was gradually extended to the household equipment and construction industry to evaluate its energy efficiency. The second stage was from 2013 to 2015, where the keywords were booming, with life cycle assessment, eco label, food consumption, and market contained. In this stage, studies preferred the utility of the labeling policy and its possible impact on production, trade, and export. For instance, the carbon labeling schemes were compared with other eco-labels to highlight the impact on the development of trade and economy [48]. In the third stage (2016–2019), studies placed emphasis on individuals’ behavior towards carbon labeled product or service by conducting surveys to investigate their perception, preference, and willingness to pay, indicating that they were interests of topics in the carbon label studies [49,50,51,52]. At the same time, multi-stakeholders’ interaction was gradually involved in the carbon label relevant researches [53]. The application of a carbon labeling scheme was gradually transformed from product to service, e.g., tourism. Carbon labeling may affect the behavior of tourists who purchases low-carbon tourism services, though tourists may have pro-environmental intent or not, as well as may display environmentally sustainable behavior or not [54].
4. Discussion and Insights
4.1. Discussion
This study highlights the necessity to make clearer the carbon labeling information and introduces a multiple-perspective co-citation analysis for interpreting co-citation cluster dynamics. Moreover, unlike other studies, the research visualizes a geographical as well as a multidisciplinary importance of carbon labeling schemes. The study underlines the novelty of a co-occurrence network among environments, economies, food, and businesses analyzed in different countries within the environmental science scenario. The research turns to improving network visualization to help consumers better understand the utility of labeling scheme.
The development of research hotspots of carbon labeling schemes has been characterized by the alteration of keywords during the time period 2007–2019. The alterations of keywords show that research aims were changing from carbon labeling as a marketing tool to consumption behavior and attitudes helpful for environmental policies. In recent years, academic circles have focused on consumption behavior in order to understand carbon labelling impact.
The study manages a bibliometric analysis with CiteSpace, which visualizes the evolution trend of carbon labeling scheme. The paper presents an upgrading of the pre-existing literature review, which stopped in 2016 [23]. From 2016 to 2019, scientific research paid more attention to consumer behavior, preference, and attitude towards carbon labeling. The keywords co-occurrence network highlights a linkage between life cycle assessment and carbon labeling, mainly for food and energy, showing academia’s interest about willingness to pay, life cycle assessment, and carbon labeling. Furthermore, there is a strong connection between consumer attitude and consumption choice as well as sustainability label and eco-label. The burst detection highlighted that the investigation of consumer behavior was a topic of interest in the carbon labeling related research field.
Unlike previous studies, the paper takes into consideration countries, such as the U.S., China, and Italy. The literature on carbon labeling schemes coming from China highlights a renewed interest in this issue. China focuses on application of system dynamics investigating the interaction among consumers, enterprises, and governments in implementation of carbon labeling [25,26]. In the future, China might improve its carbon labeling policy and put it into wide practice, influencing market prospect, and providing insightful policy implications on sustainable consumption and production.
4.2. Insights
Though the analytic review on the 175 carbon label related articles, three main challenges have been identified to lay out foundations for future studies. First, precise accounting for carbon emissions is a prerequisite for the labeling practice [29]. Carbon label is also an entitled carbon footprint label, since most of the carbon labels are presented in a footprint form [6]. As implied in the definition of carbon label, lifecycle-based carbon footprinting is a cornerstone to support the presentation of a carbon labeling scheme [55]. However, the system boundary for a specific product or service is difficult to define, which may cause uncertainty in expression of the accounting results; thus, decreasing credibility of the labeling scheme [28]. For instance, existing studies have shown that the carbon footprint of crops are varied by place of production, due to the different system boundary for lifecycle accounting, giving rise to uncertainty in food carbon labeling practice [30]. Such inconsistency may give rise to the same product that has significantly different numerical values labeled on its package [56]. It, thus, calls for improvement of carbon footprint assessment to ensure fair comparison among similar products or services. Besides, a functional unit is generally followed by the life cycle assessment, which limits comparability among various types of products [29]. There is a call for standardized methods to normalize the carbon footprint (regarding products or services) into a common scale, in order to improve the comparability of various labeling schemes [57].
The second issue with the labeling practice is the poor communication with consumers. A number of studies have identified that consumers are confused by the labeling information, even though they are willing to pay certain premium for carbon labeled product or service [58,59]. In such context, research turns to improving visualization to help consumers better understand the utility of labeling scheme. For example, a traffic light colored system was proposed to indicate intensity of product carbon footprint by using the normalization method [60,61]. Whether such form of label suggested is effective in enhancing communication still needs further validation. Moreover, it is worth noting that consumers may be irrational regarding environmental concerns [62]. Conventional research methods, including questionnaires, focus groups, in-depth interviews, etc., have been widely employed to explore consumer perception and willingness to pay for carbon labeled products [63]. However, they may be limited by capturing responses based on consciousness [64,65]. Neuroscience is insightful to identify the conscious and subconscious responses; thus, to discriminate social consciousness and actual behaviors [66,67]. Such a tool has potentials to investigate consumer behavior towards different forms of labeling presentation.
The third issue is the labeling policy overlapping. Taking food as an example, there are a number of labels presented on its package, such as information regarding organic, food miles, animal welfare, and carbon footprint [68]. Various labels not only add complexity in the packaging design, but also give rise to the issues with respect to information credibility and reliability, even resulting in more confusion when consumers purchase products. Thus, the integration of various labeling policies is essential to ensure information coverage and improve labeling form of presentation [48,69]
5. Conclusion and Implications
This study reviews carbon label related studies in the period of 2007–2019 based on a bibliometric analysis. The number of publications, the countries of publications, the categories, the journals, the authors, the institutions, and the highly cited papers are investigated to have a holistic view on the research progress regarding carbon labeling scheme. There are 175 publications identified in the defined period, which presents an increase trend. The publications cover 44 categories and 85 journals. “Environmental Sciences” is the key subject category, and “Journal of Cleaner Production” is the journal with the most publications. 287 institutions have contributed to this research area. U.S. ranks the first in the number of publications, followed by China, UK, Germany, Australia, and Italy.
The study investigates the research progress of carbon labeling schemes, to provide insight into its future development. The outcomes confirm the necessity to optimize life-cycle assessment for carbon labeling schemes as well as the importance of labeling for better visualization. Moreover, the study gives support to the importance of improving carbon labeling schemes to help consumers change their purchasing behaviors.
Some considerations about the implications of this study are introduced. The first regards the cooperation between developing countries and developed countries. Spillover effects may accelerate carbon labeling scheme implementation. Developed countries may transfer experiences, good practices to developing countries to ameliorate carbon-labeling schemes, so as to standardize the schemes internationally. Carbon labels, in particular, and eco-labels, in general, represent a private governance and may enhance compliance. The standardization of the carbon labeling scheme at an international level may be useful to define a limit for the number of categories, as well as for the variety of labels that sometimes overlap each other [6].
The second implication takes into consideration the consumers and their motivation. It is necessary to define strategies to motivate consumers towards decreasing GHG emissions, and facilitate the knowledge of the labeling meanings. At this purpose, green education programs should be defined, involving both consumers and entrepreneurs, as well as eco-advertising, which, using, for instance, social media, encourage people to purchase environmentally friendly products and services.
The third implication concerns the use of new business models and technologies. The use of eco-branding, such as names and symbols, to distinguish environmentally friendly businesses from environmentally unfriendly competitors. The adoption of carbon-branding implements sustainable business practices leading to a reduction of costs, enhancing corporate social responsibility, attracting new markets, and obtaining higher prices [11]. Technologies, e.g., blockchain, which is a public digitalized ledger, may be used in the carbon labeling process to create more transparency and trust in the relationship between customers and sellers (concerning environmentally friendly purchasing).
There is a connection between carbon labeling schemes and life cycle assessment. Future research, thus, would be the optimization of life cycle assessment for labeling accreditation, improvement of labeling visualization for better expression, and normalization of various environmental labels to promote sustainable consumption. How to implement carbon label standards, as well as homogenizing carbon labeling schemes among different countries should be investigated to provide insightful policy implications on sustainable consumption and production. Moreover, future studies may observe that carbon labeling schemes trigger consumers to take pro-environmental purchasing actions. In such cases, the research might deeply analyze the linkages between consumers and enterprises, as well as between enterprises and governments, to implement carbon labeling schemes.
Author Contributions
R.Z. was involved in conceptualization of this study; D.W. implemented the bibliometric analysis; R.Z. prepared the manuscript draft; S.P. revised and edited the manuscript. All authors have read and agreed to the published version of the manuscript.
Funding
This study is sponsored by the National Natural Science Foundation of China (No. 41301639, 41571520), Sichuan Provincial Young Talent Program (No. 2019JDJQ0020), Chengdu Soft Science Fund (2020-RK00-00246-ZF), Sichuan Province Circular Economy Research Center Fund (No. XHJJ-2002).
Conflicts of Interest
The authors declare no conflict of interest.
References
- Zhao, R.; Min, N.; Geng, Y.; He, Y.L. Allocation of carbon emissions among industries/sectors: An emission intensity reduction constrained approach. J. Clean. Prod. 2017, 142, 3083–3094. [Google Scholar] [CrossRef]
- Natural Resources Defense Council. Available online: https://www.nrdc.org/resources/paris-agreement-climate-change (accessed on 17 July 2020).
- Tan, M.Q.B.; Tan, R.B.H.; Khoo, H.H. Prospects of carbon labelling—A life cycle point of view. J. Clean. Prod. 2014, 72, 76–88. [Google Scholar] [CrossRef]
- Carbon Trust. Available online: https://www.carbontrust.com/resources/the-carbon-emissions-generated-in-all-that-we-consume (accessed on 17 July 2020).
- Bolwig, S.; Gibbon, P. Counting carbon in the marketplace: Part 1—Overview paper. In Proceedings of the Global Forum on Trade—Trade and Climate Change, Paris, France, 9–10 June 2009. [Google Scholar]
- Liu, T.T.; Wang, Q.W.; Su, B. A review of carbon labeling: Standards, implementation, and impact. Renew. Sustain. Energy Rev. 2016, 53, 68–79. [Google Scholar] [CrossRef]
- Mostafa, M.M. Egyptian consumers’ willingness to pay for carbon-labeled products: A contingent valuation analysis of socio-economic factors. J. Clean. Prod. 2016, 135, 821–828. [Google Scholar] [CrossRef]
- Ciasullo, M.V.; Maione, G.; Torre, C.; Troisi, O. What about sustainability? An empirical analysis of consumers’ purchasing behavior in fashion context. Sustainability 2017, 9, 1617. [Google Scholar] [CrossRef] [Green Version]
- Carbon Trust. Available online: https://www.carbontrust.com/resources/product-carbon-footprint-labelling-consumer-research-2020 (accessed on 17 July 2020).
- Feucht, Y.; Zander, K. Consumers’ preferences for carbon labels and the underlying reasoning. A mixed methods approach in 6 European countries. J. Clean. Prod. 2018, 178, 740–748. [Google Scholar] [CrossRef]
- Shuai, C.; Ding, L.; Zhang, Y.; Guo, Q.; Shuai, J. How consumers are willing to pay for low-carbon products?—Results from a carbon-labeling scenario experiment in China. J. Clean. Prod. 2014, 83, 366–373. [Google Scholar] [CrossRef]
- Li, Q.W.; Long, R.Y.; Chen, H. Empirical study of the willingness of consumers to purchase low-carbon products by considering carbon labels: A case study. J. Clean. Prod. 2017, 161, 1237–1250. [Google Scholar] [CrossRef]
- Plassmann, K. Comparing voluntary sustainability initiatives and product carbon footprinting in the food sector, with a particular focus on environmental impacts and developing countries. Dev. Policy Rev. 2018, 36, 503–523. [Google Scholar] [CrossRef]
- Zhao, R.; Liu, Y.Y.; Zhang, N.; Huang, T. An optimization model for green supply chain management by using a big data analytic. J. Clean. Prod. 2017, 142, 1085–1097. [Google Scholar] [CrossRef]
- Gadema, Z.; Oglethorpe, D. The use and usefulness of carbon labelling food: A policy perspective from a survey of UK supermarket shoppers. Food Policy 2011, 36, 815–822. [Google Scholar] [CrossRef]
- McKinnon, A.C. Product-level carbon auditing of supply chains. Int. J. Phys. Distrib. Logist. Manag. 2010, 40, 42–60. [Google Scholar] [CrossRef] [Green Version]
- Shi, X.P. The spillover effects of carbon footprint labelling on less developed countries: The example of the East Asia Summit region. Dev. Policy Rev. 2013, 31, 239–254. [Google Scholar] [CrossRef]
- Yang, Y.; Meng, G.F. A bibliometric analysis of comparative research on the evolution of international and Chinese ecological footprint research hotspots and frontiers since 2000. Ecol. Indic. 2019, 102, 650–665. [Google Scholar] [CrossRef]
- Chen, C.M. Science mapping: A systematic review of the literature. J. Data Inf. Sci. 2017, 2, 1–40. [Google Scholar] [CrossRef] [Green Version]
- Falkner, R. The Paris Agreement and the new logic of international climate politics. Int. Aff. 2016, 92, 1107–1125. [Google Scholar] [CrossRef]
- Aldy, J.; Pizer, W.; Tavoni, M.; Reis, L.A.; Akimoto, K.; Blanford, G.; Carraro, C.; Clarke, L.E.; Edmonds, J.; Iyer, G.C.; et al. Economic tools to promote transparency and comparability in the Paris Agreement. Nat. Clim. Chang. 2016, 6, 1000–1004. [Google Scholar] [CrossRef]
- Fujimori, S.; Kubota, I.; Dai, H.; Takahashi, K.; Hasegawa, T.; Liu, J.; Hijioka, Y.; Masui, T.; Takimi, M. Will international emissions trading help achieve the objectives of the Paris Agreement? Environ. Res. Lett. 2016, 11, 104001. [Google Scholar] [CrossRef]
- Liu, W.L.; Wang, C.; Xie, X.; Mol, A.P.J.; Chen, J.N. Transition to a low-carbon city: Lessons learned from Suzhou in China. Front. Environ. Sci. Eng. 2012, 6, 373–386. [Google Scholar] [CrossRef]
- Wang, C.X.; Wang, L.H.; Liu, X.L.; Du, C.; Ding, D.; Jia, J.; Yan, Y.; Wu, G. Carbon footprint of textile throughout its life cycle: A case study of Chinese cotton shirts. J. Clean. Prod. 2015, 108, 464–475. [Google Scholar] [CrossRef]
- Zhao, R.; Han, J.J.; Zhong, S.Z.; Huang, Y. Interaction between enterprises and consumers in a market of carbon-labeled products: A game theoretical analysis. Environ. Sci. Pollut. Res. 2018, 25, 1394–1404. [Google Scholar] [CrossRef] [PubMed]
- Zhao, R.; Zhou, X.; Han, J.; Liu, C. For the sustainable performance of the carbon reduction labeling policies under an evolutionary game simulation. Technol. Forecast. Soc. Chang. 2016, 112, 262–274. [Google Scholar] [CrossRef]
- Wu, P.; Feng, Y. Using lean practices to improve current carbon labelling schemes for construction materials—A general framework. J. Green Build. 2012, 7, 173–191. [Google Scholar] [CrossRef]
- Wu, P.; Low, S.P.; Xia, B.; Zuo, J. Achieving transparency in carbon labelling for construction materials—Lessons from current assessment standards and carbon labels. Environ. Sci. Policy 2014, 44, 11–25. [Google Scholar] [CrossRef] [Green Version]
- Röös, E.; Sundberg, C.; Hansson, P. Uncertainties in the carbon footprint of food products: A case study on table potatoes. Int. J. Life Cycle Assess. 2010, 15, 478–488. [Google Scholar] [CrossRef]
- Röös, E.; Sundberg, C.; Hansson, P. Uncertainties in the carbon footprint of refined wheat products: A case study on Swedish pasta. Int. J. Life Cycle Assess. 2011, 16, 338–350. [Google Scholar] [CrossRef]
- Van Loo, E.J.; Caputo, V.; Nayga, R.M.; Verbeke, W. Consumers’ valuation of sustainability labels on meat. Food Policy 2014, 49, 137–150. [Google Scholar] [CrossRef]
- Lazzarini, G.A.; Visschers, V.H.M.; Siegrist, M. Our own country is best: Factors influencing consumers’ sustainability perceptions of plant-based foods. Food Qual. Prefer. 2017, 60, 165–177. [Google Scholar] [CrossRef]
- Shi, J.; Visschers, V.H.M.; Bumann, N.; Siegrist, M. Consumers’ climate-impact estimations of different food products. J. Clean. Prod. 2018, 172, 1646–1653. [Google Scholar] [CrossRef]
- Grunert, K.G.; Hieke, S.; Wills, J. Sustainability labels on food products: Consumer motivation, understanding and use. Food Policy 2014, 44, 177–189. [Google Scholar] [CrossRef] [Green Version]
- Onozaka, Y.; McFadden, D.T. Does Local Labeling Complement or Compete with Other Sustainable Labels? A Conjoint Analysis of Direct and Joint Values for Fresh Produce Claim. Am. J. Agric. Econ. 2011, 93, 693–706. [Google Scholar] [CrossRef]
- Vermeir, I.; Verbeke, W. Sustainable food consumption: Exploring the consumer “Attitude—Behavioral Intention” gap. J. Argic. Environ. Ethics 2006, 19, 169–194. [Google Scholar] [CrossRef]
- Janssen, M.; Hamm, U. Product labelling in the market for organic food: Consumer preferences and willingness-to-pay for different organic certification logos. Food Qual. Prefer. 2012, 25, 9–22. [Google Scholar] [CrossRef]
- Aertsens, J.; Verbeke, W.; Mondelaers, K.; Van Huylenbroeck, G. Personal determinants of organic food consumption: A review. Br. Food J. 2009, 111, 1140–1167. [Google Scholar] [CrossRef] [Green Version]
- Zander, K.; Hamm, U. Consumer preferences for additional ethical attributes of organic food. Food Qual. Prefer. 2010, 21, 495–503. [Google Scholar] [CrossRef]
- Peschel, A.O.; Grebitus, C.; Steiner, B.; Veeman, M. How does consumer knowledge affect environmentally sustainable choices? Evidence from a cross-country latent class analysis of food labels. Appetite 2016, 106, 78–91. [Google Scholar] [CrossRef] [Green Version]
- Camilleri, A.R.; Larrick, R.P.; Hossain, S.; Patino-Echeverri, D. Consumers underestimate the emissions associated with food but are aided by labels. Nat. Clim. Chang. 2019, 9, 53–58. [Google Scholar] [CrossRef]
- Rugani, B.; Vázquez-Rowe, I.; Benedetto, G.; Benetto, E. A comprehensive review of carbon footprint analysis as an extended environmental indicator in the wine sector. J. Clean. Prod. 2013, 54, 61–77. [Google Scholar] [CrossRef]
- Chen, C.M.; Song, M. Visualizing a field of research: A methodology of systematic scientometric reviews. PLoS ONE 2019, 14, e0223994. [Google Scholar] [CrossRef] [Green Version]
- Zhao, R.; Geng, Y.; Liu, Y.; Tao, X.; Xue, B. Consumers’ perception, purchase intention, and willingness to pay for carbon-labeled products: A case study of Chengdu in China. J. Clean. Prod. 2018, 171, 1664–1671. [Google Scholar] [CrossRef]
- Chen, C.M. CiteSpace II: Detecting and visualizing emerging trends and transient patterns in scientific literature. J. Am. Soc. Inf. Sci. Technol. 2006, 57, 359–377. [Google Scholar] [CrossRef] [Green Version]
- Zhu, J.; Hua, W. Visualizing the knowledge domain of sustainable development research between 1987 and 2015: A bibliometric analysis. Scientometrics 2017, 110, 893–914. [Google Scholar] [CrossRef]
- Kleinberg, J. Bursty and hierarchical structure in streams. Data Min. Knowl. Disc. 2003, 7, 373–397. [Google Scholar] [CrossRef]
- Onozaka, Y.; Hu, W.; Thilmany, D.D. Can eco-labels reduce carbon emissions? Market-wide analysis of carbon labeling and locally grown fresh apples. Agric. Food Syst. 2016, 31, 122–138. [Google Scholar] [CrossRef]
- Röös, E.; Tjarnemo, H. Challenges of carbon labelling of food products: A consumer research perspective. Br. Food J. 2011, 113, 982–996. [Google Scholar] [CrossRef]
- Spaargaren, G.; Van Koppen, C.S.A.K.; Janssen, A.M.; Hendriksen, A.; Kolfschoten, C.J. Consumer responses to the carbon labelling of food: A real life experiment in a canteen practice. Sociol. Rural. 2013, 53, 432–453. [Google Scholar] [CrossRef]
- Zhao, R.; Zhong, S.Z. Carbon labelling influences on consumers’ behaviour: A system dynamics approach. Ecol. Indic. 2015, 51, 98–106. [Google Scholar] [CrossRef]
- Chen, N.; Zhang, Z.H.; Huang, S.M.; Zheng, L. Chinese consumer responses to carbon labeling: Evidence from experimental auctions. J. Environ. Plan. Manag. 2018, 61, 2319–2337. [Google Scholar] [CrossRef]
- Zhao, R.; Zhou, X.; Jin, Q.; Wang, Y.; Liu, C.L. Enterprises’ compliance with government carbon reduction labelling policy using a system dynamics approach. J. Clean. Prod. 2017, 163, 303–319. [Google Scholar] [CrossRef]
- Juvan, E.; Dolnicar, S. Measuring environmentally sustainable tourist behaviour. Ann. Tour. Res. 2016, 59, 30–44. [Google Scholar] [CrossRef]
- Hu, A.H.; Chen, C.H.; Lan, Y.C.; Hong, M.Y.; Kuo, C.H. Carbon-labeling implementation in Taiwan by combining strength-weakness-opportunity-threat and analytic network processes. Environ. Eng. Sci. 2019, 36, 541–550. [Google Scholar] [CrossRef]
- Cohen, M.A.; Vandenbergh, M.P. The potential role of carbon labeling in a green economy. Energy Econ. 2012, 34, S53–S63. [Google Scholar] [CrossRef] [Green Version]
- Zhao, R.; Deutz, P.; Neighbour, G.; McGuire, M. Carbon emissions intensity ratio: An indicator for an improved carbon labelling scheme. Environ. Res. Lett. 2012, 7, 014014. [Google Scholar] [CrossRef]
- Upham, P.; Dendler, L.; Bleda, M. Carbon labelling of grocery products: Public perceptions and potential emissions reductions. J. Clean. Prod. 2011, 19, 348–355. [Google Scholar] [CrossRef]
- Koistinen, L.; Pouta, E.; Heikkilä, J.; Forsman-Hugg, S.; Kotro, J.; Mäkelä, J.; Niva, M. The impact of fat content, production methods and carbon footprint information on consumer preferences for minced meat. Food Qual. Prefer. 2013, 29, 126–136. [Google Scholar] [CrossRef]
- Osman, M.; Thornton, K. Traffic light labelling of meals to promote sustainable consumption and healthy eating. Appetite 2019, 138, 60–71. [Google Scholar] [CrossRef]
- Thøgersen, J.; Nielsen, K.S. A better carbon footprint label. J. Clean. Prod. 2016, 125, 86–94. [Google Scholar] [CrossRef] [Green Version]
- Hornibrook, S.; May, C.; Fearne, A. Sustainable Development and the Consumer: Exploring the role of carbon labelling in retail supply chains. Bus. Strategy Environ. 2015, 24, 266–276. [Google Scholar] [CrossRef]
- Lombardi, G.V.; Berni, R.; Rocchi, B. Environmental friendly food. Choice experiment to assess consumer’s attitude toward “climate neutral” milk: The role of communication. J. Clean. Prod. 2017, 142, 257–262. [Google Scholar] [CrossRef]
- Matukin, M.; Ohme, R.; Boshoff, C. Toward a better understanding of advertising stimuli processing exploring the link between consumers’ eye fixation and their subconscious responses. J. Advert. Res. 2016, 56, 205–216. [Google Scholar] [CrossRef]
- Van Gaal, S.; Lamme, V.A.; Fahrenfort, J.J.; Ridderinkhof, K.R. Dissociable brain mechanisms underlying the conscious and unconscious control of behavior. J. Cogn. Neurosci. 2011, 23, 91–105. [Google Scholar] [CrossRef] [PubMed] [Green Version]
- Khushaba, R.N.; Wise, C.; Kodagoda, S.; Louviere, J.; Kahn, B.E.; Townsend, C. Consumer neuroscience: Assessing the brain response to marketing stimuli using electroencephalogram (EEG) and eye tracking. Expert Syst. Appl. 2013, 40, 3803–3812. [Google Scholar] [CrossRef]
- Zhao, R. Neuroscience as an insightful decision support tool for sustainable development. Iran. J. Public Health 2019, 48, 1933–1934. [Google Scholar] [CrossRef] [PubMed]
- De-Magistris, T.; Gracia, A.; Barreiro-Hurle, J. Do consumers care about European food labels? An empirical evaluation using best-worst method. Br. Food J. 2017, 119, 2698–2711. [Google Scholar] [CrossRef]
- Galli, A.; Wiedmann, T.; Ercin, E.; Knoblauch, D.; Ewing, B.; Giljum, S. Integrating ecological, carbon and water footprint into a “footprint family” of indicators: Definition and role in tracking human pressure on the planet. Ecol. Indic. 2012, 16, 100–112. [Google Scholar] [CrossRef]
Figure 1.
Output of publications during 2007–2019.

Figure 2.
Number of publications regard the top five countries.

Figure 3.
National cooperation network.

Figure 4.
Top 10 subject categories.

Figure 5.
Keywords co-occurrence network.

Figure 6.
Clusters of carbon label studies related keywords.

Figure 7.
Top 15 Keywords ranked by burst detection.


Table 1.
Criteria for literature data retrieval.
| Set | Results | Search Criteria |
|---|---|---|
| #6 | 2016 | (#5 OR #4 OR #3 OR #2 OR #1) AND LANGUAGE: (English) AND DOCUMENT TYPES: (Article OR Review) Indexes=SCI-EXPANDED, SSCI, A&HCI TIMESPAN=2007-2019 |
| #5 | 210 | (TS=(carbon label*) AND TS=(environmental impact)) AND LANGUAGE: (English) AND DOCUMENT TYPES: (Article OR Review) Indexes=SCI-EXPANDED, SSCI, A&HCI TIMESPAN=2007-2019 |
| #4 | 378 | (TS=(carbon label*) AND TS=(consume*)) AND LANGUAGE: (English) AND DOCUMENT TYPES: (Article OR Review) Indexes=SCI-EXPANDED, SSCI, A&HCI TIMESPAN=2007-2019 |
| #3 | 68 | (TS=(carbon label*) AND TS=(life cycle assessment)) AND LANGUAGE: (English) AND DOCUMENT TYPES: (Article OR Review) Indexes=SCI-EXPANDED, SSCI, A&HCI TIMESPAN=2007-2019 |
| #2 | 68 | (TS=(carbon label*) AND TS=(service)) AND LANGUAGE: (English) AND DOCUMENT TYPES: (Article OR Review) Indexes=SCI-EXPANDED, SSCI, A&HCI TIMESPAN=2007-2019 |
| #1 | 1601 | (TS=(carbon label*) AND TS=(product)) AND LANGUAGE: (English) AND DOCUMENT TYPES: (Article OR Review) Indexes=SCI-EXPANDED, SSCI, A&HCI TIMESPAN=2007-2019 |
Table 2.
Top 10 countries with the most published articles from 2007 to 2019.
| Country | Centrality | TP | Percentage (%) |
|---|---|---|---|
| USA | 0.98 | 41 | 23.43 |
| China | 0.21 | 27 | 15.43 |
| UK | 0.38 | 23 | 13.14 |
| Germany | 0.19 | 16 | 9.14 |
| Australia | 0.19 | 14 | 8.00 |
| Italy | 0.92 | 13 | 7.43 |
| Netherland | 0.70 | 10 | 5.71 |
| Sweden | 0.08 | 10 | 5.71 |
| France | 0.61 | 9 | 5.14 |
| South Korea | 0.82 | 7 | 4.00 |
TP: total publications.
Table 3.
Top 10 journals with the most published articles.
| Journals | IF(2018) | EP | Percentage (%) | TC | ACP |
|---|---|---|---|---|---|
| Journal of Cleaner Production | 6.395 | 37 | 21.14 | 149 | 4.03 |
| Food Policy | 3.788 | 10 | 5.71 | 91 | 9.10 |
| Sustainability | 2.592 | 10 | 5.71 | 1 | 0.10 |
| Energy Policy | 4.880 | 6 | 3.43 | 3 | 0.50 |
| International Journal of Life Cycle Assessment | 4.868 | 5 | 2.86 | 7 | 1.40 |
| British Food Journal | 1.717 | 4 | 2.29 | 24 | 6.00 |
| Appetite | 3.501 | 4 | 2.29 | 19 | 4.75 |
| Renewable & Sustainable Energy Reviews | 10.556 | 4 | 2.29 | 14 | 3.50 |
| Environmental Science & Policy | 4.816 | 3 | 1.71 | 26 | 8.67 |
| Energy Economics | 4.151 | 3 | 1.71 | 21 | 7.00 |
EP: entire publications, TC: total citations, ACP: average citation per paper.
Table 4.
Institutions with the most publications.
| Institution | Country | TP |
|---|---|---|
| Southwest Jiaotong University | China | 6 |
| Central Queensland University | Australia | 4 |
| Swedish University of Agricultural Sciences | Sweden | 4 |
| Eidgenössische Technische Hochschule Zürich | Switzerland | 4 |
| Korea University | Korea | 3 |
TP: total publications.
Table 5.
Top 10 cited papers.
| Title | Author | Country and Institution | Journal and Year | TC | ACP |
|---|---|---|---|---|---|
| Sustainability labels on food products: Consumer motivation, understanding and use | Grunert, K.G.; Hieke, S; Wills, J. | Denmark, Aarhus University | Food Policy (2014) | 267 | 44.50 |
| Does local labeling complement or compete with other sustainable labels? A conjoint analysis of direct and joint values for fresh produce claim | Onozaka, Y.; McFadden, D.T. | Norway, University Stavanger | American Journal of Agricultural Economics (2011) | 144 | 16.00 |
| the use and usefulness of carbon labeling food: A policy perspective from a survey of UK supermarket shoppers | Gadema, Z.; Oglethorpe, D. | England, Northumbria University | Food Policy (2011) | 112 | 12.44 |
| Carbon labeling of grocery products: public perceptions and potential emissions reductions | Upham, P.; Dendler, L.; Bleda, M. | England, University Manchester | Journal of Cleaner Production (2011) | 108 | 12.00 |
| Consumers’ valuation of sustainability labels on meat | Van Loo, E.J.; Caputo, V.; Nayga, R.M.; Verbeke, W. | South Korea, Korea University | Food Policy (2014) | 85 | 14.17 |
| Product-level carbon auditing of supply chains Environmental imperative or wasteful distraction? | McKinnon, A.C. | Scotland, Heriot Watt University | International Journal of Physical Distribution & Logistics Management (2010) | 68 | 6.80 |
| The potential role of carbon labeling in a green economy | Cohen, M.A.; Vandenbergh, M.P. | USA, Vanderbilt University | Energy Economics (2012) | 67 | 8.38 |
| Finnish consumer perceptions of carbon footprints and carbon labeling of food products | Hartikainen, H.; Roininen, T.; Katajajuuri, K.M.;Pulkkinen, H.; | Finland, MTT Agrifood Research Finland | Journal of Cleaner Production (2014) | 64 | 10.67 |
| Vulnerability of exporting nations to the development of a carbon label in the United Kingdom | Edwards-Jones, G.; Plassmann, K.; York, E.H.; Hounsome, B.; Jones, D.L.; Canals, L. | Wales, Bangor University | Environmental Science & Policy (2009) | 64 | 5.82 |
| Challenges of carbon labeling of food products: a consumer research perspective | Roos, E.; Tjarnemo, H.; | Sweden, Swedish University of Agricultural Sciences | British Food Journal (2011) | 51 | 5.67 |
TC: total citations, ACP: average citation per paper.
Table 6.
Descriptive statistics of the keywords.
| Keywords | Count | Centrality | Percentage (%) |
|---|---|---|---|
| Carbon footprint | 50 | 0.18 | 7.72 |
| Willingness to pay | 37 | 0.18 | 5.38 |
| Food | 28 | 0.03 | 4.07 |
| Carbon label | 26 | 0.38 | 3.78 |
| Consumption | 26 | 0.20 | 3.78 |
| Product | 24 | 0.07 | 3.49 |
| Climate change | 21 | 0.10 | 3.05 |
| Information | 20 | 0.32 | 2.91 |
| Behavior | 18 | 0.13 | 2.62 |
| Greenhouse gas emission | 18 | 0.04 | 2.62 |
| Life cycle assessment | 17 | 0.19 | 2.47 |
| Eco label | 16 | 0.21 | 2.33 |
| Sustainability | 16 | 0.23 | 2.33 |
| Impact | 15 | 0.06 | 2.18 |
| Choice | 14 | 0.12 | 2.03 |
| Footprint | 14 | 0.12 | 2.03 |
| Perception | 14 | 0.05 | 2.03 |
| Attitude | 13 | 0.20 | 1.89 |
| Label | 13 | 0.03 | 1.89 |
| Choice experiment | 12 | 0.08 | 1.74 |
| Preference | 11 | 0.10 | 1.60 |
| Policy | 10 | 0.14 | 1.45 |
© 2020 by the authors. Licensee MDPI, Basel, Switzerland. This article is an open access article distributed under the terms and conditions of the Creative Commons Attribution (CC BY) license (http://creativecommons.org/licenses/by/4.0/).
Share and Cite
MDPI and ACS Style
Zhao, R.; Wu, D.; Patti, S. A Bibliometric Analysis of Carbon Labeling Schemes in the Period 2007–2019. Energies 2020, 13, 4233. https://0-doi-org.brum.beds.ac.uk/10.3390/en13164233
AMA Style
Zhao R, Wu D, Patti S. A Bibliometric Analysis of Carbon Labeling Schemes in the Period 2007–2019. Energies. 2020; 13(16):4233. https://0-doi-org.brum.beds.ac.uk/10.3390/en13164233
Chicago/Turabian StyleZhao, Rui, Dingye Wu, and Sebastiano Patti. 2020. "A Bibliometric Analysis of Carbon Labeling Schemes in the Period 2007–2019" Energies 13, no. 16: 4233. https://0-doi-org.brum.beds.ac.uk/10.3390/en13164233
Note that from the first issue of 2016, this journal uses article numbers instead of page numbers. See further details here.