Data for Urban Scale Building Energy Modelling: Assessing Impacts and Overcoming Availability Challenges


1
School of Mechanical & Materials Engineering, University College Dublin (UCD), Belfield, D04 V1W8 Dublin, Ireland
2
Industrial Process and Energy Systems Engineering (IPESE), École Polytechnique Fédérale de Lausanne (EPFL), 1951 Sion, Switzerland
*
Author to whom correspondence should be addressed.
Energies 2020, 13(16), 4244; https://0-doi-org.brum.beds.ac.uk/10.3390/en13164244
Submission received: 8 June 2020
/
Revised: 31 July 2020
/
Accepted: 3 August 2020
/
Published: 17 August 2020
(This article belongs to the Section G: Energy and Buildings)
Abstract
:Data are essential to urban building energy models and yet, obtaining sufficient and accurate building data at a large-scale is challenging. Previous studies have highlighted that the data impact on urban case studies has not been sufficiently discussed. This paper addresses this gap by providing an analysis of the impact of input data on building energy modelling at an urban scale. The paper proposes a joint review of data impact and data accessibility to identify areas where future survey efforts should be concentrated. Moreover, a Morris sensitivity analysis is carried out on a large-scale residential case study, to rank input parameters by impact on space heating demand. This paper shows that accessible data impact the whole modelling process, from approach selection to model replicability. The sensitivity analysis shows that the setpoint and thermal characteristics were the most impactful for the case study considered. Solutions proposed to overcome availability and accessibility issues include organising annual workshops between data users and data owners, or developing online databases that could be populated on a volunteer-basis by data owners. Overall, overcoming data challenges is essential for the transition towards smarter cities, and will require an improved communication between all city stakeholders.
1. Introduction
Reducing greenhouse gas emissions is a major concern worldwide. Among the various end-use sectors, buildings represent a significant part, consuming approximately one third of the world final energy and emitting slightly less than 30% of the total CO2 emissions [1]. It is thus necessary to account for the building sector when addressing energy use and greenhouse gas emission concerns. Worldwide, measures have been taken to improve building energy efficiency. In Europe, building sustainability is addressed, among others, in the Energy Performance of Buildings Directive (EPBD) and the Energy Efficiency Directive (EED) [2,3].
Urban building energy modelling is a relatively new field [4,5], where building thermal behaviour is modelled over a large-scale, typically in the range of “several dozens to thousands of buildings” [4]. Building models at an urban scale are used to understand the past and current demand patterns, to test future scenarios and assist decision makers with making the best choices for existing and future cities. Thus, building energy models are useful for multiple stakeholders, from policymakers to municipalities or utilities, and they have an important role to play in the transition towards a more efficient system [5]. Urban energy modelling involves three steps: data collection, model development and validation [4].
In the literature, building stock models adopt either a top-down or bottom-up approach [6,7]. The bottom-up approaches will be the focus of the present paper. Indeed, these rely on the modelling of individual buildings and, thus, are more adequate to account for the varying building characteristics in cities worldwide. In the literature, bottom-up techniques are typically divided into two or three subcategories [6,7,8,9,10]; in the remainder of this paper, the following classification is considered:
- Statistical or black box (BB);
- Physics-based or white box (WB);
- Hybrid or grey box (GB).
The present paper considers the distinction between the above three categories to be dependent on the model parameter identification technique [11]. WB models are developed using principles from physics (e.g., heat transfer equations) and expert knowledge or construction characteristics. Such models require the availability of extensive databases that characterise the materials used for construction. They also rely on the availability of stochastic models to represent the impacts of some of the gains, such as appliances, presence, comfort or environmental conditions. BB models are data-driven models, constructed with historical data and which parameters typically lack physical meaning [6,11]. GB models, also called hybrid models, combine both “physics and statistics” [8], i.e., rely on “physical knowledge of the system and data fitting techniques” [12]. As described by Koulamas et al., GB models “use the mathematical structure of the physics-based white box models and measured data to estimate their parameters” [10]; models combining WB and BB techniques have also been classified as GB [12].
Each of the three modelling approach encompasses various sub-approaches. Examples are given below (the list is non-exhaustive):
- WB: models developed using building characteristics/user knowledge and simulation softwares, such as Energy Plus, TRNSYS, ESP-r, etc. [7,8,12]. A review of simulation tools that have been used to estimate building energy demand at urban scale was carried out by Sola et al. [13]. The WB approach also includes reduced order models developed using expert knowledge and/or building characteristics;
These three modelling techniques have been utilised to develop urban-scale simulation platforms to estimate building energy use, among others. For example, CitySim is an “urban energy use simulator” [16], which thermal model relies on the resistance/capacitance approach [17,18]; the tool has been applied to case studies in Lausanne and Zürich (Switzerland), among others [16,18]. The ECCABS model relies on a first order approach, and has been applied at city and country scale to calculate the annual final energy use of buildings [19,20]. The Simstadt platform, which is able to calculate the monthly heat demand of buildings at large-scale, relies on Tabula data, 3D building models (as per CityGML standard) and follows ISO13790 [21,22]; the platform has been applied to case studies in Ludwigsburg and Essen in Germany, among others [21,22]. Another example is the Urban Modelling Interface or UMI, which evaluates “environmental performance of neighbourhoods and cities with respect to operational and embodied energy use, walkability and daylighting potential” [23]. The energy module is based on Energy Plus, and the platform has been applied to multiple case studies in the US or Portugal, among others [23,24]. Further examples of urban building energy models are reviewed in the work of Sola et al. and Reinhart and Cerezo Davila [4,13,25].
For all three modelling approaches, data are essential for model development and deployment, as data are required to develop, validate and use the model. The model outcome accuracy is not necessarily limited to the model accuracy alone, but is also largely influenced by the input data [5], which should not be neglected. Bhandari et al. highlighted that “the uncertainties of various input parameters for a model generally increase with the breadth and depth of possible inputs, leading to unrealistic simulation results” [26].
Despite local and transnational data providers, building energy modellers have struggled to obtain sufficient and accurate data at a large-scale [4,27,28,29,30,31]. The challenge is not new. Back in 2001, Jones et al. pointed out the issue: “because it is practically impossible to collect and maintain detailed data for every building, urban planning models must work with relatively low level data” [32]. More recently, in 2014, Perez noted the “ambiguous role of data, always needed but rarely available” [31], while Ioannou and Itard highlighted that the difficulty of obtaining reliable building data and occupant-related information is “one of the most important problems when it comes to simulating building energy consumption” [33]. Hecht et al. stated that “despite the importance of the built environment, both for researchers and planners, statistical data on buildings are often not up to date, strongly spatially aggregated or only very locally available” [34]. This lack of building data has been identified as an obstacle to research progression [35,36], and to the development of adequate policies and the monitoring of their impact [36,37,38].
While the data challenges faced by building energy modellers have been acknowledged, they tend not to be comprehensively addressed in the literature [5,31], with papers focusing on the end results rather than the data obstacles to overcome. For example, Rager et al. mentioned that “only few publications tackle the problem of the creation of urban dataset” [39]. Perez mentioned that “with some partial exceptions, the subject of input data quality in the literature relating to urban energy micro- and macro-simulation research tends to be little discussed or even overlooked entirely” [31]. While building models of various complexities have been developed in an ‘ideal context’ with synthetic data, the reality of data availability cannot be ignored. To improve building modelling at urban scale, these data issues need to be highlighted and faced. Innovative strategies to overcome these challenges should be developed and shared to improve modelling efficiency and reduce difficulties for future research.
The present paper addresses the aforementioned research gap and associated opportunity; more specifically, the present work:
- Discusses the impact that a lack of data has on the different steps of building energy model development;
- Addresses data prioritisation by:
- ○
- Reviewing outcomes of small- and large-scale sensitivity analyses as published in the literature;
- ○
- Carrying out a large-scale sensitivity analysis on a new case study using the Morris method;
- Proposes short- and medium-term solutions to improve data availability and accessibility at urban scale.
In Section 2, the current data situation at urban scale is reviewed and data requirements are placed in perspective with the modelling approach. The impacts of a lack of data on the development of urban energy models and model outcomes are addressed in Section 3 and Section 4, respectively. Finally, solutions to improve data challenges are proposed in Section 5, and conclusions are provided in Section 6. Figure 1 summarises the structure of the present paper, showing the key issues and terms addressed, the current data challenges and ways to overcome them.
2. Data for Building Energy Modelling at Urban Scale
Input data are defined as “those aspects who impact or correlate with the output data” [15]. A wide range of data is required to develop building thermal models and/or to apply these models to a case study. As highlighted in the Introduction, urban scale building modellers have struggled to collect all the data required to develop their models. This lack of data is discussed in the following section. The terms ‘data availability’, ‘data accessibility’ and ‘data quality’ are firstly defined and influencing factors are reviewed, before discussing data required for different building models and reviewing data sources available.
2.1. Building Data: Definitions and Influencing Factors
2.1.1. Data Availability and Accessibility
Data availability is defined here as the existence of building data in any format (e.g., paper format, digital format). Data availability is influenced by four main factors at urban scale:
- Time resolution: annual energy data do not involve the same monitoring, processing and/or storing efforts than hourly or sub-hourly measurements. Thus, hourly datasets are typically less available than datasets with coarser resolutions.
- Level of aggregation: databases are characterised by different levels of aggregation, from a single building zone to average values over a country or larger. Obtaining individual building characteristics for a whole district or city is much more challenging [20,29,30,34]. Typically, the less data are aggregated, the higher the diversity. Berthou et al. consider four levels of data diversity, from low to very high, depending on the format of the data [41]:
- ○
- Median or average value: low diversity;
- ○
- Probabilistic function at country scale: medium diversity;
- ○
- Probabilistic function at urban scale: high diversity;
- ○
- Information at building level: very high diversity.
Probabilistic functions have been used in several case studies, but due to lack of data at the individual building level, their definition typically relies on assumptions (e.g., extrapolation from smaller/other case studies) [28]. - Features and building type: some building data are easier to obtain than others. For instance, building dimensions are typically available in land registers and more geometrical details are becoming available, thanks to the use of technologies such as the airborne laser scanner or photogrammetry in larger cities [34,40]. Other data such as air change rate are challenging to measure at a large-scale and are typically not documented at urban scale [31]. Detailed occupant-behaviour data are also particularly challenging to obtain at a single building level, as collecting occupant behaviour profiles/information is time-consuming, expensive and requires occupant involvement [42]; however, progress has been made in recent years and datasets have been increasingly collected [43,44]. Energy consumption data are not systematically monitored at the adequate level of aggregation and time resolution for building energy modellers. Moreover, system boundary may be challenging to define. In terms of energy data, a distinction can be made between residential and non-residential buildings [45]. In non-residential buildings, indoor environmental data and energy consumption tend to be monitored to ensure the implementation of standards specific to the workplace. In residential buildings, the indoor monitoring is not as extensive and typically consists of a single temperature measurement at a central location. However, more advanced monitoring systems are being commercialised for households, which would be a first step towards collecting more data in the residential sector [45].
Data accessibility is defined here as how easily data can be accessed and used for model development. Data can be available, i.e., monitored or documented, but not accessible due to confidentiality reasons or local legislation. In addition to such restrictions, building data may be available in paper format but not easily accessible, as building energy modellers would first need to carry out data digitalisation before using it for urban scale modelling. While typical values can be obtained at country scale in national or European databases [19], obtaining individual building characteristics for a whole district or city is more challenging [20,29,30,34]. Overall, the situation has improved in recent years: more and more geographical and administrative entities have published online databases or maps containing various energy, geometric or system information at different levels of aggregation and detail. Examples of cities around the world sharing 3D maps of their buildings are given in the following references: [46,47]. While national agencies increasingly offer simple building information online (e.g., footprint through cadastral map), data related to the construction year, number of floors and construction characteristics are not usually included in these databases [34]; however, they are known from the design and construction phases, at least for the more recent buildings. The same applies to energy consumption data, which are typically compiled by energy companies, but are rarely shared due to confidentiality or economic reasons [48]. Energy performance certificates (EPC) databases are a great source of building information in Europe, but not all countries offer a convenient way to access these data [49,50].
In the literature, data accessibility is generally not distinguished from data availability. Nevertheless, addressing data accessibility is essential to improve current data challenges. Indeed, outside of confidentiality issues, data that are available but not accessible can be shared with less effort than starting a measurement campaign ab initio. In particular, multiple data are available in building permits or construction documentation (e.g., number of floors, windows to wall ratio, construction materials, etc.) that, once digitalised and gathered in a database, would contribute to the development of more accurate building models. From the building modeller perspective, features with the highest impact on simulation outcomes may be considered as the ‘most relevant’, and the ones that should be collected and shared in priority. ‘Data collectors’ (e.g., municipalities) could benefit from some insight about which features should be digitalised first as data collection procedures require financial and man-hour investment.
2.1.2. Data Quality
Building data may be available/accessible, but they may be of poor quality for the case study considered. The quality of building data used for model development and execution impacts the model outcomes. The term quality here refers to:
- How accurately data were measured and compiled in a database i.e., was an adequate acquisition process in place? Has any error been made in the reporting process?
- How accessible data are used i.e., were data used in an adequate context?
Building data are often distributed among different databases [51]. Correlated features obtained from different sources may not be consistent. For example, the database may indicate a building has nine floors, while its height is 10 m. Such inconsistent correlated characteristics can be due to e.g., errors in the measurement process or database development. Examples of errors encountered with energy performance databases are detailed in the work of Pasichnyi et al. [51].
Data quality is also impacted by the lack of data discussed above. As building modellers face data availability/accessibility challenges, assumptions and simplifications have to be taken to develop an urban energy model. The resulting data quality for the case study depends, among others, on their spatial validity or how scalable data are. For example, in the absence of measurements for the case study considered, a modeller may choose to use ventilation/infiltration rate data measured in neighbouring countries to develop a national building model; even though these data may have been estimated in an accurate manner, they may not reflect the case study chosen, as there may be differences in the construction practices and user behaviour between case studies in different jurisdictions.
The building sector is dynamic, and temporal validity [40] is another example of data quality challenge. Modellers may have to use older data due to the absence of regular surveys, and these data may not be an accurate description of the current state of the building. For example, the refurbishment state may not be known, and modellers may have to rely on the original construction characteristics. Nouvel et al. showed that not taking into consideration the refurbishment state of the buildings led to overestimation of 70 to 180% of the annual heating demand for the German case study considered [40].
Prior to using data for modelling work, its quality should be assessed, and a thorough data cleaning process should be applied to ensure the best quality possible of the final dataset. For GIS data, quality is addressed in the standard ISO19157 and relies on aspects such as completeness, accuracy, temporal validity, among others [40]. For energy performance certificate data, Pasichnyi et al. propose an approach based on six validation levels [51]. The authors detailed the application of the approach to a Swedish case study. For example, in Level 1, physical rules, constraints rules and statistical checks are implemented to identify errors in the data. Higher levels of validation rely on the use of additional datasets. Data cleaning and cross-verification thus play an important role in the final dataset quality.
2.2. Typical Input Dataset
A typical dataset for development and use of a building energy model includes, among others, information relating to weather, geometry, construction, systems and occupants. The data required vary depending on the modelling approach considered. A review of the data requirements for the three main modelling approaches (BB, WB and GB) is outlined below.
The input data used for BB models vary greatly as do the approaches categorised as BB. Wang et al. highlighted that weather data, occupant-related information, heat loss data and day types are needed, among others. The day type was used in BB models to develop a model for each typical day, such as weekday vs. weekend, to reflect the changing occupant behaviour and demand. Sampling frequency ranges from minute to year depending on the aim of the study [15]. The determination of an adequate input set has been an important question of research addressed with diverse techniques, including the comparison of the performance of the models with varying input data, or the measure of correlation or dependence between variables, among others. Wang et al. highlighted that future research should address the determination of “both the type and number of input variables […] in order to standardize the data collection instruments” [15].
The more complex WB models are developed using simulation software such as Energy Plus, Esp-r or TRNSYS, among others. These tools allow modelling of the building and its systems on an hourly or sub-hourly basis. The building model consists of multiple conditioned and unconditioned zones [52]. Alternatively, simpler WB models can be built using for instance, the reduced-order RC approach or static approaches. WB models require input data relating to the building geometry, construction characteristics, building systems and occupant behaviour. Different levels of input details are required depending on the complexity of the model. A typical challenge for the WB models lies in representing the stochastic aspects relating to occupant presence, perception of comfort and control system, among others.
GB models considered in this section are reduced-order RC models, which consist of representing buildings by thermal resistances and capacitances, similarly to an electrical circuit [53]. In a heating context, GB approaches typically require historical data of indoor temperature and heating consumption [43] to identify the parameters of the physics-based equations derived from the RC circuit. There exist multiple parameter identification methods, such as minimisation of square or absolute difference between the measured and estimated values [54,55,56], Maximum a Posteriori method or the Maximum Likelihood [57,58]. Parameters can be refined online and a Kalman filter can be used to remove noise [59]. Reynders et al. showed that additional measurements, such as the heat flux on the roof or floors, are necessary for higher order models (namely from third order upwards in the case study considered) [60]. Obtaining measured temperature or heating system data can be challenging both financially and practically, thus, in multiple case studies, synthetic data have been used for parameter identification of GB models. These data are obtained from a WB model using simulation software such as Energy Plus, TRNSYS or Esp-r, to cite a few [56,61]. With such WB models, synthetic data can be obtained, relatively easily, over multiple building characteristics without the need to install sensors, nor to deal with missing data. However, they should not be considered ‘real data’ per se; they are obtained from a model and, thus, as with any other modelling outcomes, they bear a level of uncertainty depending on the approach, inputs chosen and the system boundary.
The above section discussed the typical input data required for different building modelling approaches. Some of the required data can be found in databases available online, which is the topic of the following section.
2.3. Sources of Building Data
Data are essential to building modelling. Table 1 describes a typical set of building data and associated data sources for building energy modelling.
In practice, input datasets vary with the modelling approach and model complexity, thus models developed in the literature have relied on different combinations of the data listed in Table 1 For GB and BB models, historical consumption and indoor environment data will be required for data fitting. When scaling up from an individual model to, e.g., a district or a city, some modelling approaches account for the impact of the neighbouring buildings through the inclusion of 3D maps, for example, such information can be used for daylighting or solar gains analysis.
Cities and countries offer an increasing number of datasets that can be used for building modelling. However, such data are typically spread over different sources and are available in diverse formats for varying spatial and temporal scales [5]. Databases were developed to centralise building data. In Europe, there exist several databases gathering measured and modelled data including: The Building Stock Observatory [62], Tabula [63], Odyssee [64], Gains [65], ExceED [66]. In the US, the Building Performance Database “is the nation’s largest dataset of information about the energy-related characteristics of commercial and residential buildings” [67]. This database contains data on close to one million commercial and residential buildings. There are numerous fields in the database, including floor area, operational or energy system characteristics among others, and users can contribute to it [68]. Another important source of building data in the US is the Residential Energy Consumption Survey (RECS) and the Commercial Building Energy Consumption Survey (CBECS), which provide data on a sample that is statistically representative of the building stock [69,70].
Characteristics of building databases vary widely from one city to another. Among the data provided, geometry data are increasingly available at a single building level using the capabilities of the GIS field [5]. The Level of Detail (LoD) for large-scale examples typically ranges from 1 to 2. The LoD, as defined in the OGC CityGML Standard [71], ranges from 0 to 4; the higher the LoD, the more detailed the representation. LoD0 consists of a 2.5D representation, while in LoD1, buildings are represented, with a flat roof, by 3D blocks. As explained by Nouvel et al. “the Level of Detail 2 (LoD2) adds the roof form to the building level, Level of Detail 3 (LoD3) adds in the positioning of the facade windows, and Level of Detail 4 (LoD4) incorporates the modelling of the indoor space” [72]. Visual representations of the different LoDs are available in the following references: [71,72]. Information about the building external dimensions (e.g., footprint, height) can be used to infer less frequently available geometrical data, such as the indoor surface or volume. These open 3D maps have been contributing to the improvement of large-scale building energy modelling. Energy performance certificates are another source of building information in Europe. Depending on the building and country, building characteristics are either based on construction documents, or estimated using the default values function of the building location, age and use [73].
3. Qualitative Impact of Data on Building Energy Modelling
This section focuses on large-scale building energy models developed to, e.g., establish an energy consumption/demand baseline and test the impact of different scenarios. It is useful to analyse the impact of data availability and accessibility on building energy modelling from a qualitative perspective, as it allows:
- Identifying the challenges that will be faced when developing urban scale models, thus, it reduces the trial and error process and improves efficiency;
- Understanding the limits of the developed models.
Input data availability and accessibility impact building simulation research at three stages of a model development, namely for the:
- Choice of the modelling approach;
- Model validation;
- Replicability of the work.
Each of the abovementioned steps is addressed in the following subsections.
3.1. Selection of the Modelling Technique
The definitions of the WB, BB and GB modelling approaches are closely linked to the data required to develop and execute them. While WB models rely on building characteristics/expert knowledge and heat transfer equations, BB models are only built from historical data. GB can be applied if both historical data and building knowledge are available. Koulamas et al. pointed out the challenge of applying engineering approaches to older buildings, due to the lack of building documentation/standards available for such cases [10]. Multiple urban scale WB models rely on the definition of typical construction characteristics over a number of construction periods, rather than using construction details obtained at individual building level. The Tabula/Episcope projects led to the development of such building typologies for more than 20 countries, which were used as the basis for large-scale building energy modelling in multiple case studies [63,74,75,76,77,78]. For GB and BB models, the quantity of training data required varies widely, with the case study complexity and approach. Foucquier et al. noted that “a large amount of training data collected over an exhaustive period of time is required” for BB models whereas “a small amount of training data collected over a short period of time is required” for GB techniques [8]. Indeed, as the BB approach does not rely on physics principles, all of the underlying trends are implicitly contained within the data; the more events the data cover, the more comprehensive the model is expected to be. Selected examples of data requirements for BB models range from 1 month to 1.5 years [79,80,81], and from a few days to several weeks for GB models [53,56,82,83,84,85].
3.2. Model Validation and Outcome Accuracy
Model validation is usually based on comparing the model outcome to measured data or to a reference model considered representative of the state of the art [4,28,31,86]. Model outcome accuracy is influenced by data quality for the case study considered as addressed in Section 2.1.2. The time resolution of the data accessible for validation will determine at which level the validation can take place. While hourly temperature and energy demand data can be accessible and used at small scale, such profiles are generally not accessible at district or city scale, limiting the validation of urban models. Another factor to account for is the data spatial scale, which also constrains the validation step. If aggregated data are provided, the validation cannot take place at individual building scale. Often, models for urban scale application are validated on a small case study, before being run on selected archetypes and validated with the aggregated outcome (e.g., overall energy demand). An example is the ECCABS model, which was applied to five countries [19,87]. The accuracy of urban building energy models varies widely, depending on the case study. Reinhart and Cerezo Davila [4] summarise errors reported in twelve large-scale models, where values range from 1 to 99% over varying spatial scales. Similarly, Ioannou and Itard observed a difference between the estimated and actual energy performance ranging from 30 to 100% in six reviewed papers [33]. The importance of having “correct data and default datasets” has been highlighted in the literature [39]. To improve accuracy, a calibration step can be carried out. When curve fitting is applied, two approaches can be used to validate the models: either part of the dataset is not considered for the curve fitting and the validity of the model will be checked by comparison with this subset, or the quality of the regression will be assessed using the full dataset. Calibrating a model with numerous uncertain inputs faces limitations [31,39]. In such cases, the calibration may lead to estimated parameters far from their real values, due to the multiplicity of possible solutions for a given objective function value.
3.3. Replicability of the Work
The replicability is defined in the present research as the ability of a model to be applicable to a case study other than the one it was initially developed for. While very specific urban modelling can bring valuable knowledge to a given case study, replicability enhances the future use and contribution of the work. An increasing number of researchers are considering replicability of their work. The ECCABS model for example was initially developed on a Swedish case study, but later extended to four other countries [19,87].
Replicability is highly related to the data accessible. In a context where cities have different levels of data access and availability, replicability can be facilitated by working with a set of typically accessible data. Perez defines a set of “compulsory data”, which includes basic building information, such as: footprint, period of construction, height or number of floors, address and building ID [31]. Standard values may be used for data which are not commonly accessible, leaving the option to override them; the data structure should thus be flexible [31].
Replicability can also be considered in the model code structure to minimise the modeller efforts when applying the model to a different case study. To improve replicability, data specific to the case study should be provided as input, rather than defined in the core heat transfer code, where possible. In practice, this is achieved by separating the core equations from the input data and model assumptions.
While Section 3 addressed the qualitative impact of data on the modelling strategy, the following section goes one step further, discusses which data are the most impacting and puts it in perspective with data accessibility at urban scale.
4. Identifying the Most Impactful Data for Building Energy Modelling
In this section, the outcomes of sensitivity analyses published in the literature are reviewed together with accessibility considerations. Moreover, a Morris approach is applied to a large-scale dataset, and allows for ranking the features tested from the most to the least impactful. Outcomes will then be used in Section 5 to provide recommendations to improve data availability and accessibility at urban scale.
4.1. Approaches for Data Impact Assessment
A sensitivity analysis (SA) can be defined as “the study of the relative importance of different input factors on the model output” [88]. Within the framework of building energy modelling, sensitivity analyses have been used, e.g., to support building design [89], to assist calibration [56,90,91] or to improve data collection strategies [40], among others. The output of interest of SA in the building field is typically related to the energy demand or consumption [19,40,89,90,92,93,94], peak load [94,95] or comfort [33,92,96].
4.2. Most Impactful Inputs: A Review of the Literature
The question of data collection prioritisation is addressed in this section, and is based on the literature and the experience of the authors with European building stock case studies. A review of nine sensitivity studies applied to the building field was carried out and the results are shown in Table 2. The purpose of the table is to establish a perspective of the data typically accessible vs. their impact on building energy use simulations. The model outcome for these studies were typically the heating consumption or demand, energy needs for space heating and cooling, or final energy demand. The impact is assessed from the reviewed studies, and considers the parameters flagged as being in the top three most impactful in these sensitivity analyses. In the work of Nouvel et al. [40], which grouped data into three categories according to their “level of relevance for urban energy analysis”, all four parameters categorised as “must-have” have been included. The “fraction of space heated” parameter from Booth et al. study [90] is categorised under ‘energy system characteristics’ in Table 2. Some of the studies investigated several SA techniques, assumptions and/or various buildings. In the work of Berthou et al. [56], only the heating mode case study was selected for the present review; regarding the study by Garcia Sanchez et al. [92], the first order analyses were considered. For the other papers of the present review, all cases were taken into account.
Not all the possible input parameters were addressed in the papers reviewed, thus the absence of a reference in the second column of Table 2 can either mean the parameter is not significant, was not studied, or both. The accessibility at urban scale was assessed based on the experience of the authors and a review of the literature. The assessment results are represented by ✓, ✓/✕, ✕ symbols, which respectively mean “commonly accessible”, “partially accessible”, “typically not accessible”.
In practice, the impact, the availability and the accessibility are case study dependent. For example, the review of the literature shows that results vary depending on the SA technique, the model outcome, the features and the buildings chosen. While several authors conclude the importance of the temperature set point or the ventilation/infiltration rate [19,33,89,92,93,99], the impact of the orientation appears to be more case study-dependent [33,92,93,100]. As this analysis relies on ranking, it also depends upon the features chosen in each paper reviewed. The assessment in Table 2, thus, only aims at giving a general trend, rather than a universal truth. Further explanations about the choices made in Table 2 are given below for the input parameters considered:
- Building construction data are typically available from building permits or construction documentation (at least for the relatively recent buildings), but are not systematically digitalised nor shared online, thus they are hardly accessible at large-scale. Masson et al. stated that “there exists for no large city an exhaustive database on building architectural practices or building material characteristics at the scale of the building” [104]. Most Member States have now developed a central or regional register for EPCs. Such databases include, e.g., data relating to building geometry, building type, and energy performance information, among others [49,50]. However, as summarised in a Request2Action Project report, “the openness of EPC data varies immensely across Europe” and so does the “the scope of the[se] EPC databases” [50]. Not all databases allow public access to data collected and in some cases, only aggregated data are provided which limits the applications [49,50]. Moreover, information is valid at the time the EPC was carried out and not all databases offer convenient way to extract and use the data [50].
- Building function is typically known at municipality level but is not systematically shared online.
- Detailed energy conversion system characteristics can be difficult to obtain but some level of information is shared in online databases [50]. For example, in the UK EPC database, information is provided on the type of heating system, its level of energy efficiency (from “very poor” to ”very good”) and the type of heating controls, among others [105]. In the case of Geneva, the maximum heating power, fuel and fuel consumption are provided for thousands of buildings [106].
- Ventilation and infiltration rates are ”one of the least accessible [parameter]” [31]. Measuring the envelope infiltration rate and occupant-related air change rate is challenging. Techniques to measure infiltration rate include gas tracing methods or air tightness tests, but these are not easy to deploy and can be costly, thus they are not widespread [31]. As a result, there are relatively few large-scale measurement campaigns shared in the literature.
- All inputs relating to occupant choices (e.g., appliances bought, control strategy of the heating system) are generally difficult to measure and to keep up to date, as they require a strong involvement of the users and data collection can be costly to implement. Some examples of accessible data include time of use surveys [44], however, such data are not widely monitored nor shared in Europe; Sousa Monteiro et al. also acknowledged the difficulty of finding such data for urban building energy models [5].
Building demand can be available at an hourly/sub-hourly basis, i.e., monitored by network operators or energy companies, building energy management systems (in commercial or administrative buildings mostly) or novel smart thermostats, if any. However, such data may be split over various data owners, which poses collection challenges. Moreover, such hourly data are typically not easily accessible due to privacy, economic or aggregation issues (e.g., data at the substation level only) [48]. Measured energy data can be available at a lower time resolution (e.g., annual) at building level for specific case studies; examples include the US or some EPC databases, among others [69,73,106].
4.3. Most Impactful Inputs: Geneva Case Study
As shown in Section 4.2, there are multiple examples of sensitivity studies applied to single buildings or small case studies. However, housing stock models have long ignored this important aspect of modelling [90,107]; only a few recent papers have carried out sensitivity analyses on large-scale case studies [19,40,107]. Moreover, at large-scale, static-model and/or One-at-a-time (OAT) approaches are often applied.
The present section addresses the aforementioned gap. Its novelty lies in the use of a global sensitivity analysis performed at large-scale on an urban case study using a dynamic building model. Further details on the case study, the method and the building model are provided in the following sections.
4.3.1. Dataset
A dataset of individual residential buildings located in Geneva, Switzerland, is considered. The building characteristics were extracted from the SITG database [103]. Annual heating consumption was available through the ‘Indice de Dépense de Chaleur’ (which can be translated to ‘Heating Index’ in English) [108]. The data extracted were cleaned to remove buildings with crucial information missing or inconsistent data between features. Thresholds were applied on the conditioned surface, the height and the annual heating consumption to remove atypical or extreme buildings. The final dataset counts 272 individual residential buildings. The main dataset characteristics are shown in Figure 2. Data for multiple types of buildings and characteristics are available on the SITG website, thus, other datasets could have been obtained with a different cleaning process, but the residential dataset considered here is sufficiently big to be considered large-scale, while keeping the computing time acceptable from a sensitivity analysis perspective.
4.3.2. Method
The SA methodology selected is the Morris approach which offers a good compromise between accuracy and computing time for large-scale case studies [92]. The Morris method is based on the computation of the mean and standard deviation of the ‘Elementary Effects’ (EE) over varying trajectories in the multidimensional input space. The EE “can be seen as a global extension of a local derivative-based method” [93] and relies on the computation of the model output at different points of the trajectory. Six trajectories (r = 6) were considered for each building, that is within the range of recommended values [76]. The mean (μi) and standard deviation (σi) of the EE are computed over the r trajectories for each dimension i. Campolongo et al. suggested considering the absolute value of the EE in the mean calculation (μ*), to avoid cancellation by terms of opposite sign [92,109]. The mean or absolute mean informs about the impact of input i on the model output; the higher, the more significant the impact of this input on the model output [92,110].
4.3.3. Model, Inputs and Output
In the present work, the impact of input data on the annual space heating demand is investigated. The building construction year was used to assign building thermal characteristics based on the construction archetypes proposed in Perez et al. [31]. As no construction archetypes are available post-2010 [31,111], only buildings built before this date were considered. A dynamic first order model was developed for each building of the dataset. The model counts an overall capacitance and a resistance for the wall, roof, ventilation/infiltration and windows. Single capacitance models have been used and described in several papers [55,82,112]. The model gains were estimated using Swiss standards [113,114], and a constant setpoint of 20 °C was applied using an ON/OFF strategy, based on a 10 min time step with a 1°C dead-band.
The focus of the SA is placed on investigating the impact of various building thermal characteristics and control settings. Table 3 lists the eight inputs considered. The choice of inputs to investigate was based on the review carried out in Table 2, and whether reference values are required in the modelling. Data that can be easily and accurately measured at large-scale were not investigated in the SA, as the real values (i.e., measured values) can be used, rather than standard ones. Priority was given to data that are considered unreliable at urban scale, either because they are hardly measurable for each single building (e.g., due to cost or technical constraints), or because they are rarely documented. Inputs related to building construction materials, solar gains, and control strategy were thus investigated, namely:
- The roof/wall/window thermal resistances (°C/W) and overall thermal capacitance (J/°C). These characteristics are calculated using, e.g., the window to wall ratio, the wall surface and the footprint of the building. Thus, the calculated thermal resistances and capacitances also encompass the building geometry characteristics;
- The window g value;
- The setpoint temperature, which is investigated here applying an offset (ΔSP) from the standard temperature 20 °C. The offset can be negative or positive. A flat setpoint strategy is implemented;
- The comfort range (dead band). The comfort range is investigated applying a temperature difference, ΔTmax, on both side of the standard setpoint temperature. Thus, ΔTmax can be considered as half the comfort range.
The definition of the distribution of each input is required in the methodology. Defining a distribution in a building modelling context is a challenging task as data are often lacking and, as a consequence, assumptions made in the literature are not systematically justified. Moreover, the distributions may not be identical from one case study to another. In the present work, all distributions are considered uniform. A range of variation has to be defined for each input to build the multidimensional space in which the trajectories will be selected. Ranges considered for each input are shown in Table 3. The analysis was carried out using the UQLab package in Matlab [115,116].
4.3.4. Results and Discussion
To obtain a global trend a rank is given, to each parameter for each building, reflecting the impact on the annual space heating demand. The parameter with the highest μ* is given the rank #1, while the lowest value gets rank #8. The ranks are then summed over the 272 buildings for each input and this sum is used for the overall ranking. The input with the lowest rank sum is the most impactful. The ranking of the features impact across the 272 buildings is presented in Table 4.
As shown in Table 4, the present analysis highlights that some intrinsic building characteristics have a more significant impact, but operational parameters matter as well. More specifically, the five most impactful inputs are related to the:
- Control parameters: offset on the standard setpoint;
- Thermal characteristics: wall and windows resistances;
- Ventilation rate;
- Window characteristics: g value.
The ranking obtained can be understood considering building physics and building temperature control principles. Two out of the five most influential parameters are thermal characteristics. The envelope thermal resistance has a direct impact on the heat losses to the outside, thus its high influence on the heating demand. Similar reasoning applies to the offset on the temperature setpoint: a higher setpoint implies higher heating needs for a given building. Finally, the g value impacts the annual heating demand by modifying the solar gains.
On the other hand, inputs such as the capacitance or the comfort range have less impact in the present case study. The capacitance, i.e., the building capacity to store energy, is expected to have a more predominant impact, if the building flexibility were the object of the SA, or if a different control strategy had been chosen. The low impact of the comfort range can be explained by the control strategy. With ON/OFF control, the average setpoint is not significantly impacted by the comfort range width and, on average, remains around 20 °C, due to the cycling control strategy. Thus, the resulting heating demand is also marginally affected. The width of the comfort range rather impacts the level of temperature oscillations from the setpoint that the occupants have to tolerate; in other words, it impacts the comfort.
The outcomes of the literature review and the present work can be used to make suggestions to improve the data situation at urban scale, as discussed in Section 5.
5. Discussion—Improving Building Data Situation at Urban Scale
There are several options to improve the current data situation at urban scale, which are discussed below, taking into consideration the learnings from the impact analysis above.
The review of sensitivity analyses showed that not all data have the same impact on the model outcome; moreover, some data are available, but not accessible to data users. Thus, improving the data situation for building energy modellers should first focus on the data that:
- Have the highest impact on the building simulation outcome;
- Can be efficiently collected and made available. In this regard, data available but not accessible should be prioritised.
The first effort could be applied to the digitalisation of building construction data. Most of the papers which tested this input concluded on its noticeable impact (‘Building construction characteristics’ in Table 2). Moreover, data are already available for relatively recent buildings, but man-hours are required to gather and digitalise information in a database. This could be implemented in the near future, and would allow building modellers to estimate theoretical thermal characteristics of buildings within the context of a WB approach. This information would provide an improvement compared to the current techniques relying on construction archetypes and construction year.
Not all impactful data are available, thus, more data surveys are required at urban scale. Occupant-related data (e.g., occupancy profiles, setpoints, etc.) are an impactful input factor, and data are lacking in this area. While time of use surveys are available in multiple countries for a sample of buildings, modellers could also benefit from simple information at the individual building level, such as the number of occupants or the building occupancy category (e.g., vacant, secondary residence, occupied all year around) [39,40]. This would improve the occupant gains and domestic hot water consumption estimations, which are often inferred from standard values (e.g., from the average floor area per occupant). For buildings with high occupant ratio variations along the year/day, peak and off-peak data could be provided. Other occupant-related data would be useful as well: Kavgic et al. suggest an annual public-funded survey representative of the whole stock including, among others, information about the ownership of appliances [117]. Table 2 also shows the important impact of information relating to the indoor setpoint and system characteristics; obtaining such information at building level at large-scale would also allow for refining the outcomes of modelling approaches relying on standards. Energy consumption data, such as energy use profiles, would ensure model calibration/validation can be carried out, and would be particularly useful for the development of GB and BB models. The current deployment of smart meters in the European Union would contribute to the collection of energy profile data. However, privacy issues should be addressed legally, before a widespread use of available profiles can be considered. In the meantime, the calculation of the annual energy use, which is already a legal requirement in some jurisdictions, could be deployed in cities where data is scarce.
Once collected, data should be accessible on a central platform to limit compiling efforts from building modellers. Nouvel et al. and Keirstead et al. suggest a standardised data collection procedure, along with a shared platform for building data [29,40]. The definition of a common standard to share spatial data is one objective of the INSPIRE Directive [40,118].
Overall, data collection is a collective effort and will only be more effective if all stakeholders are involved, from data owners (e.g., citizens) to data users (e.g., building energy modellers) and data collectors (e.g., municipalities, companies). Indeed, while modellers can provide evidence of the most relevant or impactful data for modelling, citizens own essential data and municipalities or companies may have the resources to gather this data at large-scale. Better communication is essential in this collective effort. Data issues in the building field have started to be addressed. Research publications discussing the impact of input data provide valuable information on what directions to follow next. However, these papers might not reach decision makers at the municipality or country level. More direct communication is thus needed between building energy modellers, private data owner and public entities to stress the essential role of quality input data for tool development and accurate scenario testing. Research projects involving industry, public and academic partners are a concrete example of how to improve the communication between stakeholders. Other types of initiatives should also be further developed. For example, an annual workshop could be organised by municipalities, where model data requirements would be discussed with researchers along with the privacy and cost constraints inherent to data surveys. Moreover, an online platform similar to the Building Performance Database in the US [68] could be set-up at city or national-level and inhabitants could, on a voluntary basis, add data relating to the number of occupants in their household, their building characteristics, their monthly electricity consumption, etc.
6. Conclusions
Data are essential to the development of building models and yet, data challenges have not been sufficiently addressed in the literature. Over the years, researchers have struggled to obtain sufficient and accurate building data to develop their models. The present paper addressed the impact of data on urban scale building energy models from different perspectives. Understanding the impact that the lack of data has on building energy modelling allows for:
- Identifying the challenges that will be faced when developing an urban scale model;
- Understanding the limits of the model developed;
- Proposing targeted solutions to improve the data situation.
The paper first sets the data context at urban scale and highlights the difference between data accessibility and availability. The paper then investigates the qualitative impact of data on building energy modelling. It was shown that data availability and accessibility impact building simulation research at three stages of a model development, namely the choice of the modelling approach, model validation and replicability of the work. Thus, an analysis of the data available and accessible is an essential first step before selecting a modelling approach for an urban case study. The paper then puts in perspective the impact of input data and its accessibility at urban scale through an analysis of the literature. The analysis showed that data considered amongst the most impactful are typically not accessible at urban scale, e.g., energy system control algorithm and ventilation/infiltration or occupant-related data. A sensitivity analysis was then carried out on a large-scale dataset using a dynamic first order building model and a Morris approach. The first three most impactful parameters for the case study considered were found to be the setpoint and building thermal characteristics, reinforcing the need for more data on control settings, occupant behaviour and building construction materials.
The results obtained are dependent on the case study assumptions and the present work could be extended by using a different building model, other input data and/or sensitivity analysis techniques. For example, a Sobol analysis could be carried out to obtain a decomposition of the variance onto the different inputs. Such analysis would make it possible to quantify the respective impact of the inputs, but computing time challenges would need to be addressed to carry out the study at large-scale.
Sensitivity analyses showed that not all data have the same impact on the model outcome; moreover, some data are available, but not accessible to data users, thus improving the data situation for building modellers could be focused first on the data that are the most impactful, and that can be efficiently collected and shared. Thus, the first efforts could be applied to the digitalisation of building construction data. Building construction data tend to be available through building permits and construction documents (at least for the relatively recent buildings). Occupant-related data (e.g., control settings, number of occupants, etc.) are lacking at urban scale, and their impact has also been highlighted in the literature and the present case study; surveys would be required to gain more insight in that area and improve building models. Once collected and digitalised, data should be made accessible on a centralised platform for a better usability.
Overall, data collection is a collective effort and will be more effective if all stakeholders are involved, from data owners (e.g., citizens) to data users (e.g., building energy modellers) and data collectors (e.g., municipalities, companies). Solutions suggested include research projects or annual workshop at city-level involving these stakeholders and giving them the opportunity to discuss the challenges they are facing, their concerns and the respective assistance each could bring when it comes to providing a better knowledge of the building sector. Another suggestion is the development of online platforms where data-owner could contribute on a voluntary basis. The key to addressing many of the current data challenges in the building field is an improved communication and cooperation between stakeholders, which should lead to more accurate and reliable building model predictions.
Author Contributions
D.F. and F.M. were in charge of the supervision and co-supervision respectively. The formal analysis and the original draft preparation were carried out by S.G. The review & editing was carried out by D.F. and F.M. All authors have read and agreed to the published version of the manuscript.
Funding
The authors gratefully acknowledge the European Commission for providing financial support during the conduct of research under the FP7-PEOPLE-2013 Marie Curie Initial Training Network “CI-NERGY” project with Grant Agreement Number 606851.
Conflicts of Interest
The authors declare no conflict of interest.
References
- UN Environment Programme. 2019 Global Status Report for Buildings and Construction: Towards a Zero-Emission, Efficient and Resilient Buildings and Construction Sector; International Energy Agency: Paris, France; The UN Environment Programme: Kenya, Nairobi, 2019; p. 41. [Google Scholar]
- European Commission. Energy Performance of Buildings Directive (2020). Available online: https://ec.europa.eu/energy/topics/energy-efficiency/energy-efficient-buildings/energy-performance-buildings-directive_en (accessed on 8 August 2020).
- European Commission. Energy Efficiency Directive (2020). Available online: https://ec.europa.eu/energy/topics/energy-efficiency/targets-directive-and-rules/energy-efficiency-directive_en (accessed on 8 August 2020).
- Reinhart, C.F.; Davila, C. Urban building energy modeling—A review of a nascent field. Build. Environ. 2016, 97, 196–202. [Google Scholar] [CrossRef] [Green Version]
- Monteiro, C.S.; Costa, C.; Pina, A.; Santos, M.Y.; Ferrao, P. An urban building database (UBD) supporting a smart city information system. Energy Build. 2018, 158, 244–260. [Google Scholar] [CrossRef]
- Swan, L.G.; Ugursal, V.I. Modeling of end-use energy consumption in the residential sector: A review of modeling techniques. Renew. Sustain. Energy Rev. 2009, 13, 1819–1835. [Google Scholar] [CrossRef]
- Li, W.; Zhou, Y.; Cetin, K.; Eom, J.; Wang, Y.; Chen, G.; Zhang, X. Modeling urban building energy use: A review of modeling approaches and procedures. Energy 2017, 141, 2445–2457. [Google Scholar] [CrossRef]
- Foucquier, A.; Robert, S.; Suard, F.; Stephan, L.; Jay, A. State of the art in building modelling and energy performances prediction: A review. Renew. Sustain. Energy Rev. 2013, 23, 272–288. [Google Scholar] [CrossRef] [Green Version]
- Li, X.; Wen, J. Building energy consumption on-line forecasting using physics based system identification. Energy Build. 2014, 82, 1–12. [Google Scholar] [CrossRef]
- Koulamas, C.; Kalogeras, A.; Pacheco-Torres, R.; Casillas, J.; Ferrarini, L. Suitability analysis of modeling and assessment approaches in energy efficiency in buildings. Energy Build. 2018, 158, 1662–1682. [Google Scholar] [CrossRef]
- De Coninck, R.; Magnusson, F.; Åkesson, J.; Helsen, L. Grey-box Building Models for Model Order Reduction and Control. In Proceedings of the 10th International Modelica Conference, Lund, Sweden, 10–12 March 2014; pp. 657–666. [Google Scholar]
- Gassar, A.A.A.; Cha, S.H. Energy prediction techniques for large-scale buildings towards a sustainable built environment: A review. Energy Build. 2020, 224, 110238. [Google Scholar] [CrossRef]
- Sola, A.; Corchero, C.; Salom, J.; Sanmarti, M. Simulation Tools to Build Urban-Scale Energy Models: A Review. Energies 2018, 11, 3269. [Google Scholar] [CrossRef] [Green Version]
- Kramer, R.; Van Schijndel, J.; Schellen, H. Simplified thermal and hygric building models: A literature review. Front. Arch. Res. 2012, 1, 318–325. [Google Scholar] [CrossRef] [Green Version]
- Wang, Z.; Srinivasan, R.S. A review of artificial intelligence based building energy use prediction: Contrasting the capabilities of single and ensemble prediction models. Renew. Sustain. Energy Rev. 2017, 75, 796–808. [Google Scholar] [CrossRef]
- Perez, D.; Kämpf, J.H.; Wilke, U.; Papadopoulou, M.; Robinson, D. CITYSIM simulation: The Case Study of Alt-Wiedikon, a Neighbourhood of Zürich City. In Proceedings of the CISBAT 2011—CleanTech for Sustainable Buildings, Lausanne, Switzerland, 14–16 September 2011; pp. 1–6. [Google Scholar]
- Ecole Polytechnique Fédérale de Lausanne (EPFL). CitySim Software. 2020. Available online: https://www.epfl.ch/labs/leso/transfer/software/citysim/ (accessed on 26 July 2020).
- Walter, E.; Kämpf, J.H.; Baratieri, M.; Corrado, V.; Gasparella, A.; Patuzzi, F. A Verification of CitySim Results Using the BESTEST and Monitored Consumption Values. In Proceedings of the 2nd Building Simulation Applications Conference, Bolzano, Italy, 4–6 February 2015; pp. 215–222. [Google Scholar]
- Mata, E.; Kalagasidis, A.S.; Johnsson, F. Building-stock aggregation through archetype buildings: France, Germany, Spain and the UK. Build. Environ. 2014, 81, 270–282. [Google Scholar] [CrossRef] [Green Version]
- Österbring, M.; Mata, É.; Thuvander, L.; Mangold, M.; Johnsson, F.; Wallbaum, H. A differentiated description of building-stocks for a georeferenced urban bottom-up building-stock model. Energy Build. 2016, 120, 78–84. [Google Scholar]
- Monien, D.; Strzalka, A.; Koukofikis, A.; Coors, V.; Eicker, U. Comparison of building modelling assumptions and methods for urban scale heat demand forecasting. Future Cities Environ. 2017, 3, 2. [Google Scholar] [CrossRef]
- Nouvel, R.; Schulte, C.; Eicker, U.; Pietruschka, D.; Coors, V. CityGML-Based 3D city Model for Energy Diagnostics and Urban Energy Policy Support. In Proceedings of the 13th Conference of International Building Performance Simulation Association, Chambéry, France, 26–28 August 2013; pp. 218–225. [Google Scholar]
- MIT Sustainable Design Lab. Urban Modeling Interface. 2020. Available online: http://web.mit.edu/sustainabledesignlab/projects/umi/index.html (accessed on 26 July 2020).
- Reinhart, C.F.; Dogan, T.; Jakubiec, J.A.; Rakha, T.; Sang, A. UMI—An Urban Simulation Environment for Building Energy Use, Daylighting and Walkability. In Proceedings of the 13th Conference of International Building Performance Simulation Association, Chambéry, France, 26–28 August 2013; pp. 476–483. [Google Scholar]
- Sola, A.; Corchero, C.; Salom, J.; Sanmarti, M. Multi-domain urban-scale energy modelling tools: A review. Sustain. Cities Soc. 2020, 54, 101872. [Google Scholar] [CrossRef]
- Bhandari, M.; Shrestha, S.; New, J. Evaluation of weather datasets for building energy simulation. Energy Build. 2012, 49, 109–118. [Google Scholar] [CrossRef]
- Allegrini, J.; Orehounig, K.; Mavromatidis, G.; Ruesch, F.; Dorer, V.; Evins, R. A review of modelling approaches and tools for the simulation of district-scale energy systems. Renew. Sustain. Energy Rev. 2015, 52, 1391–1404. [Google Scholar] [CrossRef]
- Girardin, L. A GIS-Based Methodology for the Evaluation of Integrated Energy Systems in Urban Area. Ph.D. Dissertation, EPFL, Lausanne, Switzerland, 2012. [Google Scholar]
- Keirstead, J.; Jennings, M.; Sivakumar, A. A review of urban energy system models: Approaches, challenges and opportunities. Renew. Sustain. Energy Rev. 2012, 16, 3847–3866. [Google Scholar] [CrossRef] [Green Version]
- Lauster, M.; Teichmann, J.; Fuchs, M.; Streblow, R.; Mueller, D. Low order thermal network models for dynamic simulations of buildings on city district scale. Build. Environ. 2014, 73, 223–231. [Google Scholar] [CrossRef]
- Perez, D. A Framework to Model and Simulate the Disaggregated Energy Flows Supplying Buildings in Urban Areas. Ph.D. Dissertation, EPFL, Lausanne, Switzerland, 2014. [Google Scholar]
- Jones, P.J.; Lannon, S.; Williams, J. Modeling Building Energy Use at Urban Scale. In Proceedings of the 7th International IBPSA Conference, Rio de Janeiro, Brazil, 13–15 August 2001; pp. 175–180. [Google Scholar]
- Ioannou, A.; Itard, L. Energy performance and comfort in residential buildings: Sensitivity for building parameters and occupancy. Energy Build. 2015, 92, 216–233. [Google Scholar] [CrossRef]
- Hecht, R.; Meinel, G.; Buchroithner, M. Automatic identification of building types based on topographic databases—A comparison of different data sources. Int. J. Cartogr. 2015, 1, 18–31. [Google Scholar] [CrossRef] [Green Version]
- Kohler, N.; Steadman, P.; Hassler, U. Research on the building stock and its applications. Build. Res. Inf. 2009, 37, 449–454. [Google Scholar] [CrossRef] [Green Version]
- Majcen, D.; Itard, L.; Visscher, H. Theoretical vs. actual energy consumption of labelled dwellings in the Netherlands: Discrepancies and policy implications. Energy Policy 2013, 54, 125–136. [Google Scholar] [CrossRef]
- Meijer, F.; Itard, L.; Sunikka-Blank, M. Comparing European residential building stocks: Performance, renovation and policy opportunities. Build. Res. Inf. 2009, 37, 533–551. [Google Scholar] [CrossRef]
- Perez-Lombard, L.; Ortiz, J.; González, R.; Maestre, I.R.; Falcón, R.G. A review of benchmarking, rating and labelling concepts within the framework of building energy certification schemes. Energy Build. 2009, 41, 272–278. [Google Scholar] [CrossRef]
- Rager, J.; Rebeix, D.; Marechal, F.; Cherix, G.; Capezzali, M. MEU: An Urban Energy Management Tool for Communities and Multi-Energy Utilities. In Proceedings of the International Conference CISBAT 2013, Lausanne, Switzerland, 4–6 September 2013; pp. 1–6. [Google Scholar]
- Nouvel, R.; Zirak, M.; Coors, V.; Eicker, U. The influence of data quality on urban heating demand modeling using 3D city models. Comput. Environ. Urban. Syst. 2017, 64, 68–80. [Google Scholar] [CrossRef]
- Berthou, T.; Duplessis, B.; Rivière, P.; Stabat, P.; Casetta, D.; Marchio, D. Smart-E: A Tool for Energy Demand Simulation and Optimization at the City Scale. In Proceedings of the 14th International IBPSA Conference, Hyderabad, India, 7–9 December 2015; pp. 1782–1789. [Google Scholar]
- Olivia, G.-S.; Christopher, T.A. In-use monitoring of buildings: An overview and classification of evaluation methods. Energy Build. 2015, 86, 176–189. [Google Scholar] [CrossRef]
- Huebner, G.M.; Mahdavi, A. A structured open data collection on occupant behaviour in buildings. Sci. Data 2019, 6, 1–4. [Google Scholar] [CrossRef]
- United Nations Statistics Division. Allocation of Time and Time Use. 2016. Available online: http://unstats.un.org/unsd/Demographic/sconcerns/tuse/default.aspx (accessed on 1 April 2016).
- Killian, M.; Kozek, M. Ten questions concerning model predictive control for energy efficient buildings. Build. Environ. 2016, 105, 403–412. [Google Scholar] [CrossRef]
- 3D Geoinformation Group, TU Delft. Cities around the World with Open Datasets. 2018. Available online: https://www.citygml.org/3dcities/ (accessed on 27 August 2018).
- Open Geospatial Consortium. 3D Data. 2019. Available online: https://www.opengeospatial.org/resources/data (accessed on 22 December 2019).
- Kaden, R.; Kolbe, T.H. City-Wide Total Energy Demand Estimation of Buildings Using Semantic 3D City Models and Statistical Data. In Proceedings of the ISPRS 8th 3DGeoInfo Conference, Istanbul, Turkey, 27–29 November 2013; pp. 163–171. [Google Scholar]
- Arcipowska, A.; Anagnostopoulos, F.; Mariottini, F.; Kunkel, S. Energy Performance Certificates across the EU—A Mapping of National Approaches; Buildings Performance Institute Europe: Brussels, Belgium, 2014. [Google Scholar]
- Altmann-Mavaddat, N.; Mair am Tinkhof, O.; Simader, G.; Arcipowska, A.; Weatherall, D. From Databases to Retrofit Action: How European Countries Are Using Energy Performance Certificate (EPC) Database Systems; Technical Report No: Request2Action Project-Deliverable 2.1; Request2Action: Brussels, Belgium, 2015. [Google Scholar]
- Pasichnyi, O.; Wallin, J.; Levihn, F.; Shahrokni, H.; Kordas, O. Energy performance certificates—New opportunities for data-enabled urban energy policy instruments? Energy Policy 2019, 127, 486–499. [Google Scholar] [CrossRef]
- Pan, Y.; Zuo, M.; Wu, G. Whole building energy simulation and energy saving potential analysis of a large public building. J. Build. Perform. Simul. 2011, 4, 37–47. [Google Scholar] [CrossRef]
- Bacher, P.; Madsen, H. Identifying suitable models for the heat dynamics of buildings. Energy Build. 2011, 43, 1511–1522. [Google Scholar] [CrossRef] [Green Version]
- Harb, H.; Boyanov, N.; Hernandez, L.; Streblow, R.; Müller, D.; Hassan, H.; Neven, B.; Luis, H.; Rita, S.; Dirk, M. Development and validation of grey-box models for forecasting the thermal response of occupied buildings. Energy Build. 2016, 117, 199–207. [Google Scholar] [CrossRef]
- Ashouri, A. Model. Predictive Control (MPC) for Building Energy Management System Using Mixed-Integer Linear Programming (MILP); EuroTech PhD Winter School: Lausanne, Switzerland, 2015. [Google Scholar]
- Berthou, T.; Stabat, P.; Salvazet, R.; Marchio, D. Development and validation of a gray box model to predict thermal behavior of occupied office buildings. Energy Build. 2014, 74, 91–100. [Google Scholar] [CrossRef]
- CTSM-R Development Team. Continuous Time Stochastic Modeling in R-User’s Guide and Reference Manual. 2015. Available online: http://ctsm.info/pdfs/ctsmr-reference.pdf (accessed on 17 January 2016).
- Friling, N.; Jiménez, M.J.; Bloem, H.; Madsen, H. Modelling the heat dynamics of building integrated and ventilated photovoltaic modules. Energy Build. 2009, 41, 1051–1057. [Google Scholar] [CrossRef]
- Ashouri, A.; Fazlollahi, S.; Benz, M.J.; Maréchal, F. Particle Swarm Optimization and Kalman Filtering for Demand Prediction of Commercial Buildings. In Proceedings of the ECOS 2015, Pau, France, 30 June–3 July 2015; pp. 1–10. [Google Scholar]
- Reynders, G.; Diriken, J.; Saelens, D. Quality of grey-box models and identified parameters as function of the accuracy of input and observation signals. Energy Build. 2014, 82, 263–274. [Google Scholar] [CrossRef]
- Hazyuk, I.; Ghiaus, C.; Penhouet, D. Optimal temperature control of intermittently heated buildings using MPC: Part I—Building modeling. Build. Environ. 2012, 51, 379–387. [Google Scholar] [CrossRef]
- The European Commission. EU Building Stock Observatory. 2018. Available online: https://ec.europa.eu/energy/topics/energy-efficiency/energy-efficient-buildings/eu-bso_en?redir=1 (accessed on 29 June 2018).
- IEE Project Episcope and Tabula Teams. Welcome to the Joint EPISCOPE and TABULA Website. 2017. Available online: http://episcope.eu/welcome/ (accessed on 31 July 2020).
- Odyssee-Mure Team. Energy Efficiency Trends & Policies|ODYSSEE-MURE. 2018. Available online: http://www.odyssee-mure.eu/ (accessed on 29 June 2018).
- International Institute for Applied Systems Analysis. GAINS Europe. 2017. Available online: http://www.iiasa.ac.at/web/home/research/researchPrograms/air/Europe.html (accessed on 30 November 2017).
- ExcEED Project Team. ExcEED—European Energy Efficient Building District Database. 2018. Available online: http://www.exceedproject.eu/ (accessed on 15 September 2018).
- U.S. Department of Energy/Office of Energy Efficiency and Renewable Energy. Buildings Performance Database. 2018. Available online: http://energy.gov/eere/buildings/buildings-performance-database (accessed on 31 March 2020).
- Lawrence Berkeley National Laboratory—Energy Technologies Area. Building Performance Database | Building Technology and Urban Systems Division. 2020. Available online: https://buildings.lbl.gov/cbs/bpd (accessed on 17 March 2020).
- U.S. Energy Information Administration. Residential Energy Consumption Survey (RECS)—Energy Information Administration. 2020. Available online: https://www.eia.gov/consumption/residential/ (accessed on 17 March 2020).
- U.S. Energy Information Administration. Energy Information Administration (EIA)—Commercial Buildings Energy Consumption Survey (CBECS). 2020. Available online: https://www.eia.gov/consumption/commercial/ (accessed on 7 March 2020).
- Open Geospatial Consortium. OGC City Geography Markup Language (CityGML) Encoding Standard. 2012. Report No.: OGC 12-019. Available online: http://www.opengis.net/spec/citygml/2.0 (accessed on 12 July 2020).
- Nouvel, R.; Zirak, M.; Dastageeri, H.; Coors, V.; Eickert, U. Urban Energy Analysis Based on 3D City Model for National Scale Applications. In Proceedings of the 5th German-Austrian IBPSA Conference, Aachen, Germany, 22–24 September 2014; pp. 83–90. [Google Scholar]
- Semple, S.; Jenkins, D. Variation of energy performance certificate assessments in the European Union. Energy Policy 2020, 137, 111127. [Google Scholar] [CrossRef]
- Ballarini, I.; Corgnati, S.P.; Corrado, V. Use of reference buildings to assess the energy saving potentials of the residential building stock: The experience of TABULA project. Energy Policy 2014, 68, 273–284. [Google Scholar] [CrossRef]
- Dascalaki, E.G.; Droutsa, K.G.; Balaras, C.A.; Kontoyiannidis, S. Building typologies as a tool for assessing the energy performance of residential buildings—A case study for the Hellenic building stock. Energy Build. 2011, 43, 3400–3409. [Google Scholar] [CrossRef]
- Coma, J.; Maldonado, J.M.; De Gracia, A.; Gimbernat, T.; Botargues, T.; Cabeza, L.F. Comparative Analysis of Energy Demand and CO2 Emissions on Different Typologies of Residential Buildings in Europe. Energies 2019, 12, 2436. [Google Scholar] [CrossRef] [Green Version]
- Loga, T.; Stein, B.; Diefenbach, N. TABULA building typologies in 20 European countries—Making energy-related features of residential building stocks comparable. Energy Build. 2016, 132, 4–12. [Google Scholar] [CrossRef]
- Kragh, J.; Wittchen, K.B. Development of two Danish building typologies for residential buildings. Energy Build. 2014, 68, 79–86. [Google Scholar] [CrossRef]
- Mena, R.; Rodriguez, F.; Castilla, M.; Arahal, M. A prediction model based on neural networks for the energy consumption of a bioclimatic building. Energy Build. 2014, 82, 142–155. [Google Scholar] [CrossRef]
- Xia, C.; Wang, J.; McMenemy, K. Short, medium and long term load forecasting model and virtual load forecaster based on radial basis function neural networks. Int. J. Electr. Power Energy Syst. 2010, 32, 743–750. [Google Scholar] [CrossRef] [Green Version]
- Karatasou, S.; Santamouris, M.; Geros, V. Modeling and predicting building’s energy use with artificial neural networks: Methods and results. Energy Build. 2006, 38, 949–958. [Google Scholar] [CrossRef]
- Fux, S.F.; Ashouri, A.; Benz, M.; Guzzella, L. EKF based self-adaptive thermal model for a passive house. Energy Build. 2014, 68, 811–817. [Google Scholar] [CrossRef]
- Jiménez, M.; Madsen, H.; Andersen, K. Identification of the main thermal characteristics of building components using MATLAB. Build. Environ. 2008, 43, 170–180. [Google Scholar] [CrossRef]
- Madsen, H.; Holst, J. Estimation of continuous-time models for the heat dynamics of a building. Energy Build. 1995, 22, 67–79. [Google Scholar] [CrossRef]
- Wang, S.; Xu, X. Simplified building model for transient thermal performance estimation using GA-based parameter identification. Int. J. Therm. Sci. 2006, 45, 419–432. [Google Scholar] [CrossRef]
- Fumo, N. A review on the basics of building energy estimation. Renew. Sustain. Energy Rev. 2014, 31, 53–60. [Google Scholar] [CrossRef]
- Mata, É.; Kalagasidis, A.S.; Johnsson, F. A modelling strategy for energy, carbon, and cost assessments of building stocks. Energy Build. 2013, 56, 100–108. [Google Scholar] [CrossRef] [Green Version]
- Saltelli, A. Sensitivity Analysis: An Introduction. 2015. Available online: http://www.andreasaltelli.eu/presentations (accessed on 5 March 2018).
- Heiselberg, P.; Brohus, H.; Hesselholt, A.; Rasmussen, H.; Seinre, E.; Thomas, S. Application of sensitivity analysis in design of sustainable buildings. Renew. Energy 2009, 34, 2030–2036. [Google Scholar] [CrossRef] [Green Version]
- Booth, A.; Choudhary, R.; Spiegelhalter, D. Handling uncertainty in housing stock models. Build. Environ. 2012, 48, 35–47. [Google Scholar] [CrossRef]
- Fabrizio, E.; Monetti, V. Methodologies and Advancements in the Calibration of Building Energy Models. Energies 2015, 8, 2548–2574. [Google Scholar] [CrossRef] [Green Version]
- Sánchez, D.G.; Lacarrière, B.; Musy, M.; Bourges, B. Application of sensitivity analysis in building energy simulations: Combining first- and second-order elementary effects methods. Energy Build. 2014, 68, 741–750. [Google Scholar] [CrossRef] [Green Version]
- Kristensen, M.H.; Petersen, S. Choosing the appropriate sensitivity analysis method for building energy model-based investigations. Energy Build. 2016, 130, 166–176. [Google Scholar] [CrossRef]
- Lam, J.C.; Hui, S.C. Sensitivity analysis of energy performance of office buildings. Build. Environ. 1996, 31, 27–39. [Google Scholar] [CrossRef]
- Yamaguchi, Y.; Hensen, J.L.M.; Shimoda, Y.; Asai, T.; Mizuno, M. District Level Energy Management Using A Bottom-Up Modelling Approach. In Proceedings of the 9th International IBPSA Conference, Montreal, QC, Canada, 15–18 August 2005; pp. 1385–1392. [Google Scholar]
- De Wit, S.; Augenbroe, G. Analysis of uncertainty in building design evaluations and its implications. Energy Build. 2002, 34, 951–958. [Google Scholar] [CrossRef]
- Saltelli, A.; Aleksankina, K.; Becker, W.; Fennell, P.; Ferretti, F.; Holst, N.; Li, S.; Wu, Q. Why so many published sensitivity analyses are false: A systematic review of sensitivity analysis practices. Environ. Model. Softw. 2019, 114, 29–39. [Google Scholar] [CrossRef]
- Saltelli, A.; Chan, K.; Scott, E.M. Sensitivity Analysis; John Wiley and Sons: Hoboken, NJ, USA, 2000. [Google Scholar]
- Corrado, V.; Mechri, H.E. Uncertainty and Sensitivity Analysis for Building Energy Rating. J. Build. Phys. 2009, 33, 125–156. [Google Scholar] [CrossRef]
- Page, J.; Dervey, S.; Morand, G. Aggregating Building Energy Demand Simulation to Support Urban Energy Design. In Proceedings of the 30th PLEA Conference: Sustainable Habitat for Developing Cities—Choosing the Way Forward, Ahmedabad, India, 27–30 November 2014; pp. 378–385. [Google Scholar]
- Meteonorm. Irradiation Data for Every Place on Earth. 2020. Available online: http://www.meteonorm.com/en/ (accessed on 31 July 2020).
- European Commission, Joint Research Centre—PVGIS Team. Photovoltaic Geographical Information System (PVGIS). 2020. Available online: https://ec.europa.eu/jrc/en/pvgis (accessed on 31 July 2020).
- Service de Géomatique et de l’Organisation de l’Information. Le Territoire Genevois à la Carte. SITG. 2016. Available online: http://ge.ch/sitg/ (accessed on 14 January 2016).
- Masson, V.; Heldens, W.; Bocher, E.; Bonhomme, M.; Bucher, B.; Burmeister, C.; De Munck, C.; Esch, T.; Hidalgo, J.; Kanani-Sühring, F.; et al. City-descriptive input data for urban climate models: Model requirements, data sources and challenges. Urban. Clim. 2020, 31, 100536. [Google Scholar] [CrossRef]
- Ministry of Housing, Communities & Local Government. Energy Performance of Buildings Data: England and Wales. 2019. Available online: https://epc.opendatacommunities.org/login (accessed on 31 August 2019).
- Ye, Y.; Zuo, W.; Wang, G. A comprehensive review of energy-related data for U.S. commercial buildings. Energy Build. 2019, 186, 126–137. [Google Scholar] [CrossRef]
- Stinner, S.; Streblow, R.; Müller, D. Dynamic Uncertainty Analysis of the Building Energy Performance in City Districts. In Proceedings of the 5th German-Austrian IBPSA Conference, Aachen, Germany, 22–24 September 2014; pp. 656–663. [Google Scholar]
- Office Cantonal de l’Energie (OCEN). Directive Relative au Calcul de L’indice de Dépense de Chaleur. 2017. Available online: http://ge.ch/energie/media/energie/files/fichiers/documents/directive_relative_au_calcul_idc_02052017.pdf (accessed on 27 August 2017).
- Campolongo, F.; Cariboni, J.; Saltelli, A. An effective screening design for sensitivity analysis of large models. Environ. Model. Softw. 2007, 22, 1509–1518. [Google Scholar] [CrossRef]
- Morris, M.D. Factorial sampling plans for preliminary computational experiments. Technometrics 1991, 33, 161–174. [Google Scholar] [CrossRef]
- Kämpf, J.H. On the Modelling and Optimisation of Urban Energy Fluxes. Ph.D. Dissertation, EPFL, Lausanne, Switzerland, 2009. [Google Scholar]
- Mata, E.; Kalagasidis, A.S. Calculation of Energy Use in the Swedish Housing—Description of the Building Energy Simulation Model EABS: Energy Assessment of Building Stocks; Chalmers University of Technology: Göteborg, Sweden, 2009; p. 52. [Google Scholar]
- Société Suisse des Ingénieurs et des Architectes. L’énergie Thermique Dans le Bâtiment—SIA 380/1; SIA: Zürich, Switzerland, 2009. [Google Scholar]
- Société Suisse des Ingénieurs et des Architectes. Données D’utilisation des Locaux Pour L’énergie et les Installations du Bâtiment—SIA 2024:2015; SIA: Zürich, Switzerland, 2015. [Google Scholar]
- Marelli, S.; Sudret, B. UQLab: A Framework for Uncertainty Quantification in Matlab. In Proceedings of the 2nd International Conference on Vulnerability, Risk Analysis and Management (ICVRAM 2014), Liverpool, UK, 13–16 July 2014. [Google Scholar]
- Marelli, S.; Lamas, C.; Sudret, B.; Konakli, K. UQLab Sensitivity Analysis User Manual. 2017. Report No.: Report UQLab-V1.0-106. Available online: http://www.uqlab.com/userguidesensitivity (accessed on 7 March 2018).
- Kavgic, M.; Mavrogianni, A.; Mumovic, D.; Summerfield, A.; Stevanovic, Z.; Djurovic-Petrovic, M. A review of bottom-up building stock models for energy consumption in the residential sector. Build. Environ. 2010, 45, 1683–1697. [Google Scholar] [CrossRef]
- The European Commission. INSPIRE|Welcome to INSPIRE. 2017. Available online: https://inspire.ec.europa.eu/ (accessed on 28 November 2017).
Figure 1.
Key terms, challenges and solutions addressed in the paper.

Figure 2.
Main dataset characteristics.


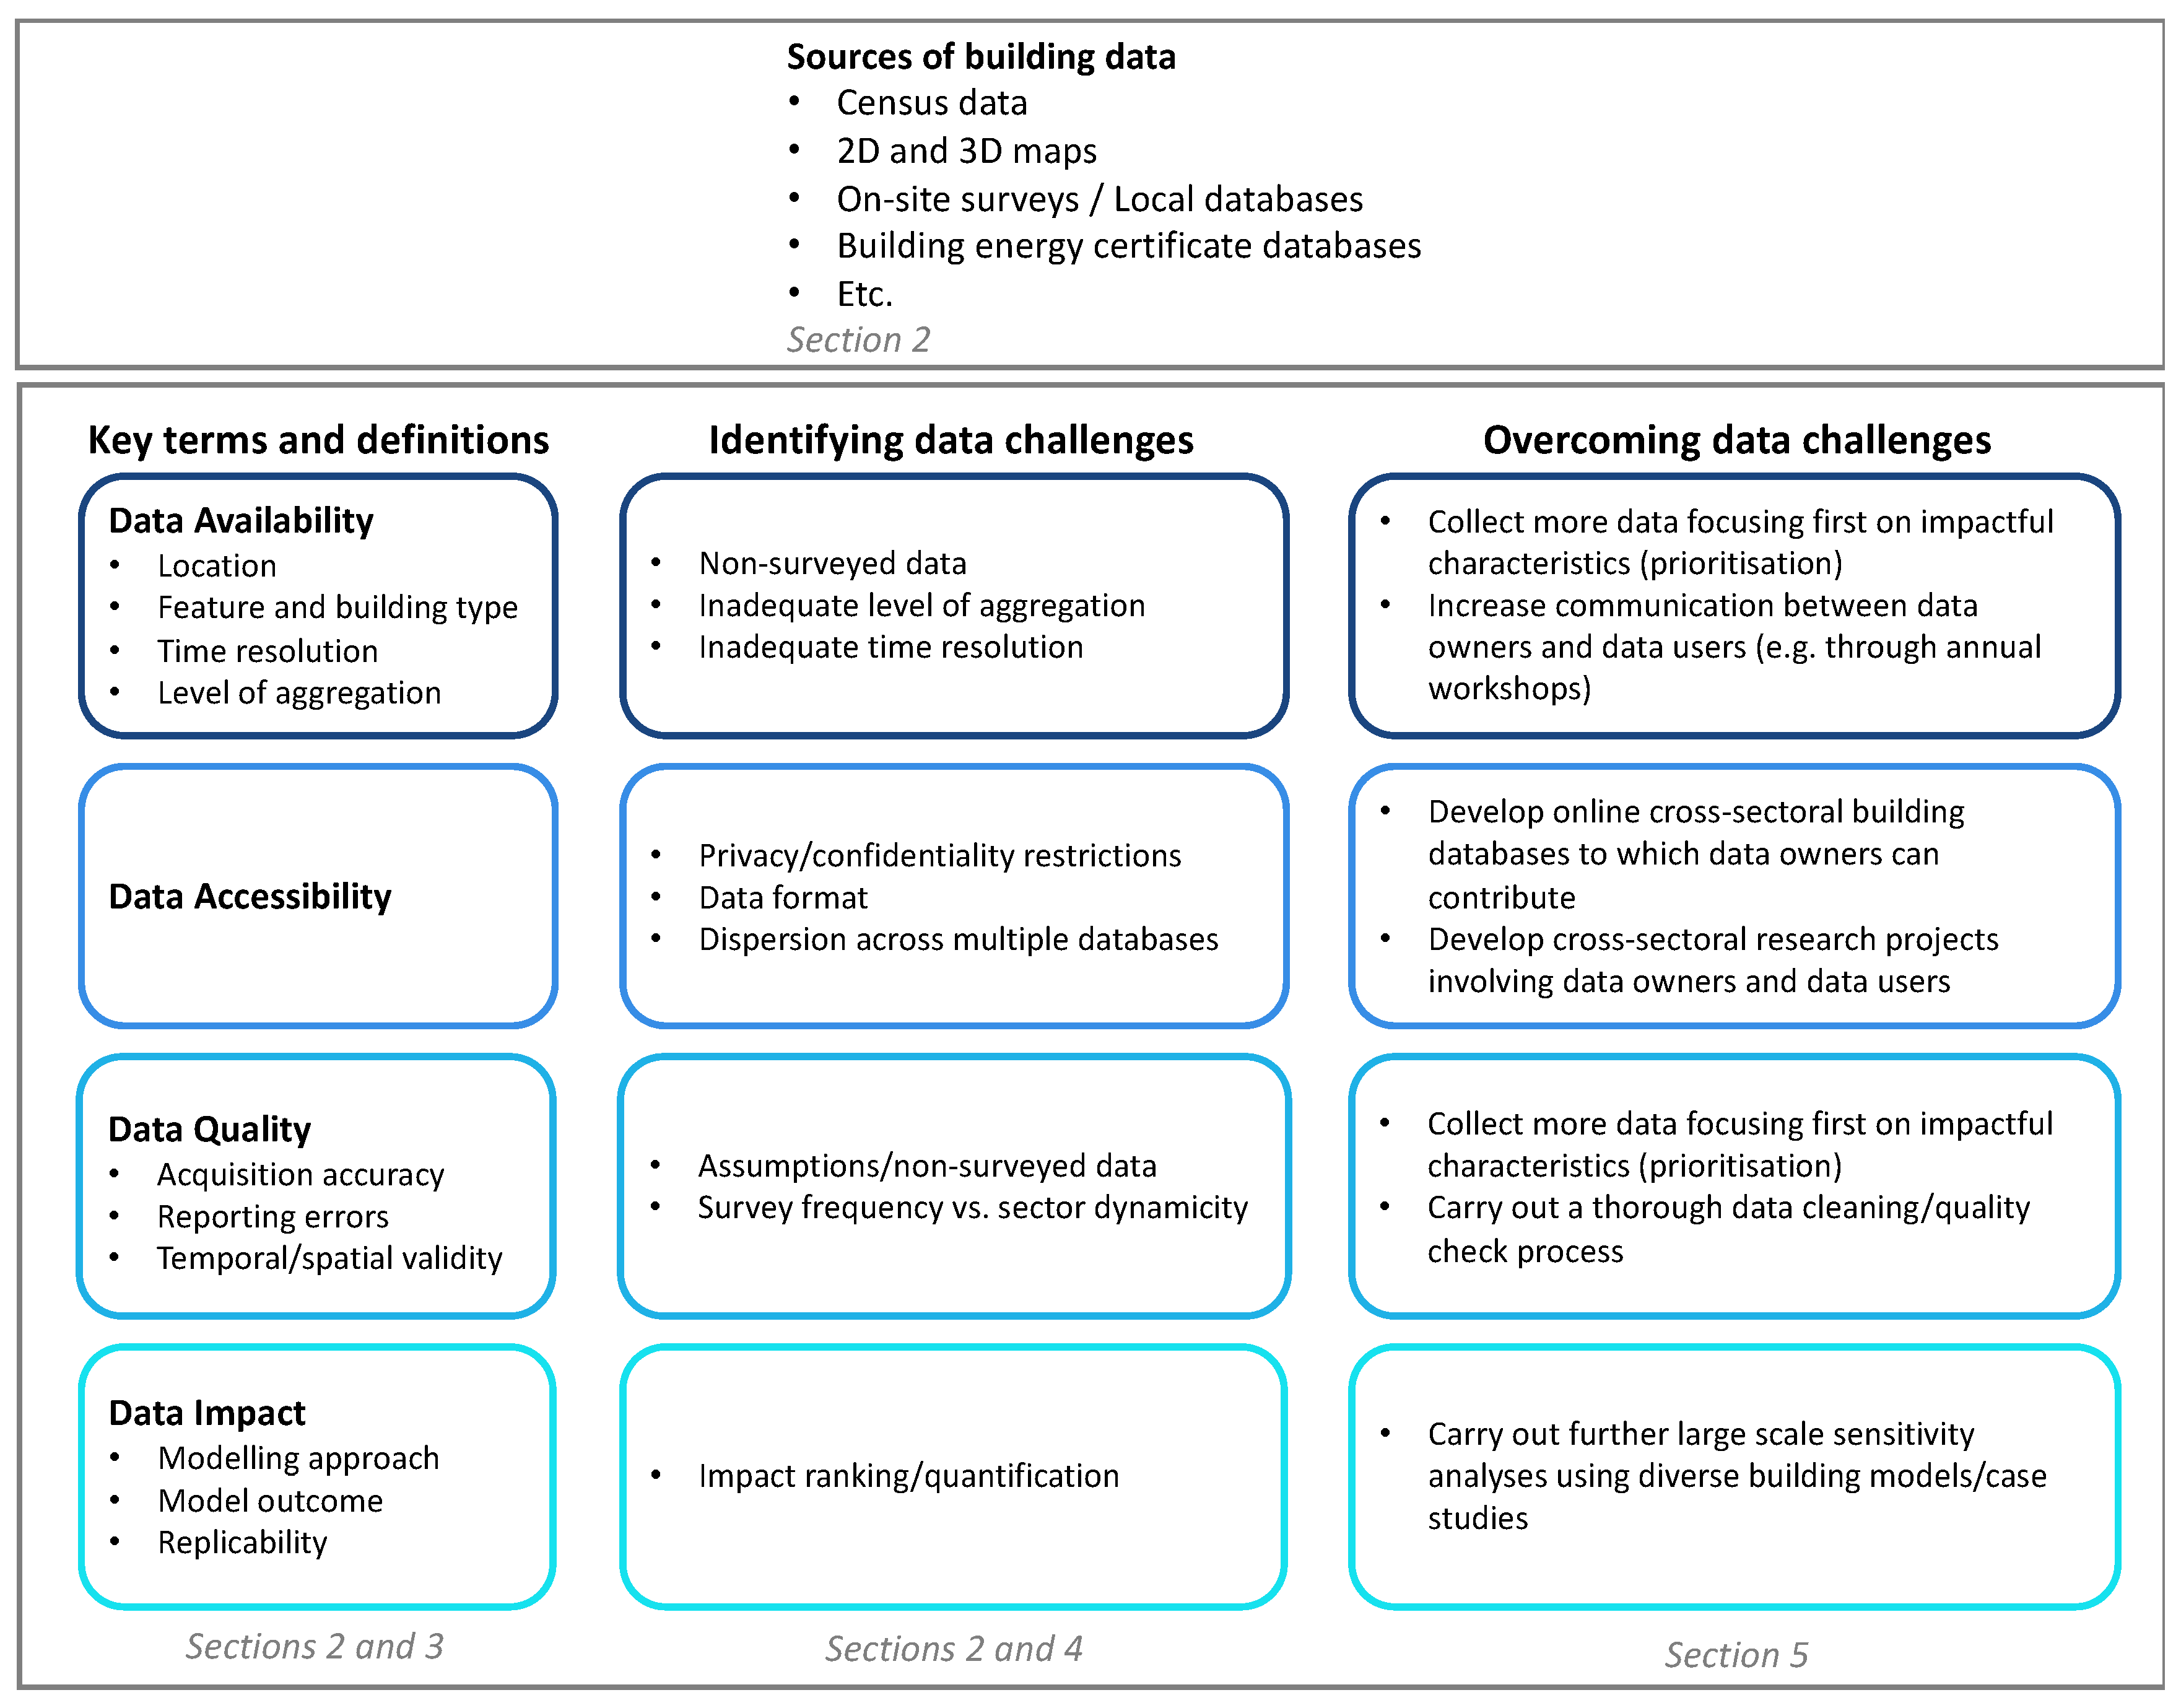
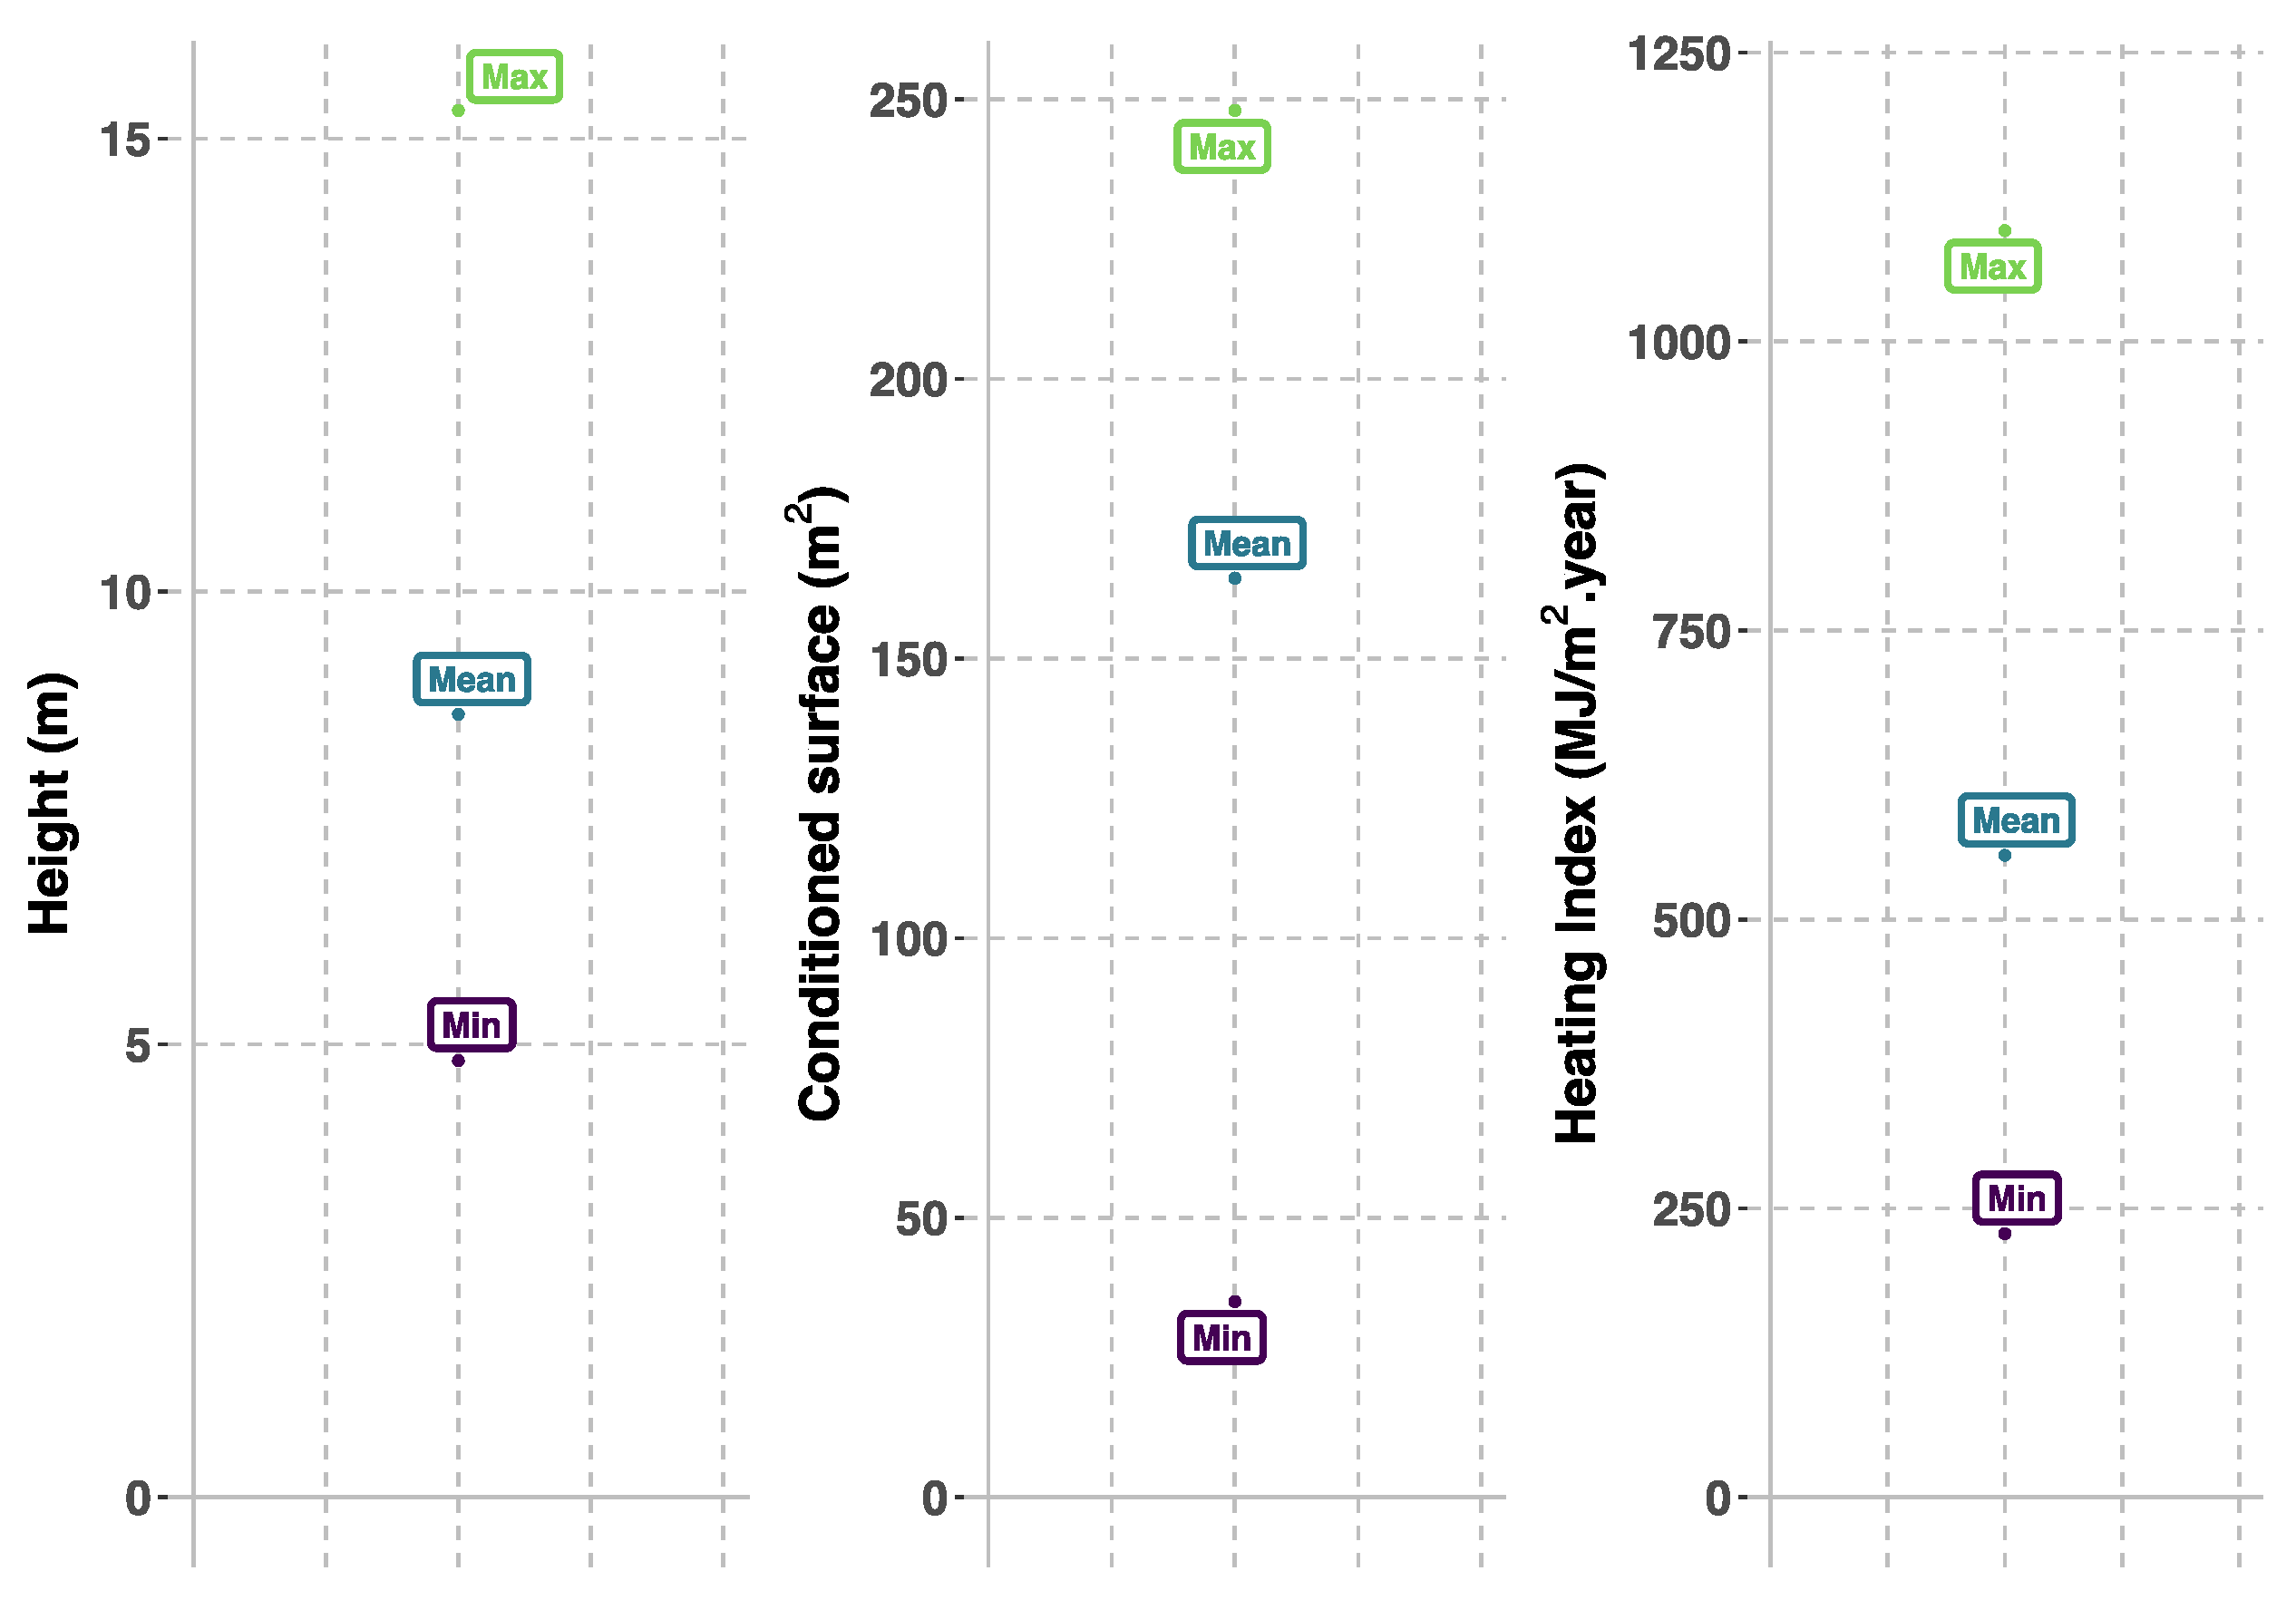
Table 1.
Dataset and potential sources for building energy modelling.
| Data Type | Features | Potential Sources |
|---|---|---|
| Weather | Irradiance, outdoor temperature, humidity, wind speed | Softwares/web services, national meteorological offices |
| Building | Geometry | 2D-3D maps |
| Construction materials | National/local databases, research studies | |
| Construction/refurbishment year | National/local databases | |
| Building category | National/local databases | |
| Energy conversion systems | System characteristics | National statistics, national/local databases |
| Heating fuel | National/local databases | |
| Energy source prices | Energy providers | |
| HVAC control strategy | Control algorithm/rule | Standards, HVAC companies |
| Indoor setpoint | Standards, research studies, local databases | |
| Occupants | Number and activity schedule, socio-economic aspects [12] | Time of use surveys, census data, local databases |
| Appliances | Number and characteristics | National statistics, local databases |
Table 2.
Data impact and accessibility at urban scale.
| Input Parameter | Larger Impact on Building Energy Modelling | Accessibility |
|---|---|---|
| Orientation | [33] | ✓ |
| Building geometry | [19,92,93] | ✓ |
| Building construction characteristics | [19,33,40,56,92,93] | ✓/✕ |
| Construction or renovation year | [40] | ✓/✕ |
| Building function | [40] | ✓/✕ |
| Energy system characteristics | [90] | ✓/✕ |
| Control strategy (incl. setpoint) | [19,33,89,90,92,93,99] | ✕ |
| Occupancy | [40,99] | ✕ |
| Ventilation/Infiltration | [19,33,56,89,92,93,99] | ✕ |
| Appliances | - | ✕ |
Table 3.
Data and range of variation used in the sensitivity analysis.
| Input | Symbol | Distribution | Range |
|---|---|---|---|
| Roof thermal resistance (°C/W) | Rroof | Uniform | ±30% |
| Wall thermal resistance (°C/W) | Rwall | Uniform | |
| Window thermal resistance (°C/W) | Rwin | Uniform | |
| Window g value (-) | g | Uniform | |
| Total thermal capacitance (J/°C) | Ctotal | Uniform | |
| Ventilation rate (h−1) | nvent | Uniform | |
| Offset on the standard setpoint temperature (°C) | ΔSP | Uniform | [−2 °C; 2 °C] |
| Comfort/– half-range (°C) | ΔTmax | Uniform | 0.5 to 1.5 °C |
Table 4.
Ranking representing the relative impact of the input on the annual space heating demand for the 272 buildings of the dataset (from the most impactful to the least impactful).
Table 4.
Ranking representing the relative impact of the input on the annual space heating demand for the 272 buildings of the dataset (from the most impactful to the least impactful).
| Rank | Input |
|---|---|
| 1 | ΔSP |
| 2 | Rwall |
| 3 | Rwin |
| 4 | g |
| 5 | nvent |
| 6 | Rroof |
| 7 | Ctotal |
| 8 | ΔTmax |
© 2020 by the authors. Licensee MDPI, Basel, Switzerland. This article is an open access article distributed under the terms and conditions of the Creative Commons Attribution (CC BY) license (http://creativecommons.org/licenses/by/4.0/).
Share and Cite
MDPI and ACS Style
Goy, S.; Maréchal, F.; Finn, D. Data for Urban Scale Building Energy Modelling: Assessing Impacts and Overcoming Availability Challenges. Energies 2020, 13, 4244. https://0-doi-org.brum.beds.ac.uk/10.3390/en13164244
AMA Style
Goy S, Maréchal F, Finn D. Data for Urban Scale Building Energy Modelling: Assessing Impacts and Overcoming Availability Challenges. Energies. 2020; 13(16):4244. https://0-doi-org.brum.beds.ac.uk/10.3390/en13164244
Chicago/Turabian StyleGoy, Solène, François Maréchal, and Donal Finn. 2020. "Data for Urban Scale Building Energy Modelling: Assessing Impacts and Overcoming Availability Challenges" Energies 13, no. 16: 4244. https://0-doi-org.brum.beds.ac.uk/10.3390/en13164244
Note that from the first issue of 2016, this journal uses article numbers instead of page numbers. See further details here.