1. Introduction
Paraffinic crude oil, constituting the vast majority of produced crude oils, contain paraffin hydrocarbons with a high freezing point which under the conditions of elevated temperature present in the reservoir are dissolved in petroleum. In the petroleum production process, crystallization of paraffin hydrocarbons occurs as a result of lowering the temperature, particularly during the autumn–winter period, and the generated crystals tend to agglomerate and deposit on the surfaces of production equipment, pipelines, and tanks. This causes production problems related to an increase in flow resistance, and in extreme cases even the clogging of pipelines.
The precipitated paraffins are a fraction of solid waxes which could additionally contain some solid contaminations. The paraffin deposition process causes a diameter narrowing for oil flow in a pipeline, and, consequently, an increase in oil flow resistances, an increase in power demand for pumping the produced media, or even long-term stoppages in crude oil production, associated with considerable financial losses.
The mechanical method is one way of removing paraffin deposits. However, the most efficient method for preventing the phenomenon of paraffin precipitation and lowering the pour point of petroleum involves the addition of a paraffin inhibitor into paraffinic crude oil. The paraffin inhibitor should be characterized by good solubility in crude oil, good compatibility with the hydrate inhibitor used in the given production plant, and sustainability in the range of temperatures used. Paraffin inhibitors in crude oil production plants are dispensed in a continuous manner to the wellheads and transmission pipelines. Typical dosage is 250–1500 mg/kg [
1].
When determining the methods for preventing paraffin precipitation from reservoir fluids during their production, it is necessary to determine the conditions for the deposition of the solid paraffin phase (wax appearance temperature—WAT). Knowing the temperature of the beginning of paraffin precipitation allows the determination of the optimal (for given conditions) method for preventing the generation of paraffin precipitates obstructing the flow of reservoir media. This is particularly important in the case of newly drilled reservoirs, where an unknown wax formation potential may become a cause of numerous problems already at the stage of a production test. The wax formation potential, meaning the determination of the amount of precipitated paraffin phase below the WAT, is perfect WAT supplementation. The determination of these two parameters allows complete listing of initial temperatures for the precipitation of the solid paraffin phase, and the subsequent presentation of the degree in which it increases with a drop in the temperature by plotting the wax precipitation curve (WPC) [
2,
3,
4,
5,
6].
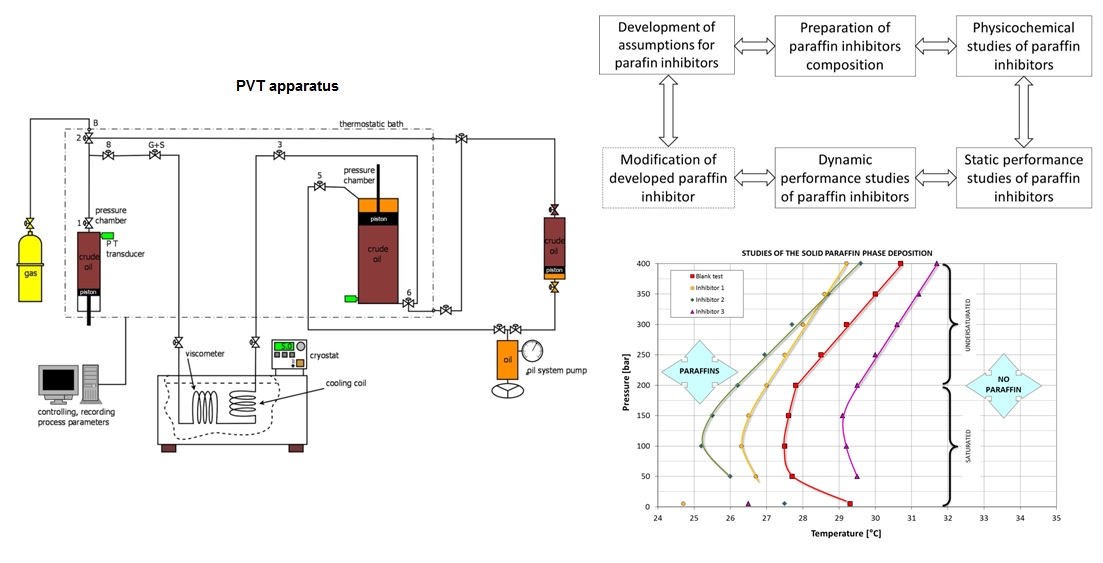
The aim of the research was to develop a path for the preparation and testing of paraffin inhibitors. The path includes the production of the inhibitor and the performance tests under near-real conditions. In the first stage, assumptions for paraffin inhibitors were developed (point 5.1.). Then, compositions of paraffin inhibitors were prepared (point 5.2.) and their physical and chemical properties were tested (point 5.2.). In the next stage, static performance tests (point 6.1.) and dynamic performance tests (point 6.2.and point 6.3.) were carried out. In dynamic performance tests, the best paraffin inhibitor composition was compared to commercially available inhibitor samples. The research path is shown in
Figure 1.
This approach to the preparation of paraffin inhibitors allows for quick evaluation of the effectiveness of paraffin inhibitors and determination of their optimal dose. We obtain a precise selection of the inhibitor, we have an influence on its modification, and this directly affects the reduction of production costs.
2. Paraffin Inhibitors—Chemical Composition
The development of effective paraffin inhibitors is a complex task involving preliminary laboratory tests, advanced tests, and ultimately field tests, meaning a technical simulation performed in a specific production plant. The final solution should be a stable, clear, and non-stratifying composition within a temperature range of –30 °C to +40 °C and not causing turbidity after adding it into crude oil.
Paraffin inhibitors added into crude oil which contains high-fusing paraffin hydrocarbons effectively prevent the deposition of paraffins on the surfaces of production equipment, pipelines, and tanks, assuring their proper and failure-free operation. Their advantages also include their properties which improve the fluidity of crude oil in a low temperature. Some of them additionally have anticorrosive properties, protecting the devices against the impact of corrosive factors present in the produced crude oil.
The primary components of paraffin inhibitors include:
2.1. Crystallization Modifiers/Pour Point Depressants
A crystallization modifier is the primary component of paraffin inhibitors, and its function is to disrupt the crystallization process of paraffins and lower the pour point of crude oil. The applied crystallization modifiers include low-molecular organic compounds and polymers of a polar nature, exhibiting surface activity. They are used individually, but often as a composition of two or more additives. They are substances preventing the generation of agglomerates from paraffin particles. They have a modifying effect on the crystallization process of paraffin hydrocarbons, leading to the generation of crystals with small sizes, which not tend to agglomerate and be deposited on the surfaces of devices. One of the effects of using crystallization modifiers involves lowering the pour point of crude oil and lowering its viscosity. This results from the combination of various mechanisms: agglomeration, cocrystallization, and adsorption [
1,
7].
Due to their diverse chemical nature, crystallization modifiers can be divided into the following groups:
acrylate and methacrylate ester copolymers with vinyl acetate,
acrylate and methacrylate ester copolymers with N-vinylpyrrolidone,
ester or amide derivatives of maleic anhydride and olefin copolymers,
ethylene and vinyl acetate copolymers,
polymethacrylates,
a mixture of vinyl acetate and maleic anhydride and alpha-olefin copolymers,
alkyl phenolic resins,
ester or amide derivatives of maleic anhydride copolymers,
polymers containing ester groups of maleic anhydride with alpha-olefins,
polymers containing imide groups of maleic anhydride with alpha-olefins [
1,
7].
2.2. Paraffin Dispersants
Paraffin dispersants are the second important components of paraffin inhibitors. They are surface active chemical compounds which are intended to prevent the agglomeration of paraffins which leads to their deposition on the walls of pipelines and tanks. The action of paraffin dispersants primarily involves the dispersion and uniform suspension of paraffin particles in the whole volume of crude oil. The additional effect of dispersants involves breaking up the already existing paraffin agglomerates.
Due to their diverse chemical nature, paraffin dispersants can be divided into:
Ionic paraffin dispersants are usually compositions of salts created in a reaction of inorganic or organic bases with alkylbenzenesulfonate acid. Alkylbenzenesulfonate acid contains an alkyl group with a straight-chained or branched-chained structure.
Nonionic paraffin dispersants are usually the products of ethoxylation of alkylphenols, aliphatic alcohols, or aliphatic amines. They are characterized by high solubility in crude oil. Their solubility depends on the quantity of ethylene oxide particles in the emulsifier particle. The low quantity of ethylene oxide particles increases their hydrophobicity, and therefore also their affinity towards oil. Some of them, especially ethoxylated fatty amines, are at the same time efficient corrosion inhibitors [
1].
2.3. Solvents
The primary components of a paraffin inhibitor are dissolved in an organic solvent. Hydrocarbon solvents are used as the primary solvent, usually of an aromatic nature, with a boiling point range of 60 °C to 250 °C, including xylene, toluene, ethylbenzene, heavy aromatic naphtha, and others. The second solvent usually does not have an aromatic nature; it is usually a refined low boiling fraction of petroleum or cycloalkanes. A good solvent enhances the action of a crystallization modifier, a bad one inhibits its action [
7].
3. Research Methods for Determining the WAT
The WAT related to the first signs of paraffin precipitation is the most important parameter determining the susceptibility of reservoir fluids to the depositions of paraffin waxes. During the many years of studies conducted in this area, a number of research methods have been developed in order to determine the WAT as precisely as possible.
The methods listed below were described in detail in the authors’ previous publication [
8].
“cold finger” method [
9,
10],
cross-polarized microscopy (CPM) [
9,
13,
14],
Fourier-transform infrared spectroscopy (FTIR) [
13],
differential scanning calorimetry (DSC) [
13],
volumetric paraffin shrinkage during freezing [
9,
16],
measuring filter resistances under dynamic conditions [
9],
measuring viscosity changes as a function of temperature [
9].
4. Research Methods for Determining the WPC
Determination of the WAT is based on the physical changes of the tested crude oil resulting from a change in the state of matter of paraffins from a liquid to a solid. While the conditions of precipitation of the solid paraffin phase are known, there is no information about its amount, which is of major significance during operation. When determining the WPC (wax precipitation curve), additional data is provided about the amount of precipitated paraffin deposit in any temperature. Several developed experimental methods allowing the determination of the WPC are listed below:
differential scanning calorimetry (DSC) [
13,
17,
18],
nuclear magnetic resonance (NMR) [
13],
Fourier-transform infrared spectroscopy (FTIR) [
19,
20,
21],
fractional precipitation [
18].
5. Materials and Methods
5.1. Preparation of Paraffin Inhibitors
The compositions of paraffin inhibitors used mixtures of polymers with various functions in the inhibitor (
Table 1).
5.1.1. Polymer 1–Polyoxyethylene Isodecyl Ether; or Polymer 2—Polyurethane
These are intended to increase the resistance of the product to high pressure by lowering the pour point of crude oil (reducing flow resistances, acting as a depressant).
5.1.2. Polymer 3—α-olefin Copolymer with Maleic Anhydride
This acts as a crystallization modifier, i.e., having a modifying effect on the crystallization process of paraffin hydrocarbons and leading to the generation of crystals with smaller sizes, thereby there is no tendency for agglomeration and deposition of crystals on the surfaces of devices.
5.1.3. Polymer 4—Polyethoxylated Tallow Amine
This is intended to enhance the dispersing properties of an inhibitor, preventing the agglomeration of paraffins and their deposition on the walls of pipelines by the uniform suspension of paraffin particles in the whole volume of petroleum.
5.1.4. Small-Molecule Ionic Dispersant—Magnesium Salt of an Organic Aromatic Acid
This is intended to enhance the dispersing properties of the inhibitor.
5.1.5. Solvent 1—Aromatic-Type Solvent
Depending on the intended use (place of application) of the given paraffin inhibitor, it is possible to modify the composition of a paraffin inhibitor within a specified range using various solvents or their mixtures. It is a frequent requirement for the pour point of a paraffin inhibitor to be below –30 °C. Then, when choosing the primary solvent, one must first mainly consider its good low-temperature properties. Other important parameters of a solvent which must be taken into account include the ability to dissolve paraffin hydrocarbons, its impact on elastomers, the necessity to provide a high flash point, availability, and the price.
5.1.6. Solvent 2—Alcohol-Type Solvent
This solvent act as a solubilizer and it is used in order to improve the mutual solubility of the individual components of an inhibitor. Due to such an approach to the issue, proper stabilities, and compatibilities of the product are obtained.
5.2. Production of Paraffin Inhibitors
Paraffin inhibitors were produced in a glass reactor provided with an agitator and thermometer, with a volume of 250 mL.
Solvent 1 was introduced into the reactor. Afterwards, individual components were introduced in room temperature in the following sequence: the small-molecule ionic dispersant, Polymer 1 or 2, Polymer 3, Polymer 4, in such a manner that each next component would be dissolved in the mixture of an inhibitor. During the last stage, Solvent 2 was added and stirred so that upon complete homogenization the paraffin inhibitor constituted a clear liquid of low viscosity.
Research results comprising the properties of paraffin inhibitors used in the tests are presented in
Table 2.
5.3. Testing the Dispersing Properties of Paraffin Inhibitors
5.3.1. Principle of the Method
The method is used to assess the dispersing properties of paraffin inhibitors by determining the ability to disperse paraffins, expressed in %. The method involves the preparation of a crude oil sample enriched with a paraffin asphaltene deposit, and subsequently dosing a paraffin inhibitor in a temperature above the WAT, introducing a steel plate to the above sample and assessing the amount of deposits on the plate after 24 h. The efficiency of a paraffin inhibitor increases along with a decrease in the amount of paraffin-asphaltene sediments deposited on the metal plate.
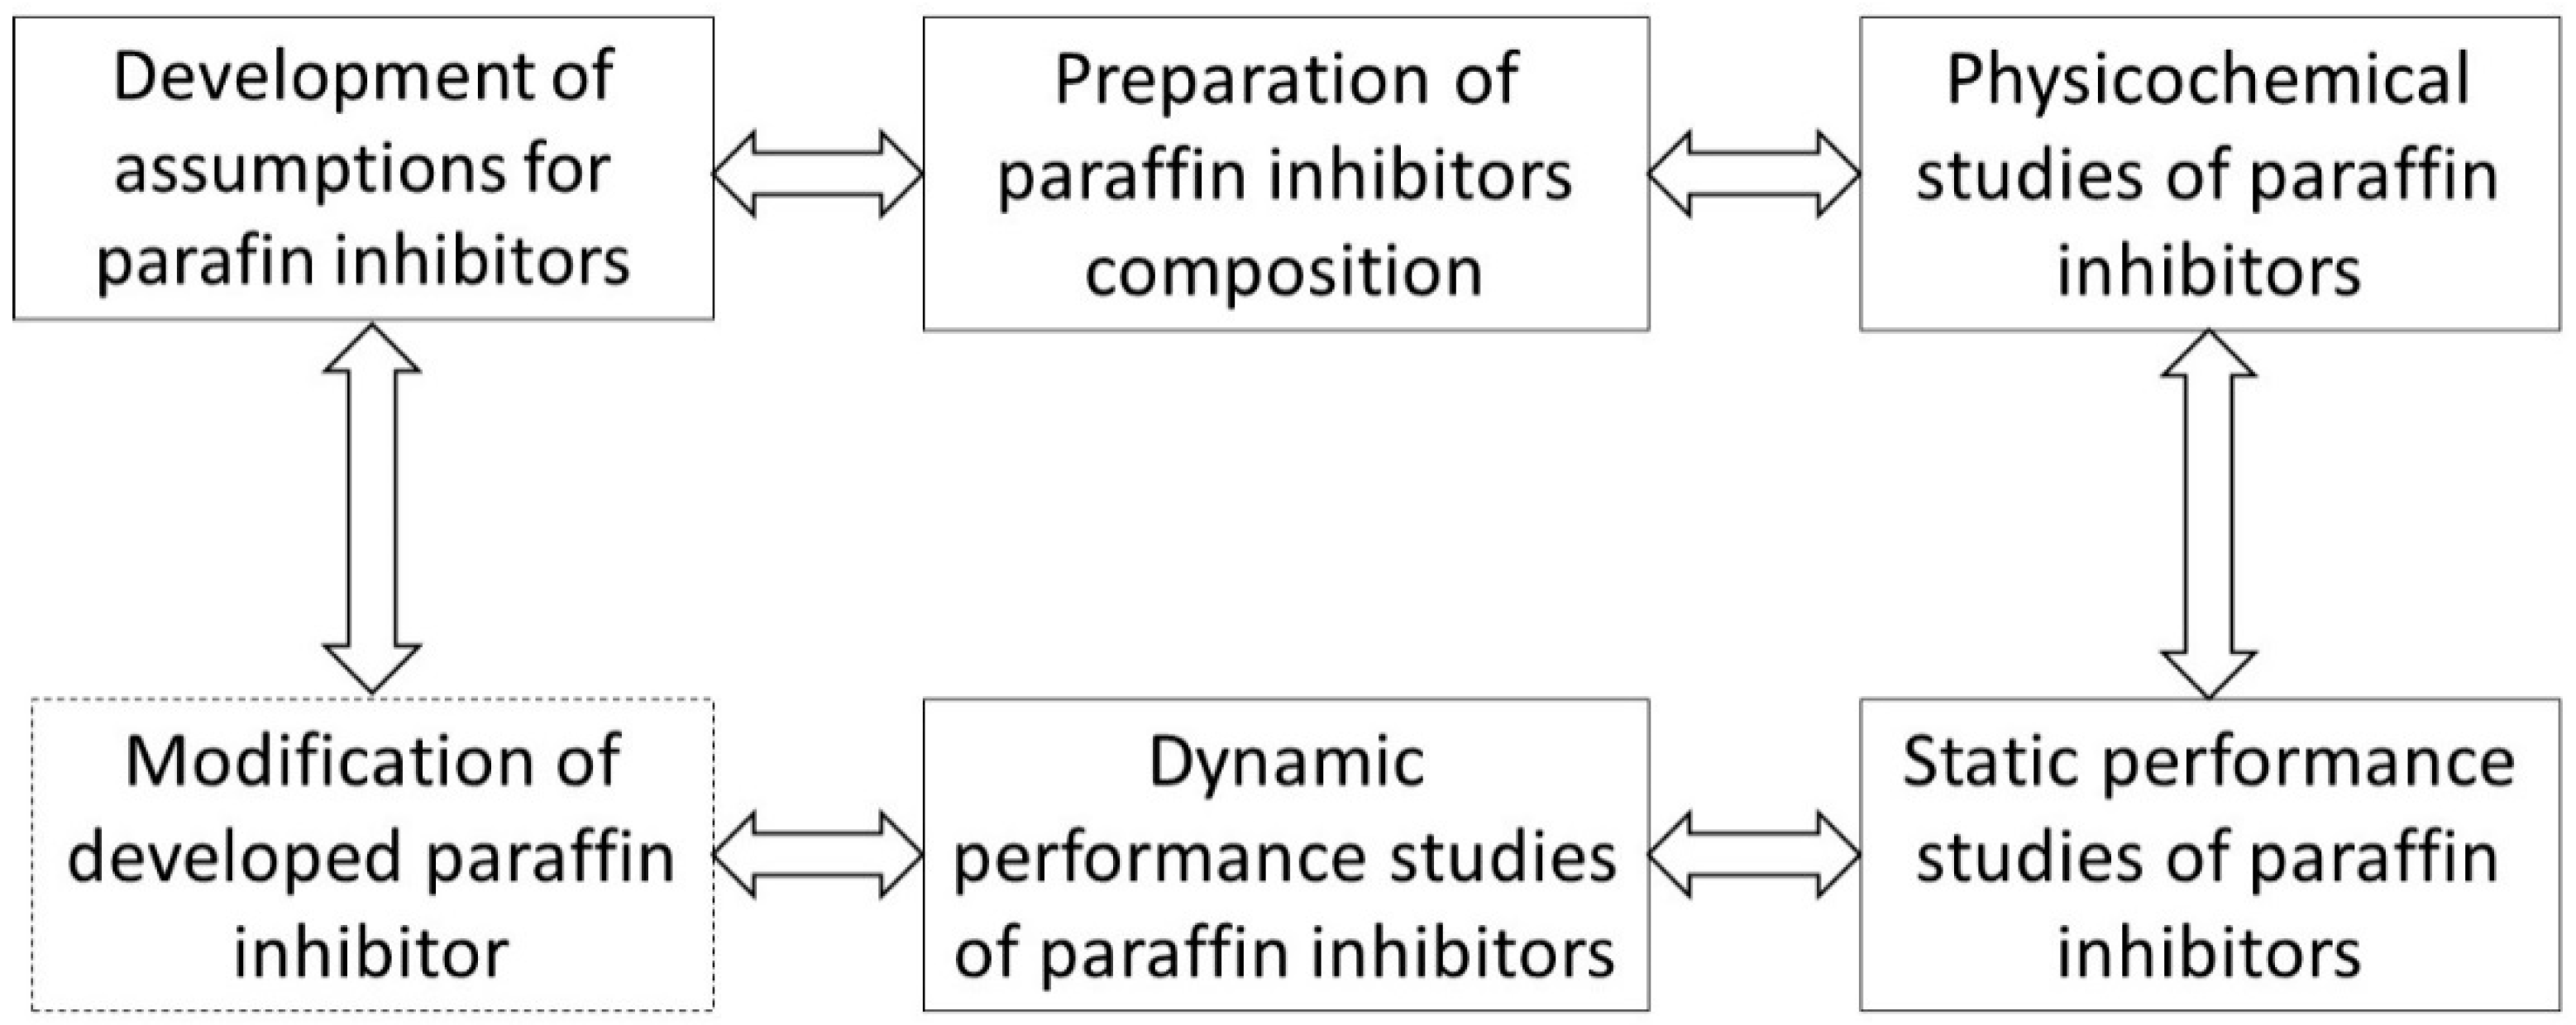
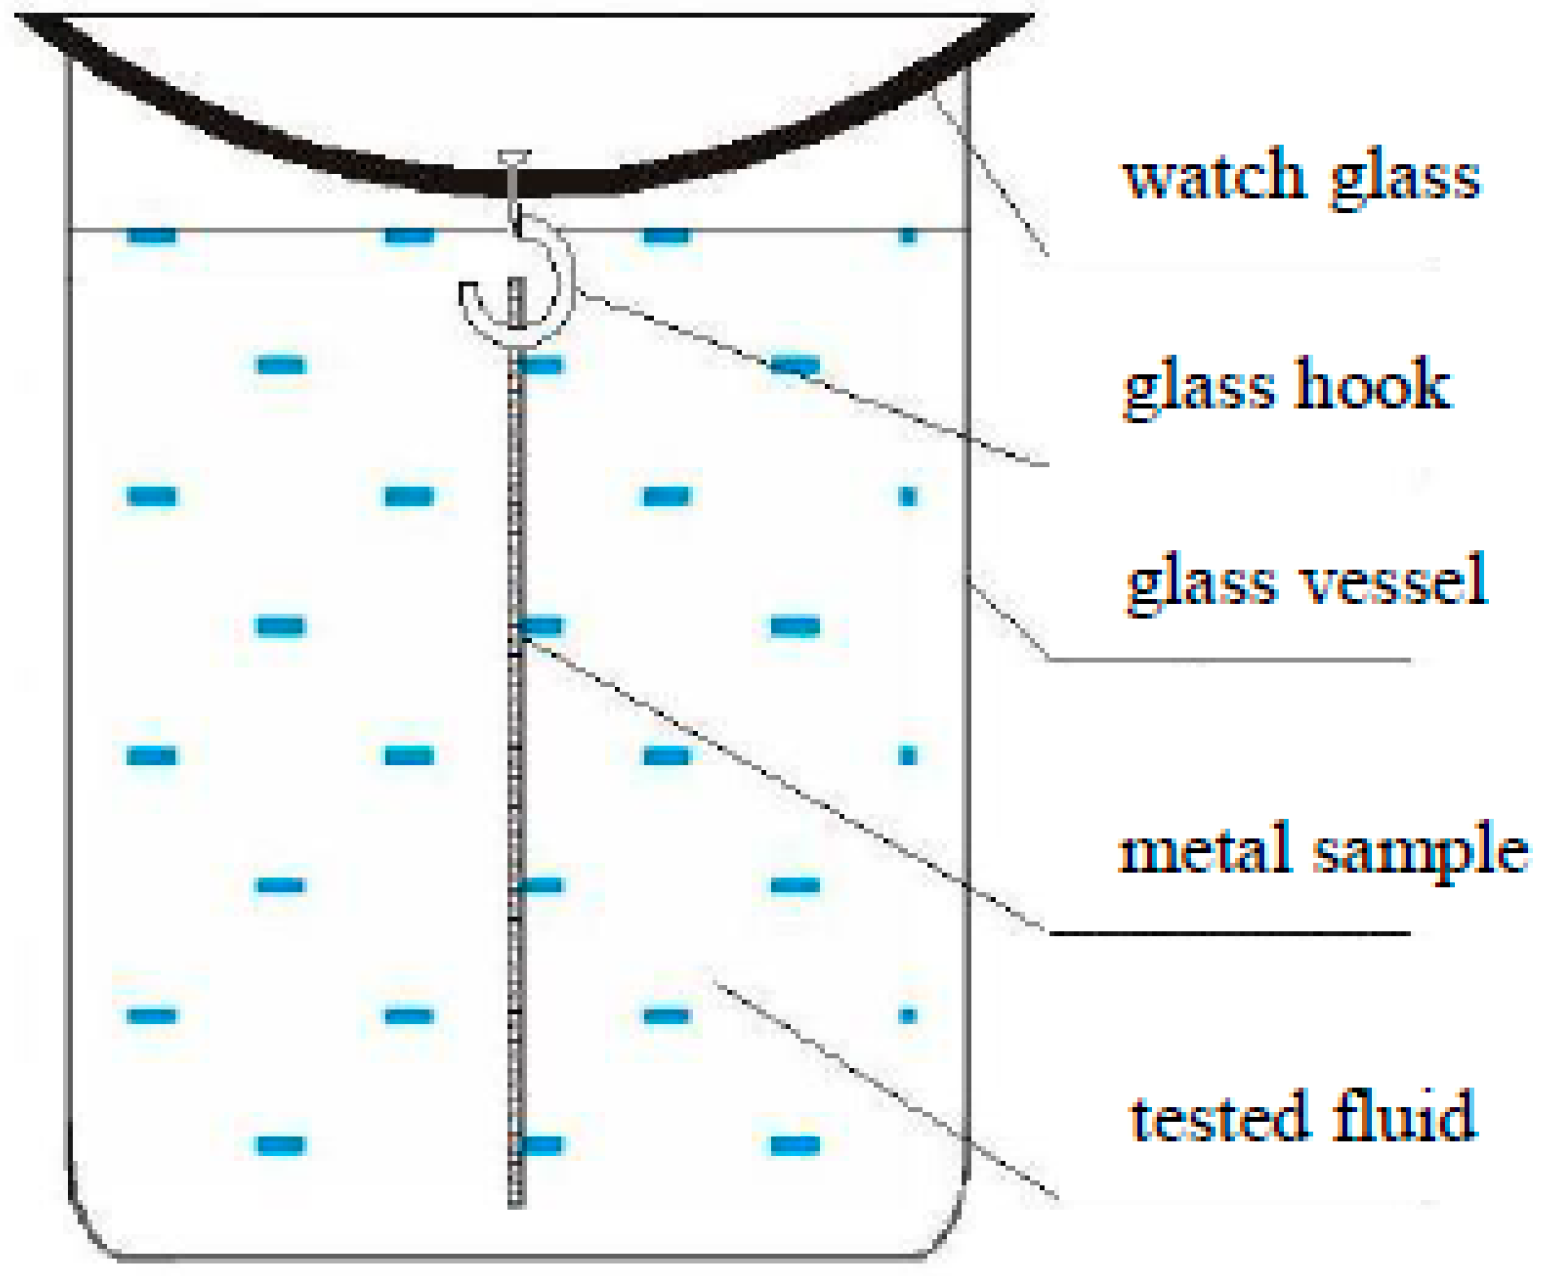
A set for testing the dispersing properties of paraffin inhibitors is presented in (
Figure 2). The set consisted of a glass vessel with a volume of 100 mL, provided with a watch glass with a glass hook in the center, used to suspend the steel plate.
Metal plates with dimensions of 50 × 20 × 3 mm were cleaned by grinding on a grinder, and the plate surface was subsequently ground with plain weave with a mesh size of 60 Å and 80 Å. The ground plates were subsequently washed with acetone and ethyl alcohol. Upon evaporation of the solvent traces, the plates were weighed on an analytical balance with an accuracy of 0.0001 g.
5.3.2. Procedure
Petroleum with properties according to
Table 3 was homogenized in a temperature above the paraffin crystallization point. The paraffin-asphaltene deposit with properties according to
Table 4 underwent transition from a solid form to a liquid form and was homogenized. Beakers with a volume of 100 mL were filled with 76.8 g of crude oil and 3.2 g of paraffin deposit; subsequently, a paraffin inhibitor was dosed precisely under the surface of oil, such that its concentration would reach the required level. The share of the inhibitor in individual beakers was 0 or 1000 mg/kg. A minimum of three petroleum samples with a paraffin-asphaltene deposit were assigned for each dosing. Crude oil with the deposit was heated up and stirred in a temperature of 60 °C. The paraffin inhibitor was dosed in a temperature of 50 °C. After reaching this temperature, the previously weighed metal plate with properties according to
Table 5, was immediately immersed in oil and covered with a watch glass. The completed sets were left in an air-conditioned laboratory in a temperature of 18 °C for a period of 24 h. After 24 h the plate was removed and left for a period of 15 min to drain, then weighed. The test result was the difference in weight between the metal plate with the paraffin deposit and the metal plate without the deposit. The efficiency of paraffin dispersion was calculated using Formula (1)
where:
X1—the average mass of a paraffin deposit for petroleum samples with a paraffin inhibitor
X0—the average mass of a paraffin deposit for petroleum samples without a paraffin inhibitor (zero)
5.4. Testing the Deposition Conditions of the Solid Paraffin Phase
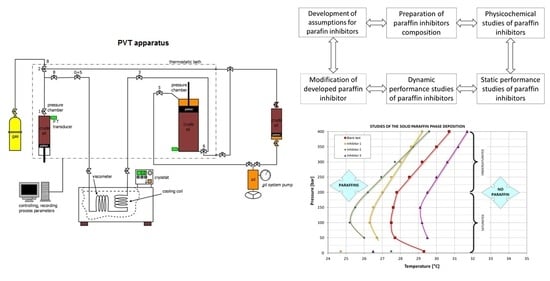
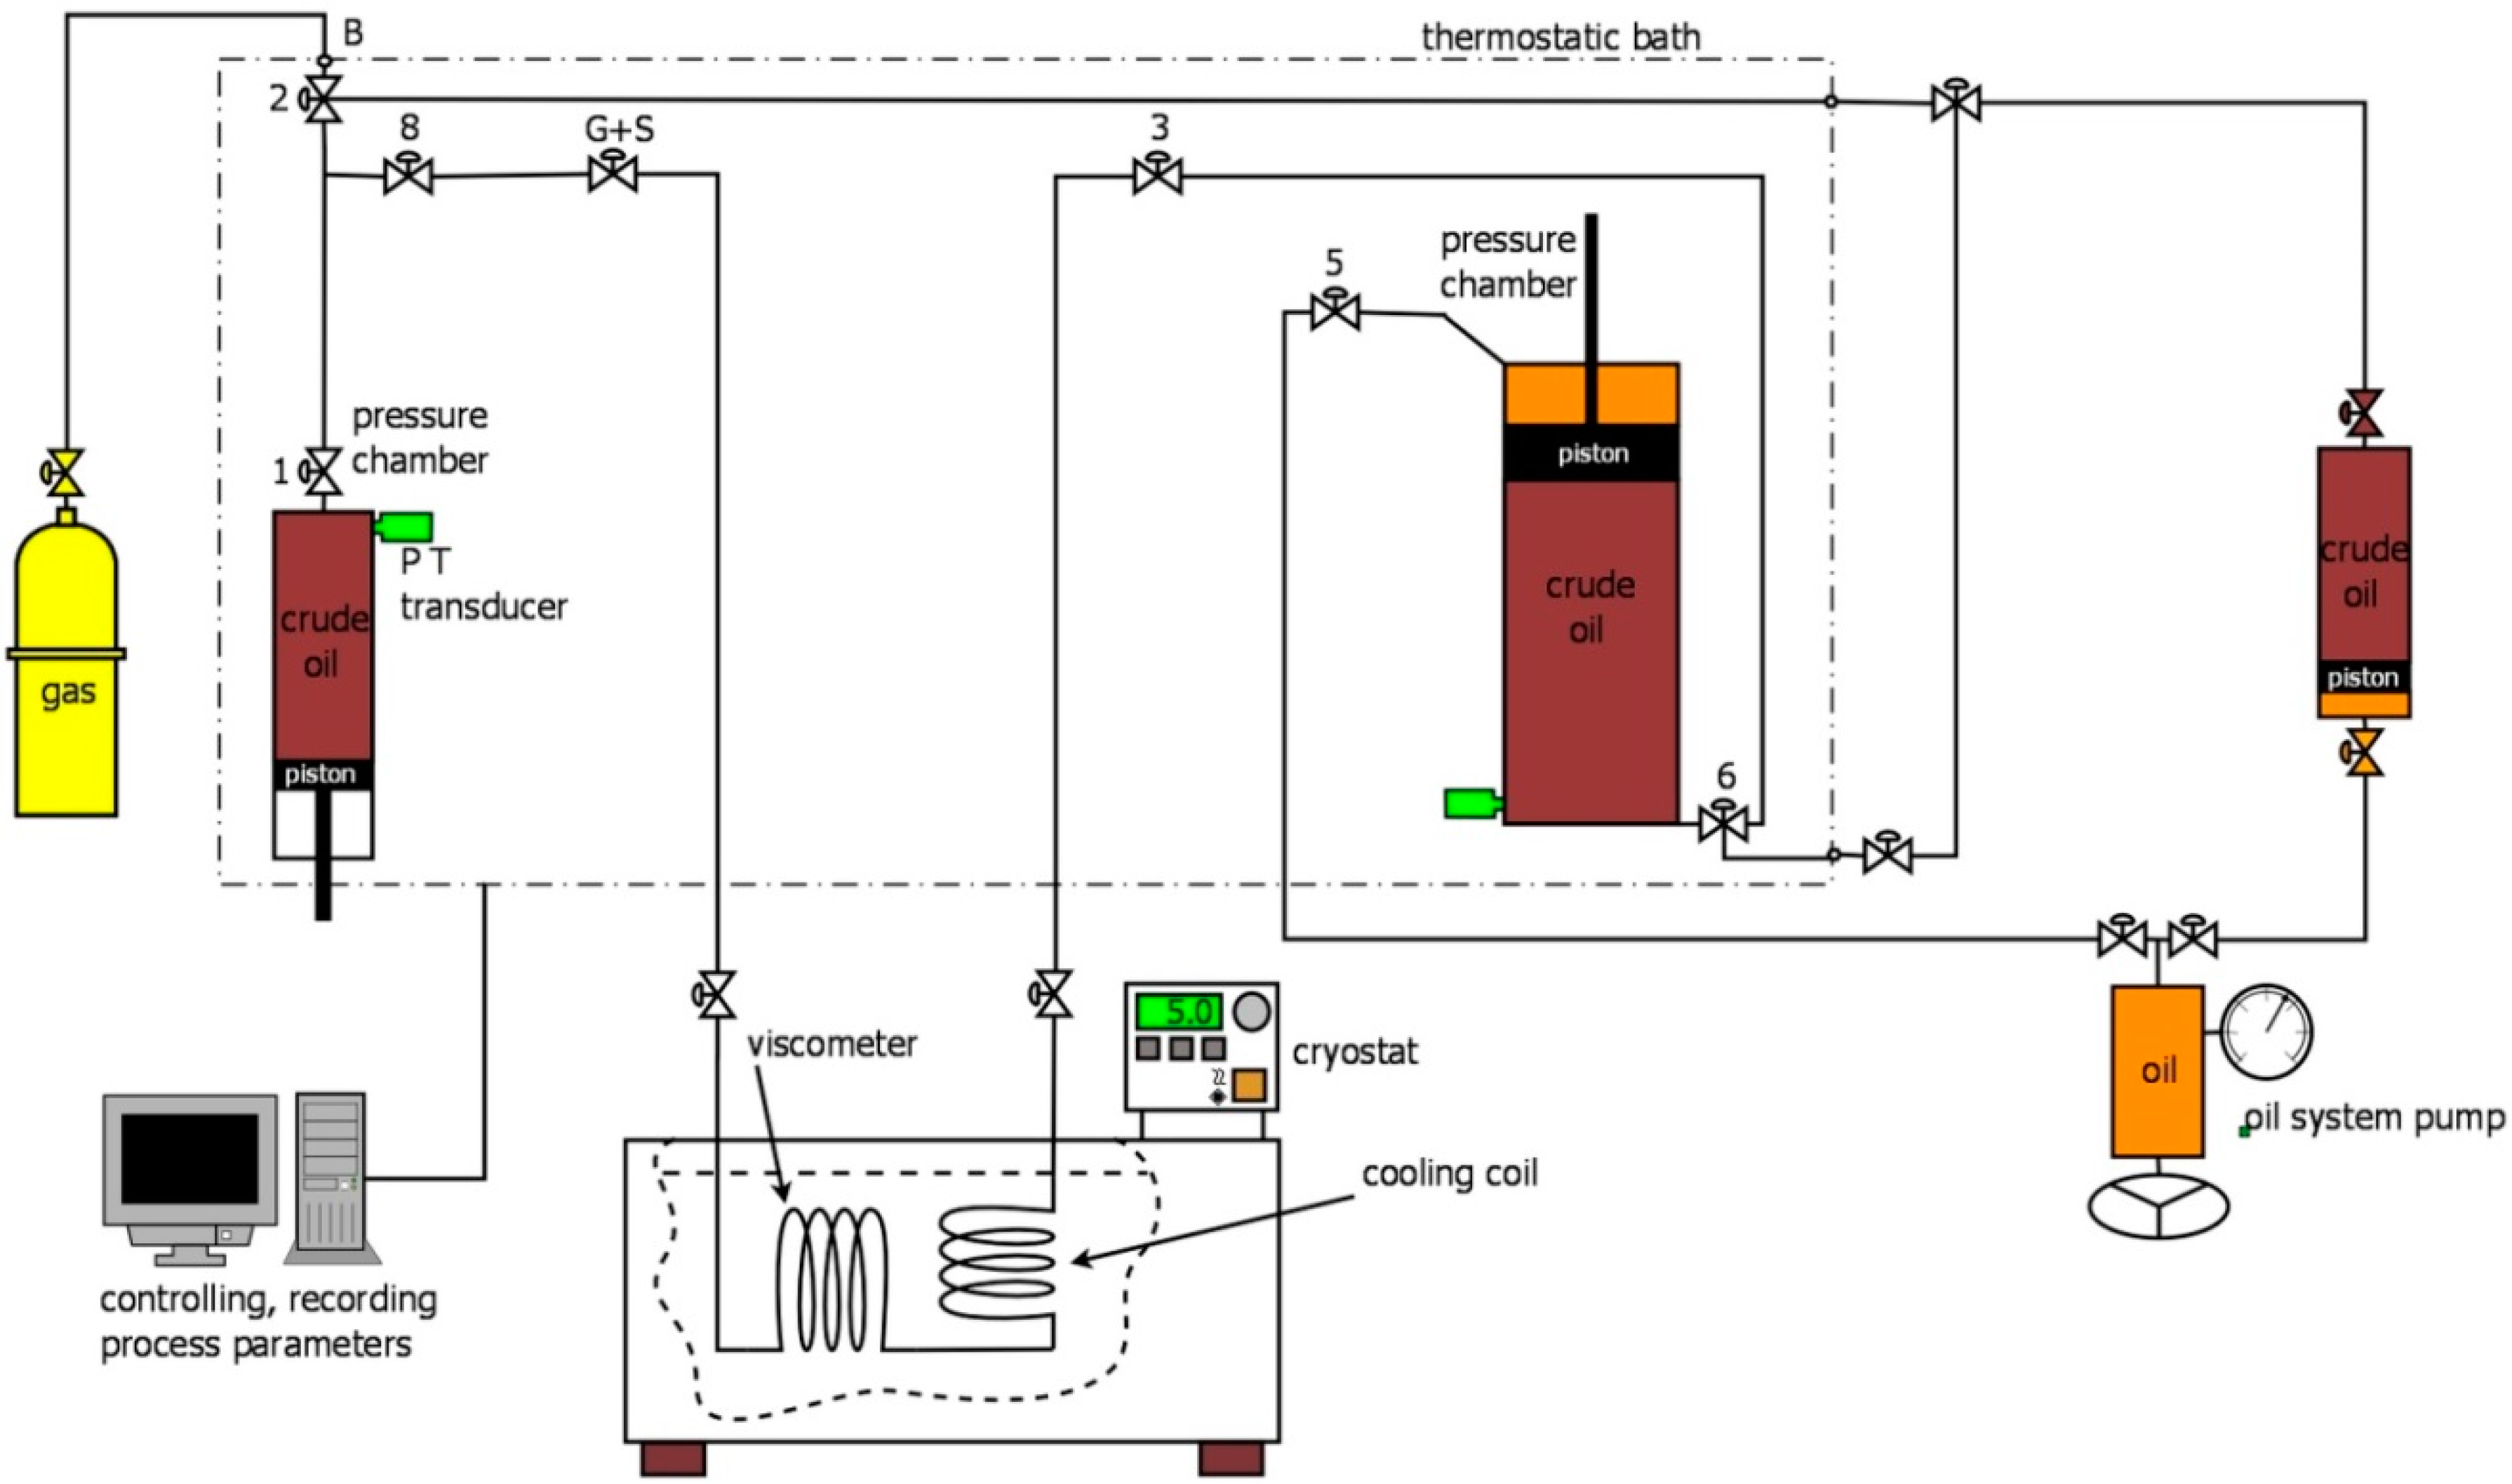
Studies of the temperature of the beginning of precipitation were conducted using a PVT apparatus for testing the phase properties of reservoir fluids. In order to accomplish the abovementioned tests, the PVT set was properly upgraded with high-pressure connections and a cooling system (cryostat) intended to maintain the preset temperature.
A capillary viscometer was the main element of the apparatus during the determination of initial pressure and temperature conditions for paraffin precipitation. Upgrading of the apparatus involved removing the viscometer from a thermostatic bath of the PVT apparatus and mounting it in a cryostat bath filled with an ethylene glycol solution. Additionally, the cryostat enabled precise temperature adjustment of the flowing reservoir fluid sample. A change in the placement of the viscometer allowed maintaining a constant temperature (above the WAT) of the tested crude oil sample in pressure cells of the PVT apparatus with a simultaneous ability to lower the temperature of a sample flowing through a capillary viscometer (
Figure 3). Such an approach was able to eliminate the risk of deposit precipitation in the pressure cells, which could cause major mistakes in determining the conditions for the precipitation of paraffins from the tested crude oil. To study the depositional conditions of the solid paraffin phase, a crude oil from the Polish reservoir was used [
22].
6. Results and Discussion
6.1. Results of Testing the Dispersing Properties of Paraffin Inhibitors
A test of the dispersing properties of selected paraffin inhibitors IP-1-18.01, IP-1-18.02, IP-1-18.03, IP-2-18.01, IP-2-18.02 was performed with a dosage of 1000 mg/kg, in a temperature of 50 °C. The test results are presented in
Table 6.
It can be seen (
Table 6) that paraffin inhibitor IP-1-18.01 is the most efficient (30.8% protection against paraffins), and it was selected for further tests of deposition conditions for the solid paraffin phase in a PVT apparatus.
6.2. Separator Oil and Gas—Testing the Conditions of Solid Paraffin Phase Deposition
Two series of tests were performed for all crude oil samples. The first series consisted of five experiments. It was assumed that the first experiment would be performed for a dead oil sample (unsaturated with gas). For the subsequent tests, the sample would be saturated with gas in increments of 50 bar until reaching Psat = 200 bar.
The second series of tests consisted of four experiments. Before each test, recombination of approx. 300 cm
3 of an oil sample was performed to a saturation pressure of 200 bar in a temperature of 45 °C. It was assumed that each experiment would be conducted for an oil sample with the same value of saturation pressure. For the subsequent tests the studied oil sample would be compressed to a higher pressure in increments of 50 bar until reaching P
t = 400 bar.
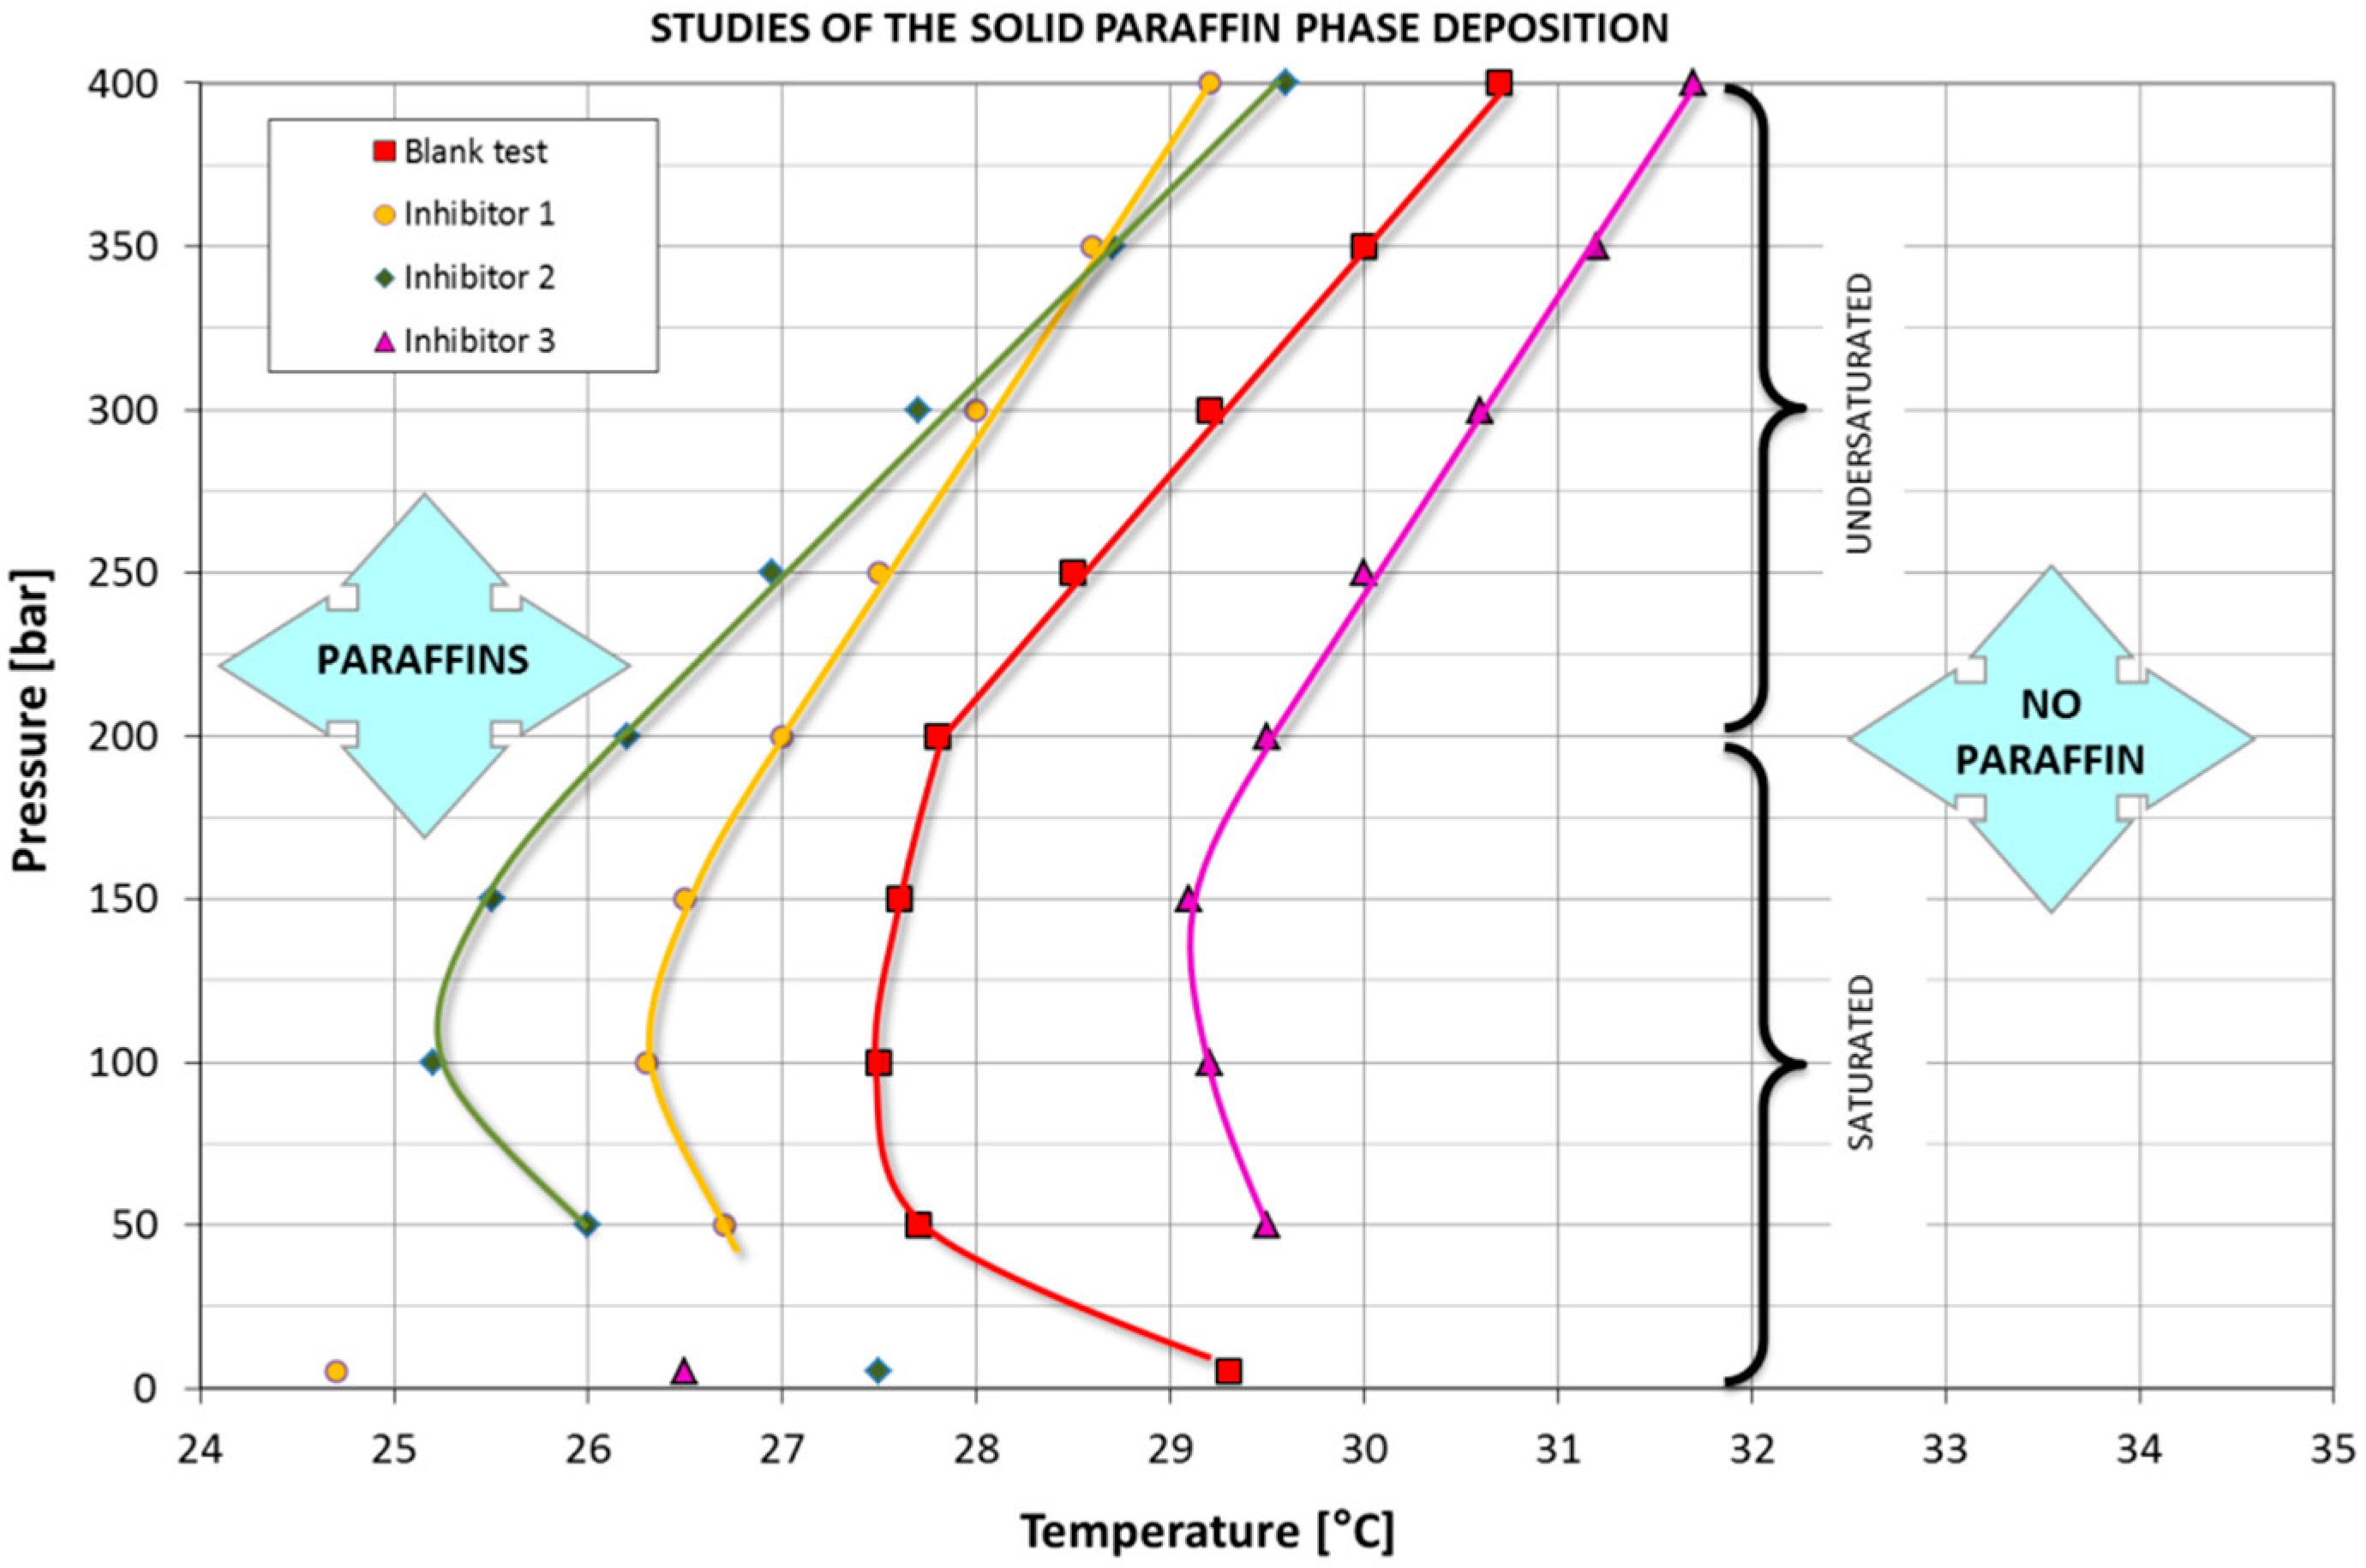
Table 7 presents main results of tests and (
Figure 4) is a paraffin precipitation PT system generated for an oil sample with the applied inhibitors.
Figure 4 presents the results achieved from testing the conditions the solid paraffin phase deposition in crude oil sample with applied inhibitors. The shape of curves in the pressure–temperature system is very similar within a range both below and above the saturation pressure. The following part of the paper describes studies intended to investigate the mass of the deposit which was intercepted during pumping oil sample through the filtering system. These experiments were conducted under the PT conditions specific to the paraffin area.
6.3. Separation of Deposits Under the Given Pressure and Temperature Conditions—Determination of the WPC
In order to determine the wax formation potential of petroleum, the PVT apparatus used in previous test (WAT determination) was additionally modified. For this purpose, a filtering assembly replaced the previously mounted capillary. The filter with its housing and a system of connections was submerged in a liquid thermostatic bath of the cryostat (
Figure 3).
A specialized high-pressure filtering system was constructed in order to separate the paraffin deposit precipitated under the given conditions from the crude oil. For its implementation a replaceable filter (resistant to the impact of hydrocarbons) enclosed in a durable, steel, compact housing was used.
The process the paraffin phase separation (from crude oil sample) took place in temperatures from 5 °C to 25 °C in increments of 5 °C. To this end, petroleum saturated to a pressure of 50 bar was used—during testing in pressure cells, the studied fluid was maintained at a pressure of approx. 70 bar. The amount of 70 cm
3 crude oil with an addition of three different inhibitors was pumped through the filtering system in each test temperature (
Table 8).
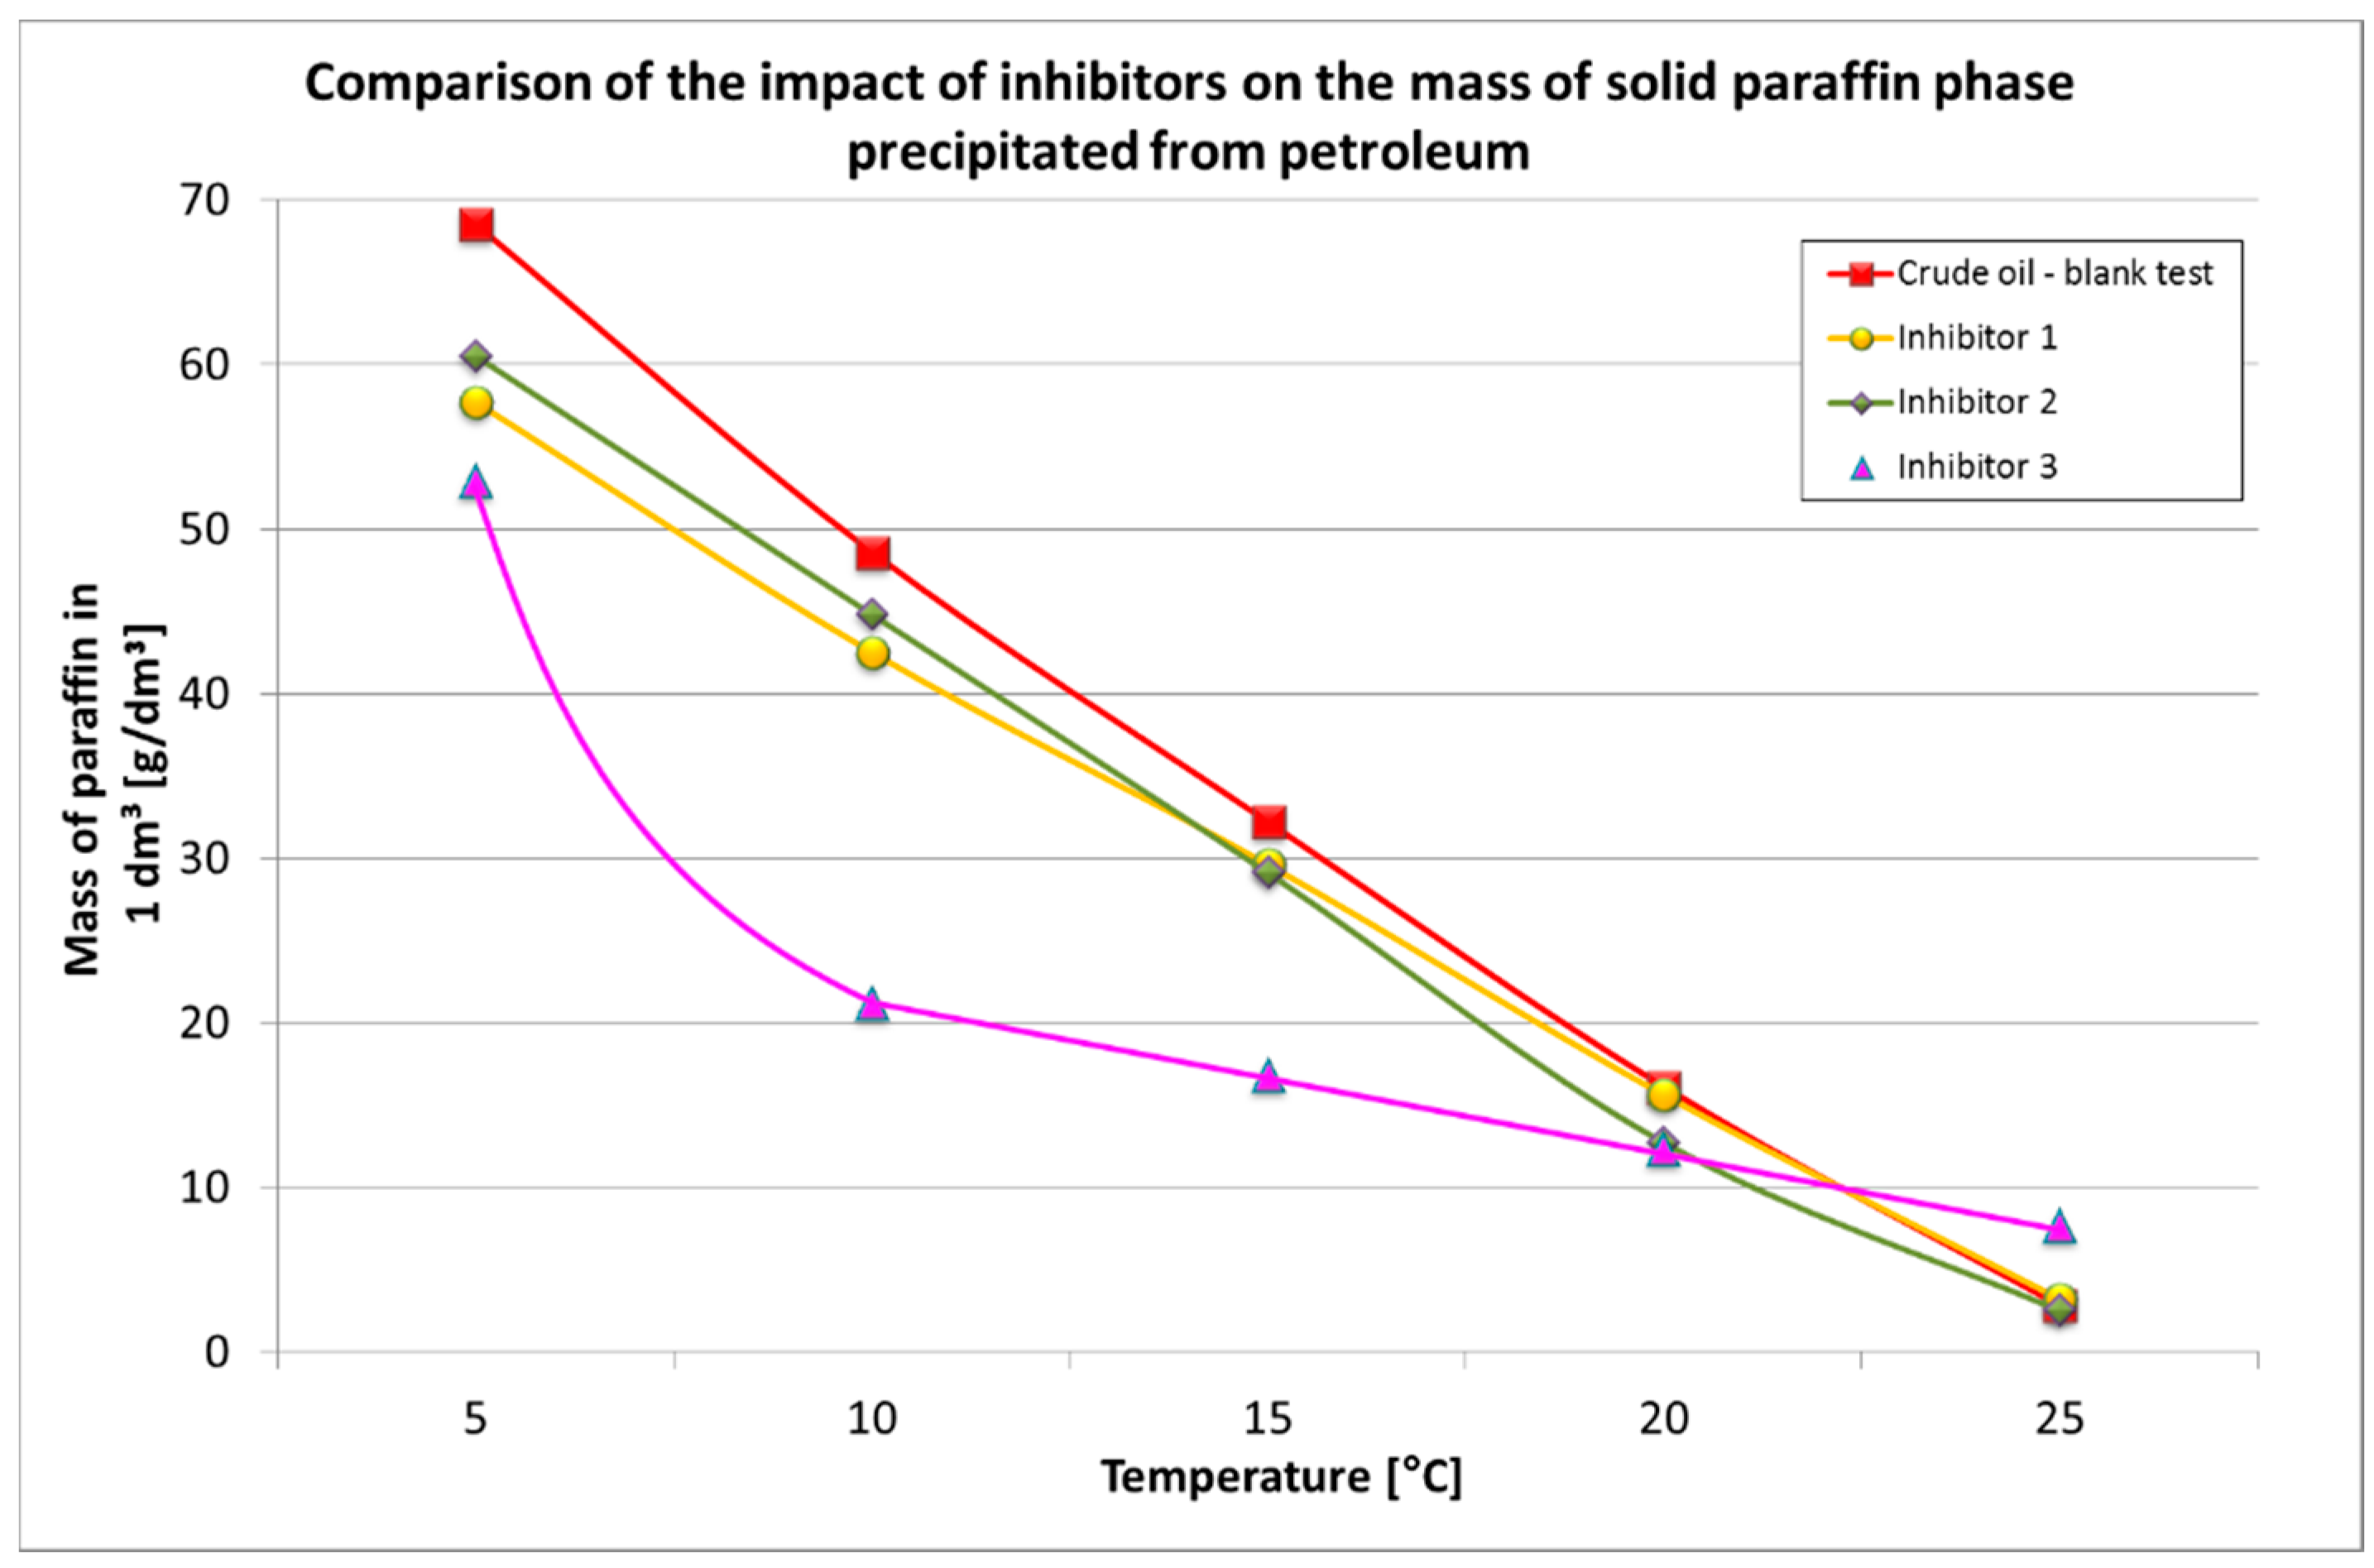
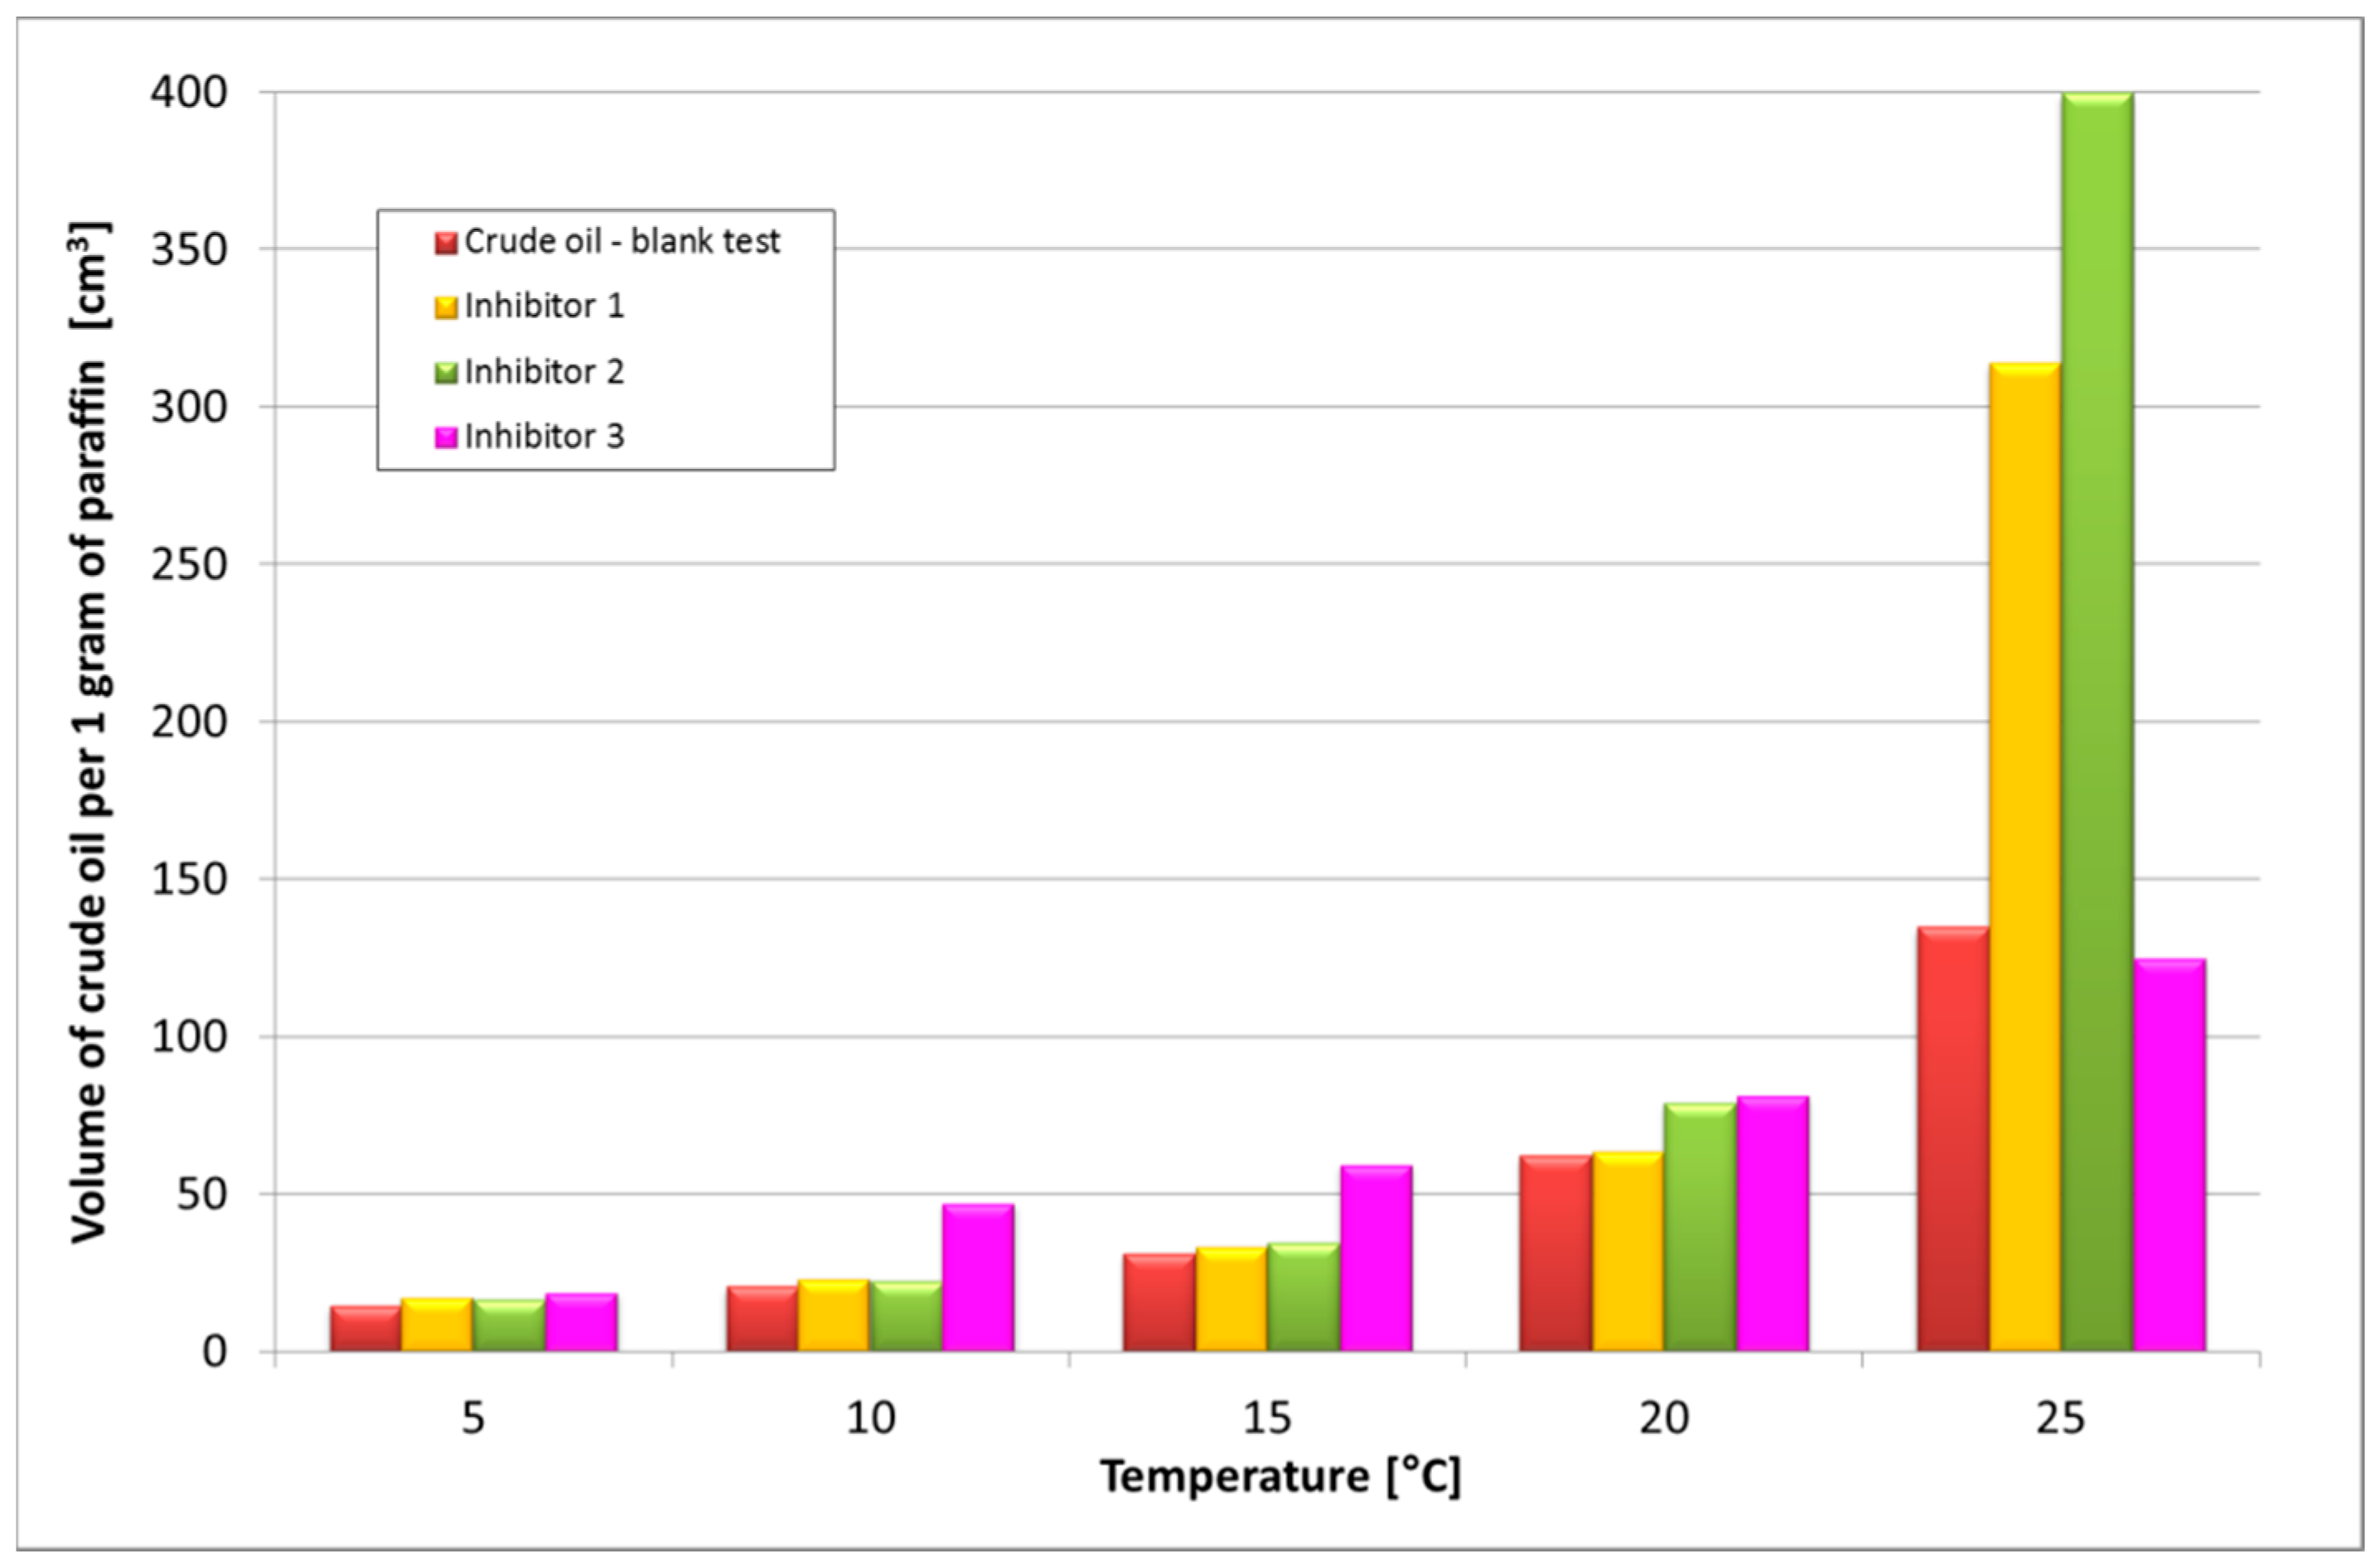
Figure 5 shows comparison of the impact of inhibitors on the WPC shape and
Figure 6 shows comparison of the impact of inhibitors on the volume of oil sample needed for deposition of 1 g of the paraffins. Under the applied pressure–temperature conditions using a 5 µm filter, it was possible to filter out between 0.19 g in 25 °C and 4.79 g in 5 °C of solid paraffin phase from the pumped volume; for crude oil with an addition of inhibitors, the amount of 0.17 g in 25 °C and 4.23 g in 5 °C was separated. The deposit had a black color, a sticky and greasy consistency, and a rather intense scent—characteristics for sour crude oil from the Polish reservoir.
In the Oil and Gas Institute—National Research Institute it is currently possible to perform a full range of tests regarding the phenomenon of solid paraffin phase deposition including to determination of the WAT temperature as well as studies of the wax formation potential associated with the temperature drop. Using live (recombinated) oil crude for specific pressure–temperature conditions helps to better understand the phenomenon of the deposition of paraffins because the pressure as well as the gas dissolved in a crude oil sample greatly affect obtained WAT results.
Based on experiments performed for crude oil without additives as blank test, as well as with the addition of three different inhibitors with a dosage of 500 mg/kg, a boundary has been determined separating the paraffin area (the presence of solid phase paraffins) from an area without paraffin (
Figure 4). Measurements of the amount of paraffin done with specialized filter allowed the determination of the WPC, due to which additional data is provided regarding the amount of precipitated paraffin deposit in the paraffinic area.
Attention should be paid to the obtained differences in the effectiveness of used agents for a dead oil sample in relation to the pressurized conditions. Inhibitor 2 turned out to be the most efficient one for dead oil, followed by inhibitor 3 and inhibitor 1. On the other hand, if an assessment of the effectiveness is made under real (pressurized conditions), this sequence undergoes a considerable change, because it turns out that the most efficient agent is the worst one for a dead oil sample, meaning inhibitor 2, followed by inhibitor 1, while inhibitor 3 was proven to be ineffective. When using inhibitor 3, the paraffin deposit appeared at a temperature higher by approximately 2 °C.
Upon an analysis of wax precipitation curves, it turns out that inhibitor 2 is the only agent to exhibit successful reduction of the amount of paraffins by approx. 12% in the full temperature range. The remaining two inhibitors are characterized by splitting into temperature areas, in which they are more efficient than the previously mentioned additive. Changes in the course of WPC for crude oil with an addition of inhibitor 1 is comparable for the base petroleum sample (with no additives) for reaching a temperature of 20 °C. For temperatures between 15 °C and 5 °C, an increase in the amount of the intercepted deposit is observed; however, it is lower than in the blank test, reaching a deposit reduction in the range of 8–16%.
For a crude oil sample with inhibitor 3, in a temperature of 25 °C, there was an almost three-fold increase in the amount of the intercepted paraffin deposit. Subsequently, from 20 °C, there was a reduction in paraffin by 14%, until reaching a level of 56% at a temperature of 10 °C.
7. Conclusions
Based on the results, the inhibitors could be categorized according to the place/method of their application listed below.
Inhibitor 1 is characterized by much higher efficiency for pressures above 300 bar, which indicated the possibility of its use in the vertical part of a well through the injection line (newly discovered reservoirs with high pressure).
When using traditional research methods, inhibitor 2 (measurements for dead oil samples) could be rejected as the least effective one. In the case of pressurized sample tests, it turned out to be the most efficient agent for use in a surface installation. This inhibitor successfully lowered the WAT and successfully reduced the amount of precipitated deposit.
Inhibitor 3 is proven to be very efficient for the dead oil sample and ineffective under pressurized conditions. However, it turns out that it perfectly reduces the amount of precipitated deposit below a temperature of 22 °C, which may suggest its use in situations of installations operating in lower temperatures (winter period) as a supporting agent, and also a cleaning one at higher doses.
The particular advantage of the described test is the possibility of conducting measurements in a wide range of pressures and using oil sample saturated with reservoir gas, close to the real production conditions. Most of the worldwide-recognized paraffin testing methods do not use live oil and do not allow for measurements under pressure conditions. Thus, the results may be burdened with an error.
The main conclusion of the presented studies is related to the change in the concept of paraffin inhibitors testing. The measurements with dead oil samples often lead to different results when compared with live oil (saturated with gas), that is typically found in producing conditions. The described methodology allows us to evaluate the effectiveness of paraffin inhibitors and to determine their optimal dosage. This approach leads to a precise selection of the inhibitor, which directly translates into cost reduction along with the maintenance of production continuity. Furthermore, it allows for a reduction of expensive production tests, and earlier rejection of ineffective inhibitors.
Author Contributions
Conceptualization, methodology, and validation, M.P. and S.S.; Formal analysis and investigation, M.P., S.S., and J.K.; Writing—original draft preparation, M.P. and S.S.; Writing—review and editing, S.S., M.P., and M.W. (Mirosław Wojnicki); Visualization, S.S. and M.W. (Mirosław Wojnicki); Supervision, M.P. and M.W. (Marcin Warnecki). All authors have read and agreed to the published version of the manuscript.
Funding
This research was funded by Polish Ministry of Science and Higher Education, number in archive: DK-4100-01/18, order no.: 01/KB/18 “Studies on the efficiency of the impact of paraffin inhibitors on lowering the WAT temperature and reducing the amount of paraffin deposit” and number in archive: DK-4100-74/18, order no.: 74/TO/18 “The development of new paraffin inhibitors for the mining industry”
Conflicts of Interest
The authors declare no conflict of interest.
References
- Gaździk, B.; Pajda, M. The impact of surface-active dispersants on the physicochemical and functional properties of paraffin inhibitors designed for high-paraffin crude oil. Nafta Gaz Sci. Technol. Oil Gas Ind. 2013, 4, 319–328. [Google Scholar]
- Alnaimat, F.; Ziauddin, M. Wax deposition and prediction in petroleum pipelines. J. Pet. Sci. Eng. 2020, 184, 106385. [Google Scholar] [CrossRef]
- Ehsani, S.; Haj-Shafiei, S.; Mehrotra, A.K. Experiments and modeling for investigating the effect of suspended wax crystals on deposition from ’waxy’ mixtures under cold flow conditions. Fuel 2019, 243, 610–621. [Google Scholar] [CrossRef]
- Coto, B.; Martos, C.; Espada, J.J.; Robustillo, M.D.; Peña, J.L. Experimental study of the effect of inhibitors in wax precipitation by different techniques. Energy Sci. Eng. 2014, 2, 196–203. [Google Scholar] [CrossRef]
- Taheri-Shakib, J.; Rajabi-Kochi, M.; Kazemzadeh, E.; Naderi, H.; Shekarifard, A. A comprehensive study of the impact of wax compositions on the wax appearance temperature (WAT) of some Iranian crude oils: An experimental investigation. J. Pet. Sci. Eng. 2018, 165, 67–80. [Google Scholar] [CrossRef]
- Zheng, S.; Saidoun, M.; Mateen, K.; Palermo, T.; Ren, Y.; Fogler, H.S. Wax Deposition Modeling with Considerations of Non-Newtonian Fluid Characteristics. In Proceedings of the Offshore Technology Conference 2016, OTC-26914-MS, Houston, TX, USA, 2–5 May 2016. [Google Scholar] [CrossRef]
- Gaździk, B. The influence of paraffin crystallization modifiers of the Flow Improver type (FI) and Pour Point Depressant (PPD) on the rheological properties and pour point temperature of paraffinic crude oils. Nafta Gaz Sci. Technol. Oil Gas Ind. 2014, 11, 825–834. [Google Scholar]
- Szuflita, S.; Kuśnierczyk, J. Investigation of the influence of pressure and temperature on paraffin wax deposition in crude oil. Nafta Gaz Sci. Technol. Oil Gas Ind. 2017, 6, 395–404. [Google Scholar] [CrossRef]
- Lubaś, J.; Biały, E.; Warnecki, M. Deposition Conditions of the Solid Paraffin Phase and Methods of Its Prevention During the Exploitation of oil Fields; INiG—PIB; Prace Naukowe Instytutu Nafty i Gazu nr 100: Krakow, Poland, 1999. [Google Scholar]
- Correra, S.; Fasano, A.; Fusi, L.; Primicerio, M. Modelling wax diffusion in crude oils: The cold finger device. Appl. Math. Model. 2006, 31, 2286–2298. [Google Scholar] [CrossRef] [Green Version]
- Coutinho, J.A.P.; Daridon, J.L. The Limitations of the Cloud Point Measurement Techniques and the Influence of the Oil Composition on Its Detection. Pet. Sci. Technol. 2005, 23, 1113–1128. [Google Scholar] [CrossRef]
- Ijeomah, C.E.; Dandekar, A.Y.; Chukwu, G.A.; Khataniar, S.; Patil, S.L.; Baldwin, A.L. Measurement of Wax Appearance Temperature under Simulated Pipeline (Dynamic) Conditions. Energy Fuels 2008, 22, 2437–2442. [Google Scholar] [CrossRef]
- Huang, Z.; Zheng, S.; Fogler, H.S. Wax Deposition: Experimental Characterisations, Theoretical Modeling, and Field Practices; Taylor & Francis Group: Boca Raton, FL, USA, 2015. [Google Scholar]
- Roenningsen, H.P.; Bjoerndal, B.; Hansen, A.B.; Pedersen, W.B. Wax precipitation from North Sea crude oils: 1. Crystallization and dissolution temperatures, and Newtonian and non-Newtonian flow properties. Energy Fuels 1992, 5, 895–908. [Google Scholar] [CrossRef]
- Dantas, N.A.A.; Gomes, E.A.S.; Barros, N.E.L.; Dantas, T.N.C.; Moura, C.P.A.M. Determination of Wax Apperance Temperature (WAT) in paraffin/solvent systems by photoelectric signal and viscosity. Braz. J. Pet. Gas 2009, 3, 149–157. [Google Scholar]
- Kruka, V.R.; Cadena, E.R.; Long, T.E. Cloud point determination form crude oils. J. Pet. Technol. 1995, 47, 681–687. [Google Scholar] [CrossRef]
- Martos, C.; Coto, B.; Peña, J.L.; Espada, J.J.; Robustillo, M.D. Experimental determination and characterization of wax fractions precipitated as a function of temperature. Energy Fuels 2008, 22, 708–714. [Google Scholar] [CrossRef]
- Coto, B.; Martos, C.; Peña, J.L.; Espada, J.J.; Robustillo, M.D. A new method for the determination of wax precipitation from non-diluted crude oils by fractional precipitation. Fuel 2008, 87, 2090–2094. [Google Scholar] [CrossRef]
- Snyder, R.G.; Maroncelli, M.; Strauss, H.L.; Hallmark, V.M. Temperature and phase behavior of infrared intensities. J. Phys. Chem. 1986, 90, 5623–5630. [Google Scholar] [CrossRef]
- Roehner, R.M.; Hanson, F.V. Determination of wax precipitation temperature and amount of precipitated solid wax versus temperature for crude oils using FT-IR spectroscopy. Energy Fuels 2001, 15, 756–763. [Google Scholar] [CrossRef]
- Alcazar-Vara, L.E.; Buenrostro-Gonzalez, E. Characterization of the wax precipitation in Mexican crude oils. Fuel Process. Technol. 2011, 92, 2366–2374. [Google Scholar] [CrossRef]
- Szuflita, S.; Kuśnierczyk, J.; Wojnicki, M.; Warnecki, M. Laboratory studies for the determination of the increase in the wax formation potential associated with the decrease in the temperature. Nafta Gaz Sci. Technol. Oil Gas Ind. 2018, 10, 25–33. [Google Scholar] [CrossRef]
Figure 1.
Scheme of the conducted research.
Figure 1.
Scheme of the conducted research.
Figure 2.
Set-up for testing the dispersing properties of paraffin inhibitors.
Figure 2.
Set-up for testing the dispersing properties of paraffin inhibitors.
Figure 3.
Scheme of PVT apparatus adjusted for determining the precipitation conditions of the solid paraffin phase.
Figure 3.
Scheme of PVT apparatus adjusted for determining the precipitation conditions of the solid paraffin phase.
Figure 4.
Pressure–temperature chart of paraffin precipitation—determined experimentally for crude oil sample.
Figure 4.
Pressure–temperature chart of paraffin precipitation—determined experimentally for crude oil sample.
Figure 5.
Effect of the inhibitors on the WPC shape.
Figure 5.
Effect of the inhibitors on the WPC shape.
Figure 6.
Effect of the inhibitors on the volume of oil sample needed for deposition of 1 g of the paraffins.
Figure 6.
Effect of the inhibitors on the volume of oil sample needed for deposition of 1 g of the paraffins.
Table 1.
Compositions of the developed paraffin inhibitors.
Table 1.
Compositions of the developed paraffin inhibitors.
| PRODUCT NAME | IP-1-18.01
% (m/m) | IP-1-18.02
% (m/m) | IP-1-18.03
% (m/m) | IP-2-18.01
% (m/m) | IP-2-18.02
% (m/m) |
|---|
| 1. | Polymer 1–polyoxyethylene isodecyl ether | 5.0 | 3.5 | 2.0 | - | - |
| 2. | Polymer 2–polyurethane | - | - | - | 5.0 | 2.0 |
| 3. | Polymer 3–α-olefin copolymer with maleic anhydride | 5.0 | 5.0 | 5.0 | 5.0 | 5.0 |
| 4. | Polymer 4–polyethoxylated tallow amine | 2.5 | 2.5 | 2.5 | 2.5 | 2.5 |
| 5. | A low molecular ionic dispersant | + | + | + | + | + |
| 6. | Solvent 1 | + | + | + | + | + |
| 7. | Solvent 2 | + | + | + | + | + |
Table 2.
Properties of paraffin inhibitors IP-1-18.01, IP-1-18.02, IP-1-18.03, IP-2-18.01, and IP-2-18.02 used in the tests.
Table 2.
Properties of paraffin inhibitors IP-1-18.01, IP-1-18.02, IP-1-18.03, IP-2-18.01, and IP-2-18.02 used in the tests.
| PARAFFIN INHIBITORS |
|---|
| No. | Determined Feature/Test Conditions | IP-1-18.01 | IP-1-18.02 | IP-1-18.03 | IP-2-18.01 | IP-2-18.02 | Unit | Test Method |
|---|
| 1. | Appearance in 20 °C | clear liquid of a yellow colour | clear liquid of an amber colour | − | visually |
| 2. | Density in 20 °C | 0.9231 | 0.9189 | 0.9146 | 0.8938 | 0.8880 | g/cm3 | ASTM D 4052 |
| 3. | Kinematic viscosity at 20 °C | 2.7 | 2.5 | 2.2 | 2.3 | 2.1 | mm2/s | PN-EN ISO 3104 |
| 4. | Flash point | >35 | >35 | >35 | >35 | >35 | °C | PN-EN ISO 2719 |
| 5. | pH of a 1% (m/m) solution in distilled water | 7.8 | 7.7 | 7.5 | 7.9 | 7.8 | - | PN-C-04963 |
| 6. | Pour point | <−39 | <−39 | <−39 | <−39 | <−39 | °C | PN-ISO 3016/ASTM D 97 |
Table 3.
Physicochemical properties of crude oil from a Polish reservoir selected for the tests.
Table 3.
Physicochemical properties of crude oil from a Polish reservoir selected for the tests.
| Physicochemical Properties | Petroleum from a Polish Reservoir | Unit | Test Method |
|---|
| Appearance in a temperature of 20 °C | brown liquid | − | visually |
| Density in a temperature of 20 °C | 0.812 | g/cm3 | ASTM D 4052 |
| Pour point | −38 | °C | PN-ISO 3016/ASTM D 97 |
| Flash point | below −30 | °C | PN-EN ISO 2719 |
| Kinematic viscosity at 20 °C | 8.99 | mm2/s | PN-EN ISO 3104 |
| Water content | 0.25 | % (m/m) | PN-83/C-04523 |
| Temperature at the beginning of distillation | 37.7 | °C | PN-EN ISO 3405 |
| -up to a temp. of 100 °C distillation amounts to | 10.1 | % (v/v) |
| -up to a temp. of 150 °C distillation amounts to | 21.3 |
| -up to a temp. of 200 °C distillation amounts to | 31.3 |
| -up to a temp. of 250 °C distillation amounts to | 40.7 |
| -up to a temp. of 300 °C distillation amounts to | 51.2 |
| -up to a temp. of 350 °C distillation amounts to | 63.4 |
| The percentage of paraffins with a freezing point of + 53 °C | 1.9 | % (m/m) | Polish industry standard
BN-0538-02 |
| The percentage of paraffins with the carbon atoms number above 30 | 6.17 | % (m/m) | PN-EN 12606-1 |
| Asphaltene content | below 0.01 | % (m/m) | Polish industry standard
BN-0538-02 |
| Resin content | 3.0 | % (m/m) |
| Sulfur content | 0.075 | % (m/m) | PN-EN ISO 8754 |
| Chloride content | 16.8 | mg NaCl/l | PN-EN 15484 |
Table 4.
Physicochemical properties of a paraffin-asphaltene deposit from a Polish reservoir selected for the tests.
Table 4.
Physicochemical properties of a paraffin-asphaltene deposit from a Polish reservoir selected for the tests.
| Physicochemical Properties | A Paraffin-Asphaltene Deposit from a Polish Reservoir | Unit | Test Method |
|---|
| Appearance in 20 °C | paste of brown color | − | visually |
| The percentage of paraffins with a freezing point of +53 °C | 34.3 | % (m/m) | Polish industry standard
BN-0538-02
|
| Asphaltene content | 54.7 | % (m/m) |
| Resin content | 11.0 | % (m/m) |
Table 5.
Chemical composition of the steel plates used in the tests.
Table 5.
Chemical composition of the steel plates used in the tests.
| Chemical Composition | % (m/m) |
|---|
| Carbon | 0.35—0.45 |
| Manganese | 0.5—0.8 |
| Silicon | max 0.5 |
| Sulfur | max 0.035 |
| Phosphor | max 0.035 |
| Iron | up to 100 |
Table 6.
Dispersing properties of paraffin inhibitors IP-1-18.01, IP-1-18.02, IP-1-18.03, IP-2-18.01, IP-2-18.02 selected for the tests with a dosage of 1000 mg/kg, at a temperature of 50 °C.
Table 6.
Dispersing properties of paraffin inhibitors IP-1-18.01, IP-1-18.02, IP-1-18.03, IP-2-18.01, IP-2-18.02 selected for the tests with a dosage of 1000 mg/kg, at a temperature of 50 °C.
| Paraffin Inhibitor | Sample No. | Plate Mass Before the Test
m0 (g) | Plate Mass with the Deposit After the Test
m1 (g) | Difference in Masses
∆m (g) | Average Difference in Masses
∆m (g) | Paraffin Dispersion Efficiency, % (m/m) |
|---|
| Sample “zero” without a paraffin inhibitor | 1 | 17.7877 | 17.1634 | 0.6243 | 0.5723 | – |
| 2 | 18.0934 | 17.4320 | 0.6614 |
| 3 | 18.2154 | 17.7841 | 0.4313 |
| IP-1-18.01 | 1 | 18.1590 | 17.8166 | 0.3424 | 0.3961 | 30.8 |
| 2 | 17.9598 | 17.5464 | 0.4134 |
| 3 | 18.2583 | 17.8259 | 0.4324 |
| IP-1-18.02 | 1 | 18.0914 | 17.5577 | 0.5337 | 0.4359 | 23.8 |
| 2 | 18.0507 | 17.6650 | 0.3857 |
| 3 | 17.6250 | 17.2367 | 0.3883 |
| IP-1-18.03 | 1 | 18.0356 | 17.6134 | 0.4222 | 0.4623 | 19.2 |
| 2 | 18.5150 | 18.0050 | 0.5100 |
| 3 | 17.7128 | 17.2580 | 0.4548 |
| IP-2-18.01 | 1 | 17.4782 | 17.1999 | 0.2783 | 0.4074 | 28.8 |
| 2 | 18.2140 | 17.6815 | 0.5325 |
| 3 | 18.0088 | 17.5973 | 0.4115 |
| IP-2-18.02 | 1 | 17.7347 | 17.3337 | 0.4010 | 0.4143 | 27.6 |
| 2 | 17.6508 | 17.2699 | 0.3809 |
| 3 | 17.8238 | 17.3628 | 0.4610 |
Table 7.
Parameters of the pressure and temperature conditions of solid paraffin phase deposition.
Table 7.
Parameters of the pressure and temperature conditions of solid paraffin phase deposition.
| No. | Wax Appearance Temperature | Saturation Pressure | Test Pressure | Comments |
|---|
| Crude Oil without Additives | Inhibitor-1 | Inhibitor-2 | Inhibitor-3 |
|---|
| | °C | °C | °C | °C | bar | bar | |
|---|
| 1 | 29.3 | 24.7 | 27.5 | 26.5 | 1.01 | 20 | Dead oil sample test |
| 2 | 27.7 | 26.7 | 26.0 | 29.5 | 50 | 70 | |
| 3 | 27.5 | 26.3 | 25.2 | 29.2 | 100 | 120 | |
| 4 | 27.6 | 26.5 | 25.5 | 29.1 | 150 | 170 | |
| 5 | 27.8 | 27 | 26.2 | 29.5 | 200 | 220 | |
| 6 | 28.5 | 27.5 | 26.95 | 30.0 | 200 | 250 | Saturation pressure lower than test pressure |
| 7 | 29.2 | 28.0 | 27.7 | 30.6 | 200 | 300 | Saturation pressure lower than test pressure |
| 8 | 30.0 | 28.6 | 28.7 | 31.2 | 200 | 350 | Saturation pressure lower than test pressure |
| 9 | 30.7 | 29.2 | 29.6 | 31.7 | 200 | 400 | Saturation pressure lower than test pressure |
Table 8.
Results of testing wax formation tendency as the temperature decreases.
Table 8.
Results of testing wax formation tendency as the temperature decreases.
| Petroleum | Temperature | Percentage | Deposit Mass | Volume of the Sample Pumped per 1 g of the Deposit |
|---|
| (–) | (°C) | (%) | (g) | (cm3) |
|---|
| Crude oil without additives | 5 | 6.85% | 4.80 | 14.60 |
| 10 | 4.86% | 3.40 | 20.60 |
| 15 | 3.22% | 2.25 | 31.10 |
| 20 | 1.61% | 1.13 | 62.00 |
| 25 | 0.28% | 0.20 | 134.80 |
Crude oil
+
Inhibitor 1 | 5 | 5.77% | 4.04 | 17.30 |
| 10 | 4.25% | 2.98 | 23.60 |
| 15 | 2.96% | 2.07 | 33.80 |
| 20 | 1.56% | 1.09 | 64.10 |
| 25 | 0.32% | 0.22 | 314.00 |
Crude oil
+
Inhibitor 2 | 5 | 6.05% | 4.24 | 16.50 |
| 10 | 4.48% | 3.14 | 22.30 |
| 15 | 2.91% | 2.04 | 34.30 |
| 20 | 1.27% | 0.89 | 78.90 |
| 25 | 0.25% | 0.18 | 399.80 |
Crude oil
+
Inhibitor 3 | 5 | 5.29% | 3.70 | 18.90 |
| 10 | 2.12% | 1.48 | 47.20 |
| 15 | 1.68% | 1.18 | 59.60 |
| 20 | 1.23% | 0.86 | 81.30 |
| 25 | 0.77% | 0.54 | 125.00 |
© 2020 by the authors. Licensee MDPI, Basel, Switzerland. This article is an open access article distributed under the terms and conditions of the Creative Commons Attribution (CC BY) license (http://creativecommons.org/licenses/by/4.0/).


