Article

Are Short Food Supply Chains More Environmentally Sustainable than Long Chains? A Life Cycle Assessment (LCA) of the Eco-Efficiency of Food Chains in Selected EU Countries

1
Institute of Economics and Finance, Warsaw University of Life Sciences—SGGW, 02-787 Warsaw, Poland
2
Faculty of Building Services, Hydro and Environmental Engineering, Warsaw University of Technology, 00-653 Warsaw, Poland
3
CESAER, AgroSup Dijon, INRA, University Bourgogne Franche-Comté, F-21000 Dijon, France
4
Newcastle University Business School, Newcastle University, Newcastle upon Tyne NE1 4SE, UK
5
Department of Agricultural Economics and Rural Development, Corvinus University of Budapest, 1093 Budapest, Hungary
6
Department of Economics and Management, Università degli Studi di Parma, 43125 Parma, Italy
7
SIFO Consumption Research Norway, Oslo Metropolitan University, 0130 Oslo, Norway
*
Author to whom correspondence should be addressed.
Submission received: 17 August 2020 / Revised: 7 September 2020 / Accepted: 11 September 2020 / Published: 16 September 2020
(This article belongs to the Special Issue Circular Economy in Low-Carbon Transition)

Abstract

:
Improving the eco-efficiency of food systems is one of the major global challenges faced by the modern world. Short food supply chains (SFSCs) are commonly regarded to be less harmful to the environment, among various reasons, due to their organizational distribution and thus the shortened physical distance between primary producers and final consumers. In this paper, we empirically test this hypothesis, by assessing and comparing the environmental impacts of short and long food supply chains. Based on the Life Cycle Assessment (LCA) approach, we calculate eco-efficiency indicators for nine types of food distribution chains. The analysis is performed on a sample of 428 short and long food supply chains from six European countries. Our results indicate that, on average, long food supply chains may generate less negative environmental impacts than short chains (in terms of fossil fuel energy consumption, pollution, and GHG emissions) per kg of a given product. The values of eco-efficiency indicators display a large variability across analyzed chains, and especially across different types of SFSCs. The analysis shows that the environmental impacts of the food distribution process are not only determined by the geographical distance between producer and consumer, but depend on numerous factors, including the supply chain infrastructure.

1. Introduction

The environmental impacts of food distribution systems are primarily related to the transportation of goods. Improving the eco-efficiency in transport, currently estimated at around 15% of global greenhouse gas (GHG) emissions [1], represents one of the major challenges of the modern World [2,3,4], becoming one of the goals of the EU climate and energy policy [5].
The shortening of supply chains, which is usually associated with shortening the distance over which agri-food products “travel”, is often treated as a strategy to reduce energy consumption in transport and improve environmental performance of distribution processes in general. This is quite commonly considered a factor in reducing transportation-related negative externalities [6,7,8], but this stereotypical view is being more and more frequently questioned [9,10,11,12].
In this context, the promotion of short food supply chains (SFSCs) to support environmental sustainability is an increasingly debated topic [7,8,13,14,15]. The European Rural Development Regulation (1305/2013) defines a short supply chain as one that “has a limited number of economic operators, committed to co-operation, local economic development, and close geographical and social relations between producers, processors and consumers” [16]. The specific feature of SFSCs, referring to this definition, is the existence of a limited number (usually maximum one) of intermediaries between the farmer (primary producer) and the final consumer. The concept of short food supply chains has been particularly promoted in the EU in recent years, constituting an important element of the Rural Development Policy [16]. This is because of envisioned advantages of short food distribution models, which include, among others, economic value added for food producers and social benefits, such as the identification of a food’s place of origin and direct contact with the producer, which are valued highly by many consumers [17]. It is also believed that short food supply chains generate environmental benefits by shortening the distance travelled by food (agricultural products). This is, however, an assumption that requires challenging and which will be empirically discussed in this paper.
Some researchers note that due to the small share of transport in total GHG emissions generated in food production, distribution and consumption, the issue of food supply chain length is of little importance for environmental sustainability [11,18,19]. However, the 9.7% share of logistics processes in the estimated total energy consumption of production and distribution [20] cannot be considered unimportant and, thus, the environmental impacts of distribution models, including transport, must not be neglected [20,21,22,23,24].
Food supply chain management is a complex process, largely because of specific requirements related to functional characteristics of food and fresh food in particular [25,26,27]. It requires, among others, maintaining the continuity of supply that is the basis of food security [28,29,30,31], which induces systematic and continuous transport activities. The logistics infrastructure (the assets of the wholesalers and retailers, including cooling equipment) plays an important role in the food distribution process, which is necessary to ensure proper conditions for food storage and delivery to the final consumer.
To date, most of the environmental impact assessments of supply chains presented in the literature are qualitative and limited to Food Miles calculation and/or the transportation-related emissions of greenhouse gases, expressed in CO2 equivalent. However, there is a lack of comprehensive analysis of environmental impacts of food supply chains of different organizational structures and lengths, which would cover a whole complexity of distribution chains, while taking into account the life cycle of all assets employed.
In our paper, we attempt to fill in this existing gap. The main goal of the article is to empirically assess the environmental impacts of short and long food supply chains through the estimation of selected eco-efficiency indicators. Referring to the views commonly presented in the literature on the environmental benefits of short food supply chains (SFSCs) we attempt to verify the main hypothesis stating that short food supply chains are less harmful to the environment than conventional, long supply chains.
The methodology applied in our study is based on the Life Cycle Assessment (LCA) approach and the eco-efficiency concept.
The paper is structured as follows: the introductory section defines the research problem and presents the objective of the study. Section 2 provides a discussion of the main literature on short and long food supply chains and associated environmental impacts and introduces the conceptual framework. This is followed by Section 3, which explains the research methodology. Section 4 provides a discussion of the main research findings and Section 5 summarizes the key conclusions from the study.

2. Literature Review

2.1. Short vs. Long Food Supply Chains and Their Environmental Impact

Historically, there were two basic food supply models for food market-direct deliveries to consumers and sales on farmer’s markets. Their importance was systematically diminished mainly due to the growth of the food processing sector. As a result, as well as due to processes of industrialization, urbanization, and the development of long-distance transportation [32], the supply chains were extended to include intermediaries and expand transportation functions. In the course of these changes, the market became dominated by logistically complex mass distribution systems; although, compared to many highly globalized supply chains, the food market is less concentrated. Nowadays, a renaissance of traditional forms of food sales can be observed, but other, innovative types of short supply chains are also emerging [12,33].
The distinguishing feature of short supply chains is a specific type of relation between key actors of the food chain—primary producers (basically farmers)—and consumers [34,35] that includes “face to face” contact (purchases directly from producers), “spatial proximity” (production and distribution locally) and “spatial extension” (consumers have information about the place and production process).
Referring to this type of relation, an approach to defining short supply chains was proposed by Malak-Rawlikowska et al. [12] based on the three “proximity” dimensions:
  • “geographical proximity”, which expresses the physical distance of transportation, measured with Food Miles, travelled by the product from the location of production to the living place of the final consumer;
  • “social proximity”, which refers to the close ‘relationship’ between the producer and consumer of the food, resulting in the direct transfer of information and mutual trust;
  • “organizational proximity”, which is related to the number of intermediaries in the food supply chain.
It is believed that shortening the distance that food products travel before reaching the consumer, which is one of the fundamental characteristics in the concept of short food supply chains [7,8,13,14,15,36], should reduce the negative environmental externalities related to transport (energy consumption, GHGs and other emissions) [11,15,18,19,37]. However, Kneafsey et al. [15] (p. 32) underline that several publications characterized SFSCs as “beneficial for the environment”, however without providing “any further qualitative or quantitative evidence to substantiate claims made”. Moreover, Galli et al. [10] (p. 9) emphasize that “SFSCs are not by definition more environmentally friendly than conventional, longer supply chains”. However, it is proven that SFSCs can bring economic benefits to farmers and the local economy, as well as to increase consumer confidence in the products they buy and their producers [6,8,10,14,15,19,38].
Economic and social benefits (close co-operation, geographical and social relations between producers, processors and consumers) that may be attributed to short food supply chains appear to be indisputable. There is growing evidence that short distribution chains indeed provide added value for producers [8,10,12,15,19,38,39] and generate social benefits [15,17,40,41,42].
Commonly shared opinions on the environmental benefits of using short food supply chains are based on mainly qualitative assessments, shaped by the simple association of geographical proximity and short transportation distances with low energy expenditure and relatively less harmful environmental impacts. This opinion, however, is hardly defendable in light of the most recent studies.
Gonçalves and Zeroual [43] and Mancini et al. [44] emphasize that the need for frequent, multiple deliveries of small quantities of products may have negative impacts on environmental sustainability; however, according to Bloemhof and Soysal [45], there are negative impacts, but they are “not so important”. The results of quantitative assessments of sustainability of short food supply chains from the study conducted within the Strength2Food (The European Union’s Horizon 2020 research and innovation project “Strengthening European Food Chain Sustainability by Quality and Procurement Policy” (grant agreement no. 678024)) project, although limited to transportation activities, prove that doubts concerning environmental benefits of SFSCs are fully justifiable [12].
The burden on the environment with the negative consequences of food distribution processes is determined not only by the geographical distance between the farmer (producer) and the consumer. There are several factors to be taken into account, such as the infrastructure along the supply chain, the type (capacity) of vehicles used, as well as the conditions in which food is transported [21,46], stored (e.g., refrigerators, freezers, etc.) and displayed in retail outlets.
The need for economical management of natural resources and the minimization of negative externalities in line with the Sustainable Development paradigm is of particular importance in the context of accelerating climate change. This increases the pressure to search for solutions that reduce energy consumption and GHG emissions not only in the sphere of food production, but also in general in distribution processes [21,47,48,49,50,51].

2.2. Eco-Efficiency Concept and Life Cycle Assessment to Measure Environmental Impacts

The concept of eco-efficiency, which appeared in the literature in the early 1990s, was disseminated widely by the World Business Council for Sustainable Development (WBCSD) as an approach to strengthen the competitiveness and environmental responsibility of enterprises [52,53,54]. Nowadays, the concept of eco-efficiency is perceived as a quantitative tool for the simultaneous assessment of economic and environmental aspects of economic systems [55], being considered one of the most important instruments used in sustainability assessments [56,57,58]. The practical implementation of the eco-efficiency approach leads to the delivery of “competitively priced goods and services that satisfy human needs and bring quality of life while progressively reducing environmental impacts of goods and resource intensity throughout the entire life cycle to a level at least in line with the Earth’s estimated carrying capacity” [59]. Maxime et al. [60] consider the eco-efficiency approach an effective way to evaluate Sustainable Development parameters aimed at reducing the consumption of natural resources and mitigation of negative environmental impacts of manufacturing processes.
Eco-efficiency can be defined as the relation of an effect, most often expressed as the value of products at the firm, sector or even the entire economy level, and inputs constituting a measure of environmental pressure generated by this firm, sector or the economy [61]. Gómez-Limón et al. [53] emphasize that eco-efficiency reflects the possibility of achieving specific economic results with the minimal use of natural resources, causing the least possible damage to the environment.
In the most general approach, the measurement of eco-efficiency is based on partial or composite indicators reflecting the relationship between specific environmental categories, which express the impacts of the production system on selected elements of the natural environment, and economic effects that reflect the production and economic performance of this system. In our study, for the eco-efficiency measurement, several eco-efficiency indicators were used, as derived from the general equation [62]:
ECO EFFICIENCY = ENVIRONMENTAL   COS TS   INPUTS ECONOMIC   EFFECTS   BENEFITS
The Life Cycle Assessment methodology offers the most comprehensive, but also the most complex, approach to the environmental impact analysis, thus providing the possibility of estimating a variety of specific eco-efficiency indicators [63].
The origin of the use of LCA for eco-efficiency measurements is related to the methodology proposed in 1996 by BASF [64]. The originally proposed methodology was aimed at supporting business projects by enabling the assessment of various production solutions while taking into account their long-term environmental impacts and their economic significance.
Concepts of eco-efficiency measurement and Life Cycle Assessment have been primarily applied in analyses related to industrial products and processes, also covering transportation. In recent years, there have been a growing number of applications related to the agri-food sector that focus on farm-level assessments of production systems [55,65,66,67,68].
LCA-based eco-efficiency assessments of entire food supply chains are limited so far and are related mainly to single products. Usually, these analyses do not focus on the distribution chains themselves, but on the entire life cycle of agricultural and food products, covering agricultural production and the processing phase [11,18,19,69,70].
To the best of our knowledge, however, the concept of the LCA methodology to assess eco-efficiency of various types of food distribution chains, defined according to the proximity dimensions, has not yet been applied.
In presenting the results of our study, we intend to suggest a methodological approach that may be best suited to this type of analysis.
A comprehensive assessment of the environmental impacts of various supply chains requires considering all effects generated throughout the product or system’s life cycle [71], including energy consumption as well as the use of capital assets involved. Due to its holistic nature, Life Cycle Assessment is a universal approach to quantitative environmental analyses. Despite some criticism and limitations [72,73], the LCA methodology is a commonly applied and recognized method for environmental assessments brought into elementary level, referring to a single material and product. The environmental performance of a product is generally shown in an Environmental Product Declaration (EPD) where environmental indicators are defined and standardized according to a set of standards on LCA (ISO 14040, ISO 14044, ISO 14025 and EN15804) or in the Environmental Certificate provided by the manufacturer. In recent years, the EPD database has grown substantially and it now covers a wide range of categories, including services, materials, vehicles, packages, food, machinery, chemical products and many other. More information on the environmental impacts of various products or materials can also be found in the literature. Regarding transportation, the share of transport in global greenhouse gases (GHG) in typical modes of transport [74,75,76,77] as well as electric vehicles [76,78,79] was analyzed in a search for ways of reducing emissions and global energy consumption [1]. Despite a considerable amount of literature studies concerning the environmental impact of different transportation modes [76,80,81,82], most of the studies are focused only on the level of greenhouse gas emissions expressed in the Global Warming Potential (GWP) index.
Regarding the construction industry, LCA is used mainly to assess the environmental performance of buildings through their life stages, including emissions from building materials, the construction process, the use of energy and demolition [83,84,85,86]. Therefore, it is often applied to building certification systems and building benchmarking [87,88,89,90] or used as a tool in decision processes towards sustainable building or neighborhood design [91,92,93]. Many studies show that, in conventional buildings, the majority of the energy and GHG emissions, accounting for 80–90% of the total carbon footprint, are related to the operational stage [94,95].
There are examples of using the LCA approach in the evaluation of supply chain configurations [96,97]. The LCA methodology is also applied to agricultural production and food products. Taking this perspective may lead to conclusions about a relatively small share of transport and distribution in the total loads generated in the life cycle of agri-food products, resulting possibly in recommendations to search for ways to reduce emissions other than via distribution links in the food supply and consumption system [11,18,19]. Similarly, in other industries, the inclusion of all life cycle phases in the LCA assessment makes the production phase the dominant factor. On the other hand, narrowing the scope of the analysis to the distribution segment may suggest that the distance over which products are transported plays a more important role [77]. The case is not clear-cut, however, as it can also be pointed out that in some cases the transportation link is responsible for even 50–70% of the total carbon footprint, e.g., when fresh vegetables or fruits are transported by energy-intensive means of transport over considerable distances [18]. The assessment of the environmental impacts generated beyond farm gate should not, however, be limited only to food transportation related to emissions from fuel combustion. It should include the whole complexity of food distribution chains such as the necessary infrastructure of all kinds of stores, the energy needed for keeping stores running, cooling energy for food preservation and emissions from the production of transportation vehicles. The LCA is well suited to make such complex assessments.

3. Materials and Methods

3.1. Primary Data Collection

The eco-efficiency LCA assessment was performed on a sample of 191 food producers (169 farmers and 22 fishmongers) participating in short and long food supply chains in six European countries: France, Hungary, Italy, Norway, Poland and the United Kingdom (Table 1). Fishmongers were integrated in the United Kingdom and Norway samples due to the importance of the fish industry in the agri-food sector in these countries. It should be emphasized here that fishmongers’ activities are not agricultural or land based (as in the case of fish farms), but have been investigated as types of market channels used by farmers. In order to simplify the analysis in the paper, we will be referring to ‘farms’ from now on.
The total number of chains detected in the sample noticeably exceeds the number of farms, because individual farmers use several distribution paths to sell the same product [12] (see Section 3.2). Sales to processors are not covered by the present study, because the analysis of the distribution channels downstream of food processing is beyond the scope of our research.
The selection of farms included in the sample meets the following two criteria: (1) farms participating in at least one type of SFSC; (2) farms operating in one of the product categories defined in Table 2. According to these criteria, selected farms were interviewed in relation to the food products belonging to the specified product categories, so that the analysis of the farms’ distribution channels related only to these products.
The sample is not representative of the whole population of food distribution chains and farms across countries. A representative sample would require random sampling, which is not feasible, since databases with information on the structure of distribution channels is not available. Nevertheless, this large sample allows for a detailed comparison of short and long food supply chains and for drawing conclusions on the regularities observed in food distribution.
Data were collected through surveys conducted between November 2017 and November 2018 with the use of a dedicated questionnaire. All the questions were tested in pilot surveys conducted in Poland and in France. The questionnaire covered the following areas: farm description (labor, production structure, means of transportation, turnover); sales (quantities sold to different distribution chains, prices, locations and distances to final destinations); specific distribution related data (amounts transported in single deliveries, labor inputs, costs of packaging, other distribution costs); self-assessment of bargaining power and chain evaluation by producers.

3.2. Typology of Food Supply Chains

There are several types of food supply chains that may be distinguished in relation to different parameters such as the product’s destination, the number and roles of intermediaries involved, and the type of product [15,34,35,98,99,100]. In accordance with the study by Malak-Rawlikowska et al. [12], nine ‘short’ and ‘long’ distribution chains were selected for our study (Table 3). All chains with none or a single intermediary between consumer and producer were categorized as ‘short’, whereas supply chains with more than one intermediary were considered ‘long’.
Our assessments were limited to the main stages of the distribution chain, which we broadly define as a system of moving products from the farm (producer) gate to the end consumer. Production (farming) systems were not a subject for the analyses, assuming the same technologies of production were used, irrespective of the future decisions on the choice of distribution channel.
In the eco-efficiency assessments, two types of transportation activities within the distribution chain were taken into account, namely:
  • transporting products from the primary producer (farm gate) to a retail outlet (P2R)—performed by producer or intermediary (e.g., agent, wholesaler, producers’ group, logistic center of the hypermarket chain),
  • transporting food by consumer from retail outlet to consumers’ place of living (R2C).
The participation of specific actors in the distribution process is illustrated in a graphic form in Table 3.
Transportation activities in short channels (a–f) are split between suppliers and consumers in different proportions:
  • In f. Direct deliveries to retail (the only short food supply chain containing an intermediary (‘Retail Shop’) between producer and food consumer), primary producers and different intermediaries deliver goods to retail outlets, from where the food is transported by consumers;
  • Transportation in chains a. Pick-your-own and b. On-farm sales to consumers is done entirely by consumers.
  • In channels c. Internet sales—courier deliveries and d. Direct deliveries to consumer producers deliver products to consumers, by themselves (d) or by out-sourcing transportation to courier companies (c). Couriers are not treated as intermediaries, but as providers of transportation services only.
  • In chains e. Sales on farmers’ markets and f. Direct deliveries to retail producers transport products to retailing places (Farmers’ Market or Retail Shop), from where the food is transported by consumers.
Each of the long chains contains at least two intermediaries:
  • h. Sales on wholesale market: an agent purchasing products for re-sale, possibly also a wholesaler, for sale by a retailer;
  • g. On-farm sales to intermediaries: wholesaler and retailer;
  • i. Sales to hypermarket chains: logistic center, possibly a producers’ group, hypermarket.
All of the above types of chains were represented in the sample. An individual producer in the sample used two and four chains on average, within the range from two (minimum) to five (maximum), both short and long. About 84% of producers used at least one short chain, and 51% participated in at least in one long chain (Table 4).
Although SFSCs represented a large majority of the sample, accounting for 70% of the total 428 chains used by farmers (Table 4), only 36.6% of the total quantity sold was delivered through short chains. This is because SFSCs typically suffer from diseconomies of scale (especially considering small to medium scale producers), and cannot absorb large quantities of produce due to limited consumer demand, as well as limited farm labor resources to dedicated to distribution and retail. These restrictions lead farmers to diversify their distribution chains.

3.3. Environmental Assessment of Food Chains

The environmental impacts of food distribution chains were evaluated using the Life Cycle Assessment methodology with respect to a set of standards concerning LCA approach. The four LCA phases—goal and scope definitions, life cycle inventory, life cycle impact assessment and interpretation of the outcomes—were defined and performed according to ISO 14040 [101] and ISO 14044 [102]. Life Cycle Assessment was performed using the OneClick LCA calculation tool [103] which is an engineering software used for life cycle studies. It complies with the international standards, requirements and building certification schemes such as LEED and BREEAM.

3.3.1. Goal and Scope Definition of Environmental Assessment

  • Aim of the LCA Analysis
Short and long chains of food distribution involve various assets (buildings, equipment, means of transportation). The assessment of their influence on the environment is based on six most commonly used and recognized environmental impact categories: Global Warming Potential (GWP), Acidification Potential (AP), Eutrophication Potential (EP), Ozone Depletion Potential (ODP), Photochemical Ozone Creation Potential (POCP) and Non-Hazardous Waste Disposed. If related to the production volumes, they form a set of eco-efficiency indicators. All above mentioned environmental indicators were normalized per 1 kg of produce sold in each of the analyzed distribution chains. This is the functional unit, that is, the reference by which the input and output flows of material and energy along the distribution chain are retrieved.
The goal and the scope of the analysis are summarized in Table 5.
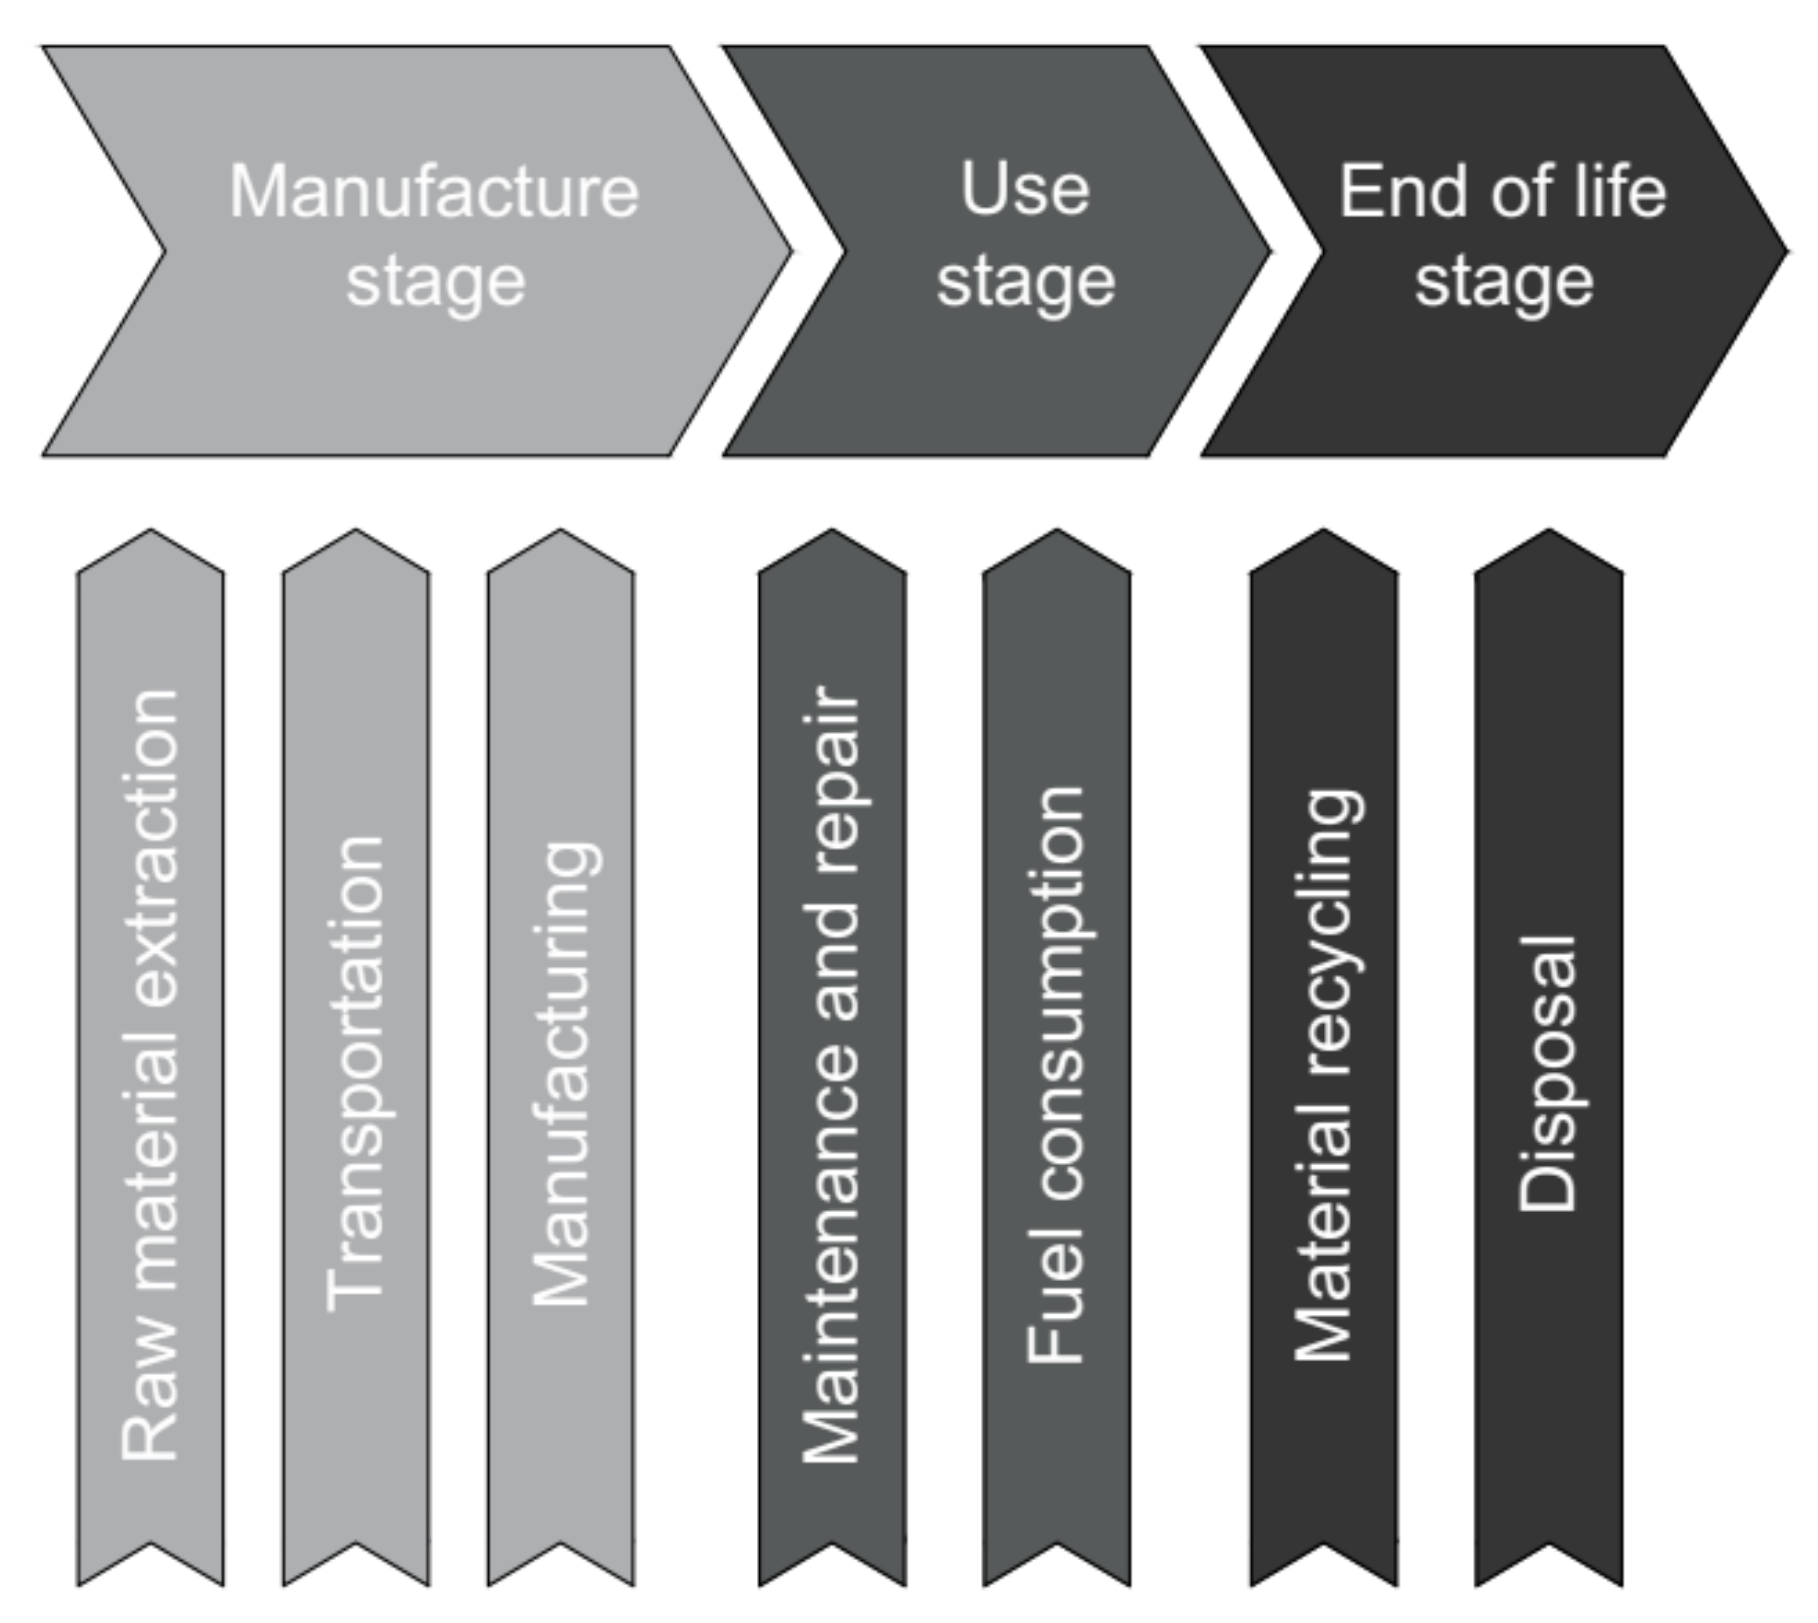
  • LCA System Boundaries
The system boundary for the food supply chain is defined in our study as being from the farm gate to the consumer. Depending on the organizational and geographical proximity of chains, as well as on chain infrastructure and types/means of transportation used, the emission level can substantially differ. Therefore, the assessment includes the emission level from buildings and transport vehicles using a ‘cradle-to-grave’ approach, i.e., from the extraction of raw materials, material processing and manufacture, through to the use phase and, finally, to the end of the life phase, which includes disposal and material recycling.
Figure 1 identifies the phases embedded in the system boundary of buildings according to the European standard EN 15978 [104]. Stages B2-B3, related to maintenance and repair services, were excluded from the analysis due to lack of sufficient data; however, they represent a negligible environmental effect compared to the remaining life cycle stages.
Regarding transportation vehicles, LCA system boundaries were defined according to the Environmental Product Declaration (EPD), developed in line with Product Category Rules (PCR) and the principles described in ISO 14025 [105]. The life cycle of vehicles can be divided into 3 main life stages: manufacturing, use phase and end of life. The system boundary applied to transportation vehicles is shown in Figure 2.

3.3.2. Life Cycle Inventory

  • Buildings
Different types of buildings with appropriate infrastructures were assigned to food distribution chains: small store, medium store, large store, wholesale market and farmers’ market instalments. The types of trading outlets are consistent with those used in national statistics [106]. For the purpose of this study, the average size (commercial area), average sales volume, and main construction characteristics for each type of trading outlet were defined as shown in Table 6.
Considering the high variability in the size and equipment used in different types of retail stores, simplifications in making relevant assumptions were unavoidable. It should be emphasized, however, that these simplifications should not affect the calculation of eco-efficiency indicators since volume of sales per unit of sales area, which is an essential parameter in the assessments, does not differ significantly within the typology of trading outlets.
Two types of buildings were excluded from the analysis: logistics centers of hypermarket chains and transfer facilities of courier companies involved in the Internet sales chain. It was decided that in both cases, the fresh foods under consideration constitute an extremely low share of the turnover and the length of their stay in storage is minimal. Hence, their participation in generating environmental impacts in the LCA analysis may be considered negligible.
Several assumptions were made regarding the construction of buildings and infrastructure. More specifically, it was assumed that:
  • a small store is a typical building with a concrete structure, with walls made of concrete blocks insulated with extruded polystyrene and few windows;
  • small and large stores are defined as single-story halls characterized by a steel lightweight frame, with walls made of sandwich panels with a mineral wool core and double steel siding, a metal roof insulated with mineral wool and an industrial floor;
  • wholesale markets are represented by two types of trading buildings: a steel frame hall with non-insulated walls and a paved area with a steel roof;
  • farmers’ markets consist usually of an outdoor site where famers sell their products either directly from their cars or tables and stands hosted in a paved area with concrete paving and paved area with steel roofing.
For each type of store, a separate life cycle inventory (LCI) was created, involving building materials and energy for building construction, energy consumption in the use phase and the amount of refrigerant, including its average annual leakage. For every store type, the same reference building lifespan of 40 years was adopted. The assumptions related to buildings and infrastructure applied to the LCA study are summarized in Table 7.
  • Material Production Phase (A1–A3)
Material types and quantities were estimated according to the technical building documentation of real trading outlets. All building flows of materials and energy were included in LCI and attributed to the building element category: external walls (envelope, structure and finishes), external windows and roof lights, foundations, structural frame, roof (including coverings), floors, walls and partitions, internal doors, internal floor finishes, internal ceiling finishes, internal wall finishes. Additionally, the LCI covered equipment such as a cold store within outlets, a dry cooler and industrial shelves. The specific type of material or product was selected from a database provided by the LCA software. Average European data were chosen. In the event that no average data were available, a local manufacturer was selected for filling in the missing information. The estimation of the energy consumption impact refers to the European energy mix.
  • Construction Phase (A4–A5)
The level of emissions generated by machines, vehicles and by heating/cooling systems during the construction stage was calculated in accordance with the general scenario provided by the LCA software. European transport distances from the manufacturer to construction site, typical for a specific type of material, were applied with one of the following types of transportation:
  • An 8-m3 concrete mixer truck, 100% fill rate: used for the transportation of a concrete mixer.
  • A 40-ton capacity truck, 100% fill rate: used for the transportation of large-scale materials, such as steel, windows, concrete elements, insulation, etc.
  • A 19-ton dumper truck, 100% fill rate: used to transport loose materials, such as sand, soil substrates, gravel.
  • Use Phase (B1, B4–B7)
During a building’s life cycle, considerable quantities of energy are used for heating, cooling, lighting and powering equipment. It was assumed that all types of outlets were using R404A for food refrigeration storage and air conditioning. Emissions related to refrigerant leakage were estimated using the literature data [107,108] and the yearly loss rates for the cooling systems were assumed as follows: 10% for small shops, 15% for medium shops and 20% for large stores. Since the amount of refrigerant depends on the cooling capacity and cooling volume, the average consumption of refrigerant was assumed to be equal to 0.3 kg/m2 for small shops, 0.2 kg/m2 for medium shops and 0.1 kg/m2 for large stores.
Materials and building components are characterized by a building’s service lifetime, therefore, some of them will be replaced during the assumed building life cycle. Material service lifetime was defined according to the Environmental Product Declaration (EPD), if available. Otherwise, default values of the material replacement periods were applied in the analysis according to the average data provided in the LCA tool.
The quantity of energy required depends on the building type and equipment elements (i.e., cooling counters in the case of stores, or refrigerated storage rooms in storage units). Therefore, for the purpose of this analysis, the data on heat and electricity consumption were obtained through interviews at a sample of retail outlets. The energy use indicators related to the building area for each type of outlet are listed in Table 8. The data represent the total consumption of energy for heating, cooling, lighting, auxiliary energy and equipment.
The energy consumption in medium and large stores has been taken as the average of the measured heat and electricity consumption in 203 outlets. The data for the small store were obtained based on a survey conducted in three stores. The energy consumption of wholesale markets and farmers’ markets (mainly electricity for lighting) was taken from measured data from one similar outlet. Although energy demand data were obtained based on values from specific facilities, they represent European average values, and are consistent with the literature values [109,110]. Gas boilers and electricity grids were assumed as the energy sources for all considered buildings.
  • Transport Vehicles
Transportation is the second major activity in the food distribution chain and is therefore a key factor of environmental pressure. The LCA of transportation concerns, in particular, the manufacture and the use of vehicles to deliver and to carry food along the distribution chain.
As regards the manufacture phase, vehicles were divided into 4 types: truck (Heavy Goods Vehicle), delivery van (Light Goods Vehicle), passenger car and city bus. Table 9 summarizes the main assumptions for the calculation of the environmental impacts generated by the transportation phase.
The load capacities of vehicles were calculated as the average of a mix of means of transportation used by producers, based on data from farm surveys. Other parameters related to the flows of material and energy were assumed in relation to the characteristics of different types of vehicles.
With regard to passenger cars, environmental factors for the manufacturing and end of life phases were extrapolated from the environmental certificate provided by a reference car manufacturer [111]. Non-hazardous waste disposed was calculated separately, based on material quantities, using LCA software. Emissions from delivery vans were estimated according to the emission level of a passenger car, taking into account the actual mass of the vehicle and the maximum mileage.
The environmental impacts of the manufacture phase for a city bus were assessed through the EPD documents concerning the same type of vehicle [112]. Emissions from the end of life phase were estimated using the environmental database provided by the LCA software. To estimate environmental indicators for heavy-duty vehicles, emission data for City Bus were recalculated to include the actual mass of the vehicle and the assumed average mileage in its lifetime.
Coefficients to calculate environmental indicators for all the transportation vehicles were finally converted to kilograms of emissions per travelled km. The applied environmental factors for analyzed transportation vehicles are shown in Table A1 in Appendix A.
  • Transportation—Use Phase Data
Transportation related eco-efficiency indicators were calculated considering P2R (farmers, intermediaries, couriers or retailers) and R2C (consumers using personal cars or public communication, which is represented in our analysis by city bus).
Concerning the vehicle use, the key data and information on P2R transportation was collected through the farm survey (means of transportation, use of fuel, locations and distances, average amount of goods transported).
Additional information on the typical organization of deliveries was used to calculate the Net Transportation Distance (NTD) attributed to specific distribution chains considered in the analysis. The NTD was calculated as the difference between a physical distance and the deductions made due to:
  • the partial use of load capacity if other goods were transported;
  • the proportion of the physical distance covered if other channels were served in one trip;
  • the frequency of transporting goods (if any) on the return journey after delivering food products to the respective channel destination.
Specific transportation related parameters for the chain “Sales to hypermarket chains” were drawn from the study by Matulka [113].
Based on individual interviews from pilot studies conducted within the Strength2Food project and experts’ knowledge, some additional assumptions were made regarding the transportation of products from wholesale markets to retail outlets.
Parameters for R2C transportation regarding the chains a. Pick-your-own and b. On-farm sales to consumers were estimated using primary information from producers. For the other types of distribution chains, information from interviews with consumers shopping on farmers’ markets and experts’ assumptions were used. The key data for LCA analyses relate the average weight of the consumers’ basket in each type of the retail outlet and distances travelled with the use of a personal car or public transportation. For R2C transports, the Net Transportation Distance for consumers’ travels was also assessed, in which physical distances from the retail outlets to consumers’ place of living were accordingly adjusted (travels to buy food when travelling on other occasions than shopping (passing by)).

4. Results

4.1. Transportation Efforts Across Supply Chains

The basic transportation-related data are summarized in Table 10. The Net Food Miles indicator, expressed as the Net Transportation Distance in kilometers to transport 1 kilogram of purchased food, is considered one of the key factors influencing the environmental performance of chains.
The results presented in Table 10 show that the average value of the Food Miles indicator for ‘short’ food supply chains (1.25 km/kg) is more than two times greater compared to ‘long’ chains (0.53), mainly due to the much smaller quantities transported in single deliveries. In long chains, the distances over which food is transported are much longer, but because of the large quantities transported, the indicator is significantly lower.
The vast majority of Food Miles are driven by consumers (68.7% in the sample on average). The highest Food Miles value characterizes chains with the full participation of consumers in transportation and small quantities transported (a. Pick-your-own, b. On farm-sales). The third largest, because of the small quantities transported, is the Food Miles indicator for d. Direct deliveries to consumer, followed by e. Sales on farmer’s markets, mainly due to the location of markets at relatively long distances for both P2R and C2R travels.
Within long food supply chains, the proportional share of consumers involved in transportation differ greatly in h. Sales on wholesale market compared to other chains (g. On-farm sales to intermediaries, i. Sales to hypermarket chains), largely due to the use of mainly small vehicles for P2R transportation, both from the farm gate to a wholesale market and from wholesale to retail outlets. In the chains g. On farm sales to intermediaries and i. Sales to hypermarket chains, P2R transportation, mainly through the use of Heavy Goods vehicles, is much more effective; thus, consumers have a dominating share in Food Miles.
The use of fuel per kilogram of transported goods corresponds strongly with distances travelled, although depends also to a large extent on the type of car used, as well as on the quantities transported. The lowest fuel consumption was estimated for c. Internet sales (short chain) and within the category of long chains—g. On-farm sales to intermediaries and i. Sales to hypermarket chains. In all these channels, this is because of the large quantities transported in a single delivery, despite the relatively long distances travelled.

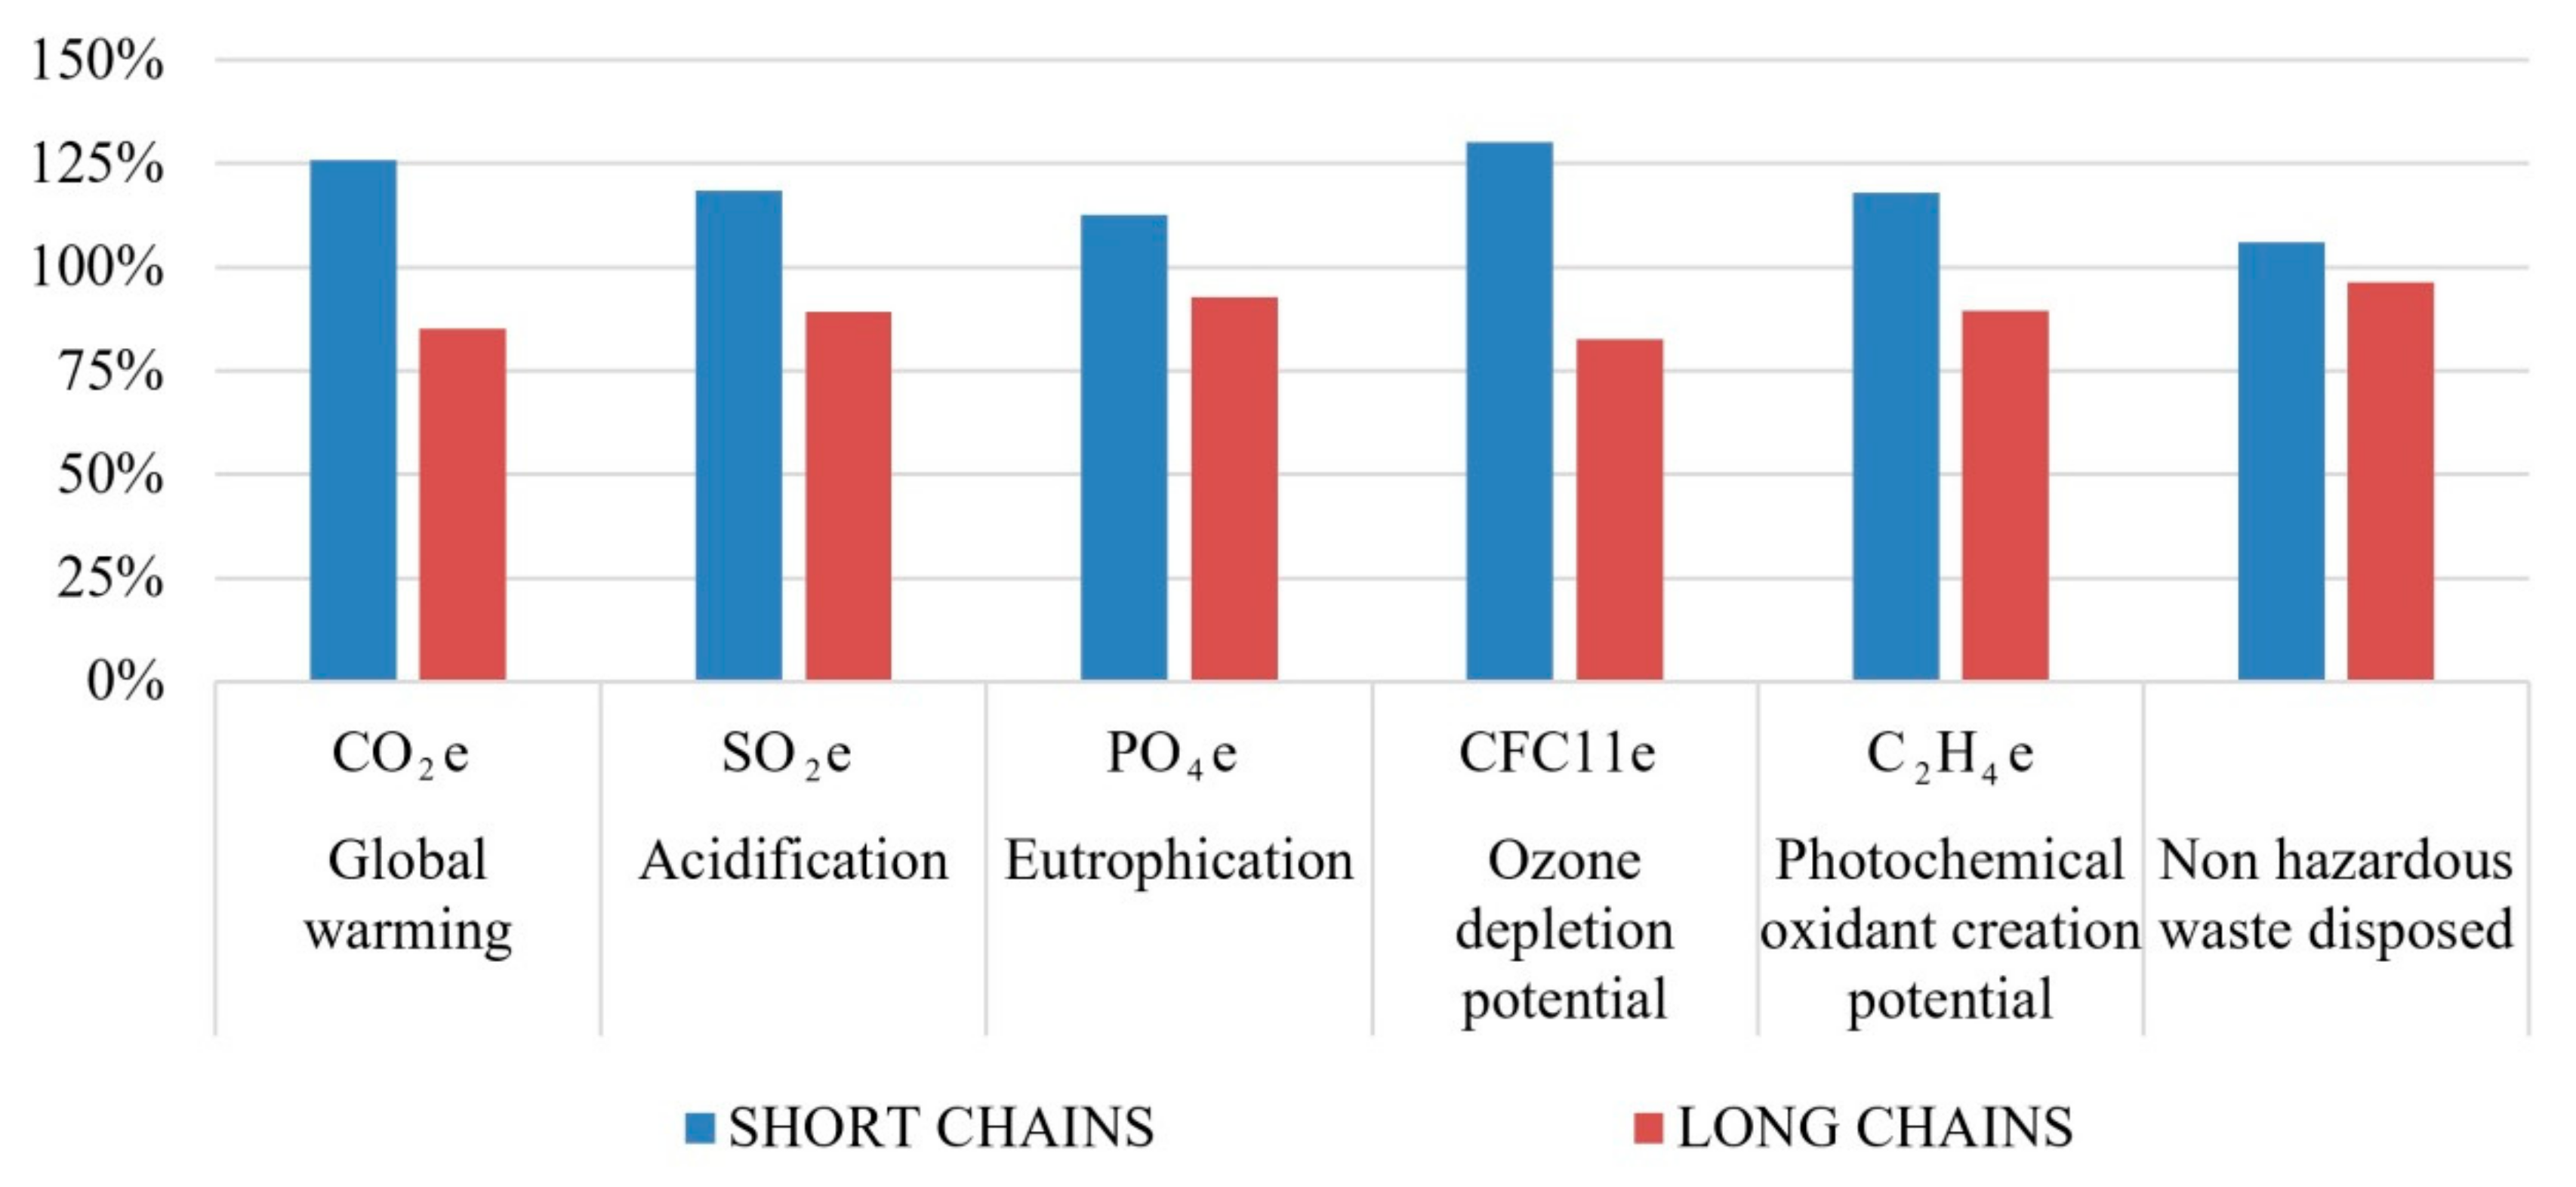
4.2. Environmental Impacts of Selected Supply Chains—LCA Results

The assessment of the environmental impacts of food supply chains according to the predetermined methodology of LCA includes three basic stages:
  • impacts related to the production phase of devices, machines, vehicles and the construction of buildings used in the food distribution process,
  • impacts related to the exploitation phase of specified devices and buildings (energy used in transportation, energy used for cooling, energy used to operate electrical devices etc.),
  • impacts related to the waste management phase.
The selected eco-efficiency indicators that illustrate the environmental impacts of the analyzed food supply chains are presented in Table 11. All values express the amounts of emitted substances per 1 kg of product delivered through the chain.
In order to make the interpretation of results easier, the values of indicators are presented in a graphic form in Figure 3. The diagram illustrates the differences between the eco-efficiency indicators for the analyzed food supply chains presented in a relative way, as relations between specific parameters and the mean values of indicators for all chains in the sample. The mean was calculated as a weighted average, considering the volume of sales in respective chains.
The highest level of emissions for the eco-efficiency indicators characterizes a. Pick-your-own and b. On-farm sales to consumers (the only exception is the second highest “waste disposed” indicator), determined mainly by consumers’ travels in both cases. Such a low environmental performance indicates the least effective use of individual cars as a means of transportation to transport relatively small quantities of food over long distances. Usually a trip to the farm in this form of shopping involves a purposeful journey, while the amount of produce transported is relatively small. Despite the very high values of all emissions, it is also worth paying attention to the proportionally high level of the “non-hazardous waste disposed” indicator, which results from a relatively large amount of waste generated by a passenger car in relation to the assumed total weight of products transported during its life time.
Emissions generated by b. On-farm sales to consumers are on average around 40% lower compared to a. Pick-your-own. This is due to the fact that, in the case of the first of these options, shopping is very often a spontaneous decision while passing by, which reduces the Net Transportation Distance. Traveling to a. Pick-your-own is usually a planned activity that involves a special trip to the farm. Even though quantities from pick-your-own are usually greater than from normal shopping, in the assessment of emissions, they do not counterbalance the longer distances travelled.
The chain c. Internet sales—courier deliveries is the least emissive, with values of all eco-efficiency indicators at the level of about 10% of the mean values for the sample. This is because the chain ensures the most efficient use of the means of transportation due to optimized distribution by courier companies. Even if individual deliveries are small, large quantities of all collected goods are transported with the use of heavy goods vehicles over considerable distances between collection points. Furthermore, the collection of parcels by couriers as well as last-mile deliveries to consumers are much more efficient in terms of environmental performance than the individual travels of consumers or producers. Another significant factor making Internet sales more eco-efficient is a lack of storage due to continuous, usually day-to-day, transportation.
The chain d. Direct deliveries to consumer is a “reversed” version of b. On-farm sales to consumers; however, it is environmentally much more efficient. In this case, transportation from the farm gate to consumers’ place of living is done entirely by the producer, who transports greater loads in a single journey, usually serving a number of customers on one trip, often delivering food to collection points. Relatively high indicators of global warming potential and ozone depletion potential result from the fuel consumption, similar to chains a. and b., but these are not sufficiently compensated by the greater loads transported.
Chains e. Sales on farmers’ markets and f. Direct deliveries to retail differ from other short chains in that they require specific outlets for retail trade. The trade infrastructure on farmers’ markets usually takes the form of simple construction stands spread over a paved and fenced area. Retail shops provide a limited area for highly concentrated sales and contain equipment, such as deep coolers or refrigerators, that are additional sources of emissions. A distinctive variable in the case of these two chains is the volume of sales from the trading area. In our study, it was 130 kg/m2 of food products on farmers’ markets and about 1100 kg/m2 of food in retail shops on average.
As all estimated LCA indicators show, e. Sales on farmers’ markets are noticeably less eco-efficient than f. Direct deliveries to retail shops. This is due to the rather extensively used trade infrastructure (lower sales from the trading area unit), more P2R transportation efforts (larger number of individual suppliers transporting relatively small quantities of products) and more consumer travels, because of the usually distant location of the majority of farmers’ markets from consumers’ place of living. In contrast to the latter, small- and medium-sized retail shops normally have much closer locations. Thus, shopping, often done in a passing-by situation on the way home or during travels for other purposes, involves much less transportation by car. This compensates for the usually lower weight of an average single purchase in a retail shop. Consumers shopping on farmers’ markets usually buy more, but travel longer distances specifically for the purpose of doing so and more often with the use of a personal car.
All LCA indicators, except “waste disposed”, which is very high in the case of e. Sales on farmers’ markets, are about 20–25% higher than mean values for the sample and comparable eco-efficiency indicators for f. Direct deliveries to retail. The exception is the relatively high emission of harmful substances in this chain because of the more extensive use of infrastructure (significantly lower sales per square meter of sales area) and the shorter life of trading instalments.
The values of all eco-efficiency LCA indicators estimated for long supply chains are close to the mean values for the sample and comparable with f. Direct deliveries to retail for the short food supply chains. This is mainly due to the more effective use of trading facilities in some types of retail outlets (e.g., hypermarkets) and large volumes of goods transported in individual deliveries that make the means of transportation more effective (reducing energy consumption in the use phase).
Among the long chains, h. Sales to wholesale market are slightly less eco-efficient, which is due to the greater share of low-capacity cars used by farmers for transportation and thus higher values of Food Miles. Eco-efficiency indicators are further worsened because of transportation from wholesale to retail outlets. Although distances travelled on this leg are relatively short, small quantities and the frequency of transportation activities (very often every day in order to provide fresh produce) increase the value of eco-efficiency indicators.
Indicators for i. Sales to hypermarket chains are very similar to those characterizing the short chain f. Direct deliveries to retail. In the case of deliveries to hypermarkets, the distances travelled by products and also by consumers are longer, but the quantities transported are significantly greater, reducing the number of Food Miles, and vice versa; in f. Direct deliveries to retail, the distances travelled are much shorter, but smaller loads in a single delivery worsen the eco-efficiency indicators for this chain.
Figure 4 presents a synthetized comparison of the average values of eco-efficiency LCA indicators for the short and long supply chains analyzed in this study.
In Table 12, the relative share of transport in relation to the total values of the eco-efficiency indicators is presented. It can be observed that, as indicated by Browne et al. [77], in the entire emissions generated by food distribution through various chains, transport plays an important role.
Transportation is responsible for a huge 79% of the total carbon footprint in the case of ‘short’ food supply chains, and for about 53% in the case of ‘long’ supply chains. In all remaining indicators for SFSCs, the share of transport is quite high compared to long chains, ranging from a 22 percentage point difference in the case of ozone depletion, to a 33.4 percentage point difference in the case of acidification. This can be explained by the more direct way of selling food through short chains, where intermediaries and their facilities are not contributing to the emissions.
In relation to the main hypothesis empirically tested in this paper, the results of our study reject the popular assumption that short food supply chains are more eco-efficient than long chains. It should be emphasized, however, that the values of eco-efficiency indicators display a large variability across analyzed chains, and especially across different types of SFSCs. A key reason for this is due to their specific features, such as the transport distance and the amount of goods per individual delivery. Moreover, the analysis shows that the environmental impacts of different food distribution systems are not only determined by the geographical distance between producer and consumer, but depend on numerous factors, including the supply chain infrastructure, the type and capacity of vehicles used, as well as specific conditions associated with food transportation, storage and the display of food in retail outlets (e.g., refrigerators and freezers, store shelves).
Our findings can hardly be compared in the context of the extant literature since, to the best of our knowledge, there are no similar, complex analyses made that quantify the eco-efficiency of several types of supply chains with the application of the LCA methodology. Opinions on the better environmental performance of short food supply chains are most often based on qualitative assessments. These assessments are typically lacking the required detailed information, or depth to the analysis, required to capture the complexity of food systems and, most importantly, are shaped by the simplifying assumption that shortening the travelling distances of products can significantly reduce the negative environmental externalities [11,15,18,19,37]. This view has, more recently, been frequently questioned [9,10,11,12,43,44,45].
The literature does contain examples of LCA-based eco-efficiency analysis of supply chains, although rather narrowly focused on single products and differently defined system boundaries, with a strong focus on production processes [69,114]. Such studies prove the applicability of the LCA methodology for assessing the environmental performance of food supply chains, providing a clear rationale for our work.

5. Conclusions

The food market today is rapidly evolving in terms of what is manifested, inter alia, by the development of new types of short supply chains. A widespread belief that SFSCs are more beneficial for the environment compared to conventional long chains is rejected by the results of our empirical testing with the use of the LCA approach. Shortening food supply chains in terms of organizational proximity does not automatically entail a more environmentally sustainable alternative to long supply chains nor mitigate some of the negative environmental externalities. Similarly, reducing the transportation distance from primary producers to end consumers, which is usually one of the specific features of SFSCs, may not lead to better eco-efficiency because of the small quantities typically transported in short supply chain deliveries.
More importantly, the results reveal that consumers make a significant contribution to the eco-efficiency measurement of all considered indicators. While this suggests a limited scope for reducing the environmental impacts of P2R transportation, there is significant potential for improving the eco-efficiency of supply chains through innovative business models for retail, which would not only shorten producer–consumer travel distances, but also make them more convenient and effective (e.g., last-mile delivery, group shopping on farmers’ markets, internet sales, courier deliveries). Further research will be required, in this context, in order to identify and empirically assess the environmental benefits of existing/new business solutions, including organizational innovations in logistics.
While the LCA provides a suitable methodological tool for assessing the environmental impacts of different types of food chains, some important caveats must be noted. First, the analysis focuses on the distribution system, without examining the environmental impacts of the production stage. Second, potential selection bias implies that the sample cannot be considered representative of the whole population of farms across different countries. Finally, the modelling approach required several assumptions and simplifications to be made, with scientific implications for the universal validity of eco-efficiency indicators and the obtained results.
Our findings widen the path for further research in the area of supply chains. Empirical investigation may complement our study in terms of:
  • Gaining deeper production data to validate our assumption on the use of technologies of production, irrespective of the choice of distribution channel;
  • Searching for country-specific characteristics, such as the scale of operations, distribution organization, shopping patterns or energy mixes, which may differentiate the eco-efficiency of supply chains;
  • Assuring the better representation of chains and the representativeness of research samples;
  • Providing more detailed mapping and eco-efficiency assessments of food supply chains, including food processing.
The methodological and empirical contribution of this study represents, however, the first attempt in the literature that applies LCA analysis to a unique sample of coexistent short and long food supply chains, and thus contributes to the existing literature in terms of the observation of various food distribution paths and the assessment of their eco-efficiency. This study thus contributes to filling an existing gap in the empirical literature by providing a critical reflection on the realization of environmental benefits of SFSCs, which cannot be simply inferred via the association of close geographical proximity and short transport distances with low energy consumption, as typically suggested in qualitative studies.
The results of the study may contribute to the debate on the EU Green Deal. Our approach may be used for the creation of better suited, evidence-based environmental and energy policy instruments for supporting the most eco-efficient supply chains and innovative business models linking close primary producers and food consumers.

Author Contributions

Conceptualization, E.M., A.K., J.K., A.W.; methodology, E.M., A.K., J.K., A.M.-R., A.W.; software, A.K., J.K., A.W., M.G., K.P.; validation, E.M., A.K., J.K., A.W.; formal analysis, A.M.-R., and E.M.; data curation, E.M., A.K., J.K., A.M.-R., A.W., M.G., K.P., J.-L.L., B.T., Á.T., M.D., G.V.; writing—Original draft preparation, E.M., A.M.-R., A.K., J.K., P.S.; writing—Review and editing, E.M., A.K., J.K., A.M.-R., A.W., P.S., M.G., K.P., J.-L.L., B.T., Á.T., M.D., G.V.; project administration, A.M.-R. All authors have read and agreed to the published version of the manuscript.

Funding

This research received funding from the European Union’s Horizon 2020 research and innovation program STRENGTH2FOOD under grant agreement no. 678024 and title: “Strengthening European Food Chain Sustainability by Quality and Procurement Policy”.

Conflicts of Interest

The authors declare no conflict of interest. The funders had no role in the design of the study; in the collection, analyses, or interpretation of data; in the writing of the manuscript, or in the decision to publish the results.

Appendix A

Table A1. Environmental parameters for eco-efficiency assessments.
Functional UnitGlobal Warming PotentialAcidification PotentialEutrophication PotentialOzone Depletion PotentialPhoto-Chemical Ozone Creation PotentialNon-Hazardous Waste Disposed
GWPAPEPODPPOCPNHWD
kg CO2ekg SO2ekg PO4ekg CFC-11ekg C2H4ekg
Buildings and infrastructure
Small storeunit/year33,500110152.20 × 10−36900
Medium storeunit/year246,100650981.35 × 10−23514,300
Large storeunit/year1,028,00032404906.77 × 10−217371,600
Wholesales marketunit/year3,196,60015,46023733.42 × 10−1884452,200
Farmers’ marketunit/year111,800590851.08 × 10−23322,900
Transportation vehicles
Passenger carunit/km0.03581.98 × 10−41.17 × 10−52.11 × 10−91.67 × 10−50.0098
VANunit/km0.04322.39 × 10−41.38 × 10−52.53 × 10−92.02 × 10−50.0094
Truckunit/km0.03691.95 × 10−41.07 × 10−43.09 × 10−92.45 × 10−50.0089
City busunit/km0.04492.48 × 10−41.40 × 10−43.97 × 10−93.06 × 10−50.0110
Energy sources
Dieselunit/l3.2404.67 × 10−39.67 × 10−45.50 × 1074.80 × 10−40.019
Petrol 95E10unit/l2.8006.00 × 10−31.00 × 10−35.00 × 1073.00 × 10−40.020
Electricity, Europeunit/kWh0.3862.17 × 10−33.00 × 10−44.17 × 10−81.05 × 10−40.014
Natural gasunit/kWh0.2447.17 × 10−44.83 × 10−52.00 × 10−84.83 × 10−50.002
Source: own calculation.

References

  1. World Resources Institute. Climate Analysis Indicators Tool; WRI: Washington, DC, USA, 2017. [Google Scholar]
  2. Moriarty, P.; Wang, S.J. Eco-efficiency indicators for urban transport. J. Sustain. Dev. Energy Water Environ. Syst. 2015, 3, 183–195. [Google Scholar] [CrossRef] [Green Version]
  3. European Commission. Communication from the Commission to the European Parliament, the Council, the European Economic and Social Committee and the Committee of the Regions. A European Strategy for Low-Emission Mobility; COM/2016/0501 Final; European Commission: Brussels, Belgium, 2016. [Google Scholar]
  4. Zhang, S.; Witlox, F. Analyzing the impact of different transport governance strategies on climate change. Sustainability 2020, 12, 200. [Google Scholar] [CrossRef] [Green Version]
  5. European Commission. Communication from the Commission to the European Parliament, the Council, the European Economic and Social Committee and the Committee of the Regions. A Policy Framework for Climate and Energy in the Period from 2020 to 2030. COM(2014) 15 Final; European Commission: Brussels, Belgium, 2014. [Google Scholar]
  6. Pirog, R.S.; Van Pelt, T.; Enshayan, K.; Cook, E. Food, Fuel, and Freeways: An Iowa Perspective on How Far Food Travels, Fuel Usage, and Greenhouse Gas Emissions; Iowa State University: Ames, IA, USA, 2001; Available online: https://lib.dr.iastate.edu/cgi/viewcontent.cgi?article=1002&context=leopold_pubspapers (accessed on 13 September 2020).
  7. European Commission. Italian NRN Contribution to the “Short Supply Chain” Workshop; EC: Bad Schandau, Germany, 2011; Available online: https://enrd.ec.europa.eu/enrd-static/fms/pdf/BAA4B613-92C1-DBB4-997B-7BFAFFA031CC.pdf (accessed on 13 September 2020).
  8. Pretty, J. Some Benefits and Drawbacks of Local Food Systems. Bioregional Connections to Sustainable Foodsheds. Briefing Note for TVU/Sustain AgriFood Network. 2001. Available online: https://www.sustainweb.org/pdf/afn_m1_p2.pdf (accessed on 13 September 2020).
  9. Shindelar, R. The Ecological Sustainability of Local Food Systems. In Think Global, Eat Local: Exploring Foodways; Pimbert, M., Shindelar, R., Schösler, H., Eds.; Rachel Carson Center: LMU Munich, Germany, 2015; pp. 19–23. [Google Scholar]
  10. Galli, F.; Brunori, G. Short Food Supply Chains as Drivers of Sustainable Development Evidence Document; Laboratorio di studi rurali Sismondi, Italy. 2013. Available online: https://orgprints.org/28858/1/evidence-document-sfsc-cop.pdf (accessed on 13 September 2020).
  11. Weber, C.L.; Matthews, H.S. Food-miles and the relative climate impacts of food choices in the United States. Environ. Sci. Technol. 2008, 42, 3508–3513. [Google Scholar] [CrossRef] [PubMed] [Green Version]
  12. Malak-Rawlikowska, A.; Majewski, E.; Wąs, A.; Borgen, S.O.; Csillag, P.; Donati, M.; Freeman, R.; Hoàng, V.; Lecoeur, J.-L.; Mancini, M.C.; et al. Measuring the Economic, Environmental, and Social Sustainability of Short Food Supply Chains. Sustainability 2019, 11, 4004. [Google Scholar] [CrossRef] [Green Version]
  13. Feenstra, G.W. Local food systems and sustainable communities. Am. J. Altern. Agric. 1997, 12, 28–36. [Google Scholar] [CrossRef]
  14. Peters, R.; Markuszewska, A.; Prior, A.; Strano, A.; Bálint, B.; Midoux, B.; Bros, C.; Koutsaftaki, C.; Jochum, C.; Buffet, C.; et al. Rural Review Issue 12—Local Food and Short Food Supply Chains, A Publication from the European Network of Rural Development-Online; European Union: Brussels, Belgium, 2012; Available online: https://enrd.ec.europa.eu/sites/enrd/files/E8F24E08-0A45-F272-33FB-A6309E3AD601.pdf (accessed on 13 September 2020).
  15. Kneafsey, M.; Venn, L.; Schmutz, U.; Balázs, B.; Trenchard, L.; Eyden-Wood, T.; Bos, E.; Foster, G.; Blackett, M. Short Food Supply Chains and Local Food Systems in the EU. A State of Play of their Socio-Economic Characteristics; Joint Research Centre (JRC): Luxembourg, 2013. [Google Scholar]
  16. European Parliament. Regulation (EU) No 1305/2013 of the European Parliament and of the Council of 17 December 2013 on Support for Rural Development by the European Agricultural Fund for Rural Development (EAFRD) and Repealing Council Regulation (EC); No 1698/2005; European Parliament: Brussels, Belgium, 2013. [Google Scholar]
  17. Vittersø, G.; Torjusen, H.; Laitala, K.; Tocco, B.; Biasini, B.; Csillag, P.; de Labarre, M.D.; Lecoeur, J.-L.; Maj, A.; Majewski, E.; et al. Short Food Supply Chains and Their Contributions to Sustainability: Participants’ Views and Perceptions from 12 European Cases. Sustainability 2019, 11, 4800. [Google Scholar] [CrossRef] [Green Version]
  18. Sims, R.; Flammini, A.; Puri, M.; Bracco, S. Opportunities for Agri-Food Chains to Become Energy-Smart; FAO and USDA, U.S. Agency for International Development: Washington, DC, USA, 2015. Available online: http://www.fao.org/3/a-i5125e.pdf (accessed on 13 September 2020).
  19. Bomford, M. Beyond Food Miles—Resilience. Available online: https://www.resilience.org/stories/2011-03-09/beyond-food-miles/ (accessed on 6 July 2020).
  20. Monforti-Ferrario, F.; Dallemand, J.-F.; Pascua, I.P.; Motola, V.; Banja, M.; Scarlat, N.; Medarac, H.; Castellazzi, L.; Labanca, N.; Bertoldi, P.; et al. Energy Use in the EU Food Sector: State of Play and Opportunities for Improvement; Joint Research Centre (JRC): Luxembourg, 2015; Available online: https://publications.jrc.ec.europa.eu/repository/bitstream/JRC96121/ldna27247enn.pdf (accessed on 6 July 2020).
  21. Ladha-Sabur, A.; Bakalis, S.; Fryer, P.J.; Lopez-Quiroga, E. Mapping energy consumption in food manufacturing. Trends Food Sci. Technol. 2019, 86, 270–280. [Google Scholar] [CrossRef]
  22. Fisher, D.; McKinnon, A.; Palmer, A. Reducing the external costs of food distribution in the UK. In Delivering Performance in Food Supply Chains; Mena, C., Stevens, G., Eds.; Woodhead Publishing Limited: Oxford, UK, 2010; pp. 459–477. ISBN 9781845694715. [Google Scholar]
  23. Foucherot, C.; Rogissart, L. Estimating Greenhouse Gas Emissions from Food Consumption: Methods and Results. Available online: https://www.i4ce.org/download/estimating-greenhouse-gas-emissions-from-food-consumption-methods-and-results/ (accessed on 13 August 2020).
  24. FAO. Energy-Smart Food for People and Climate; Issue Paper; Food and Agriculture Organization of the United Nations: Rome, Italy, 2011. [Google Scholar]
  25. Akkerman, R.; Farahani, P.; Grunow, M. Quality, safety and sustainability in food distribution: A review of quantitative operations management approaches and challenges. OR Spectr. 2010, 32, 863–904. [Google Scholar] [CrossRef]
  26. European Commission. Guidance on the Implementation of Articles 11, 12, 14, 17, 18, 19 and 20 of Regulation (EC) N° 178/2002 on General Food Law. Conclusions of the Standing Committee on the Food Chain and Animal Health; EC: Brussels, Belgium, 2010. [Google Scholar]
  27. Pal, A.; Kant, K. A Food Transportation Framework for an Efficient and Worker-Friendly Fresh Food Physical Internet. Logistics 2017, 1, 10. [Google Scholar] [CrossRef] [Green Version]
  28. Peck, H. Resilience in the Food Chain: A Study of Business Continuity Management in the Food and Drink Industry. Final Report to the Department for Environment, Food and Rural Affairs; DEFRA: London, UK, 2006.
  29. Commitee on World Food Security. Global Strategic Framework for Food Security and Nutrition (GSF); FAO: Rome, Italy, 2017; Available online: http://www.fao.org/3/MR173EN/mr173en.pdf (accessed on 13 August 2020).
  30. Ziska, L.; Crimmins, A.; Auclair, A.; DeGrasse, S.; Garofalo, J.F.; Khan, A.S.; Loladze, I.; de León, A.A.P.; Showler, A.; Thurston, J.; et al. Food Safety, Nutrition, and Distribution. In The Impacts of Climate Change on Human Health in the United States: A Scientific Assessment; U.S Global Change Research Program: Washington, DC, USA, 2016; pp. 189–216. ISBN 9780309377270. Available online: http://medsocietiesforclimatehealth.org/wp-content/uploads/2016/11/Health-Impacts-of-Climate-Change-in-the-U.S.-2016_Full-Report_small.pdf (accessed on 13 August 2020).
  31. Candel, J.J.L. Diagnosing integrated food security strategies. NJAS Wagening. J. Life Sci. 2018, 84, 103–113. [Google Scholar] [CrossRef]
  32. Chiffoleau, Y.; Millet-Amrani, S.; Canard, A. From Short Food Supply Chains to Sustainable Agriculture in Urban Food Systems: Food Democracy as a Vector of Transition. Agriculture 2016, 6, 57. [Google Scholar] [CrossRef] [Green Version]
  33. Malak-Rawlikowska, A.; Majewski, E.; Wąs, A.; Gołaś, M.; Kłoczko-Gajewska, A.; Borge, S.O.; Coppola, E.; Csillag, P.; de Labarre, M.D.; Freeman, R.; et al. Quantitative Assessment of Economic, Social and Environmental Sustainability of Short Food Supply Chains and Impact on Rural Territories; Deliverable 7.2., Strength2Food Project no.678024; Strength2Food: Krakow, Poland, 2019; Available online: https://www.strength2food.eu/wp-content/uploads/2019/02/D7.2-Quantitative-assessment-of-economic-social-and-environmental-sustainability-of-short-food-supply-chains-and-impact-on-rural-territories_final_protected.pdf (accessed on 13 August 2020).
  34. Marsden, T.; Banks, J.; Bristow, G. Food supply chain approaches: Exploring their role in rural development. Sociol. Rural. 2000, 40, 424–438. [Google Scholar] [CrossRef]
  35. Renting, H.; Marsden, T.K.; Banks, J. Understanding alternative food networks: Exploring the role of short food supply chains in rural development. Environ. Plan. A 2003, 35, 393–411. [Google Scholar] [CrossRef] [Green Version]
  36. Fondse, M. Grown Close to Home: A Typology of Short Food Supply Chain Business Models in the Netherlands. Master’s Thesis, Wageningen University, Wageningen, The Netherlands, 2012. [Google Scholar]
  37. Erker, T.; Louis, S. Sustainability of Local Food Systems: Practices and Motivations of Farmers at St. Louis Farmers Markets. Senior Honors Thesis, Washington University in St. Louis, St. Louis, MI, USA, 2010. [Google Scholar]
  38. Aubert, M. The Determinants of Selling through a Short Food Supply Chains: An Application to the French Case; Post-Print hal-01296422, HAL. 2015. Available online: https://ideas.repec.org/p/hal/journl/hal-01296422.html (accessed on 13 August 2020).
  39. Conner, D.; Colasanti, K.; Ross, R.B.; Smalley, S.B. Locally grown foods and farmers markets: Consumer attitudes and behaviors. Sustainability 2010, 2, 742–756. [Google Scholar] [CrossRef] [Green Version]
  40. Wittman, H.; Beckie, M.; Hergesheimer, C. Linking Local Food Systems and the Social Economy? Future Roles for Farmers’ Markets in Alberta and British Columbia. Rural Sociol. 2012, 77, 36–61. [Google Scholar] [CrossRef]
  41. Galli, F.; Bartolini, F.; Brunori, G.; Colombo, L.; Gava, O.; Grando, S.; Marescotti, A. Sustainability assessment of food supply chains: An application to local and global bread in Italy. Agric. Food Econ. 2015, 3, 21. [Google Scholar] [CrossRef] [Green Version]
  42. Mundler, P.; Laughrea, S. The contributions of short food supply chains to territorial development: A study of three Quebec territories. J. Rural Stud. 2016, 45, 218–229. [Google Scholar] [CrossRef]
  43. Gonçalves, A.; Zeroual, T. Logistic Issues and Impacts of Short Food Supply Chains: Case Studies in Nord—Pas de Calais, France. In Toward Sustainable Relations between Agriculture and the City; Soulard, C.-T., Perrin, C., Valette, E., Eds.; Springer: Berlin/Heidelberg, Germany, 2017; pp. 33–49. [Google Scholar]
  44. Mancini, M.; Menozzi, D.; Donati, M.; Biasini, B.; Veneziani, M.; Arfini, F. Producers’ and Consumers’ Perception of the Sustainability of Short Food Supply Chains: The Case of Parmigiano Reggiano PDO. Sustainability 2019, 11, 721. [Google Scholar] [CrossRef] [Green Version]
  45. Bloemhof, J.M.; Soysal, M. Sustainable Food Supply Chain Design. In Sustainable Supply Chains; Bouchery, Y., Corbett, C.J., Fransoo, J.C., Tan, T., Eds.; Springer: Amsterdam, The Netherlands, 2017; pp. 395–412. [Google Scholar]
  46. Tassou, S.A.; De-Lille, G.; Ge, Y.T. Food transport refrigeration—Approaches to reduce energy consumption and environmental impacts of road transport. Appl. Therm. Eng. 2009, 29, 1467–1477. [Google Scholar] [CrossRef] [Green Version]
  47. Sims, R.; Schaeffer, R.; Creutzig, F.; Cruz-Núñez, X.; D’Agosto, M.; Dimitriu, D.; Figueroa-Meza, M.J.; Fulton, L.; Kobayashi, S.; Lah, O.; et al. Transport. In Climate Change 2014: Mitigation of Climate Change; Edenhofer, O., Pichs-Madruga, R., Sokona, Y., Farahani, E., Kadner, S., Seyboth, K., Adler, A., Baum, I., Brunner, S., Eickemeier, P., et al., Eds.; Cambridge University Press: Cambridge, UK, 2014; pp. 599–670. [Google Scholar]
  48. Nielsen, J.Ø.; Vigh, H. Adaptive lives. Navigating the global food crisis in a changing climate. Glob. Environ. Chang. 2012, 22, 659–669. [Google Scholar] [CrossRef]
  49. Tirado, M.C.; Clarke, R.; Jaykus, L.A.; McQuatters-Gollop, A.; Frank, J.M. Climate change and food safety: A review. Food Res. Int. 2010, 43, 1745–1765. [Google Scholar] [CrossRef]
  50. OECD. Enhancing the Mitigation of Climate Change though Agriculture; OECD: Paris, France, 2019. [Google Scholar]
  51. Gowreesunker, B.L.; Tassou, S.A. Approaches for modelling the energy flow in food chains. Energy. Sustain. Soc. 2015, 5, 7. [Google Scholar] [CrossRef] [Green Version]
  52. WBCSD; Lehni, M. Eco-Efficiency. Creating More Value with Less Impact; WBCSD: Geneva, Switzerland, 2000. [Google Scholar]
  53. Gómez-Limón, J.A.; Picazo-Tadeo, A.J.; Reig-Martínez, E. Eco-efficiency assessment of olive farms in Andalusia. Land Use Policy 2012, 29, 395–406. [Google Scholar] [CrossRef]
  54. Schaltegger, S.; Burritt, R. Contemporary Environmental Accounting. Issues, Concepts and Practice; Routledge: London, UK, 2000. [Google Scholar]
  55. Rybaczewska-Błażejowska, M.; Gierulski, W. Eco-Efficiency Evaluation of Agricultural Production in the EU-28. Sustainability 2018, 10, 4544. [Google Scholar] [CrossRef] [Green Version]
  56. Huppes, G.; Ishikawa, M. A framework for quantified eco-efficiency analysis. J. Ind. Ecol. 2005, 9, 25–41. [Google Scholar] [CrossRef]
  57. Müller, K.; Holmes, A.; Deurer, M.; Clothier, B.E. Eco-efficiency as a sustainability measure for kiwifruit production in New Zealand. J. Clean. Prod. 2015, 106, 333–342. [Google Scholar] [CrossRef]
  58. Caiado, R.G.G.; Dias, R.; Mattos, L.V.; Quelhas, O.L.G.; Filho, W.; Dias, R.d.F.; Mattos, L.V.; Quelhas, O.L.G.; Filho, W.L. Towards sustainable development through the perspective of eco-efficiency—A systematic literature review. J. Clean. Prod. 2017, 165, 890–904. [Google Scholar] [CrossRef]
  59. World Business Council for Sustainable Development. Eco-Efficient Leadership for Improved Economic and Environmental Performance; WBCSD: Geneva, Switzerland, 1996. [Google Scholar]
  60. Maxime, D.; Marcotte, M.; Arcand, Y. Development of eco-efficiency indicators for the Canadian food and beverage industry. J. Clean. Prod. 2006, 14, 636–648. [Google Scholar] [CrossRef]
  61. OECD. Ecoefficiency; OECD Publishing: Paris, France, 1998. [Google Scholar]
  62. UN. Eco-Efficiency Indicators: Measuring Resource-Use Efficiency and the Impact of Economic Activities on the Environment. Available online: https://sustainabledevelopment.un.org/index.php?page=view&type=400&nr=785&menu=1515 (accessed on 18 August 2020).
  63. Burchart-Korol, D.; Kruczek, M.; Czaplicka-Kolarz, K. Wykorzystanie ekoefektywności w ocenie poziomu ekoinnowacyjności. In Innowacje w Zarządzaniu i Inżynierii Produkcji; Oficyna Wydawnicza Polskiego Towarzystwa Zarządzania Produkcją, Poland: Opole, Poland, 2013. [Google Scholar]
  64. Saling, P.; Kicherer, A.; Dittrich-Krämer, B.; Wittlinger, R.; Zombik, W.; Schmidt, I.; Schrott, W.; Schmidt, S. Eco-efficiency analysis by BASF: The method. Int. J. Life Cycle Assess. 2002, 7, 203–218. [Google Scholar] [CrossRef]
  65. Pishgar-Komleh, S.H.; Zylowski, T.; Rozakis, S.; Kozyra, J. Efficiency under different methods for incorporating undesirable outputs in an LCA+DEA framework: A case study of winter wheat production in Poland. J. Environ. Manag. 2020, 260, 110–138. [Google Scholar] [CrossRef]
  66. Charles, R.; Jolliet, O.; Gaillard, G.; Pellet, D. Environmental analysis of intensity level in wheat crop production using life cycle assessment. Agric. Ecosyst. Environ. 2006, 113, 216–225. [Google Scholar] [CrossRef]
  67. Wang, M.; Wu, W.; Liu, W.; Bao, Y. Life cycle assessment of the winter wheat-summer maize production system on the North China Plain. Int. J. Sustain. Dev. World Ecol. 2007, 14, 400–407. [Google Scholar] [CrossRef]
  68. Liang, L.; Chen, Y.; Gao, W.; Sui, P.; Chen, D.; Zhang, W. Life cycle environmental impact assessment in winter wheat-summer maize system in north China plain. J. Agric. Environ. Sci. 2009, 28, 1773–1776. [Google Scholar]
  69. McCarthy, D.; Matopoulos, A.; Davies, P. Life cycle assessment in the food supply chain: A case study. Int. J. Logist. Res. Appl. 2015, 18, 140–154. [Google Scholar] [CrossRef]
  70. Mesaric, J.; Franjkovic, J.; Šebalj, D. Supply chains in the context of Life Cycle Assessment and Sustainability. In Proceedings of the 16th International Scientific Conference Business Logistics in Modern Management, Osijek, Croatia, 13 October 2016. [Google Scholar]
  71. Carlsson-Kanyama, A. Climate change and dietary choices—How can emissions of greenhouse gases from food consumption be reduced? Food Policy 1998, 23, 277–293. [Google Scholar] [CrossRef]
  72. Anand, C.K.; Amor, B. Recent developments, future challenges and new research directions in LCA of buildings: A critical review. Renew. Sustain. Energy Rev. 2017, 67, 408–416. [Google Scholar] [CrossRef]
  73. van der Giesen, C.; Cucurachi, S.; Guinée, J.; Kramer, G.J.; Tukker, A. A critical view on the current application of LCA for new technologies and recommendations for improved practice. J. Clean. Prod. 2020, 259, 120904. [Google Scholar] [CrossRef]
  74. Eriksson, E.; Blingeb, M.; Liivgren, G. Life cycle assessment of the road transport sector. Sci. Total Environ. 1996, 189/190, 69–76. [Google Scholar] [CrossRef]
  75. Li, C.; Cui, S.P.; Gong, X.Z.; Meng, X.C.; Sun, B.X.; Liu, Y. Life Cycle Assessment of Heavy-Duty Truck for Highway Transport in China. J. Chem. Inf. Model. 2013, 53, 1689–1699. [Google Scholar] [CrossRef]
  76. Yang, L.; Hao, C.; Chai, Y. Life Cycle Assessment of Commercial Delivery Trucks: Diesel, Plug-In Electric, and Battery-Swap Electric. Sustainability 2018, 10, 4547. [Google Scholar] [CrossRef] [Green Version]
  77. Browne, M.; Rizet, C.; Anderson, S.; Allen, J.; Keïta, B. Life cycle assessment in the supply chain: A review and case study. Transp. Rev. 2005, 25, 761–782. [Google Scholar] [CrossRef]
  78. EEA. Electric Vehicles from Life Cycle and Circular Economy Perspectives; TERM 2018: Transport and Environment Reporting Mechanism (TERM) Report; European Environment Agency, Publications Office of the European Union: Luxembourg, 2018; Available online: file:///C:/Users/Agata%20i%20Marcin/Downloads/TH-AL-18-012-EN-N%20TERM%202018.pdf (accessed on 13 August 2020).
  79. Egede, P.; Dettmer, T.; Herrmann, C.; Kara, S. Life cycle assessment of electric vehicles—A framework to consider influencing factors. Procedia CIRP 2015, 29, 233–238. [Google Scholar] [CrossRef]
  80. Patterson, J.; Johnson, A. Understanding the Life Cycle GHG Emissions for Different Vehicle Types and Powertrain Technologies. Final Report for LowCVP; Ricardo plc. 2018. Available online: file:///C:/Users/Agata%20i%20Marcin/Downloads/LowCVP-LCA_Study-Final_Report.pdf (accessed on 13 August 2020).
  81. Syed, A.; Van Mierlo, J.; Messagie, M. Life cycle assessment of electrification of heavy-duty vehicle. In Proceedings of the 32nd International Electric Vehicle Symposium, Lyon, France, 19–22 May 2019; pp. 1–12. [Google Scholar]
  82. Nordelöf, A.; Romare, M.; Tivander, J. Life cycle assessment of city buses powered by electricity, hydrogenated vegetable oil or diesel. Transp. Res. Part D Transp. Environ. 2019, 75, 211–222. [Google Scholar] [CrossRef]
  83. Cabeza, L.F.; Rincón, L.; Vilariño, V.; Pérez, G.; Castell, A. Life cycle assessment (LCA) and life cycle energy analysis (LCEA) of buildings and the building sector: A review. Renew. Sustain. Energy Rev. 2014, 29, 394–416. [Google Scholar] [CrossRef]
  84. Nwodo, M.N.; Anumba, C.J. A review of life cycle assessment of buildings using a systematic approach. Build. Environ. 2019, 162. [Google Scholar] [CrossRef]
  85. Bahramian, M.; Yetilmezsoy, K. Life cycle assessment of the building industry: An overview of two decades of research (1995–2018). Energy Build. 2020, 219, 109917. [Google Scholar] [CrossRef]
  86. Vilches, A.; Garcia-Martinez, A.; Sanchez-Montañes, B. Life cycle assessment (LCA) of building refurbishment: A literature review. Energy Build. 2017, 135, 286–301. [Google Scholar] [CrossRef]
  87. Lavagna, M.; Baldassarri, C.; Campioli, A.; Giorgi, S.; Valle, A.d.; Castellani, V.; Sala, S. Benchmarks for environmental impact of housing in Europe: Definition of archetypes and LCA of the residential building stock. Build. Environ. 2018, 145, 260–275. [Google Scholar] [CrossRef]
  88. Schlegl, F.; Gantner, J.; Traunspurger, R.; Albrecht, S.; Leistner, P. LCA of buildings in Germany: Proposal for a future benchmark based on existing databases. Energy Build. 2019, 194, 342–350. [Google Scholar] [CrossRef]
  89. Komerska, A.; Kwiatkowski, J. Preliminary Study on the GWP Benchmark of Office Buildings in Poland Using the LCA Approach. Energies 2020, 13, 3298. [Google Scholar]
  90. Chen, Y.; Ng, S.T. Factoring in embodied GHG emissions when assessing the environmental performance of building. Sustain. Cities Soc. 2016, 27, 244–252. [Google Scholar] [CrossRef]
  91. Zabalza, I.; Scarpellini, S.; Aranda, A.; Llera, E.; Jáñez, A. Use of LCA as a tool for building ecodesign. A case study of a low energy building in Spain. Energies 2013, 6, 3901–3921. [Google Scholar] [CrossRef] [Green Version]
  92. Lausselet, C.; Borgnes, V.; Brattebø, H. LCA modelling for Zero Emission Neighbourhoods in early stage planning. Build. Environ. 2019, 149, 379–389. [Google Scholar] [CrossRef]
  93. Basbagill, J.; Flager, F.; Lepech, M.; Fischer, M. Application of life-cycle assessment to early stage building design for reduced embodied environmental impacts. Build. Environ. 2013, 60, 81–92. [Google Scholar] [CrossRef]
  94. Ramesh, T.; Prakash, R.; Shukla, K.K. Life cycle energy analysis of buildings: An overview. Energy Build. 2010, 42, 1592–1600. [Google Scholar] [CrossRef]
  95. Saade, M.R.M.; Guest, G.; Amor, B. Comparative whole building LCAs: How far are our expectations from the documented evidence? Build. Environ. 2020, 167, 106449. [Google Scholar] [CrossRef]
  96. Kalluri, S. Comparative Life Cycle Assessment of Road and Multimodal Transportation Options—A Case Study of Copperwood Project. Master’s Thesis, Michigan Technological University, Houghton, MI, USA, 2016. [Google Scholar]
  97. Weber, C.L.; Hendrickson, C.T.; Matthews, H.S.; Nagengast, A.; Nealer, R.; Jaramillo, P. Life cycle comparison of traditional retail and e-commerce logistics for electronic products: A case study of buy.com. In Proceedings of the 2009 IEEE International Symposium on Sustainable Systems and Technology (ISSST ’09) in Cooperation with 2009 IEEE International Symposium on Technology and Society (ISTAS), Tempe, AZ, USA, 18–20 May 2009. [Google Scholar]
  98. Michelson, H.; Boucher, S.; Cheng, X.; Huang, J.; Jia, X. Connecting supermarkets and farms: The role of intermediaries in Walmart China’s fresh produce supply chains. Renew. Agric. Food Syst. 2017, 33, 47–59. [Google Scholar] [CrossRef]
  99. Ferreira, K.; Goh, J.; Valavi, E. Intermediation in the Supply of Agricultural Products in Developing Economies; Harvard Business School Research Paper Series; Harvard Business School: Boston, MA, USA, 2017. [Google Scholar] [CrossRef] [Green Version]
  100. Cadilhon, J.; Fearne, A.; Hughes, D.; Moustier, P. Wholesale Markets and Food Distribution in Europe: New Strategies for Old Functions; Discussion Paper; Centre for Food Chain Research, Imperial College: London, UK, 2003. [Google Scholar]
  101. International Organization for Standardization. ISO 14040: Environmental Management—Life Cycle Assessment—Principles and Framework; IOS: Geneva, Switzerland, 2006; Available online: https://www.iso.org/standard/37456.html (accessed on 13 August 2020).
  102. International Organization for Standardization. ISO 14044. Environmental Management—Life Cycle Assessement—Requirements and Guidelines; IOS: Geneva, Switzerland, 2006; Available online: https://www.iso.org/standard/38498.html (accessed on 13 August 2020). [CrossRef]
  103. Bionova LTD. One Click LCA. Available online: https://www.oneclicklca.com/ (accessed on 13 August 2020).
  104. European Committee for Standardization (CEN). EN 15978. Sustainability of Construction Works—Assessment of Environmental Performance of Buildings—Calculation Method; European Committee for Standardization: Brussels, Belgium, 2011. [Google Scholar]
  105. International Organization for Standardization. ISO 14025. Environmental Labels and Declarations—Type III Environmental Declarations—Principles and Procedures; IOS: Geneva, Switzerland, 2006. [Google Scholar]
  106. Central Statistical Office. Rynek wewnętrzny w 2018 roku; Główny Urząd Statystyczny: Warsaw Poland, 2019. [Google Scholar]
  107. Vukovic, Z.; Regodic, D. Freon Leakage. Int. J. Sci. Res. 2014, 4, 1–9. [Google Scholar]
  108. Koronaki, I.P.; Cowan, D.; Maidment, G.; Beerman, K.; Schreurs, M.; Kaar, K.; Chaer, I.; Gontarz, G.; Christodoulaki, R.I.; Cazauran, X. Refrigerant emissions and leakage prevention across Europe—Results from the RealSkillsEurope project. Energy 2012, 45, 71–80. [Google Scholar] [CrossRef]
  109. Kolokotroni, M.; Mylona, Z.; Evans, J.; Foster, A.; Liddiard, R. Supermarket energy use in the UK. Energy Procedia 2019, 161, 325–332. [Google Scholar] [CrossRef]
  110. Tassou, S.A.; Ge, Y.; Hadawey, A.; Marriott, D. Energy consumption and conservation in food retailing. Appl. Therm. Eng. 2011, 31, 147–156. [Google Scholar] [CrossRef] [Green Version]
  111. Mercedes-Benz. Environmental Cycle, Certificate Mercedes-Benz E-Class; Daimler AG, Untertürkheim Department: Group Environmental Protection, RD/RSE; Mercedes-Benz: Stuttgart, Germany, 2015. [Google Scholar]
  112. EPD International AB. Environmental Product Declaration, Irizar I4 Coach; S-P-01571; IRIZAR S.COOP: Gipuzkoa, Spain, 2019. [Google Scholar]
  113. Matulka, P. Carbon FootPrint dla wybranych łańcuchów dostaw artykułów żywnościowych do sieci hipermarketów. Master’s Thesis, Warsaw University of Life Sciences, Warsaw, Poland, 2018. [Google Scholar]
  114. Andersson, K.; Ohlsson, T. Life cycle assessment of bread produced on different scales. Int. J. Life Cycle Assess. 1999, 4, 25–40. [Google Scholar] [CrossRef]
Figure 1. Life Cycle Assessment (LCA) system boundary definition applied to buildings (according to EN 15978).
Energies 13 04853 g001
Figure 2. LCA system boundary definition applied to transportation vehicles.
Energies 13 04853 g002
Figure 3. Relative eco-efficiency indicators (emissions per 1 kg of product) for supply chains related to weighted mean value = 100%. Source: own calculation.
Energies 13 04853 g003
Figure 4. Average eco-efficiency indicators for short and long food supply chains related to weighted mean value (mean = 100%). Source: own calculation.
Energies 13 04853 g004
Table 1. Number of farms and chains in the research sample.
CountryFranceHungaryItalyNorwayPolandUnited KingdomTotal
Number of farms223922165735191
of which:
  Farms223922145715169
  Fishmongers---2-2022
Number of chains6579633212069428
of which:
  short chains526153245456300
  long chains13181086613128
Source: own elaboration.
Table 2. Number of chains used by producers for distribution of products in the sample.
Category of ProductTotal Number of ChainsShort ChainsLong Chains
Fruits 964650
Vegetables 897712
Fish and Seafood463610
Cheese936627
Meat45396
Honey32239
Eggs651
Total428300128
Source: own elaboration.
Table 3. Participation of producers, intermediaries and consumers in transportation activities in selected food supply chains.
ChainProducer GatePink = Consumer Travel (R2C); Blue = Product Travel (P2R)
Short chains
a. Pick-your-own ProducerConsumer
b. On-farm sales to consumersProducerConsumer
c. Internet sales—courier deliveriesProducer/CourierConsumer
d. Direct deliveries to consumerProducerConsumer
e. Sales on farmers’ marketsProducerFarmers’ MarketConsumer
f. Direct deliveries to retailProducerRetail Shop **Consumer
Long chains
g. On-farm sales to intermediariesProducerAgentWholesaler ***Retail Shop **Consumer
h. Sales on wholesale marketProducerWholesalerRetail Shop **Consumer
i. Sales to hypermarket chainsProducerProducers’ Group **Logistics CentreHypermarket StoreConsumer
* The pink color in the table indicates a part of the physical distance in the distribution channel in which food is transported from the purchase (sales) by the consumer. Blue color indicates that the product travels from the farm gate to sales point being transported by producers or intermediaries. ** Retail outlets including food stores, hotels and restaurants. *** Alternatively. Source: Malak-Rawlikowska et al. 2019 [12].
Table 4. Yearly sales by supply chain for the full sample.
Supply ChainsTotal Volume Sold and Market ShareProducer Participation Across Chains
(Tons)(%)Number of Farms Using Certain Type of ChainsAs % of All Chains Used
n = 428
As % of All Farms in the Sample
n = 191 *
a. Pick-your-own16.30.130.71.6
b. On-farm sales to consumers854.77.111025.757.6
c. Internet sales—courier deliveries148.21.2286.514.7
d. Direct deliveries to consumer176.71.5286.514.7
e. Sales on farmers’ markets313.12.67317.138.2
f. Direct deliveries to retail2872.724.05813.630.4
Short Chains Total4381.736.630070.184.3
g. On-farm sales to intermediaries2266.318.9399.120.4
h. sales on wholesale market2315.119.36014.031.4
i. Sales to hypermarket chains 3018.925.2296.815.2
Long Chains Total7600.363.412829.951.3
Total sample11,982.0100428100-
* note that one farm can use diverse chains at the same time therefore this column should not be summarized to 100%. Source: own elaboration.
Table 5. Summary of scope/definitions.
Life Cycle Assessment of Food Supply Chains
Functional EquivalentFood supply chainShort and long food distribution chains
Definition of supply chainsFrom the farm gate to the consumer
LocationEuropean Union
Functional unit1 kg of purchased product
Assessed impact categories GWP, AP, EP, OPD, POCP, Non-Hazardous Waste Disposed
Eco-efficiency indicatorAssessed impact category/1kg of product
LCA System BoundaryCradle to grave
Buildings:
  Building construction materials, including technical equipment and furnishings
  Energy in operation stage, excluding office equipment
  Emissions due to refrigerant leakage included
Transport vehicles:
  Manufacturing, fuel use and disposal included
  Road infrastructure excluded
  Emissions due to refrigerant leakage from air conditioning excluded
Calculation SoftwareOneClick LCA© and 360optimi, Bionova [103]
Source: own elaboration.
Table 6. Definition of trading types.
Type of Trading OutletSize Category (m2)Sales Area (m2)Parking Area (m2)Average Sales Volume (kg/m2 year)Construction TypeInfrastructure Type (Parking)
Small store<399100251208Typical concrete structure, brick wall insulatedAsphalt paving
Medium store400–249910002501116Lightweight construction: steel frame with metal cladding, insulatedAsphalt paving
Large store (Hypermarket type)>2500500012501018Lightweight construction: steel frame with metal cladding, insulatedAsphalt paving
Wholesale marketX80,30039,7004480Lightweight construction: steel frame with metal cladding, non-insulated, Paved area with steel roofAsphalt paving
Farmer’s marketX6000500130Paved area with steel roofConcrete pavement tiles
Source: own elaboration.
Table 7. Summary of Life Cycle Assessment analysis assumptions for buildings.
Area of AnalysisData Sources and Assumptions
Material quantities (A1–A3)Data inventory based on real reference case buildings and technical buildings’ documentation
Material database: Ecoinvent, GaBi
Environment data source: Environmental Product Declaration (EPD)
Average regional European data if possible. Otherwise, local manufacturer was selected
Building material transport distances (A4)Average European transport distance specific for each material type
Construction and installation process (A5)Average emissions for the construction process were based a general scenario available in the calculation tool
Material service lifetime (B4–B5)According to the Environmental Product Declaration (EPD)
Building use phase energy consumption (B6)Energy consumption was based on the real measured data of different stores. Emissions from grid electricity were calculated according to the European energy mix
End-of-Life Stage (C1–C4)Based on a scenario provided in the calculation tool
Total lifetime TLT40 years
Source: own elaboration.
Table 8. Energy use and refrigerant indicators for defined outlet types.
Outlet Type Heating (kWh/(m2 year))Electricity (kWh/(m2 year))Amount of Refrigerant (kg/m2)Annual Refrigerant Leakage (%)
Small store1144630.310
Medium store652800.215
Large store652800.120
Wholesale market37172--
Farmers’ market-38--
Source: own elaboration.
Table 9. Assumptions applied to transportation vehicles.
Vehicle TypeMass of the Vehicle (Tons)Load Capacity (Tons)Use of Fuel (l/100 km)Maximum Mileage (km)
Heavy Goods Vehicle8.221.0033.01,000,000
Light Goods Vehicle1.71.5011.0500,000
Passenger car1.40.35 (5 persons)8.0250,000
City Bus14.03.20 (45 persons)32.01,300,000
Source: own elaboration.
Table 10. Food Miles and transportation-related data for food supply chains in the sample.
Supply ChannelsNet Food Miles Use of Fuel [L/kg]
Average [km/kg]Of Which P2R [%]Of Which R2C [%]P2RR2C
a. Pick-your-own6.040.0100.0-0.474
b. On-farm sales to consumers3.750.0100.0-0.300
c. Internet sales—courier deliveries0.15100.00.00.021-
d. Direct deliveries to consumer1.65100.00.00.177-
e. Sales on farmer’s markets1.3632.167.90.0400.058
f. Direct deliveries to retail0.4961.039.00.0310.012
Short Chains Total1.2524.275.8xx
g. On-farm sales to intermediaries0.2629.270.80.0160.012
h. Sales on wholesale market0.6268.631.40.0560.012
i. Sales to hypermarket chains0.6724.775.30.0210.036
Long Chains Total0.5341.063.4xx
Total0.7931.368.7xx
Source: own elaboration.
Table 11. Eco-efficiency LCA indicators assessed for short and long food supply chains (kg emissions/kg of product).
Category of Supply ChainsCategory of Environmental Impacts
Global WarmingAcidificationEutrophicationOzone Depletion PotentialPhotochemical Oxidant Creation PotentialNon-Hazardous Waste Disposed
kg CO2e 10−3 kg SO2e 10−4 kg PO4e10−7 kg CFC11e 10−4 kg C2H4e10−2 kg
Short chains
a. Pick-your-own1.544.025.442.502.426.75
b. On-farm sales to consumers0.972.543.441.581.534.27
c. Internet sales—courier deliveries0.070.130.270.120.130.18
d. Direct deliveries to consumer0.641.222.111.021.191.88
e. Sales on farmers’ markets0.491.582.250.691.034.44
f. Direct deliveries to retail0.331.241.740.430.751.31
Long chains
g. On-farm sales to intermediaries0.240.921.410.300.541.56
h. Sales on wholesale market0.401.292.000.550.851.80
i. Sales to hypermarket chains 0.331.151.740.460.702.29
AVERAGE0.381.261.850.530.781.99
Source: own calculation.
Table 12. Share of transport among eco-efficiency LCA indicators for short and long supply chains.
Global WarmingAcidificationEutrophicationOzone Depletion PotentialPhotochemical Oxidant Creation PotentialNon-Hazardous Waste Disposed
kg CO2e10−3 kg SO2e10−4 kg PO4e10−7 kg CFC11e10−4 kg C2H4e10−2 kg
SFSCs79.2%66.3%65.7%85.3%71.4%54.8%
LFSCs53.6%32.9%35.9%63.3%42.6%30.8%
Sample62.9%45.0%46.7%71.3%53.1%39.5%
Source: own calculation.

