Article

Parametric Design to Maximize Solar Irradiation and Minimize the Embodied GHG Emissions for a ZEB in Nordic and Mediterranean Climate Zones

1
Department of Engineering, CIRIAF—Interuniversity Research Center on Pollution and Environment “Mauro Felli”, University of Perugia, 06125 Perugia, Italy
2
Department of Civil and Environmental Engineering, Faculty of Engineering, Norwegian University of Science and Technology, 7491 Trondheim, Norway
3
SINTEF Community—Architecture, Materials, and Structures, 7491 Trondheim, Norway
*
Author to whom correspondence should be addressed.
Submission received: 4 August 2020 / Revised: 7 September 2020 / Accepted: 15 September 2020 / Published: 22 September 2020
(This article belongs to the Special Issue Life Cycle Thinking for a Sustainable Built Environment)

Abstract

:
This work presents a validated workflow based on an algorithm developed in Grasshopper to parametrically control the building’s shape, by maximizing the solar irradiation incident on the building envelope and minimizing the embodied emissions. The algorithm is applied to a zero-emission building concept in Nordic and Mediterranean climate zones. The algorithm enables conducting both energy and environmental assessments through Ladybug tools. The emissions embodied in materials and the solar irradiation incident on the building envelope were estimated in the early design stage. A three-steps optimization process through evolutionary solvers, such as Galapagos (one-objective) and Octopus (multi-objective), has been conducted to shape the most environmentally responsive ZEB model in both climates. The results demonstrated the replicability of the algorithm to optimize the solar irradiation by producing an increment of solar incident irradiation equal to 35% in the Mediterranean area, and to 20% in the Nordic climate. This could contribute to compensate the additional 15% of emissions due to the higher quantities of employed materials in the optimized design. The developed approach, which is based on the parametric design principles for ZEBs, represents a support instrument for designers to develop highly efficient energy solutions in the early design stages.

1. Introduction

The environmental impact of buildings on the global energy demand and atmospheric greenhouse gas (GHG) emissions has rapidly increased during recent decades. According to the Intergovernmental Panel on Climate Change (IPCC) [1], the building sector is responsible for over 40% of the global energy consumption and 18% of GHG emissions. The Fifth Assessment Report of IPCC describes buildings as a critical issue in the low-carbon energy transition and a global challenge to a sustainable development. Current technology in the building industry offers already available and highly cost-effective solutions to achieve a considerable reduction in energy demand and GHG emissions. In recent decades, the regulations and national building standards have focused on lowering the operational energy consumption [2,3,4]. In the Energy Roadmap 2050 published by the European Climate Foundation, five de-carbonization scenarios were proposed and these highlighted the importance of having an efficient use of on-site renewable energy sources (RES) [5]. In response to that, the concepts of net zero-energy buildings (NZEB) and zero-emission buildings (ZEB) were developed to face the challenges of reducing energy consumption and GHGs, and increasing the on-site production of energy from RES.
The paper is structured as follows. The Background (Section 2) is articulated around three sub-sections describing the main research topics (Section 2.1, Section 2.2 and Section 2.3). The Methodology (Section 3) is divided into two sub-sections: in the first sub-section, the workflow is presented, while in the second sub-section, the case study is described (Section 3.1 and Section 3.2). In the Results and Discussion (Section 4), the outcomes referring to the reference model, the exposure optimization process, and the responsive ZEB for each climate zone (Section 4.1, Section 4.2 and Section 4.3) are presented and discussed, then the evolutionary process is outlined (Section 4.4) and the limitations of the study are highlighted (Section 4.5). Finally, the Conclusions and Future Developments summarize the resulting knowledge generated and the implications of this work (Section 5).

2. Background

2.1. Towards GHGs Reduction: Zero-Emission Buildings

An NZEB is defined as a building with high energy efficiency, which can generate on-site as much energy from RES as it needs to cover its operational energy consumption on an annual basis. In that regard, relevant contributions to its definitions [6,7,8] are here included, such as the work done in the framework of the International Energy Agency (IEA) “Solar Heating and Cooling (SHC) Task 40 Net Zero Energy Solar Buildings”, in which the state of the art of zero-energy buildings and their classifications have been provided. Up to 30 net zero-energy buildings worldwide were analyzed and monitored for at least 12 months to define the best practices and develop design guidelines [9,10,11,12,13]. Other definitions of net zero-energy buildings are in the study conducted by Marszal et al. [14]. Methodologies for calculating the performance of ZEBs are described in the same research by integrating aspects of the life cycle assessments (LCA), as in [15,16]. The work conducted by Torcellini et al. [8] proposed a different categorization of ZEBs into four clusters based on boundary conditions, performance, and metrics. In Lund et al. [17], the ZEBs are grouped according to energy demand and installed systems for energy production.
The ZEBs implement both passive and active strategies. The use of RES and their integration on building components is rapidly growing worldwide [18]. The data reported from the IEA showed that the total installed production capacity of photovoltaic systems (PV) has grown with an average rate of 49% per year during the last ten years [19], and, similarly, an increment of 12% per year has been registered for solar thermal (ST) plants [20]. Furthermore, the growing interest toward bioclimatic and solar houses is demonstrated by numerous studies on the exploitation of solar irradiation for passive strategies [21,22,23,24,25,26]. The concept of a zero-emission solar house (ZESH) was proposed by Oliveira et al., 2017 [27], who developed the Ekó House ZEB concept, starting from the aforementioned classification proposed by Torcellini et al. [8].
This study aims at proposing a new parametric approach to optimize a ZEB residential design in the early design stage. The optimization strategies are pursued by maximizing the solar energy potential and minimizing the embodied emissions in the construction stage. The workflow is based on an algorithm for the multi-objective optimization of passive and active strategies and real-time evaluation of embodied and operational emissions. This workflow was tested in both Mediterranean and Nordic climate zones.

2.2. Parametric Design for Multi-Objective Optimization

The parametric-driven approach allows multi-objective optimization processes to define the optimized building shape configurations, simultaneously and automatically. Similar approaches have been adopted in other studies (Table 1). The research conducted by Yun Kyu [28] proposed a method to represent building geometry by implementing agent points (nodes), and showing a novel solution for building geometry construction. Such a workflow leads to design more energy-efficient buildings, with a better exploitation of solar radiation impinging on the building envelope. A similar approach has been developed by Lobaccaro [29]. By contrast, the study carried out by Zani [30] described a generative algorithm for handling varying hypotheses on user occupancy that can influence building energy performance.
Recently, the use of parametric tools has also been adopted for the calculation of a number of other performance aspects in addition to solar radiation, such as the emissions from operational energy use and embodied emissions of materials [31,32,33]. Some studies led to the development of new methodologies that allow multi-objective optimization for energy and/or environmental assessments [34,35]. Nevertheless, to develop a parametric approach to conduct fast and simplified LCA analyses during the early stage of the design process is critical for ZEB designs. In this regard, Hollberg implemented an algorithm in Grasshopper to conduct LCA studies on a building’s components [36]. However, it did not allow for a free control of the building’s shape but only a minimal control was possible through few parameters, such as the number of levels and the building footprint.

2.3. Solar Irradiation at Different Latitudes

Nordic and Mediterranean climate zones largely differ due to the available solar irradiance and the annual sun path’s distribution. The Scandinavian region has been considered, for a long time, an area characterized by a low solar potential compared to Central Europe. Nevertheless, recent studies demonstrated that some of these common assumptions were incorrect [46]. Jones and Underwood [47] presented the data collected by two sun tracking systems installed in Piteå (Sweden) and Freiburg (Germany) and the results proved that they receive almost the same annual global solar irradiation [46,48], although the distribution through the year is different. Those studies documented the growing interest in solar energy exploitation in the Scandinavian countries, and in this regard, the research carried out by Lobaccaro et al. [49] and Imenes et al. [50] is worth being mentioned.
In this paper, the weather data collected in Oslo (OS) (Norway) were chosen as representative of the Nordic climate zone. Oslo is classified according to the Köppen–Geiger classification as a “Warm Summer Continental Climate”. However, Oslo is located on the very edge of this climate area and it is characterized by some regular snow during winter with an average annual temperature of 6.7 °C. For the Mediterranean area, characterized by larger available solar irradiation, the sun path shows higher values of the azimuth angle compared to the Scandinavian region. The solar irradiation incident on a horizontal surface is higher, although the daylight hours throughout the year are almost the same, according to the monitoring campaign conducted by Castaldo et al. [51]. The city of Perugia (PG) (Italy) has been set as the location for the Mediterranean climate zone. The city belongs to the climate zone classified as “Cfb—Marine West Coast Climate” according to the Köppen–Geiger climate classification [52].

3. Methodology

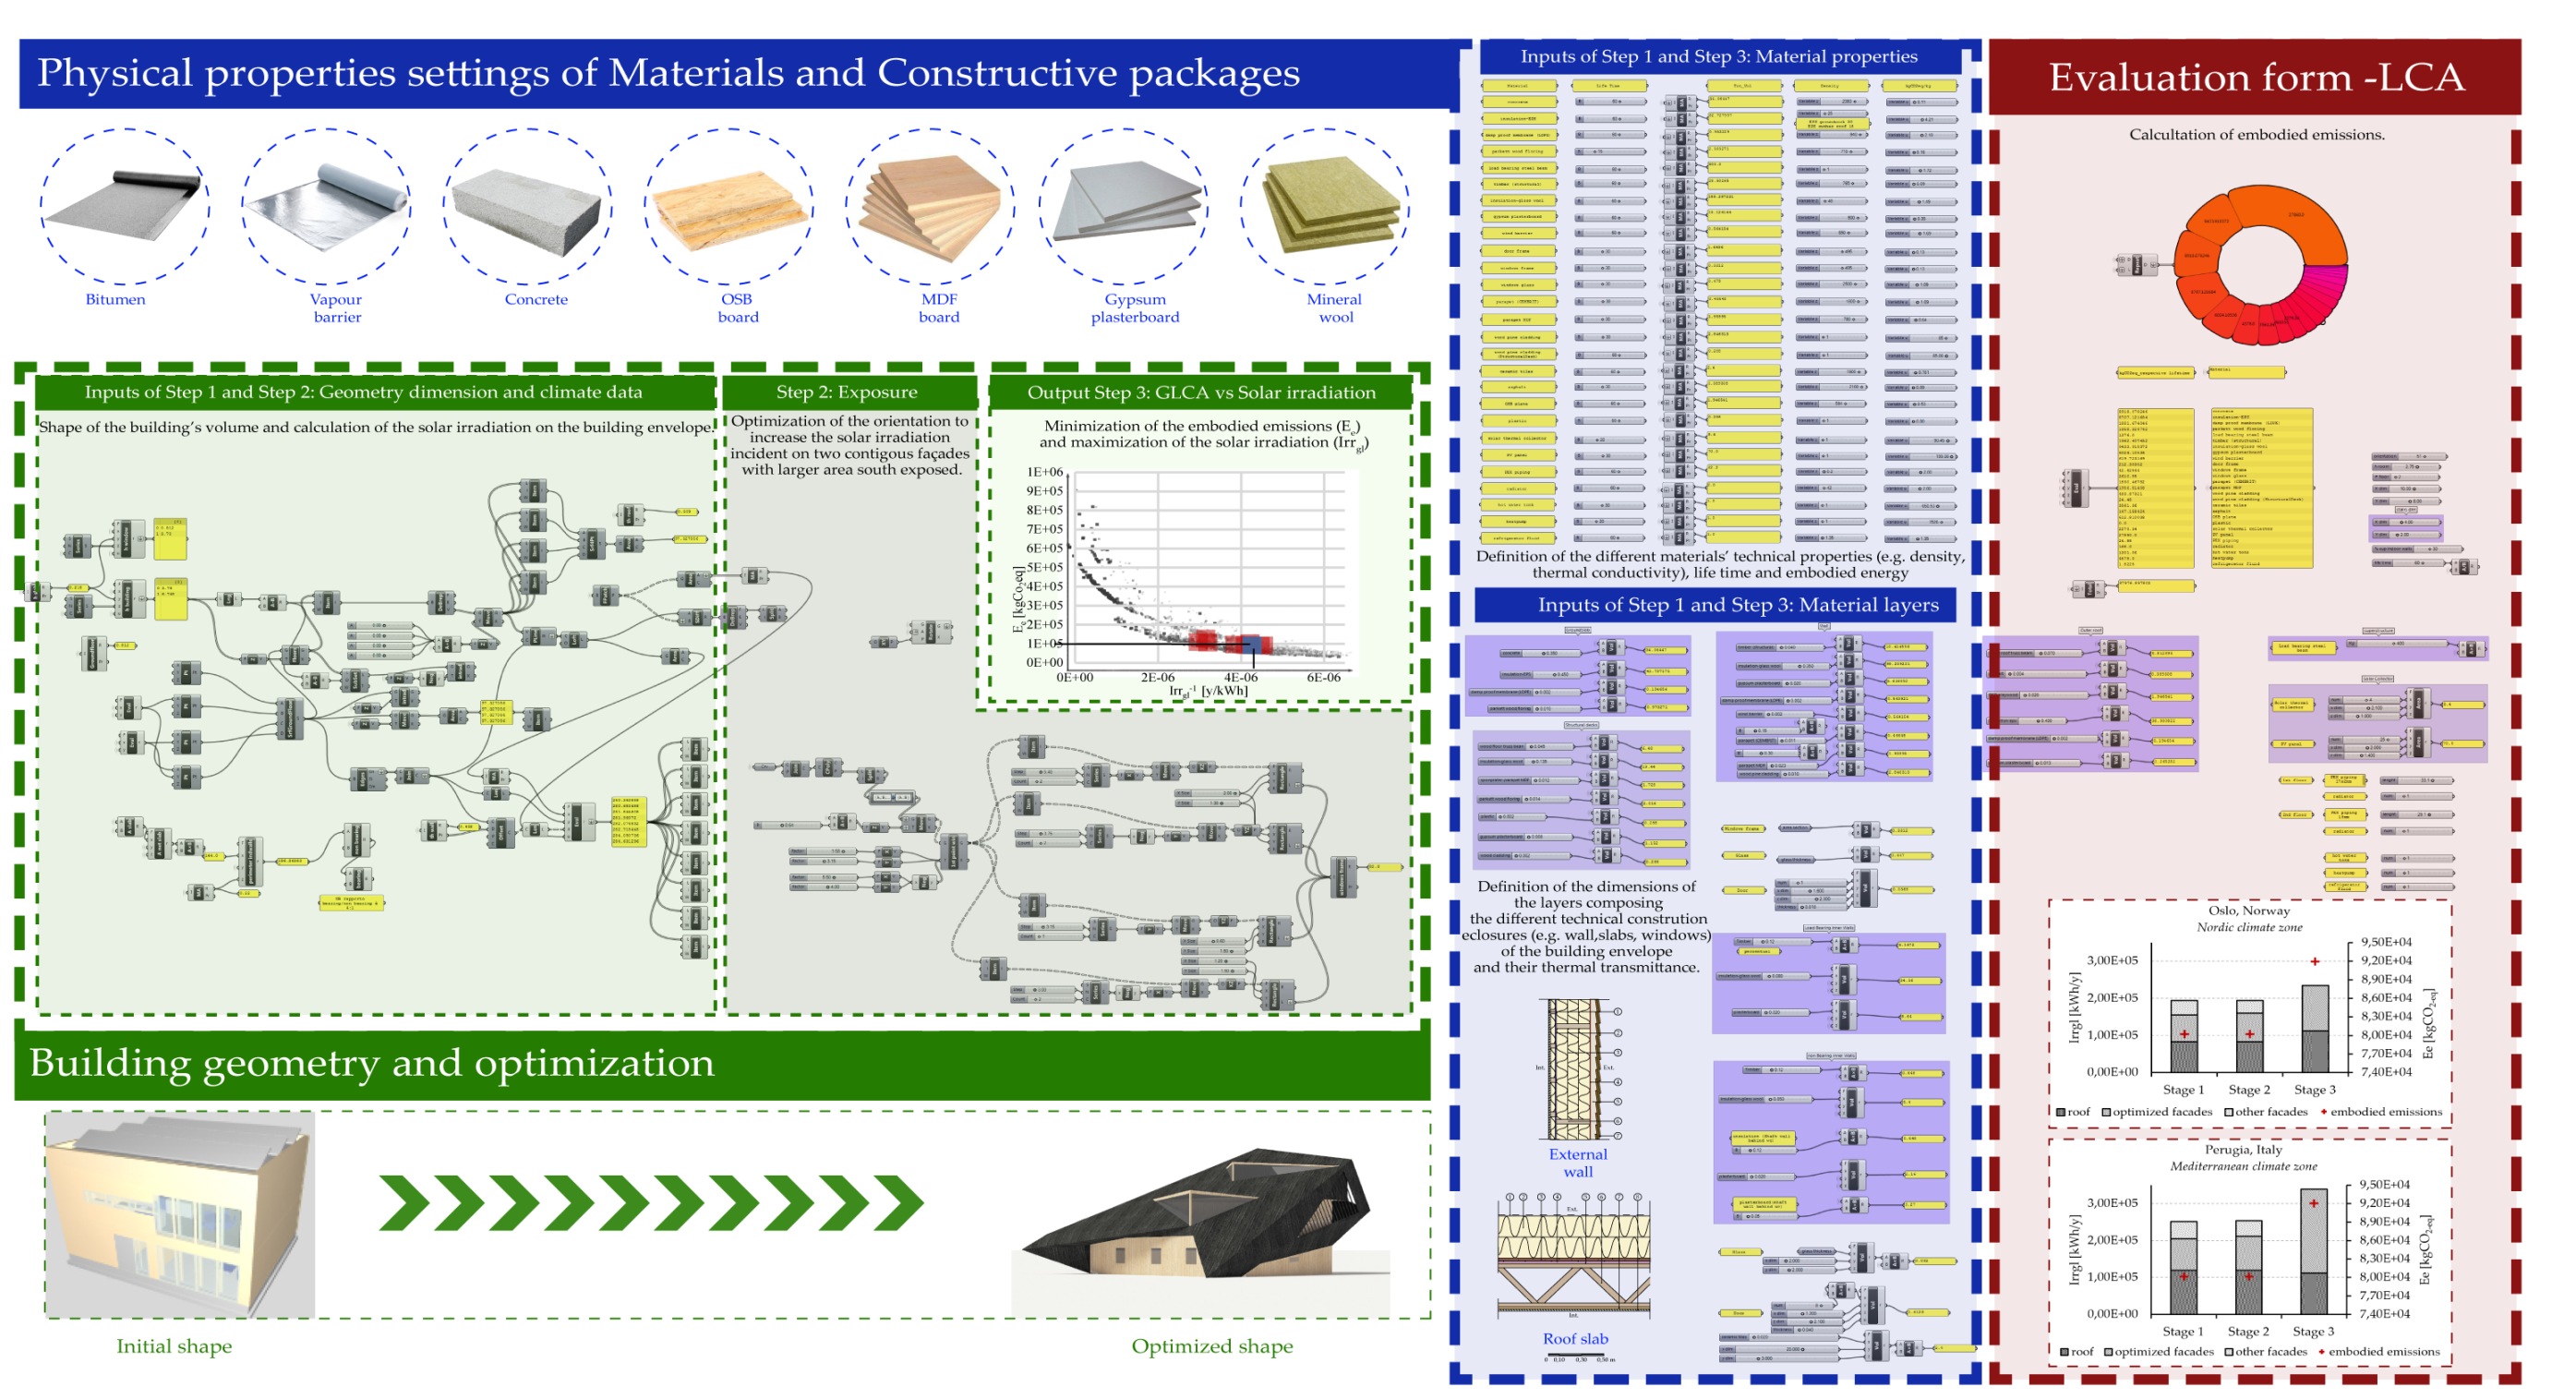
3.1. Multi-Objective Optimization Workflow

This paper presents a workflow based on an algorithm defined through Grasshopper (Figure 1). Grasshopper is a parametric design tool based on Python scripts. It allows the implementation of different algorithms for parametric design by means of a visual programming interface. In this study, an algorithm implemented in a previous study [35] was used to parametrically control the building’s volume of a ZEB Base Case (presented in Section 2.2). The algorithm allows conducting both solar irradiation analysis and environmental impact calculation to optimize the building’s shape according to two objective functions: (i) maximization of the solar irradiation (Irrgl) harvesting on the building envelope and (ii) minimization of the embodied emissions (Ee) due to the employed building’s materials. The calculations are performed for all the design configurations. The inputs and outputs data, and the tools used to control the geometry (Gm) in each step of the workflow are shown in Table 2.
The workflow is based on an algorithm that applies parametric transformations to evaluate the solar and environmental optimization of the building shape in the early design stage. It is structured in three steps.
In Step 1, the Base Case was modeled through a parametric approach followed by the calculation of the building’s materials’ embodied emissions, and the global solar irradiation on the envelope. The Evaluation component of Grasshopper was used to conduct the GHG analysis in terms of embodied emissions for each model configuration. This made it possible to control several material properties to evaluate the impact of the materials and technologies on the building’s total embodied emissions. The system boundaries used for the GHG analysis are defined according to EN 15804; specifically, the stages A1–A5, B4, and B6 have been used. Stage B4 (replacement of building components) was applied only to the PV system, which has a service life of 30 years (Table 3).
According to the Norwegian Standard 3940:2012 [53], the building lifetime was set to 60 years, while the functional unit, used for referring to the energy and environmental impact, is 1 m2 of HFA. The emission factors of the building materials were retrieved from the Norwegian Environmental Product Declarations (EPD) (www.epd-norge.no) when possible, or alternatively, the information was collected from the Ecoinvent 3.0 LCA database. The emission factors were integrated in the algorithm with the other parameters specifically developed to control the variation of the building’s geometry and components. In fact, Step 1 of the GHG analysis is strictly connected to the building’s geometry: the volumes and the masses of the employed building materials were estimated and constantly updated during the optimization process; then, they were converted into carbon emissions by using the emission factors. The GHG emissions of the technical installations (heat pump, boiler, radiator, etc.) were calculated by multiplying the number of technical components by the emission factors of each component. A third cluster of parameters was introduced in Grasshopper to calculate the annual global solar irradiation incident on the building’s envelope. This solar irradiation analysis was carried out by using the Ladybug plug-in. Iterative grid-based analyses visualized in radiation maps were performed by setting “r-trace” parameters in Radiance (Table 4) in accordance with similar previous studies [54].
Two different weather files—the .epw files of Perugia (Italy) and Oslo (Norway)—were used as inputs to define reference values for the Base Case, which are later compared to the optimized configurations carried out from Step 3.
In Step 2, the orientation of the ZEB Base Case model and the exposure of its façades were optimized to increase the south exposed area for the installation of the building-integrated photovoltaic (BiPV) panels. Such an optimization process aims to develop a configuration with the highest incident solar irradiation on two contiguous façades by varying the building’s orientation and façades’ exposure. The box-shaped dwelling (the Base Case) was rotated by 90° by incremental angle steps of 1 degree. The optimization was conducted by coupling Ladybug with the Galapagos evolutionary solver to generate the optimized configurations in terms of global incident solar irradiation on two contiguous façades (fitness). The optimization process starts by creating an initial population of the optimized building orientation and façades’ exposure through multiple-crossovers mutations and with random combinations of genes. The best solutions according to the fitness criteria (i.e., highest solar irradiation on two contiguous façades) are selected. Then, the process is repeated. The optimization process runs until the final population of optimized building shapes has been generated. The analysis was conducted on both the Mediterranean and the Nordic climate zones.
In Step 3, the parametric transformations of the Base Case’s shape were introduced in the workflow. The shape’s variations represent the core of this part of the work, in which parametric design principles are applied. In fact, the shape configuration of the Base Case is controlled through few control points, whose geometrical positions were moved to find a balance between the maximization of solar irradiation on the building envelope and the minimization of the embodied emissions. Both of them (solar irradiation and embodied emissions) were set as objective functions (fitness) of the evolutionary solver Octopus. Differently from Galapagos, Octopus allows the optimization of several objective functions simultaneously within a single process. The investigated processes were progressively reported on a Cartesian plan, whose axes indicate Ee and Irrgl−1. The mathematical inverse function allowed obtaining a better arrangement of the solutions by locating the best ones close to the origin of the axes. Finally, the comparison between the optimized building shape for the Nordic and the Mediterranean climate zones has been performed.

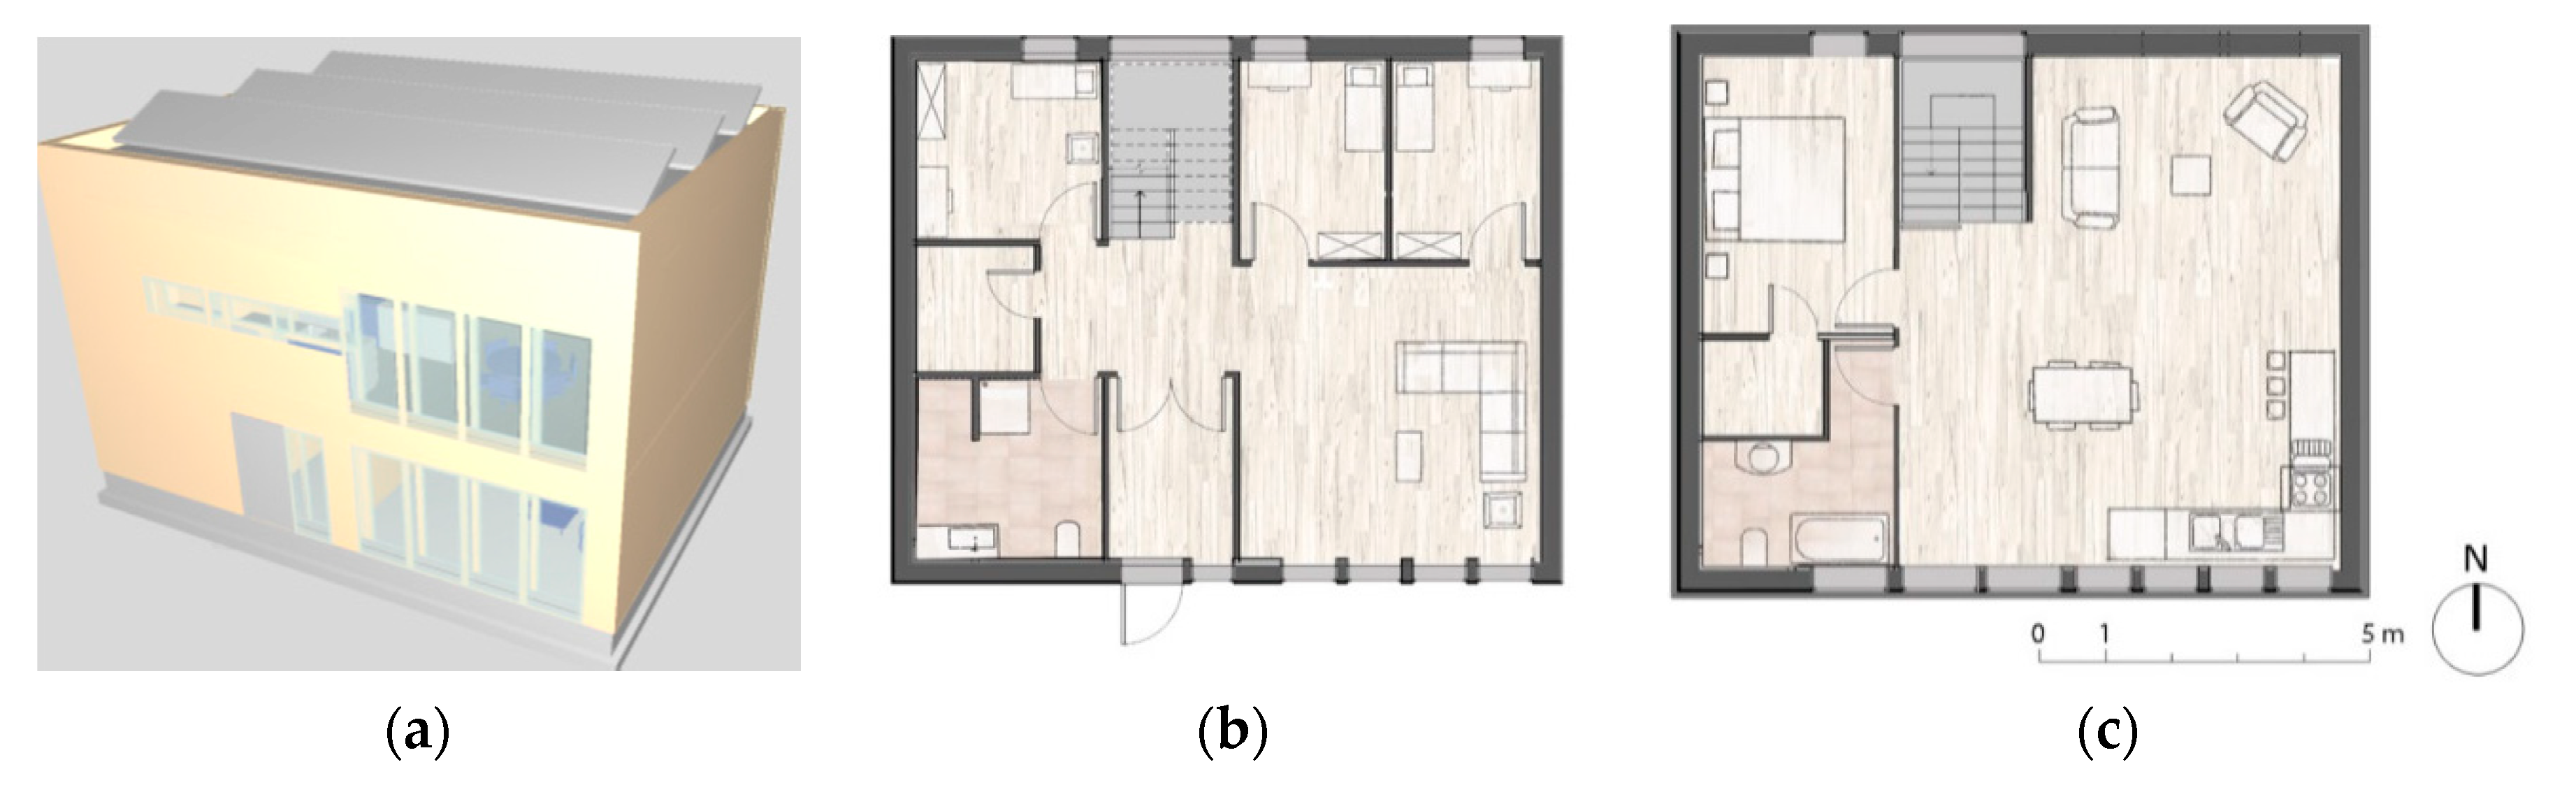
3.2. The ZEB Single-Family House Case Study

The process was applied to a single-family house pilot project in Oslo (Norway) that aims to reach the zero environmental impact in terms of embodied and operational emissions by reducing its energy consumptions (passive approach) and applying efficient energy production strategies (active approach). This concept building, largely described in previous works [56], was used as the Base Case in this study (Figure 2a). The building is a typical Norwegian single-family house and it is arranged in two stories. The building volume is a box shape with a rectangular plan of 10 by 8 m. The longest façades are exposed respectively towards north and south. The house contains four bedrooms and two bathrooms (Figure 2b,c) with a total heated floor area (HFA) of 160 m2.
The embodied emissions for the construction materials are listed in Table 5, while the characteristics of the construction of the Base Case are detailed in Table 6.
The energy requirements are achieved by an air-to-water heat pump integrated with solar collectors on the façade and with a PV system installed on the flat roof. The used module is from the manufacturer SunPower (SPR-3333NE-WHT-D), and it is a monocrystalline cell type with high efficiency (around 20%). The energy production due to the 8.3 m2 of ST has been calculated equal to 3300 kWh/y, while the 69 m2 of the PV system allows it to reach more than 11,000 kWh/y.

4. Results and Discussion

4.1. Step 1, ZEB Reference Model

The embodied emissions of the materials for the Base Case were calculated to be equal to 8.35 kgCO2-eq/m2 HFA per year (80,200 kgCO2-eq, total emissions for 60 years). The global solar incident irradiation on the building envelope was estimated equal to around 194,000 kWh/y in Oslo, while it reached around 250,000 kWh/y in Perugia. In Table 7, the global solar incident irradiation on each façade is reported, as well as its average value on the whole envelope. Already at the early stage, the results highlight how the geographical location can affect the distribution of solar irradiation on the building envelope.
It is worth noting that the lower solar angles in the Nordic region led to a slightly minor irradiation of the roof—only 43% in Oslo against 47% in Perugia—counterbalanced by the increment of the south exposed façade—25% in Oslo against 22% in Perugia. The percentages refer to the annual total global irradiation (Total Irrgl) of the two single cases.

4.2. Step 2, Exposure Optimization of the Box-Shaped Model

The optimization performed in Step 2 demonstrated that the box-shaped model of the Base Case could be more efficient if rotated by 51° (Table 8 and Table 9). Although the total annual global irradiation does not change significantly among the three investigated orientations, the solar energy incident on two contiguous façades—in this case, façade B and façade C (Table 7)—increases by 12% if compared to the 90° rotated model in both climate zones. The algorithm allowed designing a model in which up to 40% of the solar energy is incident on the two contiguous façades B and C. In particular, the solar irradiation incident on façades B and C is equal to 77,400 kWh/y in the Nordic case study, while the Mediterranean achieves 91,900 kWh/y.

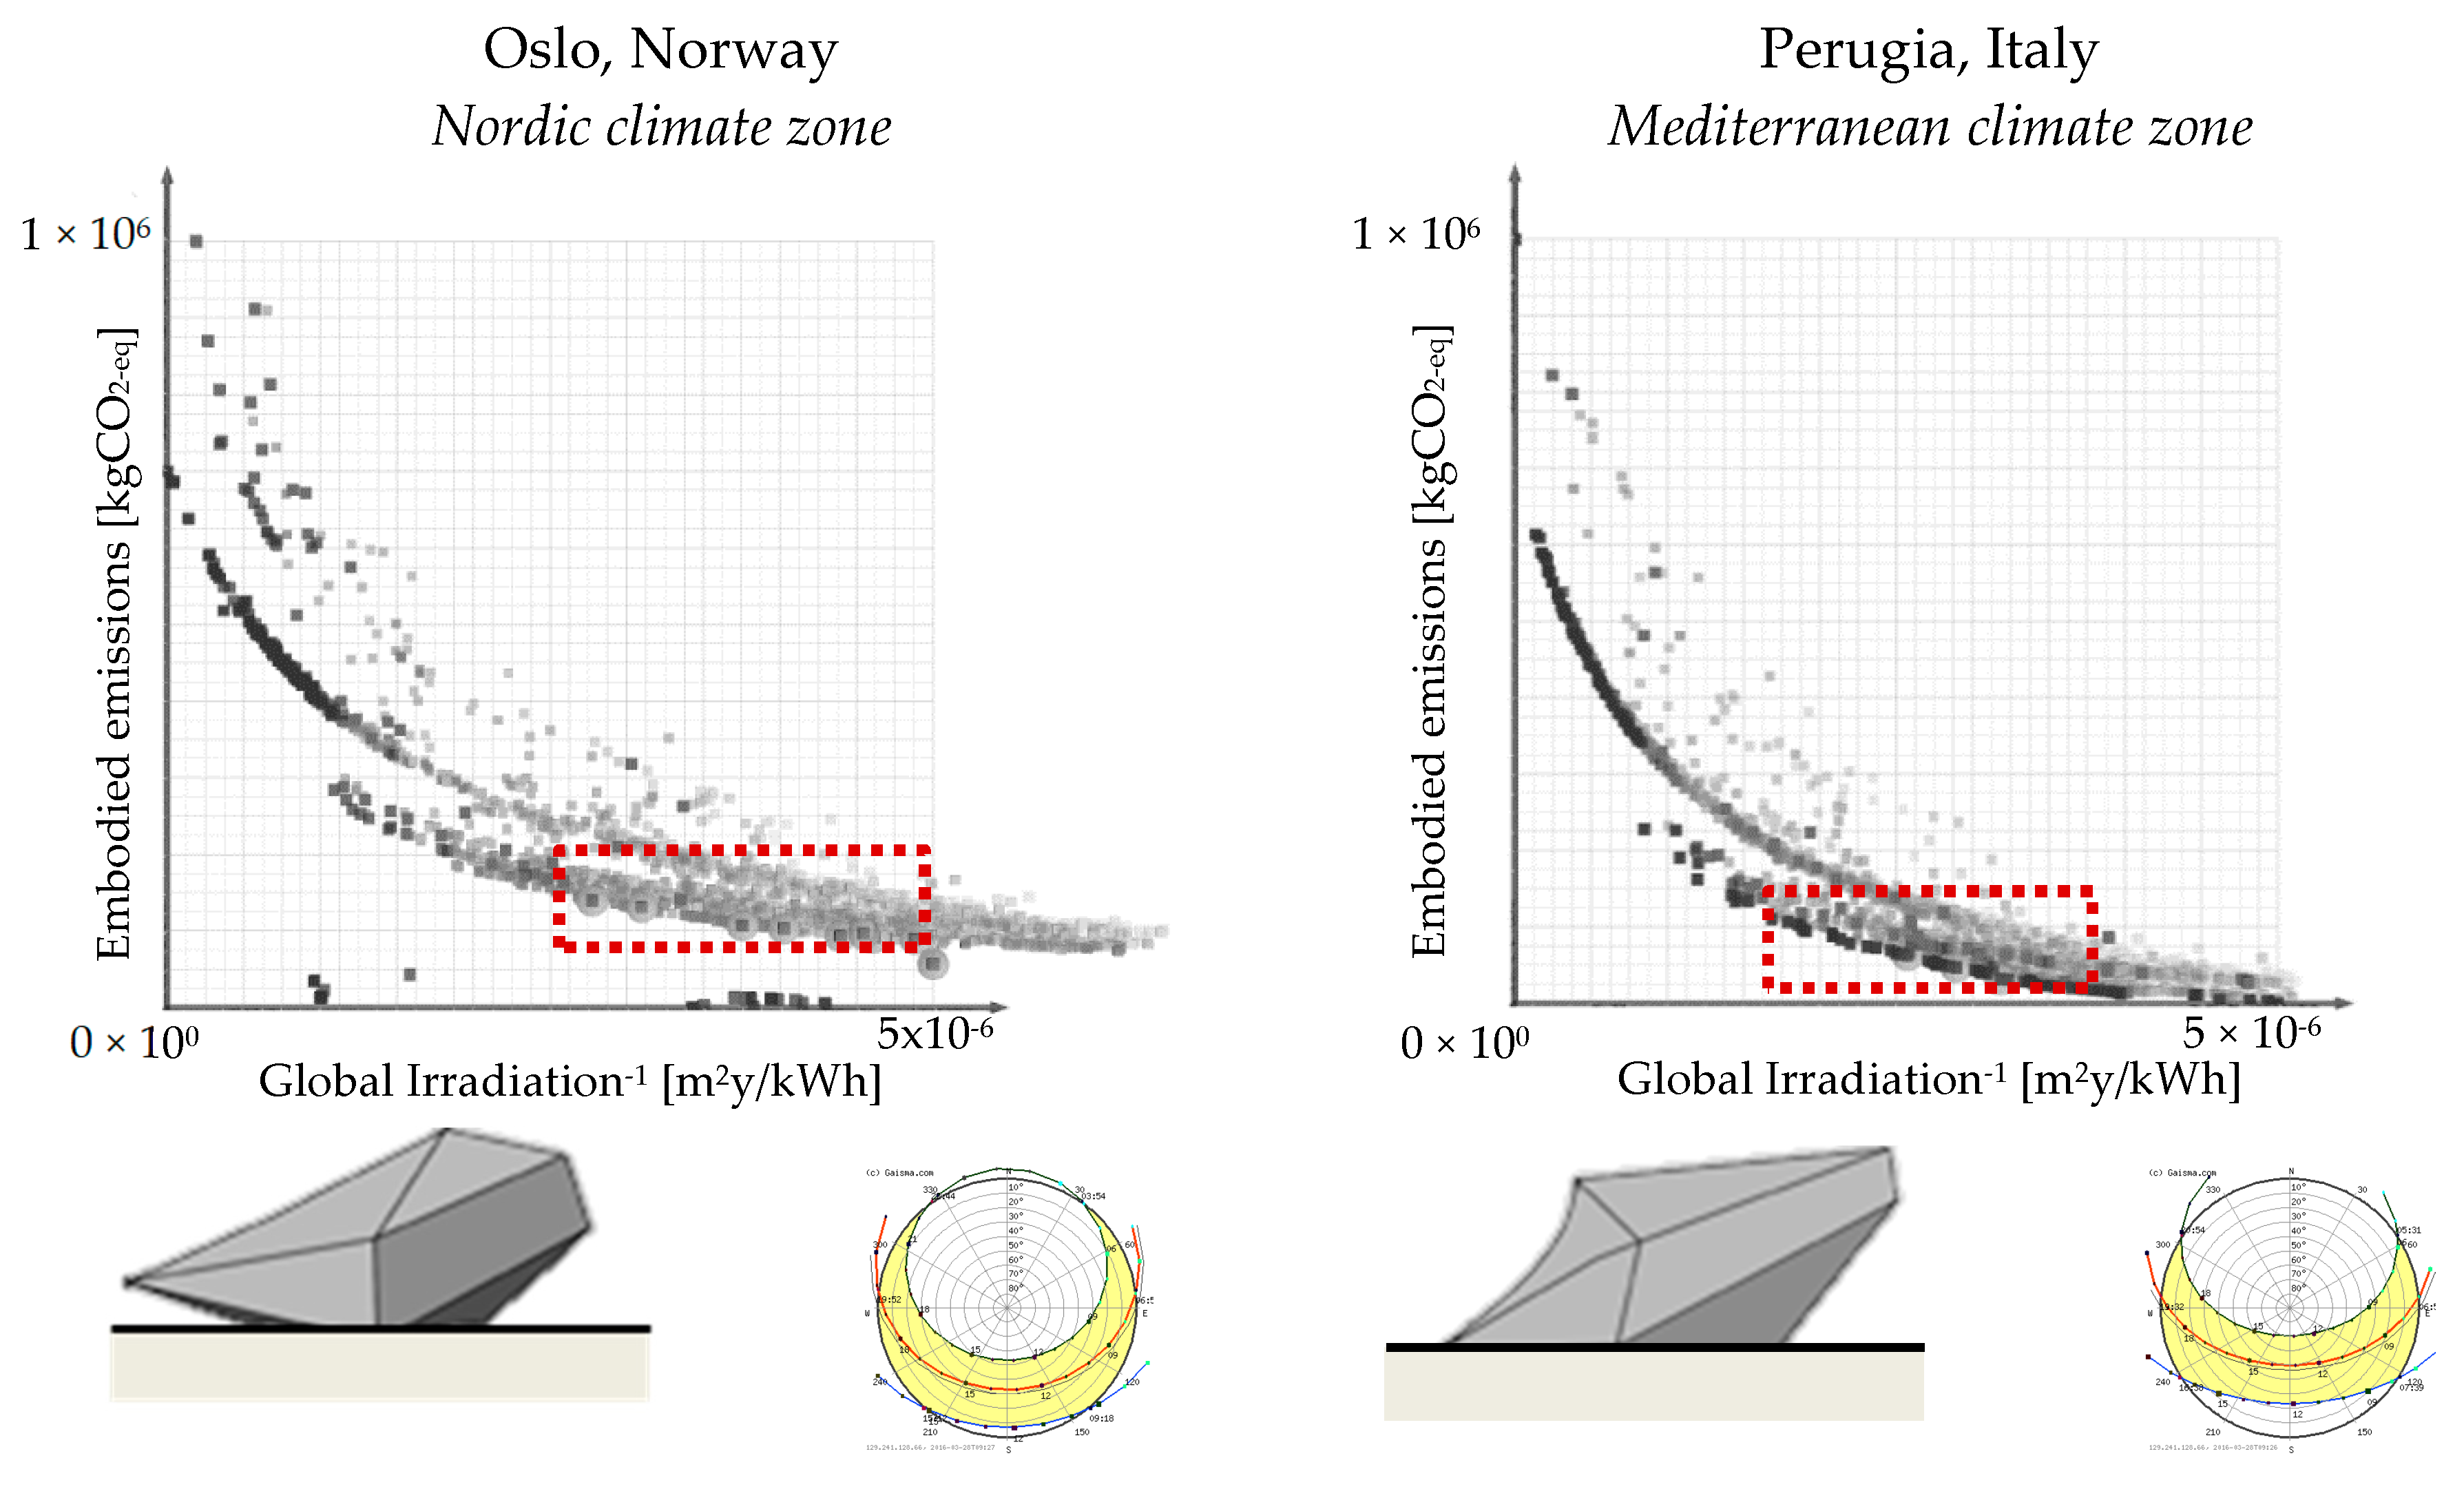
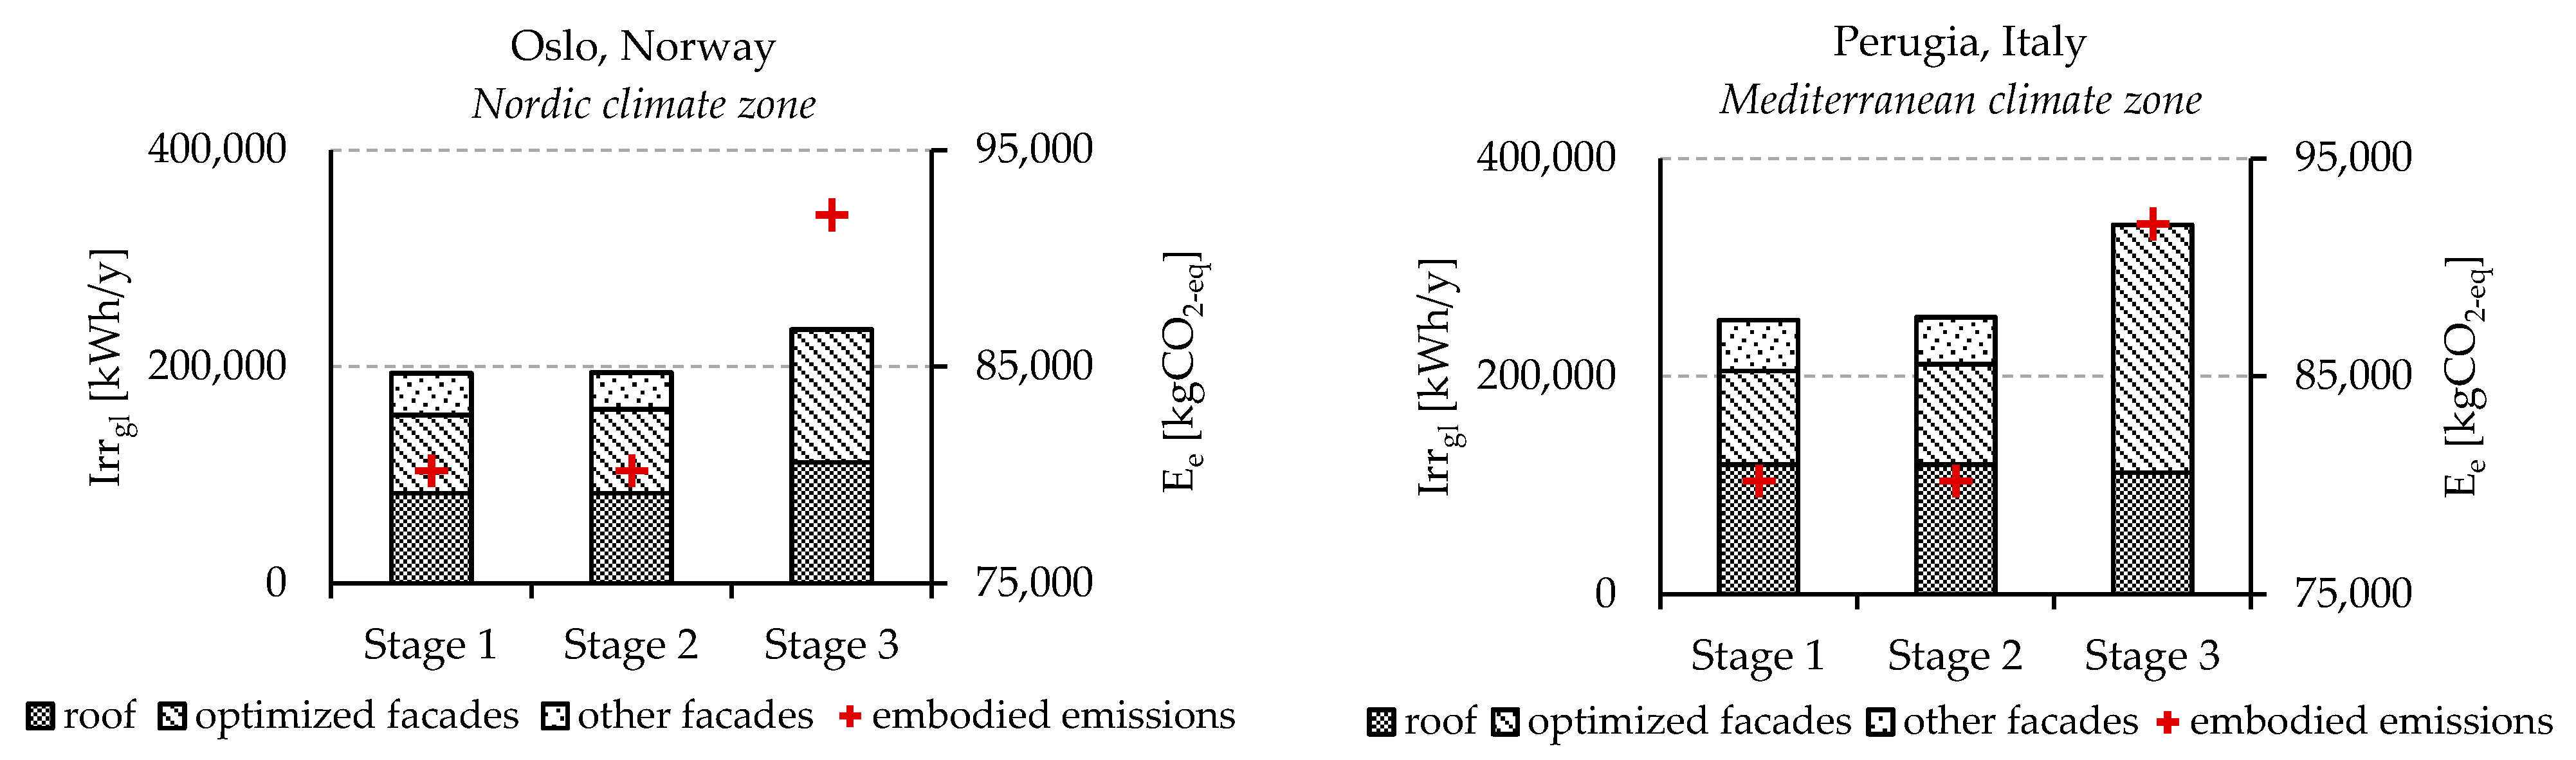
4.3. Step 3, Towards a Responsive ZEB

The outcomes from Step 2 were used as inputs in Step 3, where the ZEB’s shape was modified from the initial box model of the Base Case.
The Octopus evolutionary solver performed a series of iterative assessments that allowed to develop the most environmentally optimal configurations characterized by the lowest impact in terms of embodied emissions from materials. All building configurations are depicted in the graphs reported in Figure 3.
Among those, the two configurations on the bottom (area delimited by the red dashed line in Figure 3) are those best fitting the curve (maximization of solar irradiation on the building envelope and minimization of the embodied emissions). The tilted angles of the main surfaces highlighted how the designed concepts are influenced by the sun paths. The height of the sun at noon in Oslo changes significantly during the year, where it varies from around 55° in the summer to below 10° in the winter.
Differently, the sun height at noon in Perugia varies from 25° in the winter to 70° in the summer. Such a variance of the angles of incidence of solar irradiation during the year shaped the building differently. In fact, while in the Mediterranean climate zone the optimized configuration appears flatter—the main surfaces are characterized by the same tilt angles, about 40° from the horizontal direction—in the Nordic zone, the building envelope of the model turns out to be as vertical as possible—the tilt angles range from 40° to more than 60°.
Figure 3 shows the graphical representation of the outcomes of the multi-objective optimization. The area delimited by the red dashed line included the most optimized configurations designed in Step 3. In fact, the others were characterized by a too high level of embodied emissions or by a shape too flat for being considered dwellings. The optimized volumes and the sun paths used on the process are shown on the bottom of Figure 3. Therefore, as summarized in Table 10, the annual global solar irradiation on the selected optimized shapes varies from 234,500 in Oslo to 339,000 kWh/y in Perugia. The developed algorithm allowed achieving a 20% improvement of solar irradiation in the Nordic climate zone and 35% in the Mediterranean area. This has been achieved by both improving the model’s orientation, façades’ exposure, and incrementing the envelope’s surface area—a factor that penalizes the solar irradiation per square meter compared to Step 2—while maintaining as low as possible the materials’ embodied emissions. The embodied emissions were estimated equal to 92,000 kgCO2-eq for both the optimized configurations: these are 15% higher than those calculated for the reference Base Case. The higher embodied emissions may be/are compensated by both the lower energy requirements for heating and the higher efficiency of the PV panels.

4.4. The Evolutionary Process

The evolutionary process described in this paper and the achieved results have demonstrated the suitability of the parametric design approach to maximize the exploitation of the available solar energy on the ZEB concept model in different climate zones. As highlighted in Figure 4, the magnitude of the enhancement is influenced by the latitude, but even in adverse climates such as the Nordic one, the algorithm allowed to achieve a significant improvement from the Base Case. At the beginning of the study, the concept of the Base Case model located in Oslo was characterized by an incident solar irradiation equal to 194,000 kWh/y, which was increased to 234,400 kWh/y at the end of Step 3. A significant goal was also achieved in Step 2, in which the solar irradiation on two south exposed contiguous façades was increased by 12%. Regarding the ZEB optimized in the Mediterranean zone, the solar irradiation reached 339,000 kWh/y from the initial 251,700 kWh/y. Furthermore, in this case, the optimization conducted in Step 2 allowed to improve the exposure of the best two contiguous façades by 12%. When it came to GHG analysis, the embodied emissions were equal to 80,200 kgCO2-eq in Step 1 and Step 2, and such an amount increased to 92,000 kgCO2-eq at the end of Step 3 in both the climate zones. This increment is caused by the greater envelope’s extension in the optimized configurations if compared to the Base Case.

4.5. Limitations of the Study

It should be noted that the ZEB Base Case was originally designed as a generic concept model for the local climatic conditions of Oslo, and the building was considered a detached house without any urban surroundings. It is relevant to underline that the urban context affects the optimization process and the optimal configuration of the environmentally responsive layout and building volume. The urban context may reduce solar accessibility and the solar energy production. In this respect, the presence of other buildings may affect both the positions and geometry of the solar systems integrated on the building envelope as demonstrated in previous studies regarding the influence of urban complexity and density on solar accessibility and PV localizations [57,58].
Finally, the assessment of the building’s energy performances during the operational stage has not be investigated in this paper, as further and detailed analyses regarding this aspect represent part of future developments. The optimized configurations carried out from the optimization process have been slightly adjusted to maintain the original HFA.

5. Conclusions and Future Developments

This work proposes a possible application of the parametric design principles to the development of a ZEB optimized in terms of solar energy potential and embodied emissions due to materials. The proposed methodology finalized to buildings form-finding was developed in the Grasshopper environment: the algorithm integrates the component for conducting environmental analyses (Evaluate component) with the one for energy assessment (Ladybug). Finally, Galapagos and Octopus tools were used as evolutionary solvers. This workflow enables an iterative analysis by dynamically linking each parameter and simultaneously modeling and comparing numerous building configurations. Furthermore, the Grasshopper tool allows visualizing in real-time the optimized model’s layouts from the early design stages, and the related data about annual global solar irradiation and embodied emissions.
The results demonstrated how the algorithm—and the parametric design principles in general—can be considered suitable for ZEB design and optimization. In fact, the solar irradiation caught by the envelope turned out to be increased by up to 35% in the Mediterranean climate zone, with a low variation of embodied emissions that could be fully compensated by the advantages derived from the optimized exposure (low energy requirements for heating, PV plant’s efficiency higher than 20%). Similarly, the ZEB base case located in the Nordic climate zone showed an increment of the Irrgl as high as 20% at the end of Step 3.
The main achievements are summarized as follows:
  • The optimization process of the orientation (Step 2) allows increasing the Irrgl by 12% in both the Nordic and Mediterranean climate zones;
  • The multi-objective optimization from Step 3 led to increase the Irrgl by 20% in the Nordic zone and 35% in the Mediterranean zone;
  • The Ee estimated at the end of Step 3 was increased by a share of 15%.
The proposed innovative workflow and the early results derive from its application in different climate zones. However, there are some future developments which are still under investigation and should allow a better assessment of the optimized models. Furthermore, the operational stage could be introduced in the calculation to have a complete view of the ZEB concept model and to better understand the effect of the optimization process on the whole life cycle of the building. To achieve those goals, the design of the building cannot be interrupted at the preliminary investigation stage of shape and volume, but it would be necessary to go further by arranging the rooms and defining their functions.

Author Contributions

Conceptualization, G.L. and M.M.; methodology, G.L., M.M. and N.L.; software, M.M.; formal analysis, M.M.; investigation, M.M. and G.L.; resources, G.L., M.M. and N.L.; data curation, M.M.; writing—original draft preparation, G.L., M.M. and N.L.; writing—review and editing, G.L., M.M., N.L. and R.A.B.; visualization, M.M.; supervision, G.L. All authors have read and agreed to the published version of the manuscript.

Funding

This research received no external funding and the APC was funded by Norwegian University of Science and Technology—Trondheim (Norway).

Acknowledgments

The authors wish to thank the Norwegian University of Science and Technology (Trondheim, Norway) and the University of Perugia (Perugia, Italy) for having supported the collaboration between the two universities in this work, framed by the EU programme for education, training, youth and sport—ERASMUS+. The authors gratefully acknowledge the support from the Research Council of Norway and several partners through the Research Centre on Zero Emission Buildings.

Conflicts of Interest

The authors declare no conflict of interest.

Nomenclature

Variables
IrrSolar irradiation
EEmissions
HFAHeated Floor Area
UThermal transmittance
Subscripts
glGlobal
eEmbodied
Acronyms
GHG Greenhouse Gas
IPCCIntergovernmental Panel on Climate Change
RESRenewable Energy Source
NZEBNet zero-energy buildings
ZEBZero-Emission Building
IEAInternational Energy Agency
SHCSolar Heating and Cooling
LCALife Cycle Assessment
PVPhotovoltaic
STSolar Thermal
ZESHZero-Emissions Solar House
OSOslo
PGPerugia
GmGeometry
EPDEnvironmental Product Declaration
BiPVBuilding-Integrated Photovoltaic

References

  1. Pachauri, R.K.; Meyer, L.A. Climate Change 2014: Synthesis Report. Contribution of Working Groups I, II and III to the Fifth Assessment Report of the Intergovernmental Panel on Climate Change; Pachauri, R.K., Meyer, L.A., Eds.; IPCC: Geneva, Switzerland, 2014; ISBN 978-92-9169-143-2. [Google Scholar]
  2. American National Standards Institute. Energy Standard for Building Except Low-Rise Residential Buildings; ASHRAE: Atlanta, GA, USA, 2013. [Google Scholar]
  3. Berardi, U. A cross-country comparison of the building energy consumptions and their trends. Resour. Conserv. Recycl. 2017, 123, 230–241. [Google Scholar] [CrossRef]
  4. European Parliament and Council Directive 2010/31/EU of the European Parliament and of the Council of 19 May 2010 on the Energy Performance of Buildings 2010. Available online: https://eur-lex.europa.eu/legal-content/EN/ALL/?uri=CELEX%3A32010L0031 (accessed on 18 September 2020).
  5. European Commission. Communication from the Commission to the European Parliament, the Council, the European Economic and Social Committee and the Committeee of the Regions—Energy Roadmap 2050. 2011. Available online: https://eur-lex.europa.eu/LexUriServ/LexUriServ.do?uri=COM:2011:0885:FIN:EN:PDF (accessed on 18 September 2020).
  6. Berardi, U. ZEB and nZEB (Definitions, Design Methodologies, Good Practices, and Case Studies). 2018. Available online: https://www.researchgate.net/publication/325258523_ZEB_and_nZEB_definitions_design_methodologies_good_practices_and_case_studies (accessed on 18 September 2020).
  7. Pless, S.; Torcellini, P. Net-Zero Energy Buildings: A Classification System Based on Renewable Energy Supply Options; National Renewable Energy Laboratory: Golden, CO, USA, 2010. [Google Scholar]
  8. Torcellini, P.; Pless, S.; Deru, M.; Crawley, D. Zero Energy Buildings: A Critical Look at the Definition; National Renewable Energy Laboratory: Golden, CO, USA, 2006. [Google Scholar]
  9. Garde, F.; Ayoub, J.; Aelenei, L.; Aelenei, D.; Scognamiglio, A. Solution Sets for Net Zero Energy Buildings: Feedback from 30 Buildings Worldwide; John Wiley & Sons: Hoboken, NJ, USA, 2017; ISBN 9783433604663. [Google Scholar]
  10. Voss, K.; Musall, E. Net Zero Energy Buildings—International Projects on Carbon Neutrality in Buildings; Walter de Gruyter: Berlin, Germany, 2011. [Google Scholar]
  11. Donn, M.; Garde, F. Solution Sets and Net Zero Energy Buildings: A Review of 30 Net ZEBs Case Studies Worldwide; John Wiley & Sons: New York, NY, USA, 2014. [Google Scholar]
  12. Cho, J.; Shin, S.; Kim, J.; Hong, H. Development of an energy evaluation methodology to make multiple predictions of the HVAC&R system energy demand for office buildings. Energy Build. 2014, 80, 169–183. [Google Scholar] [CrossRef]
  13. Athienitis, A.; O’Brien, W. Modeling, Design, and Optimization of Net-Zero Energy Buildings; Ernst & Sohn: Berlin, Germany, 2015. [Google Scholar]
  14. Marszal, A.J.; Heiselberg, P.; Bourrelle, J.S.; Musall, E.; Voss, K.; Sartori, I.; Napolitano, A. Zero Energy Building—A review of definitions and calculation methodologies. Energy Build. 2011, 43, 971–979. [Google Scholar] [CrossRef]
  15. Cellura, M.; Guarino, F.; Longo, S.; Mistretta, M. Energy life-cycle approach in Net zero energy buildings balance: Operation and embodied energy of an Italian case study. Energy Build. 2014, 72, 371–381. [Google Scholar] [CrossRef]
  16. Hernandez, P.; Kenny, P. From net energy to zero energy buildings: Defining life cycle zero energy buildings (LC-ZEB). Energy Build. 2010, 42, 815–821. [Google Scholar] [CrossRef]
  17. Lund, H.; Marszal, A.; Heiselberg, P. Zero energy buildings and mismatch compensation factors. Energy Build. 2011, 43, 1646–1654. [Google Scholar] [CrossRef]
  18. Mohajeri, N.; Upadhyay, G.; Gudmundsson, A.; Assouline, D.; Kämpf, J.; Scartezzini, J.-L. Effects of urban compactness on solar energy potential. Renew. Energy 2016, 93, 469–482. [Google Scholar] [CrossRef] [Green Version]
  19. International Energy Agency. Technology Roadmap: Solar Photovoltaic Energy 2014; International Energy Agency: Paris, France, 2014. [Google Scholar]
  20. International Energy Agency. World Energy Outlook 2019; International Energy Agency: Paris, France, 2019. [Google Scholar]
  21. Pajek, L.; Košir, M. Implications of present and upcoming changes in bioclimatic potential for energy performance of residential buildings. Build. Environ. 2018, 127, 157–172. [Google Scholar] [CrossRef]
  22. Raza, M.Q.; Nadarajah, M.; Ekanayake, C. Demand forecast of PV integrated bioclimatic buildings using ensemble framework. Appl. Energy 2017, 208, 1626–1638. [Google Scholar] [CrossRef]
  23. Khambadkone, N.K.; Jain, R. A bioclimatic analysis tool for investigation of the potential of passive cooling and heating strategies in a composite Indian climate. Build. Environ. 2017, 123, 469–493. [Google Scholar] [CrossRef]
  24. Ulpiani, G.; Giuliani, D.; Romagnoli, A.; di Perna, C. Experimental monitoring of a sunspace applied to a NZEB mock-up: Assessing and comparing the energy benefits of different configurations. Energy Build. 2017, 152, 194–215. [Google Scholar] [CrossRef]
  25. Finocchiaro, L.; Lobaccaro, G. Bioclimatic Design of Green Buildings. In Handbook of Energy Systems in Green Buildings; Springer: Berlin/Heidelberg, Germany, 2017; pp. 1–31. ISBN 978-3-662-49088-4. [Google Scholar]
  26. Pignataro, M.A.; Lobaccaro, G.; Zani, G. Digital and physical models for the validation of sustainable design strategies. Autom. Constr. 2014, 39, 1–14. [Google Scholar] [CrossRef]
  27. Oliveira, C.T.; Antonio, F.; Burani, G.F.; Udaeta, M.E.M. GHG reduction and energy efficiency analyses in a zero-energy solar house archetype. Int. J. Low Carbon Technol. 2017, 12, 225–232. [Google Scholar] [CrossRef]
  28. Yi, Y.K.; Malkawi, A.M. Optimizing building form for energy performance based on hierarchical geometry relation. Autom. Constr. 2009, 18, 825–833. [Google Scholar] [CrossRef]
  29. Lobaccaro, G.; Chatzichristos, S.; Leon, V.A. Solar Optimization of Housing Development. Energy Procedia 2016, 91, 868–875. [Google Scholar] [CrossRef] [Green Version]
  30. Zani, A.; Tagliabue, L.C.; Poli, T.; Ciribini, A.L.C.; De Angelis, E.; Manfren, M. Occupancy Profile Variation Analyzed through Generative Modelling to Control Building Energy Behavior. Procedia Eng. 2017, 180, 1495–1505. [Google Scholar] [CrossRef]
  31. Kiss, B.; Szalay, Z. Modular approach to multi-objective environmental optimization of buildings. Autom. Constr. 2020, 111, 103044. [Google Scholar] [CrossRef]
  32. Soflaei, F.; Shokouhian, M.; Tabadkani, A.; Moslehi, H.; Berardi, U. A simulation-based model for courtyard housing design based on adaptive thermal comfort. J. Build. Eng. 2020, 31, 101335. [Google Scholar] [CrossRef]
  33. Adeli, M.M.; Farahat, S.; Sarhaddi, F. Parametric analysis of a zero-energy building aiming for a reduction of CO2 emissions for warm climate. Environ. Sci. Pollut. Res. 2020, 27, 34121–34134. [Google Scholar] [CrossRef]
  34. Lolli, N.; Fufa, S.M.; Inman, M. A Parametric Tool for the Assessment of Operational Energy Use, Embodied Energy and Embodied Material Emissions in Building. Energy Procedia 2017, 111, 21–30. [Google Scholar] [CrossRef]
  35. Lobaccaro, G.; Wiberg, A.H.; Ceci, G.; Manni, M.; Lolli, N.; Berardi, U. Parametric design to minimize the embodied GHG emissions in a ZEB. Energy Build. 2018, 167, 106–123. [Google Scholar] [CrossRef] [Green Version]
  36. Hollberg, A.; Ruth, J. LCA in architectural design—A parametric approach. Int. J. Life Cycle Assess 2016, 21, 943–960. [Google Scholar] [CrossRef] [Green Version]
  37. Cavalliere, C.; Hollberg, A.; Dell’Osso, G.R.; Habert, G. Consistent BIM-led LCA during the entire building design process. In IOP Conference Series: Earth and Environmental Science; IOP Publishing Ltd: Bristol, UK, 2019; Volume 323, p. 12099. [Google Scholar] [CrossRef]
  38. Ramin, H.; Hanafizadeh, P.; Ehterami, T.; AkhavanBehabadi, M.A. Life cycle-based multi-objective optimization of wall structures in climate of Tehran. Adv. Build. Energy Res. 2019, 13, 18–31. [Google Scholar] [CrossRef]
  39. Azzouz, A.; Borchers, M.; Moreira, J.; Mavrogianni, A. Life cycle assessment of energy conservation measures during early stage office building design: A case study in London, UK. Energy Build. 2017, 139, 547–568. [Google Scholar] [CrossRef] [Green Version]
  40. Ylmén, P.; Mjörnell, K.; Berlin, J.; Arfvidsson, J. The influence of secondary effects on global warming and cost optimization of insulation in the building envelope. Build. Environ. 2017, 118, 174–183. [Google Scholar] [CrossRef]
  41. Braulio-Gonzalo, M.; Bovea, M.D. Environmental and cost performance of building’s envelope insulation materials to reduce energy demand: Thickness optimisation. Energy Build. 2017, 150, 527–545. [Google Scholar] [CrossRef] [Green Version]
  42. Pomponi, F.; D’Amico, B. Holistic study of a timber double skin façade: Whole life carbon emissions and structural optimisation. Build. Environ. 2017, 124, 42–56. [Google Scholar] [CrossRef]
  43. Bonomo, P.; Frontini, F.; De Berardinis, P.; Donsante, I. BIPV: Building envelope solutions in a multi-criteria approach. A method for assessing life-cycle costs in the early design phase. Adv. Build. Energy Res. 2017, 11, 104–129. [Google Scholar] [CrossRef]
  44. Ashouri, M.; Astaraei, F.R.; Ghasempour, R.; Ahmadi, M.H.; Feidt, M. Optimum insulation thickness determination of a building wall using exergetic life cycle assessment. Appl. Therm. Eng. 2016, 106, 307–315. [Google Scholar] [CrossRef]
  45. Azari, R.; Garshasbi, S.; Amini, P.; Rashed-Ali, H.; Mohammadi, Y. Multi-objective optimization of building envelope design for life cycle environmental performance. Energy Build. 2016, 126, 524–534. [Google Scholar] [CrossRef]
  46. Boström, T. Solar Power Plants in the North. Available online: https://www.nordicenergy.org/project/solar-power-plants-in-the-north/ (accessed on 6 July 2020).
  47. Jones, A.D.; Underwood, C.P. A thermal model for photovoltaic systems. Sol. Energy 2001, 70, 349–359. [Google Scholar] [CrossRef]
  48. Klitkou, A.; Godoe, H. The Norwegian PV manufacturing industry in a Triple Helix perspective. Energy Policy 2013, 61, 1586–1594. [Google Scholar] [CrossRef]
  49. Lobaccaro, G.; Carlucci, S.; Croce, S.; Paparella, R.; Finocchiaro, L. Boosting solar accessibility and potential of urban districts in the Nordic climate: A case study in Trondheim. Sol. Energy 2017, 149, 347–369. [Google Scholar] [CrossRef]
  50. Imenes, A.G.; Kanters, J. 3D solar maps for the evaluation of building integrated photovoltaics in future city districts: A norwegian case study. In Proceedings of the 2016 IEEE 43rd Photovoltaic Specialists Conference (PVSC), Portland, OR, USA, 5–10 June 2016; pp. 3141–3146. [Google Scholar]
  51. Castaldo, V.L.; Pisello, A.L.; Pigliautile, I.; Piselli, C.; Cotana, F. Microclimate and air quality investigation in historic hilly urban areas: Experimental and numerical investigation in central Italy. Sustain. Cities Soc. 2017, 33, 27–44. [Google Scholar] [CrossRef]
  52. Kottek, M.; Grieser, J.; Beck, C.; Rudolf, B.; Rubel, F. World Map of the Köppen-Geiger climate classification updated. Meteorol. Z. 2006, 15, 259–263. [Google Scholar] [CrossRef]
  53. NS 3940:2012 Calculation of the Areas and Valumes of Buildings. Standards Norway, Oslo, Norway. Available online: https://www.standard.no/en/PDF/FileDownload/?redir=true&filetype=Pdf&preview=true&item=529401&category=5 (accessed on 22 September 2020).
  54. Reinhart, C.F.; Wienold, J. The daylighting dashboard—A simulation-based design analysis for daylit spaces. Build. Environ. 2011, 46, 386–396. [Google Scholar] [CrossRef]
  55. EN 15978:2011 EN 15978. Sustainability of Construction Works. Assessment of Environmental Performance of Buildings. Calculation Method 2011. 2011. Available online: https://infostore.saiglobal.com/preview/is/en/2011/i.s.en15978-2011-lc-2011-11.pdf?sku=1500481 (accessed on 18 September 2020).
  56. Houlihan Wiberg, A.; Georges, L.; Dokka, T.H.; Haase, M.; Time, B.; Lien, A.G.; Mellegård, S.; Maltha, M. A net zero emission concept analysis of a single-family house. Energy Build. 2014, 74, 101–110. [Google Scholar] [CrossRef]
  57. Nault, E.; Peronato, G.; Rey, E.; Andersen, M. Review and critical analysis of early-design phase evaluation metrics for the solar potential of neighborhood designs. Build. Environ. 2015, 92, 679–691. [Google Scholar] [CrossRef]
  58. Kanters, J.; Wall, M. A planning process map for solar buildings in urban environments. Renew. Sustain. Energy Rev. 2016, 57, 173–185. [Google Scholar] [CrossRef]
Figure 1. Overview of the algorithm developed in the Grasshopper environment with the different steps, inputs, and outputs.
Energies 13 04981 g001
Figure 2. View of the zero-emission building (ZEB) Base Case (a), plans of the ground floor (b), and the first floor (c).
Energies 13 04981 g002
Figure 3. Step 3—graphical representation of the outcomes of the multi-objective optimization.
Energies 13 04981 g003
Figure 4. Trend and values of global solar incident irradiation and emissions embodied in materials throughout the optimization process about Oslo and Perugia. In both Step 1 and Step 2—box-shaped model—the exposure of two contiguous façades was optimized. In Step 3, the whole envelope was enhanced, thus the graphs report a null value for the bar of “other façades”.
Energies 13 04981 g004
Table 1. Overview of the existing workflows related to the parametric design for multi-objective optimization.
AuthorsReferenceYearLocationCase StudyInput *ToolsOutput **Visualization
WdGdMpEnLceEeOeIrrDf3DGraphs
Yun Kyu et al.[28]2009USASingle-family houseExcel
Lobaccaro et al.[29]2016TrondheimRow housesRhinoceros; Grasshopper
Zani et al.[30]2017ItalyUniversity campusSketchup; Rhinoceros; Grasshopper; Ladybug; Honeybee; EnergyPlus; Octopus
Kiss et al.[31]2020HungaryGeneric buildingRhinoceros; Grasshopper
Soflaei et al.[32]2020USACourtyard housingRhinoceros; Grasshopper
Mahdavi Adeli et al.[33]2020IranSingle-family houseDesign Builder
Lolli et al.[34]2017NorwayZEB residential single-family houseExcel
Lobaccaro et al.[35]2018NorwaySingle-family houseRhinoceros; Grasshopper; DIVA for Gh; Ladybug; EnergyPlus; Octopus
Hollberg et al.[36]2016GermanySingle-family houseRhinoceros; Grasshopper
Cavalliere et al.[37]2019SwitzerlandGeneric buildingBIM
Ramin et al.[38]2019IranGeneric envelopeN/A
Azzouz et al.[39]2017UKOffice buildingIMPACT
Ylmén et al.[40]2017SwedenApartmentEnergyPlus; Heat 3; Therm
Braulio-Gonzalo et al.[41]2017SpainGeneric envelopeHULC
Pomponi et al.[42]2017UKGeneric envelopeMATLAB; OpenLCA
Bonomo et al.[43]2017UndefinedBuilding Integrated Photovoltaic façadeExcel
Ashouri et al.[44]2016UndefinedGeneric envelopeMATLAB
Azari et al.[45]2016USAOffice buildingAthena Impact Estimator; ANN
* The input values are: weather data (Wd), geometric dimensions (Gd), material properties (Mp), energy standards (En), and life cycle emissions (Lce). ** The output values are: embodied emission (Ee), operational energy (Oe), solar irradiation (Irr), and daylight factor (Df).
Table 2. Overview of the workflow.
Step 1Step 2Step 3
Inputs
-
Geometric dimensions
-
Material properties
-
Material layers
-
Climate data
-
Geographical information
-
Geometric dimensions
-
Climate data
-
Geographical information
-
Shape’s control points
-
Material properties
-
Material layers
-
Climate data
-
Geographical information
WorkflowGeometry
Shape of the building’s volume and calculation of the solar irradiation on the building envelope
Exposure
Optimization of the orientation to increase the solar irradiation incident on two contiguous façades
LCA vs. Solar Irradiation
Minimization of the embodied emissions (Ee) and maximization of the solar irradiation (Irrgl)
OutputssParametric 3D model and analyses of data and visualizationsOptimized exposure with a larger area south exposedOptimized energy and environmentally responsive model
Tools and Analysis-----
GmEeIrrgl--GmEeIrrgl--GmEeIrrgl--
GrasshopperEvaluate for GhLadybugGalapagosOctopusGrasshopperEvaluate for GhLadybugGalapagosOctopusGrasshopperEvaluate for GhLadybugGalapagosOctopus
Table 3. Building life cycle phases according to [55].
Product StageConstruction Process StageUse StageEnd-of-LifeBenefits and Loads Beyond the System Boundaries
A1A2A3A4A5B1B2B3B4B5B6B7C1C2C3C4D1D2D3D4
Raw material supplyTransportManufacturingTransportConstruction installation processUseMaintenanceRepairReplacementRefurbishmentOperational energy use (space heating)Operational energy use (appliances)Operational water useDeconstruction demolitionTransportWater processingDisposalReuseRecoveryRecyclingExported energy/potential
Table 4. Set of “r-trace” parameters.
Ambient BouncesAmbient DivisionsAmbient Super SamplesAmbient ResolutionAmbient AccuracySpecular ThresholdDirect SamplingDirect Relays
31000203000.100.150.202
Table 5. Building elements of the ZEB Base Case included in the LCA calculation [35].
Building ElementsGHG Emissions [kgCO2-eq/m2 HFA Year]
Groundwork and foundations1.44
Superstructure and outer walls1.69
Inner walls0.50
Structural deck0.24
Outer roof0.64
Heating distribution system and units0.65
Ventilation system0.05
Photovoltaic system2.90
Solar thermal system0.24
Total8.35
Table 6. Thermal transmittance value (U-value) of the different building envelope components of the ZEB Base Case.
ElementU—Value [W/m2 K]Composition
External wall0.12Timber-frame wall with 350-mm-thick insulation
Indoor
  • Gypsum plasterboard (15 mm)
  • Wind barrier (0.2 mm)
  • Mineral wool (350 mm) (0.2 mm)
  • Vapor barrier (PE-foil)
  • Vertical timber structure (30 mm)
  • Horizontal timber structure (50 mm)
  • Wood pine cladding (15 mm)
Outdoor
Energies 13 04981 i001
Roof0.10Compact roof with 400-mm-thick insulation
Outdoor
  • Asphalt (15 mm)
  • Mineral wool (400 mm)
  • MDF board (30 mm)
  • Damp-proof membrane (LPDE 0.2 mm)
  • OSB board (15 mm)
  • Wooden trusses (h: 300 mm)
  • OSB board (15 mm)
  • Gypsum plasterboard (15 mm)
Indoor
Energies 13 04981 i002
Internal Slab-Indoor
  • Parquet wood flooring (15 mm)
  • MDF board (15 mm)
  • Mineral wool (200 mm)
  • OSB board (15 mm)
  • Damp-proof membrane (LPDE 0.2 mm)
  • Wooden trusses (h: 300 mm)
  • OSB board (15 mm)
  • Gypsum plasterboard (15 mm)
Indoor
Energies 13 04981 i003
Slab on the ground0.07 (0.06)
The value in brackets considers the thermal resistance of the ground.
Slab on the ground with 500-mm-thick insulation.
Indoor
  • Parquet wood flooring (15 mm)
  • PE foil (0.2 mm)
  • Concrete slab (100 mm)
  • Radon membrane (0.2 mm)
  • EPS (500 mm)
Ground/Soil
Energies 13 04981 i004
Windows0.65Triple-glazed low-energy windows, with insulated frame
Doors0.65Insulated doors
Table 7. Results of the solar analyses conducted during Step 1 on the ZEB concept model.
ZEB Concept Model Energies 13 04981 i005
Weather fileOsloPerugia
kWh/y%kWh/y%
North façade (A)13,700716,0006
East façade (D)24,7001330,90012
South façade (C)48,2002554,80022
West façade (B)24,1001230,90012
Roof83,20043119,10047
Total IrrglkWh/y194,000250,000
Average IrrglkWh/m2y560730
Table 8. Optimization performed by the Galapagos evolutionary solver on solar analyses in Step 2.
Rotation Angle/Exposure0°/Biggest Façade Oriented to South51°/Two Contiguous Façades Oriented to South90°/Smallest Façade Oriented to South
Weather FileOsloPerugiaOsloPerugiaOsloPerugia
Façade AkWh/y13,70016,00019,90025,20030,30037,900
Façade BkWh/y24,70030,90036,30042,40039,30044,700
Façade CkWh/y48,20054,80041,10049,60029,60037,900
Façade DkWh/y24,10030,90014,00017,80011,10013,100
RoofkWh/y83,200119,10083,200119,10083,200119,100
Façades B and CkWh/y72,90085,80077,40091,90068,90082,600
Total IrrglkWh/y193,900251,700194,500254,100193,500252,700
Average IrrglkWh/m2y560730570740560740
Table 9. Advantages and disadvantages of optimization performed by the Galapagos evolutionary solver on solar analyses in Step 2.
Energies 13 04981 i0060°/Biggest façade oriented to south
-
Advantages: maximum façade’s area facing south where there is the highest amount of solar irradiation.
-
Disadvantages: higher variation of total solar irradiation on the different façades
Energies 13 04981 i00790°/Smallest façade oriented to south
-
Advantages: lower variation of the total solar irradiation on the different façades.
-
Disadvantages: minimum façade’s area facing to the south
Energies 13 04981 i00851°/Two contiguous façades oriented to south
-
Advantages: the highest amount of solar irradiation on two contiguous façades. Therefore, the higher façade’s area can be irradiated.
-
Disadvantages: the other two façades received the lowest incoming irradiation.
Table 10. Optimization performed by the Octopus evolutionary solver on solar analysis in Step 3.
Optimized Shape
Weather File/LocationOsloPerugia
kWh/ykWh/m2ykWh/ykWh/m2y
Façades122,600335227,500415
Roof111,800110111,50080
Total Irrgl234,400445339,000495

