Enhanced CH4-CO2 Hydrate Swapping in the Presence of Low Dosage Methanol


1
Center for Energy Resource Engineering (CERE), Department of Chemical Engineering, Technical University of Denmark, 2800 Kgs. Lyngby, Denmark
2
Solid State Chemistry (SSC), Department of Energy Conversion and Storage, Technical University of Denmark, 2800 Kgs. Lyngby, Denmark
*
Authors to whom correspondence should be addressed.
Energies 2020, 13(20), 5238; https://0-doi-org.brum.beds.ac.uk/10.3390/en13205238
Submission received: 7 September 2020
/
Revised: 25 September 2020
/
Accepted: 28 September 2020
/
Published: 9 October 2020
(This article belongs to the Special Issue CO2 Capture, Storage, Utilisation and Sequestration and Hydrocarbon Extraction)
Abstract
:CO2-rich gas injection into natural gas hydrate reservoirs is proposed as a carbon-neutral, novel technique to store CO2 while simultaneously producing CH4 gas from methane hydrate deposits without disturbing geological settings. This method is limited by the mass transport barrier created by hydrate film formation at the liquid–gas interface. The very low gas diffusivity through hydrate film formed at this interface causes low CO2 availability at the gas–hydrate interface, thus lowering the recovery and replacement efficiency during CH4-CO2 exchange. In a first-of-its-kind study, we have demonstrate the successful application of low dosage methanol to enhance gas storage and recovery and compare it with water and other surface-active kinetic promoters including SDS and L-methionine. Our study shows 40–80% CH4 recovery, 83–93% CO2 storage and 3–10% CH4-CO2 replacement efficiency in the presence of 5 wt% methanol, and further improvement in the swapping process due to a change in temperature from 1–4 °C is observed. We also discuss the influence of initial water saturation (30–66%), hydrate morphology (grain-coating and pore-filling) and hydrate surface area on the CH4-CO2 hydrate swapping. Very distinctive behavior in methane recovery caused by initial water saturation (above and below Swi = 0.35) and hydrate morphology is also discussed. Improved CO2 storage and methane recovery in the presence of methanol is attributed to its dual role as anti-agglomerate and thermodynamic driving force enhancer between CH4-CO2 hydrate phase boundaries when methanol is used at a low concentration (5 wt%). The findings of this study can be useful in exploring the usage of low dosage, bio-friendly, anti-agglomerate and hydrate inhibition compounds in improving CH4 recovery and storing CO2 in hydrate reservoirs without disturbing geological formation. To the best of the authors’ knowledge, this is the first experimental study to explore the novel application of an anti-agglomerate and hydrate inhibitor in low dosage to address the CO2 hydrate mass transfer barrier created at the gas–liquid interface to enhance CH4-CO2 hydrate exchange. Our study also highlights the importance of prior information about methane hydrate reservoirs, such as residual water saturation, degree of hydrate saturation and hydrate morphology, before applying the CH4-CO2 hydrate swapping technique.

1. Introduction
Natural gas hydrates (NGHs) are cage-like crystalline compounds formed by the van der Waals-forced inclusion of natural gas molecules in hydrogen-bonded water molecules under high pressure and low temperature conditions [1,2]. NGHs are considered as a potential clean energy source for the future, with up to 230 gas hydrate deposits distributed evenly across the world in marine or permafrost environments. These deposits remain untouched and hold a reserve estimated to be twice the amount of known fossil fuels available [3,4,5]. To produce methane from a gas hydrate reservoir, several techniques have been suggested, including depressurization [6], thermal stimulation [7] and chemical inhibitor injection [8]. In comparison, depressurization is considered as the most cost-effective method to be commercially applied. There are many depressurization techniques that are suggested to optimize gas production, including constant rate depressurization [9], multistage depressurization [10], cyclic depressurization [11,12], slow stepwise depressurization [13,14] and depressurization combined with gas injection [15,16]. As all the above production techniques are based on the decomposition of methane hydrate, catastrophic sediment failures can be triggered with an additional risk of methane release to the atmosphere, accelerating the greenhouse effect due to rapid hydrate decomposition. Utilization of CO2 in natural gas hydrate production by CH4-CO2 swapping was introduced in the 1980s, suggesting CO2-assisted methane recovery from hydrate reservoir and simultaneous CO2 sequestration [17,18]. In 2012, an in situ gas hydrate exploitation field test based on CH4-CO2 exchange was successfully performed on the Ignik Sikumi field [19,20]. A binary CO2 gas mixture was injected into the hydrate-bearing sandstone formation, and CH4 was produced, while CO2 was sequestered in the formation. This suggests the feasibility and commercial viability of the swapping method for simultaneous methane recovery and carbon dioxide capture [21]. Subsequently, producing CH4 from NGHs by gas swapping has gained attention as an important energy resource together with the mitigation of greenhouse gas CO2 in the atmosphere, one of the major global environmental issues that concern humans, while the stability of the formation is not disturbed [22,23].
The driving force behind CH4-CO2 hydrate exchange is the difference in CH4 and CO2 hydrate phase equilibria under hydrate formation conditions. CO2 hydrate is more stable than the CH4 analog under favorable hydrate thermodynamic conditions. Gibbs free energy for the exchange reaction is negative, and thus, the thermodynamic feasibility of the spontaneous replacement reaction of CH4 hydrate by CO2 is justified [24]. CO2 as the preferred guest species in hydrate enclathration was experimentally demonstrated by Ohgaki in a mixed CH4-CO2 hydrate system at 280 K [18]. Methane recovery efficiency was found to be driven by guest species fugacity, where the use of pressurized and liquid CO2 leads to higher methane production [25,26]. The replacement efficiency was studied in the CH4-CO2 process utilizing liquid CO2 and was proposed as a more suitable alternative than gaseous CO2 [26,27,28,29], while similar approaches with CO2 emulsions showed the most favorable efficiency despite the uncertainties in optimal CO2 emulsion conditions [30]. Stanwix et al. [31] reviewed pure CO2 replacement experiments, reporting up to 50% CH4 recovery. There are many hydrate-focused review studies which also provide excellent summaries of CH4-CO2 replacement in hydrates [32,33,34,35,36,37,38,39,40,41,42,43].
However, this method suffers from low methane recovery and CO2 storage efficiency due to various reasons. The exact mechanism during CH4-CO2 exchange is not well understood [33]. It is known that CO2 or CH4 gas molecule diffusivity through solid hydrate (order of 10−13 m2 s−1) is much smaller than their diffusivity through water (order of 10−10 m2 s−1) [41]. Therefore CO2 or CH4 gas molecule transport within the hydrate is one of the controlling factors during CH4-CO2 hydrate swapping and slow reaction [44]. CH4-CO2 swapping initiates when CO2 molecules arrive at the CH4 hydrate surface area and diffuse into the CH4 hydrate. Figure 1 suggests a conceptual framework highlighting CH4-CO2 hydrate swapping. Injected CO2 gas molecules diffuse through two hydrate layers before exchanging with CH4, driven by thermodynamic hydrate stability difference [45]. CO2 gas diffusion distance into the CH4 hydrate is controlled by the CO2 concentration available at the hydrate surface and hydrate surface area [41]. CO2 gas concentration at the hydrate–gas interface is controlled by CO2 gas molecule transport via CO2 hydrate film, pore water and relative gas permeability within sediments. Formation of a thick CO2 hydrate film at the gas–water interface would limit the availability of CO2 gas concentration arriving at the CH4 hydrate surface. In this study, we have focused on delaying this CO2 hydrate layer formation and changing its morphology to enhance CO2 gas concentration at the CH4 hydrate surface with the help of low dosage chemicals. This secondary hydrate film acts as diffusion barrier during CO2 or CH4 transport, causing lower methane recovery and replacement during CH4-CO2 exchange [41,46,47]. Excess water saturation and clay minerals within sediments can further slow-down methane production [48,49].
Different techniques have been used to enhance methane recovery during CH4-CO2 swapping. For example, a CO2 rich gas mixture (CO2-N2) is used in place of pure CO2 [16,50], combined with depressurization [16,51], the presence of hydrate inhibitors [52,53] and thermal stimulation-based CH4-CO2 replacement [54]. Experimental investigations of hydrate inhibitors to enhance CH4-CO2 replacement are very limited. Khlebnikov et al. [52] used two hydrate inhibitors, methanol (30 wt%) and salt (NaCl and MgCl2, 10 wt%), and confirmed their positive effects on CH4-CO2 hydrate swapping. They reported that methanol showed more efficient performance compared to salt. In another study, CH4-CO2 swapping was studied in the presence of a bio-friendly surfactant (rhamnolipid) and found to yield a 10% increase in CO2 storage and 72% increase in the replacement process [55]. Hence, the influence of chemicals such as anti-agglomerates, inhibitors or surfactants on CH4-CO2 exchange requires more extensive study. The presence of a low concentration of surface-active chemicals can potentially enhance the diffusivity of gas molecules through the hydrate film by making it dispersed or by delaying hydrate film formation. Improved gas diffusivity allows higher CO2 concentrations to arrive at the hydrate–gas interface to participate in CH4-CO2 swapping. Additionally, more investigation is required to understand the effects of methane hydrate reservoir properties, including hydrate morphology, hydrate saturation and residual water saturation.
In this study, we have formed CH4 hydrate from gaseous CH4 and in the presence of small concentrations of different surface-active chemicals (surfactant, amino acid and methanol) in water. Pure CO2 was injected into this reservoir to initiate the CH4-CO2 exchange scenario. After a soaking period of 24 h, GC analysis was carried out to measure the change in CO2 and CH4 concentration in the vapor phase. The effects of change in concentration of surface-active chemical, properties of hydrate-bearing sediments (e.g., hydrate saturation and morphology), residual water saturation and change in temperature on CH4 recovery and CO2 storage are calculated.
2. Materials and Methods
2.1. Setup and Materials
In this study, CH4-CO2 exchange was examined using a high-pressure cell (HPC) with fixed volume of 1000 mL and maximum working pressure of 120 bar. A safety valve was also attached to the reactor. The reactor was connected to a cooling bath, gas supply, vacuum pump and ventilation to atmosphere. Figure 2 describes the systematic layout. An analytical grade of pure CH4 and CO2 gas mixture with 99.99% purity was obtained from Air Liquide Company. The solutions used in this study, including sodium dodecyl sulphate (SDS), L-methionine and methanol (MeOH), were acquired from Sigma Aldrich. Liquid solution was prepared for different concentrations using distilled water and details are described in Table 1. A Hewlett-Packard gas chromatographer (HP7890, Agilent, Copenhagen, Denmark) was used to analyze the composition of the gas mixture at different stages. Coarse quartz sand with particle sizes of 0.9–1.6 mm was used as the porous medium.
2.2. Procedure
Figure 3 provides the schematic of the experimental procedure. At the start of the experiment, the reactor was cleaned with distilled water and ethanol. Dry weight of sand was measured and saturated with a given volume of the solution. Sand with desired water volume was placed in the pressure cell, and the height of the sand column was measured. Thereafter, the HPC lid was sealed, and the air inside was evacuated using a vacuum pump or flushed with methane gas to dilute the effect of air inside the cell. After removing the air, the HPC was pressurized with methane gas at 80–85 bar and 25 °C, and the whole system was left idle to let methane gas dissolve into the liquid. After some time, cooling was started, and pressure and temperature was recorded using a data logger. As cooling started inside the pressure reactor, pressure began dropping, suggesting initiation of hydrate formation. When temperature fell below the hydrate formation temperature for a given initial pressure, hydrate was considered to form, suggested by a steep decrease in pressure value followed by stabilized pressure. During the sharp pressure drop, there was spike in temperature profile generated by the temperature sensor located at the top position, indicating that hydrate formation happened first at the top layer. To improve the hydrate saturation and its distribution across the height, multiple heating and cooling cycles were employed. It was also observed that initial liquid saturation was different across the height of the pressure cell due to gravity, as liquid saturation would be higher at the bottom and lower at the top. Due to differences in liquid saturation, heterogeneous hydrate saturation was considered. During the multiple heating and cooling cycles, no temperature spike was observed at the bottom layer, indicating that hydrate never formed at the bottom, even after multiple heating and cooling cycles. The figure below describes the whole experimental process. The first step includes the formation of artificial methane hydrate in sediments in the presence of chemicals. For the base case, water was used. During methane hydrate formation, induction time was measured for both fresh and memory runs to understand the effect of water memory. Multiple heating and cooling cycles were finished in 48–72 h and allowed to stabilize before CO2 gas was injected.
At the end of methane hydrate formation, when pressure was stabilized for more than 24 h, it was considered that methane hydrate was formed. To initiate CH4-CO2 swapping, first, methane vapor was ventilated carefully and then CO2 gas was injected. CH4 gas ventilation and CO2 injection were done quickly. During the ventilation, special care was taken so that pressure inside the cell never dropped below methane hydrate dissociation pressure. This was repeated 2 to 3 times to remove the excess of methane inside the reactor with CO2 gas. CO2 injection pressure was kept constant during the whole study. Gas sample was collected just after CO2 was injected and after the 24-h soaking period to study the variation in CH4 and CO2 moles in the vapor phase.
At this stage, a gas sample was collected to record the moles of methane and CO2 in the vapor phase. Vapor pressure inside the pressure reactor always remained above methane hydrate dissociation pressure; therefore, release of methane hydrate was considered to come from the CH4-CO2 hydrate exchange. The difference in moles in the vapor phase was used to calculate CH4 release and CO2 storage in hydrates.
Figure 4 describes the systematic of the hydrate exchange. As gas was injected from the top of the reactor, residual water saturation available at the top layer reacted with CO2, and CO2 hydrate formed. Further below the CO2 hydrate layer, CO2 concentration started to decrease and methane concentration started to increase in hydrate within mixed hydrate layer. Below the mixed hydrate layer, we found an unreacted methane hydrate layer, not accessible by CO2 molecule due to mass transfer barrier created by CO2 hydrate film and mixed hydrate film as well as low relative gas permeability. It was envisaged that the presence of chemicals could delay the thin CO2 film formation and permit more time for CO2 to reach the methane hydrate surface.
2.3. Experimental Data Processing
Moles of CH4 injected into the pressure cell is calculated as
P1 is the initial operating pressure after methane gas injection into the reactor, V1 is the available gas volume inside the pressure cell, T1 is the recorded experimental temperature by top layer temperature sensor corresponding to P1, R is the universal gas constant, and z1 is the compressibility factor at the given pressure and temperature, calculated from the Benedict–Webb–Rubin–Starling equation of state.
For constant volume processes, V1 remains constant and number of moles of CH4 () after methane hydrate formed is determined by
P2 is the stabilized pressure at the end of the cooling cycle with the stabilized T2 for hydrate formation, and z2 is the compressibility factor for P2 and T2 conditions, respectively.
Thus, the moles number of methane trapped in the solid hydrate crystal due to hydrate formation, , is given by
The mass of the consumed liquid solution () engaged in methane hydrate formation can be calculated as follows:
Here, MH is the molar mass of the water and NH is the hydration number. NH is considered constant for methane hydrate formation with pressure 1.9 to 9.7 MPa and temperature 263 to 285 K. The average hydration number equal to 6.0 was used in our studies. Density of methane hydrate is assumed as 0.9 (g cm−3). Therefore, the volume of hydrate VH (cm3) is calculated as
The hydrate saturation fraction can now be defined by
Vp is pore volume calculated as Vp = Vsp − Vs, Vsp is total sand pack volume inside pressure cell while Vs is the dry sand volume. Furthermore, the percentage of the liquid consumed from hydrate formation, CL, is quantified as
Here, nL is the moles of the water used. During methane hydrate formation, we also calculate the induction time for fresh and memory runs during the repeated multiple heating–cooling cycles as per the technique discussed in our previous publication [56]. Due to formation of hydrate, change in new gas volume available (Vex) for swapping is calculated as below:
Vs,new is the volume of the liquid not converted into hydrate and is calculated as
After methane hydrate formation, CH4 vapor is quickly replaced by CO2 without dissociating methane hydrate. This was done by quickly venting CH4 gas and injecting CO2 simultaneously to initiate CH4-CO2 exchange. Just after the CO2 injection, gas sample was collected to analyze moles of CH4 and CO2 gas available in the vapor phase. To quantify the number of moles after the flushing, nmix,i is calculated as
Here, Pinj is the pressure recorded after CO2 rich gas injection and Tinj is the pressure recorded corresponding to the pressure Pinj at the top layer. Zinj was calculated at a given Pinj and Tinj and for given molar gas composition calculated from gas chromatography calculations. Hence, the moles of each component in the gas phase is calculated by
where and are the molar compositions of the gases collected and determined by gas chromatography.
After an approximately 24-h soaking period, CH4-CO2 hydrate exchange was assumed to have occurred at constant temperature and constant volume condition; gas sample was collected again to analyze the change in molar composition of vapor phase during the soaking period. Total number of moles of gas mixture moles after soaking period nmix,f is determined as
where Pf represents the residual gas phase after soaking period, and Tf is the temperature corresponding to the top layer and at the pressure Pf. Zf is calculated again using a similar approach as discussed before. The moles of each component in the gas phase is calculated by
Difference in moles of CH4 and CO2 gas between initial condition Equation (11) and final condition Equation (13) indicates the amount of CH4 released from hydrate and CO2 gas stored in hydrate. It is calculated as given below.
Here, is the moles of methane released and is the moles of CO2 stored. CO2 gas consumption due to CO2 solubility into the solution is ignored at low temperature due to presence of hydrate in vicinity [57,58].
Methane recovery, , caused by gas swapping can be calculated by
Similarly, CO2 storage efficiency, , is calculated as
CH4 release efficiency, , per mole CO2 injected is calculated as
3. Results and Discussion
A series of experiments was performed to study CH4-CO2 hydrate exchange using unconsolidated coarse silica sand (0.9−1.6 mm) within a high-pressure cell and in the presence of hydrate formers, including alcohol, amino acid (L-methionine) and surfactant (sodium dodecyl sulfate, SDS). P-T and GC analysis were carried out to study the mole fraction of each gas in the vapor phase before and after soaking periods to calculate the moles of gas released and stored in hydrate formation. Effects of hydrate former, initial water saturation, residual water saturation and temperature change on CH4 recovery and CO2 storage were analyzed.
3.1. Role of Anti-Agglomeration and Hydrate Inhibition during CH4-CO2 Hydrate Swapping
Thermodynamics hydrate inhibitors (THI) and low dosage hydrate inhibitors (LDHI) are two groups of chemicals that prevent hydrate plug formation in oil and gas pipelines [33]. LDHI are further divided into kinetic hydrate inhibitors (KHI) and anti-agglomeration compounds (AA) [59]. AA chemicals are different than THI and KHI as AA disperse the hydrate into the condensate phase [60]. Alcohols and salts are well known to behave as THI. Alcohols have strong affinity towards water, thus leaving less available water for gas hydrate formation. However, it is also known that when methanol (MeOH) is added in low concentrations into water, it behaves as a hydrate promoter/activator as the presence of a low amount of methanol reduces surface tension at the gas–liquid interface and due to its hydrophobic nature [61,62,63]. York et al. [64] showed that small amounts of MeOH co-surfactants behave as AA chemicals, thus creating dispersed hydrate. Kvamme et al. [65] through simulation studies suggested that 5 wt% methanol boosts gas diffusion by 40%. Therefore, in this study, we have taken 5 wt% methanol as the chosen concentration to study.
Hydrophobic amino acids and anionic surfactant SDS are well-known kinetic hydrate promoters (KHP) when used in low concentrations [66]. KHPs do not influence the thermodynamics and only accelerate formation kinetics by changing the water activity at the gas–liquid interface. Different mechanisms are proposed for surfactants or amino acids as kinetic promoters [67,68]. In this study, we have compared the effect of SDS and methionine and 5 wt% MeOH on CH4-CO2 exchange as there are similarities and differences in these chemicals. Key similarities include lower surface tension and improved gas diffusion through the liquid phase, whereas a key difference includes the role of SDS and methionine in hydrate agglomeration without influencing thermodynamics, while 5 wt% methanol acts as an anti-agglomerate and thermodynamic inhibitor.
Application of thermodynamic inhibitors to improve CH4-CO2 swapping is a very recent development. Two recent studies have shown the positive effect of thermodynamic inhibitors such as salt and methanol to enhance CH4-CO2 exchange [52,53]. Some studies also show that in the presence of inorganic salts, anti-agglomeration capability was further boosted [69]. It is known that when hydrate inhibitors such as methanol are used in high concentrations, the hydrate equilibrium curve of CH4 and CO2 hydrate is shifted upward [1]. However, the effect of a low dosage of methanol on the hydrate equilibrium curve and subsequent effect on thermodynamic driving force during CH4-CO2 hydrate swapping has not been studied previously. The difference in equilibrium pressure between CH4 and CO2 at a given temperature is the thermodynamic driving force behind CH4-CO2 hydrate exchange. Table 2 provides the change in driving force (ΔP = Peq,CH4 − Peq,CO2) in the presence of low concentrations (1 and 5 wt%) of MeOH and NaCl using CSMGem software (Version 1.1, Colorado School of Mines, Golden, CO, USA) [1].
At 0 °C and below, the presence of the inhibitor improves the driving force as ΔP increases for all concentrations for a given inhibitor compared to the pure water case. Above 0 °C, it was found that 5 wt% methanol is most effective in terms of improving the driving force. In the presence of 5 wt% methanol, the driving force increased from 14.72 bar (pure water) to 21.54 bar at 1 °C. As the temperature increased from 1 °C to 4 °C, the driving force increased from 21.54 to 27.58 bar for 5 wt% MeOH, thereafter starting to decrease. Therefore, based on CSMGem software calculations in our studies and previous discussion, 5 wt% MeOH seems to be a good candidate to enhance hydrate swapping due to its behavior as an anti-agglomerate and thermodynamic force enhancer during CH4-CO2 hydrate exchange in the 0–4 °C temperature range. Thus, an experimental study was carried out to investigate the effect of 5 wt% MeOH on hydrate swapping and compare it with water and other kinetic hydrate formers.
3.2. Methane Hydrate Formation in Coarse Sediments
Morphology of hydrates in sediments depends on the formation kinetics, sediment characteristics and initial fluid saturation. Coarse sediments have pore-filling hydrate types while veined/nodule-type hydrates are formed in fine sediments. Multiple heating and cooling cycles were performed to increase hydrate saturation and improve hydrate distribution within sediments. Performing multiple heating/cooling cycles results in induced gas hydrate dissociation and reformation, which favors a more homogeneous gas hydrate distribution [70]. To study the CH4-CO2 hydrate exchange, we first formed methane hydrate sediments in the presence of different chemicals in the water including SDS, L-methionine and 5 wt% methanol.
3.2.1. Methane Hydrate Formation in Coarse Sediments in the Presence of SDS
Table 3 summarizes the experimental parameters and the calculated values for hydrate formation in the presence of SDS for different initial saturations. It should be mentioned that we performed two experiments to study the effect of different initial solution saturation on the methane hydrate saturation. For CO2 injection, only experiment 5 was considered.
The difference in initial promoter saturation and its correlation with the final hydrate saturation was investigated. As it is shown in Table 3, the initial promoter saturation is positively correlated with the final methane hydrate saturation. The memory effect holds again as the memory solution induction times are longer than the fresh induction times, forcing each system to a more homogeneous distribution of the hydrates. Positive correlation between the induction times (fresh or memory) and the final hydrate saturation was observed. The delay in hydrate nucleation would lead to higher induction time and may provide additional time for gas consumption. Thus, there is general correlation between induction time and saturation, such that the higher induction time relates to higher gas uptake and higher hydrate saturation. From the growth profiles shown in Figure 5, it is validated that, in the top layer, hydrate formation begins, whereby it occurs in two stages, shown by the distinct exothermic peaks. Simultaneously, batch hydrate formation occurs in the bottom layer. Surfactants were also reported to reduce the surface tension at the gas–liquid interface which improves the mass transfer during hydrate formation [71,72,73]. Hence, considering the improvement of the porous system due to surfactant presence on mass and heat transfer in the hydrate formation process, many studies focus more on the improved interaction among porous media properties and surfactant in the hydrate formation rate [74,75,76]. Amino acids are potential green alternatives to currently used kinetic promoters, such as surfactants. Most amino acids are soluble in water, non-toxic in nature and bio-friendly. The utilization of amino acids for gas hydrate formation is very recent, and their behavior is not well understood [69,77]. Recent research has shown that hydrophobic amino acids like L-methionine have similar promotion capabilities to SDS at a similar concentration (500-2000 ppm) [77].
It can be observed from the pressure and temperature profiles that CH4 hydrate formation occurs when the system temperature is below the hydrate formation temperature. This is identified as an abrupt pressure decrease in the pressure profile at a low-temperature range of 1–3 °C, followed by an increase in temperature, as is expected for the exothermic hydrate formation reaction. Two temperature profiles are recorded due to the presence of two thermocouples installed. Total distance between the two is around 53 mm. Water saturation distribution within sediments is not uniform due to gravity. We believe that water saturation in the bottom is higher compared to the top due to gravity. Since gas is injected from top of the cell, hydrate is formed at the top layer first and reduces permeability in sediments. Gas does not reach the bottom and a delay in hydrate formation at the bottom of the high-pressure cell is observed. Furthermore, it is observed that multiple cooling and heating cycles result in more distinctive temperature peaks during CH4 hydrate formation, improving hydrate saturation and its distribution.
3.2.2. Methane Hydrate Formation in Coarse Sediments in the Presence of Water and L-Methionine
The experimental details of coarse sand and key parameters for methane hydrate formation in the presence of water and methionine are displayed in Table 4.
Methane hydrate formation in a water/methionine solution in the presence of the porous media results in similar hydrate saturation for the same initial solution saturation. Kinetic promotion does not change the final equilibrium state of the formed hydrate, only affecting the kinetics of the formation process. The induction time (fresh or memory) of the promoter is higher compared to water, but for the same hydrate saturation in this porous medium bed, the gas uptake is higher. The memory effect is weaker in the presence of methionine.
The experimental growth profiles for methane hydrate formation are depicted in Figure 6. The formation of methane hydrate occurs initially on the top and moves towards the bottom. This is the effect of gas injection from the top. The higher occurrence of hydrates in the top layer, according to the comparison between the bottom and top temperature profiles, is caused by gas injection and pressurization from the top. With methane gas injected from the top, the liquid phase at the top is expected to be saturated first and tends to form hydrate earlier. After hydrate occurrence in the top layer, gas diffusion is limited by the higher mass transfer resistance. This suggests that the spatial distribution of the hydrate saturation in the sand pack has an effect. Zhang et al. [78] performed experiments in mixed-size porous media with gas circulation from the bottom, confirming the role of gas circulation in the spatial distribution of hydrate saturation.
Multiple cooling and heating cycles were performed, as presented in Figure 6, aiming to eliminate the limited gas distribution effect and to accomplish a more even hydrate saturation distribution with memory effect utilized. In such a way, after the first methane hydrate formation, a cooling/heating cycle activates the memory effect since gas diffusion allows the further saturation of the porous medium. Thus, hydrate can be formed with a more homogeneous distribution. Comparing the two growth profiles with the promoter present in Figure 5, hydrate formation in the top layer occurs in two stages, as it can be seen from the two distinctive peaks corresponding to the exothermic hydrate formation reaction, which suggests that methionine has a two-stage hydrate growth process. This leads to longer induction times (fresh or memory) for the same hydrate saturation since the gas uptake is higher. Supporting publications highlight that the memory effect does not happen for all hydrate systems every time, and the exact mechanism behind the presence of the memory effect is not yet agreed upon [79]. For example, Wilson et al. [80] did not observe any memory effect in a THF/water mixture. Higher induction time observed during memory runs could also be caused by a delay in hydrate nucleation in the presence of chemicals and change in pore water activity. It is also believed that hydrates lose the memory effect if they are melted at high temperatures above 25 °C while under high pressure [81,82].
3.2.3. Methane Hydrate Formation in Coarse Sand in the Presence of Methanol
Table 5 below provides the key details of methane hydrate formation behavior in the presence of methanol. The key difference between methanol and SDS or methionine is in terms of the degree of hydrate saturation and induction time. During experiments 8–12, 5 wt% methanol was used as the hydrate promoter. Initial water saturation varied between 29% and 66%. Hydrate saturation varied between 20% and 28%. It was found that as initial water saturation increased from 29% to 66%, hydrate saturation increased from 20% to 29% and thereafter decreased to 20%. Results suggest that initial water saturation controls hydrate saturation, in that there is an optimal initial water saturation that results in maximum hydrate saturation. Previous research works showing the effect of initial water saturation on hydrate morphology indicate that the morphology of the gas hydrate is controlled by initial water saturation, such as Swi below 35%, whereby hydrates formed are grain-coating, whereas above 35%, hydrates are pore-filling [83,84].
Comparing pressure profiles in Figure 7 with Figure 5 and Figure 6 indicate that Methane hydrate formation behavior in the presence of methanol is different from kinetic hydrate promoters (SDS and methionine) and water, as suggested by the different pressure profiles and different induction time recorded. The different pressure profile in the case of methanol might be caused by the change in methanol concentration in the remaining water near the hydrate formation front. Concentration of methanol in the residual water is not constant during the hydrate formation, and the transport of methanol away from the reaction front controls further hydrate formation. Such an effect does not exist in the case of fresh water. During the cycling process with methanol, hydrate formation is more homogeneous and thus the pressure drop more rapidly reaches a steady state. It may be possible that, due to its role as anti-agglomerate, no sharp pressure drop is observed, revealing the opposite behavior compared to kinetic promoters and water. Pressure drop was steeper in the memory run compared to fresh, suggesting an improvement in hydrate formation during the memory run. Induction time calculated in the presence of hydrate former is lower than in the presence of methanol during the fresh run, average saturation achieved in the case of methanol was lower compare to hydrate former, and induction time in the presence of methanol was also higher compare to the hydrate formers. During the memory run, induction time decreased compare to fresh runs. This behavior was in contrast to hydrate formers, where induction time increased in memory runs compared to fresh run. Figure 8 describes the variation in hydrate saturation (SH) and induction time (to) during experiments 8–12.
3.3. Enhanced CH4 Recovery and CO2 Storage during CH4-CO2 Exchange Process
The presence of additives could play an influential role during CH4-CO2 exchange processes, as they can alter hydrate morphology [55,65], enhance water activities within pore space [85] and influence the thermodynamic driving force behind CH4-CO2 exchange [52]. In this study, results are collected to study the effect of additive on CH4-CO2 exchange in porous media, and their behavior can be evaluated by comparing the CH4 recovery and CO2 storage efficiencies for each type. In this section, we discuss the effect of additives on CH4-CO2 exchange and share our understanding of the CH4-CO2 exchange mechanism.
3.3.1. Proposed Framework for CH4 -CO2 Hydrate Exchange in Methane Hydrate in the Presence of Additives
Methane hydrate-bearing sediments have four phases: hydrate, gas, water and grain. Residual water that has not participated in hydrate formation is available and lies along with methane hydrate in the sediment matrix. This residual water plays an important role during CO2 injection into CH4 hydrate-bearing sediment. To discuss the role of residual water, hydrate-bearing sediments are divided into two varieties, as sediments with pore water and sediments with hydrates only, as shown in Figure 9. It has been documented that, during lab studies, hydrate forms at the gas–liquid interface first. Therefore, CO2 injection into the hydrate would first interact with the liquid phase and form hydrate film at gas–liquid interfaces, as it is a thermodynamically feasible process. Some of the CO2 would also come into contact with CH4 hydrate at the hydrate–gas contact area and participate in CH4-CO2 hydrate exchange after CO2 molecules diffuse into the methane hydrate. Hydrate saturation and morphology control the CO2 flow, or sweep area, into the sediment matrix as they directly control the relative gas permeability in methane hydrate-bearing sediments [86]. Differences in hydrate morphology (pore-filling and grain-coating) influence the relative permeability of gas [86] as well as CO2 gas–hydrate interface.
CO2 hydrate film formation at gas–liquid interfaces is thermodynamically more feasible compared to CO2 exchange of CH4 molecules. CO2 affinity towards CO2 hydrate formation at gas–liquid interfaces would reduce the availability and selectivity of CO2 to reach to methane hydrate surface; thus, CO2 flow into methane hydrate sediment is reduced. Increase in residual water saturation would increase the gas–water interface and would further reduce the CO2 concentration available for CH4-CO2 swapping. CO2 affinity towards CO2 hydrate film formation at the gas–liquid interface and its impact on CH4-CO2 swapping is shown in Figure 10.
The CO2 hydrate formation process at the gas–liquid interface would be much faster compared to hydrate exchange; thus, it would have a lower induction time. The thickness of this hydrate film would increase with time and would start to act as a diffusion barrier for CO2 molecules to reach the methane hydrate surface. It is known that the diffusion of gas molecules through the hydrate film is very low compared to gas diffusion via the water phase [41]. CO2 concentration at CH4 hydrate surfaces further decreases as the CO2 hydrate film thickness increases, and when this hydrate film achieves a certain thickness, gas molecule diffusion through this hydrate film will completely stop. This means that the CO2 gas molecules do not arrive at the CH4 hydrate surface, nor is the released CH4 from CH4-CO2 swapping able to diffuse through and instead remains trapped. At the hydrate–gas interface, a mixed hydrate layer from CH4-CO2 swapping would develop. CO2 composition in mixed hydrates would decrease as they travel far from the gas–hydrate interface, which is correlated with the CO2 concentration available at the hydrate–gas interface. The availability of CO2 gas molecules at the hydrate–CO2 interface is controlled by a CO2 hydrate film developed at the gas–liquid interface. In the presence of additives, such as hydrate formers, SDS or methionine, CO2 concentration at the hydrate–gas interface will further reduce compared to the pure water case (refer to Figure 11).
The presence of methanol disrupts the CO2 hydrate film by inhibiting and delaying pure CO2 hydrate formation at the gas–liquid interface (refer to Figure 12). Methanol would also act as an anti-agglomerate and increase the induction time of CO2 hydrate formation by not allowing agglomeration. In the previous section, we saw that methane hydrate formation in the presence of methanol has higher induction time compared to water and other hydrate formers. Once CO2 hydrate film formed, it would be thinner and dispersed due to the anti-agglomeration effect of methanol.
Therefore, in the presence of methanol, the CO2 concentration at the gas–hydrate interface will be much higher compared to water or other hydrate formers. High CO2 concentration would lead to a longer diffusion distance into methane hydrate. Enhanced diffusion distance and favorable thermodynamic conditions would enhance CH4-CO2 hydrate swapping. Consequently, the CH4 release efficiency will significantly increase in comparison due to a delay in CO2 hydrate film formation at the gas–liquid interface. CH4 would have additional time for diffusion due to the delay in hydrate film formation and its dispersed nature, and CH4 concentration in the vapor phase would increase without any risk of CH4 hydrate reformation or trapping of CH4 below the CO2 hydrate film.
3.3.2. CH4 Recovery and CO2 Storage at Same Initial Water Saturation in the Presence of Different Hydrate Formers and Water
Table 6 summarizes the experimental data and key ratios, including recovery, storage and replacement during CH4-CO2 hydrate exchange in the presence of different additives. It should be mentioned that the CH4-CO2 exchange was performed after CH4 hydrate formation with the same initial water saturation (Swi ≈ 45%) for the promoters (SDS and methionine, 500 ppm) and low dosage alcohol (MeOH, 5 wt%) and compared to the water.
Experiments 5–8 had initial methane hydrate saturations varying from 28% to 35% caused by differences in gas uptake due to the presence of different chemicals [87] and pure CO2 injection pressure varied from 50 to 60 bar. Due to initial water saturation above 40%, it was assumed that the hydrate morphology was pore-filling [84,88]. During CO2 injection, the temperature inside the top hydrate layer increased as CO2 was injected. Just after injection and venting, a gas sample was collected to analyze the gas composition in vapor phase. Figure 13 provides the pressure profile in each experiment after CO2 injection. Temperature returned to isothermal conditions and stayed constant during the swapping process, in the range of 0.8–1.1 °C. After a 24-h soaking period, a gas sample was collected for GC analysis to calculate the methane recovery and CO2 storage, and a P-T temperature profile was recorded. From this analysis, the number of moles was quantified and the key ratios after 24 h of soaking were calculated, as described in Section 2.3. After GC analysis, controlled depressurization was also performed, indicated by the sharp pressure drop in the pressure profile. However, discussion of this is beyond the scope of this work.
Experiments 5–7 had similar methane hydrate saturation, suggesting similar residual liquid saturation and hydrate saturation. Comparing promoters SDS or methionine with water, they display better CO2 storage efficiency while they result in no CH4 recovery. CO2 storage with the kinetic promoter (SCO2 ≈ 88%) is almost doubled compared to water (SCO2 ≈ 44%), indicating their promoting effect in pure CO2 hydrate formation due to higher water activity and lower surface tension in the presence of the kinetic promoter at the gas–liquid interface. It also indicates that residual liquid saturation plays an important role, as liquid saturation would be responsible for higher CO2 consumption in the form of CO2 hydrate in the presence of a kinetic promoter as compared to water. However, the promoter-driven enhancement of pure CO2 hydrate formation at the gas–liquid interface would drive higher CO2 consumption in pure CO2 hydrate, leading to higher CO2 storage and creating a dense hydrate film between the gas–liquid interfaces. The affinity of CO2 gas molecules for CO2 hydrate formation increased compared to swapping. Due to the lower induction time of hydrate formation in the presence of SDS or methionine, CO2 hydrate film formation at the gas–liquid interface would be very quick, and the hydrate film would be denser compared to pure water. Due to this case, less CO2 concentration would be available at the methane hydrate–gas interface, which will further reduce the CO2 gas molecule diffusion distance into methane hydrate compared to water and methanol.
Furthermore, the CH4 recovery ratios in Table 6 are negative under kinetic promoter addition, suggesting the inability of released methane gas to diffuse through the CO2 hydrate film due to the smaller time window and due to CH4 hydrate reformation from the higher driving force available in the presence of promoter-saturated water in the pores. This phenomenon is a consequence of the quick CO2 hydrate film formation which controls CO2 gas diffusion into the CH4 hydrate. Consequently, the amount of CO2 gas which was diffused into the CH4 hydrate through the pure CO2–hydrate film was lower. Therefore, the CH4 gas released from the CH4-CO2 replacement process is trapped beneath this barrier and participates in CH4 hydrate reformation. Thus, it can be claimed that the presence of kinetic promoters results in higher CO2 storage efficiency, mainly driven by pure CO2 hydrate formation with additional hindering of CH4-CO2 replacement efficiency and induced CH4 hydrate reformation.
On the other hand, the presence of low dosage MeOH (5 wt%, Swi ≈ 45%) in the system subjected to CH4-CO2 exchange shows promising results in terms of CO2 storage and CH4 recovery compared to the promoter cases, depicted in Table 6. Considering a system where CH4 hydrate has formed in the porous media with low dosage MeOH, CH4 hydrate saturation is expected to be lower compared to water or kinetic promoter systems because of the alcohol inhibition and anti-agglomerate effect. This is confirmed by the calculated CH4 hydrate saturation in Table 6. with lower observed hydrate saturation (SH ≈ 28%) for the MeOH case. At 5 wt% MeOH, inhibition of MeOH is converted into anti-agglomeration. Risk of methane hydrate reformation also decreased in the presence of methanol and contributed to high methane recovery, in contrast to promoter cases, while the CO2 storage efficiency remained approximately the same for both methanol and promoters. The presence of low dosage methanol in the system suggests that more CO2 is believed to store in methane hydrate through replacement reaction due to higher thermodynamic driving force. Availability of CO2 gas molecules at the CH4 hydrate surface improved due to the enhanced relative gas permeability due to low saturation [86], delay in CO2 hydrate formation at gas–liquid interface and enhanced thermodynamic driving force in the presence of CH4-CO2 swapping.
Figure 13 presents the pressure profiles for the replacement process in experiments 5–8 during a soaking period that lasted for around 24 h. From Figure 13, after CH4 gas venting and CO2 injection, the CH4-CO2 exchange is considered to start immediately after the isolation of the HPC from the inlet valve. This is observed as an abrupt decrease in pressure profiles. This implies CO2 gas consumption considering that the CH4 vapor phase from the hydrate formation stage was displaced and assuming isochoric displacement during venting. CO2 hydrate formation is the reason for the observed gas consumption at a very early stage after injection. Observing the pressure profiles with promoters (experiment 5—SDS and experiment 7—methionine), the pressure was stabilized for 24 h. Similar observation comes from the base case with only water, indicating similar behavior of promoters regarding the replacement process and confirming quick CO2 hydrate layer formation at an early stage after CO2 injection. When correlating the pressure profile with pressure drop (ΔP1) calculated in Table 6, we see that ΔP1 is always negative, highlighting the drop in system pressure caused by CO2 storage and no release of methane from methane hydrate. In experiment 8, ΔP1 is positive, confirming additional methane recovery due to the presence of methane, not seen before in experiment 5 and 7. All experiments had near similar CO2 storage rates. ΔP1 is further complemented by an increased trend in pressure profile observed in the presence of the low dosage inhibitor (experiment 8—MeOH). This can be explained since, initially from CO2 injection, the CO2 hydrate begins to form with a faster rate than CH4 release. At some point, the CO2-CH4 exchange process continues further due to low dosage inhibition effects, but with a slower rate than CH4 release. Thus, pressure builds up.
3.3.3. CH4 Recovery and CO2 Storage in the Presence of Low Dosage Alcohol (Effect of Initial Liquid Saturation, Hydrate Morphology and Effect of Temperature)
In this section, we show that in the presence of similar pore water chemistry (presence of 5 wt% methanol), degree of hydrate saturation and nature of hydrate morphology affect the CH4-CO2 hydrate exchange due to the hydrate–gas interface controlled by hydrate surface area [41] and difference in relative gas permeability, which controls CO2 flow into methane hydrate sediments.
In this section, we perform a total of five CH4-CO2 experiments in the presence of 5 wt% MeOH having varying initial and residual liquid saturations. Results are presented in Table 7. In experiments 8–10, swapping was performed at 1 °C, whereas in experiments 11 and 12, swapping was performed at 4 °C. During the 24-h soaking period, pressure profiles (refer to Figure 14) were recorded, and gas samples were collected at the start and end of the soaking periods to calculate the differences in moles of CH4 and CO2 gas molecules in vapor phase. From this analysis, key ratios concerning recovery, replacement and storage were calculated and are presented in Table 7.
During experiments 8–10, we investigated the effect of low (30%—experiment 10), median (44%—experiment 8) and high initial water saturation (66%—experiment 9) on CH4-CO2 replacement at 1 °C. Due to the difference in initial water saturation, methane hydrates with different hydrate saturations and morphologies were formed. Experiment 10 with Swi = 30% had SH = 22%, whereas experiment 8 and experiment 9 had SH = 28% and 20%, respectively. Hydrate morphology is also assumed to be different and controlled by initial water saturation [84,88], as shown in Table 7.
Figure 14 present the pressure profiles for the replacement process in experiments 8–10 during the soaking period, which lasted for around 24 h. Pressure profiles indicate a near-similar pressure trend in all the experiments involving methanol. The calculated swapping key ratios are plotted in Figure 15 to illustrate the trend concerning the effect of initial water saturation and the corresponding hydrate saturation on CH4-CO2 swapping efficiency. Looking at pressure drop, ΔP1, values calculated in experiments 8–12 suggest that experiments 8 and 9 have higher methane recovery and low CO2 storage, causing higher pressure at the end of the soaking period than initial injection pressure after 24 h of soaking. In experiments 10–12, we observed lower system pressure compared to initial injection pressure, indicating higher CO2 storage and lower methane recovery. In typical swapping experiments, system pressure is lower than initial injection pressure, suggesting higher CO2 storage than CH4 release [52,89].
Results in Table 7 show that the lower liquid saturation system (Swi = 30%—experiment 10) leads to higher CH4 recovery and replacement efficiencies among three experiments 8–10. It can be seen that CH4 replacement (ReCH4), recovery (RCH4) ratios for median (Swi = 44%—experiment 8) and high liquid saturation (Swi = 66%—experiment 9) are lower compared to the low methane hydrate saturation case (Swi = 30%—experiment 10).
Our findings could be explained based on differences in hydrate morphology between experiment 10 and experiments 8 and 9. Initial liquid saturation controls the degree of hydrate saturation and its morphology within the pore space. Initial water saturation controls hydrate morphology as well as degree of hydrate saturation. For initial water saturation, Swi < 35%, the hydrate morphology is grain-coating, whereas above 35%, a pore-filling hydrate morphology is suggested [84,88]. For the grain-coating hydrate morphology, an increase in hydrate saturation provides a higher hydrate surface area, thus enhancing the hydrate–CO2 gas interface and improving the CH4-CO2 hydrate exchange. For the pore-filling hydrate morphology, an increase in hydrate saturation decreases the relative permeability of gas [86] and the permeability of hydrate-bearing sediments [41]; thus, CO2 gas flow into methane hydrate sediments is restricted and lower CO2 concentrations arriving at the CH4 hydrate surface cause poor CH4-CO2 exchange. Residual water saturation after hydrate formation also plays a critical role as it controls the liquid–gas interface where CO2 hydrate film formation takes place. Qing et al. [29] studied CH4-CO2 exchange using liquid CO2 and found that the replacement of CH4 hydrate decreased with an increase in hydrate saturation. They have also found that replacement increased with a decrease in initial water saturation.
The above explanation affirms that experiment 10 had better hydrate exchange-based soaking ratios than experiment 8 and 9 due to the grain-coating hydrate morphology that provided additional hydrate–gas contact. The surface area in a grain-coating hydrate system is higher compared to the pore-filling analog [90]. Grain-coating hydrate morphology-based methane hydrate systems also have better relative gas permeability, thus enabling better fluid movement through pores in the sediment matrix compared to a pore-filling hydrate morphology [86]. Low initial water saturation reduced the free active water in the pore space and hydrates were formed as grain-coating hydrates due to the water-wet nature of silica sand. Therefore, the better soaking ratios observed in experiment 10 are attributed to the larger hydrate–gas interface and better fluid migration within pores.
Comparing experiments 8 and 9, both had a pore-filling hydrate morphology but experiment 9 had a better hydrate swapping-based soaking ratio compared to experiment 8. This is attributed to the difference in hydrate saturation between experiments 8 and 9. Experiment 9 had lower hydrate saturation SH = 20% compared to SH = 28% in experiment 8. It is known that for a pore-filling hydrate morphology, an increase in hydrate saturation leads to a decrease in relative gas permeability [86]. Pore-filling hydrate also reduces the intrinsic permeability of the hydrate-bearing sediments by blocking the pores and creating more obstruction for fluid migration in comparison to the grain-coating hydrate-bearing sediment matrix [91,92]. The lower the hydrate saturation (experiment 9, Sh ≈ 20%), the less pore space is occupied, and, thus, the higher the relative gas permeability inside the pore-space leading to higher gas exchange efficiency compared to the higher hydrate saturation system (experiment 8, Sh ≈ 28 %). Experiments 8–10 consistently had CO2 storage efficiency above 80%, highlighting the role of residual liquid phase saturation during CO2 hydrate formation at the gas–liquid interface after CO2 injection into the CH4 hydrate. CH4 recovery and CH4 replacement ratios were also correlated, highlighting enhanced CH4-CO2 replacement as a contributing factor in CH4 recovery, apart from the release of CH4 gas caused by CH4 hydrate melting due to CO2 hydrate formation.
The comparison between the two experiments (experiment 11 vs. experiment 12) at T = 4 °C, having different initial water saturations (Swi ≈ 45%—experiment 11 vs. Swi ≈ 30%—experiment 12), reconfirms that the difference in hydrate contact surface area due to different the hydrate morphology plays a key role in CH4-CO2 hydrate swapping efficiency. Swi controls the hydrate morphology, which in turn controls hydrate surface area. Experiment 12 has shown better replacement and recovery efficiency (RCH4 ≈ 89%, ReCH4, CO2inj ≈ 10%) due to lower initial water saturation (Swi = 30%) at 4 °C compared to the efficiency of the pore-filling type hydrates of experiment 11 at 4°C (RCH4 ≈ 45%, ReCH4, CO2inj ≈ 5%), due to higher initial water saturation (Swi = 45%). Grain-coating hydrates also have higher relative gas permeability and improved fluid movement due to a connected pore network [86].
Table 2 shows that temperature has an effect on CH4-CO2 replacement in the presence of 5 wt% methanol, such that an increase in swapping temperature from 1 °C to 4 °C improves the driving force (ΔP) from 21 to 27 bars. Driving force (ΔP) is defined as the hydrate stability pressure difference between CH4 and CO2 gas hydrate stability pressure at a given temperature. As seen in Table 2, the presence of 5 wt% MeOH increases the hydrate stability pressure difference between CO2 and CH4 for given temperatures compared to pure water. From Table 2, CSMGem-based calculations suggest that the biggest pressure difference was observed at 4 °C in the case of 5 wt% MeOH. Therefore, the temperature effect on CH4-CO2 swapping was also investigated during this study. In experiments 11 and 12, exchange was performed at 4 °C and calculated data are presented in Table 7, where a pressure profile is plotted (refer to Figure 16). The following discussion is focused on comparing the effect of temperature on CH4-CO2 swapping-based soaking ratio experiments with similar initial water saturations (experiment 8 vs. experiment 11, experiment 10 vs. experiment 12).
Experiments 8 and 11 have similar initial water saturation (ca. 45%), similar hydrate saturation (ca. 28%) and similar hydrate morphology (pore-filling). In experiment 8, swapping was performed at 1 °C, and in experiment 11, the temperature was 4 °C. Soaking-based ratios shown in Table 7 confirm better efficiencies for experiment 11 (4 °C) versus experiment 8 (1 °C). For experiment 11, the CO2 storage efficiency (SCO2) was 93%, while for experiment 8, the SCO2 was ≈ 84%. Additional CO2 storage in experiment 11 can be attributed to CO2 storage in the CH4 hydrate due to higher driving force at 4 °C in the presence of 5 wt% MeOH, as in experiments 8 and 11, all parameters were identical except for a difference in swapping temperature. As more CO2 replaced CH4 from hydrate cages, we recorded additional methane recovery in experiment 11, as confirmed by better methane recovery and replacement ratio (RCH4 ≈ 45%, ReCH4, CO2inj ≈ 5%) compared to experiment 8 (RCH4 ≈ 15%, ReCH4,CO2inj ≈ 2%).
Experiments 10 and 12 also have similar initial water saturation (ca. 30%) and similar hydrate morphology (grain-coating). In Experiment 10, swapping was performed at 1 °C and in experiment 12, it was 4 °C. Higher methane hydrate saturation in experiment 12 (SH = 27%) resulted in higher hydrate surface area compared to experiment 10 (SH = 22%), as hydrates formed are grain-coating. We recorded the enhanced methane recovery at elevated temperatures for experiment 12. Improved CH4 recovery and replacement efficiency (RCH4 = 89%, ReCH4 = 10%) were recorded in experiment 12 compared to ratios (RCH4 = 83%, ReCH4 = 6%) recorded in experiment 10, which are attributed to the higher temperature and higher hydrate surface area available in experiment 12.
CH4-CO2 exchange mechanisms include different phenomena, including CO2 hydrate formation, CH4 hydrate dissociation and CO2 gas diffusion into the CH4 hydrate to initiate CH4-CO2 replacement. Energy released by CO2 hydrate formation initiates CH4 hydrate dissociation, causing the release of methane gas and improving pore connectivity within the sediment matrix. This allows additional CO2 gas molecules to reach the CH4 hydrate surface. Hence, total CH4 recovered is the sum of methane recovered from hydrate dissociation plus methane recovered through CH4-CO2 swapping. It is known that grain-coating methane hydrates are more unstable and dissociate faster compare to pore-filling hydrates [90,91,92,93]; therefore, energy released from CO2 hydrate formation would be able to dissociate grain-coating hydrates faster compared to pore-filling hydrates. We report supporting observations in our studies when we compare the CH4 recovery ratios in experiments 8–12. Due to the grain-coating morphology in experiments 10 and 12, we recorded additional methane recovery 83–87%, compared to 15–45% recorded in experiments 8, 9 and 11, which had pore-filling morphologies. Low replacement ratios (2–10%) but high methane recovery ratios (15–89%) recorded in experiments 8–12 also suggest that a high percentage of methane recovered during CH4-CO2 hydrate swapping comes from methane hydrate dissociation and the release of trapped methane within the pore space caused by CO2 hydrate dissociation. Thus, the difference in RCH4% in experiments 8–12 is the cumulative result of differences in hydrate morphology, degree of hydrate saturation, CO2 transportation via different barriers and thermodynamic driving force between CH4 and CO2 hydrate.
CO2 storage ratio varied between 83% and 94% during experiments 8–12. The CO2 storage ratio had less variation compared to the CH4 recovery ratio. This suggests that factors like methane hydrate saturation, its morphology and thermodynamic driving force did not control CO2 storage in methane hydrate reservoirs. We propose that CO2 storage during CH4-CO2 swapping is highly influenced by residual water saturation and pore water activity [85] as pure CO2 hydrate will form first at the gas–liquid interface, as it is a more thermodynamically favorable process. In the presence of 5 wt% methanol, we have near-similar pore-water activity, and deviation among each experiment can be contributed to enhanced CO2 storage by CH4-CO2 swapping. Experiments 10–12 had better replacement efficiency compared to experiments 8 and 9, thus resulting in better CO2 storage ratios in experiments 10–12 in addition to CO2 stored as CO2 hydrate film at the gas–liquid interface.
This is further confirmed by comparing CO2 storage ratios in experiments 5–8. In the presence of hydrate promoters including SDS and methionine, the CO2 storage ratio was recorded as 88% in experiments 5 and 7 without any CH4 recovery. CO2 storage was recorded as 83% in the presence of 5 wt% MeOH, indicating the weaker promotion capability of MeOH during CO2 hydrate formation at the gas–liquid interface. Hence, based on this study, we report different controlling parameters to enhance CH4-CO2 hydrate exchange, as illustrated in Figure 17 below.
Through this study, we have demonstrated the novel application of anti-agglomerate and hydrate inhibitor additives when used in low concentrations to enhance CH4-CO2 hydrate exchange. The presence of these chemicals in water would delay hydrate formation at the gas–liquid interface during CO2 injection into methane hydrate and would create a dispersed hydrate morphology. The delay in hydrate film formation and its dispersed nature would allow additional CO2 gas molecule availability for CH4-CO2 swapping, thus improving both CH4 recovery and CO2 storage. Low dosage kinetic inhibitors and anti-agglomeration compounds are well studied and frequently used chemicals in the petroleum industry to prevent hydrate plug formation in oil and gas pipelines. We call for more research on the usage of environmentally friendly, anti-agglomeration and hydrate inhibition compounds to enhance methane recovery and CO2 storage. Further research is required to study the effects of impurities, such as clay material, water salinity, porous material properties, degree of hydrate saturation and CO2 concentration, in injected gas through core flooding-based flow experiments.
4. Conclusions
Both CO2 storage and CH4 recovery were enhanced during the CH4-CO2 hydrate exchange process in the presence of low dosage methanol. In the presence of methanol, delayed hydrate film formation at the gas–liquid interface allowed additional CO2 gas molecules to be able to arrive at the hydrate surface. Higher CO2 concentrations at the surface allowed higher diffusion into methane hydrate. Due to thermodynamic force enhancement, more CO2 molecules were able to replace CH4. Other surface-active chemicals, such as SDS and methionine, enhanced CO2 storage at a similar range as methanol, but they did not release any methane through exchange. The grain-coating morphology caused by low initial water saturation was more advantageous during CH4-CO2 replacement. This research opens the possibility of CO2 storage in methane hydrate without disturbing the geological formation using the CH4-CO2 hydrate exchange processes in the presence of anti-agglomeration additives. We also demonstrated the thermal capabilities of 5 wt% methanol, as CO2 storage was enhanced as temperature increased from 1 to 4 °C.
Author Contributions
Conceptualization, J.S.P.; methodology, J.S.P.; formal analysis, J.S.P. and C.K.; investigation, C.K.; writing—original draft preparation, J.S.P. and C.K.; writing—review and editing, A.P.K. and N.v.S.; supervision, J.S.P. and N.v.S.; project administration, J.S.P. and N.v.S.; funding acquisition, N.v.S. All authors have read and agreed to the published version of the manuscript.
Funding
This research is funded by the Danish Council for Independent Research.
Conflicts of Interest
The authors declare no conflict of interest.
References
- Sloan, E.D.; Koh, C.A. Clathrates Hydrates of the Natural Gases, 3rd ed.; CRC Press: Boca Raton, FL, USA, 2007. [Google Scholar]
- Koh, C.A.; Sloan, E.D.; Sum, A.K.; Wu, D.T. Fundamentals and applications of gas hydrates. Annu. Rev. Chem. Biomol. Eng. 2011, 2, 237–257. [Google Scholar] [CrossRef]
- Collett, T.; Bahk, J.J.; Baker, R.; Boswell, R.; Divins, D.; Frye, M.; Goldberg, D.; Husebø, J.; Koh, C.; Malone, M.; et al. Methane hydrates in nature-current knowledge and challenges. J. Chem. Eng. Data 2015, 60, 319–329. [Google Scholar] [CrossRef]
- Boswell, R.; Collett, T.S. Current perspectives on gas hydrate resources. Energy Environ. Sci. 2011, 4, 1206–1215. [Google Scholar] [CrossRef]
- Makogon, Y.F. Natural gas hydrates—A promising source of energy. J. Nat. Gas Sci. Eng. 2010, 2, 49–59. [Google Scholar] [CrossRef]
- Almenningen, S.; Flatlandsmo, J.; Fernø, M.A.; Ersland, G. Multiscale Laboratory Verification of Depressurization for Production of Sedimentary Methane Hydrates. SPE J. 2017, 22, 138–147. [Google Scholar] [CrossRef]
- Feng, J.C.; Wang, Y.; Li, X.S.; Chen, Z.Y.; Li, G.; Zhang, Y. Investigation into optimization condition of thermal stimulation for hydrate dissociation in the sandy reservoir. Appl. Energy 2015, 154, 995–1003. [Google Scholar] [CrossRef]
- Fuhai, D.; Xiaoya, Z.; Dongliang, L.; Shuanshi, F.; Deqing, L. Experimental investigation on propane hydrate dissociation by high concentration methanol and ethylene glycol solution injection. Energy Fuels 2009, 23, 1563–1567. [Google Scholar]
- Nair, V.C.; Prasad, S.K.; Kumar, R.; Sangwai, J.S. Energy recovery from simulated clayey gas hydrate reservoir using depressurization by constant rate gas release, thermal stimulation and their combinations. Appl. Energy 2018, 225, 755–768. [Google Scholar] [CrossRef]
- Heeschen, K.U.; Abendroth, S.; Priegnitz, M.; Spangenberg, E.; Thaler, J.; Schicks, J.M. Gas Production from Methane Hydrate: A Laboratory Simulation of the Multistage Depressurization Test in Mallik, Northwest Territories, Canada. Energy Fuels 2016, 30, 6210–6219. [Google Scholar] [CrossRef]
- Wang, Y.; Feng, J.C.; Li, X.S.; Zhan, L.; Li, X.Y. Pilot-scale experimental evaluation of gas recovery from methane hydrate using cycling-depressurization scheme. Energy 2018, 160, 835–844. [Google Scholar] [CrossRef]
- Konno, Y.; Masuda, Y.; Akamine, K.; Naiki, M.; Nagao, J. Sustainable gas production from methane hydrate reservoirs by the cyclic depressurization method. Energy Convers. Manag. 2016, 108, 439–445. [Google Scholar] [CrossRef]
- Phillips, S.C.; Flemings, P.B.; You, K.; Meyer, D.W.; Dong, T. Investigation of in situ salinity and methane hydrate dissociation in coarse-grained sediments by slow, stepwise depressurization. Mar. Pet. Geol. 2019, 109, 128–144. [Google Scholar] [CrossRef]
- Zhao, J.; Liu, Y.; Guo, X.; Wei, R.; Yu, T.; Xu, L.; Sun, L.; Yang, L. Gas production behavior from hydrate-bearing fine natural sediments through optimized step-wise depressurization. Appl. Energy 2020, 260, 114275. [Google Scholar] [CrossRef]
- Okwananke, A.; Yang, J.; Tohidi, B.; Chuvilin, E.; Istomin, V.; Bukhanov, B.; Cheremisin, A. Enhanced depressurisation for methane recovery from gas hydrate reservoirs by injection of compressed air and nitrogen. J. Chem. Thermodyn. 2018, 117, 138–146. [Google Scholar] [CrossRef]
- Chen, Y.; Gao, Y.; Chen, L.; Wang, X.; Liu, K.; Sun, B. Experimental investigation of the behavior of methane gas hydrates during depressurization-assisted CO2 replacement. J. Nat. Gas Sci. Eng. 2019, 61, 284–292. [Google Scholar] [CrossRef]
- Ebinuma, T. Method for Dumping and Disposing of Carbon Dioxide Gas and Apparatus Therefore. U.S. Patent 5,261,490, 16 November 1993. pp. 1–16. [Google Scholar]
- Ohgaki, K.; Takano, K.; Sangawa, H.; Matsubara, T.; Nakano, S. Methane Exploitation by Carbon Dioxide from Gas Hydrates—Phase Equilibria for CO2-CH4 Mixed Hydrate System. J. Chem. Eng. Jpn. 1996, 29, 478–483. [Google Scholar] [CrossRef] [Green Version]
- Anderson, B.; Boswell, R.; Collett, T.S.; Survey, U.S.G.; Co, D.; Tx, H.; Ohtsuki, S.; White, M.; Zyrianova, M. Review of the Findings of the Iġnik Sikumi CO2-CH4 Gas Hydrate Exchange Field Trial. In Proceedings of the 8th International Conference on Gas Hydrates (ICGH8-2014), Beijing, China, 28 July–1 August 2014; Volume 17. [Google Scholar]
- Schoderbek, D.; Martin, K.L.; Howard, J.; Silpngarmlert, S.; Hester, K. North slope hydrate fieldtrial: CO2/CH4 exchange. In Proceedings of the OTC Arctic Technology Conference, Houston, TX, USA, 3–5 December 2012; Volume 1, pp. 155–171. [Google Scholar]
- Farrell, H.; Schoderbek, D.; Smith, B.; Klein, P.; Kralick, J.; Hester, K.; Martin, K.; Howard, J.; Raterman, K.; Slipngarmlert, S.; et al. Iġnik Sikumi gas hydrate field trial completed. Fire Ice 2012, 12, 1–3. [Google Scholar]
- Lee, H.J.; Lee, J.D.; Linga, P.; Englezos, P.; Kim, Y.S.; Lee, M.S.; Kim, Y. Do Gas hydrate formation process for pre-combustion capture of carbon dioxide. Energy 2010, 35, 2729–2733. [Google Scholar] [CrossRef]
- Orr, F.M. CO2 capture and storage: Are we ready? Energy Environ. Sci. 2009, 2, 449–458. [Google Scholar] [CrossRef]
- Yezdimer, E.M.; Cummings, P.T.; Chialvo, A.A. Determination of the Gibbs free energy of gas replacement in SI clathrate hydrates by molecular simulation. J. Phys. Chem. A 2002, 106, 7982–7987. [Google Scholar] [CrossRef]
- Ota, M.; Morohashi, K.; Abe, Y.; Watanabe, M.; Lee Smith, R.; Inomata, H. Replacement of CH4 in the hydrate by use of liquid CO2. Energy Convers. Manag. 2005, 46, 1680–1691. [Google Scholar] [CrossRef]
- Ota, M.; Abe, Y.; Watanabe, M.; Smith, R.L.; Inomata, H. Methane recovery from methane hydrate using pressurized CO2. Proc. Fluid Phase Equilibria 2005, 228, 553–559. [Google Scholar] [CrossRef]
- Ota, M.; Takeomi, S.; Tsutomu, A.; Watanabe, M.; Yoshiyuki, S.; Smith, R.L., Jr.; Inomata, H. Macro and microscopic CH4–CO2 replacement in CH4 hydrate under pressurized CO2. AIChE J. 2012, 59, 215–228. [Google Scholar] [CrossRef]
- Zhao, J.; Zhang, L.; Chen, X.; Fu, Z.; Liu, Y.; Song, Y. Experimental Study of Conditions for Methane Hydrate Productivity by the CO2 Swap Method. Energy Fuels 2015, 29, 6887–6895. [Google Scholar] [CrossRef]
- Yuan, Q.; Sun, C.Y.; Liu, B.; Wang, X.; Ma, Z.W.; Ma, Q.L.; Yang, L.Y.; Chen, G.J.; Li, Q.P.; Li, S.; et al. Methane recovery from natural gas hydrate in porous sediment using pressurized liquid CO2. Energy Convers. Manag. 2013, 67, 257–264. [Google Scholar] [CrossRef]
- Zhao, J.; Xu, K.; Song, Y.; Liu, W.; Lam, W.; Liu, Y.; Xue, K.; Zhu, Y.; Yu, X.; Li, Q. A Review on Research on Replacement of CH4 in Natural Gas Hydrates by Use of CO2. Energies 2012, 5, 399–419. [Google Scholar] [CrossRef] [Green Version]
- Stanwix, P.L.; Rathnayake, N.M.; De Obanos, F.P.P.; Johns, M.L.; Aman, Z.M.; May, E.F. Characterising thermally controlled CH4-CO2 hydrate exchange in unconsolidated sediments. Energy Environ. Sci. 2018, 11, 1828–1840. [Google Scholar] [CrossRef]
- Chong, Z.R.; Yang, S.H.B.; Babu, P.; Linga, P.; Li, X. Sen Review of natural gas hydrates as an energy resource: Prospects and challenges. Appl. Energy 2016, 162, 1633–1652. [Google Scholar] [CrossRef]
- Hassanpouryouzband, A.; Joonaki, E.; Vasheghani Farahani, M.; Takeya, S.; Ruppel, C.; Yang, J.; English, N.J.; Schicks, J.M.; Edlmann, K.; Mehrabian, H.; et al. Gas hydrates in sustainable chemistry. Chem. Soc. Rev. 2020, 49, 5225–5309. [Google Scholar] [CrossRef]
- Lee, J.Y.; Ryu, B.J.; Yun, T.S.; Lee, J.; Cho, G.C. Review on the Gas Hydrate Development and Production as a New Energy Resource. KSCE J. Civ. Eng. 2011, 15, 689–696. [Google Scholar] [CrossRef]
- Merey, S.; Al-raoush, R.I.; Jung, J.; Alshibli, K.A. Journal of Petroleum Science and Engineering Comprehensive literature review on CH 4 -CO 2 replacement in microscale porous media. J. Pet. Sci. Eng. 2018, 171, 48–62. [Google Scholar] [CrossRef]
- Komatsu, H.; Ota, M.; Smith, R.L.; Inomata, H. Review of CO2-CH4clathrate hydrate replacement reaction laboratory studies—Properties and kinetics. J. Taiwan Inst. Chem. Eng. 2013, 44, 517–537. [Google Scholar] [CrossRef]
- Hauge, L.P.; Birkedal, K.A.; Ersland, G.; Graue, A. Methane Production from Natural Gas Hydrates by CO2 Replacement—Review of Lab Experiments and Field Trial. SPE Conf. 2014. [Google Scholar] [CrossRef]
- Li, F.; Yuan, Q.; Li, T.; Li, Z.; Sun, C.; Chen, G. A review: Enhanced recovery of natural gas hydrate reservoirs. Chin. J. Chem. Eng. 2019, 27, 2062–2073. [Google Scholar] [CrossRef]
- Xu, C.G.; Li, X. Sen Research progress of hydrate-based CO2 separation and capture from gas mixtures. RSC Adv. 2014, 4, 18301–18316. [Google Scholar] [CrossRef]
- Jung, J.W.; Espinoza, D.N.; Santamarina, J.C. Properties and phenomena relevant to CH4-CO2 replacement in hydrate-bearing sediments. J. Geophys. Res. Solid Earth 2010, 115, 1–16. [Google Scholar] [CrossRef]
- Chen, Y.; Gao, Y.; Zhao, Y.; Chen, L.; Dong, C.; Sun, B. Experimental investigation of different factors in fluencing the replacement efficiency of CO2 for methane hydrate. Appl. Energy 2018, 228, 309–316. [Google Scholar] [CrossRef]
- Koh, D.Y.; Kang, H.; Lee, J.W.; Park, Y.; Kim, S.J.; Lee, J.; Lee, J.Y.; Lee, H. Energy-efficient natural gas hydrate production using gas exchange. Appl. Energy 2016, 162, 114–130. [Google Scholar] [CrossRef]
- Svandal, A.; Kvamme, B.; Grànàsy, L.; Pusztai, T.; Buanes, T.; Hove, J. The phase-field theory applied to CO2 and CH4 hydrate. J. Cryst. Growth 2006, 287, 486–490. [Google Scholar] [CrossRef]
- Xu, C.G.; Cai, J.; Lin, F.h.; Chen, Z.Y.; Li, X. Sen Raman analysis on methane production from natural gas hydrate by carbon dioxide-methane replacement. Energy 2015, 79, 111–116. [Google Scholar] [CrossRef]
- Yoon, J.; Kawamura, T.; Yamamoto, Y.; Komai, T. Transformation of Methane Hydrate to Carbon Dioxide Hydrate: In Situ Raman Spectroscopic Observations. J. Phys. Chem. A 2004, 108, 5057–5059. [Google Scholar] [CrossRef]
- Ors, O.; Sinayuc, C. An experimental study on the CO2-CH4 swap process between gaseous CO2 and CH4 hydrate in porous media. J. Pet. Sci. Eng. 2014, 119, 156–162. [Google Scholar] [CrossRef]
- Jung, J.W.; Jang, J.; Santamarina, J.C.; Tsouris, C.; Phelps, T.J.; Rawn, C.J. Gas production from hydrate-bearing sediments: The role of fine particles. Energy Fuels 2012, 26, 480–487. [Google Scholar] [CrossRef]
- Song, Y.; Zhou, H.; Ma, S.; Liu, W.; Yang, M. CO2 sequestration in depleted methane hydrate deposits with excess water. Int. J. Energy Res. 2018, 42, 2536–2547. [Google Scholar] [CrossRef]
- Xu, C.G.; Cai, J.; Yu, Y.S.; Yan, K.F.; Li, X. Sen Effect of pressure on methane recovery from natural gas hydrates by methane-carbon dioxide replacement. Appl. Energy 2018, 217, 527–536. [Google Scholar] [CrossRef]
- Mu, L.; von Solms, N. Methane Production and Carbon Capture by Hydrate Swapping. Energy Fuels 2017, 31, 3338–3347. [Google Scholar] [CrossRef]
- Zhao, J.; Zhang, L.; Chen, X.; Zhang, Y.; Liu, Y.; Song, Y. Combined replacement and depressurization methane hydrate recovery method. Energy Explor. Exploit. 2016, 34, 129–139. [Google Scholar] [CrossRef] [Green Version]
- Khlebnikov, V.N.; Antonov, S.V.; Mishin, A.S.; Bakulin, D.A.; Khamidullina, I.V.; Liang, M.; Vinokurov, V.A.; Gushchin, P.A. A new method for the replacement of CH4 with CO2 in natural gas hydrate production. Nat. Gas Ind. B 2016, 3, 445–451. [Google Scholar] [CrossRef]
- Gambelli, A.M.; Rossi, F. The use of sodium chloride as strategy for improving CO2/CH4 replacement in natural gas hydrates promoted with depressurization methods. Arab. J. Geosci. 2020, 7, 598. [Google Scholar] [CrossRef]
- Zhang, L.; Yang, L.; Wang, J.; Zhao, J.; Dong, H.; Yang, M.; Liu, Y.; Song, Y. Enhanced CH4 recovery and CO2 storage via thermal stimulation in the CH4/CO2 replacement of methane hydrate. Chem. Eng. J. 2017, 308, 40–49. [Google Scholar] [CrossRef]
- Heydari, A.; Peyvandi, K. Study of biosurfactant effects on methane recovery from gas hydrate by CO2 replacement and depressurization. Fuel 2020, 272, 117681. [Google Scholar] [CrossRef]
- Pandey, J.S.; Daas, Y.J.; Solms, N. Von Insights into Kinetics of Methane Hydrate Formation in the Presence of Surfactants. Processes 2019, 7, 598. [Google Scholar] [CrossRef] [Green Version]
- Servio, P.; Englezos, P. Effect of temperature and pressure on the solubility of carbon dioxide in water in the presence of gas hydrate. Fluid Phase Equilib. 2001, 190, 127–134. [Google Scholar] [CrossRef]
- Hashemi, S.; Macchi, A.; Bergeron, S.; Servio, P. Prediction of methane and carbon dioxide solubility in water in the presence of hydrate. Fluid Phase Equilib. 2006, 246, 131–136. [Google Scholar] [CrossRef]
- Kelland, M.A. History of the development of low dosage hydrate inhibitors. Energy Fuels 2006, 20, 825–847. [Google Scholar] [CrossRef]
- Huo, Z.; Freer, E.; Lamar, M.; Sannigrahi, B.; Knauss, D.M.; Sloan, E.D. Hydrate plug prevention by anti-agglomeration. Chem. Eng. Sci. 2001, 56, 4979–4991. [Google Scholar] [CrossRef]
- Chang, T.M.; Dang, L.X. Liquid-vapor interface of methanol-water mixtures: A molecular dynamics study. J. Phys. Chem. B 2005, 109, 5759–5765. [Google Scholar] [CrossRef]
- Abay, H.K.; Svartaas, T.M. Effect of ultralow concentration of methanol on methane hydrate formation. Energy Fuels 2010, 24, 752–757. [Google Scholar] [CrossRef]
- Amtawong, J.; Guo, J.; Hale, J.S.; Sengupta, S.; Fleischer, E.B.; Martin, R.W.; Janda, K.C. Propane Clathrate Hydrate Formation Accelerated by Methanol. J. Phys. Chem. Lett. 2016, 7, 2346–2349. [Google Scholar] [CrossRef]
- York, J.D.; Firoozabadi, A. Alcohol cosurfactants in hydrate antiagglomeration. J. Phys. Chem. B 2008, 112, 10455–10465. [Google Scholar] [CrossRef]
- Kvamme, B.; Selvåg, J.; Saeidi, N.; Kuznetsova, T. Methanol as a hydrate inhibitor and hydrate activator. Phys. Chem. Chem. Phys. 2018, 20, 21968–21987. [Google Scholar] [CrossRef] [PubMed]
- Pandey, J.S.; Daas, Y.J.; Solms, N. Von Screening of Amino Acids and Surfactant as Hydrate Promoter for CO 2 Capture from Flue Gas. Processes 2020, 8, 124. [Google Scholar] [CrossRef] [Green Version]
- Kumar, A.; Bhattacharjee, G.; Kulkarni, B.D.; Kumar, R. Role of Surfactants in Promoting Gas Hydrate Formation. Ind. Eng. Chem. Res. 2015, 54, 12217–12232. [Google Scholar] [CrossRef]
- Lal, B.; Mukhtar, H.; Bavoh, C.B.; Osei, H.; Sabil, K.M. A Review on the Role of Amino Acids in Gas Hydrate Inhibition, CO2 Capture and Sequestration, and Natural Gas Storage. J. Nat. Gas Sci. Eng. 2019, 64, 52–71. [Google Scholar]
- Dong, S.; Li, M.; Firoozabadi, A. Effect of salt and water cuts on hydrate anti-agglomeration in a gas condensate system at high pressure. Fuel 2017, 210, 713–720. [Google Scholar] [CrossRef]
- Le, T.X.; Rodts, S.; Hautemayou, D.; Aimedieu, P.; Bornert, M.; Chabot, B.; Tang, A.M. Kinetics of methane hydrate formation and dissociation in sand sediment. Geomech. Energy Environ. 2020, 23, 100103. [Google Scholar] [CrossRef] [Green Version]
- Khodaverdiloo, K.R.; Erfani, A.; Peyvandi, K.; Varaminian, F. Synergetic effects of polyacrylamide and nonionic surfactants on preventing gas hydrate formation. J. Nat. Gas Sci. Eng. 2016, 30, 343–349. [Google Scholar] [CrossRef]
- Liu, W.; Li, Y.; Xu, X. Influence factors of methane hydrate formation from ice: Temperature, pressure and SDS surfactant. Chin. J. Chem. Eng. 2019, 27, 405–410. [Google Scholar] [CrossRef]
- Molokitina, N.S.; Nesterov, A.N.; Podenko, L.S.; Reshetnikov, A.M. Carbon dioxide hydrate formation with SDS: Further insights into mechanism of gas hydrate growth in the presence of surfactant. Fuel 2019, 235, 1400–1411. [Google Scholar] [CrossRef]
- Pan, Z.; Liu, Z.; Zhang, Z.; Shang, L.; Ma, S. Effect of silica sand size and saturation on methane hydrate formation in the presence of SDS. J. Nat. Gas Sci. Eng. 2018, 56, 266–280. [Google Scholar] [CrossRef]
- Dicharry, C.; Duchateau, C.; Asbaï, H.; Broseta, D.; Torré, J.P. Carbon dioxide gas hydrate crystallization in porous silica gel particles partially saturated with a surfactant solution. Chem. Eng. Sci. 2013, 98, 88–97. [Google Scholar] [CrossRef] [Green Version]
- Sun, X.; Liu, D.; Chang, D.; Wang, W.; Pan, Z. Analysis of natural gas hydrate formation in sodium dodecyl sulfate and quartz sand complex system under saline environment. Pet. Sci. Technol. 2018, 36, 1073–1079. [Google Scholar] [CrossRef]
- Prasad, P.S.R.; Kiran, B.S. Are the amino acids thermodynamic inhibitors or kinetic promoters for carbon dioxide hydrates? J. Nat. Gas Sci. Eng. 2018, 52, 461–466. [Google Scholar] [CrossRef]
- Zhang, B.; Zheng, J.; Yin, Z.; Liu, C.; Wu, Q.; Wu, Q.; Liu, C.; Gao, X.; Zhang, Q. Methane hydrate formation in mixed-size porous media with gas circulation: Effects of sediment properties on gas consumption, hydrate saturation and rate constant. Fuel 2018, 233, 94–102. [Google Scholar] [CrossRef]
- Ripmeester, J.A.; Alavi, S. Some current challenges in clathrate hydrate science: Nucleation, decomposition and the memory effect. Curr. Opin. Solid State Mater. Sci. 2016, 20, 344–351. [Google Scholar] [CrossRef] [Green Version]
- Wilson, P.W.; Haymet, A.D.J. Hydrate formation and re-formation in nucleating THF/water mixtures show no evidence to support a “memory” effect. Chem. Eng. J. 2010, 161, 146–150. [Google Scholar] [CrossRef]
- Sowa, B.; Maeda, N. Statistical Study of the Memory Effect in Model Natural Gas Hydrate Systems. J. Phys. Chem. A 2015, 119, 10784–10790. [Google Scholar] [CrossRef]
- Wu, Q.; Zhang, B. Memory effect on the pressure-temperature condition and induction time of gas hydrate nucleation. J. Nat. Gas Chem. 2010, 19, 446–451. [Google Scholar] [CrossRef]
- Yegya Raman, A.K.; Venkataramani, D.; Bhagwat, S.; Martin, T.; Clark, P.E.; Aichele, C.P. Emulsion stability of surfactant and solid stabilized water-in-oil emulsions after hydrate formation and dissociation. Colloids Surf. A Physicochem. Eng. Asp. 2016, 506, 607–621. [Google Scholar] [CrossRef]
- Berge, L.I.; Jacobsen, K.A.; Solstad, A. Measured acoustic wave velocities of R11 (CCl3F) hydrate samples with and without sand as a function of hydrate concentration. J. Geophys. Res. Solid Earth 1999, 104, 15415–15424. [Google Scholar] [CrossRef]
- Clennell, M.B.; Henry, P.; Hovland, M.; Booth, J.S.; Winters, W.J.; Thomas, M. Formation of Natural Gas Hydrates in Marine Sediments: Gas Hydrate Growth and Stability Conditioned by Host Sediment Properties. Ann. N. Y. Acad. Sci. 2006, 912, 887–896. [Google Scholar] [CrossRef]
- Singh, H.; Myshakin, E.M.; Seol, Y. A nonempirical relative permeability model for hydrate-bearing sediments. SPE J. 2019, 24, 547–562. [Google Scholar] [CrossRef]
- Xu, C.G.; Yu, Y.S.; Ding, Y.L.; Cai, J.; Li, X. Sen The effect of hydrate promoters on gas uptake. Phys. Chem. Chem. Phys. 2017, 19, 21769–21776. [Google Scholar] [CrossRef] [PubMed]
- Kumar, A.; Maini, B.; Bishnoi, P.R.; Clarke, M.; Zatsepina, O.; Srinivasan, S. Experimental determination of permeability in the presence of hydrates and its effect on the dissociation characteristics of gas hydrates in porous media. J. Pet. Sci. Eng. 2010, 70, 114–122. [Google Scholar] [CrossRef]
- Mu, L.; Von Solms, N. Experimental Study on Methane Production from Hydrate-Bearing Sandstone by Flue Gas Swapping. Energy Fuels 2018, 32, 8167–8174. [Google Scholar] [CrossRef] [Green Version]
- Jarrar, Z.A.; Alshibli, K.A.; Al-Raoush, R.I.; Jung, J. 3D measurements of hydrate surface area during hydrate dissociation in porous media using dynamic 3D imaging. Fuel 2020, 265, 116978. [Google Scholar] [CrossRef]
- Waite, W.F.; Santamarina, J.C.; Cortes, D.D.; Dugan, B.; Espinoza, D.N.; Germaine, J.; Jang, J.; Jung, J.W.; Kneafsey, T.J.; Shin, H.; et al. Physical properties of hydrate-bearing sediments. Rev. Geophys. 2009, 47. [Google Scholar] [CrossRef]
- Stern, L.A.; Kirby, S.H.; Circone, S.; Durham, W.B. Scanning electron microscopy investigations of laboratory-grown gas clathrate hydrates formed from melting ice, and comparison to natural hydrates. Am. Mineral. 2004, 89, 1162–1175. [Google Scholar] [CrossRef]
- Chen, X.; Espinoza, D.N. Surface area controls gas hydrate dissociation kinetics in porous media. Fuel 2018, 234, 358–363. [Google Scholar] [CrossRef]
Figure 1.
Conceptual layout of the transport of CO2 gas molecule through different media and of the decrease in gas concentration arriving at CH4 hydrate surface.
Figure 1.
Conceptual layout of the transport of CO2 gas molecule through different media and of the decrease in gas concentration arriving at CH4 hydrate surface.

Figure 2.
Schematic diagram of the high-pressure cell assembly in A and dimensioning in B. (A) Schematic representation of the high pressure cell and associated assembly including cooling bath, Gas injection cylinder and data acquisition system; (B) Figure showing the dimension of the high pressure cell and visual representation of the system’s initial calculations.

Figure 3.
Schematic of the experimental investigation. GC1 is the gas sample collected just after CH4 venting and CO2 gas injection; GC2 is the second gas sample collected after 24-h soaking period.
Figure 3.
Schematic of the experimental investigation. GC1 is the gas sample collected just after CH4 venting and CO2 gas injection; GC2 is the second gas sample collected after 24-h soaking period.

Figure 4.
Schematic of gas injection into methane hydrate-containing sediments and subsequent CO2 injection.
Figure 4.
Schematic of gas injection into methane hydrate-containing sediments and subsequent CO2 injection.

Figure 5.
Pressure and temperature profiles for CH4 hydrate formation under 500 ppm SDS with different initial solution saturations. (A) P-T Profile during methane hydrate formation in the presence of SDS 500 ppm and Swi = 22.4%; (B) P-T Profile during methane hydrate formation in the presence of SDS 500 ppm and Swi = 43.6%.

Figure 6.
Pressure and temperature profiles for CH4 hydrate formation experiments for water (left) and methionine (right) with the same experimental parameters (injection pressure ≈ 85 bar, Swi ≈ 44%, and targeted temperature 1 °C). (A) P-T Profile during methane hydrate formation in the presence of Water and Swi = 43.9%; (B) P-T Profile during methane hydrate formation in the presence of L-methionine and Swi = 44.4%.

Figure 7.
Pressure and temperature (P-T) profiles for CH4 hydrate formation with 5 wt% MeOH in different initial solution saturations. (A) P-T Profile during methane hydrate formation in the presence of MeOH and Swi = 43.5%; (B) P-T Profile during methane hydrate formation in the presence of MeOH and Swi = 66.1%; (C) P-T Profile during methane hydrate formation in the presence of MeOH and Swi = 30.5%; (D) P-T Profile during methane hydrate formation in the presence of MeOH and Swi = 45.5%.

Figure 8.
Hydrate saturation and induction time (fresh and memory) for experiments 8–12. (A) Variation in SH and Swi during experiments 8–12; (B) Variation in induction time (to) (Fresh/memory) during experiments 8–12.
Figure 8.
Hydrate saturation and induction time (fresh and memory) for experiments 8–12. (A) Variation in SH and Swi during experiments 8–12; (B) Variation in induction time (to) (Fresh/memory) during experiments 8–12.

Figure 9.
Conceptual layout showing key hydrate formation mechanisms during CO2 injection into methane hydrate deposits and the role of residual pore water and methane hydrate saturation.
Figure 9.
Conceptual layout showing key hydrate formation mechanisms during CO2 injection into methane hydrate deposits and the role of residual pore water and methane hydrate saturation.

Figure 10.
Hydrate formation mechanism at the gas–liquid interface and gas–hydrate interface and their relationship.
Figure 10.
Hydrate formation mechanism at the gas–liquid interface and gas–hydrate interface and their relationship.

Figure 11.
CH4-CO2 exchange mechanism in the presence of promoter and water and their interconnection. Promoter increases CO2 storage but also reduces CH4 recovery due to thin CO2 hydrate barrier and CH4 reformation.
Figure 11.
CH4-CO2 exchange mechanism in the presence of promoter and water and their interconnection. Promoter increases CO2 storage but also reduces CH4 recovery due to thin CO2 hydrate barrier and CH4 reformation.

Figure 12.
CH4-CO2 exchange mechanism in the presence of MeOH in water. MeOH enhances CH4 replacement and improves CO2 storage due to enhanced thermodynamics of CH4-CO2 exchange and delay in CO2 hydrate film formation at gas–liquid interface.
Figure 12.
CH4-CO2 exchange mechanism in the presence of MeOH in water. MeOH enhances CH4 replacement and improves CO2 storage due to enhanced thermodynamics of CH4-CO2 exchange and delay in CO2 hydrate film formation at gas–liquid interface.

Figure 13.
Pressure profiles for CH4-CO2 replacement process 24 h after soaking in experiments 5–8 having similar Swi but in the presence of different additives in the water. Sudden drop in pressure at the end of 24 h corresponds to gas collection for GC analysis followed by controlled depressurization. (A) Pressure profile after CO2 injection and during the soaking period in experiment 5; (B) Pressure profile after CO2 injection and during the soaking period in experiment 6; (C) Pressure profile after CO2 injection and during the soaking period in experiment 7; (D) Pressure profile after CO2 injection and during the soaking period in experiment 8.

Figure 14.
Pressure profiles for CH4-CO2 replacement process at 1 °C and for 24-h soaking period. Experiments 8–10 at different Swi and in the presence 5 wt% MeOH in water. Sudden drop in pressure at the end of 24 h corresponds to gas collection for GC analysis followed by controlled depressurization. (A) Pressure profile after CO2 injection and during the soaking period in experiment 8; (B) Pressure profile after CO2 injection and during the soaking period in experiment 9; (C) Pressure profile after CO2 injection and during the soaking period in experiment 10.

Figure 15.
CH4-CO2 exchange key recovery ratios for different initial water saturations and corresponding hydrate saturations. (A) Soaking ratios for different initial water saturation (Swi) during experiments 8–10; (B) Soaking ratios for different hydrate saturation (SH) during experiments 8–10.
Figure 15.
CH4-CO2 exchange key recovery ratios for different initial water saturations and corresponding hydrate saturations. (A) Soaking ratios for different initial water saturation (Swi) during experiments 8–10; (B) Soaking ratios for different hydrate saturation (SH) during experiments 8–10.

Figure 16.
Pressure profiles for CH4-CO2 replacement process 24 h after soaking during experiment 11 and experiment 12. These experiments were performed at T = 4 °C. Experiments were performed with different Swi and in the presence of 5 wt% of MeOH in the water. Sudden drop in pressure at the end of 24 h corresponds to gas collection for GC analysis followed by controlled depressurization. (A) Pressure profile after CO2 injection and during the soaking period in experiment 11 (B) Pressure profile after CO2 injection and during the soaking period in experiment 12.

Figure 17.
Flow chart illustrating different factors contributing to enhanced CH4-CO2 exchange as discussed in the manuscript and influence of anti-agglomerate/inhibitor compounds in improving exchange and its impact on different factors (highlighted in yellow).
Figure 17.
Flow chart illustrating different factors contributing to enhanced CH4-CO2 exchange as discussed in the manuscript and influence of anti-agglomerate/inhibitor compounds in improving exchange and its impact on different factors (highlighted in yellow).


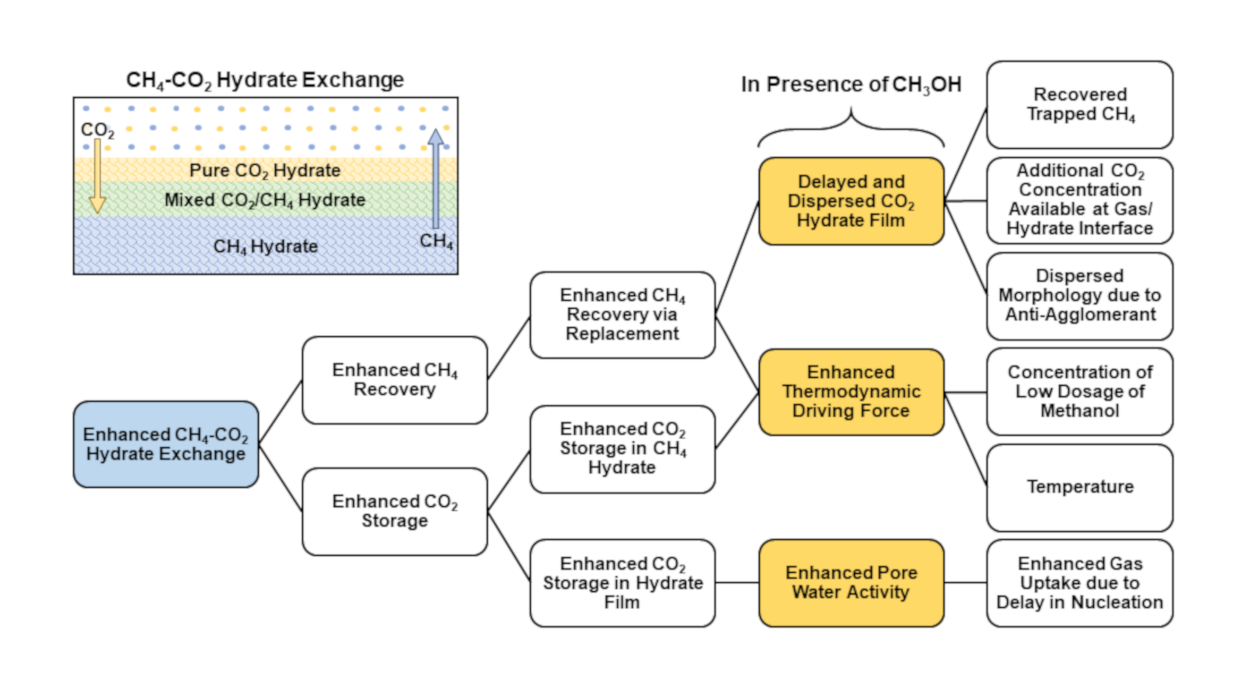
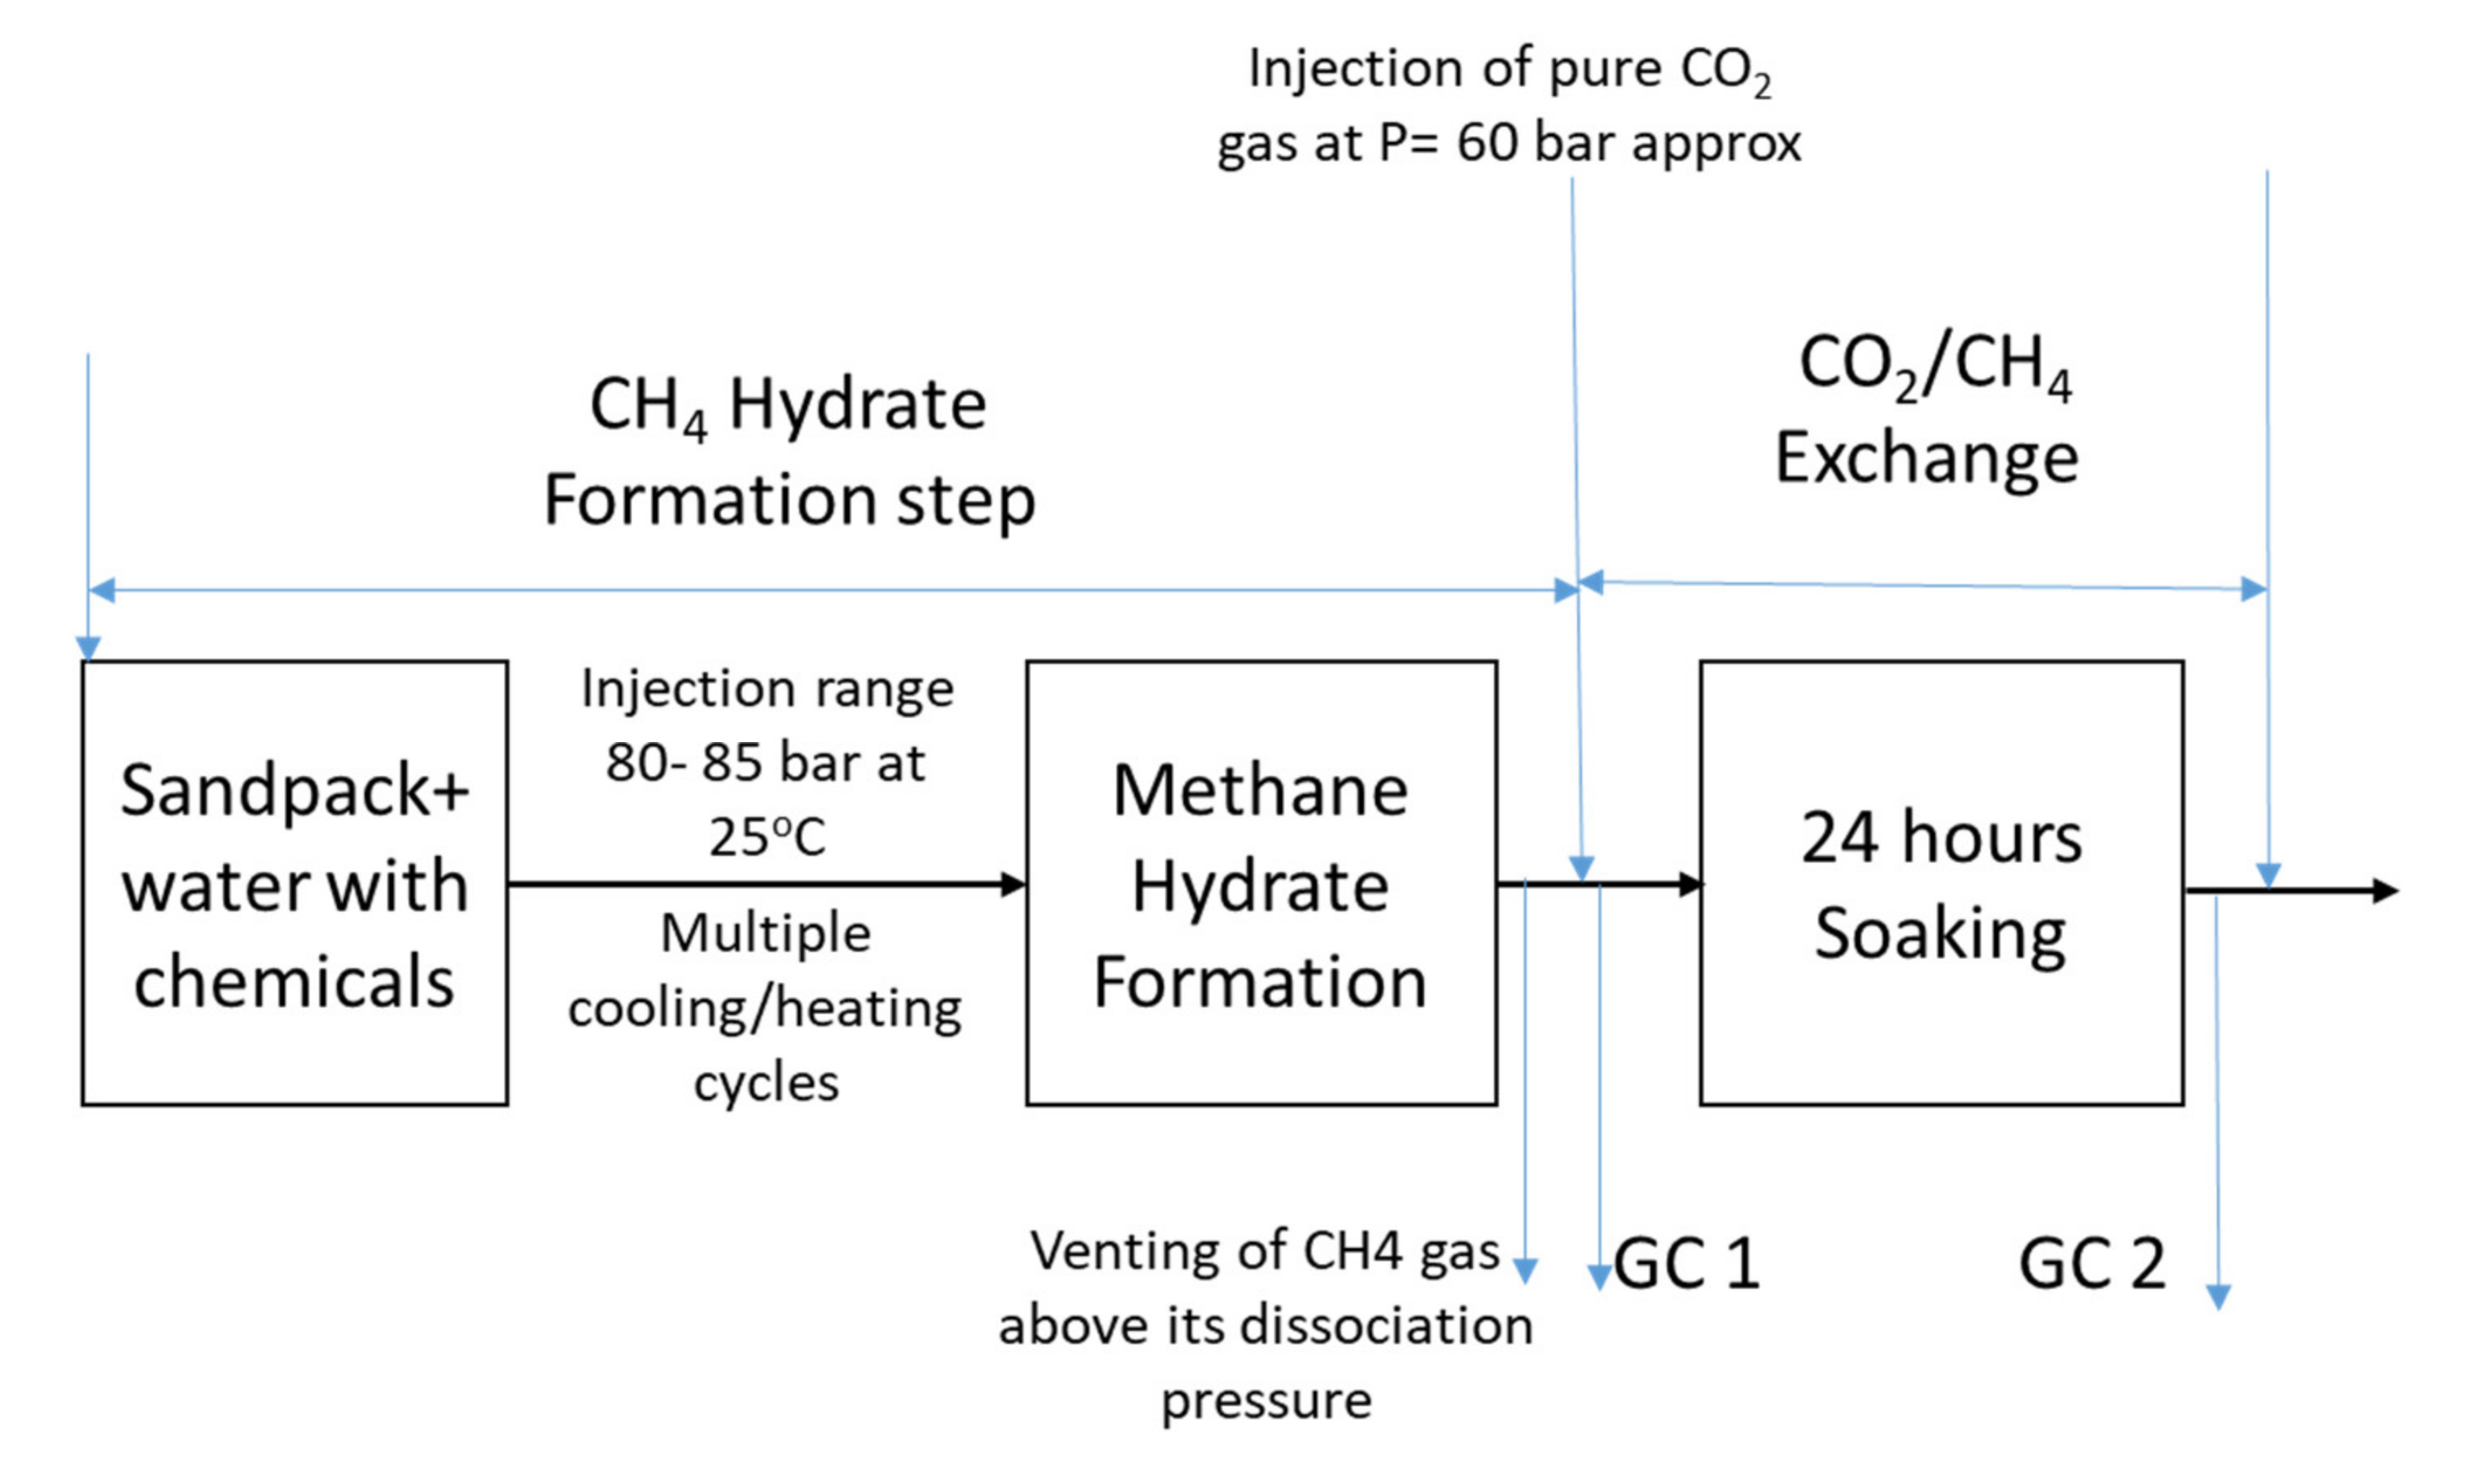
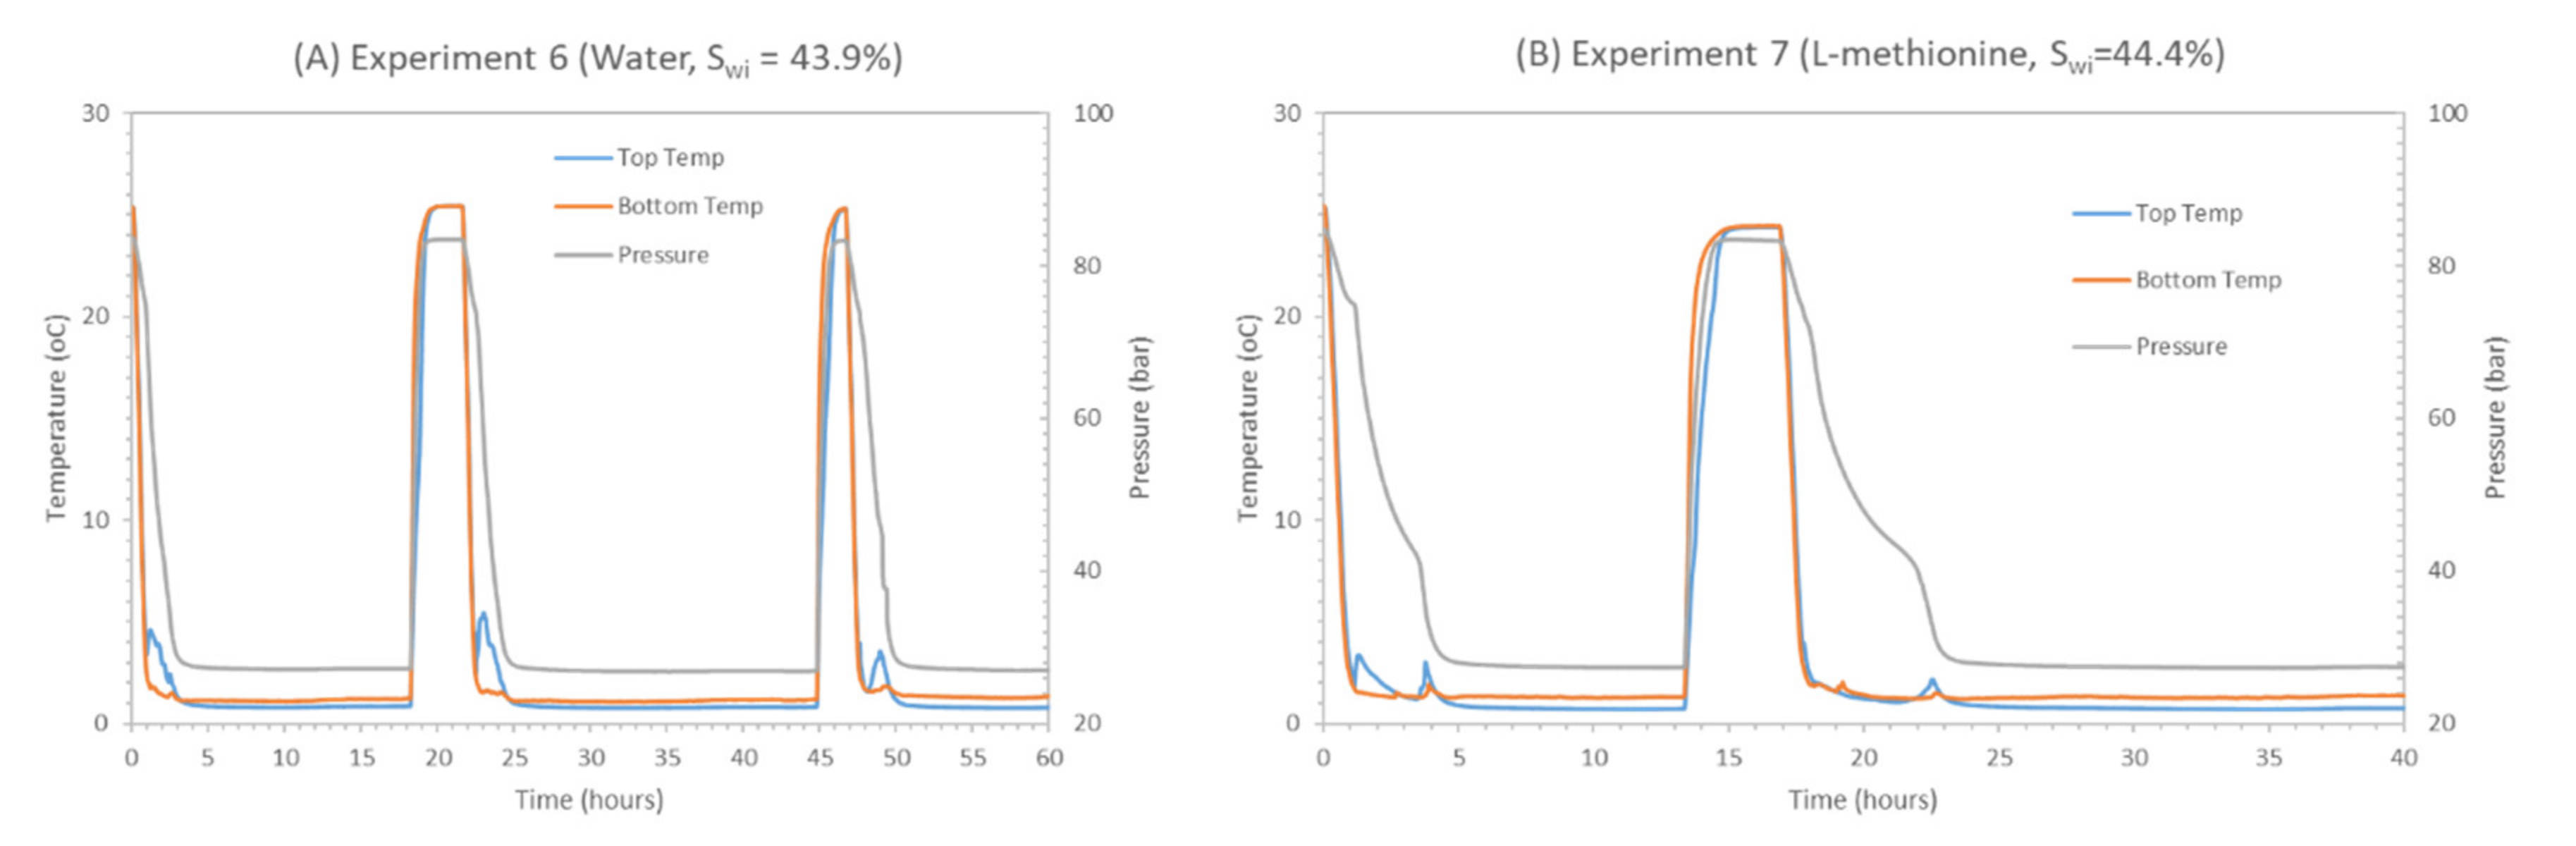
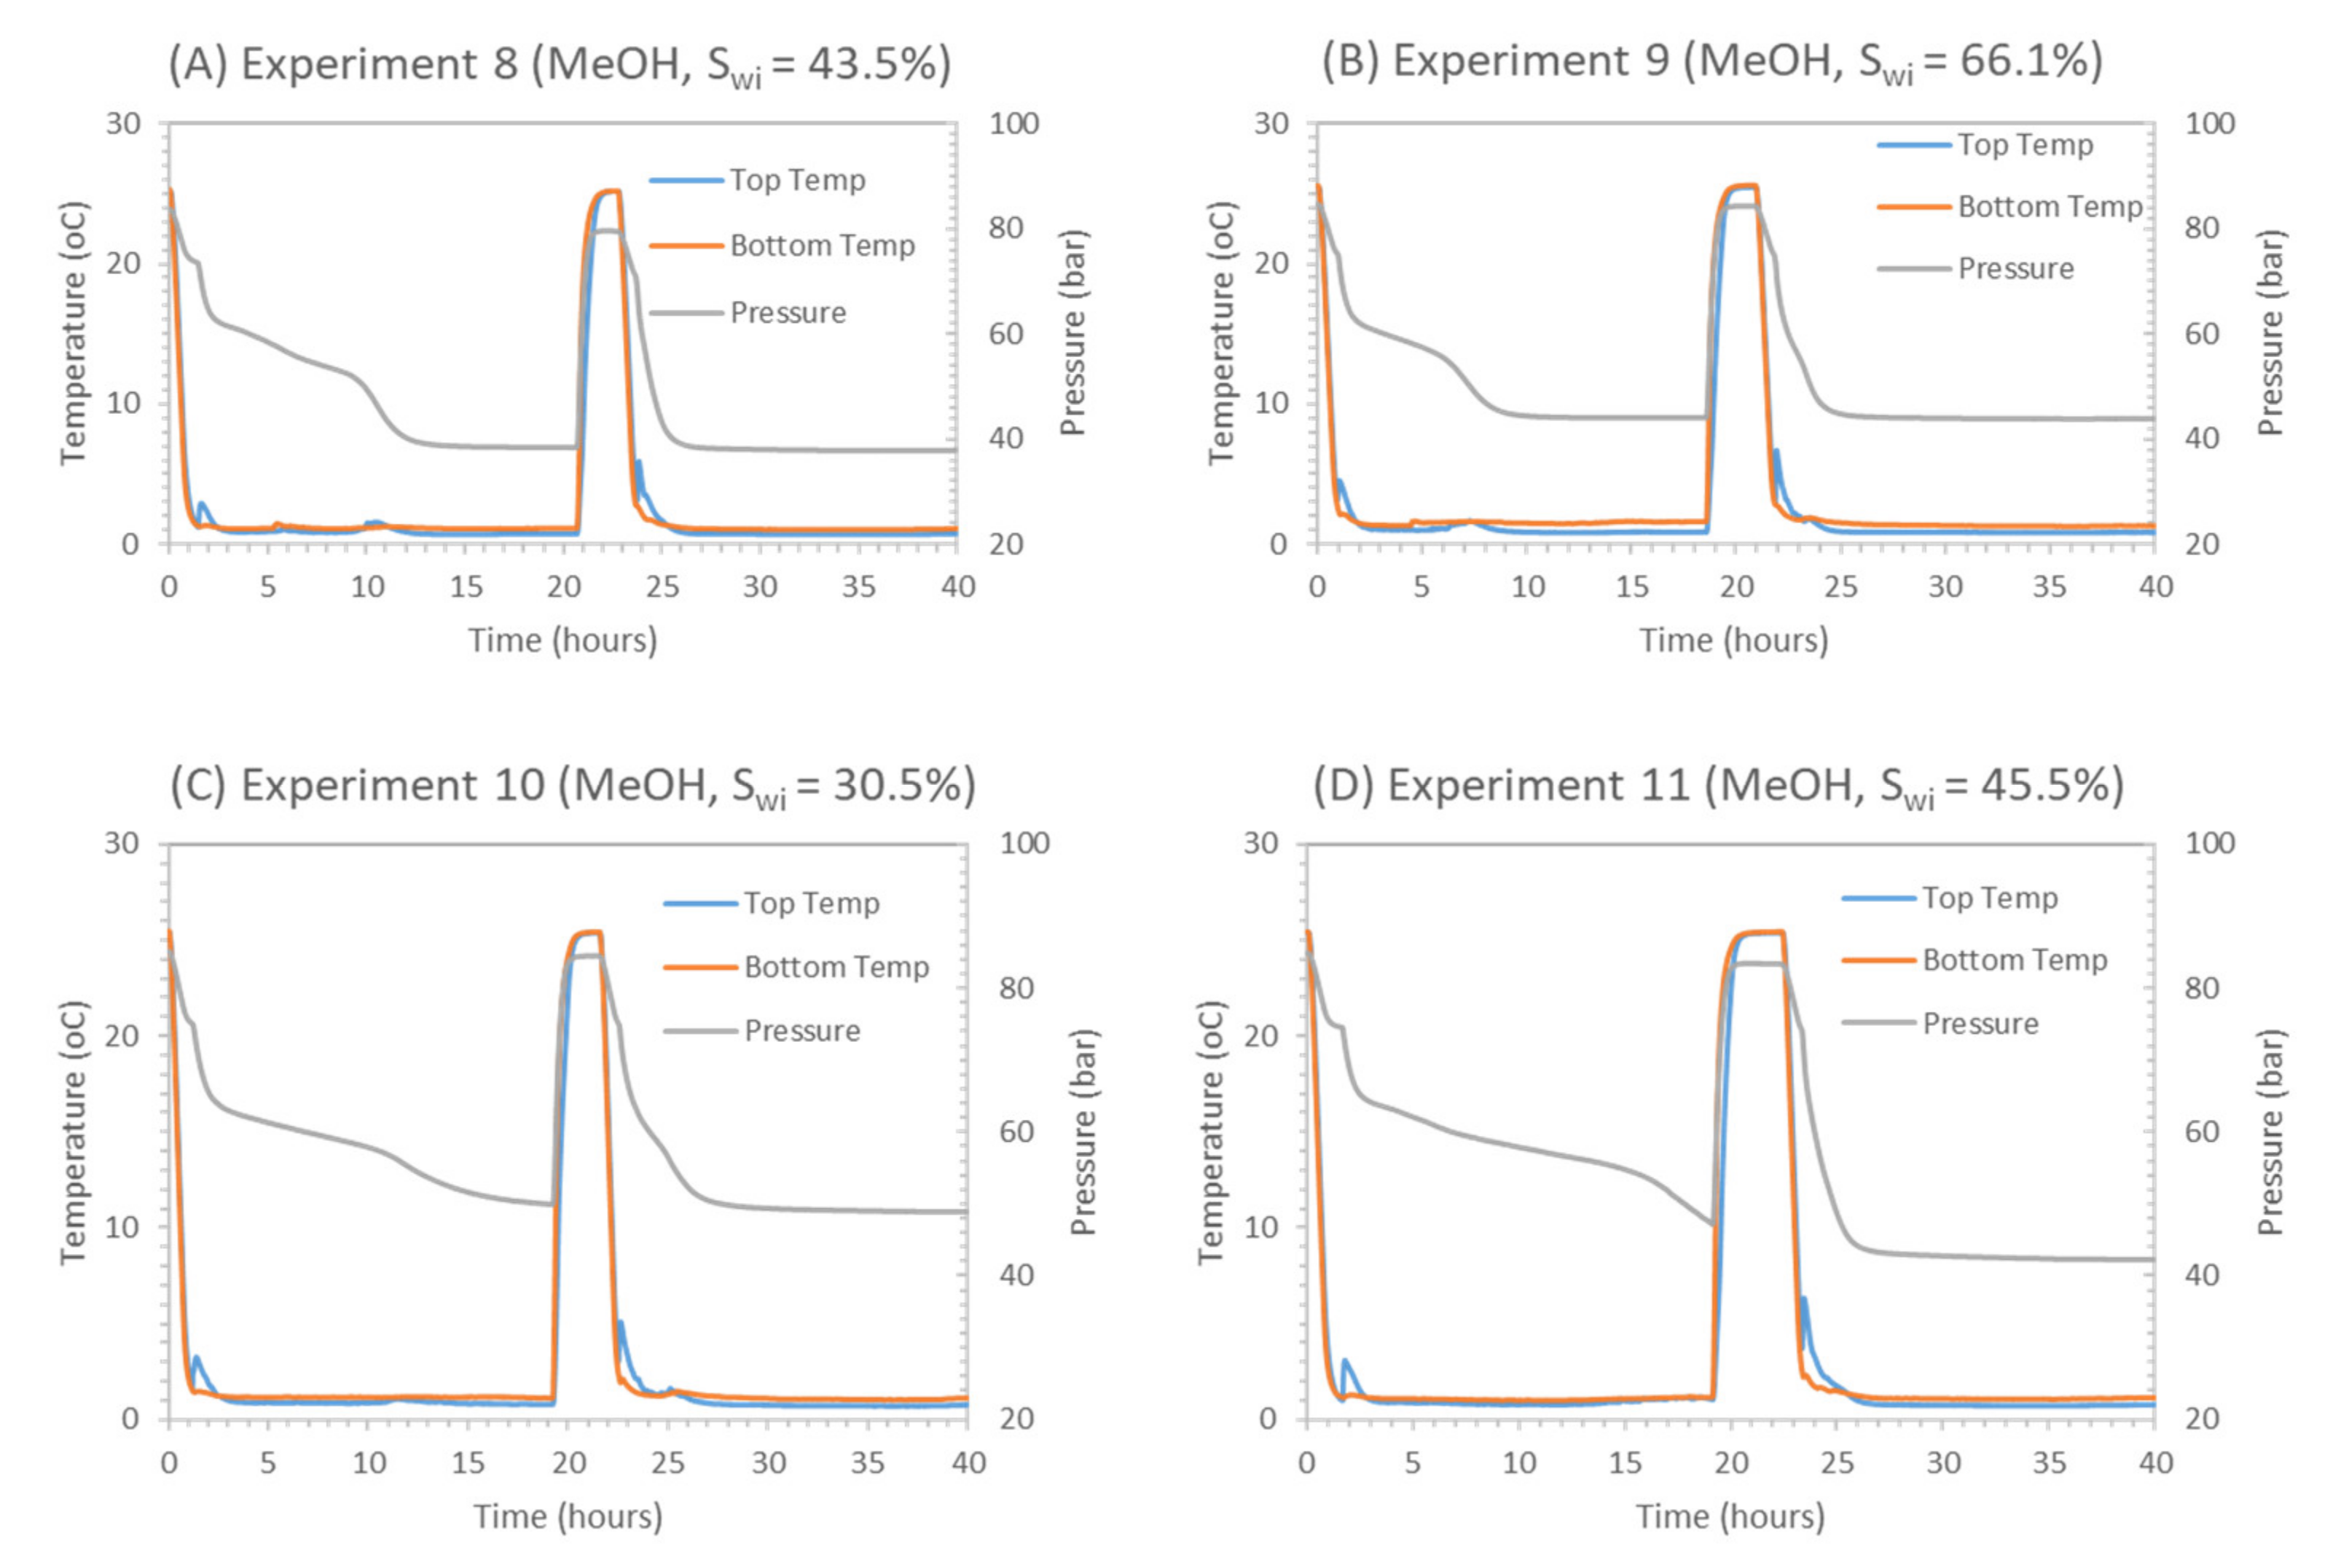
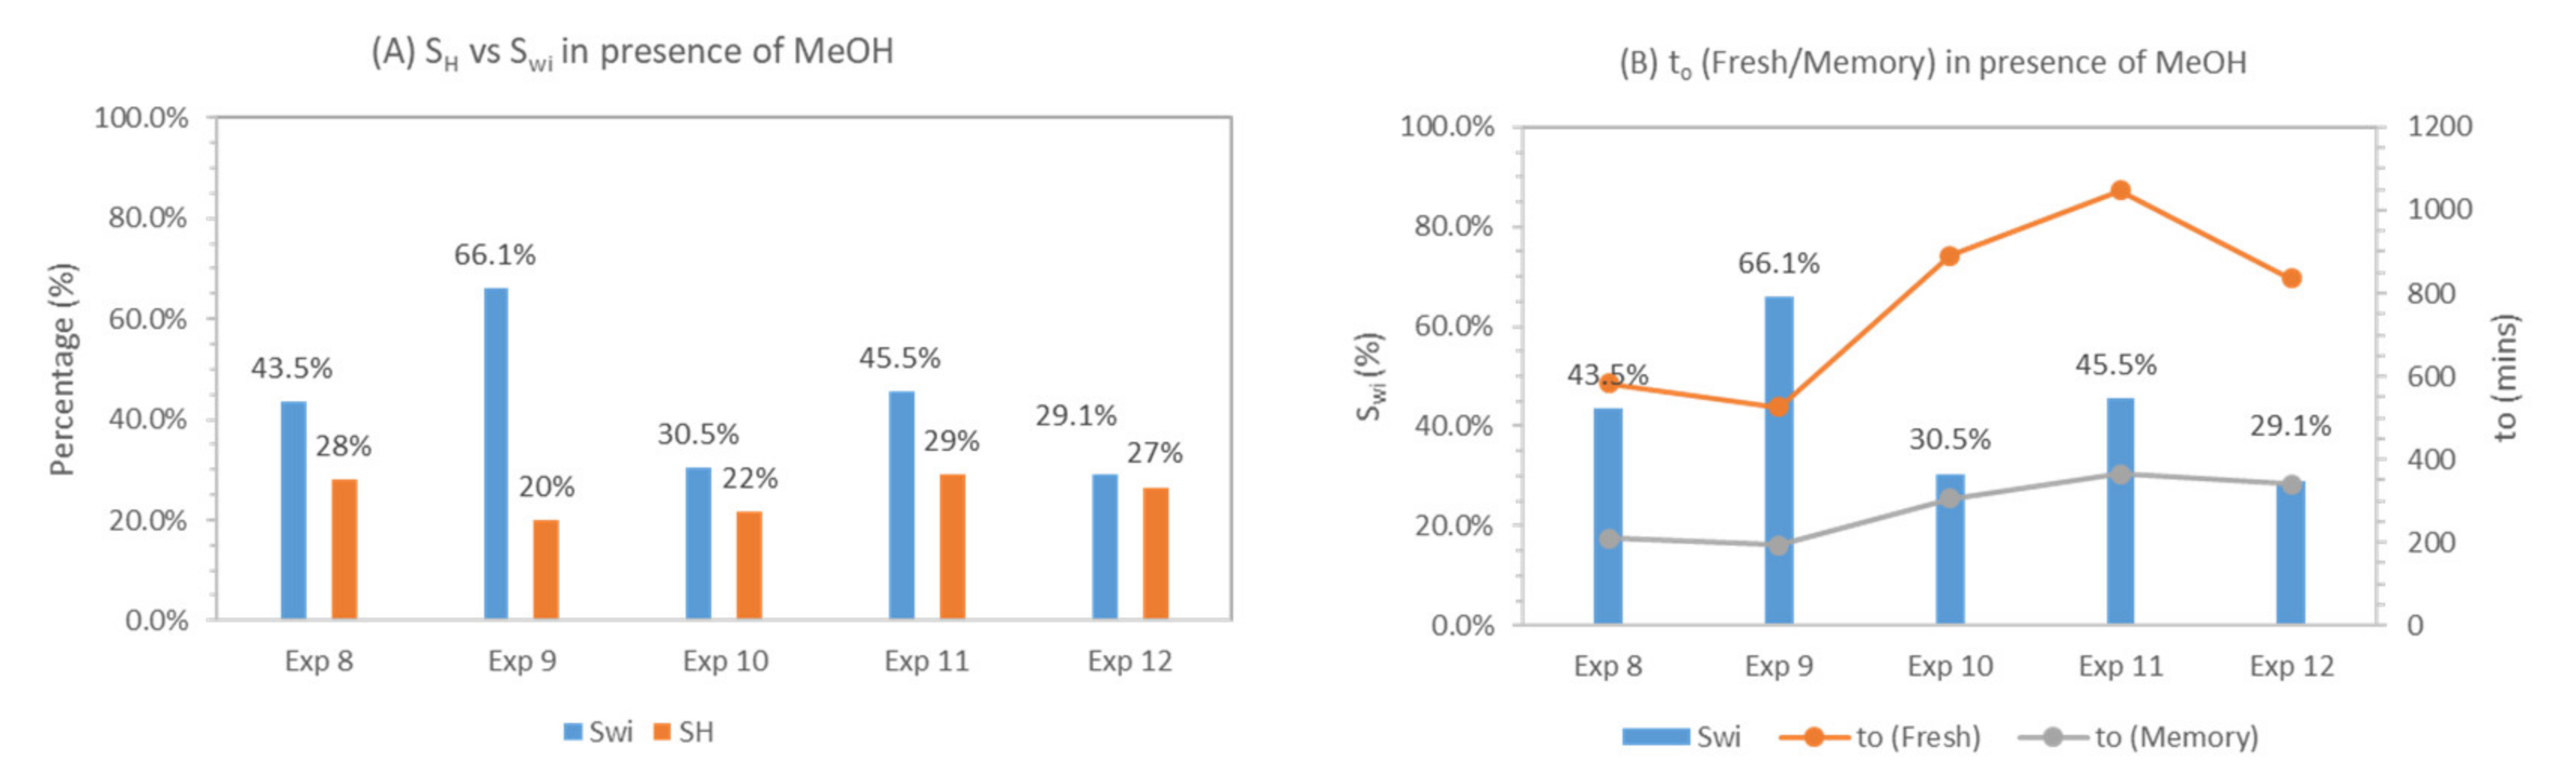
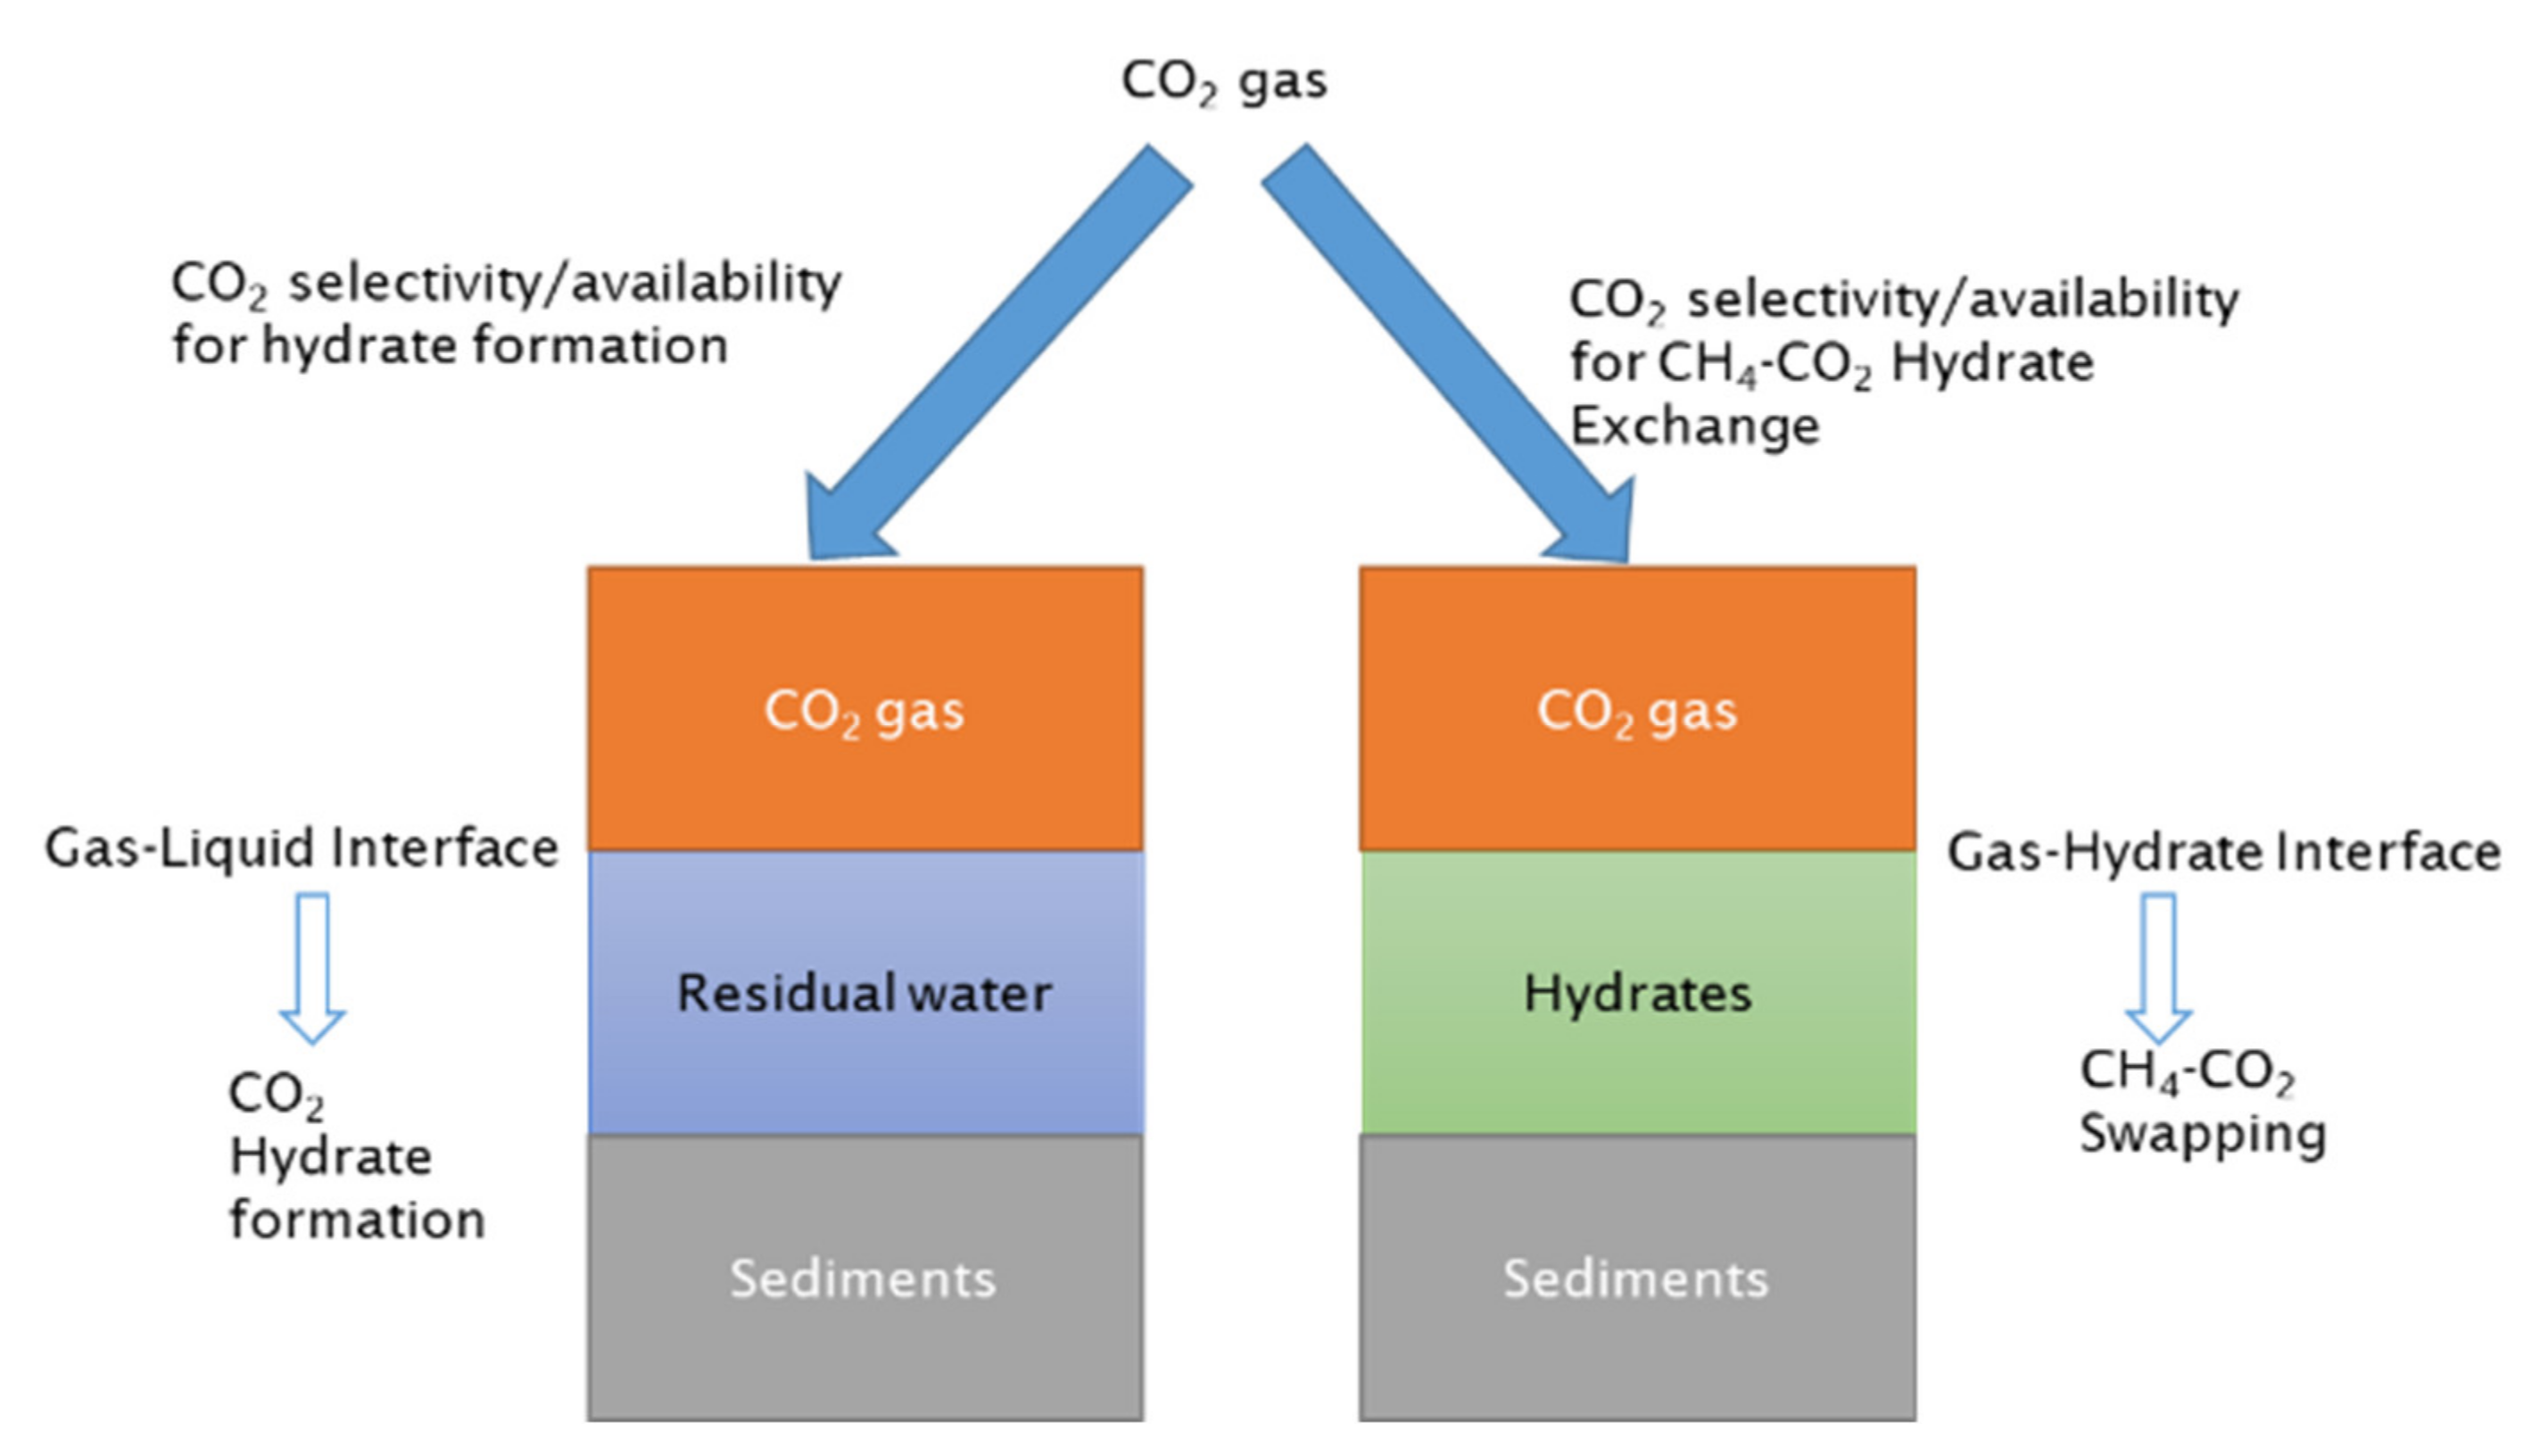
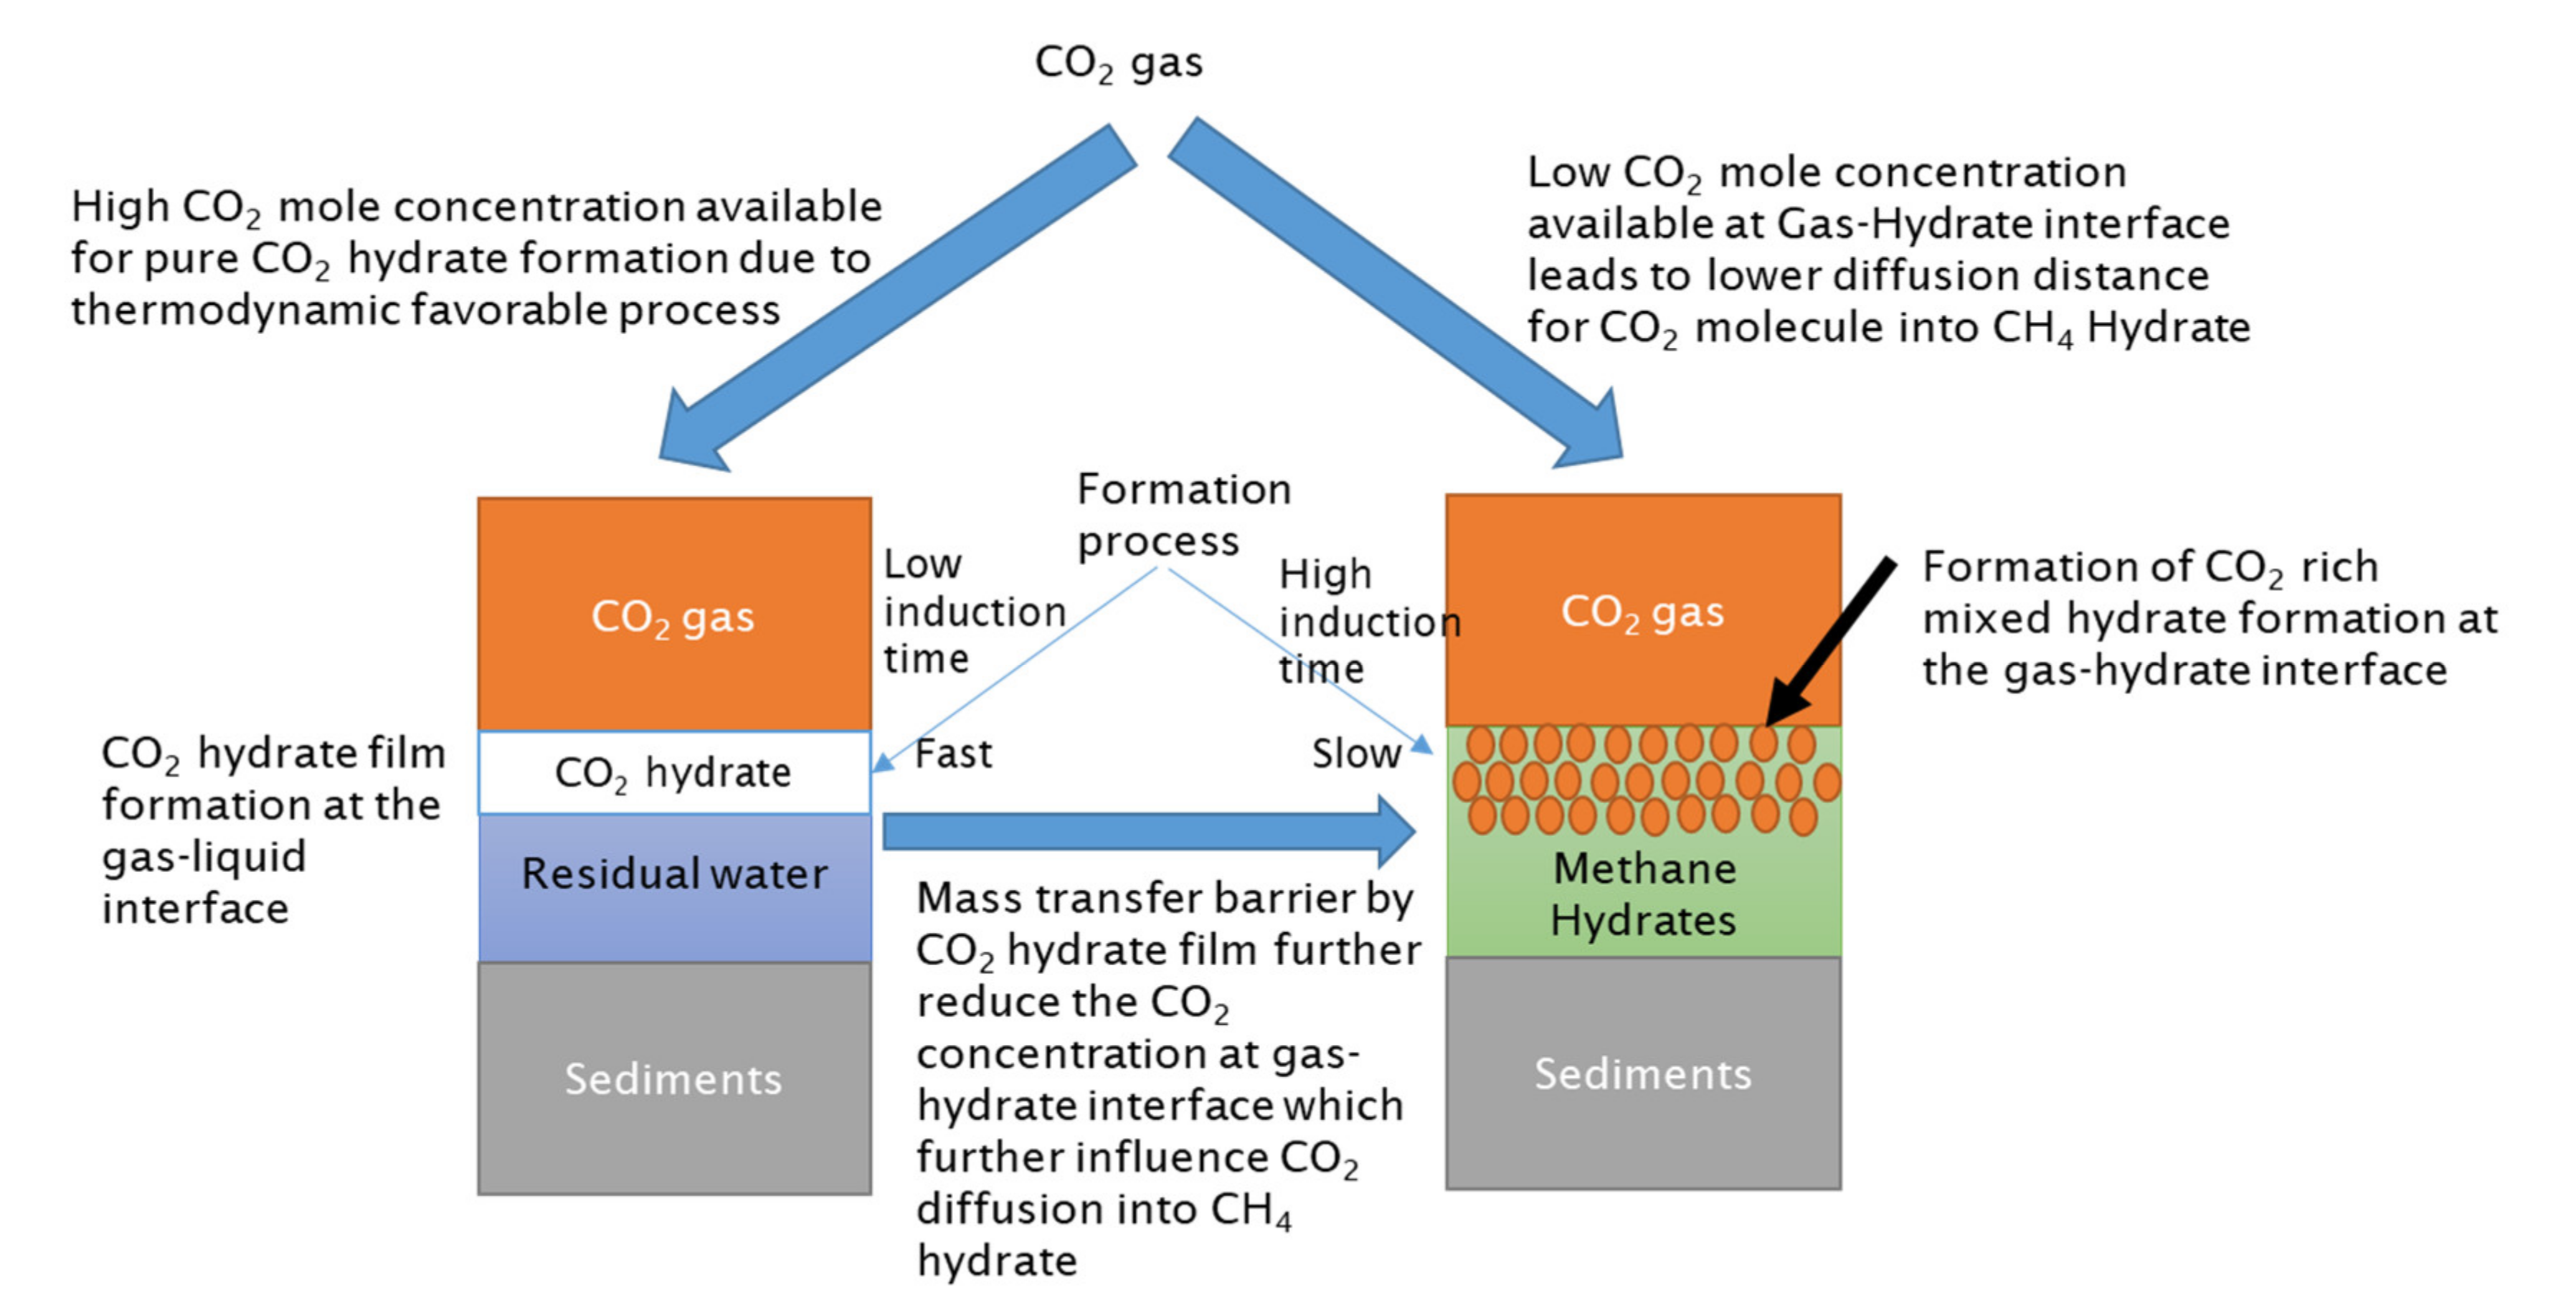
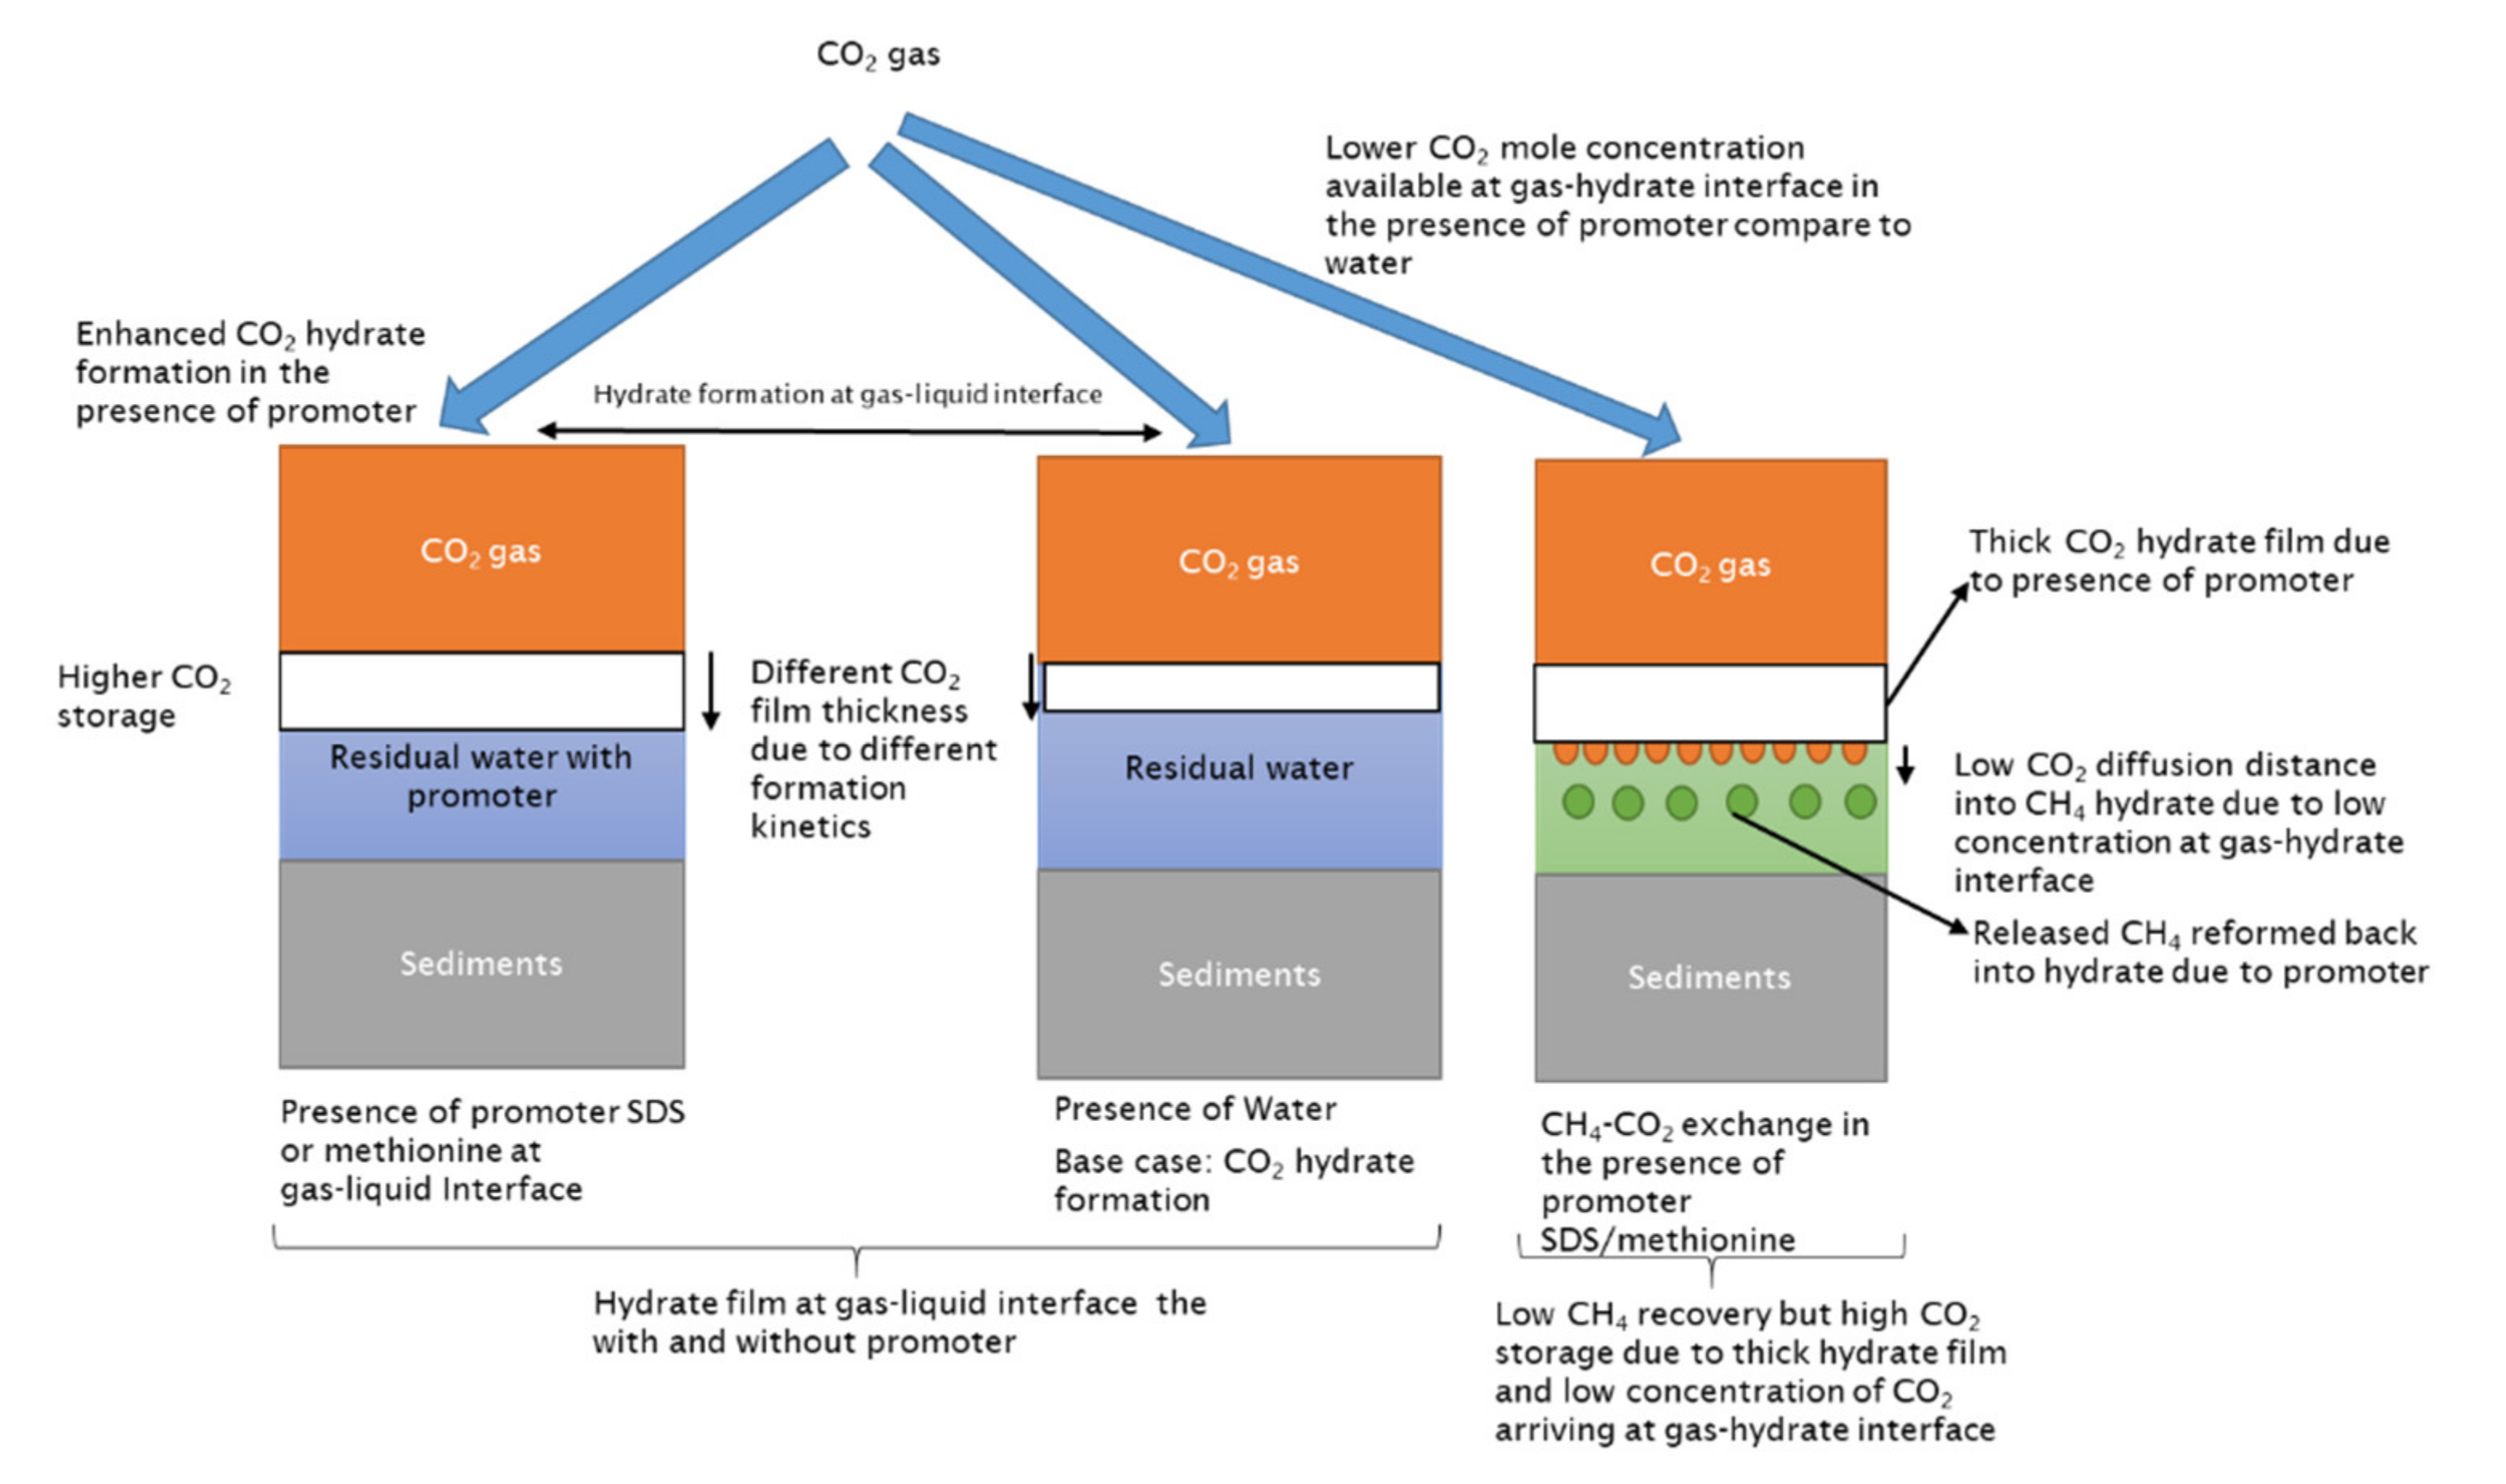
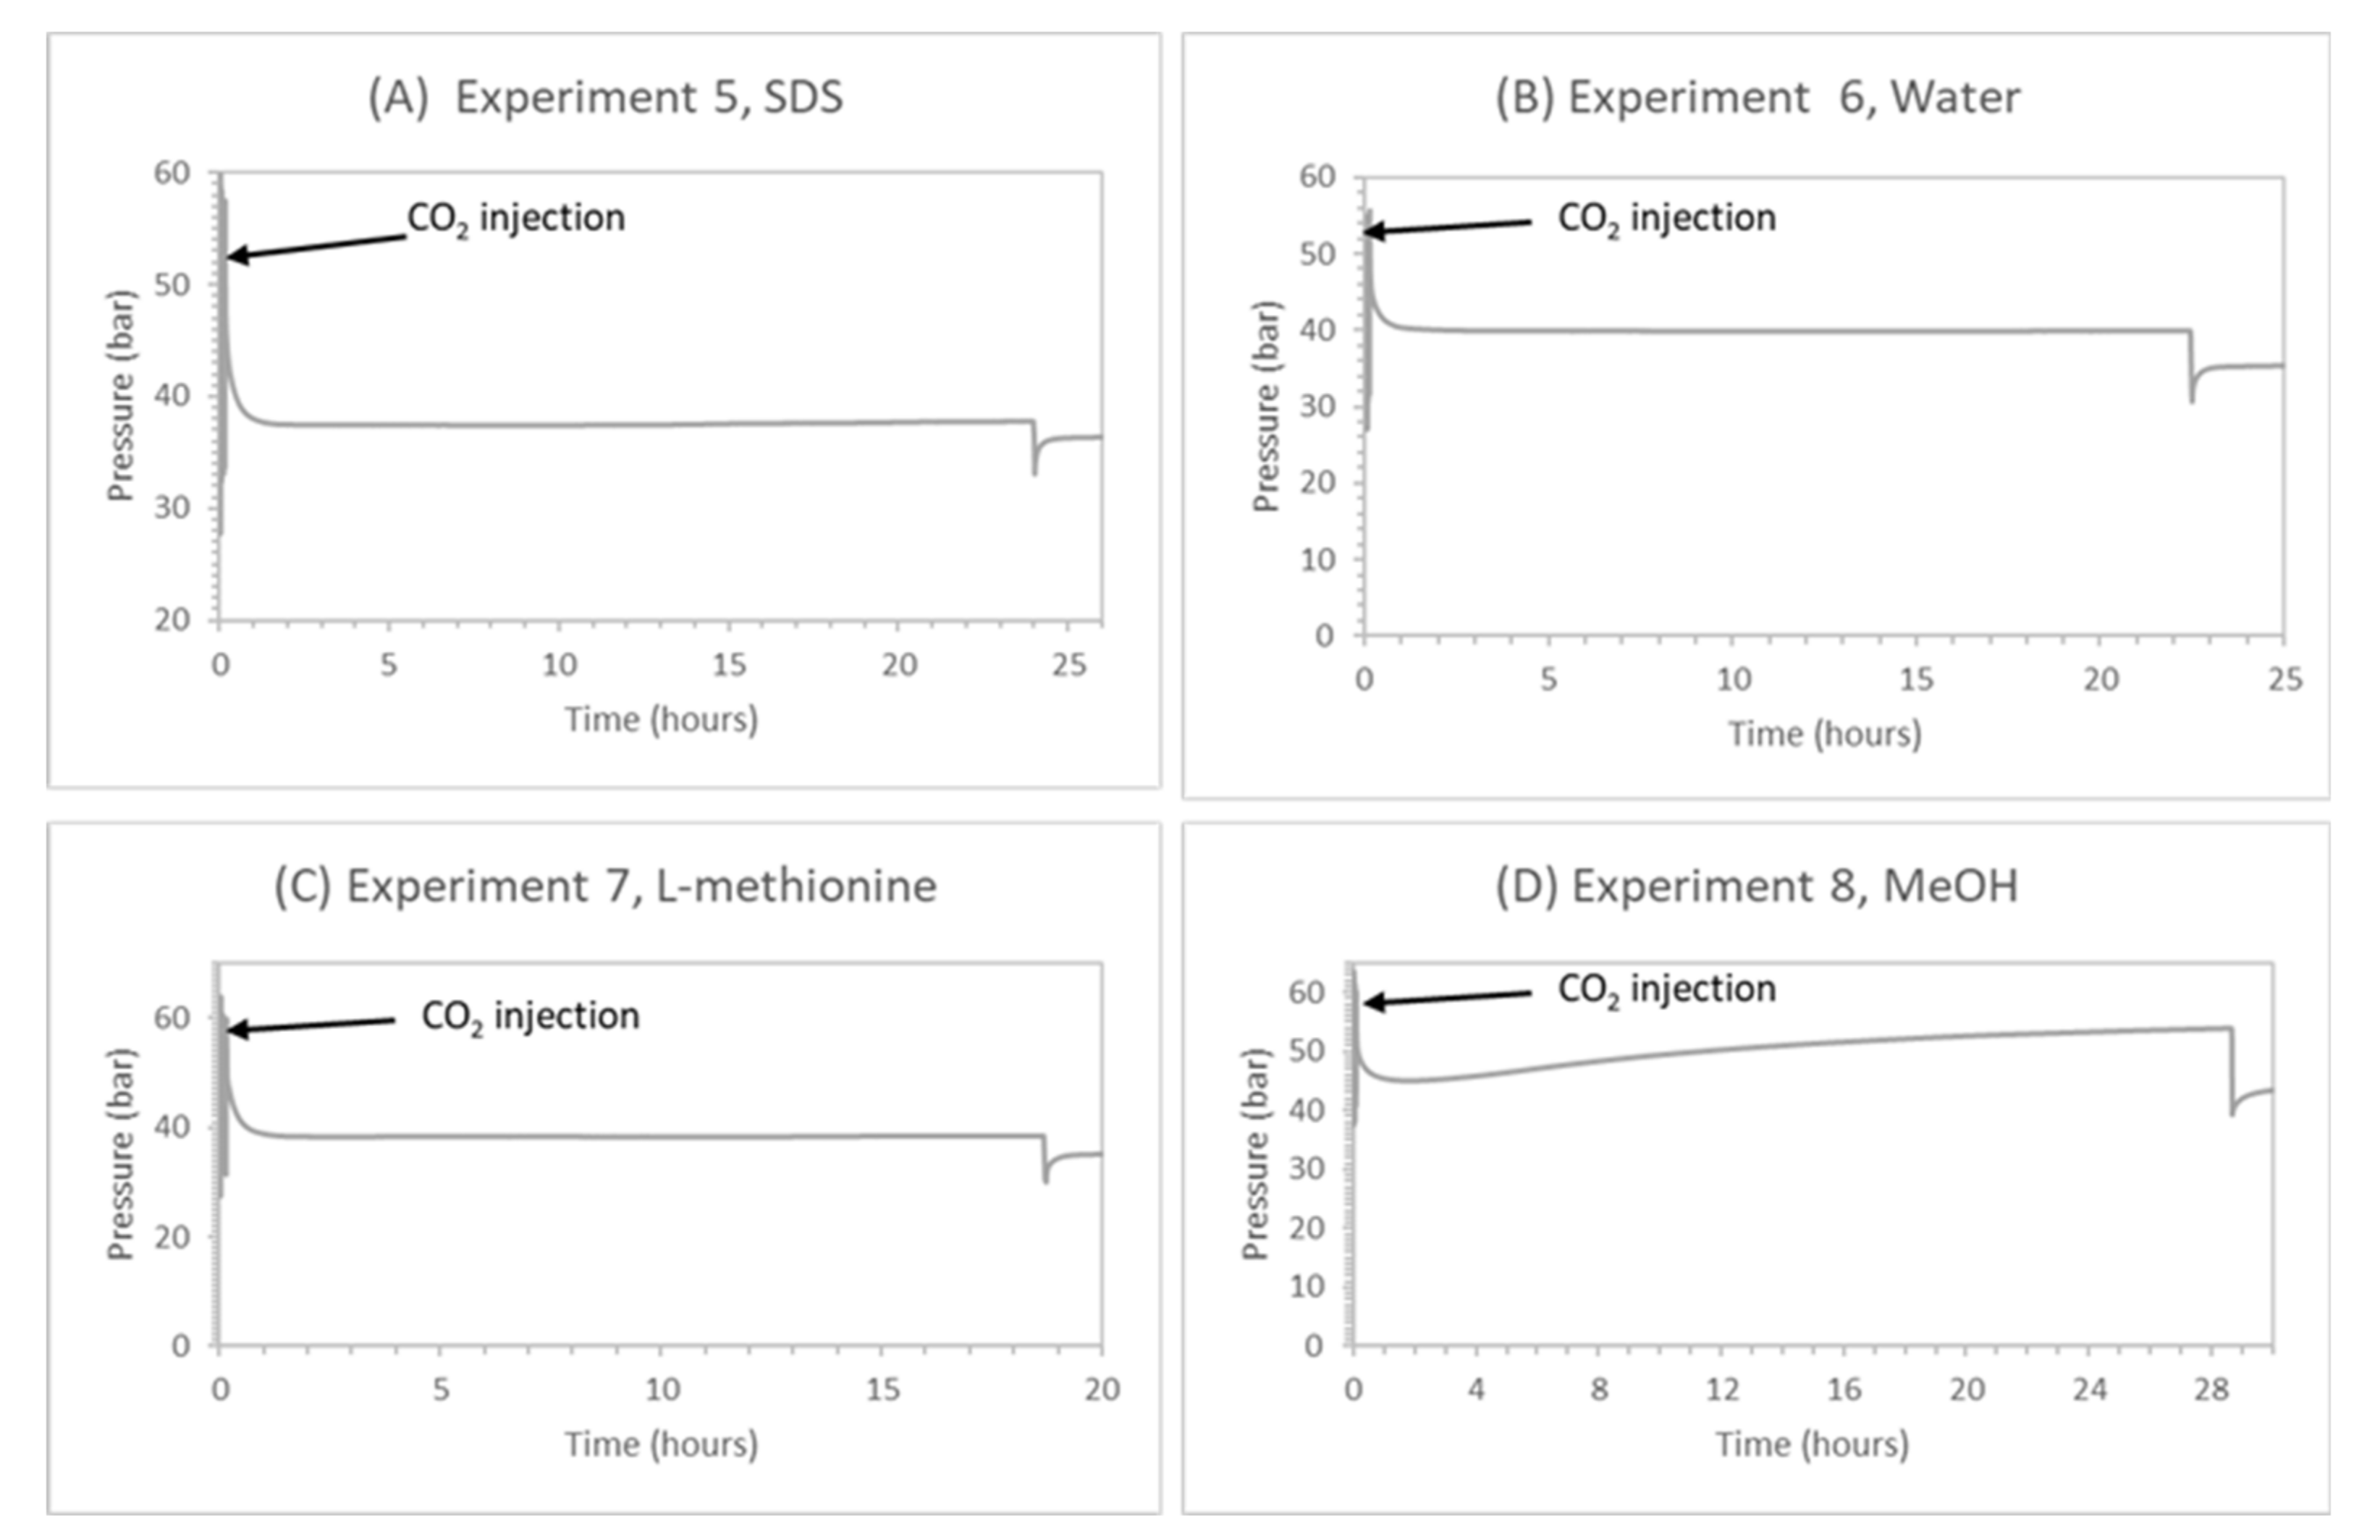
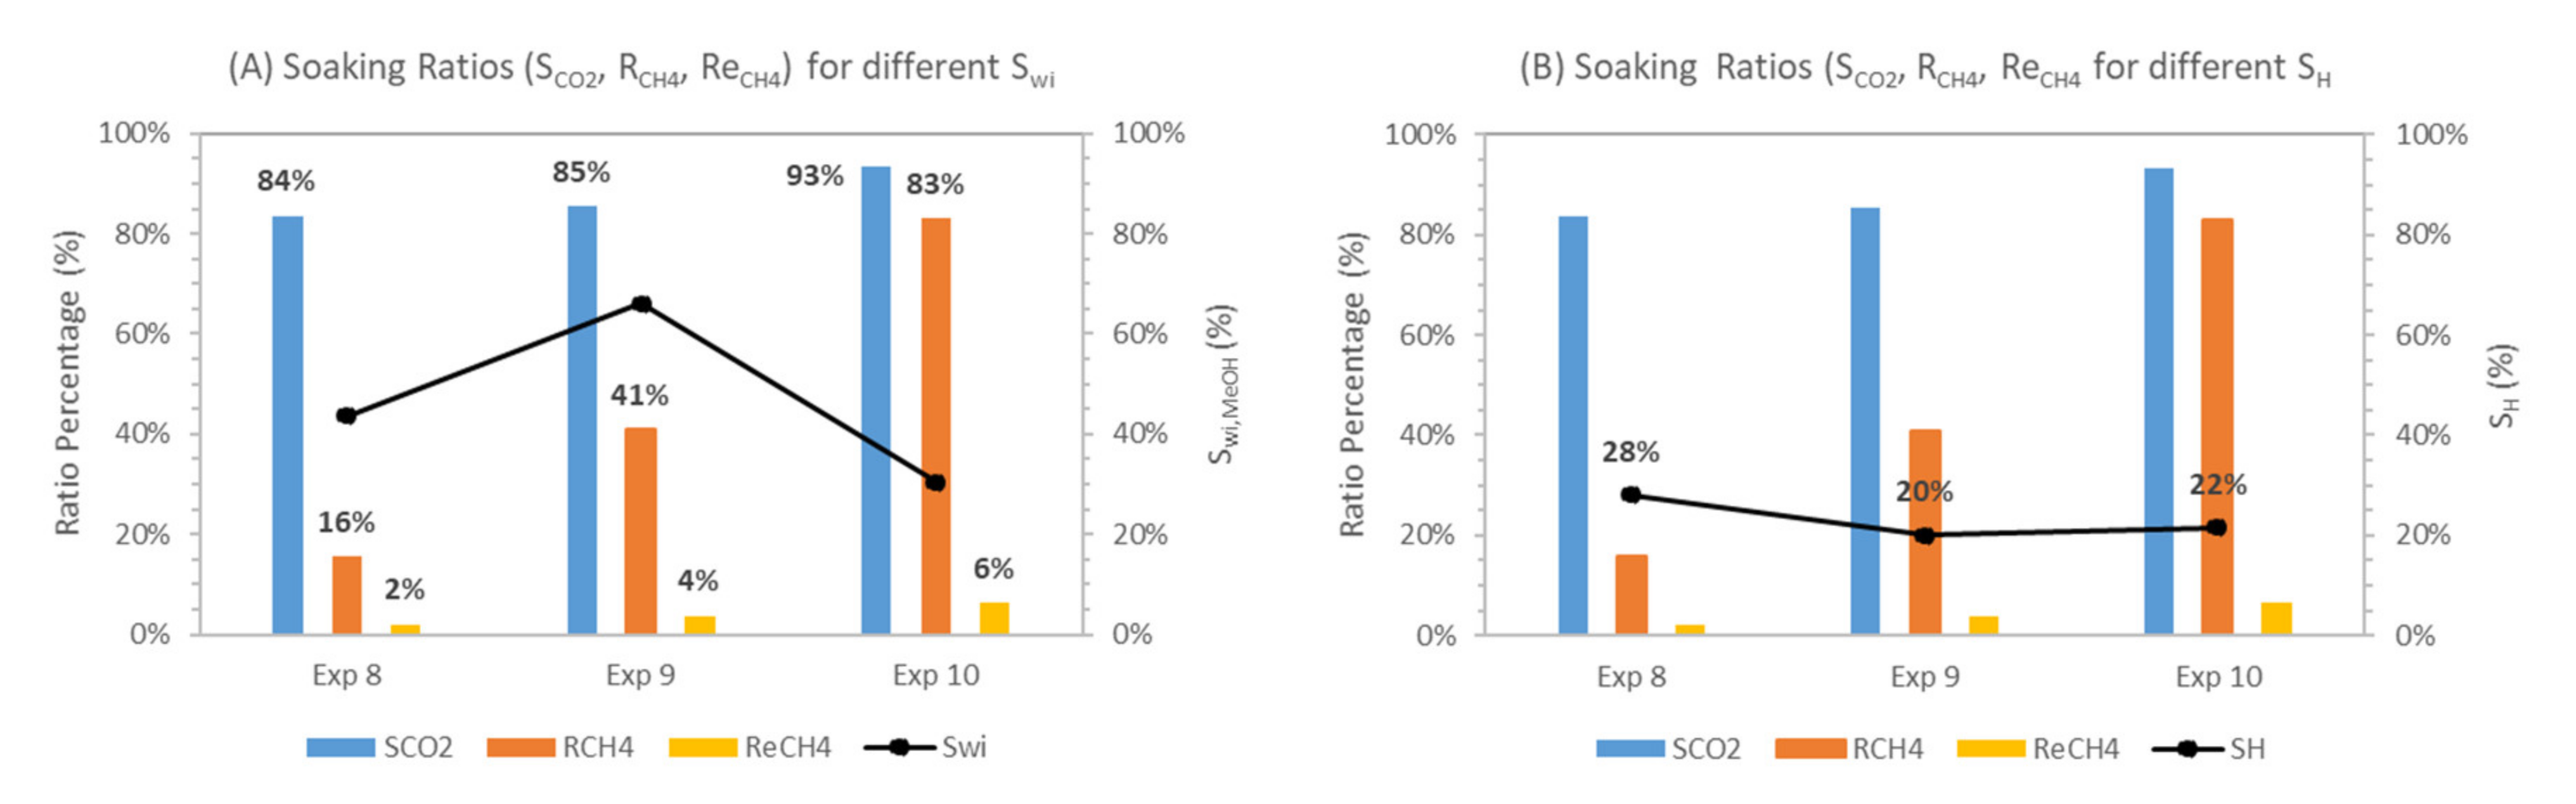
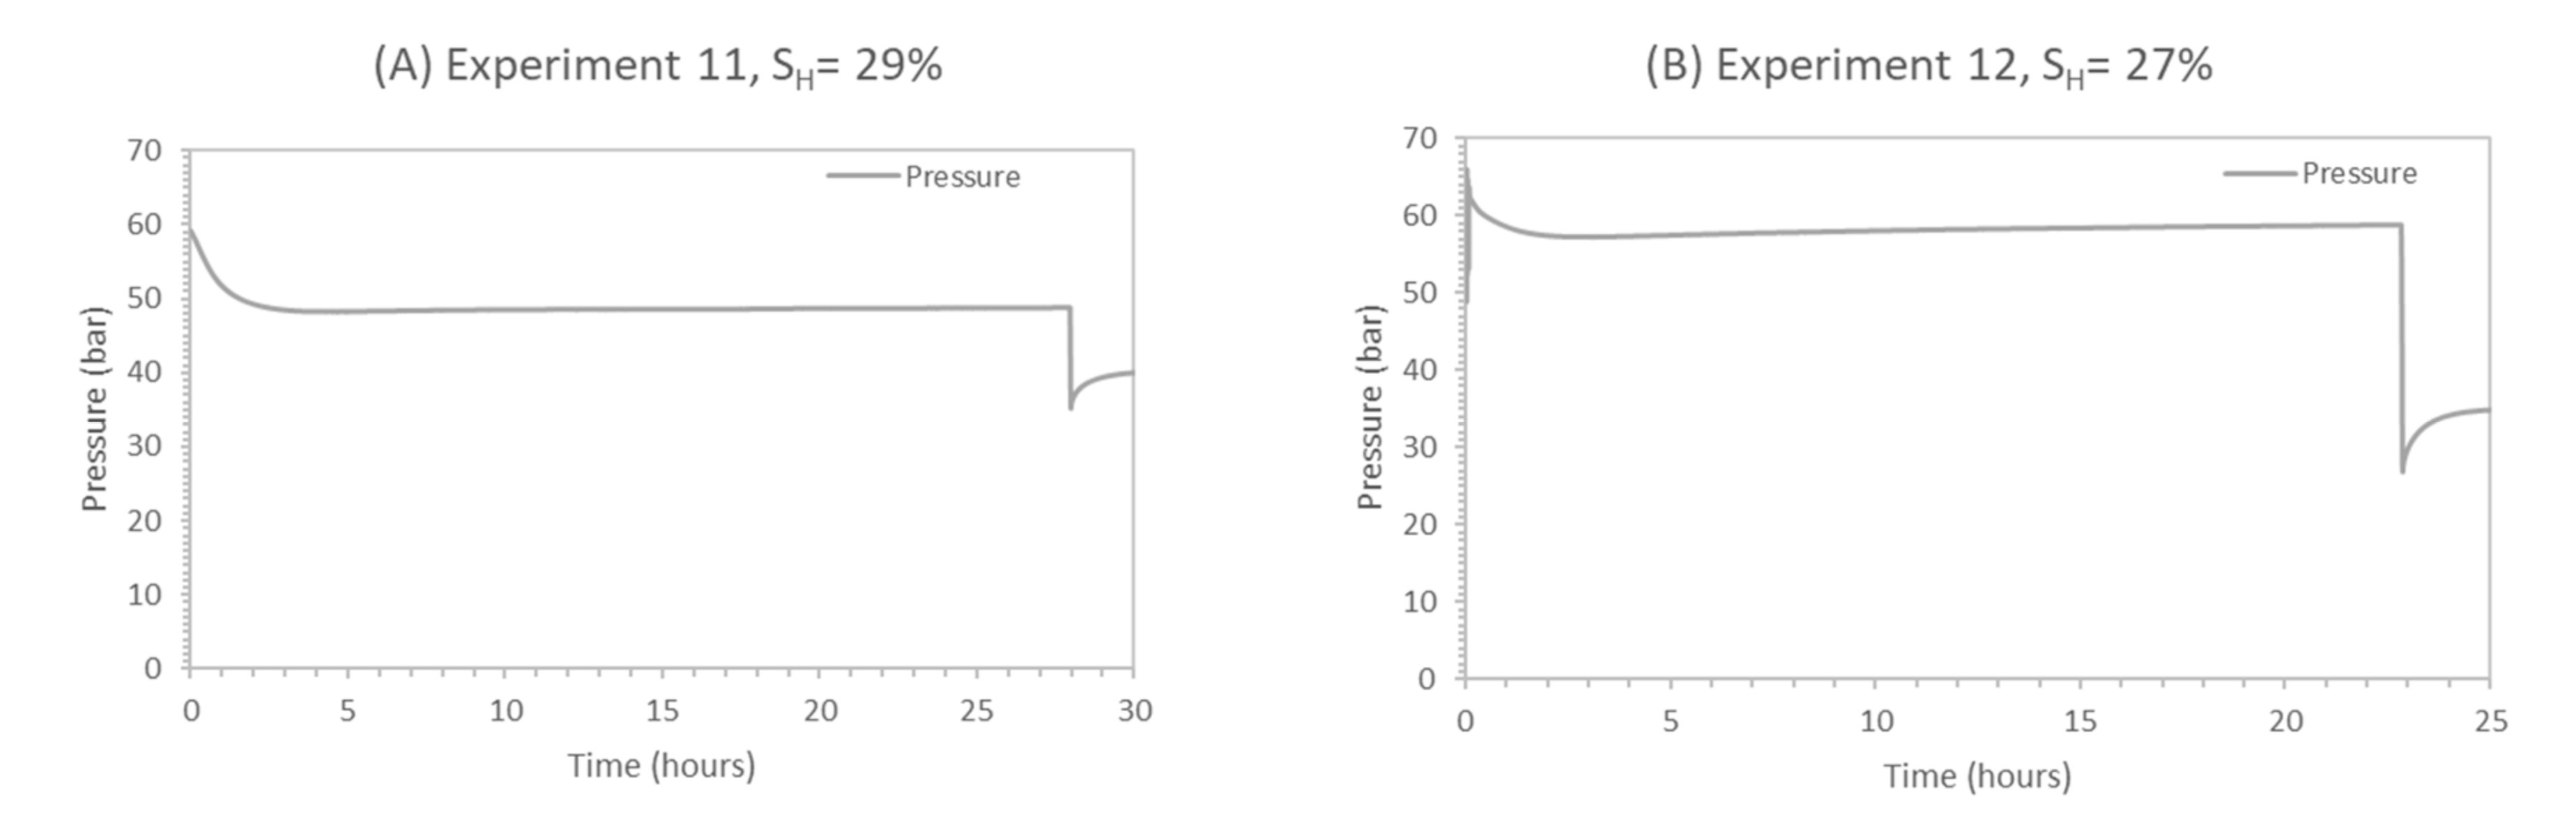
Table 1.
Chemical types and respective concentrations used in experiments.
| Solutions | Concentration | Unit |
|---|---|---|
| SDS | 500 | ppm |
| L-methionine | 500 | ppm |
| MeOH | 5 | wt% |
Table 2.
Change in driving force (Peq,CH4 − Peq,CO2) at different temperatures in the presence of different concentrations of methanol and NaCl. Values were calculated using CSMGem software.
Table 2.
Change in driving force (Peq,CH4 − Peq,CO2) at different temperatures in the presence of different concentrations of methanol and NaCl. Values were calculated using CSMGem software.
| Driving Force, ΔP = Peq,CH4 − Peq,CO2 | ||||||
|---|---|---|---|---|---|---|
| T | Water | MeOH, 1 wt% | MeOH, 5 wt% | MeOH, 10 wt% | NaCl, 1 wt% | NaCl, 5 wt% |
| (°C) | (bar) | (bar) | (bar) | (bar) | (bar) | (bar) |
| −1 | 13.65 | 13.23 | 18.26 | 21.21 | 14.69 | 20.94 |
| 0 | 13.56 | 14.36 | 19.85 | 22.37 | 15.96 | 21.80 |
| 1 | 14.72 | 15.58 | 21.54 | 0.53 | 17.32 | −33.19 |
| 2 | 15.96 | 16.87 | 20.77 | −81.57 | 18.76 | −133.09 |
| 3 | 17.28 | 18.23 | 25.18 | −184.65 | 20.29 | no data |
| 4 | 18.67 | 19.66 | 27.05 | −311.20 | 21.88 | no data |
| 5 | 20.12 | 21.11 | 23.98 | −523.45 | no data | no data |
| 6 | 21.59 | 22.56 | no data | −667.63 | 25.32 | no data |
| 7 | 23.04 | 23.89 | −98.28 | −952.38 | 26.41 | no data |
Table 3.
Methane hydrate formation in the presence of 500 ppm SDS.
| Experiment No. | Experiment 3 | Experiment 5 |
|---|---|---|
| Tini,top (°C) | 25.31 | 25.38 |
| Pinj,CH4 (bar) | 84.46 | 83.48 |
| PCH4,final (bar) | 67.13 | 27.74 |
| Tfinal,top (°C) | 1.10 | 0.81 |
| Swi (%) | 22.4% | 43.6% |
| SH (%) | 16% | 35% |
| to, -Fresh (m) | 23 | 95 |
| to, -Memory (m) | 69 | 191 |
Table 4.
Methane hydrate formation in the presence of water and methionine.
| Experiment No. | Experiment 6 | Experiment 7 |
|---|---|---|
| Solution | Water | Methionine |
| Tini,top (°C) | 26.75 | 25.40 |
| Pinj,CH4 (bar) | 83.72 | 84.78 |
| PCH4,final (bar) | 26.91 | 27.43 |
| Tfinal,top (°C) | 0.84 | 0.75 |
| Swi (%) | 43.9% | 44.4% |
| SH (%) | 35% | 37% |
| to, -Fresh (min) | 81 | 176 |
| to, -Memory (min) | 95 | 316 |
Table 5.
Methane hydrate formation under the presence of methanol (before soaking = BS, after Soaking = AS).
Table 5.
Methane hydrate formation under the presence of methanol (before soaking = BS, after Soaking = AS).
| Experiment No. | Experiment 8 | Experiment 9 | Experiment 10 | Experiment 11 | Experiment 12 |
|---|---|---|---|---|---|
| Tini,top (°C) | 25.257 | 25.49 | 25.415 | 25.385 | 25.278 |
| Pinj,CH4 (bar) | 83.82 | 84.64 | 85.08 | 84.84 | 84.26 |
| PCH4,final (bar) | 37.53 | 44.01 | 48.24 | 41.15 | 42.96 |
| Tfinal,top (°C) | 0.79 | 0.86 | 0.80 | 0.76 | 0.81 |
| Swi (%) | 43.5% | 66.1% | 30.5% | 45.5% | 29.1% |
| SH (%) | 28% | 20% | 22% | 29% | 27% |
| to, -Fresh (m) | 582 | 525 | 890 | 1048 | 836 |
| Hydrate morphology | Pore-filling | Pore-filling | Grain-coating | Pore-filling | Grain-coating |
| to, -Memory (m) | 209 | 194 | 305 | 364 | 340 |
Table 6.
Collected experimental data from the CH4-CO2 exchange process and calculated key soaking ratios 24 h after the replacement process (BS = before swapping, AS = after soaking).
Table 6.
Collected experimental data from the CH4-CO2 exchange process and calculated key soaking ratios 24 h after the replacement process (BS = before swapping, AS = after soaking).
| Experiment No. | Experiment 5 | Experiment 6 | Experiment 7 | Experiment 8 |
|---|---|---|---|---|
| Chemical type | SDS | Water | Methionine | MeOH |
| Swi (%) | 43.6% | 43.9 | 44.4% | 43.5% |
| SH (%) | 35% | 35% | 37% | 28% |
| PCH4,final (bar) | 27.74 | 26.91 | 27.43 | 37.53 |
| Pinj,CO2 (bar) | 60.01 | 55.38 | 58.61 | 50.87 |
| Tinj,top (°C) | 13.80 | 16.72 | 9.71 | 6.29 |
| PCO2/CH4,final (°C) | 37.61 | 39.42 | 38.43 | 53.94 |
| Tfinal,top (°C) | 1.02 | 0.67 | 0.82 | 0.80 |
| ΔP1 (PCO2inj − PCO2/CH4,final) | 22.4 | 15.96 | 20.18 | −3.07 |
| BS-nCO2 in vapor (mol) | 9.58 | 1.928 | 9.537 | 8.265 |
| BS-nCH4 in vapor (mol) | 0.323 | 0.098 | 0.260 | 0.328 |
| AS-nCO2 in vapor (mol) | 1.107 | 1.085 | 1.118 | 1.355 |
| AS-nCH4 in vapor (mol) | 0.071 | 0.141 | 0.092 | 0.494 |
| Stored CO2 (moles) | 8.48 | 0.84 | 8.42 | 6.91 |
| Released CH4 (moles) | −0.25 | 0.04 | −0.17 | 0.17 |
| After Soaking Key Ratios | ||||
| CO2 Storage, SCO2 (%) | 88.45% | 43.72% | 88.28% | 83.60% |
| CH4 Release, ReCH4 (%) | −2.64% | 2.26% | −1.77% | 2.01% |
| CH4 Recovery, RCH4 (%) | −19.38% | 3.31% | −12.53% | 15.68% |
Table 7.
Collected experimental data from the CH4-CO2 exchange process with 5 wt% MeOH under various liquid saturations and experimental temperatures. Key ratios are calculated from 24-h soaking period when the replacement process occurred (BS = before swapping, AS = after soaking).
Table 7.
Collected experimental data from the CH4-CO2 exchange process with 5 wt% MeOH under various liquid saturations and experimental temperatures. Key ratios are calculated from 24-h soaking period when the replacement process occurred (BS = before swapping, AS = after soaking).
| Experiment No. | 8 | 9 | 10 | 11 | 12 |
|---|---|---|---|---|---|
| Chemical type | MeOH | MeOH | MeOH | MeOH | MeOH |
| Swi (%) | 44% | 66% | 30% | 45% | 30% |
| SH (%) | 28% | 20% | 22% | 29% | 27% |
| Hydrate morphology | Pore-filling | Pore-filling | Grain-coating | Pore-filling | Grain-coating |
| PCH4,final (bar) | 37.53 | 44.01 | 48.24 | 41.15 | 42.96 |
| TCH4,final,top (°C) | 0.79 | 0.86 | 0.80 | 3.76 | 3.81 |
| Pinj,CO2 (bar) | 50.87 | 56.21 | 59.38 | 59.26 | 62.37 |
| Tinj,top (°C) | 6.29 | 4.70 | 1.75 | 5.73 | 8.18 |
| PCO2/CH4,final (°C) | 53.94 | 59.02 | 60.21 | 48.78 | 58.82 |
| ΔP1 (PCO2inj − PCO2/CH4,final) | −3.07 | −2.81 | −0.83 | 10.48 | 3.55 |
| Tfinal,top (°C) | 0.80 | 0.81 | 0.81 | 3.73 | 3.79 |
| BS-nCO2 in vapor (mol) | 8.265 | 8.096 | 11.247 | 10.063 | 9.923 |
| BS-nCH4 in vapor (mol) | 0.328 | 0.208 | 0.421 | 0.203 | 0.054 |
| AS-nCO2 in vapor (mol) | 1.355 | 1.178 | 0.747 | 0.656 | 1.264 |
| AS-nCH4 in vapor (mol) | 0.494 | 0.513 | 1.145 | 0.669 | 1.050 |
| Stored CO2 (moles) | 6.91 | 6.91 | 10.50 | 9.41 | 8.66 |
| Released CH4 (moles) | 0.17 | 0.31 | 0.72 | 0.47 | 0.99 |
| After Soaking Key Ratios | |||||
| CO2 Storage, SCO2 (%) | 83.60% | 85.45% | 93.36% | 93.48% | 86.41% |
| CH4 Release, ReCH4 (%) | 2.01% | 3.76% | 6.44% | 4.64% | 10.04% |
| CH4 Recovery, RCH4 (%) | 15.68% | 40.84% | 82.98% | 44.73% | 89.09% |
© 2020 by the authors. Licensee MDPI, Basel, Switzerland. This article is an open access article distributed under the terms and conditions of the Creative Commons Attribution (CC BY) license (http://creativecommons.org/licenses/by/4.0/).
Share and Cite
MDPI and ACS Style
Pandey, J.S.; Karantonidis, C.; Karcz, A.P.; von Solms, N. Enhanced CH4-CO2 Hydrate Swapping in the Presence of Low Dosage Methanol. Energies 2020, 13, 5238. https://0-doi-org.brum.beds.ac.uk/10.3390/en13205238
AMA Style
Pandey JS, Karantonidis C, Karcz AP, von Solms N. Enhanced CH4-CO2 Hydrate Swapping in the Presence of Low Dosage Methanol. Energies. 2020; 13(20):5238. https://0-doi-org.brum.beds.ac.uk/10.3390/en13205238
Chicago/Turabian StylePandey, Jyoti Shanker, Charilaos Karantonidis, Adam Paul Karcz, and Nicolas von Solms. 2020. "Enhanced CH4-CO2 Hydrate Swapping in the Presence of Low Dosage Methanol" Energies 13, no. 20: 5238. https://0-doi-org.brum.beds.ac.uk/10.3390/en13205238
Note that from the first issue of 2016, this journal uses article numbers instead of page numbers. See further details here.