Article

Evaluation of Compressor Heat Pump for Root Zone Heating as an Alternative Heating Source for Leafy Vegetable Cultivation

1
CREA Research Centre for Vegetable and Ornamental Crops, Consiglio per la ricerca in agricoltura e l'analisi dell'economia agraria (Council for Agricultural Research and Economics), Via dei Fiori 8, 51017 Pescia (PT), Italy
2
CREA Research Centre for Engineering and Agro-Food Processing, Consiglio per la ricerca in agricoltura e l'analisi dell'economia agraria (Council for Agricultural Research and Economics), Via Milano, 43 24047 Treviglio (BG), Italy
3
CREA Research Centre for Engineering and Agro-Food Processing, Consiglio per la ricerca in agricoltura e l'analisi dell'economia agraria (Council for Agricultural Research and Economics), Via della Pascolare, 16 00015 Monterotondo (Rome), Italy
*
Author to whom correspondence should be addressed.
Submission received: 18 December 2019 / Revised: 23 January 2020 / Accepted: 6 February 2020 / Published: 8 February 2020

Abstract

:
Protected horticulture is a high energy-consuming sector in which the optimization of energy use and cost for heating facilities is strategic in achieving high environmental and economic sustainability of production. The main aim of the project was to evaluate the use of a heat pump for basal heating as an alternative technology to grow crops with reduced canopies, such as basil. During the test, an area of the greenhouse contained two systems of coaxial pipes circulating warm water from a heat pump and a condensing boiler. These pipes were placed above the growing media. At the same time, a separate area of the same greenhouse contained a traditional heating system consisting of an air heater, the solution commonly used to heat greenhouses. Microclimatic conditions and energy consumption were analyzed for the three heating technologies. The energy analysis of the three experimental heating options showed that all of them could ensure suitable thermal conditions for cultivation in the winter period. Overall, the results confirmed the energy saving resulting from the adoption of the heat pump, underlining the importance of this device in terms of the support that the energy-saving goal receives.

Graphical Abstract

1. Introduction

Worldwide, protected agriculture (glass and plastic greenhouses, tunnels) covers an area of at least 900,000 hectares. 70% of it (mostly located in Asian countries such as Japan, China and Korea) uses greenhouses made of flexible plastic films. Within the Mediterranean basin, protected agriculture reaches up to 400,000 hectares, concentrated above all in Spain, Italy, Egypt, France, Greece and Turkey [1]. Heating the greenhouse is also a feasible option: it is a well-established practice in central-northern regions and an increasingly widespread one in southern areas. According to Campiotti [1], throughout the Mediterranean basin the energy consumption of greenhouse systems ranges between 5 and 7 kg of oil equivalents/m2/y (1 kgoe = 11.63 kWh), or 60–80 kWh/m2/y, while in central and northern Europe it may reach 40–80 kgoe/m2/y (460–930 kWh/m2/y).
Energy costs to heat a greenhouse represent a significant expense: in cold regions they represent the second-largest cost item after the workforce [2]. According to Campiotti [1], the greenhouse equipment (light-supplementation, dehumidification, heating, cooling and actuators) needed to achieve maximum yields may result in energy costs in the order of 30%–40% of total production costs. As matter of fact, focusing on energy consumption partitioning, Runkle and Both [3] assessed that heating requires approximately 65%–85% of the total energy consumed in a greenhouse, with the remaining portion used for electricity and transportation. Reducing energy consumption for heating has therefore become an important challenge. Many efforts have allowed the optimization of the daily average temperature and humidity as well as that of solar radiation and CO2 concentration [4,5,6]. Furthermore, studies have proposed innovative strategies such as structural design, the use of energy-efficient covers, improved heating and ventilation systems, management of indoor micro-climates and use of renewable energy sources based on the location of greenhouses. These techniques are mostly focused on reducing the energy requirement of farming, increasing the efficient use of energy and reducing the costs of the required power. There are a variety of heaters commonly used in greenhouses: air heaters (either wall-mounted or free-standing) to warm the inside volume of greenhouses, water heaters and boilers (gas or electric powered) for basal (or root-zone) heating of crops both in soil or soilless cultivation; furthermore, electric convectors, wood or pellet stoves and heat pumps (HPs) are also used [7,8,9,10,11]. However, focusing only on heating devices technologies may be misleading: the balance between the agronomic needs of plants and the energy-saving potential of each heating technique requires attention as well [12]. Growers, researchers, and manufacturers require that the information on the energy-efficient strategies and their effect on plants refers to the economic feasibility of the existing heating energy-saving technologies for conventional greenhouses. To this extent, Sethi and Sharma [13] and Ahamed et al. [14] reviewed and evaluated passive heating technologies available worldwide for protected cultivation, with the main aims being to increase the heat gain and reduce heat loss from the greenhouse. Researchers examined the energy-saving potential that renewable and sustainable solutions (e.g., photovoltaic modules, solar thermal collectors, hybrid photovoltaic/solar thermal collectors and systems, energy-efficient HPs, innovative ventilation technologies and efficient lighting systems) may have for greenhouse systems [15,16]. However, concerning HPs, their use in agriculture still mainly only refers to fruit drying [17,18]. Concerning greenhouse heating, studies have focused on HPs only in the case of geothermal source HPs, on integrated systems [11,16,19,20,21,22] or they have investigated their financial and environmental viability using simulation tools [10]. There are many reasons why HPs have not garnered great interest in protected agriculture applications, mostly due to the traditional design in building experiences. Indeed, conventional heat pumps have the best efficiency with a relatively low temperature of supply water that cannot exceed 45–50 °C, so they are only thought to be efficient in cases of well insulated structures, mainly associated with low-temperature heating systems, such as floor heating.
As renewable power sources (wind, solar, hydro, and geothermal) do not consume fuel, the energy sources they rely on cannot be accounted for in the same manner as for fossil fuel sources. Choosing the right methodology for these power technologies is, therefore, essential to achieve an unbiased estimation of the source-based building energy use and, at the same time, to provide overall energy metrics (e.g., energy productivity) [23].
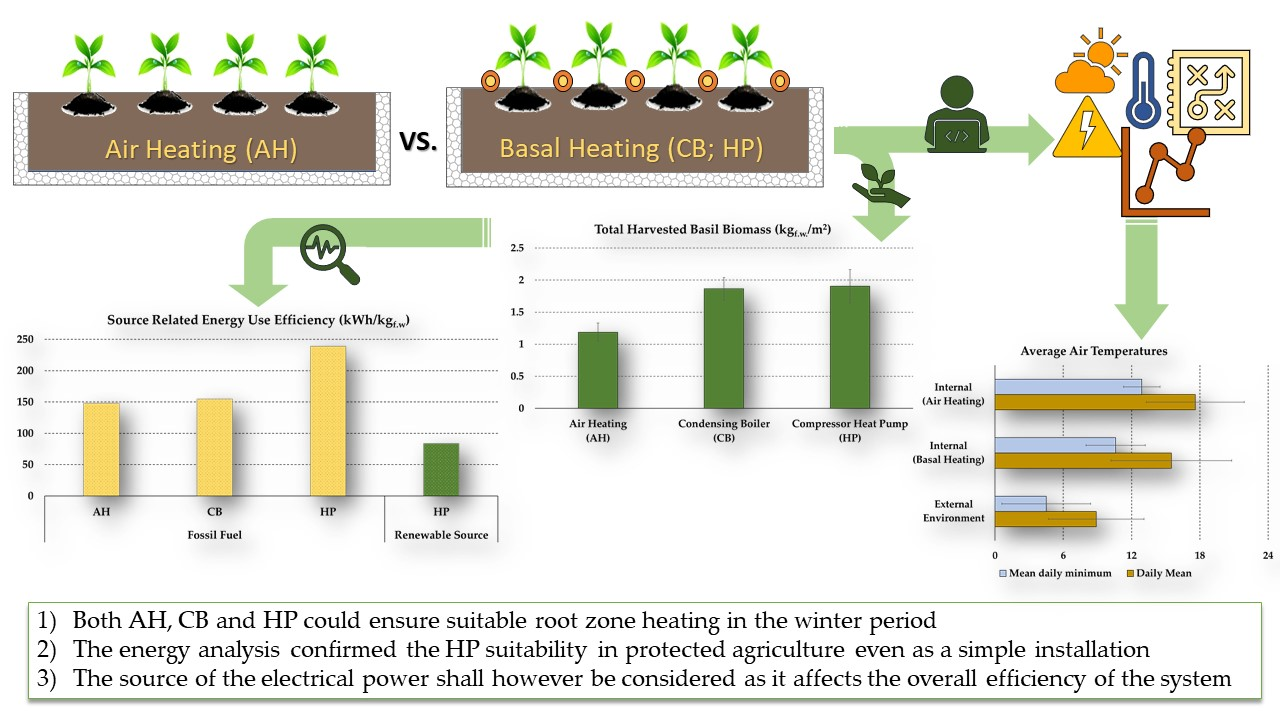
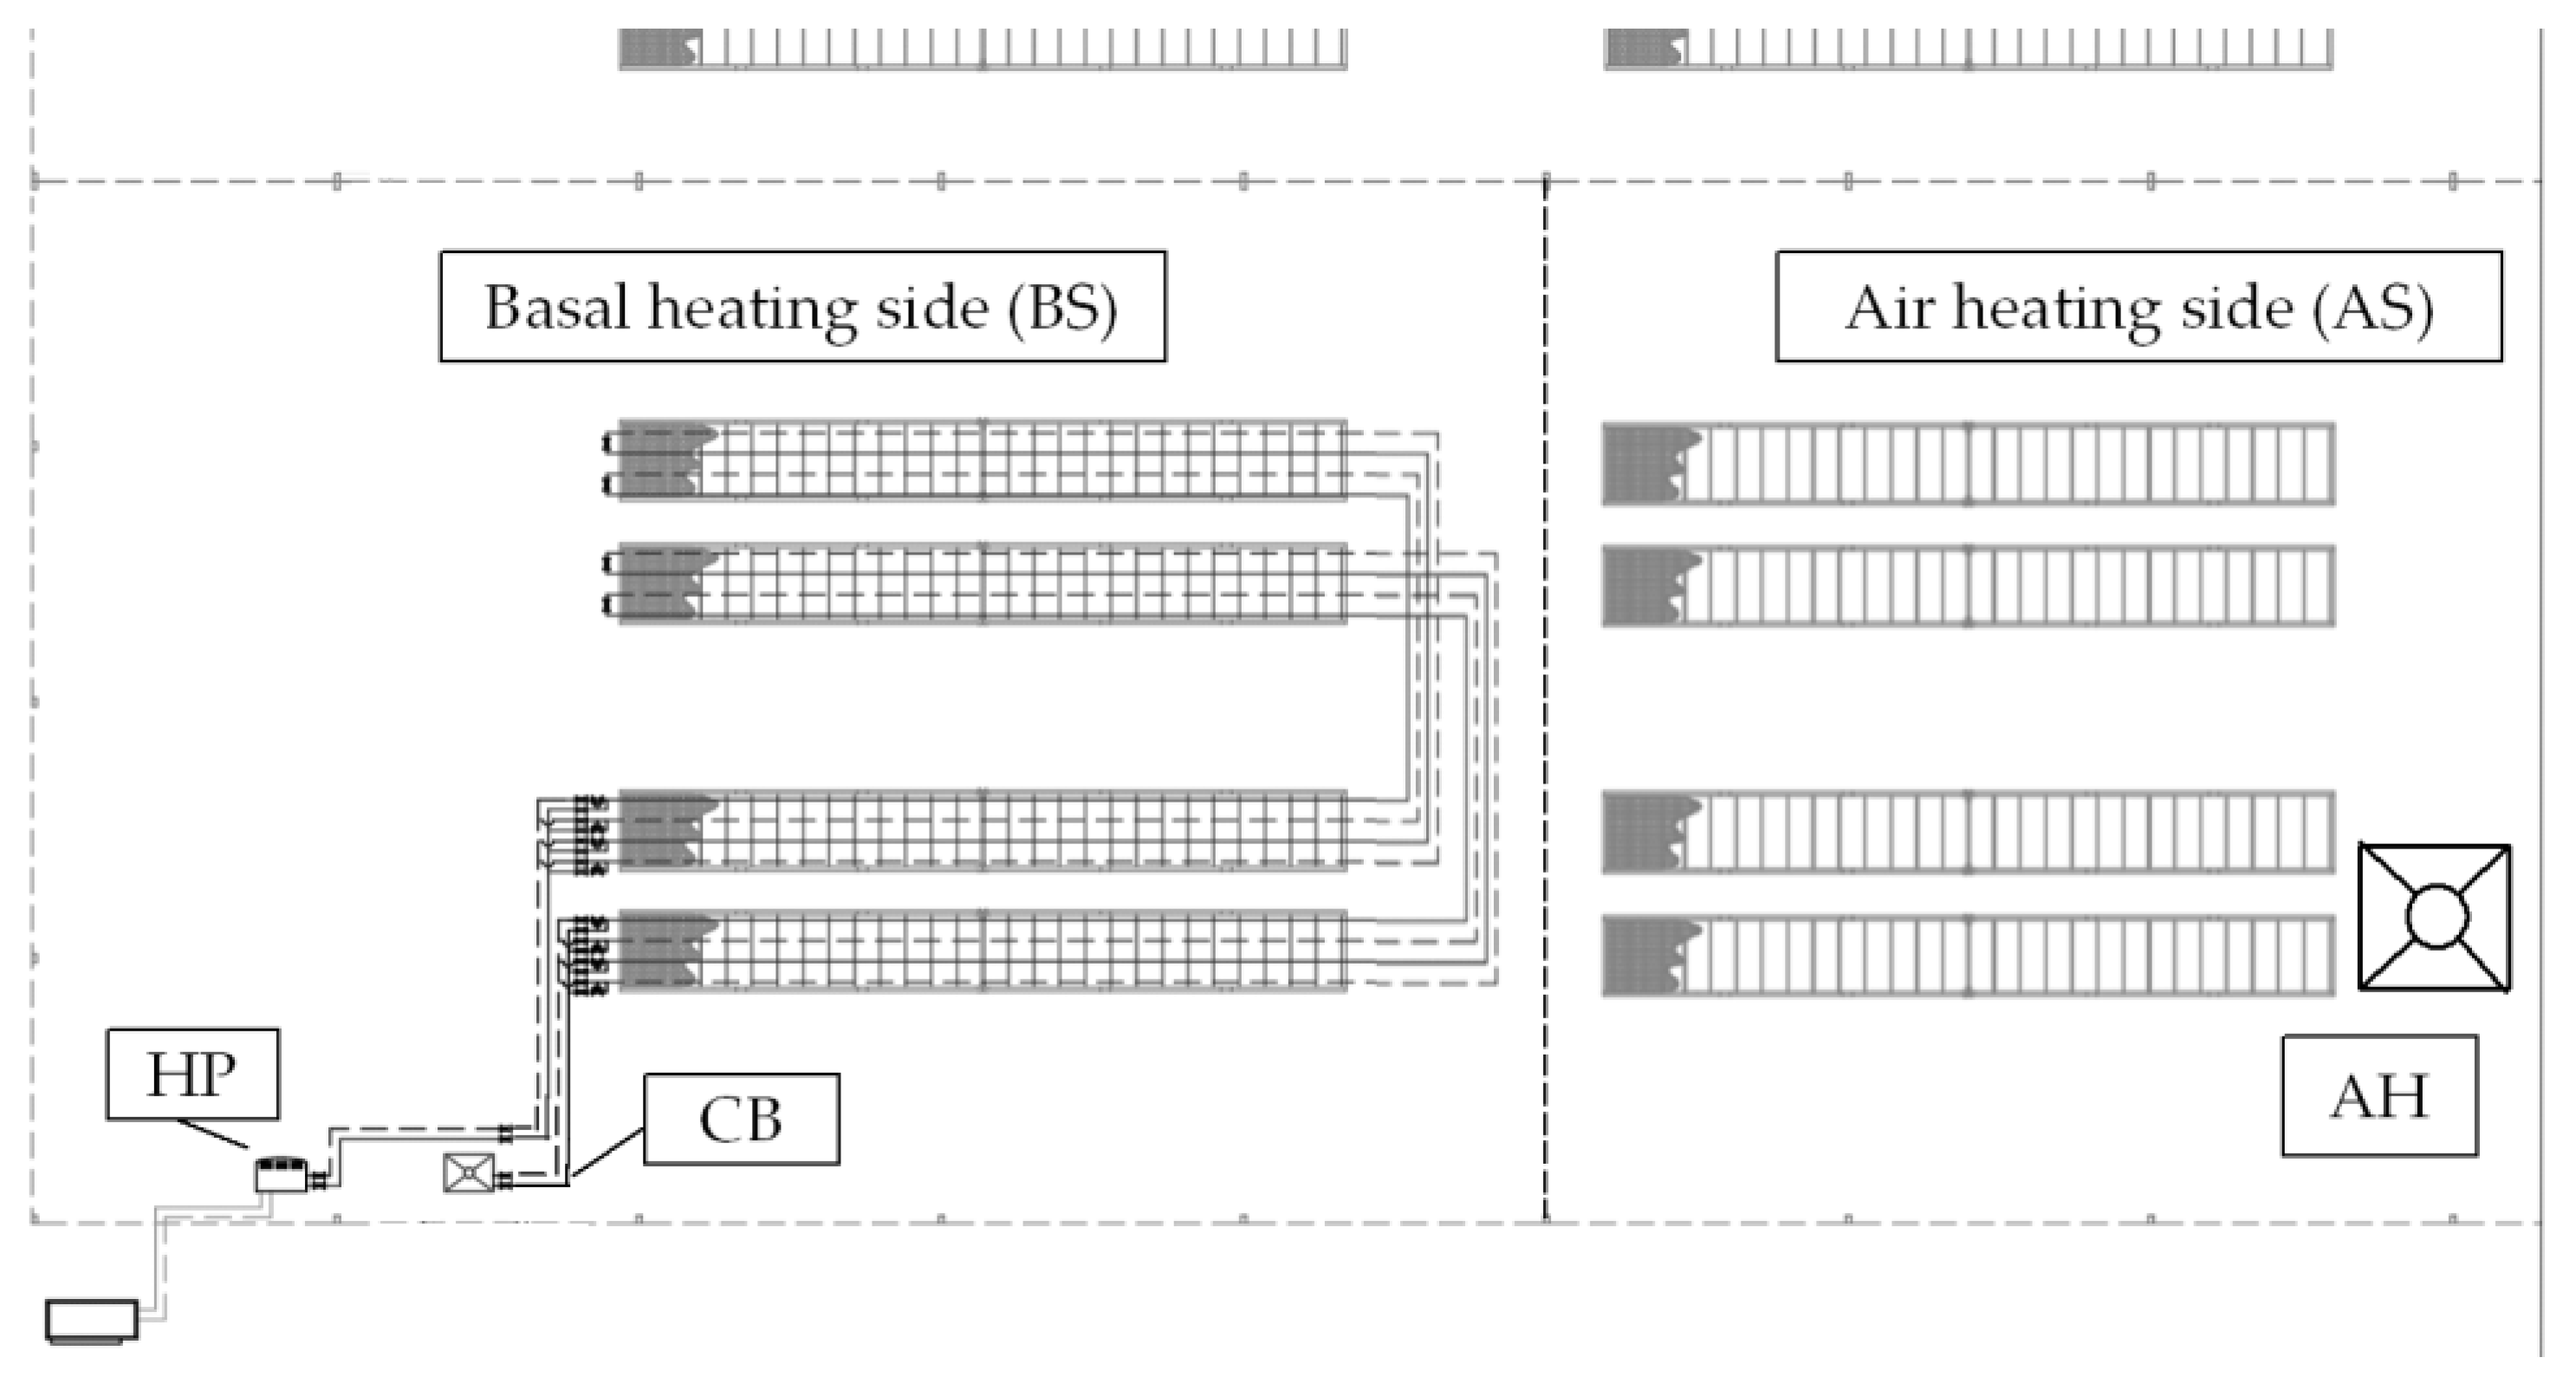
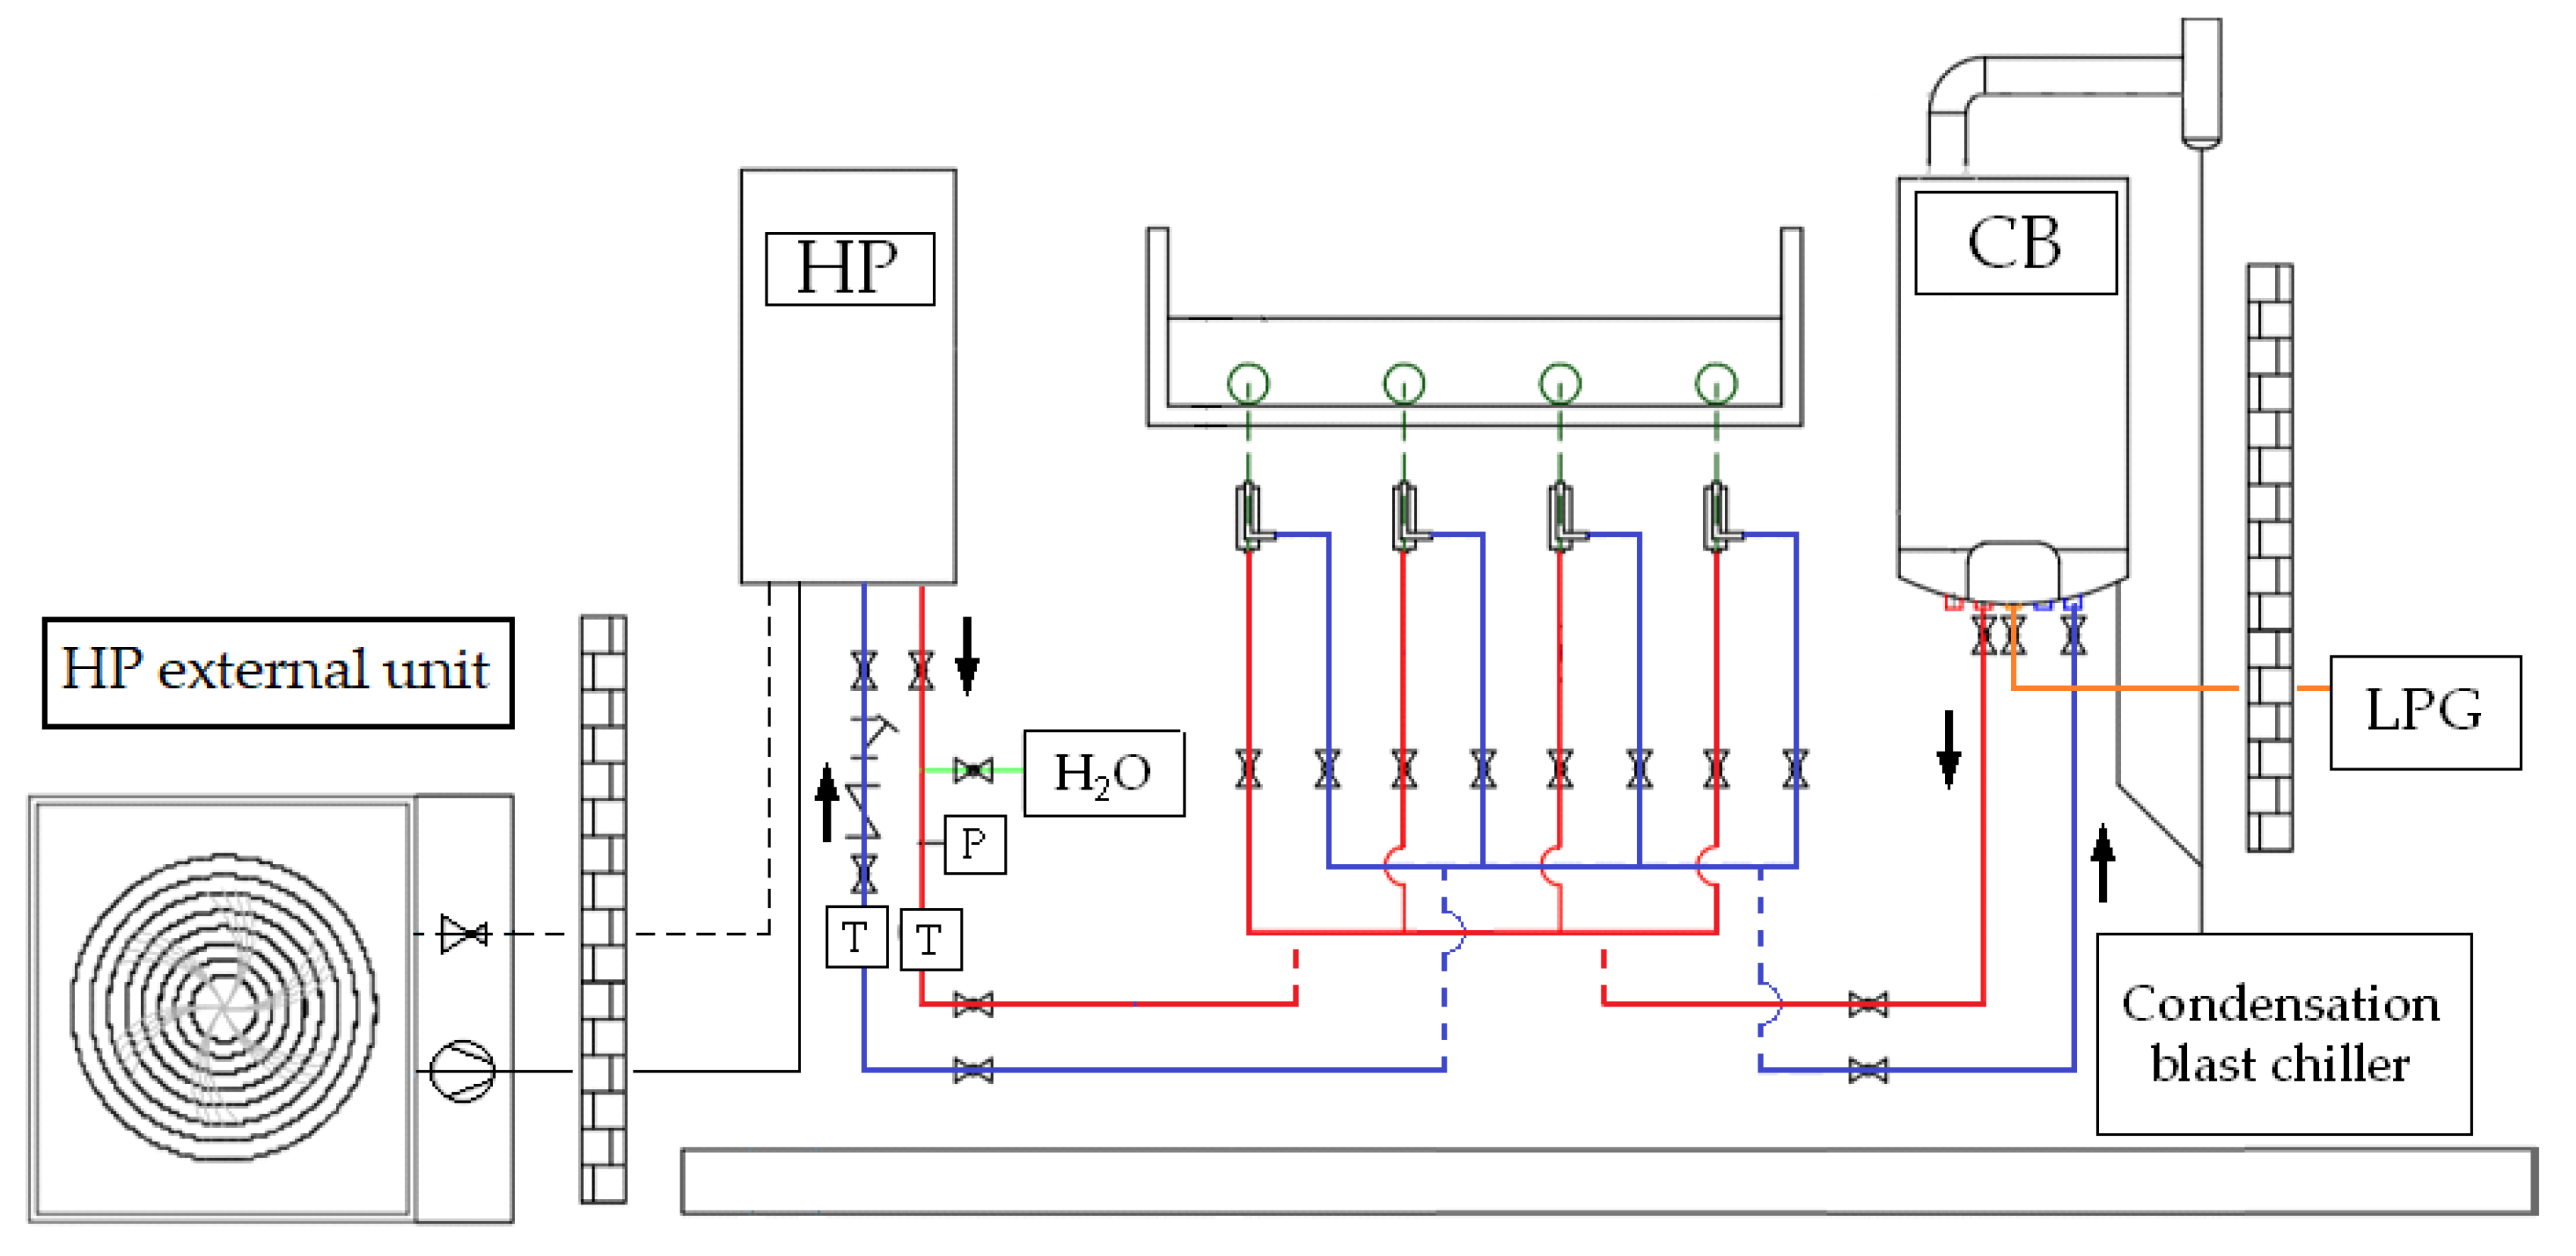
This study aims to investigate the possibility of using conventional heat pumps as an energy source and to compare their efficiency compared to traditional heating systems. Furthermore, this study aims to verify in an existing ordinary greenhouse i) the applicability of a commercial air to water heat pump and ii) test the energy efficiency of the heat pump without geothermal or photovoltaic solutions. Commonly, moderate temperature heating systems such as HPs engender a limitation on the heating output of the system resulting in a partial coverage of the heating requirements of large volume facilities during cold periods. Following this, the HP technology was used to provide basal heating to a small leafy vegetable (sweet basil) by means of root zone heating.
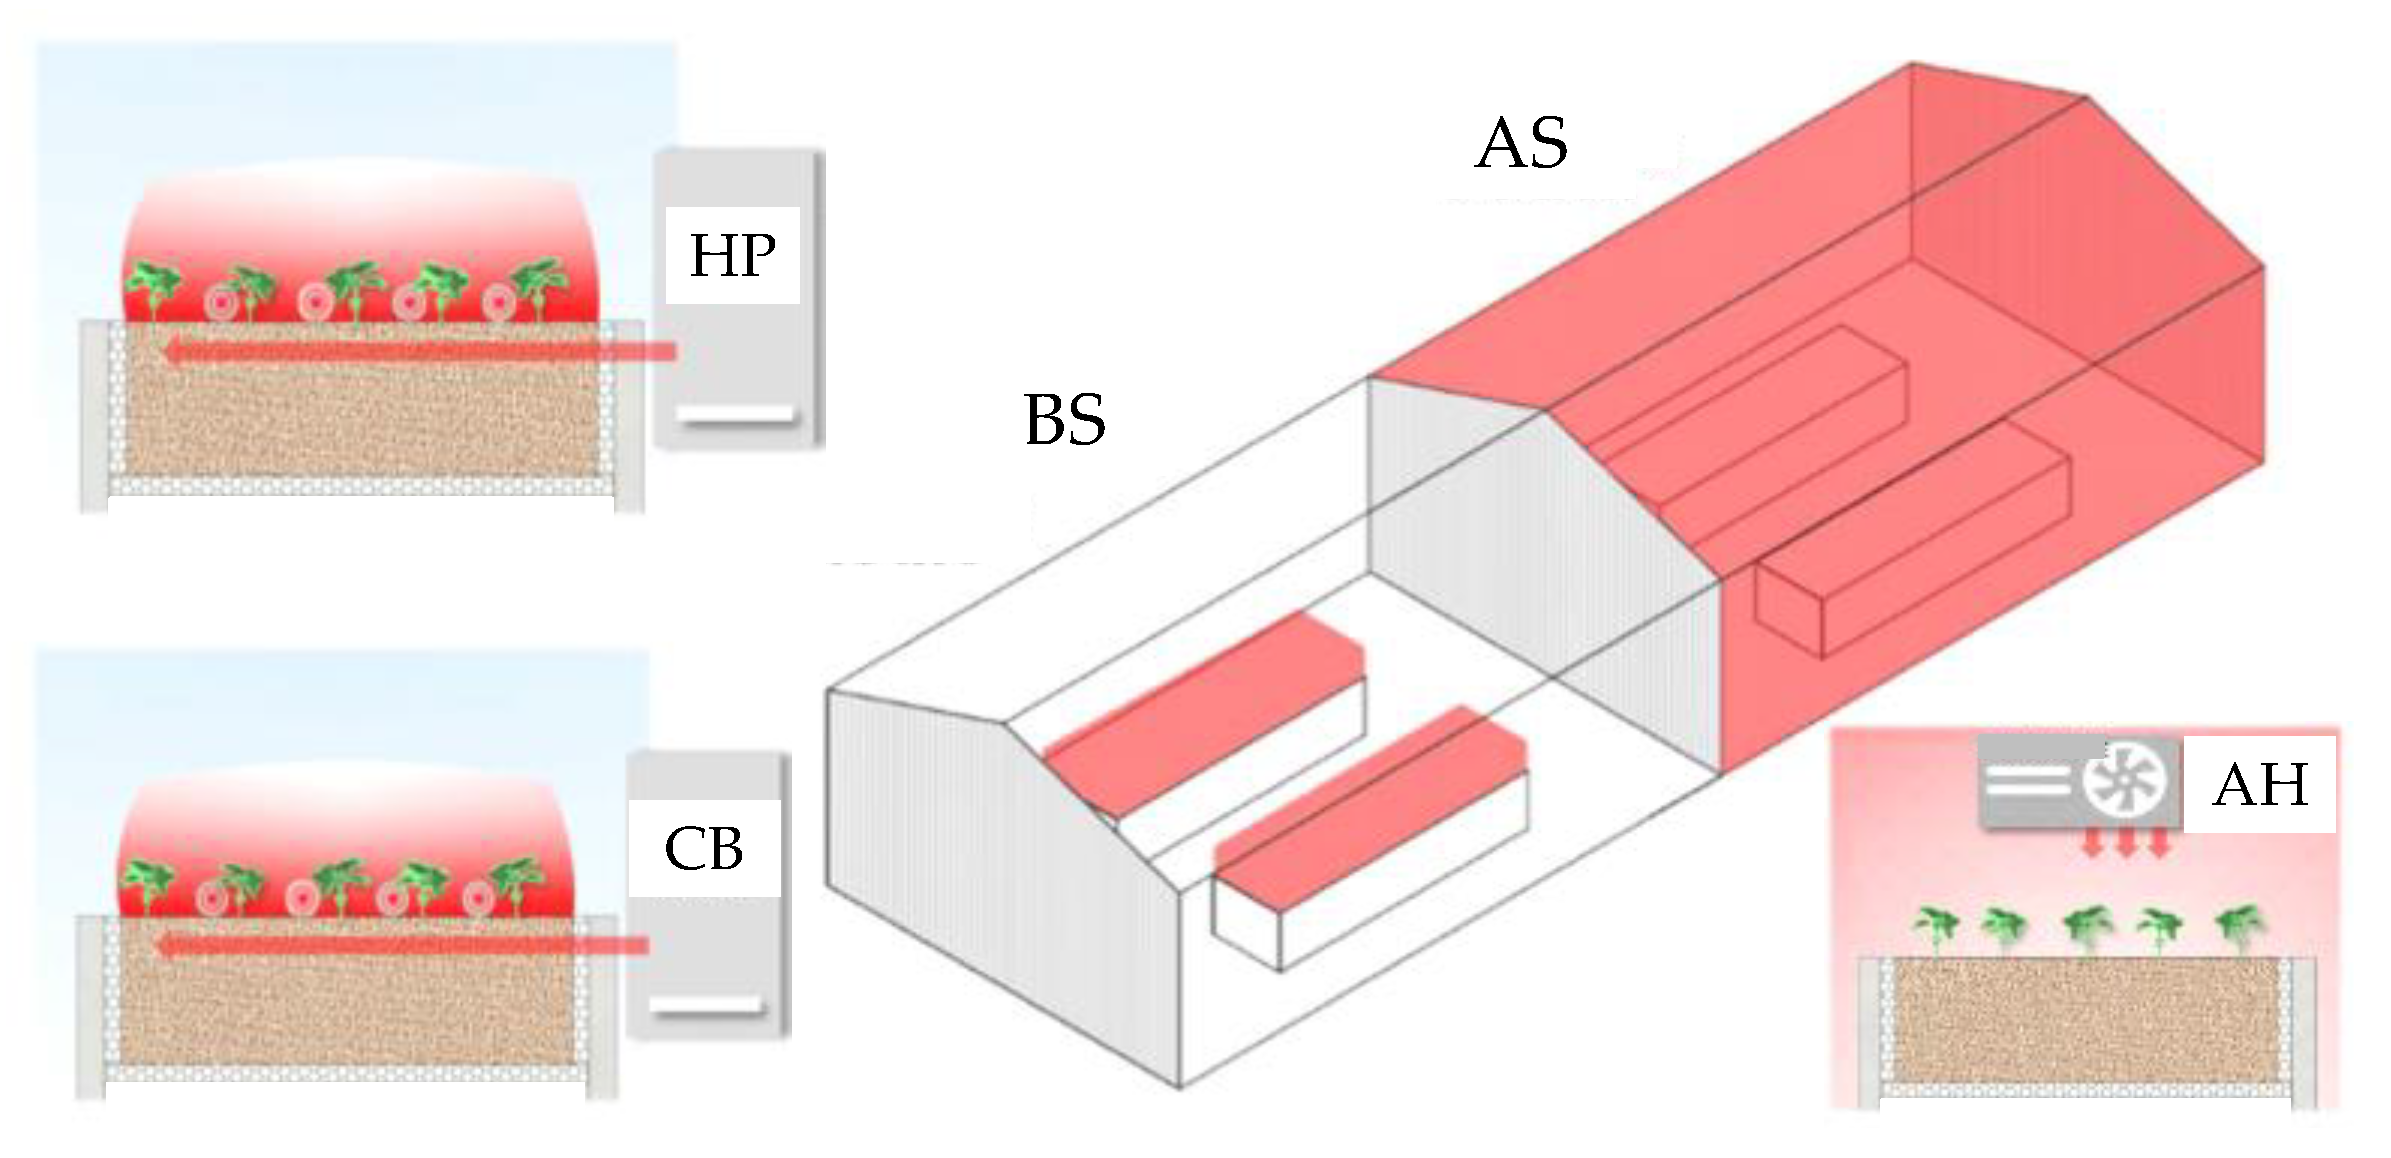
With these premises, this study presents a comparison between three heating technologies available at retailers (two with a basal heating system: an air-to-water heat pump and a condensing boiler; and the third with an oil-fired air heater for heating the total volume of the greenhouse). This work focuses entirely on the energy consumption of the tested systems with specific reference to energy efficiency meant as the ratio between direct energy consumption per unit of product or per unit of crop cycles, where the energy consumption refers to the primary consumption of fuel and/or electricity [1]. Moreover, insights into the use of the captured energy and the fossil fuel equivalence approach are also presented to discuss the impact each heating technology has when varying the energy source.

2. Materials and Methods

2.1. Design of the Experiment

The experimental plan involved the use of three heating technologies: a condensing boiler (CB), a heat pump (HP) and an air-to-air heater (AH). CB and HP provided basal heating to basil seedlings while the AH represented the standard reference heating system (control) for the entire volume of the greenhouse. Each treatment affected two benches and had four replicates (two per growing bench with 70 seedlings per replicate for a whole of 280 seedlings/treatment). All the plants underwent the same agronomic treatments (fertigation and pest control), according to basil requirements. Growing media composition was peat: perlite 50:50 v·v−1.
Inside the three differently heated environments, an experiment on a small leafy crop was carried out following a completely randomized design. 840 sweet basil seedlings (Ocimum basilicum L.), one of the aromatic plants with greatest consumption worldwide [24], underwent simultaneous hand transplanting in 6 growing benches on 12 February 2018. Each bench contained 5 rows of seedlings with 28 plants per row. February is the month of the year that historically has the coldest temperatures: Figure 1 reports in detail the mean temperature trend of 2018 and the period of the experimental test.
During the growing period, the plants underwent two harvests: the first one took place 36 days after transplant (DAT) and the second 13 days after the first (49 DAT), assessing plant biomass production (i.e., yield) in both cuts, measuring shoot fresh weight and shoot dry weight (shoots dried in oven at 75 °C, until constant weight reached). The amounts of direct energy consumption (kcal) was calculated keeping into account the two different heated surfaces (10.2 m2 for HP and CB; 100 m2 for AH) and referring to unit of product (fresh gf.w, and dried gd.w.). Energy-use efficiency (EUE, kcal·g−1) was calculated as described by Equation (1):
EUE = kcal g
The EUE was calculated for both the fresh (EUEf_Yeld) and the dry (EUEd_Yeld) weight of harvested plant biomass.

2.2. The Greenhouse and the Growing Benches

The trial took place in a greenhouse of the CREA Research Center for Vegetable and Ornamental Crops (Pescia, Italy, 43°53’13’’ N, 10°41’18’’ E; degree day: 1.877). The greenhouse had a total surface area of 200 m2, a ridge height of 3.50 m and it is North/East to South/West longitudinally oriented. It consisted of a supporting structure made of galvanized iron, roofing in polycarbonate slabs and walls of polyethylene sheets equipped with a fully automatized opening system. It bordered on open spaces to the North, South and West and with another greenhouse eastward. Inside the greenhouse there were regular prismatic concrete benches (0.70 m width × 7.25 m length × 0.30 m height, with 3 cm thickness polystyrene panels coating on the walls and on the bottom) placed on cement blocks that raised them 0.35 m above the soil level. A vertical polyethene sheet divided the inner space of the greenhouse into two parts, one with the air-heating system (AS) and the other with a basal-heating system (BS), to test the three heating technologies running simultaneously (Figure 2). Figure 3 shows the schematic layout of the experimental greenhouse.
Coaxial pipes [25] placed on the surface of the growing media among the plants’ rows provided the basal heating (Figure 4). This position was chosen to check if this kind of heating system could also heat the plant canopy as well as the growing media and the root zone.

2.3. The Heating System

The test aimed to compare three heating technologies (Table 1) to point out the extent of both energy-saving and consumption and to assess their suitability to heat a leafy vegetable crop, in an existing greenhouse with standard insulation.
The air to air AH represented the reference system of the experiment: it consisted of a floor-mounted fan-cooled diesel generator cabinet Gentili Junior 85 SP(Gentili Generatori S.r.l., Pescia, Italy) (Table 2). A thermostat, placed at about 1 m from the surface of the growing media, switched on/off the AH in accordance with the established temperature setpoint of 15 °C. The CB basal system relied on an LPG (Liquified petroleum gas) fueled condensation boiler Ferroli EcoConcept 15A(Ferroli S.p.A.,Verona, Italy), while the HP basal heating system was an Aermec HSI 140CT (Aermec S.p.A., Verona, Italy) (Table 2). The boiler exhaust fumes were not released into the greenhouse. The thermostat for managing CB and HP systems, set at 15° C, had the temperature probe placed inside the canopy, just above the centre of the hydraulic line.
Figure 5 reports a detailed layout of the experimental greenhouse, while Figure 6 reports the layout of CB and HP systems.

2.4. Instruments

To investigate the effect of the different heating treatments, probes recorded greenhouse internal air, canopy and growing media temperatures, respectively. Canopy temperature monitoring was performed contemporarily in each area of the greenhouse using 24 Testo (Testo SE & Co. KGaA, Titisee-Neustadt, Germany) mod. 175 data loggers: 8 for each heating treatment. They were positioned 10 cm above the growing media. Growing media temperature was recorded by 4 sensors for each heating treatment, positioned 10 cm below the surface of the growing media. Greenhouse temperature and relative humidity was monitored by installing a datalogger Testo mod. 175H1 at 2 m above ground level. The list of the adopted instruments is reported in Table 3.

2.5. Methodology to Relate the Energy Efficiency to Fossil/Renewable Energy Sources

As mentioned above, energy from non-combustible sources of renewable power cannot be accounted for in the same manner as it is for fossil fuel sources. Subsequently, the fossil fuel equivalency approach and the captured energy methodology were used to compare the three heating technologies under testing to consider the energy conversion occurring from both fossil fuel and renewable sources [23]. The fossil fuel equivalency approach (FFE) considers the average heat rate of fossil generators (currently 9510 BTU/kWh or about 35% efficiency) and assigns it as the heat rate for non-combustible renewable electricity (RE) generation. This value represents the source energy value of the fossil generation that RE generation displaces. The captured energy (CE) methodology assumes that the energy source is precisely equal to the electricity produced without losses before its transmission and distribution: in this case, the heat conversion rate is 3412 BTU/kWh and corresponds to a conversion efficiency of 100%. It is noted that these are not the complete set of the possible methodological choices for non-combustible source energy accounting. Another method would assume that non-combustible renewable generation consumes no source energy (e.g., 0 BTU/kWh) [23].

2.6. Data Processing

The experimental data underwent statistical processing with Minitab 17 statistical software [26] to calculate the descriptive statistics for each treatment (arithmetic mean ± standard deviation). To evaluate the statistically significant differences between the treatments, data underwent analysis of variance (ANOVA) followed by post-hoc multiple comparisons (Tukey honest significant difference ((HSD) test, p < 0.05).

3. Results

3.1. Thermal and Environmental Conditions

The mean recorded OAT during the entire experiment was 8.9 °C, the daily average minimum temperatures was 4.5 °C with an absolute minimum of −6 °C. The average air temperature inside (IAT) of the BS during the experiment was 15.5 °C, with a mean daily minimum temperature of 10.6 °C and an absolute minimum temperature of 4.1 °C. At the same time, the average IAT of the AS was 17.6 °C, with a daily mean minimum of 12.9 °C and an absolute minimum of 9.1 °C. Figure 7 shows, as example, a scatterplot of the air temperature inside (IAT) and outside (OAT) the greenhouse registered during the three coldest days of the experiment. As expected, the minimum temperatures recorded in the AS section were higher than those recorded in the BS zone (CB and HP).
Significant differences were observed among the different heating technologies (Table 4), temperature density distribution are reported in Figure 8 to highlight the differences that occurred between the two environments.
Inside canopy mean and mean daily minimum temperatures were not significantly different for the three heating technologies (Table 5). Inside growing media temperatures in the BS system were significantly higher than in the AS system, both for CB and HP treatments, with mean registered temperature of 20–21 °C, compared to 16 °C registered in AS system (Table 5). Measured temperatures inside canopy and inside growing media are also reported as a boxplot in Figure 9.
Relative humidity mean values registered inside and outside the greenhouse during the trial are shown in Table 6.

3.2. Basil Biomass Production

Figure 10 shows the basil biomass harvested at the first and second cut (36 and 49 DAT). Significant differences of biomass production (g f.w.·m2) were found between the AS and the BS, while no differences were found between the CB and HP system both in each cut and in the total harvested biomass. Moreover, further processing pointed out that the total harvested biomass (g·m−2) positively and significantly correlates with the minimum temperatures recorded in the growing media.
The daily growth rate of the basil seedlings in the first and in the second growing period for each heating system is presented in Figure 11.

3.3. Energy Consumption

Values were measured in liters for the AH, cubic meters for the LPG and kilowatt-hours for the HP. With the aim of making the three different systems uniform, each measuring unit was converted to kWh. Table 7 reports the energy consumption measured during the period of the first and the second growing cycles and the total value. The value is reported as global and specific heat consumption, where the latter is referred to as the heated square meter. The heated square meter resulted the two different heated surfaces (10.2 m2 of the benches for HP and CB; 100 m2 of the greenhouse section dedicated to AH)
The energy consumption per unit of product is reported in Table 8. Results show that the CB–BS system per gram of product resulted similar compared with the AH–AS. The HP–BS system per gram of product resulted in 44% energy saving than the AH–AS and CB–BS (0.08 instead of 15 kWh/gf.w).
Table 9 reports the source-related energy-use efficiencies (kWh/kg f.w.) resulting from the correction of the global energies consumption (Table 8) with FFE (9510 BTU/kWh) and CE rates (3412 BTU/kWh). In this way the importance of the energy source and of the adopted approach arises in objective manner: the HP–FFE shows the related fossil fuel required but also the fossil fuel displaced in case of RE.

4. Discussion

Reducing the energy costs in protected environments is possible in order to: i) reduce energy needs, ii) use energy more efficiently and, iii) use less expensive energy sources. The balance between the agronomic needs of plants and the energy-saving potential of different techniques should to be considered to achieve the target of energy saving. For this reason, this work was focused on the evaluation of thermal energy saving for leafy vegetables production in wintertime. The experiment consisted in a comparison between an air heater, which heated the whole greenhouse volume; a basal heating system powered by a condensing boiler and a basal heating system powered by an air-to-water heat pump. The temperature trends show that the minimum air temperatures recorded inside the greenhouse are 6.1 (BS) and 8.4 °C (AS) higher than those occurring outside. Such increments are of the same order of magnitude of those (5.3–7.3 °C) reported in a similar experience carried out in a greenhouse equipped with a solar combined air source heat pump system for strawberry production [27]. At both the harvest times, the AS production (gf.w. m−2) was significantly lower than that of the BS, heated both with CB and HP. The biomass produced in the AS section was lower, on average, from 51% (first cut) to 33.3% (second cut) of that harvested in the BS. Biomass productions resulting from HP and CB in the BS do not differ significantly. As a matter of fact, increasing soil/growing media temperature results in heat accumulation at root zone level and this can be associated with an increase in yields [28,29]. The dry matter content was of 8.70 ± 0.30%, on average, and it is in line with other results reported for sweet basil by Walters and Currey [30]. The increase in biomass production of basil between the first and the second cut was significantly higher for the AH system as compared to the BS system. In particular, the HP resulted in the lowest percentage increase of biomass, even if the first cut achieved the highest production. As matter of fact, basal heating seems to allow accelerated plant growth [28]. Further support for these results can be found in the positive significant correlation that fresh basil biomass showed compared to minimum temperatures recorded in the growing media, which in the BS were higher than in the AS treatment. The energy consumption of the condensing boiler and of the air heater resulted similar. The energy consumption of the heat pump resulted in 45% energy saving than the air heater and than the condensing boiler system confirming that significant thermal energy saving is possible.
These results confirm the possibility of using conventional heat pumps in agriculture even as a simple installation in an existing greenhouse and their potential efficiency with respect to traditional heating systems [18]. Other authors confirmed that this efficiency can be higher if the heat pump is associated with geothermal and photovoltaic systems [19]. The fact that the heat pump was able to heat the basil plant during the entire period can be attributed to the reported climatic conditions and to the use of a basal system with a small-canopy leafy vegetable. In other layouts of cultivation or species, it should be considered that underfloor or basal heating systems with a moderate temperature (approximatively 40 °C) engender a limitation on the heating output of the radiant system. Therefore, they may not cover all the heating requirements in cold periods, meaning that they should be coupled with another heating system [31]. It is important to consider that even if heat pumps could be used for greenhouse systems, and were more efficient than other conventional heating sources, this would not automatically be translated into financial and environmental benefits [19,22,32]. In fact, the financial cost depends on the unit cost of the energy of electricity or fuel as LPG, methane or diesel, on taxes, on excise duties and on the fixed rate of the supplier. Moreover, the environmental assessment of the layout of the heat pump plant (conventional, geothermal or with photo-voltaic), using electricity from the electricity grid, does not allow an unequivocal environmental assessment [19].
The FFE and CE rates point out that the higher efficiency of HP shall be also evaluated in light of the used energy source: when fossil fuels are the primary energy source, the SREUEf_Yeld points out that such technology is not the most efficient. However, in case the primary energy source is a renewable one, the results enhance the fossil fuel saving potential (Table 9). This opens issues on the fact that energy evaluation shall refer also to social, ecological and strategic values [33]; this shifts attention towards the infrastructures required for energy demand, production, capture and conversion. A thorough analysis of these aspects would enable the setup of a concrete energy-efficient machining system, tailored to meet the enterprise’s needs [34]. For example, in Italy, during 2017, powerplants had 41.5% of efficiency [35], which corresponds to 8222 BTU/kWh, that would have resulted in a SREUEf_Yeld for HP–FFE equal to 201.64 kWh/ kgf.w. that is 13.5% lower than the value of Table 9. However, given the 35.1% average contribution of renewable source [0 BTU/kWh] to the National electric power production, relating the efficiency to the sole fossil fuel contribution would have resulted in a global heat rate of 5355 BTU/kWh and, subsequently, in a SREUEf_Yeld of 130.986 kWh/kgf.w.
In any case, it is also interesting in relation to the approach of the European Council for an Energy Efficient Economy, which recently issued a document about the “energy sufficiency” concept, based on a recognition that energy-efficiency policies alone are not enough to turn around the rising demand for environmentally-costly energy services [36]. The simplest definition of “sufficiency” is: “an amount of something that is enough for a particular purpose”. When this refers to energy (defined as the ability to do work, or to bring about change) and to energy efficiency (meant as the measure of the ratio between energy outputs and inputs) it is clear that energy sufficiency becomes a higher-order idea according to which “sufficient” production facilities or processes are those leading, by definition, to the lowest energy requirements in absolute terms. The present research and the achieved results comply with this recent concept.

5. Conclusions

The energy analysis of the three experimental heating options showed that all of them provide a greenhouse with suitable root zone heating in the winter period. In particular, the results show that the adoption of a conventional heat pump for greenhouse heating leads to remarkable energy savings (–45% energy consumption compared to the condensing boiler and the air heater). On the one hand, these savings underline the key role that HP technology plays in supporting the energetic sustainability of horticultural and floricultural greenhouse farming; on the other, they open issues of the extension of HP applicability in agriculture even without its coupling with geothermal or photovoltaic solutions. The source of the electrical power shall, however, be considered as it affects the overall efficiency of the system.

Author Contributions

Conceptualization, M.F., G.B., M.C., D.M., S.C.; methodology, M.F., C.T., S.C., G.B., M.C., D.M.; formal analysis, M.F., C.T., S.C., M.C., M.B., D.M.; investigation, C.T.; resources, M.F., G.B., C.B.; data curation, M.F., C.T., S.C., M.B., C.B.; writing—original draft preparation, writing, C.T., M.F., S.C., M.C., M.B., D.M., G.B.; supervision, M.F., C.B.; project administration, M.F., G.B., C.B. All authors have read and agreed to the published version of the manuscript.

Funding

This work was supported by the Italian Ministry of Agricultural, Food, Forestry and Tourism Policies, MIPAAFT) under the AGROENER project (D.D. n. 26329, 1 April 2016)—http://agroener.crea.gov.it/.

Conflicts of Interest

The authors declare no conflict of interest. The funders had no role in the design of the study; in the collection, analyses, or interpretation of data; in the writing of the manuscript; or in the decision to publish the results.

Nomenclature

LPG Liquified petroleum gas
CBCondensing boiler
HPCompressor heat pump
COPCoefficient of performance of heat pump
AHOil fired air heater
OATOutside air temperature
IATInside air temperature
ESDExperimental starting date
ECDExperimental completion date
DATDays after transplant
BSBasal heating section
ASAir heating section
EUEEnergy-use efficiency
SREUESource-related energy-use efficiencies
kgoekg of oil equivalents
FFEFossil fuel equivalency
CECaptured energy
RERenewable energy

References

  1. Campiotti, A.C.; Bibbiani, C.; Dondi, F.; Viola, C. Efficienza energetica e fonti rinnovabili per l’agricoltura protetta. Ambiente Risorse Salute 2010, 126, 6–12. Available online: https://www.researchgate.net/publication/285776483_Efficienza_energetica_e_fonti_rinnovabili_per_l'agricoltura_protetta (accessed on 2 September 2019).
  2. Hemming, S.; Balendonck, J.; Dieleman, J.A.; De Gelder, A.; Kempkes, F.L.K.; Swinkels, G.L.A.M.; De Visser, P.H.B.; De Zwart, H.F. Innovations in greenhouse systems—Energy conservation by system design, sensors and decision support systems. Acta Hortic. 2015, 1170, 1–15. [Google Scholar] [CrossRef]
  3. Runkle, E.; Both, A. Greenhouse Energy Conservation Strategies. Michigan State University-Extension Buletin. February 2012. Available online: https://www.canr.msu.edu/resources/greenhouse_energy_conservation_strategies (accessed on 2 September 2019).
  4. Shen, Y.; Wei, R.; Xu, L. Energy Consumption Prediction of a Greenhouse and Optimization of Daily Average Temperature. Energies 2018, 11, 65. [Google Scholar] [CrossRef] [Green Version]
  5. Dieleman, J.A.; Marcelis, L.F.M.; Elings, A.; Dueck, T.A.; Meinen, E. Energy saving in greenhouses: Optimal use of climate conditions and crop management. Acta Hortic. 2006, 718, 203–210. [Google Scholar] [CrossRef] [Green Version]
  6. Elings, A.; Kempkes, F.L.K.; Kaarsemaker, R.C.; Ruijs, M.N.A.; Van de Braak, N.J.; Dueck, T.A. The energy balance and energy-saving measures in greenhouse tomato cultivation. Acta Hortic. 2005, 691, 67–74. [Google Scholar] [CrossRef] [Green Version]
  7. Bailey, B.J. Limiting the relative humidity in insulated greenhouses at night. Acta Hortic. Energy Prot. Cultiv. 1983, 148, 1–11. [Google Scholar] [CrossRef]
  8. Kozai, T. Thermal performance of an oil engine driven heat pump for greenhouse heating. J. Agric. Eng. Res. 1986, 35, 25–37. [Google Scholar] [CrossRef]
  9. Garcia, J.L.; De la Plaza, S.; Navas, L.M.; Benavente, R.M.; Luna, L. Evaluation of the feasibility of alternative energy sources for greenhouse heating. J. Agric. Eng. Res. 1998, 69, 107–114. [Google Scholar] [CrossRef]
  10. Aye, L.; Fuller, R.J.; Canal, A. Evaluation of a heat pump system for greenhouse heating. Int. J. Therm. Sci. 2010, 49, 202–208. [Google Scholar] [CrossRef] [Green Version]
  11. Esen, M.; Yuksel, T. Experimental evaluation of using various renewable energy sources for heating a greenhouse. Energy Build. 2013, 65, 340–351. [Google Scholar] [CrossRef]
  12. Paradiso, R.; De Pascale, S. Effects of Plant Siza, Temperature, and Light Intensity on Flowering of Phalaenopsis Hybrids in Mediterranean Greenhouses. Sci. World J. 2014, 2014, 9. [Google Scholar] [CrossRef] [PubMed] [Green Version]
  13. Sethi, V.P.; Sharma, S.K. Survey and evaluation of heating technologies for worldwide agricultural greenhouse applications. Sol. Energy 2008, 82, 832–859. [Google Scholar] [CrossRef]
  14. Ahamed, M.S.; Guo, H.; Tanino, K. Energy saving techniques for reducing the heating cost of conventional greenhouses. Biosyst. Eng. 2019, 178, 9–33. [Google Scholar] [CrossRef]
  15. Cuce, E.; Harjunowibowo, D.; Cuce, P.M. Renewable and sustainable energy saving strategies for greenhouse systems: A comprehensive review. Renew. Sustain. Energy Rev. 2016, 64, 34–59. [Google Scholar] [CrossRef]
  16. Anifantis, A.S.; Colantoni, A.; Pascuzzi, S. Thermal energy assessment of a small scale photovoltaic, hydrogen and geothermal stand-alone system for greenhouse heating. Renew. Energy 2017, 103, 115–127. [Google Scholar] [CrossRef]
  17. Teeboonma, U.; Tiansuwan, J.; Soponronnarit, S. Optimization of heat pump fruit dryers. J. Food Eng. 2003, 59, 369–377. [Google Scholar] [CrossRef]
  18. Goh, L.J.; Othman, M.Y.; Mat, S.; Ruslan, H.; Sopian, K. Review of heat pump systems for drying application. Renew. Sustain. Energy Rev. 2011, 15, 4788–4796. [Google Scholar] [CrossRef]
  19. Hui, F.; Qichang, Y.; Ji, S. Application of ground-source heat pump and floor heating system to greenhouse heating in winter. Trans. Chin. Soc. Agric. Eng. 2008. Abstract no.12. [Google Scholar]
  20. Russo, G.; Anifantis, A.S.; Verdiani, G.; Mugnozza, G.S. Environmental analysis of geothermal heat pump and LPG greenhouse heating systems. Biosyst. Eng. 2014, 2014, 11–23. [Google Scholar] [CrossRef]
  21. Anifantis, A.S.; Colantoni, A.; Pascuzzi, S.; Santoro, F. Photovoltaic and Hydrogen Plant Integrated with a Gas Heat Pump for Greenhouse Heating: A Mathematical Study. Sustainability 2018, 10, 378. [Google Scholar] [CrossRef] [Green Version]
  22. D’Arpa, S.; Colangelo, G.; Starace, G.; Petrosillo, I.; Bruno, D.E.; Uricchio, V.; Zurlini, G. Heating requirements in greenhouse farming in southern Italy: Evaluation of ground-source heat pump utilization compared to traditional heating systems. Energy Effic. 2016, 9, 1065–1085. [Google Scholar] [CrossRef]
  23. Donohoo-Vallett, P. Accounting Methodology for Source Energy of Non-Combustible Renewable Electricity Generation. U.S. Department of Energy, October 2016; DOE/EE 1488. Available online: https://www.energy.gov/sites/prod/files/2016/10/f33/Source%20Energy%20Report%20-%20Final%20-%2010.21.16.pdf (accessed on 7 January 2020).
  24. Makri, O.; Kintzios, S. Ocimum sp. (basil): Botany, cultivation, pharmaceutical properties, and biotechnology. J. Herbs Spices Med. Plants 2008. [Google Scholar] [CrossRef]
  25. Fedrizzi, M.; Cacini, S.; Burchi, G. Root zone heating optimization in ornamental plant production. GreenSys 2009, 893, 389–395. [Google Scholar] [CrossRef]
  26. Minitab. Minitab 17 Statistical Software; Minitab: State college, PA, USA, 2010. [Google Scholar]
  27. Tang, Y.; Ma, X.; Li, M.; Wang, Y. The effect of temperature and light on strawberry production in a solar greenhouse. Sol. Energy 2020, 195, 318–328. [Google Scholar] [CrossRef]
  28. Flores Velasquez, J.; Ibarra, J.L. Cultivation of peppers using plastic mulch with coloured films and nutrient irrigation. Plasticulture 1998, 1998 116, 16–26. [Google Scholar]
  29. Elad, Y.; Israeli, L.; Fogel, M.; Rav David, D.; Kenigsbuch, D.; Chalupowicz, D.; Maurer, D.; Lichter, A.; Silverman, D.; Biton, S.; et al. Conditions influencing the development of sweet basil grey mould and cultural measures for disease management. Crop Prot. 2014, 64, 67–77. [Google Scholar] [CrossRef]
  30. Walters, K.J.; Currey, C.J. Hydroponic Greenhouse Basil Production: Comparing Systems and Cultivars. HortTechnology 2015, 25, 645–650. [Google Scholar] [CrossRef] [Green Version]
  31. Fabrizio, E. Energy reduction measures in agricultural greenhouses heating: Envelope, systems and solar energy collection. Energy Build. 2012, 53, 57–63. [Google Scholar] [CrossRef]
  32. Esen, H.; Inalli, M.; Esen, M. Technoeconomic appraisal of a ground source heat pump system for a heating season in eastern Turey. Energy Convers. Manag. 2006, 47, 1281–1297. [Google Scholar] [CrossRef]
  33. Stern, P.C.; Aronson, E. National Research Council. In Energy Use: The Human Dimension; The National Academies Press: Washington, DC, USA, 1984. [Google Scholar]
  34. Peng, T.; Xun, X. Energy-efficient machining systems: A critical review. Int. J. Adv. Manuf. Technol. 2014, 72, 1389–1406. [Google Scholar] [CrossRef]
  35. Caputo, A. Fattori di emission atmosferica di gas a effetto serra nel settore elettrico nazionale e nei principali Paesi Europei. ISPRA, Rapporti 303/2019; ISBN 978-88-448-0945-4. Available online: http://www.isprambiente.gov.it/files2019/pubblicazioni/rapporti/R_303_19_gas_serra_settore_elettrico.pdf (accessed on 14 January 2020).
  36. Darby, S.; Fawcett, T. Energy Sufficiency: An Introduction. ECEEE and the Authors. 2018. Available online: https://www.energysufficiency.org/libraryresources/library/items/energy-sufficiency-an-introduction/ (accessed on 2 September 2019).
Figure 1. Monthly means of the external temperature at the experimental site and period of testing (OAT: outer external temperature; ESD: Experiment starting date; ECD: Experiment completion date).
Energies 13 00745 g001
Figure 2. Global layout of the experimental greenhouse (basal side on the left and air side on the right).
Energies 13 00745 g002
Figure 3. Schematic layout of the experimental test.
Energies 13 00745 g003
Figure 4. Detail of the coaxial pipes and basil plant layout.
Energies 13 00745 g004
Figure 5. Detailed layout of the experimental trial: in the left part the dashed and full lines represent the pipes used to heat the growth substrate.
Energies 13 00745 g005
Figure 6. Detail of the scheme adopted at the basal side (heat pump (HP) and condensing boiler (CB) were connected to different benches).
Energies 13 00745 g006
Figure 7. Plot of the greenhouse inner and outer environmental temperatures during the three coldest days of the experimental period.
Energies 13 00745 g007
Figure 8. Density of temperature distribution of the OAT (outside air temperature) and the IAT (inside air temperature) in the AS (air-heating section) and BS (basal-heating section) of the greenhouse.
Energies 13 00745 g008
Figure 9. Boxplots of the daily minimum temperatures measured inside canopy and inside the growing media for the different heating systems. CB: condensing boiler; AH: air heater; HP: heat pump.
Energies 13 00745 g009
Figure 10. Average values of harvested biomass (gf.w.·m−2) of the first, and second cut, and of the total harvested biomass, reported for each tested heating systems: AH (air-heater–air section); CB (condensing boiler–basal section); HP (heat pump–basal section). Data are expressed as average ± standard deviation. Means that do not share a letter are significantly different.
Energies 13 00745 g010
Figure 11. Boxplots representing the daily growth rate of the basil seedlings in the first and in the second growing period for each heating technologies. Means that do not share a letter are significantly different.
Energies 13 00745 g011
Table 1. The main characteristics of the three heating technologies.
LabelTypeEnergy SourceHeating Distribution System
CBCondenser boilerLPGCanopy and root zone
HPHeat pumpElectricityCanopy and root zone
AHOil fired air heaterDieselAir (i.e., entire greenhouse volume, or rather canopy)
Table 2. Technical declared data of the three heating systems.
Heat PumpAirmec HSI 140CT
Maximum thermal powerkW12.8
Maximum cooling capacitykW10.00
Maximum absorbed electrical power (external unit)kW5.2
Coefficient of performance (COP, radiators, external air t = 7 °C, water in/out t = 40/45 °C) 3.6
Condenser boilerFerroli EcoConcept 15A
Maximum thermal powerkW15.3–3.6
LPG gas flowNm31.19–0.28
Maximum absorbed electrical powerW140
Efficiency (80–60 °C)%98.1–97.5
Efficiency (50–30 °C)%104.9–106.7
Efficiency 30% Pmax%109.3
Air heaterGentili Junior 85 SP
Maximum heating powerkW118
Declared efficiency%91
Table 3. Instruments. BS: basal-heating greenhouse section; OAT: greenhouse outside air temperature; IAT: greenhouse inside air temperature; AS: air-heating greenhouse section; HP: heat pump; CB: condensing boiler; AH: air heater.
Brand/ModelMeasured ValuesPosition/Purpose
Testo 175 T1Temperature Canopy12
Testo 175 T2TemperatureCanopy12
Testo 175 T2TemperatureGrowing media BS8
Testo 175 T2TemperatureIrrigation water1
Testo 175 H1Temp, HumidityOAT, IAT 2
VP-3Temp, HumidityGreenhouse 2
Testo 175 T3TemperatureGrowing media AS4
QSO-S PARSolar radiationGreenhouse2
Orno OR-WE-505Electricity consumptionHP1
Elkrogas BK-G4 PLPG consumptionCB1
Aqua metro VZO 4Diesel consumptionAH1
Table 4. Main measured temperature outside (OAT) and inside (IAT) the greenhouse. Data are expressed as average ± standard deviation. Means that do not share a letter are significantly different.
EnvironmentTemperature (°C)
MeanMean Daily MinimumAbsolute Minimum
OAT8.9 ± 4.2 c4.5 ± 3.9 c−6
BS-IAT15.5 ± 5.3 b10.6 ± 2.6 b4.1
AS-IAT17.6 ± 4.3 a12.9 ± 1.6 a9.1
Table 5. Main measured temperatures inside canopy and inside growing media for the three heating systems. Data are expressed as average ± standard deviation. Means that do not share a letter are significantly different. CB: condensing boiler; AH: air heater; HP: heat pump.
Heating TechnologyTemperature (°C)
CanopySubstrate
MeanMean daily minimumAbsolute minimumMeanMean daily minimumAbsolute minimum
CB16.6 ± 2.2 a12.4 ± 2.8 a5.121.0 ± 1.2 a20.0 ± 1.3 b16.8
AH17.1 ± 2.0 a13.1 ± 1.5 a9.315.9 ± 2.0 b14.5 ± 1.8 c10.7
HP16.4 ± 2.2 a12.2 ± 2.7 a4.921.6 ± 1.2 a20.8 ± 1.2 a18.3
Table 6. Mean values of humidity inside and outside the greenhouse during the experimental test. BS: basal heating system; AS: air heating system.
Outside Humidity %BS Humidity %AS Humidity %
Min48.935.631.6
Mean72.464.053.5
Max90.679.669.0
Table 7. Global and specific heat consumption for the studied heating technologies. CB: condensing boiler; AH: air heater; HP: heat pump.
HarvestsHeating TechnologyGlobal Heat Consumption (kWh)Specific Heat Consumption (kWh/m2)
First cutAH13.99 × 103139.99
CB2.45 × 103240.07
HP13.3 × 106130.59
Second cutAH3.59 × 10335.92
CB0.61 × 10360.18
HP0.29 × 10328.82
Total consumptionAH17.59 × 103175.91
CB3.06 × 103300.25
HP1.63 × 103159.41
Table 8. Kilowatt-hours expended for gram of harvested biomass. CB: condensing boiler; AH: air heater; HP: heat pump; EUEf_Yeld: Energy-use efficiency expressed for fresh weight of harvested plant biomass; EUEd_Yeld: Energy-use efficiency expressed for dry weight of harvested plant biomass; gf.w. grams of fresh weight; gd.w.: grams of dry weight.
HarvestHeating TechnologyEUEf_Yeld (kWh/ gf.w)EUEd_Yeld (kWh/ gd.w.)
First cutAH0.747.37
CB0.667.50
HP0.323.44
Second cutAH0.040.40
CB0.040.45
HP0.020.98
Total consumptionAH0.151.63
CB0.151.80
HP0.080.98
Table 9. Kilowatt-hours expended for kilogram of fresh harvested biomass of the three tested heating technologies. CB: condensing boiler; AH: air heater; HP: heat pump; CE: captured energy; FFE: fossil fuel equivalency.
Heating TechnologySREUEf_Yeld (kWh/kgf.w)
AH148.07
CB154.77
HP–CE83.68
HP–FFE233.09

