Snapshot of Photovoltaics—February 2020


European Commission, Joint Research Centre (JRC), Via E. Fermi 2749, I-21027 Ispra (VA), Italy
Energies 2020, 13(4), 930; https://0-doi-org.brum.beds.ac.uk/10.3390/en13040930
Submission received: 7 February 2020
/
Revised: 15 February 2020
/
Accepted: 18 February 2020
/
Published: 19 February 2020
(This article belongs to the Special Issue Accelerating the Adoption of Solar Energy towards a Low-Carbon Future)
Abstract
:Since the demonstration of the first modern silicon solar cells at Bell Labs in 1954, it took 58 years until the cumulative installed photovoltaic electricity generation capacity had reached 100 GW by the end of 2012. Then, it took another five years to reach an annual installation capacity of over 100 GW in 2017 and close to 120 GW in 2019. As a consequence, the total world-wide installed photovoltaic electricity generation capacity exceeded 635 GW at the end of 2019. Although it witnessed a 20% and 25% decrease in annual installations in 2018 and 2019, respectively, China was again the largest market with 30 GW of annual installations. The number of countries in the club with more than 1 GW annually has increased to 18 countries in 2019. The use of local battery storage systems in solar farms as well as decentralized photovoltaic electricity generation systems combined has again increased, due to the falling storage system costs.
1. Introduction
The 25th session of the Conference of the Parties (COP25) in Madrid, Spain in December 2019 failed to reach an agreement on the urgent pathways to decarbonize our energy supply by 2050. This failure increases the pressure on the Parties in 2020, if the pathway to 1.5 °C should not be lost, to come forward with credible solutions before the COP26 in Glasgow, UK in November 2020.
According to the World Energy Outlook 2019, the only scenario to meet the Paris Agreement is the Sustainable Development Scenario [1]. Under this scenario, the power sector has to be 80% carbon free by 2040. In this scenario, solar photovoltaic electricity generation would have to supply 3518 TWh in 2030 and 7208 TWh in 2040. However, this scenario does not yet take into account a broad electrification of our total energy supply, especially in the transport, heating, and cooling sector as well as electrification of industrial processes. It is interesting to note that the WEO2019 sustainable development scenario is converging with the Greenpeace [r]evolution world energy scenario 2015 [2].
Solar photovoltaic electricity generation is key to achieving a deep decarbonization with a high grade of electrification in 100% RES energy scenarios [3]. Different to the mainstream opinion, this scenario predicts that it could be achieved in a cost effective matter as a levelized cost of electricity would decrease from around 76 USD/MWh in 2015 to around 58 USD/MWh by 2050.
In such a scenario, the use of electricity and synthetic fuels in the transportation sector as well as in the heating and cooling sector will increase the demand for renewable electricity after 2030. In such a 100% RES scenario, solar photovoltaic (PV) power would have to provide 5800 TWh in 2025, 17,000 TWh by 2030, and over 50,000 TWh by 2040. This is a huge challenge if one compares that only about 750 TWh of electricity were generated with PV systems in 2019.
Despite a decrease in annual installations in China for the second year in a row, the global photovoltaic market increased again and reached about 120 GW in 2019. The political induced slowdown in China was more than compensated for by new emerging markets and it is worthwhile to mention that 18 countries installed more than 1 GW in 2019. The total solar photovoltaic power capacity exceeded 635 GW at the end of 2019.
Over the last few years, the number of countries looking towards PV for a cost effective electricity supply has increased substantially. Traditional government driven incentive programs in the form of direct investment subsidies, feed-in tariffs, or net-metering approaches have declined. On the other hand, tender programmes or renewable portfolio standards (RPS) with power purchase agreements (PPA) have gained increasing attention and led to more market driven investment decisions.
2. Photovoltaic Solar Cell Production
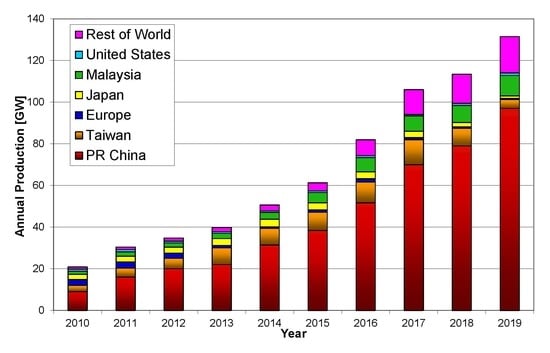
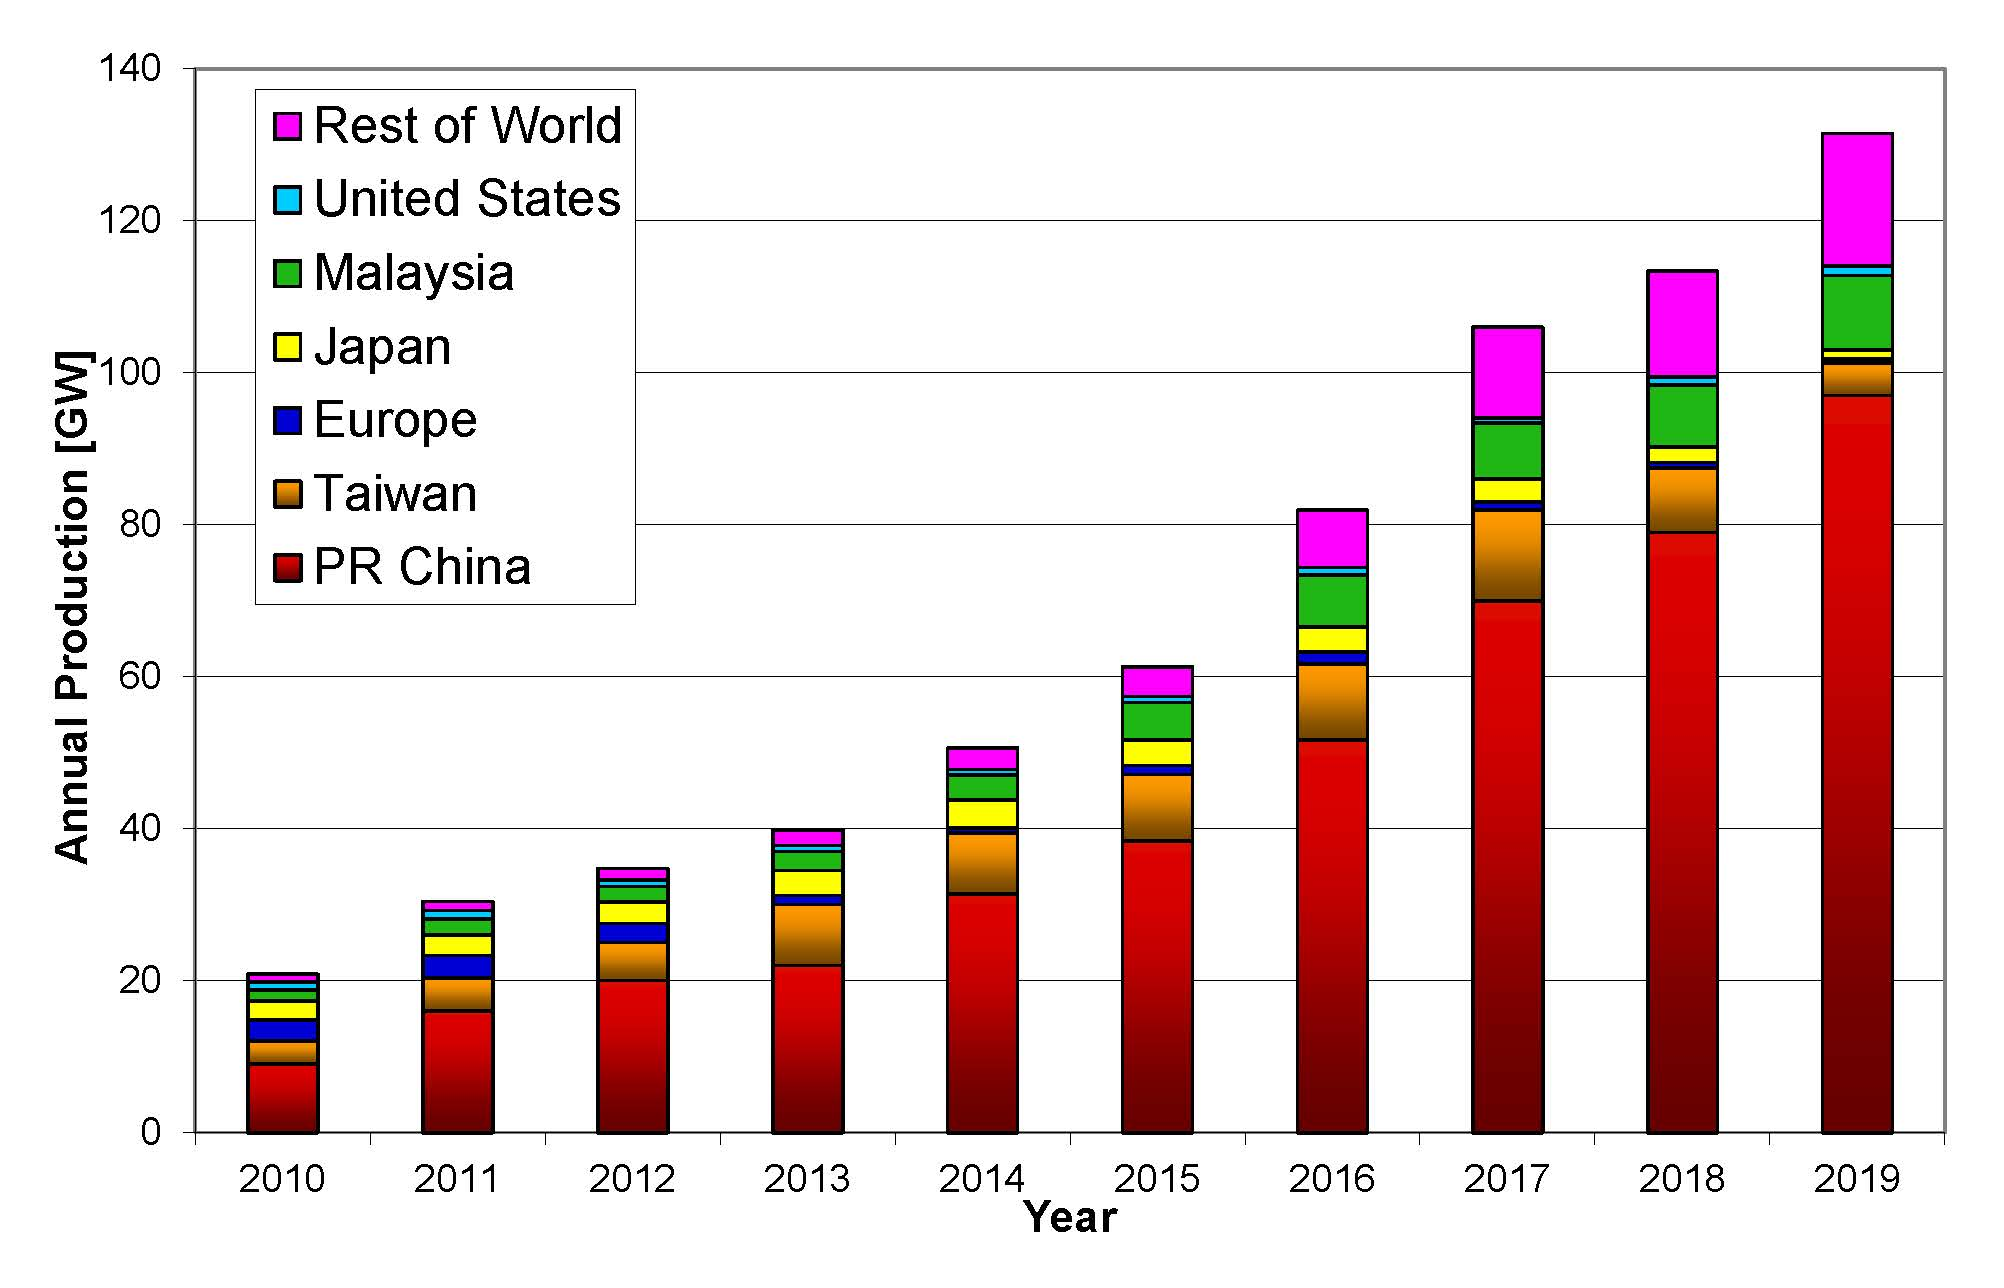
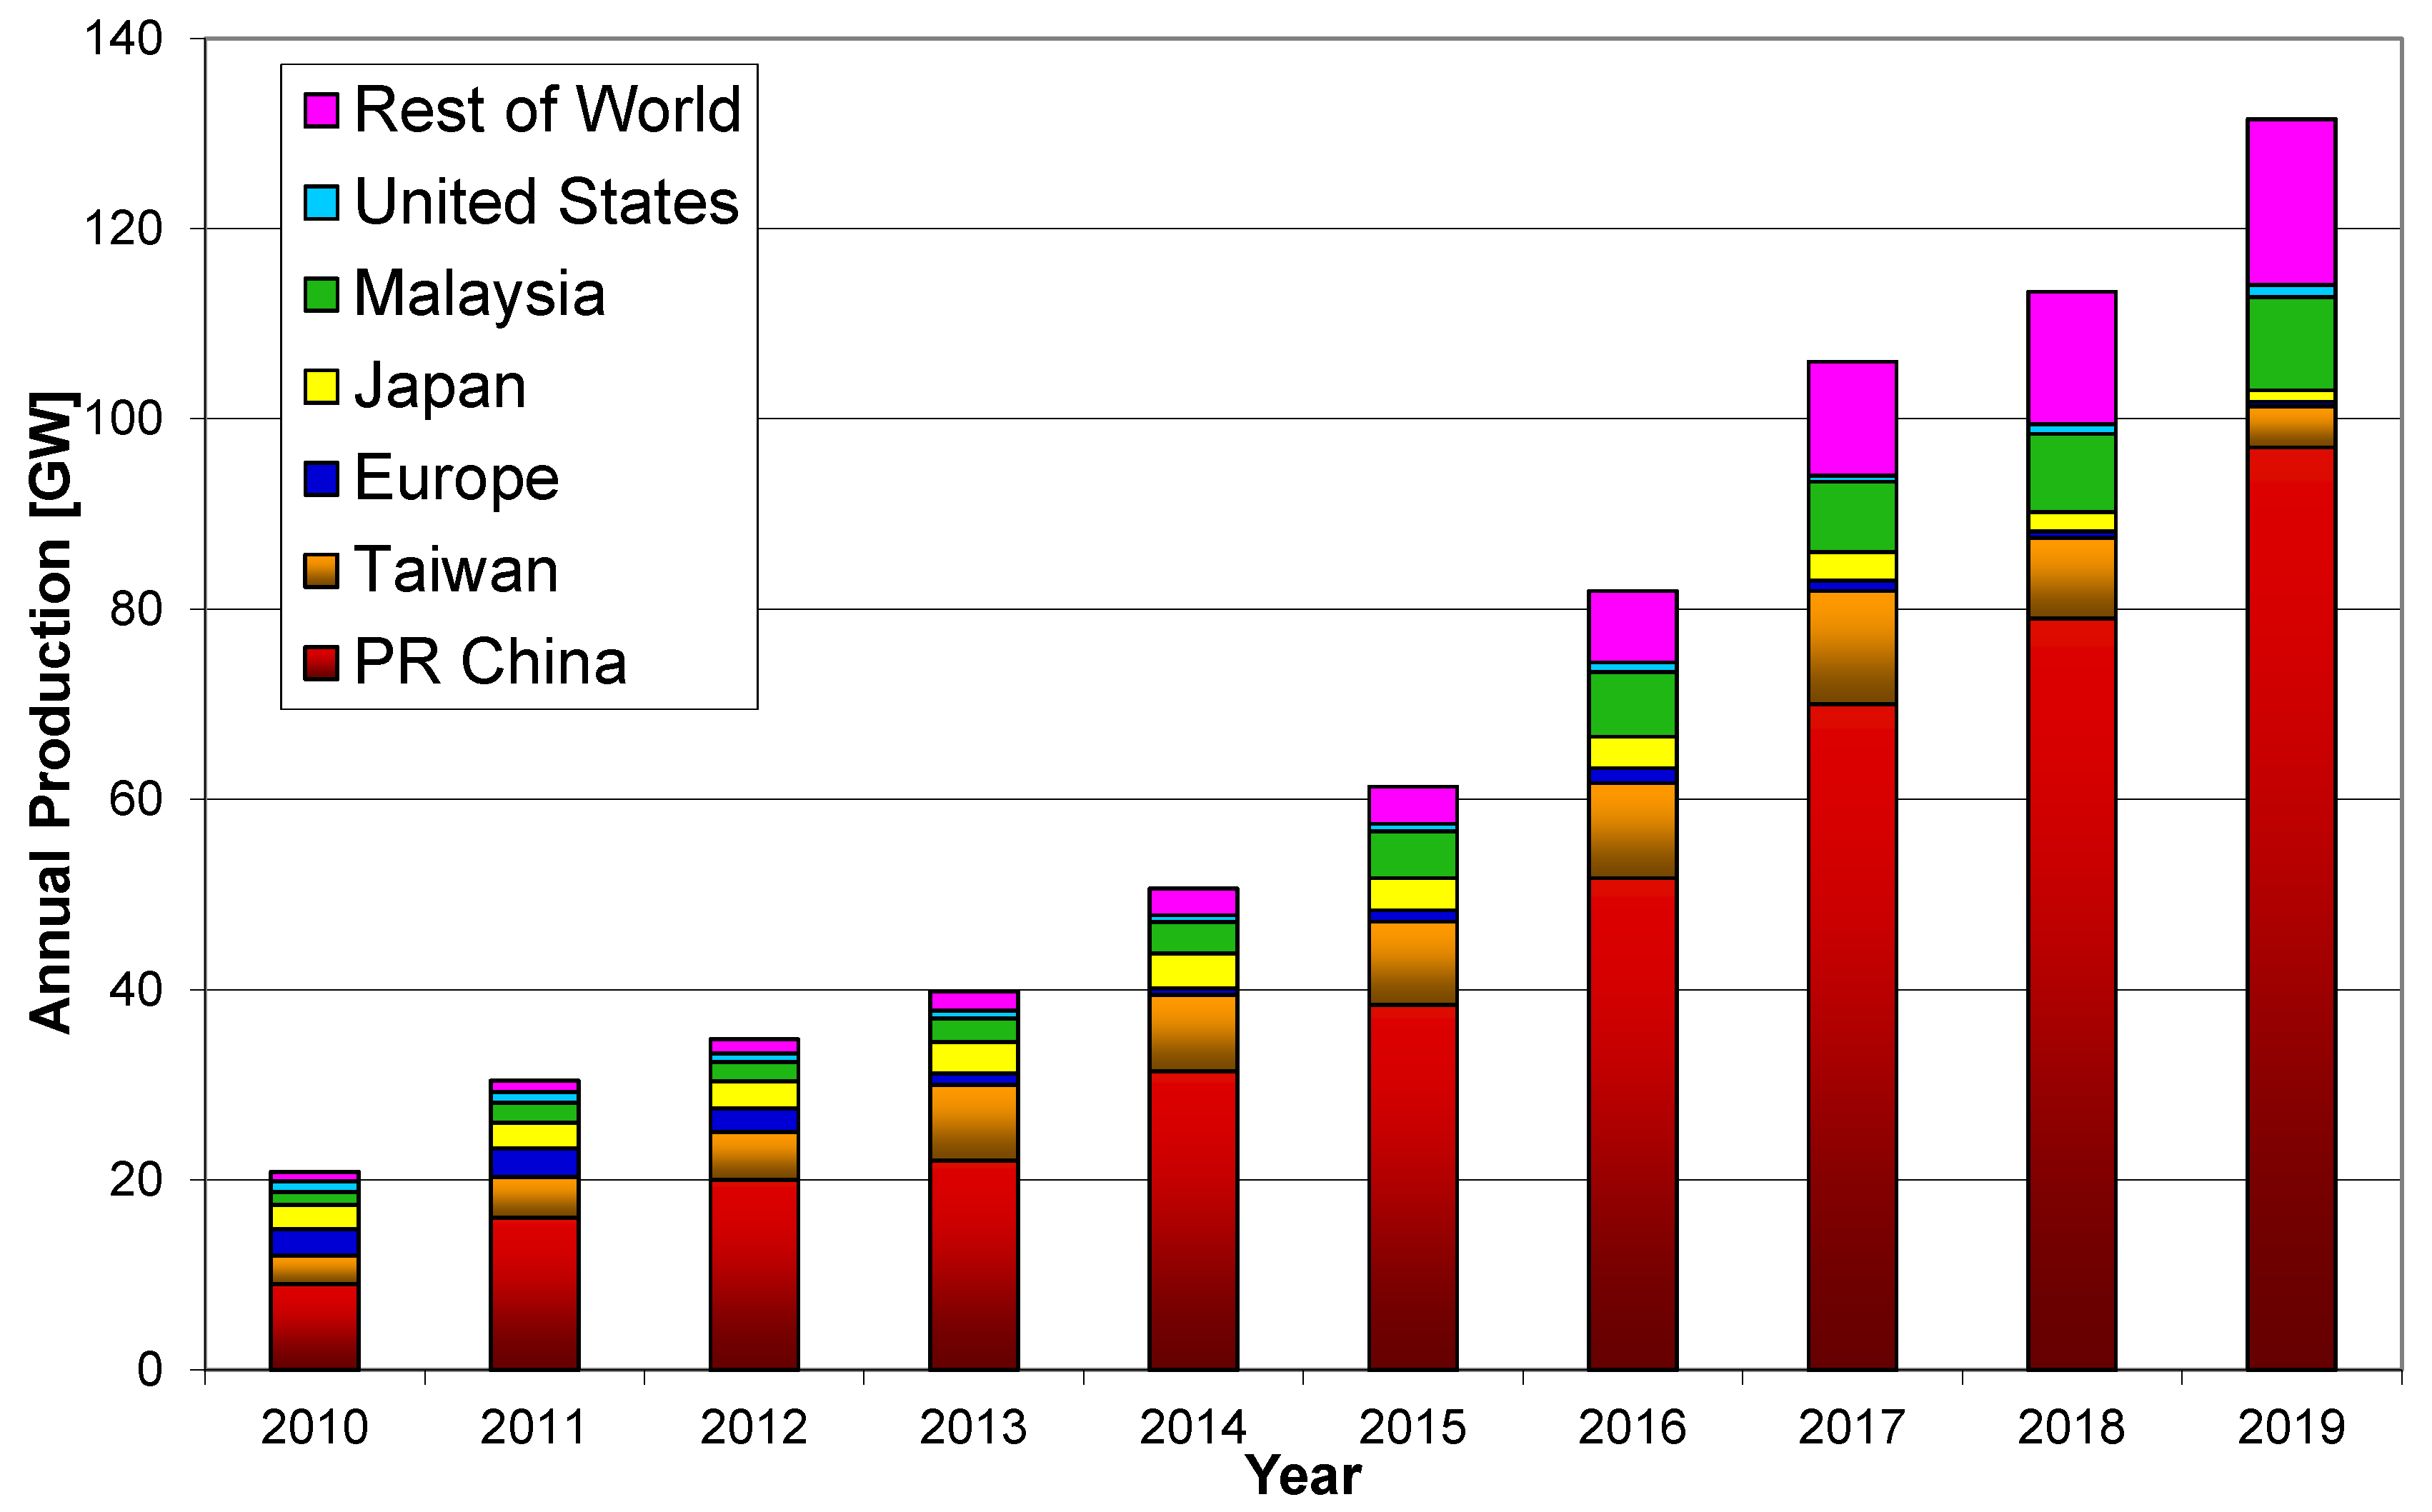
The current available preliminary data for the world solar cell production in 2019 vary between 120 GW and 135 GW. A number of facts are responsible for the variation in this data. As the number of public traded companies is decreasing, the access to genuine company data is getting more complicated. In addition, different reporting, e.g., production, shipments or sales figures, are used.
The data sources were stock market reports of listed companies, different market reports and personal contacts. The comparison of different sources led to an estimate of 131 GW (Figure 1), which is an increase of around 16% compared to 2018.
Uncertainties in Production Statistics:
- Solar cells or thin film module production figures are only reported by a limited number of companies.
- Figures of shipments or sales possibly include products from stock or delivery in the future.
- Reports of “solar products”—no differentiation between wafers, cells, or modules.
- There is an increasing trend towards specialization of solar cell production, with only a small module manufacturing capacity as well as Original Equipment Manufacturing (OEM), which increases the risk of double counting.
The steep price decline for solar system hardware and the fierce competition amongst the solar cell manufacturing companies resulted in an ongoing consolidation of manufacturing companies along the value chain. At the beginning of 2020, Bloomberg New Energy Finance reported that they still tracked 290 active companies along the crystalline silicon value chain from polysilicon to module manufacturing [5]. Despite the overall decrease of companies active along the silicon value chain and a significant overcapacity, there were still a number of new market entrants in the last few years. Another interesting fact is that two-thirds of the current manufacturing capacity for silicon solar cells, which is over 190 GW, were only commissioned after 2015 [6].
The number of GW markets outside of China has further increased and compensated the decrease of the local market there in 2019. The current coronavirus outbreak in China and its effects on the photovoltaic value chain highlights the dangers of a too massive manufacturing concentration in only one world region. Manufacturing 4.0 could help to reduce the manufacturing costs further, not only in Asia, and could enable a geographically more balanced PV value chain.
The German mechanical engineering industry association (VDMA) commissioned a study by the Fraunhofer Institute for Solar Research (Fh ISE) about chances for solar cell manufacturing in Europe. The study highlighted the importance of economy of scale and shows that a European manufacturing chain could be competitive with solar PV factories capable of 5 to 10 GW annual production [7].
The global increase of solar photovoltaic power needed for the energy transition will lead to a greater number of jobs in the sector. According to IRENA, the solar sector provided jobs for more than 3.6 million at the end of 2018 [8]. Most of these jobs are downstream in the value chain. With increasing automation of manufacturing processes, the number of jobs per MW produced in the manufacturing sector of solar photovoltaic hardware will decrease to stay competitive.
3. Solar PV Electricity Generation and Markets
Over the last few years, the capital expenditures (CAPEX) for PV solar systems have converged globally. However, differences in market size and local competition can still lead to significant differences. Local factors like import taxes, local content rules, or existing tax credits have an additional influence on local prices. A global benchmark for levelized cost of electricity (LCOE) is published regularly by BNEF. For the 2nd half year (H2) 2019, this benchmark in the solar sector was USD 51 per MWh, which corresponds to a decrease of about 15% compared to of the second half 2018 [9]. With this, the LCOE for non-tracking silicon PV systems have decreased by over 77% over the last 10 years [10]. The contribution of solar module costs towards the benchmark PV system CAPEX has fallen below 30%.
Battery costs have decreased by roughly 85% between 2010 and 2018 [4]. This price reduction as well as various incentive programs have increased the number of residential and commercial PV projects with storage. The addition of storage in large scale PV plants mainly is driven by the goal to utilize the alternating current (AC) connection as efficient as possible.
A number of factors determine the real electricity generation costs from photovoltaic systems. Geographical and technology factors like the solar radiation, tracking or no-tracking PV system design, string or central inverter configuration, fixed operation and maintenance (O&M) as well as connection costs are important. However, the financial aspects of a project like the share between debt and equity as well the interest rates and return on equity expectations have a more significant influence and can differ substantially from country to country. The variation of LCOE for non-tracking systems varied between USD 39 to 73 per MWh without and USD 65 and 213 per MWh with storage in the second half of 2019 [9]. One-axis tracking systems without storage varied between USD 35 and 65 per MWh. Power Purchase Agreements (PPA) can have even lower prices, depending on the solar radiation, local tax regime, and financing conditions.
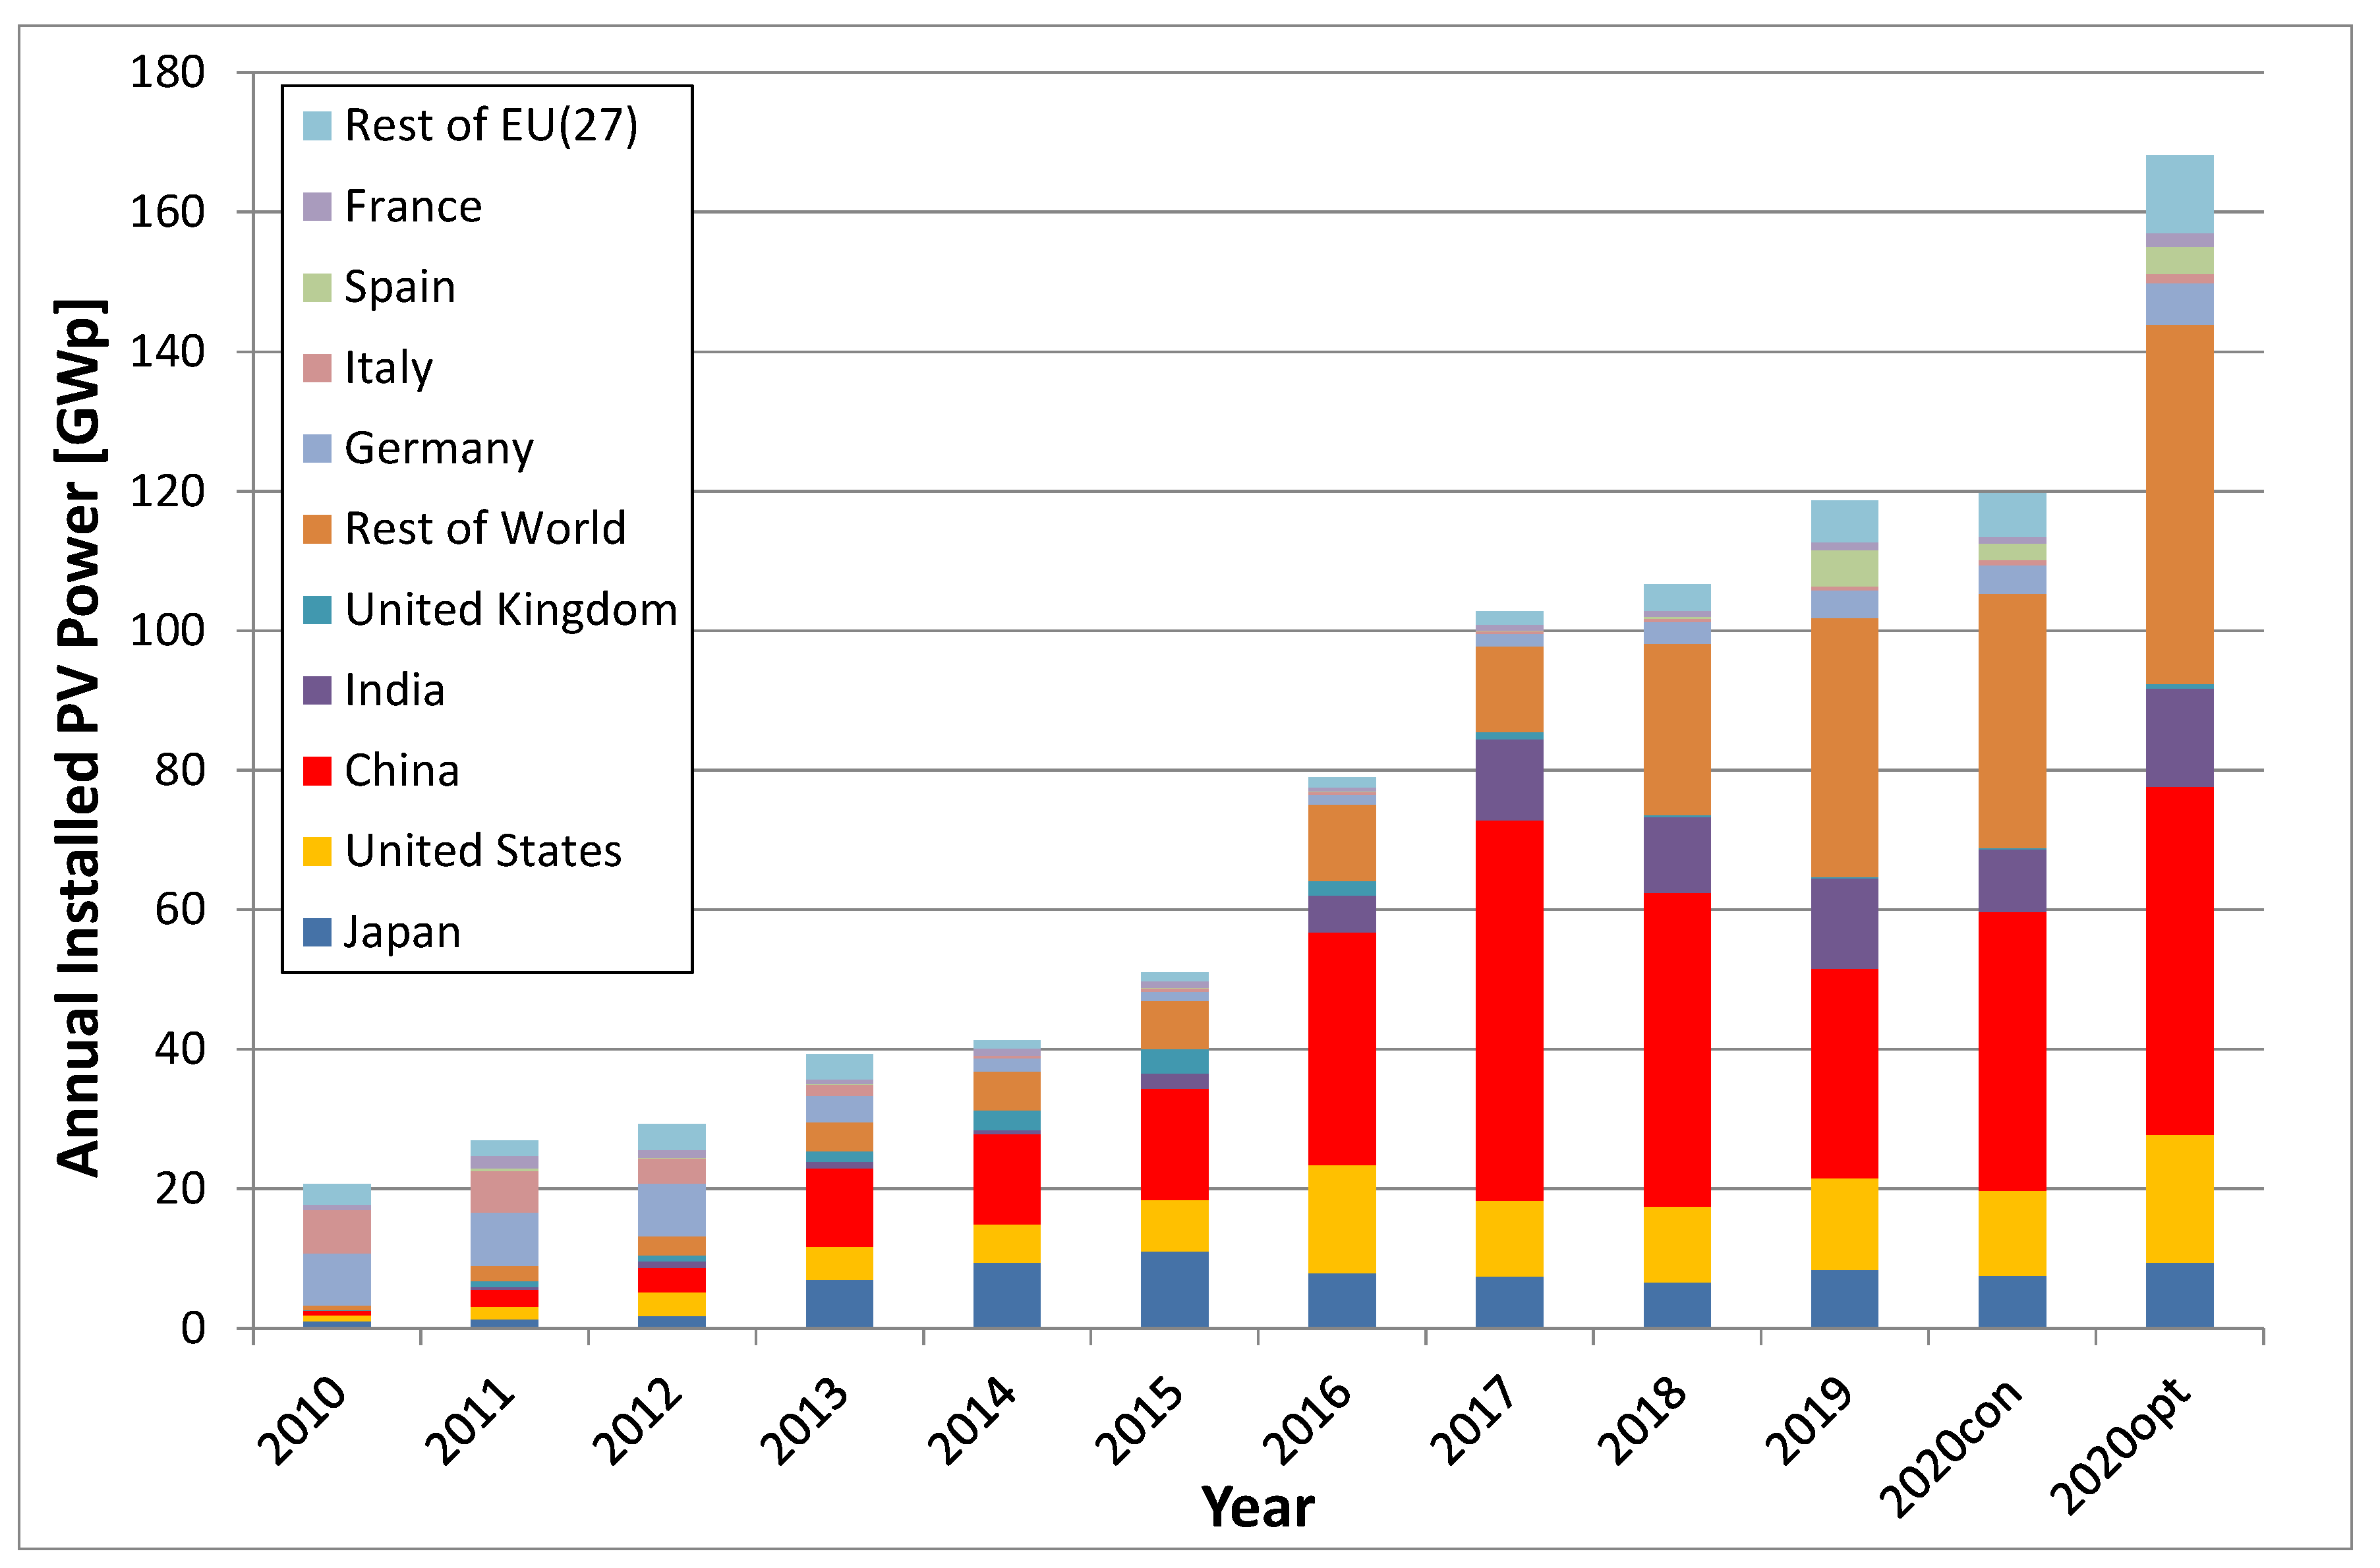
Overall Investments in renewable power slightly increased, whereas investments into solar energy saw a 2% decrease to USD 141 billion. However, preliminary data show that the new PV capacity increased by more than 10% to about 120 GW in 2019 (Figure 2), which is roughly in the middle between the conservative and optimistic forecasts [4].
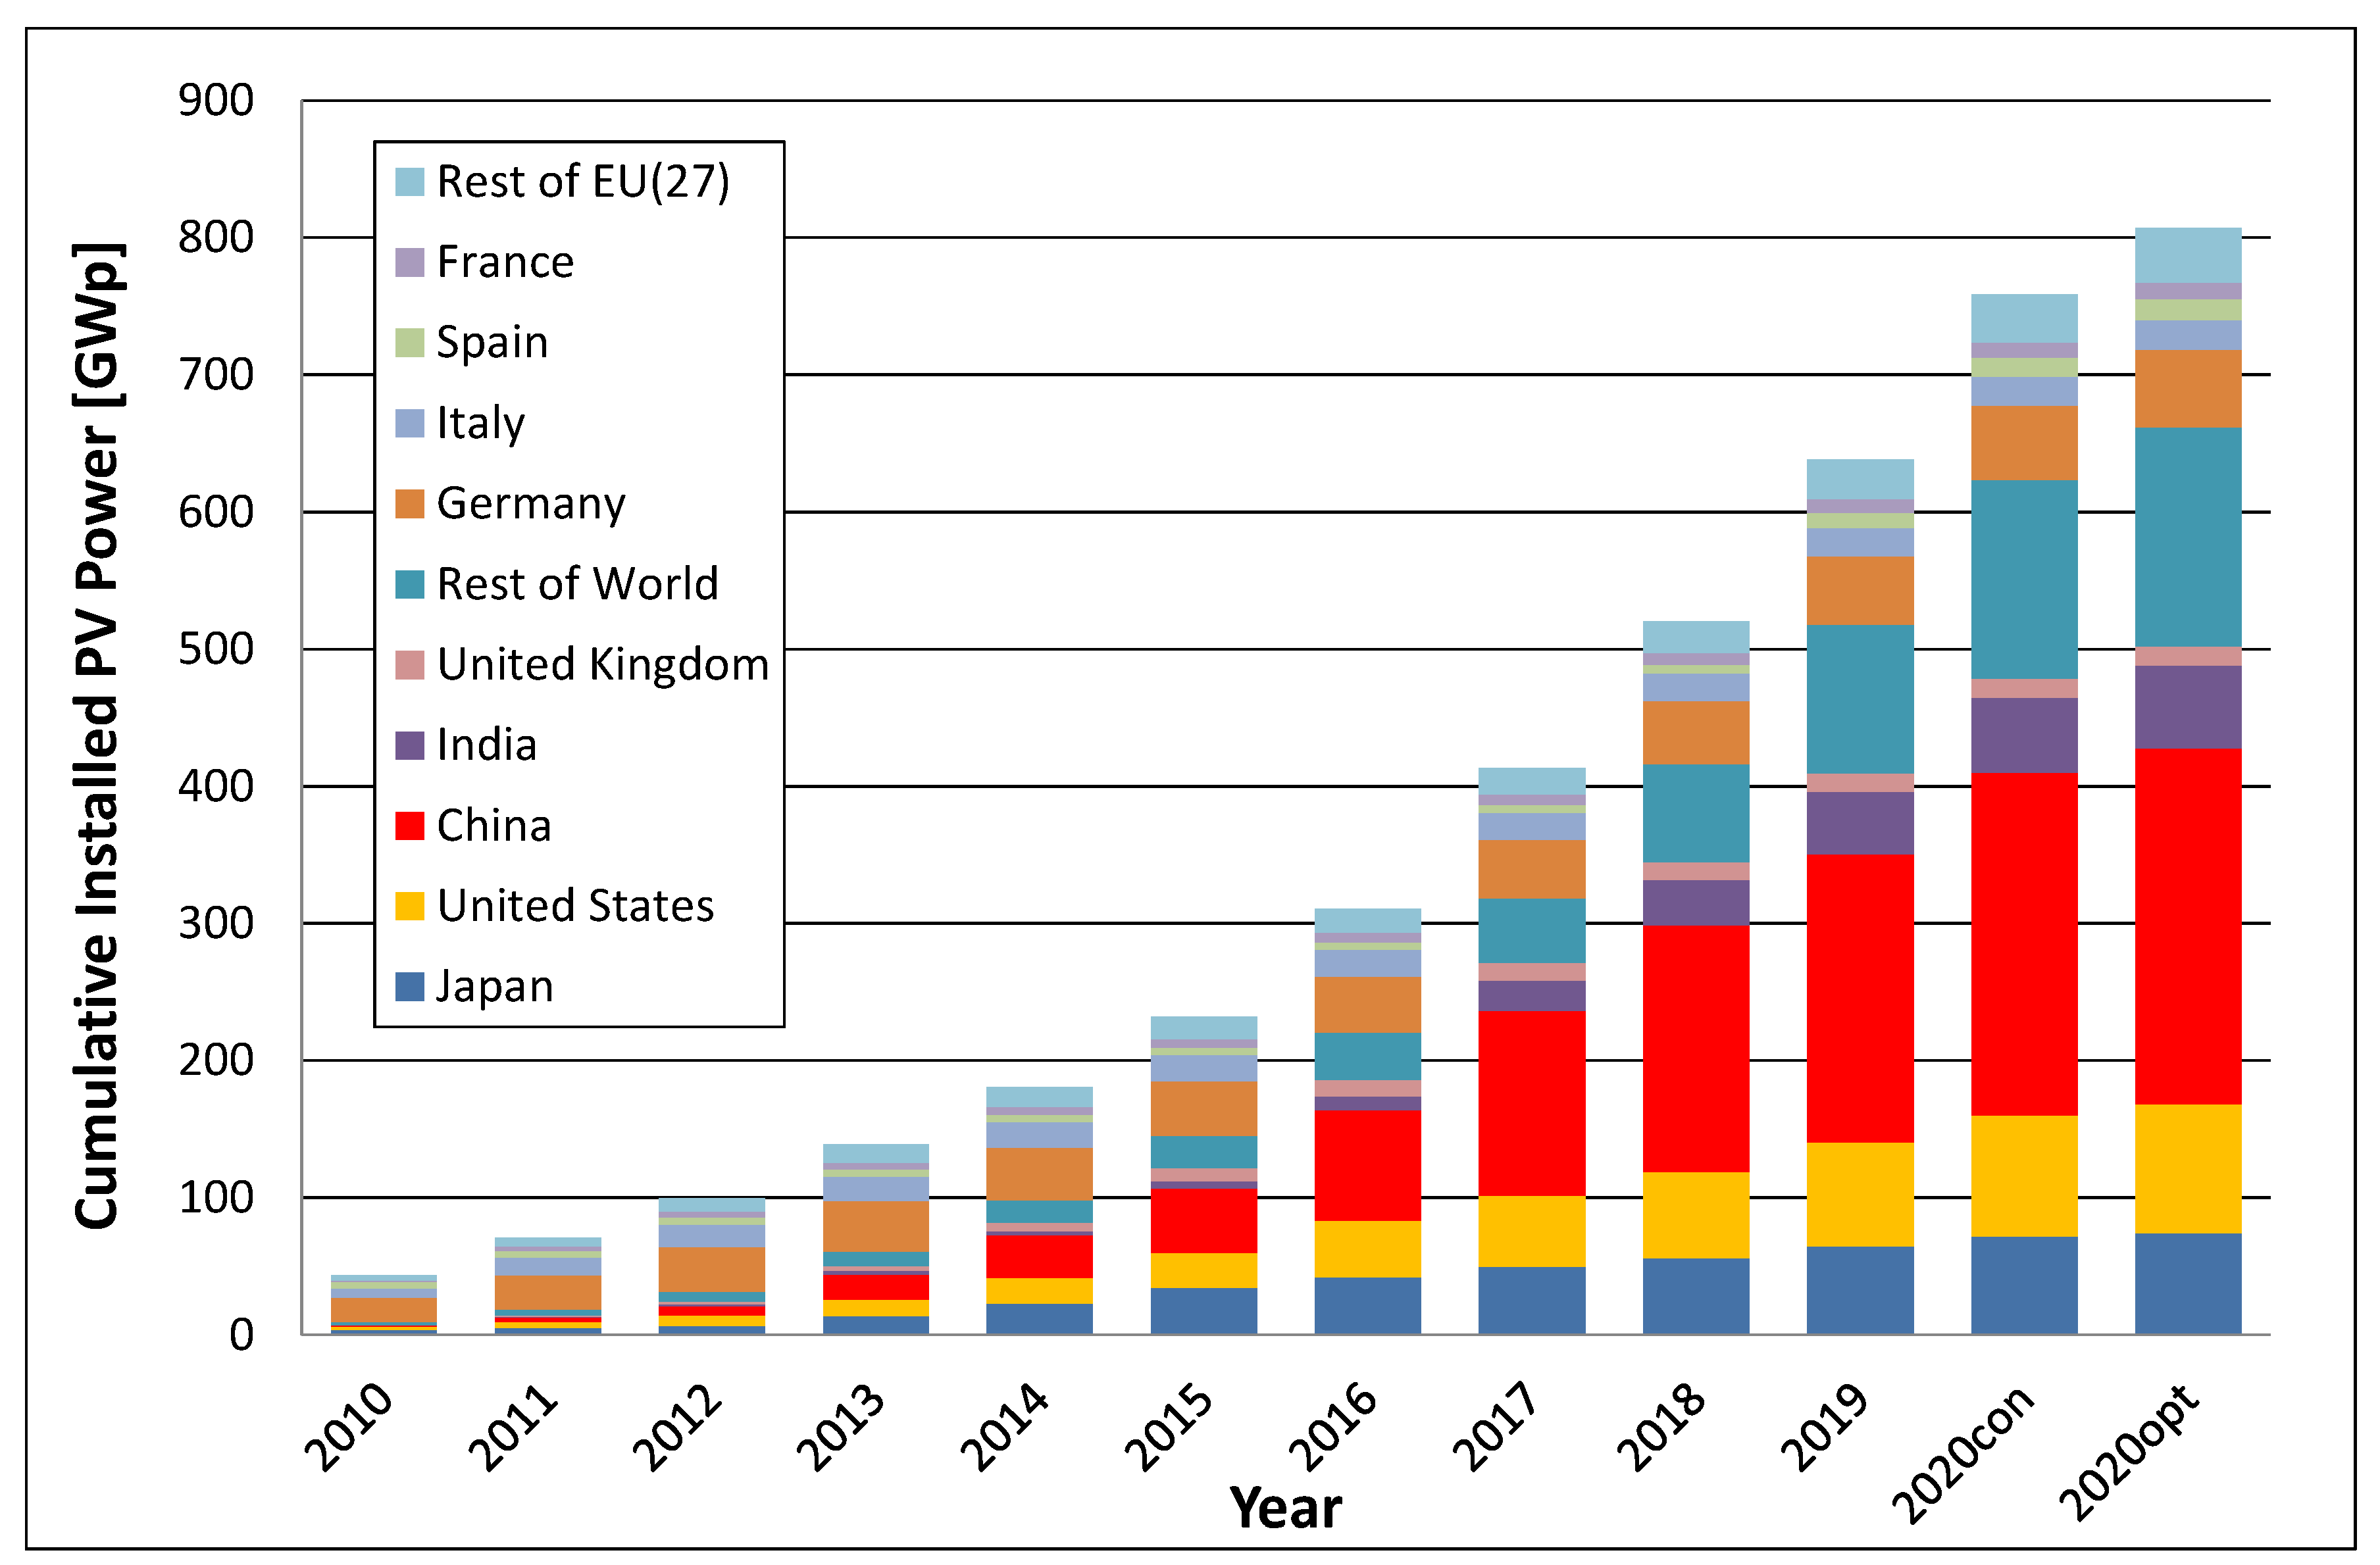
For 2020, most market forecasts expect a higher growth rate. Predictions for new installations range between 120 GW and 154 GW (Figure 3) [11]. The 2019 International Energy Agency (IEA) Renewable 2019 Report expects an addition between 586 and 765 GW of new PV power between 2020 and 2024 [12]. This would increase the total installed solar photovoltaic power capacity to 1195 GW in the main case or 1374 GW in the accelerated scenario.
Uncertainties in Market Statistics:
- The installed capacities reported in this communication are installed system hardware, which in some cases might not yet be officially connected to the grid. Therefore, some discrepancies with other statistics might occur on an annual basis, especially if the capacity is only counted once it is actively feeding to the grid. However, in the long run, the statistics will converge.
- Reported capacity in this communication is nominal direct current (DC) peak power (Wp) under standard test conditions (1000 W irradiance, air mass 1.5 light spectrum and 25 °C device temperature) for reasons of consistency.
- Not all national and international statistics use DC peak power (Wp) for solar PV systems. Often the utility peak AC power, relevant for the transmission operator is reported. Since 2009, the DC/AC ratio is constantly increasing and varies from market to market.
- Official statistics of solar PV power installations or sales statistics of the relevant components are not available from all countries.
The three largest markets, China, the European Union (EU27), and the United States of America, were home to more than 64% of the total world-wide solar photovoltaic power capacity of 638 GW at the end of 2019 (Figure 2). Given the current deployment trend, it is expected that the total solar PV power capacity will exceed 1 TW in 2022.
3.1. Africa
Over the last five years, the total installed solar PV capacity has more than quadrupled from close to 1.5 GW at the end of 2014 to more than 8 GW at the end of 2019. The main drivers for this growth were South Africa, Egypt, Morocco, and Algeria, which now account for more than three quarters of the total capacity. However, the utilization of Africa’s vast solar resources is accelerating. An important tool to finance large solar PV projects in Africa is the World Bank’s Scaling Solar program [14]. So far, four African Nations, Ethiopia, Madagascar, Senegal, and Zambia have signed financing agreements.
In 2018, the Africa Development Bank (AfDB) had launched an initiative called “Desert to Power”. The aim of the initiative is to deploy 10 GW solar power for the 250 million people across the Sahel zone. On 16 September 2019, on the occasion of the G5 Sahel summit in Ouagadougou, the heads of state gave strong support to this initiative.
The largest solar project in Africa is the Benban solar complex with 2 GWAC power, located near Aswan in upper Egypt. The Benban project is divided into 41 individual plants. Thirty-one plants have a 50 MWAC (64 MWDC) capacity each, whereas, due to the shape of the area, the remaining 10 projects have different capacities [15].
3.2. Asia and Pacific Region
After the surprise announcement of China’s National Development and Reform Commission (NDRC), the Chinese Ministry of Finance and the National Energy Board ending the feed in tariff scheme for new utility-scale solar projects in May 2018, it took longer than expected until the successful bidders of the first solar auction were announced in July 2019 [16]. This delay resulted in another 25% decrease of the Chinese new installation market to 30 GW in 2019. However, this was almost compensated for by stronger than expected markets in Australia, India, Japan, South Korea, and Vietnam. The impacts of the current coronavirus outbreak on the Chinese solar PV value chain are not only a huge uncertainty concerning production but installations as well. If the disruptions only affect the first quarter of 2020, a stable market or even a moderate increase to about 80 GW might be achieved in 2020.
3.3. European Union
Two major political events currently reshape the renewable energy market in the European Union. The first was the exit of Great Britain from the EU on 31 January 2020. The second was the announcement of the European Green Deal in December 2019 [17].
The goals of the Green Deal for the EU include becoming climate-neutral by 2050, helping companies become world leaders in clean products and technologies, and ensuring a just and inclusive transition. Plans on how to finance this Green Deal were presented in January 2020 with the aim to mobilize EUR 1 trillion of sustainable investments over the next decade [18].
The Green Deal calls for an accelerated reduction of greenhouse gas (GHG) emissions in the European Union to at least 50% and towards 55% compared with 1990 levels. This is more than the 40% GHG reduction foreseen in the recast of the Renewable Energy Directive (RED II) [19]. To understand possible implications for PV at EU level, different decarbonization scenarios were analyzed with regard to how to reach a 50 to 55% GHG reduction by 2030 [20]. Depending on the chosen pathway to achieve the targeted GHG reduction and assumptions about the technology availability of alternative options, the necessary PV capacity in the European Union would need to be significantly higher than the estimated 360 GW to achieve the 32% RES target in the recast Renewable Energy Directive [21].
In 2011, new PV installations in The EU(28) peaked and accounted for 70% of worldwide installations. Six years with declining markets and stagnation followed until this trend was reversed in 2018 [22]. The 2018 growth rate was almost 50% to reach roughly 9 GW and was even exceeded in 2019, when the annual market in the European Union was between 16 and 17 GW. The top three countries were Spain (4.8 to 5.2 GW), Germany (3.8 to 4 GW), and the Netherlands (2.3 to 2.5 GW). A newcomer in the top 5 is Poland, which installed about 800 MW. Three more countries installed more than 500 MW, namely Belgium, Hungary, and Italy.
3.4. Americas
The combined North and South American Markets grew by over 25% and new solar photovoltaic power capacity of about 21 GW was added in 2019. Amongst the three largest markets, Mexico (2.1 GW) and Brazil (3.0 GW) changed places, whereas the USA (13.2 GW) remained in first place. A total of close to 100 GW are now installed in the Americas, with more than 75% in the USA. However, already five countries have a total capacity exceeding 1 GW followed by four countries with more than 500 MW. For 2020, a market exceeding 20 GW can be expected.
4. Conclusions
The already low costs of solar electricity generation with PV systems and the potential for further cost reduction will drive the growth of PV installations in the coming decades. A number of PV industry associations, as well as Greenpeace, the European Renewable Energy Council (EREC), the Energy Watch Group with Lappeenranta University of Technology (LUT), Bloomberg New Energy Finance (BNEF), and the International Energy Agency and the International Renewable Energy Agency (IRENA), have developed scenarios for the future growth of PV systems [1,2,3,22,23,24,25]. The different deployment figures of these scenarios are shown in Table 1. Between 2016 and 2019, the predicted PV capacity in the IEA World Energy Outlook has significantly increased. The JRC PV Status Reports have tracked pre-2016 scenarios [26,27].
It is interesting to note that some of the 2020 values were already exceeded in 2019 (red figures).
Despite the existing differences in the deployment pathways and ambitions, all scenarios indicate huge growth potentials for PV power in the future, provided that an enabling policy framework is in place. It is important to remember that system changes—and the massive deployment of solar PV is such change—will not happen by itself, but need the active support of all stakeholders. In order to stay on the 1.5 °C track, society has to realize the energy transition towards a net zero carbon energy supply by 2050 and PV is a crucial pillar to achieve this. However, there are still a number of barriers ranging from perception, legal, and regulatory conditions as well as technical limitations of the existing transmission and distribution systems. Neither the necessary adaptation and transformation of the energy networks nor the political will to accelerate the use of renewable energy sources and PV is in line with the urgency to decarbonize our energy supply by 2050.
Funding
This research received no external funding
Conflicts of Interest
The author declares no conflict of interest. The scientific output expressed is based on the current information available to the author, and does not imply a policy position of the European Commission.
References
- Fatih, B. World Energy Outlook 2019; International Energy Agency Publication: Paris, France, 2019. [Google Scholar]
- Energy Revolution. 2015. Available online: https://www.duesseldorf.greenpeace.de/sites/www.duesseldorf.greenpeace.de/files/greenpeace_energy-revolution_erneuerbare_2050_20150921.pdf (accessed on 3 February 2020).
- Ram, M.; Bogdanov, D.; Aghahosseini, A.; Gulagi, A.; Oyewo, A.S.; Child, M.; Caldera, U.; Sadovskaia, K.; Farfan, J.; Barbosa, L.S.N.S.; et al. Global Energy System Based on 100% Renewable Energy—Power, Heat, Transport and Desalination Sectors; Study by Lappeenranta University of Technology and Energy Watch Group; Energy Watch Group Publication: Berlin, Germany, 2019. [Google Scholar]
- Jäger-Waldau, A. PV Status Report 2019; Publications Office of the European Union: Luxembourg, 2019. [Google Scholar]
- 2019 PV Manufacturing Capacity Review; Bloomberg New Energy Finance Publication: London, UK, 2020.
- PV Capacity Expansion Benefits Equipment Suppliers; Bloomberg New Energy Finance Publication: London, UK, 2020.
- VDMA. Press Release European Photovoltaic Production Can be Profitable. Available online: https://pv.vdma.org/documents/105945/39287166/pr_vdma_study_pv_cost%20comparison_final_en_1565787427224.pdf/85b54816-7f5c-5a92-6c56-72d84f6edc48 (accessed on 3 February 2020).
- Renewable Energy and Jobs—Annual Review 2019. Available online: https://www.irena.org/publications/2019/Jun/Renewable-Energy-and-Jobs-Annual-Review-2019 (accessed on 3 February 2020).
- 2H 2019 LCOE Update; Bloomberg New Energy Finance Publication: London, UK, 2019.
- Q3 Levelised Cost of Energy Outlook; Bloomberg New Energy Finance Publication: London, UK, 2009.
- 4Q 2019 Global PV Market Outlook; Bloomberg New Energy Finance Publication: London, UK, 2019.
- Renewables 2019—Analysis and Forecast to 2024; International Energy Agency Publication: Paris, France, 2019.
- Global Market Outlook for Photovoltaics, 2019, 2018, 2017, Solar Power Europe Publication: Brussels, Belgium, 2019.
- World Bank, Scaling Solar Programme. Available online: https://www.scalingsolar.org/ (accessed on 6 February 2020).
- Benban 1.8 GW PV Solar Park, Egypt, Strategig Environmental & Social Assessment—Final Report. Available online: https://www.eib.org/attachments/registers/65771943.pdf (accessed on 6 February 2020).
- Notice of the General Department of the National Energy Administration on Announcing the Results of the State Subsidy Bidding for Photovoltaic Power Generation Projects in 2019. Available online: http://zfxxgk.nea.gov.cn/auto87/201907/t20190711_3682.htm (accessed on 6 February 2020).
- The European Green Deal, COM (2019) 640Final. Available online: https://www.google.com.hk/url?sa=t&rct=j&q=&esrc=s&source=web&cd=1&ved=2ahUKEwiW3r6m0urnAhUIvJQKHdZECYAQFjAAegQICRAB&url=https%3A%2F%2Fec.europa.eu%2Finfo%2Fsites%2Finfo%2Ffiles%2Feuropean-green-deal-communication_en.pdf&usg=AOvVaw09aGzz6zB_1HSyO-mMaohO (accessed on 6 February 2020).
- Sustainable Europe Investment Plan—European Green Deal Investment Plan, COM (2020) 21Final. Available online: https://www.google.com.hk/url?sa=t&rct=j&q=&esrc=s&source=web&cd=1&ved=2ahUKEwjh0tri0urnAhVCzIsBHfMHCTEQFjAAegQIBBAB&url=https%3A%2F%2Fec.europa.eu%2Fcommission%2Fpresscorner%2Fapi%2Ffiles%2Fattachment%2F860462%2FCommission%2520Communication%2520on%2520the%2520European%2520Green%2520Deal%2520Investment%2520Plan_EN.pdf.pdf&usg=AOvVaw0Y6HEeQqom6TflIHpVYuHG (accessed on 6 February 2020).
- Directive (EU). 2018/2001 of the European Parliament and of the Council of 11 December 2018 on the promotion of the use of energy from renewable sources (recast). Available online: https://www.google.com.hk/url?sa=t&rct=j&q=&esrc=s&source=web&cd=2&ved=2ahUKEwiTv-uZ0-rnAhVVy4sBHQ5YCTsQFjABegQIBRAB&url=https%3A%2F%2Feur-lex.europa.eu%2Flegal-content%2FEN%2FTXT%2FPDF%2F%3Furi%3DCELEX%3A32018L2001%26from%3DEN&usg=AOvVaw2HV8_0CHUvIT7myc2Y8sVm (accessed on 6 February 2020).
- Jäger-Waldau, A.; Kougias, I.; Taylor, N.; Thiel, C. How photovoltaics can contribute to GHG emission reductions of 55% in the EU by 2030. Renew. Sustain. Energy Rev. 2020. under review. [Google Scholar]
- Jäger-Waldau, A.; Huld, T.; Bódis, K.; Szabó, S. Photovoltaics in Europe after the Paris Agreement. In Proceedings of the 2018 IEEE 7th World Conference on Photovoltaic Energy Conversion, WCPEC 2018—A Joint Conference of 45th IEEE PVSC, 28th PVSEC and 34th EU PVSEC26, Waikoloa Village, HI, USA, 10–15 June 2018; pp. 3835–3837. [Google Scholar] [CrossRef]
- Bloomberg New Energy Finance. New Energy Outlook 2019; Bloomberg New Energy Finance Publication: Paris, France, 2019. [Google Scholar]
- Oecd, I.E.O. World Energy Outlook 2016; International Energy Agency Publication: Paris, France, 2016. [Google Scholar]
- International Renewable Energy Agency (IRENA). Global Energy Transformation: A Roadmap to 2050, 2019 ed.; International Renewable Energy Agency Publication: Abu Dhabi, UAE, 2019. [Google Scholar]
- Ram, M.; Bogdanov, D.; Aghahosseini, A.; Oyewo, A.S.; Gulagi, A.; Child, M.; Fell, H.-J.; Breyer, C. Global Energy System Based on 100% Renewable Energy—Power Sector; Study by Lappeenranta University of Technology and Energy Watch Group; Energy Watch Group Publication: Berlin, Germany, 2017. [Google Scholar]
- Jäger-Waldau, A. PV Status Report 2013; Publications Office of the European Union: Luxembourg, 2013. [Google Scholar]
- Jäger-Waldau, A. PV Status Report 2014; Publications Office of the European Union: Luxembourg, 2014. [Google Scholar]
Figure 1.
World PV Cell/Module Production from 2010 to 2019 (data source: [4] and new analysis).
Figure 1.
World PV Cell/Module Production from 2010 to 2019 (data source: [4] and new analysis).

Figure 2.
Annual photovoltaic installations from 2010 to 2020 (data source: [11,12,13] and own analysis).

Figure 3.
Cumulative Photovoltaic Installations from 2010 to 2020 (data source: [11,12,13] and own analysis).


Table 1.
Worldwide scenarios of cumulative solar photovoltaic electrical capacities until 2040.
| Year | 2019 [GW] | 2020 [GW] | 2025 [GW] | 2030 [GW] | 2040 [GW] |
|---|---|---|---|---|---|
| Actual Installations | 635 | ||||
| Greenpeace (advanced [r]evolution scenario) | 844 | 2000 | 3725 | 6678 | |
| LUT 100% RES Power 2017 | 1168 | 3513 | 6980 | 13,805 | |
| LUT 100% Energy 2019 | 1097 | 1628 | 12,951 | 30,531 | |
| BNEF NEO 2019 | 795 | 1435 | 2440 | 5044 | |
| IRENA 2019 reference case * | 514 | 1020 | 2017 | 3122 | |
| IRENA 2019 REmap case * | 583 | 1358 | 3151 | 5761 | |
| IEA New Policy Scenario 2016 | 481 | 715 | 949 | 1405 | |
| IEA 450ppm Scenario 2016 ** | 517 | 814 | 1278 | 2108 | |
| IEA Stated Policy Scenario 2019 *** | 655 | 1309 | 1866 | 3142 | |
| IEA Sustainable Development Scenario 2019 **** | 650 | 1277 | 2537 | 4815 |
*: 2020 and 2025 values are interpolated, as only 2016, 2030, and 2040 values are given. **: 2025 value is interpolated, as only 2020, 2030, and 2040 values are given. ***: 2020 value is interpolated, as only 2018, 2025, 2030, and 2040 values are given. ****: 2020 and 2025 values are interpolated, as only 2018, 2030, and 2040 values are given.
© 2020 by the author. Licensee MDPI, Basel, Switzerland. This article is an open access article distributed under the terms and conditions of the Creative Commons Attribution (CC BY) license (http://creativecommons.org/licenses/by/4.0/).
Share and Cite
MDPI and ACS Style
Jäger-Waldau, A. Snapshot of Photovoltaics—February 2020. Energies 2020, 13, 930. https://0-doi-org.brum.beds.ac.uk/10.3390/en13040930
AMA Style
Jäger-Waldau A. Snapshot of Photovoltaics—February 2020. Energies. 2020; 13(4):930. https://0-doi-org.brum.beds.ac.uk/10.3390/en13040930
Chicago/Turabian StyleJäger-Waldau, Arnulf. 2020. "Snapshot of Photovoltaics—February 2020" Energies 13, no. 4: 930. https://0-doi-org.brum.beds.ac.uk/10.3390/en13040930
Note that from the first issue of 2016, this journal uses article numbers instead of page numbers. See further details here.