Classical Failure Modes and Effects Analysis in the Context of Smart Grid Cyber-Physical Systems


1
Institute of Mechanical Engineering, Associated Laboratory for Energy, Transports, and Aeronautics, Instituto Superior Técnico, Universidade de Lisboa, Av. Rovisco Pais 1, 1049-001 Lisboa, Portugal
2
Instituto Superior Técnico, Universidade de Lisboa, Av. Rovisco Pais 1, 1049-001 Lisboa, Portugal
*
Author to whom correspondence should be addressed.
Energies 2020, 13(5), 1215; https://0-doi-org.brum.beds.ac.uk/10.3390/en13051215
Submission received: 15 February 2020
/
Revised: 29 February 2020
/
Accepted: 2 March 2020
/
Published: 6 March 2020
(This article belongs to the Special Issue Cyber-Physical Systems for Smart Grids)
Abstract
:Reliability assessment in traditional power distribution systems has played a key role in power system planning, design, and operation. Recently, new information and communication technologies have been introduced in power systems automation and asset management, making the distribution network even more complex. In order to achieve efficient energy management, the distribution grid has to adopt a new configuration and operational conditions that are changing the paradigm of the actual electrical system. Therefore, the emergence of the cyber-physical systems concept to face future energetic needs requires alternative approaches for evaluating the reliability of modern distribution systems, especially in the smart grids environment. In this paper, a reliability approach that makes use of failure modes of power and cyber network main components is proposed to evaluate risk analysis in smart electrical distribution systems. We introduce the application of Failure Modes and Effects Analysis (FMEA) method in future smart grid systems in order to establish the impact of different failure modes on their performance. A smart grid test system is defined and failure modes and their effects for both power and the cyber components are presented. Preventive maintenance tasks are proposed and systematized to minimize the impact of high-risk failures and increase reliability.
1. Introduction
Electric energy plays a crucial role in today’s society. It is the most versatile and easily controlled form of energy and it is involved in almost all aspects of society’s daily routine.
In recent years, several new challenges have been emerging due to the expansion of renewable energy sources (intermittent sources) in the electrical grid, due to the electrification of new industrial sectors and due to the new huge volume of online data generated from electrical systems. Moreover, in the future smart grids, it is expected that energy becomes available everywhere from dispersed sources associated with the growth of mobile loads and the increasing number of energy storage equipment [1,2]. With this, new technological functionalities are required to provide energy management in a more reliable, effective and secure way.
The conventional electric grid is a passive and rigid grid characterized by predictable power flow directions, conventional energy sources, and expected load profiles. On the contrary, a smart grid can be described as an active grid, with constant fluctuations due to the intermittent operation of renewable energy sources, like solar or wind, unexpected load profiles, and unpredictable power flow directions, making a more dynamic grid. Consumers’ participation in demand response and in electricity markets are also expected to play an important role in energy efficiency [2,3]. However, many new problems are arising, such as:
- The increased complexity of the electrical system, creating a considerable number of barriers to the development of such systems, regarding technical and non-technical challenges;
- The correct operation of every single equipment in a smart grid will be directly or, at least, indirectly dependent on the correct behavior of other equipment;
- The needed to endow the grid of “intelligence” and robustness due to the interdependence between cyber and power systems. A malfunction of even minor equipment can put in danger the efficiency and reliability of the electrical grid.
In this framework, the lack of adequate control and monitoring/management strategies can lead to a power outage of parts of the grid. In addition, if the smart grid is not capable of handle cyber threats, a partial outage of the system may occur.
Reliability aspects like increased complexity represented by the interconnection and interoperability between different types of systems are an additional aspect to consider in the smart grid context and motivates the exploration of new approaches to assess the smart grid operational reliability. In this context, Reliability Centered Maintenance (RCM) has been a solution proposed in recent years and applied to electric power systems.
In [4], a four steps “rational RCM” approach is applied on a distribution system, where the key is to combine a risk assessment (using FMECA) and a dependability analysis to optimize the maintenance in the RCM context. In [5] an RCM methodology that provides a quantitative relationship between PM of assets and the total cost of maintenance is applied in distribution systems. In [6] an RCM approach is proposed to minimize the total customer interruption cost and the total energy not supplied cost in a distribution feeder. In [7] an RCM approach that considers the protection system hidden functions is applied to a distance protection system. In [8], a hybrid methodology that combines quantitative and qualitative analysis is used to identify the Maintenance Significant Items in an RCM context. In [9] a game theory method is applied in the RCM context to assess the contribution of every single piece of equipment to the whole system reliability under different loading conditions and high-order contingencies. In [10] a weighted importance reliability index is proposed to prioritize the elements of an electric distribution system in an RCM framework. In [11] the lifetime of main components involved in a smart distribution grid is analyzed and a probability model for the lifetime is proposed. In [12] a quantitative maintenance optimization to improve the RCM in power systems with renewable energy is proposed. In [13] variance-based fairness indices are proposed to summarize the inequality and inequity between power system stakeholders in order to measure the impact of reliability actions. In [14] an analytical method to quantify the cyber faults in the reliability is proposed. In [15] a quantitative method to analyze the impact of the cyber equipment and communication quality in a cyber-physical power distribution system is proposed. RCM combines reliability evaluation and maintenance planning [5,11,12,13,14,15].
When considering reliability assessment tools, RCM arises as one of the most important methods. Benefits of an RCM approach far exceed those of any type of maintenance program and it has been widely used by the aircraft, oil and gas, spacecraft, or nuclear industry [16]. However, the use of RCM is relatively new in industries outside of these areas [4,5,6,7,8,9,10,16]. RCM strategies and their impact on electrical power systems are still undefined due to the lack of evidence and current applications.
As an important part of any RCM evaluation, the Failure Modes and Effects Analysis (FMEA) method is a structured method used to define, identify, and eliminate known and/or potential failures, problems, and errors in the system, process, and/or service [17,18,19,20]. FMEA can be considered as a team-oriented engineering analysis that uses personnel’s knowledge and experience to perform it, generally supported on drawings, diagrams, charts, and failure statistics, among other useful information, being the intellect and ideas of the expert team a necessary element for meaningful discussion and successful outcomes [21].
It has been proven that FMEA is a good tool for exhaustively identifying and recording the local effects that arise from component failures, thus inferring the effects of those failures at the system’s level. Nowadays, in the context of smart grids, which combine a large number of components of different types and functions, FMEA can help identify those failure modes causing critical component failures and, consequently, lead to a critical system failure.
Among the failure modes that can be identified using FMEA are the smart grid security technical and non-technical threats; technical threats are related to infrastructure security, technical operational security and system’s data management security, and the non-technical threats related to environmental security and government regulatory policies and implementations [22]. FMEA can also help to identify the preventive actions oriented to mitigate specific failure modes occurrences, like the PMU based monitoring system applied in HV transformers [23]. In addition, artificial intelligence-based FMEA can improve the failure modes prioritization according to its criticality and other criteria [24].
Once the most critical failure modes have been identified using FMEA, they can be used to perform a quantitative reliability assessment to determine the impact that each determined failure modes would have on the system.
This paper has two purposes: (1) to show a review of the FMEA applications in smart grids environment, and (2) to show the results of an FMEA analysis conducted in a smart grid test system.
Section 2 starts reviewing FMEA application in electrical power equipment maintenance and testing. Section 3 summarizes the classical FMEA procedure. The cyber and power architecture of a smart grid test system is introduced in Section 4. Here, failure rate values for each cyber-control equipment are credited. Complementing, Section 5 categorizes the failure modes for power and cyber-control equipment, including the network links. FMEA analysis is conducted in Section 6. In Section 7, we analyze how much significant information is lost when using the classical FMEA procedure in a smart grid structure. As described in Section 8, the main conclusion is that maintenance tasks cannot be efficiently prioritized. The classical FMEA is successful in assemble failure modes and their causes for a smart grid, however, the classical FMEA needs to be modified to improve risk prioritization concerning the smart grid’s reliability assessment and risk analysis.
2. FMEA Applications in Electrical Power Equipment: A Brief Overview
Most of the applications of FMEA in electrical power equipment were developed at the component level, that is, without considering the effect of equipment failures on systems’ performance.
For example, concerning wind power technology, in [25] is shown a classical FMEA approach applied to assess the reliability of a 2MW wind turbine using three commercial software: XFMEA from Reliasoft, Reliability Workbench from Isograph, and Relex Reliability Studio 2007 from Crimson Quality. The authors divided each one of the three risk factors of FMEA (Severity, Occurrence, and Detection) into four risk categories. Eight mechanical failure modes, five electrical failure modes, and three structural failure modes were identified related to the turbine. Results show that when using the product of the Occurrence and Detection risk factors, FMEA underestimates the operational field’s failure rates in new turbine designs. Authors also propose that a procedure for failure prioritization using their risk priority number (RPN) value could be a useful tool for designers to identify weaknesses in new wind turbine designs.
Another FMEA application and analysis on wind power is shown in [26], where onshore and offshore wind turbines were considered. The classical FMEA is now compared with the authors’ modified FMEA that studies the probability of occurrence instead of a ranking for occurrence as in [12], considering now the cost of the failure mode instead of severity rank, and uses a non-detection possibility based on failure data instead of a detection ranking. The paper also proposes a priority number called a cost-priority number (CPN), which was obtained by multiplication of the new three risk factors considered [26]. Their results show that, in general, the priority number from both approaches, the RPN and CPN, produce very similar prioritization for most of the major components considered.
A non-electrical system is studied in [27], where FMEA analysis is conducted to assess the reliability of hydraulic turbines, and to compare FMEA with the Fault Tree Analysis (FTA) method. Seven main hydraulic turbine components were considered for both analyses. This work indicates that FMEA and FTA are complimentary risk analysis methodologies capable of identifying failures and tracking their possible consequences. While FMEA makes an exhaustive analysis for each failure mode, FTA allows having a general view of the system and the relations between different components.
In [28], the authors assess the condition of the electric and mechanical components of a hydropower plant (Angara-Yenisei hydropower station). The FMECA method (FMEA plus criticality assessment) was applied to face the lack of statistical information about failures. Results achieved show that FMECA allows evaluating the possible effects of the failure modes even when there is a gap in the failure statistics.
Another example of FMEA application is in photovoltaic (PV) systems. In [29], FMEA is applied in a simple test system composed of four PV strings, string combiner devices, inverter, cable system (aerial and underground), a three-phase transformer, and also its connection to the power grid. Five risk categories were defined for each of the FMEA’s risk factors ranking. The author clearly shows that FMEA can improve the early detection of some hidden failures that could not immediately affect the PV system, but would induce a degradation if no action was taken.
Another FMEA application in PV systems can be found in [30]. The authors used relevant criteria and practical experience provided by personnel working in a PV power plant instead of using the one from theoretical and office technicians. Ninety-four failure modes were identified, 16 of which had an RPN greater than 100, which is considered as the most critical failure modes for prioritization. Authors’ conclusions establish substantial differences between FMEA results using criteria from practical personnel, like maintenance operators, and those results using an FMEA performed considering the criteria of office and manage technicians, like engineers.
Risk analysis of an energy storage system (ESS) was developed in [31], where a review of the failure modes that affect lead-acid batteries (LAB) was done. The analysis focuses on three aspects: (i) positive active material degradation with loss of adherence to the metallic grid, and positive electrode grid corrosion; (ii) irreversible sulfating of the negative active material; and (iii) the electrolyte, separator, charge-discharge regime, and other elements that contribute to the battery failure. This work shows the importance of identifying the failure modes and its associated mechanisms in lead-acid batteries and in lead-carbon batteries (LCB) because it has a great potential for innovation and extensive applications in solar power integration projects.
Another extensive analysis of failure modes on batteries, now on lithium-based batteries (LIB), is presented in [32]. Lithium batteries are one of the most popular energy storage technologies for several applications, including electric cars. This paper covers several experimental and simulation results to characterize different failure modes and their respective mechanisms in LIB technology. Most important, the authors claim the urgency for the development of computational direct simulation techniques for LIB based on its chemo-mechanical models to have a better perspective about possible material failures [32].
FMEA has also been applied in electrical components of power systems. For example, in [33] an FMEA analysis is conducted to assess reliability in capacitors banks used in the distribution power system at the Sultanate of Oman. Four risk categories (catastrophic, critical, marginal, and insignificant) were defined for each FMEA risk factor ranking, and seventeen main failure modes were identified and analyzed. Some failure modes considered were the capacitor element short-circuit, open circuit, insulating liquid leakage, and leakage current for support insulators, for example. In [34], FMEA was used to identify the main failure modes to be used as input for a probabilistic method to assess the reliability of a 400 kV transmission system at the substation equipment level.
In [35], a modified FMEA based on Fuzzy Logic was developed. Three FMEA risk factor categories were represented by fuzzy sets and based on three continuity indexes: the loss of power in distribution transformers when a failure mode occurs, the frequency of interruption in each consumer unit, and the duration of interruption in each customer unit. Results show that the FMEA based on fuzzy logic achieves better prioritization results for the analyzed equipment.
Power transformers’ failures have been extensively analyzed through the FMEA method because of its high impact in terms of security and cost in electric power grids. Three recent applications are presented in the following. In [36], an FMEA including criticality analysis is performed on 92 power transformers, identifying three critical components: windings with high criticality, on-load tap changer (OLTC), and bushings with medium criticality. In [37], FMEA with criticality was applied on 384 non-failed distribution transformers in India. Results show that component insulation failures have a greater RPN and are caused by corrosion, moisture, high acidity, hot spot due to overloading, and/or low quantity of oil. The second priority is achieved by winding failures that may be due to manufacturing defects, transient overvoltage, lightning, short-circuit, and faulty connections. The third example is described in [38] where a general FMECA is applied to assess the risk of failure of 220 kV in-service power transformers, considering the failures that can result in transformer service interruption. Authors classified the failures as minor and major ones, performing an FMECA analysis for each of the two types of failure; the minor failures have no significant effects on transformer performance, while major failures are related to the transformer’s components degradation and would be irreversible. Results show that outages caused by overcurrent have the highest RPN in the minor failure analysis. Failures due to insulation deterioration have the highest RPN in the major failure analysis, followed by load tap changer failures.
In electric power distribution systems, one can verify three lines: (1) a “local” one represented by the micro-grids; (2) a “global and classical” one exemplified by distribution power systems, and (3) being also “global” but incorporating the cyber-physical component, the smart grid. Some research can be pointed out. In [39], an FMEA analysis is conducted to identify the failure modes in micro-grid equipment including different generation technologies. In [40], a classical FMECA was applied in a power distribution system located in the region of RELIZANE northwest of ALGERIA; authors conduct the FMECA analysis according to IEC 60812 standard [19]. Results show that it is necessary to replace the most of equipment, especially transformers and transmission lines; the analysis also allowed to identify the critical components that must be taken into account to improve the maintenance plans. More recently, authors showed in [24] an FMEA analysis for a smart grid framework. A comparison with a modified FMEA that combines the classical FMEA with a fuzzy inference system was studied to improve the prioritization of failure modes. Results clearly showed that fuzzy-based FMEA obtains better prioritization criteria for the analyzed failure modes when compared with classical FMEA applied to a smart-grid framework.
Overall, several studies focused on RCM and alternative approaches to evaluating reliability assessment in smart grid systems, but none of them have considered FMEA as a reliable tool for risk assessment.
3. The Classical Failure Modes and Effect Analysis (FMEA): Main Concept and Procedure
FMEA is a systematic methodology designed to identify known and potential failure modes and their causes and effects on system performance [17,19,21,33]. It was originally used by the US Armed Forces in 1949 [41] to classify failures “according to their impact on mission success that was related to the personnel and equipment safety”. After, an impulse was given by its use in the program Apollo in the 1960s following its application in the aerospace industry. As defined in [21], FMEA is a method designed to:
- Identify and fully understand potential failure modes and their causes, and the effects of failure on the system or end users, for a given product or process.
- Assess the risk associated with the identified failure modes, effects, and causes, and prioritize issues for corrective action.
- Identify and carry out corrective actions to address the most serious concerns.
FMEA can be viewed as a proactive procedure for evaluating a process by identifying where and how it might fail and assessing the relative impact of different failures [42,43]. Despite FMEA’s primary objective is improving the system design, it can be applied in any stage of a project to mitigate potential future risks produced by failure modes. FMEA is conducted by a cross-functional team of subject matter experts that analyzes the system to identify weaknesses and propose correcting actions that prevent a negative impact on the system’s performance [21]. At this point, it is important to note that FMEA’s objective is not to predict failures. Its aim is to identify existing and potential failures through a subjective and systematic assessment to classify those failures according to a risk measure.
The FMEA method is supported by a set of standards and procedures among other technical documents. The main standards and procedures are:
- SAE J1739:2000, Potential Failure Mode and Effects Analysis in Design (Design FMEA) and Potential Failure Mode and Effects Analysis in Manufacturing and Assembly Processes (Process FMEA), and Potential Failure Mode and Effects Analysis for Machinery (2000)—Society of Automotive Engineers;
- Military StandardMIL-STD-1629A, Procedures for Performing a Failure Mode Effects and Criticality Analysis (1980)—U.S. Army;
- IEC 60812:2006—Analysis techniques for system reliability—Procedure for failure mode and effects analysis (FMEA) (2006)—International Electrotechnical Commission;
- ECSS-Q-ST-30-02C—Failure modes, effects (and criticality) analysis (FMEA/FMECA) AIAG and VDA FMEA Handbook (2019)—European Cooperation for Space Standardization;
- SAE ARP5580, Recommended Failure Modes and Effects Analysis (FMEA) Practices for Non - Automobile Applications—Society of Automotive Engineers, and;
- NASA RCM Guide, Reliability centered maintenance guide for facilities and collateral equipment (2008)—National Aeronautics and Space Administration.
The classical FMEA approach considers three factors, called risk factors, to characterize each failure mode [19]:
- Severity (SEV): that assesses the significance of the failure mode’s effect on system operation;
- Frequency of Occurrence (OCC): that represents the number of times the failure mode occurs. This risk factor is related to the failure rate, that can be defined as the frequency in which an engineering system or component fails, expressed in failures per unit of time [43];
- Detectability (DET): that represents how detectable a certain failure can be before it happens.
Risk factors OCC, SEV, and DET are divided into categories. In the classical FMEA, each of these categories is rated by an integer number, usually on a scale from 1 to 10 as in [17], or 1 to 5 as used in [24]). Of course, the categories and ratings for SEV, OCC, and DET can be the same as those proposed in standards related to classical FMEA like IEC 60812:2006 [19] or specially defined depending on the problem characteristics.
The risk factor’s categories and ratings used in this work are listed in Table 1 (Frequency of occurrence), Table 2 (Severity), and Table 3 (Detectability).
Based on these three risk factors, a risk priority number (RPN) is calculated as
via the product of SEV, OCC, and DET as a metric for evaluating each failure mode in the FMEA, as proposed in [19]. Because the RPN calculation in the classical FMEA approach results from the unique arithmetic product between three integers, then there is no associated computational complexity.
RPN = SEV × OCC × DET,
The higher the RPN of a failure mode, the greater the risk is for the system reliability. Hence, proper actions should be preferentially taken on the high-risk failure modes so that the system should increase its availability. As will be shown in the discussion Section, the RPN calculation is an important issue for FMEA. However, classical FMEA is still an important tool for reliability and risk assessment in highly complex industries such as aerospace, nuclear, and petrochemical.
FMEA Procedure
One can summarize the FMEA procedure in 10 main steps. They are:
- Review all subsystems to do a list of the main items and their components;
- Brainstorm potential failure modes associated with each component;
- List the probable failure effects of each component to each subsystem;
For each failure mode:
- 4.
- Assign an Occurrence (OCC) rating using Table 1;
- 5.
- Assign a Detectability (DET) rating using Table 3;
- 6.
- Assign a Severity (SEV) rating using Table 2;
- 7.
- Calculate the failure mode RPN using Equation (1));
- 8.
- Develop an action plan to address the highest RPN;
- 9.
- Take corrective action, and;
- 10.
- Reevaluate the RPN number after the actions are completed.
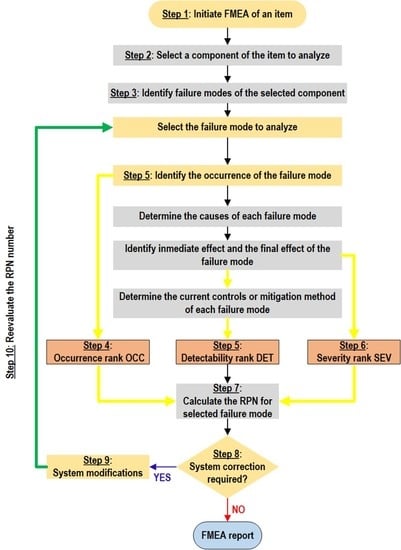
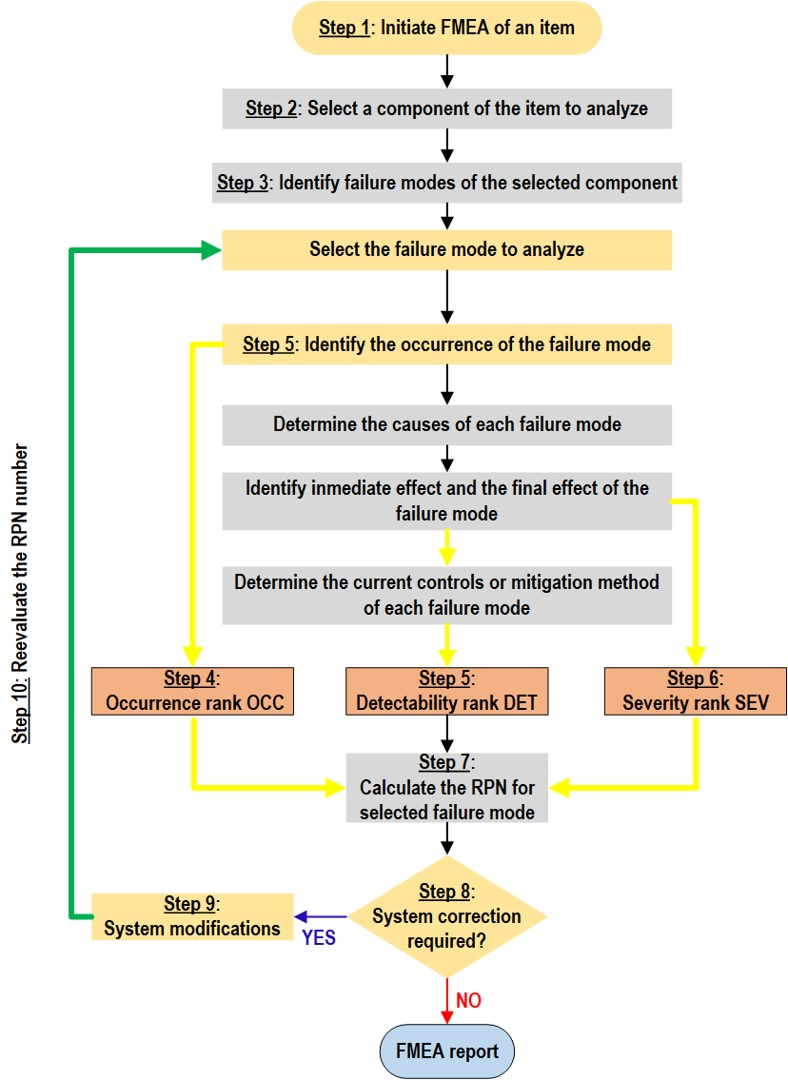
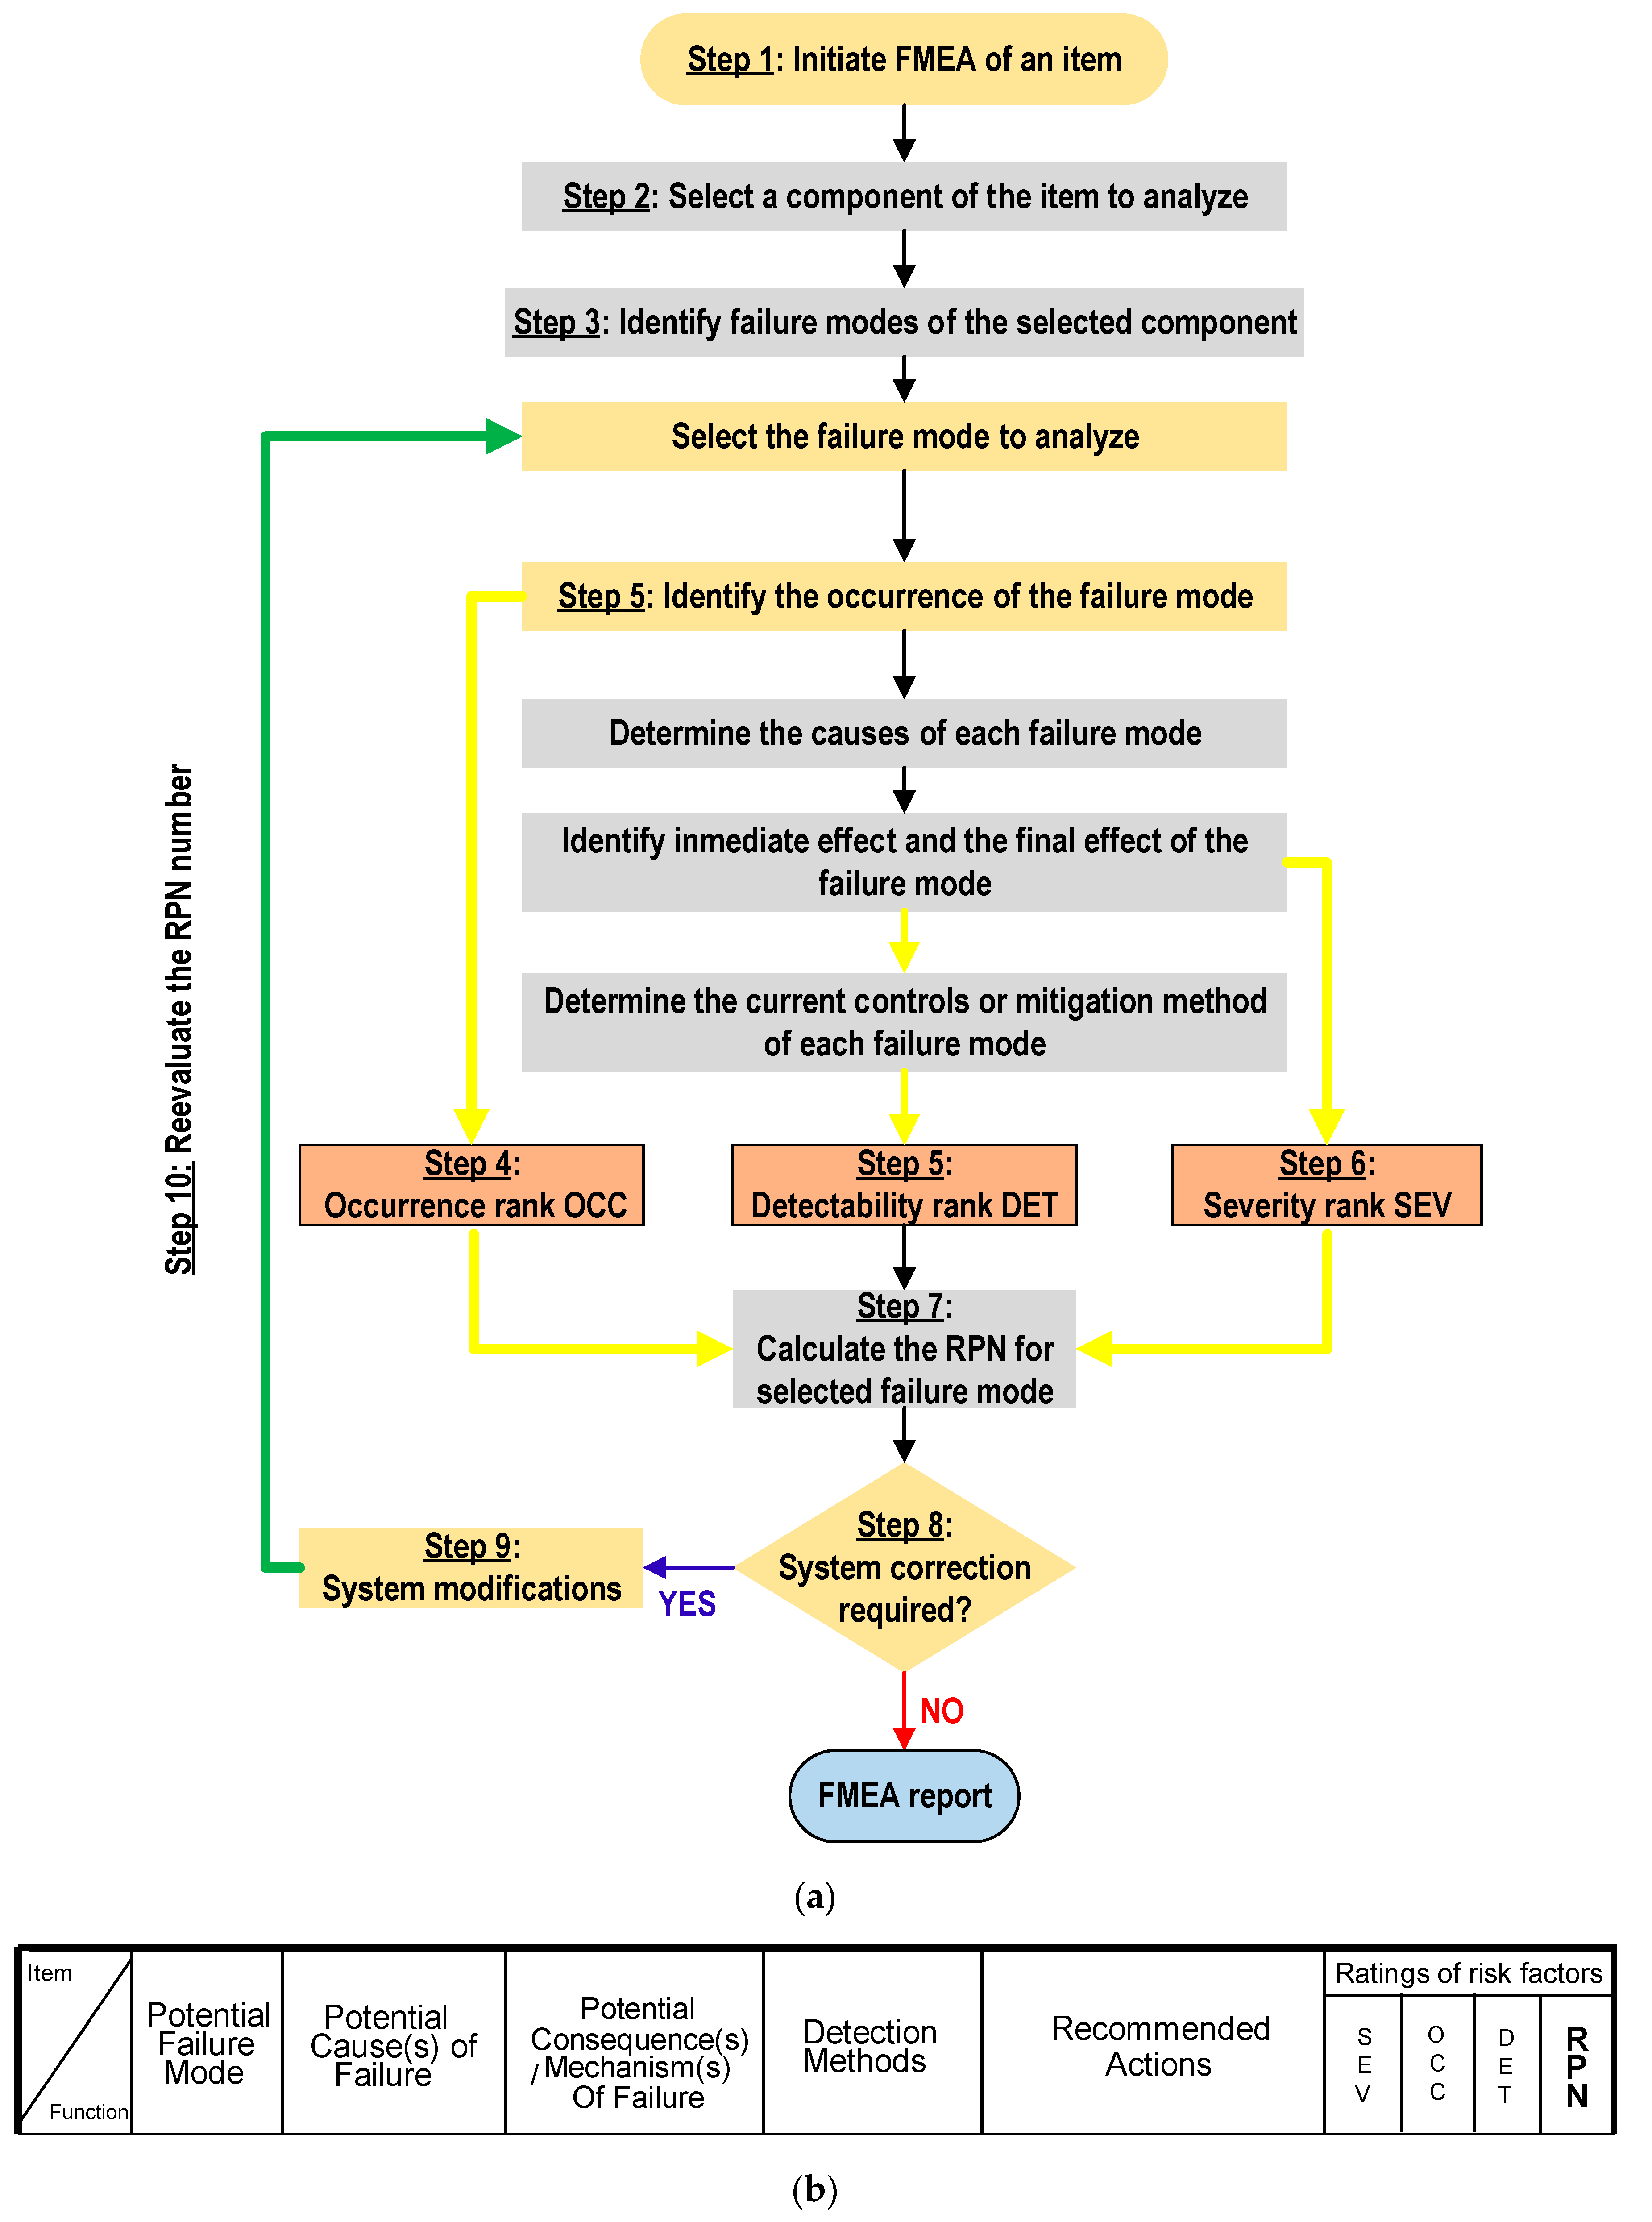
The flowchart in Figure 1a shows how the 10 steps are linked for conducting a classical FMEA [17,19]. Once the three risk factors OCC, DET, and SEV were assigned in steps 4, 5, and 6, failure mode RPN is computed in step 7 using Equation (1). After, it is necessary to develop an action plan to reduce the highest RNP, forming step 8 as indicated in Figure 1a. Following that, step 9 considers the need of executing some corrective action to decrease the RPN value. This can be accomplished reducing the failure mode occurrence OCC, implementing actions to reduce the failure mode consequences (severity SEV), or even improving the detection methods already implemented. Notice the main loop in the FMEA flowchart in Figure 1a. It appears when all RPNs are computed since the recommended corrective actions must be implemented, and reevaluated being performed again to verify if these corrective actions reduced the risk in the system.
The final FMEA report must contain all the failure modes ordered by their RPN ranking, being registered in a worksheet whose columns (Figure 1b) contain information about the component, associated failure mode(s), causes, consequences, detection methods, recommended actions, and the corresponding ratings for SEV, OCC, and DET risk factors. Every FMEA report should include one section detailing all assumptions considered for the FMEA effectuated.
4. The Test System Architecture for A Smart Grid
In this section, a smart grid test system is presented for studying how the cyber-power interdependencies coupled with different failure modes will disturb the grid performance. Failure modes will be identified for both the power and the cyber components, and a complete FMEA analysis will be applied.
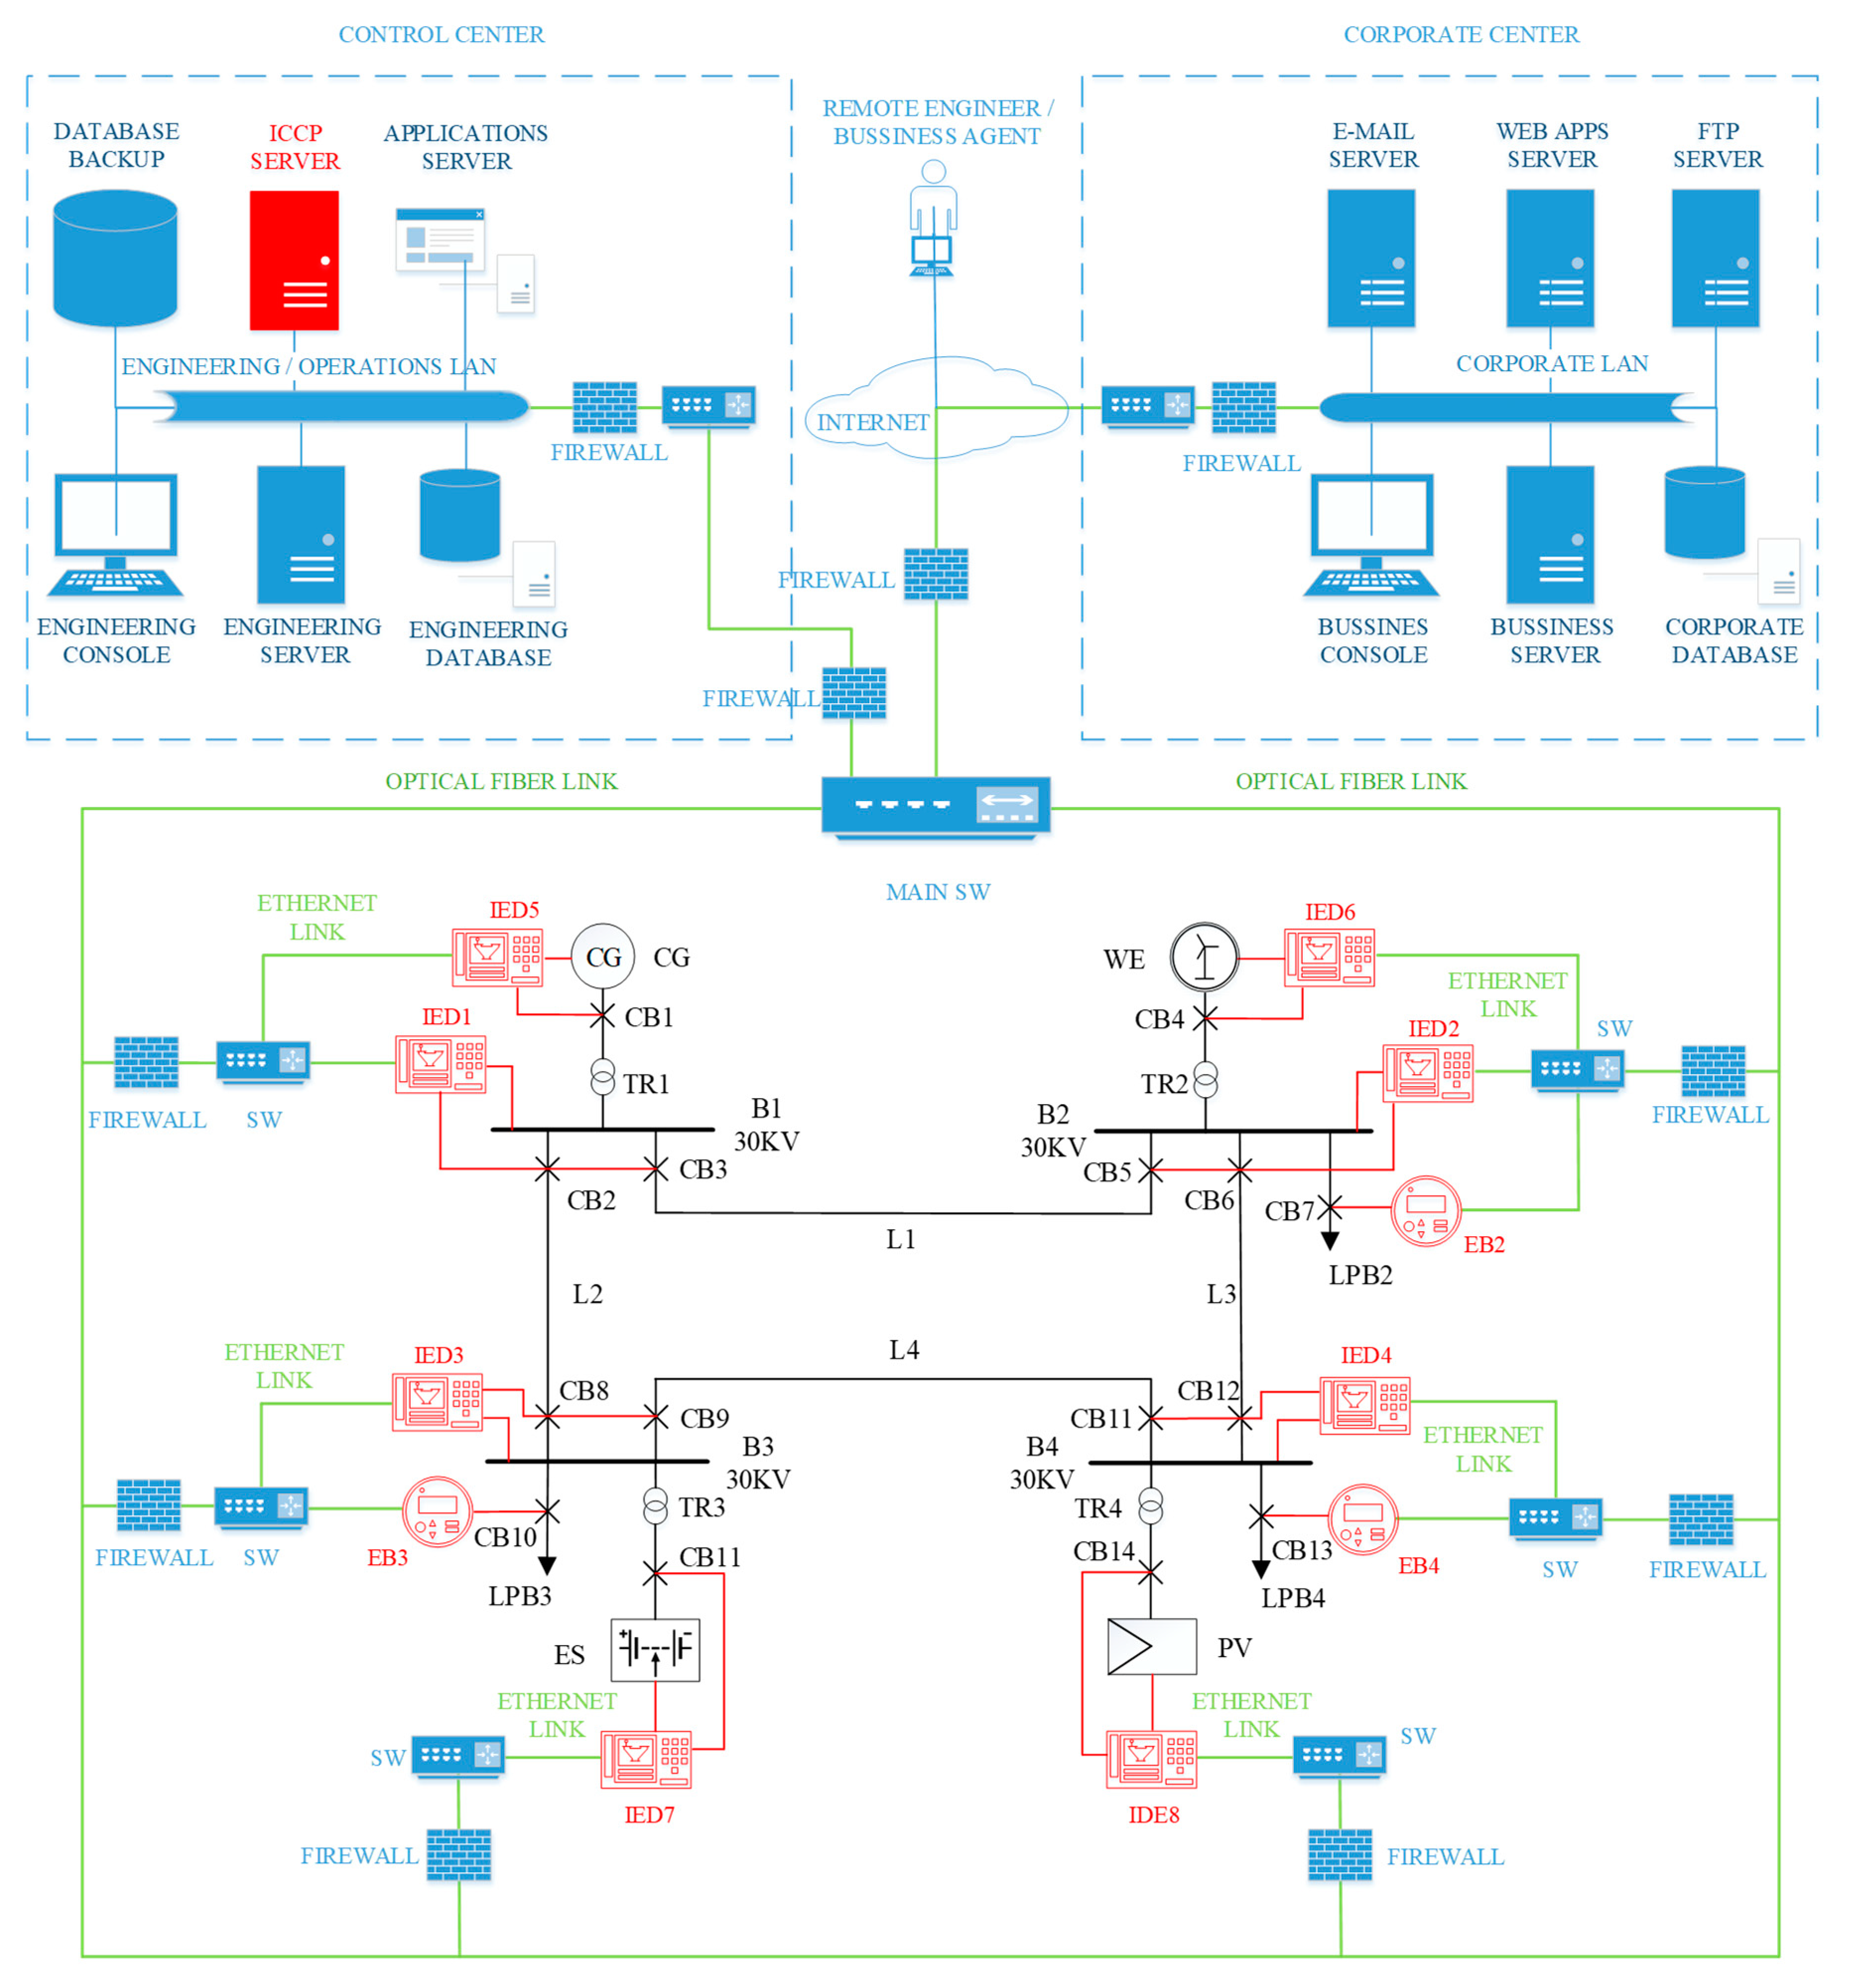
Figure 2 shows the cyber and power architecture of the smart grid test system, this system was specially designed to be used in [43] and to include the main power and cyber equipment that can be found in a smart grid. The 30 kV power network, depicted in black lines in Figure 2 down, is a meshed grid consisting of four 30 kV substations. The grid presents redundancy in the 30 kV grid, i.e., there are different ways for energy transport between busbar Nº.1 (B1), busbar Nº.2 (B2), busbar Nº.3 (B3), and busbar Nº. 4 (B4).
A 110 MW conventional generation station (CG) is connected to busbar B1. Distributed renewable generation stations are connected to busbar B2 (130 MW wind energy park, WE) and busbar B4 (100 MW photovoltaic power plant, PV). The power network also has a 50 MW energy storage system (ES) connected to busbar B3. A total of four power transformers (TR1, TR2, TR3, and TR4) and fifteen circuit breakers (CB1, CB2, …, CB15) are also included in the power network.
Consumers in Figure 2 are represented as three load points named LPB2, LPB3, and LPB4 and connected to busbar B2, B3, and B4, respectively. Load LPB2 represents a 20 MW residential area, while LPB3 and LPB4 represent industrial and commercial areas referred to as 85 MW and 40 MW load, respectively.
Regarding the power equipment, only busbars, power cables (aerial lines L1, L4), circuit breakers (CB), and power transformers are considered for this FMEA analysis. Storage facility and generation stations were not considered into this FMEA analysis.
Failure rates for each component have been collected from two main sources: from statistical data obtained from the Portuguese electrical utility, being the second source a set of specialized databases and manufacturer datasheets [44,45]. Table 4 lists the failure rates used in our research and attributed them to each power component. Note that relative to aerial cables and for simplification purposes, it was assumed that different substations are equally distanced between each other (about 2.5 km). Additionally, notice that the transformers’ failure rate is not always higher than other electrical equipment, such as stated in references [44,45] and listed in Table 4. For example, transformers between 300 to 10,000 KVA have a failure rate of around 0.0059 failures per unit-year. Transformers whose nominal power is greater than 10,000 KVA have failure rates around 0.0153.
Description of the Cyber Network of the Smart Grid Test System
Included in the power network in Figure 2 there is a cyber network topology to monitor, protect, and control the power system. Among all possible cyber network topologies, a cyber-ring topology was selected due to its elementary architecture, providing an acceptable level of reliability with a redundant path for data transmission. The cyber-control network shown in Figure 2 is a bus topology LAN-Ethernet and WAN-optical fiber network consisted of human-machine interfaces (HMIs), Ethernet switches (SWs), servers (SVs), energy boxes (EBs), intelligent electronic devices (IEDs), and Ethernet and optical fiber links (all marked in blue, red, and green lines in Figure 2).
The metering infrastructure is composed of smart meters designated in Figure 2 as energy boxes (EBs), being linked to load points in order to collect data about energy consumption. Note that, in practice, it is assumed that each customer is connected to a single EB. However, for simplifying purposes in this work, we consider only one main EB for all customers at each load point.
IEDs act as interface devices between power and communication networks, including measuring units, protective relays, and controllers. Each IED is responsible for monitoring and executes the commands received from HMIs. Table 5 lists the cyber-power links between each IED controller in Figure 2 network and their corresponding power elements (buses and circuit breakers).
As indicated in Figure 2, each IED or EB element is connected to an Ethernet switch (SW) through a LAN-Ethernet communication, which is then responsible for redirecting information through the corresponding communication links. Ethernet switches are all connected through a ring topology towards WAN-optical fiber network links (green lines in Figure 2). At last, a central Ethernet device (MAIN SW) is responsible for gathering information from all points of the communication network, sending it to the corporate and control centers (up blue blocks in Figure 2).
In the control center, all data concerning the power system status is available for monitoring, analysis, and decision-making. The control center is responsible for scheduling power generation to meet consumers’ demand, also managing major system problems by executing automatic procedures or manual instructions through the HMIs. Real-time data gathered from the power system are also displayed on the HMI, which allows real-time intelligent data handling and network status monitoring. As also shown in Figure 2 up, left in red, an Inter-Control Center Communications Protocol server (ICCP server) is specified to provide data exchange over WANs between utility control centers and substations. As also indicated in Figure 2 up, an APPLICATIONS SERVER and an ENGINEERING SERVER manage a big amount of data and information that are stored in an ENGINEERING DATABASE.
The CORPORATE CENTER (Figure 2 up, right) is responsible for managing a high number of energy market players that will compete to provide the best power quality at the best price. Cost fluctuations on energy generation (due to different penetration levels of distributed generation and dynamic energy demand) are managed in the BUSINESS SERVER in order to optimize cost-effectiveness operations and optimize the balance between energy demand, storage, and production. A CORPORATE DATABASE is responsible for collecting and storing all energy market information in the corporate center, while E-MAIL SERVER, WEB APPS SERVER, and FILE TRANSFER PROTOCOL (FTP) servers make it accessible for all market stakeholders.
The reliability values of each cyber equipment described in the anterior paragraphs and used in this work are listed in Table 6. All values were obtained from datasheets and reliability statistics [45,46,47,48,49,50,51], and all derived using reliability theory about failure rates [43]. For the Ethernet links, however, reliability data was not found explicitly in literature. To surpass this, one assumed a very low failure rate value. Concerning the optical fiber links, it was assumed a total length of 10 km in the communication network.
5. Identifying Potential Failure Modes in the Smart Grid Test System
Potential failure modes that can occur in the smart grid test system in Figure 2 needed to be evaluated in their causes and influence on the system. With this objective, this section summarizes the potential failure modes of each equipment considered in our smart grid test system.
Each equipment was first categorized according to their type and function in the system. In this way, several failure modes were then defined and described for each power equipment.
The assessment considers two assumptions:
- The analysis focused on the identification of single failures for smart grid components, and;
- Complex interdependences or cascading failures are out of scope for the current analysis.
Power equipment comprehended in our analysis of four components: busbar, power cable, circuit breaker, and a power transformer. For each one, a set of failure modes and associated criteria were identified as listed in Table 7.
Related to the cyber-control equipment, their failure modes are listed in Table 8. The list shows the five cyber-control devices considered: Intelligent Electronic Device (IED), server (SV), Human-Machine Interfaces (HMI), Ethernet switch (SW), and the Energy Box (EB).
Security failure and power failure were considered for all devices. Security failure is related to the susceptibility of cyber equipment to lose their integrity, while power failure is related to its interruption affecting the normal operation of the cyber network.
The IED defective communication is the failure mode associated with damaged transducers or poor signal causing intermittent communication between the IED and remaining cyber-network.
The server (SV) data overload is the failure mode associated with lower storage capacity or an unexpectedly large amount of data to storage that can result in defective data storage. Hardware crash is another failure mode related to some physical damage caused by overheating situations or humidity causing a hard drive crash, thus resulting in loss of data. At last, any software error corrupting stored data will result in an operational failure mode.
An HMI data error is a failure mode that is generally associated with inherent problems in HMI operation that of course will compromise its normal functioning.
Two failure modes attributed in Table 8 to an Ethernet switch (SW) are related to cyber-attacks: the Performance decrease and the Network/Cyber storm failure modes. Congestion of packets and/or broadcast of an excessive number of messages in an uncontrollable way in a communication network can decrease the SW operational performance or even congestion SW operation. At last, an SW Operational failure caused by a bad SW configuration or module failure can blackout its operation.
Energy Box contains a Catastrophic failure mode associated to temperature stresses that can severely damage the EB. Power consumption misreading and Operational failure are two failure modes related to incorrect data acquisition. Manual manipulation, significant measurement error, improper EB programming, and defective installation all result in incorrect data acquisition problems.
Related to network links, two types were considered: optical fiber links for communications in long distances, and Ethernet links for short distances. Their inherent characteristics result in different failure modes described in Table 9. Optical fiber links have a set of failure modes that are all related to its physic integrity: Fracture, lead-bonds degradation, and humidity-induced failure modes. Ethernet link failures degrade any network performance by decreasing available capacity and disturbing IP-packet forwarding. Hardware or software failures can happen at protocol network layers. Integrity defects as manufacturing imperfections, incorrect connections, or degradation in the RJ45 connectors, for example, may lead to loss of physical connectivity in the network hardware or link breakdown. Superposition of events usually occurs when electromagnetic coupling happens in adjacent pairs of wires causing signals interference. This is referred to as Crosstalk and is more frequent as the signal frequency increases.
6. FMEA Analysis and Its Results
A complete FMEA analysis was fulfilled to the smart grid test system in Figure 2, representing a typical cyber-power network. Using the failure modes systematized in the previous section, one searches for causes and potential impacts of each power and cyber equipment failures on the smart grid. Not only does our performed FMEA take into account the main interdependencies between power and cyber systems topology, but mechanisms that prevent the cause of each failure mode from occurring (current controls) are also proposed.
The three risk factors (Severity (SEV) in Table 1, Occurrence (OCC) in Table 2, and Detection (DET) in Table 3) were first assigned for each failure mode:
- For Severity (SEV) rating, the seriousness of the failure and its effects in the system is taken into consideration;
- For Detection (DET) assignment, it is considered the ability to detect the failure before it could affect the system, and;
- For the Occurrence (OCC) rating, its value is stated according to equipment’s failure rates, as specified in Table 4 and.
Assignment of all ratings is performed according to FMEA evaluators’ expert criteria. Even in an Occurrence (OCC) rating, which could be accurately performed, it can be revised in accordance with a specific cause of failure that seems to be more or less likely to occur according to the FMEA’s evaluators criteria.
In a general way, any failure mode is expected to be assigned with different Detection (DET) and Occurrence (OCC) ratings that depend on the causes that triggered it. However, Severity (SEV) rating is unique for each failure mode. Since each failure mode’s priority is evaluated by its RPN value (1), this may lead to different RPNs for the same failure mode since each cause of failure has its own RPN value.
Our research identified and analyzed a total of 107 failure modes associated with the smart grid test system, the overall failure modes can be found in [43]. To this paper, we selected the 42 highest risk failure modes, listed in Table 10, and ordered from most risky to least risky. Remember that Table 10 is the result of the conducted FMEA analysis using the OCC, DET, and SEV rating numbers and respective RPN values from Equation (1). The complete FMEA table can be found in [43]. Table 10 also includes the potential Failure Cause and the suggested recommended actions in order to minimize the impact of those failure modes in the smart grid.
Examining the costs and causes of power and cyber incidents using the 42 highest risk failure modes in Table 10, we conducted the following conclusions:
Power equipment incidents:
- (1)
- Servers (SVs) and transformers have the most critical failure modes, achieving RPNs of 480 and 450, respectively. Their high-risk failure compromises the correct smart grid operation;
- (2)
- Bus bar failure modes were also identified as critical (rank 5, 8, and 9), in the sense that their impact in the smart grid is significant mainly due to several associated failure modes with high RPNs;
Cyber equipment incidents:
- (1)
- Related to cyber equipment, failure modes with the highest RPNs are those related with operational failures verified in Human-Machine Interfaces (HMIs) with RPN = 400, Ethernet switches (SWs) shutdown reaching RPN = 360, or Intelligent Electronic Device (IEDs) having some control failure, achieving RPN = 392;
- (2)
- Ethernet links, optical fiber links and Energy boxes (EBs) revealed the less critical equipment in the cyber system, mainly due to their low failure rates;
- (3)
- Failure modes related to security reasons, despite the enormous impact cyberattacks, can cause, were not indicated by FMEA as high-risk failures. For example, servers (SV) achieved a security failure of only RPN = 200. This is explained due to low occurrence ratings, in the sense that, in spite of the expected increase of cyberattacks attempts in future years, they will not be necessarily successful;
- (4)
- Power outages in a cyber-equipment’s power supply are expected to be less frequent, thus expressed in Table 10 with lower RPN values.
In fact, a general outlook on Table 10 outcomes show two important indications:
- (1)
- Besides all ratings being treated as equals, Occurrence OCC rating remains with low variations between different failure modes with high and low RPNs. Hence, it is not a decisive rating with impact on high-risk failures;
- (2)
- Failure modes characterized by high levels of unpredictability are likely to be more critical. These modes occur without early warning and are difficult to prevent, while strong negative impacts on the smart grid operation also have a repercussion in high Severity SEV ratings.
Finally, a conclusion regarding human interference in future smart grids must be pointed out. In fact, HMI’s operational failure due to human error proves to have negative impacts on the grid. This human error is unintentional and its high probability of occurrence and unpredictability (as seen in Table 10) makes it a high-risk failure cause. This way, we expect that one of the main weaknesses in future smart grids is related to some tasks that demand human interference.
7. Discussion
In order to use the achieved FMEA results, it is important to account for significant information loss during a classical FMEA procedure. This situation can compromise important conclusions concerning high-risk failure modes and their impact on the reliability of the system. In fact, Table 10 shows the result of FMEA giving prioritization of high-risk failure modes (based on their RPN value) due to their high-risk causes of failure. This means that, according to FMEA, maintenance strategies should be prioritized from the highest RPN to the lowest in order to increase the smart grid’s reliability. This implies that failure’s causes must receive special attention in any maintenance task. Doing this will decrease or eliminate any risk of a failure in the system, thus reducing some failure mode impact on the smart grid.
That should be established to decrease the number of times the respective failure manifests itself, so that system reliability increases as intended. However, this also means that numerous failure causes are herein discriminated as long as high-risk causes of failure of each failure mode are not taken into account for final FMEA analysis. In fact, some failure modes with critical causes have, sometimes, fewer RPN values than certain less critical failure modes, although they are identified as prioritized because of their higher RPN. In these situations, maintenance strategies for these failure modes with fewer RPN values may be ignored, if using the FMEA approach. For instance, Table 11 contains selected failure modes extracted from Table 10, the causes of which have equal Severity (SEV) ratings but different RPNs. Related to the busbar’s electrical disturbances failure mode, it can be caused due to short circuits between bars with different phases (RPN of 320) or due to harmonics (RPN of 256). Although harmonics still have a high RPN, meaning it is a high-risk cause of failure, its importance could be neglected because it is ranked in 7th place from the 10 failure modes–causes shown in Table 11 and, therefore, maintenance strategies would not be recommended for this failure mode–cause [43].
We point out that maintenance tasks cannot be efficiently prioritized when the classical FMEA approach is applied in a smart grid framework. Therefore, it has implications in the maintenance costs/risk-decrease ratio. Besides this, the relative importance among OCC, SEV, and DET risk factors are not taken into account in the classical FMEA. The three factors are treated as equals, with the same weight in the RPN computation. It is thus clear that it may not be adequate when considering a practical application of FMEA in smart grids.
As an illustration, Table 10 indicates that software errors in IEDs control applications have a high negative impact on system performance (high severity risk) when compared to unintentional human error in HMI operations (SEV rating is assigned with 8 and 5, respectively, for IED and HMI). However, one can perceive that HMI operational failure due to human error has a higher-risk failure mode when compared with IEDs control failure. The severity of the failure seems then to be herein suppressed.
Similarly, different combinations of OCC, SEV, and DET values may result in the same RPN rating, but with different hidden risk implications. For example, the wrong operation in CB due to overloads and magnetic-core delamination in transformers has the same RPN—168 more precisely—but their ratings are different. Their impacts on the system could be different, but unfortunately, FMEA could not distinguish them. This clearly shows that FMEA is limited in the prioritization of maintenance tasks. FMEA is not able to assign different weights for its ratings, leading to some misreading concerning the risk of a failure mode. For an adequate application of FMEA, it is of utmost importance to assemble subject experts with a high level of knowledge of the smart grid operation. This condition is related to the fact that failure modes and failure causes must be enumerated and exhaustively detailed and discussed in order to evaluate, as accurately as possible, the impacts of failure in the smart grid.
In the literature, we verified the lack of failure rates information discriminated against for each failure mode, either for power and cyber equipment. Even data found in the Portuguese electric energy utility (EDP Distribuição), a big company with interests in cost-effective maintenance methodologies, was inconclusive. In our research, failure mode’s failure rates were subjectively discriminated from equipment’s failure rates, which may have led to some errors in RPN final calculation, especially for OCC rating, which seemed to cause low impact for RPN the way it was obtained.
For FMEA to be correctly applied, experimental failure rates for each mode of failure must be detailed. If possible, extensive research would be useful to get experimental rates for each cause of failure. Therefore, for a deeper understanding of the criticality of certain failure, the collection of data on the frequency of failure for each power and cyber equipment, by specifying failure rates for each failure mode and their causes, would be profitable for reliability purposes. Knowing the frequency of certain failure, as long as the real impact that failure triggers in the smart grid was kept in mind, would make FMEA more efficient (more reliability of OCC rating) and maintenance strategies more precise (strategies based on maintenance frequency adjustments are improved).
Finally, in order to ensure the system’s high-reliability level, a cost-effective maintenance strategy must be achieved by prioritizing failure modes from the most critical to the lowest one, as long as one has to take into consideration maintenance costs for each equipment and each failure mode. This way, in what concerns the level of risk of the analyzed smart grid test system (note that, concerning the economic side, it is not evaluated in the present study), it is of utmost importance to establish maintenance strategies according to their risk number.
Strategies with the aim of (i) mitigating or eliminating failure modes in order to decrease OCC rating, (ii) increasing failure detectability for the purpose of lowering DET rating, and (iii) minimizing losses or negative impacts when a failure occurs in order to diminish SEV rating, all three must be performed in order to increase reliability of a smart grid topology.
8. Conclusions
This paper analyses the application of classical FMEA analysis in a smart grid environment. A simple smart grid test system was defined as having power and a cyber-components. Results of qualitative assessment of reliability analysis were performed, and a critical analysis of FMEA results was carried out. Analyzing the results achieved, seven critical conclusions can be pulled out, which allow highlighting the advantages and disadvantages concerning the practical implementation of classical FMEA in a smart grid cyber-physical system:
- (1)
- Advantage: it allowed identify the top ten high risky failure modes, which are related to server, transformers, HMI, IED, busbar, power cables and Ethernet switch;
- (2)
- Advantage: short circuits were identified as the causes for the riskiest failure modes in power equipment;
- (3)
- Advantage: concerning the cyber equipment, human and software errors (associated with HMI and servers) were identified as causes for high-risk failure modes;
- (4)
- Disadvantage: the RPN value is highly sensitive to small variations in the three risk factors SEV, OCC, and DET;
- (5)
- Disadvantage: The prioritization of failure modes based on the RPN value is not adequate for applications in a smart grid cyber-physical system. It does not take into account the relative importance of the three risk factors, which is different for each team analyzing the system. For example, the relative importance of the severity factor (SEV) in a transformer is different from the importance of the SEV factor when it concerns an Ethernet switch;
- (6)
- Disadvantage: there is a lack of information regarding the failure rates associated with each failure mode analyzed. This happens since the occurrence of a failure is recorded without differentiating which failure mode is related to the said failure.
It is important to highlight that classical FMEA is successful in assemble failure modes and their causes in a given smart grid. However, for a better reliability assessment and risk analysis of a smart grid using FMEA, it needs to be modified to improve risk prioritization. Since power systems reliability assessment is usually conducted considering component failures as a whole, that is, without differentiating the failure modes that drive the component failure, FMEA can be used first to identify the criticality of the failure modes and then use these critical failure modes as inputs for a quantitative reliability analysis instead a single failure rate for each component.
Component’s failure rate used in reliability analysis is a composition of failure probability functions for each of the failure modes identified for this component. This implies that reliability analysis would consider both the critical and non-critical failure modes. Therefore, considering the most critical failure modes for each equipment and using it as input for the quantitative reliability analysis, it would be possible to improve the perception of the failure mechanisms that lead to a reduction in system’s reliability, allowing the chance to focus the maintenance efforts at reducing the impact of this specific failure mode. For this reason, is important to the registry the failure statistics at the failure mode level and not only at the component level.
Author Contributions
Conceptualization, A.A.Z., J.F., and P.J.D.C.B.; methodology, A.A.Z. and A.B.; validation, A.A.Z. and A.B.; formal analysis, A.A.Z. and A.B.; investigation, A.A.Z. and A.B.; writing—original draft preparation, A.A.Z.; writing—review and editing, A.A.Z., J.F. and P.J.D.C.B.; supervision, P.J.D.C.B.; funding acquisition, P.J.D.C.B. All authors have read and agreed to the published version of the manuscript.
Funding
This work has been partially supported by national funds through the Fundação para a Ciência e a Tecnologia (FCT), through IDMEC, under LAETA project UID/EMS/50022/2020, and by Secretaría Nacional de Educación Superior, Ciencia, Tecnología e Innovación (SENESCYT) of the Ecuadorian Government through fellowship CZ05-000291-2017.
Conflicts of Interest
The authors declare no conflict of interest.
Nomenclature and Abbreviations
| FMEA | Failure Modes and Effects Analysis |
| RPN | Risk priority number |
| RCM | Reliability Centered Maintenance |
| FMECA | Failure Modes, Effects, and Criticality Analysis |
| PMU | Phasor Measuring Unit |
| CPN | Cost-priority number |
| FTA | Fault Tree Analysis |
| PV | Photovoltaic Power System |
| ESS | Energy Storage System |
| LAB | Lead-acid batteries |
| LCB | Lead–carbon batteries |
| OLTC | On-load tap changer |
| SAE | Society of Automotive Engineers |
| IEC | International Electrotechnical Commission |
| ECSS | European Cooperation for Space Standardization |
| NASA | National Aeronautics and Space Administration |
| SEV | Severity |
| OCC | Occurrence |
| DET | Detection |
| LAN | Local area network |
| WAN | Wide area network |
| HMI | Human-machine interface |
| SW | Ethernet switch |
| SV | Server |
| EB | Energy box |
| IED | Intelligent electronic device |
| ICCP | The inter-control center communications protocol |
| FTP | File transfer protocol |
References
- Moslehi, K.; Kumar, R. A reliability perspective of the smart grid. IEEE Trans. Smart Grid 2010, 1, 57–64. [Google Scholar] [CrossRef]
- Santacana, E.; Rackliffe, G.; Tang, L.; Feng, X. Getting smart. IEEE Power Energy Mag. 2010, 8, 41–48. [Google Scholar] [CrossRef]
- Farhangi, H. The path of the smart grid. IEEE Power Energy Mag. 2010, 8, 18–28. [Google Scholar] [CrossRef]
- Yssaad, B.; Abene, A. Rational reliability centered maintenance optimization for power distribution systems. Int. J. Electr. Power Energy Syst. 2015, 73, 350–360. [Google Scholar] [CrossRef]
- Bertling, L. Reliability Centred Maintenance for Electric Power Distribution Systems. Ph.D. Thesis, Royal Institute of Technology KTH, Stockholm, Sweden, 2002. [Google Scholar]
- Mirsaeedi, H.; Fereidunian, A.; Mohammadi-Hosseininejad, S.M.; Lesani, H. Electricity distribution system maintenance budgeting: A reliability-centered approach. IEEE Trans. Power Deliv. 2018, 33, 1599–1610. [Google Scholar] [CrossRef]
- Rafiei, M.; Khooban, M.-H.; Igder, M.A.; Boudjadar, J. A novel approach to overcome the limitations of reliability centered maintenance implementation on the smart grid distance protection system. IEEE Trans. Circuits Syst. II Express Briefs 2019, 67, 320–324. [Google Scholar] [CrossRef]
- Tang, Y.; Liu, Q.; Jing, J.; Yang, Y.; Zou, Z. A framework for identification of maintenance significant items in reliability centered maintenance. Energy 2017, 118, 1295–1303. [Google Scholar] [CrossRef]
- Pourahmadi, F.; Fotuhi-Firuzabad, M.; Dehghanian, P. Application of game theory in reliability-centered maintenance of electric power systems. IEEE Trans. Ind. Appl. 2017, 53, 936–946. [Google Scholar] [CrossRef]
- Afzali, P.; Keynia, F.; Rashidinejad, M. A new model for reliability-centered maintenance prioritization of distribution feeders. Energy 2019, 171, 701–709. [Google Scholar] [CrossRef]
- Sanz-Bobi, M.A.; Mazidi, P.; Sanchez, A.; Gonzalez, A.; Bachiller, R. Lifetime analysis of the main communication components in a smart distribution grid. In Proceedings of the International Telecommunications Energy Conference (INTELEC), Sentosa, Singapore, 13–17 October 2019. [Google Scholar]
- Shayesteh, E.; Yu, J.; Hilber, P. Maintenance optimization of power systems with renewable energy sources integrated. Energy 2018, 149, 577–586. [Google Scholar] [CrossRef]
- Heylen, E.; Ovaere, M.; Proost, S.; Deconinck, G.; Van Hertem, D. Fairness and inequality in power system reliability: Summarizing indices. Electr. Power Syst. Res. 2019, 168, 313–323. [Google Scholar] [CrossRef]
- Liu, W.; Gong, Q.; Han, H.; Wang, Z.; Wang, L. Reliability modeling and evaluation of active cyber-physical distribution system. IEEE Trans. on Power Syst. 2018, 33, 7096–7108. [Google Scholar] [CrossRef]
- Wang, S.; Wu, Z.; Su, A.; Jin, S.; Xia, Y.; Zhao, D. Reliability modeling and simulation of cyber-physical power distribution system considering the impacts of cyber components and transmission quality. In Proceedings of the Chinese Control Conference (CCC), Wuhan, China, 25–27 July 2018. [Google Scholar]
- National Aeronautics and Space Administration (NASA). Reliability Centered Maintenance Guide for Facilities and Collateral Equipment; National Aeronautics and Space Administration: Washington, DC, USA, 2000.
- Liu, H. FMEA Using Uncertainty Theories and MCDM Methods; Springer Science & Business Media: Singapore, 2016. [Google Scholar]
- Leimeister, M.; Kolios, A. A review of reliability-based methods for risk analysis and their application in the offshore wind industry. Renew. Sustain. Energy Rev. 2018, 91, 1065–1076. [Google Scholar] [CrossRef]
- International Electrotechnical Commission. IEC 60812—Analysis Techniques for System Reliability—Procedure for Failure Mode and Effects Analysis (FMEA); International Electrotechnical Commission: Geneva, Switzerland, 2006. [Google Scholar]
- Bertling, L. Infrastructure Asset Management with Power System Application; CRC Press: Boca Raton, FL, USA, 2018. [Google Scholar]
- Carlson, C.S. Effective FMEAs: Achieving Safe, Reliable, and Economical Products and Processes Using Failure Mode and Effects Analysis; John Wiley & Sons, Inc.: Hoboken, NJ, USA, 2002. [Google Scholar]
- Otuoze, A.O.; Mustafa, M.W.; Larik, R.M. Smart grids security challenges: Classification by sources of threats. J. Electr Syst. Inf. Technol. 2018, 5, 468–483. [Google Scholar] [CrossRef]
- Basu, K.; Padhee, M.; Roy, S.; Pal, A.; Sen, A.; Rhodes, M.; Keel, B. Health monitoring of critical power system equipment using identifying codes. In Lecture Notes in Computer Science (Including Subseries Lecture Notes in Artificial Intelligence and Lecture Notes in Bioinformatics); LNCS; Springer: Cham, Switzerland, 2019; Volume 11260, pp. 29–41. [Google Scholar] [CrossRef] [Green Version]
- Zúñiga, A.A.; Fernandes, J.F.P.; Branco, P.J.C. A Fuzzy-based failure modes and effects analysis (FMEA) in smart grids. In Advances in Intelligent Systems and Computing; Rocha, Á., Ferrás, C., Paredes, M., Eds.; International Conference on Information Technology & Systems ICITS 2019; Springer: Cham, Switzerland, 2019; Volume 918, pp. 507–516. [Google Scholar]
- Arabian-Hoseynabadi, H.; Oraee, H.; Tavner, P. Failure modes and effects analysis (FMEA) for wind turbines. Int. J. Electr. Power Energy Syst. 2010, 32, 817–824. [Google Scholar] [CrossRef] [Green Version]
- Shafiee, M.; Dinmohammadi, F. An FMEA-based risk assessment approach for wind turbine systems: A comparative study of onshore and offshore. Energies 2014, 7, 619–642. [Google Scholar] [CrossRef] [Green Version]
- Souza, R.D.Q. Fmea and fta analysis for application of the reliability-centered maintenance methodology: Case study on hydraulic turbines. ABCM Symp. Ser. Mechatron. 2008, 3, 803–812. [Google Scholar]
- Lifar, A.S.; Brom, A.E. FMECA use for the equipment reliability analysis in hydro-power engineering. In Proceedings of the IOP Conference Series: Earth and Environmental Science, Ota, Nigeria, 18–20 June 2019; Volume 72, pp. 1–6. [Google Scholar]
- Colli, A. Failure mode and effect analysis for photovoltaic systems. Renew. Sustain. Energy Rev. 2015, 50, 804–809. [Google Scholar] [CrossRef]
- Villarini, M.; Cesarotti, V.; Alfonsi, L.; Introna, V. Optimization of photovoltaic maintenance plan by means of an FMEA approach based on real data. Energy Convers. Manag. 2017, 152, 1–12. [Google Scholar] [CrossRef]
- Yang, J.; Hu, C.; Wang, H.; Yang, K.; Liu, J.B.; Yan, H. Review on the research of failure modes and mechanism for lead-acid batteries. Int. J. Energy Res. 2017, 41, 336–352. [Google Scholar] [CrossRef]
- Lyu, D.; Ren, B.; Li, S. Failure modes and mechanisms for rechargeable Lithium-based batteries: A state-of-the-art review. Acta Mech. 2019, 230, 701–727. [Google Scholar] [CrossRef]
- Pourramazan, A.; Saffari, S.; Barghandan, A. Study of Failure Mode and Effect Analysis (FMEA) on capacitor bank used in distribution power systems. Int. J. Innov. Res. Electr. Electron. Instrum. Control Eng. 2017, 5, 113–118. [Google Scholar]
- Pottonen, L.; Pulkkinen, U.; Koskinen, M. A method for analysing the effect of protection system failures on power system reliability. In Proceedings of the 15th Power Systems Computation Conference, Liege, Belgium, 22–26 August 2005. [Google Scholar]
- Araújo, W.P.P. Metodologia Fmea-Fuzzy Aplicada à Gestão de Indicadores de Continuidade Individuais de Sistemas de Distribuição de Energia Elétrica. Master’s Thesis, Universidade Federal de Santa Catarina, Florianopolis, Brazil, 2008. [Google Scholar]
- Saraswati, D.; Marie, I.A.; Witonohadi, A. Power transformer failures evaluation using Failure Mode Effect and Criticality Analysis (FMECA) method. Asian J. Eng. Technol. 2014, 2, 484–489. [Google Scholar]
- Singh, J.; Singh, S.; Singh, A. Distribution transformer failure modes, effects and criticality analysis (FMECA). Eng. Fail. Anal. 2019, 99, 180–191. [Google Scholar] [CrossRef]
- Khalil, M.M.; Cristaldi, L.; Faifer, M. FMECA analysis for the assessing of maintenance activity for power transformers. In Proceedings of the Maintenance Performance Measurement and Management (MPMM) Conference; Imprensa da Universidade de Coimbra: Coimbra, Portugal, 2014; pp. 21–26. [Google Scholar]
- Hare, J.; Shi, X.; Gupta, S.; Bazzi, A. Fault diagnostics in smart micro-grids: A survey. Renew. Sustain. Energy Rev. 2016, 60, 1114–1124. [Google Scholar] [CrossRef]
- Yssaad, B.; Khiat, M.; Chaker, A. Maintenance optimization for equipment of power distribution system based on FMECA method. Acta Electrotech. 2012, 53, 218–223. [Google Scholar]
- US Department of Defense. Mil.-Std-1629, Procedures for Performing a Failure Mode, Effects and Criticality Analysis; US Department of Defense: Arlington, VA, USA, 1949.
- Akbari, M.; Khazaee, P.; Sabetghadam, I.; Karimifard, O. Failure Modes and Effects Analysis (FMEA) for power transformers. In Proceedings of the 28th International Power System Conference, Tehran, Iran, 13 November 2013; pp. 1–7. [Google Scholar]
- Baleia, A.N.S. Failure Modes and Effects Analysis (FMEA) for Smart Electrical Distribution Systems. Master’s Thesis, Universidade de Lisboa, Lisboa, Portugal, 2018. [Google Scholar]
- Institute of Electrical and Electronics Engineers. IEEE Recommended Practice for the Design of Reliable Industrial and Commercial Power Systems; IEEE: Piscataway, NJ, USA, 2007. [Google Scholar]
- Swedpower, A.B. T-Book Reliability Data of Components in Nordic Nuclear Power Plants; The TUD Office: Stockholm, Sweden, 2005. [Google Scholar]
- Bakcblaze. Hard Drive Stats for Q3 2017. 2018. Available online: https://www.backblaze.com/blog/hard-drive-failure-rates-q3-2017/ (accessed on 25 September 2019).
- CISCO. Cisco Industrial Ethernet 2000 Series Switches—Data Sheet; CISCO: San Jose, CA, USA, 2016; pp. 1–12. [Google Scholar]
- EKE-Electronics. Human-Machine Interface Technical Specifications N.D. Available online: https://www.eke-electronics.com/human-machine-interface (accessed on 30 September 2019).
- Scheer, G.W.; Dolezilek, D.J. Comparing the reliability of Ethernet network topologies in substation control and monitoring networks. In Proceedings of the 2nd Annual Western Power Delivery Automation Conference, Spokane, WA, USA, 27–29 March 2002; pp. 1–15. [Google Scholar]
- Frontier Economics Ltd. Research into the Costs of Smart Meters for Electricity and Gas DSOs; Frontier Economics Ltd.: London, UK, 2008. [Google Scholar]
- Berghmans, F.; Eve, S.; Held, M. An introduction to reliability of optical components and fiber optics sensors. In NATO Science for Peace and Security Series B: Physics and Biophysics; Bock, W.J., Gannot, I., Tanev, S., Eds.; Optical Waveguide Sensing and Imaging; Springer Science & Business Media: Dordrecht, The Netherlands, 2008; pp. 73–100. [Google Scholar]
Figure 1.
(a) FMEA flowchart from [17,19]. (b) Example of an FMEA worksheet line and respective columns.

Figure 2.
Schematic diagram of the cyber-power network representing the smart grid test system [43].
Figure 2.
Schematic diagram of the cyber-power network representing the smart grid test system [43].


Table 1.
Traditional ratings for failure mode’s occurrence (OCC) [17].
Table 1.
Traditional ratings for failure mode’s occurrence (OCC) [17].
| Rating | Occurrence (OCC) | Possible Failure Rate |
|---|---|---|
| 10 | Extremely high | ≥1 in 2 |
| 9 | Very high | 1 in 3 |
| 8 | Repeated failures | 1 in 8 |
| 7 | High | 1 in 20 |
| 6 | Moderately high | 1 in 80 |
| 5 | Moderate | 1 in 400 |
| 4 | Relatively low | 1 in 2000 |
| 3 | Low | 1 in 15,000 |
| 2 | Remote | 1 in 150,000 |
| 1 | Nearly impossible | ≤1 in 150,000 |
Table 2.
Traditional ratings for failure mode’s severity (SEV) [17].
Table 2.
Traditional ratings for failure mode’s severity (SEV) [17].
| Rating | Effect | Severity of Effect |
|---|---|---|
| 10 | Hazardous without warning | The highest severity ranking of a failure mode, occurring without warning and with the consequent hazard. |
| 9 | Hazardous with warning | Higher severity ranking of a failure mode, occurring with a warning and the consequent hazardous. |
| 8 | Very high | Operation of the system is broken down without compromising safe |
| 7 | High | Operation of the system may be continued, but its performance is affected |
| 6 | Moderate | Operation of the system is continued, but its performance is degraded |
| 5 | Low | Performance of the system is affected seriously, and the maintenance is needed |
| 4 | Very low | Performance of the system is less affected, and the maintenance may not be needed |
| 3 | Minor | System performance and satisfaction with minor effect |
| 2 | Very minor | System performance and satisfaction with a slight effect |
| 1 | None | No effect |
Table 3.
Traditional ratings for failure mode’s detection (DET) [17].
Table 3.
Traditional ratings for failure mode’s detection (DET) [17].
| Rating | Detection | Criteria |
|---|---|---|
| 10 | Absolutely impossible | Design control does not detect a potential cause of failure mode, or there is no design control |
| 9 | Very remote | Very remote chance the design control will detect a potential cause of the failure or subsequent failure mode |
| 8 | Remote | Remote chance the design control will detect a potential cause of the failure or subsequent failure mode |
| 7 | Very low | Very low chance the design control will detect a potential cause of the failure or subsequent failure mode |
| 6 | Low | Low chance the design control will detect a potential cause of the failure or subsequent failure mode |
| 5 | Moderate | Moderate chance the design control will detect a potential cause of the failure or subsequent failure mode |
| 4 | Moderately high | Moderately high chance the design control will detect a potential cause of the failure or subsequent failure mode |
| 3 | High | High chance the design control will detect a potential cause of the failure or subsequent failure mode |
| 2 | Very High | Very high chance the design control will detect a potential cause of the failure or subsequent failure mode |
| 1 | Almost certain | Design control will almost certainly detect a potential cause of the failure or subsequent failure mode |
Table 4.
Failure rates attributed to each power equipment.
| Equipment | Failure Rate [(f/year)/km] | Length [km] | Failure Rate [f/year] | Source |
|---|---|---|---|---|
| Busbar 30 kV | - | - | 0.01 | [45] |
| Cable 30 kV | 0.0054 | 2.5 | 0.135 | EDP Distribuição |
| Circuit breaker 30 kV | - | - | 0.023 | EDP Distribuição |
| Transformer | - | - | 0.01 | EDP Distribuição |
Table 5.
Cyber-power links between power and cyber network.
| Link | Linked Equipment |
|---|---|
| 1 | (IED1:BUS1), (IED1:CB2), (IED1:CB3) |
| 2 | (IED2:BUS2), (IED2:CB5), (IED2:CB6) |
| 3 | (IED3:BUS3), (IED3:CB8), (IED3:CB9) |
| 4 | (IED4:BUS4), (IED4:CB12), (IED4:CB13) |
| 5 | (IED5:CG), (UED5:CB1) |
| 6 | (IED6:WE), (IED6:CB4) |
| 7 | (IED7:ES), (IED7:CB11) |
| 8 | (IED8:PV), (IED8:CB14) |
Table 6.
Reliability values used in this work for each cyber-control equipment.
| Equipment | Failure Rate [f/year] | Source |
|---|---|---|
| HMI | 0.1720 | EKE-electronics [48] |
| SW | 0.0225 | Cisco [47] |
| SV | 0.0270 | Backblaze [46] |
| IED | 0.0526 | Schweitzer Engineering Laboratories [43] |
| EB | 0.0050 | Frontier Economics [50] |
| Ethernet link | ≤ | - |
| Optical fiber link | 0.0438 | [51] |
Table 7.
Failure modes for power equipment considered for analysis.
| Power Equipment | Failure Mode | Criteria |
|---|---|---|
| Busbar | Loss of structural integrity | The metallic strip can lose its mechanical integrity due to support insulators breakdown, cracking of welds and fracture of the copper bar. |
| Loss of electrical continuity | The occurrence of arc flashes degrades the copper bar. | |
| Loss of electrical efficiency | Moisture and humidity can lead to short circuits. | |
| Electrical operation failure | Short circuits between buses and harmonics can lead to ohmic heating. | |
| Power cable | Insulation failure | The aging process results in the eventual failure of the insulating and sheathing materials. |
| Cable integrity defect | Manufacturing imperfection, incorrect installation or hostile environments can result in cable breakdown. | |
| Electrical operation failure | Moisture, shield damage, overloads or short circuits can damage the cable. | |
| Circuit breaker | Insulation failure | Loss of dielectric properties can damage the CB. |
| Wrong operation | Improper parameterization or manual installation leads to spurious opening or closures. | |
| Bushing breakdown | Lightning or external short circuits can damage the bushing. | |
| Bushing terminal hotspot | Moisture can increase ohmic resistance in bushing terminals, resulting in bushing damage. | |
| Loss of dielectric strength in bushings | Heat, oxidation, acidity, and moisture can lead to bushing degradation. | |
| Mechanical failure in the operating mechanism | Lack of lubrication, contamination or corrosion prevents CB from acting when necessary. | |
| Contacts degradation | Contact wear and electrical treeing can damage the equipment. | |
| Power Transformer | Bushing breakdown | Lightning or external short circuits can damage transformer bushings. |
| Bushing terminal hot spot | Moisture can increase ohmic resistance in bushing terminals, resulting in bushing damage. | |
| Loss of dielectric strength in bushings | Heat, oxidation, acidity, and moisture can lead to bushing degradation. | |
| Magnetic-core delamination | Harmonics or corrosion can induce core degradation. | |
| Tap changer mechanical failure in the drive mechanism | Corrosion, friction or contamination can lead to transformer unstable operation. | |
| Tap changer contacts degradation | Contact wear and electrical treeing can lead to transformer unstable operation. | |
| Tank rupture | Vibration-induced damage, corrosion or cracking of welds result in oil leakage and possible catastrophic event. | |
| Windings isolation degradation or breakdown | Oil contamination, oil moisture or short circuits and overloads can damage transformer windings. | |
| Distortion, loosening or displacement of the windings | It can lead to short circuits. | |
| Transformer explosion | Internal short circuits or human sabotage can lead to catastrophic events. | |
| Cooling system failure | Damaged fans or cooling pipes obstruction can also lead to catastrophic events. |
Table 8.
Failure modes for cyber-control equipment considered for analysis.
| Cyber Equipment | Failure Mode | Criteria |
|---|---|---|
| IED | Security failure | Related to the susceptibility of cyber equipment to lose their integrity. |
| Power failure | Related to the remote disconnection of power, which affects the normal operation of the cyber network. | |
| Defective communication | Damaged transducers or poor signal can lead to intermittent communication between IED and remaining cyber-network. | |
| SV | Security failure | Related to the susceptibility of cyber equipment to lose their integrity. |
| Power failure | Related to remote disconnection of power, affecting the normal operation of the cyber network. | |
| Data overload | Lower storage capacity or an unexpectedly large amount of data to storage results in defective data storage. | |
| Hardware crash | Physical damage, overheating, humidity or hard drive crash, all result in loss of data. | |
| Operational failure | Inherent software errors can corrupt stored data. | |
| HMI | Security failure | Related to the susceptibility of cyber equipment to lose their integrity. |
| Power failure | Related to remote disconnection of power, affecting the normal operation of the cyber network. | |
| Data error | Related to inherent problems in the HMI operation that compromises its function. | |
| SW | Security failure | Related to the susceptibility of cyber equipment to lose their integrity. |
| Power failure | Related to remote disconnection of power, affecting the normal operation of the cyber network. | |
| Performance decrease | The congestion of packets in the communication network can decrease SW operational performance. | |
| Network/Cyber storm | Broadcast of an excessive number of messages in an uncontrollable way can congestion SW operation. | |
| Operational failure | Inherent problems in SW configuration or module failure can blackout the SW. | |
| EB | Security failure | Related to the susceptibility of cyber equipment to lose their integrity. |
| Power failure | Related to remote disconnection of power, affecting the normal operation of the cyber network. | |
| Communication error | Poor signal with SV leads to no transmission data. | |
| Power consumption misreading | Manual manipulation or significant measurement error lead to incorrect data acquisition. | |
| Operational failure | Improper EB programming or defective installation result in incorrect data acquisition. | |
| Catastrophic failure | Temperature stress can severely damage the EB. |
Table 9.
Failure modes for network link considered for analysis.
| Network Link | Failure Mode | Criteria |
|---|---|---|
| Optical fiber link | Fracture | Stress, corrosion or fatigue can lead to microcracks, resulting in cable breakdown. |
| Lead–bonds degradation | Temperature stress can damage plated contacts. | |
| Humidity induced | Electrochemical oxidation in transmitters and receivers. | |
| Ethernet link | Crosstalk | Excessive traffic of packets results in congestion and overload of data. |
| Integrity defect | Manufacturing imperfection, incorrect installation or RJ45connectors degradation results in delays in data transmission, or even its interruption. | |
| Link breakdown | Cable breakdown due to external physical damage. |
Table 10.
Final RPN obtained for highest risk selected failure modes.
| Rank | Equipment | Failure Mode(s) | Failure Cause(s) | OCC | DET | SEV | RPN | Recommended Action(s) |
|---|---|---|---|---|---|---|---|---|
| 1 | Transformer | Transformer explosion | Internal short circuit | 5 | 10 | 9 | 450 | Real-time signal analysis |
| 2 | HMI | Operational failure | Human error | 5 | 10 | 5 | 400 | Hire or educate qualified employees |
| 3 | IED | Control failure | Defective data processing (software error) | 7 | 7 | 8 | 392 | Periodic software update |
| 4 | Bus bar | Loss of structural integrity | Break of the support insulators | 6 | 9 | 7 | 378 | Implement hot spot alert strategies |
| 5 | Cable | Electrical operation failure | Short circuits transients | 6 | 10 | 6 | 360 | Real-time current analysis |
| 6 | SW | Operational failure (SW blackout) | SW is locked up | 6 | 10 | 6 | 360 | Periodic reboot |
| 7 | Bus bar | Loss of electrical continuity | Arc flash | 4 | 10 | 8 | 320 | Improve preventive maintenance actions |
| 8 | Bus bar | Electrical disturbances | Short circuits between bus bars | 4 | 10 | 8 | 320 | Real-time current analysis |
| 9 | Transformer | Distortion, loosening or displacement of the winding | Short circuits | 5 | 9 | 7 | 315 | Real-time current analysis |
| 10 | Busbar | Loos of structural integrity | Fracture of the cooper bar | 5 | 9 | 7 | 315 | Implement hot spot alert strategies |
| 11 | Busbar | Loos of structural integrity | Cracking of connection welds | 5 | 9 | 7 | 315 | Implement hot spot alert strategies |
| 12 | CB | Bushing breakdown | External short circuit | 5 | 10 | 6 | 300 | Real-time current analysis |
| 13 | SV | Data errors | Software malfunction | 5 | 10 | 6 | 300 | Periodic software update: periodic data backup |
| 14 | SW | Operational failure (SW blackout) | Module failure | 5 | 10 | 6 | 300 | |
| 15 | Transformer | Winding overheating | Overload | 6 | 7 | 7 | 294 | Real-time signal analysis |
| 16 | Cable | Cable integrity defect | Lightnings | 7 | 5 | 8 | 280 | Use of active lightning protection equipment |
| 17 | CB | CB contacts degradation | Electrical treeing (partial discharges) | 5 | 9 | 6 | 270 | Implement hot spot strategies |
| 18 | Busbar | Electrical disturbances | Harmonics | 4 | 8 | 8 | 256 | Real-time current analysis |
| 19 | SW | Performance decreased | Mististatic traffic | 7 | 6 | 6 | 252 | Establish optimized communication network topology for better performance; SW replacement |
| 20 | IED | Communication failure | Poor communication between IED and remaining cyber-network | 5 | 8 | 6 | 240 | Establish alternative paths for communication |
| 21 | Transformer | Winding isolation degradation or breakdown | Short circuits and overloads | 4 | 10 | 6 | 240 | Real-time current analysis |
| 22 | Transformer | Bushing breakdown | External short circuit | 4 | 10 | 6 | 240 | Real-time current analysis |
| 23 | Transformer | Tank rupture | Cracking of welds | 3 | 9 | 8 | 215 | Implement hot spot strategies |
| 24 | IED | Power outages | Remote disconnection of power | 3 | 10 | 7 | 210 | Install a capacity external battery for backups (UPS) |
| 25 | SV | Power outages | Remote disconnection of power | 3 | 10 | 7 | 210 | Install a capacity external battery for backups (UPS) |
| 26 | CB | Insulation failure | Loss of dielectric properties | 5 | 7 | 6 | 210 | Signal analysis optimization in order to find opening patterns |
| 27 | IED | Communication Failure | Network/Cyber storm | 5 | 7 | 6 | 210 | Establish an optimized communication network topology for better performance |
| 28 | SV | Security failure | Denial of Service attacks (DoS) | 2 | 10 | 10 | 200 | Enforce appropriate security policies |
| 29 | CB | Bushing terminal hot spot | Mechanical stress due to external short circuit conditions | 4 | 8 | 6 | 192 | Establish preventive cleaning and terminal squeeze routines |
| 30 | IED | Communication failure | Signal processing error (corrupted data) | 4 | 8 | 6 | 192 | |
| 31 | IED | Security failure | Faulty information injection (cyberattack) | 3 | 7 | 9 | 169 | Enforce appropiate security policies and configuration |
| 32 | IED | Monitoring failure | Significance measurement error | 5 | 6 | 6 | 180 | Cross data with other monitored data in the grid |
| 33 | HMI | Security failure | Human retaliation | 2 | 10 | 9 | 180 | Restrict access to specialist personnel and controlled by a security check |
| 34 | SW | Power outage | Remote disconnection of power | 3 | 10 | 6 | 180 | Install a capacity external battery for backup (UPS); install PLC system |
| 35 | SW | Network/Cyber storm | Broadcast of an excessive number of messages in an uncontrollable way (misleading information) | 4 | 7 | 6 | 168 | Install higher-performance SWs; establish communication network topology for better performance |
| 36 | Transformer | Cooling system failure | Cooling pipes obstruction | 3 | 7 | 8 | 168 | Periodic cooling system maintenance (Check for leaks, rust or accumulation of dirt) |
| 37 | CB | Wrong operation (Spurious opening and closure) | Overload | 6 | 4 | 7 | 168 | Real-time current analysis |
| 38 | Transformer | Magnetic-core delamination | Harmonics | 4 | 7 | 6 | 168 | Real-time current analysis |
| 39 | Transformer | Bushing terminal hot spot | Mechanical stress due to external short circuit conditions | 4 | 7 | 6 | 168 | Establish preventive cleaning and terminal squeeze routines |
| 40 | Transformer | Tap changer contacts degradation | Electrical treeing (partial discharges) | 3 | 9 | 6 | 162 | Implement hot spot alert strategies |
| 41 | Optical fiber link | Fracture | Stress, corrosion for fatigue due to microcracks | 3 | 10 | 4 | 120 | Increase cable robustness |
| 42 | Optical fiber link | Humidity induced | Electrochemical oxidation of transmitter and receivers | 3 | 10 | 4 | 120 | Use of hermetically sealed package |
Table 11.
Selected failure modes for analysis and discussion.
| Equipment | Failure Mode(s) | Failure Cause | OCC | DET | SEV | RPN | RANK |
|---|---|---|---|---|---|---|---|
| Busbar | Loss of structural integrity | Fracture of the copper bar | 5 | 9 | 7 | 315 | 4 |
| Break of the support insulators | 6 | 9 | 7 | 378 | 1 | ||
| Cracking of connection welds | 5 | 9 | 7 | 315 | 5 | ||
| Busbar | Electrical disturbances | Short circuit between bus bars | 4 | 10 | 8 | 320 | 3 |
| Harmonics | 4 | 8 | 8 | 256 | 7 | ||
| SW | Operational failure (SW blackout) | SW is locked up | 6 | 10 | 6 | 360 | 2 |
| Module failure | 5 | 10 | 6 | 300 | 6 | ||
| IED | Communication failure | Poor communication between IED and remaining cyber network | 5 | 8 | 6 | 240 | 8 |
| Signal processing error (corrupted data) | 4 | 8 | 6 | 192 | 10 | ||
| Network/Cyber storm | 5 | 7 | 6 | 210 | 9 |
© 2020 by the authors. Licensee MDPI, Basel, Switzerland. This article is an open access article distributed under the terms and conditions of the Creative Commons Attribution (CC BY) license (http://creativecommons.org/licenses/by/4.0/).
Share and Cite
MDPI and ACS Style
Zúñiga, A.A.; Baleia, A.; Fernandes, J.; Branco, P.J.D.C. Classical Failure Modes and Effects Analysis in the Context of Smart Grid Cyber-Physical Systems. Energies 2020, 13, 1215. https://0-doi-org.brum.beds.ac.uk/10.3390/en13051215
AMA Style
Zúñiga AA, Baleia A, Fernandes J, Branco PJDC. Classical Failure Modes and Effects Analysis in the Context of Smart Grid Cyber-Physical Systems. Energies. 2020; 13(5):1215. https://0-doi-org.brum.beds.ac.uk/10.3390/en13051215
Chicago/Turabian StyleZúñiga, Andrés A., Alexandre Baleia, João Fernandes, and Paulo Jose Da Costa Branco. 2020. "Classical Failure Modes and Effects Analysis in the Context of Smart Grid Cyber-Physical Systems" Energies 13, no. 5: 1215. https://0-doi-org.brum.beds.ac.uk/10.3390/en13051215
Note that from the first issue of 2016, this journal uses article numbers instead of page numbers. See further details here.