1. Introduction
Lithium-ion (Li-ion) batteries have prevailed over other energy storage types during the last decade due to the longer lifetime, higher efficiency and energy density [
1]. This fact has driven its gradual integration in many applications from consumer electronics e.g., smartphones or power banks to renewable storage systems or electric vehicles.
However, Li-ion batteries may experience a fast degradation or even become hazardous if operated out of the limits specified by the manufacturer [
2]. Therefore, a battery management system (BMS) to monitor and control the state of the battery is required. Besides keeping the battery within the operative limits, to estimate the state of charge (SOC) and the state of health (SOH) accurately is an essential function of the BMS.
Numerous methods for SOC estimation have been proposed in the literature, with diverse complexity and accuracy [
3]. The coulomb counting relies on the current monitoring and calculates the net charge transferred, to estimate the SOC [
4]. The relationship between the open-circuit voltage (OCV) and the SOC can also be used as an estimator if the battery is in a long-enough rest period [
5]. Equivalent circuit models and extended Kalman filtering can be applied to calculate the OCV and estimate the SOC during the operation of the battery [
6,
7]. The accuracy of the model parameters affects the performance of the method, hence dual/joint extended Kalman filters method estimates SOC and model parameters at the same time, increasing the method performance but also its complexity [
8]. The model parameters are easy to obtain, however, they are affected by factors such as SOC, current rate (C-rate), temperature or degradation level. The combination of these variables may affect the SOC estimation accuracy [
9,
10]. These methods are most widely used for online battery monitoring, however, more advanced methods are being developed proving their effectiveness under controlled environments. The complexity of the implementation in practical applications and the robustness of these methods is, however, one of the great challenges that still needs to be solved in this area. Meanwhile, Coulomb counting remains as one of the most accepted and widespread methods in the market for all types of applications.
Coulomb counting method stands out for its simplicity, however, its accuracy is compromised by the error accumulation during the incremental calculation of the transferred charge in a long time operation. Moreover, the method depends on the initial value of SOC and the actual capacity. OCV can be used in combination with coulomb counting to minimize the error and provide a reliable starting point for the estimation [
11]. The capacity of the battery depends on the C-rate and the temperature, additionally, there are losses during the charging and discharging process and, to a lesser extent, due to the self-discharge. All these factors must be taken into account during the SOC estimation to improve the accuracy.
This paper presents an approach that improves the method described above providing accurate results throughout the range of temperatures and battery load. The OCV-SOC relationship at different temperatures is used for the SOC estimation during the idling periods, minimizing the cumulative error due to the integration of current. The presented method provides better precision results with a very low computational complexity, therefore representing an evolution of the classic Coulomb counting algorithm. The influence of the different operating conditions is analyzed at the beginning of life (BOL) of the battery in order to implement a correction mechanism. The SOH is evaluated with a recursive least squares method [
12] and updated for a reliable SOC estimation. The method is verified through an extensive test based on a real driving pattern at different temperatures.
2. Experimental
In this work, Lithium Nickel Manganese Cobalt Oxide (NMC) batteries are used to validate the proposed method. The battery’s nominal voltage is 3.6 V and the nominal capacity 3.4 Ah. The upper/lower cutoff voltage is 4.2 V/2.65 V.
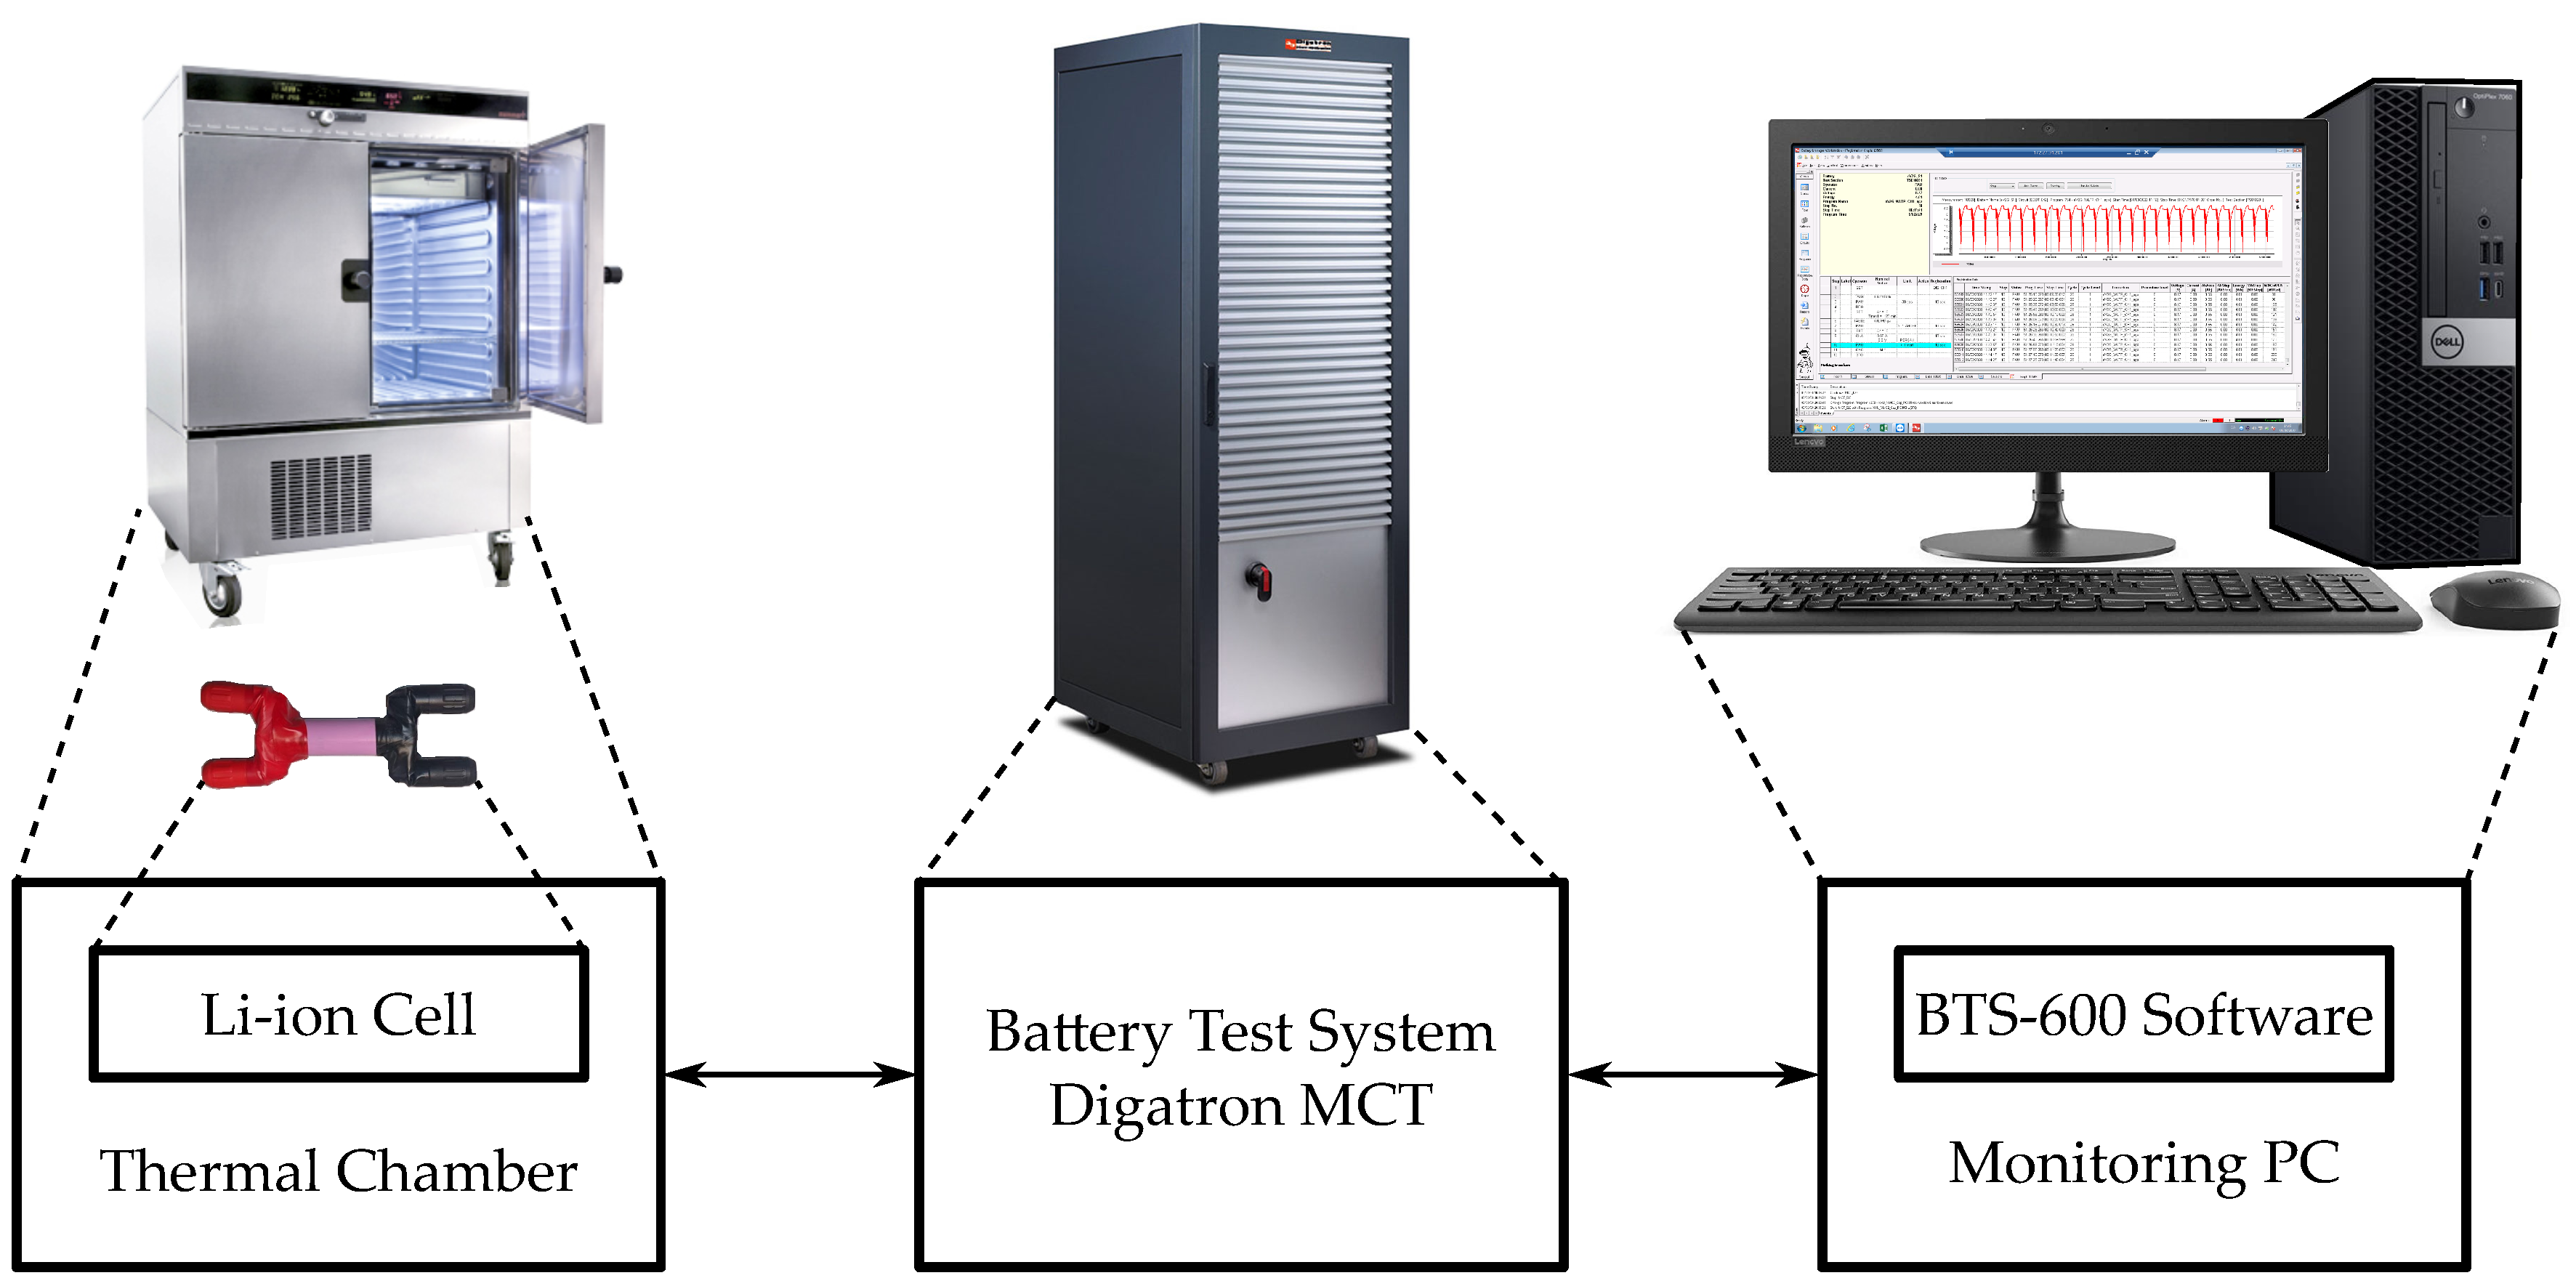
Figure 1 shows the set-up used to test the batteries. A thermal test chamber is used to control the temperature of the battery. The battery test system charges and discharges the cells with a predefined current profile and the host computer collects the measurements from the battery, with one second resolution.
The experimental procedure is shown in
Figure 2. The tests were designed to age the cells simulating a real scenario of cycling at different temperatures. A series of driving cycles and characterization tests were conducted for this purpose.
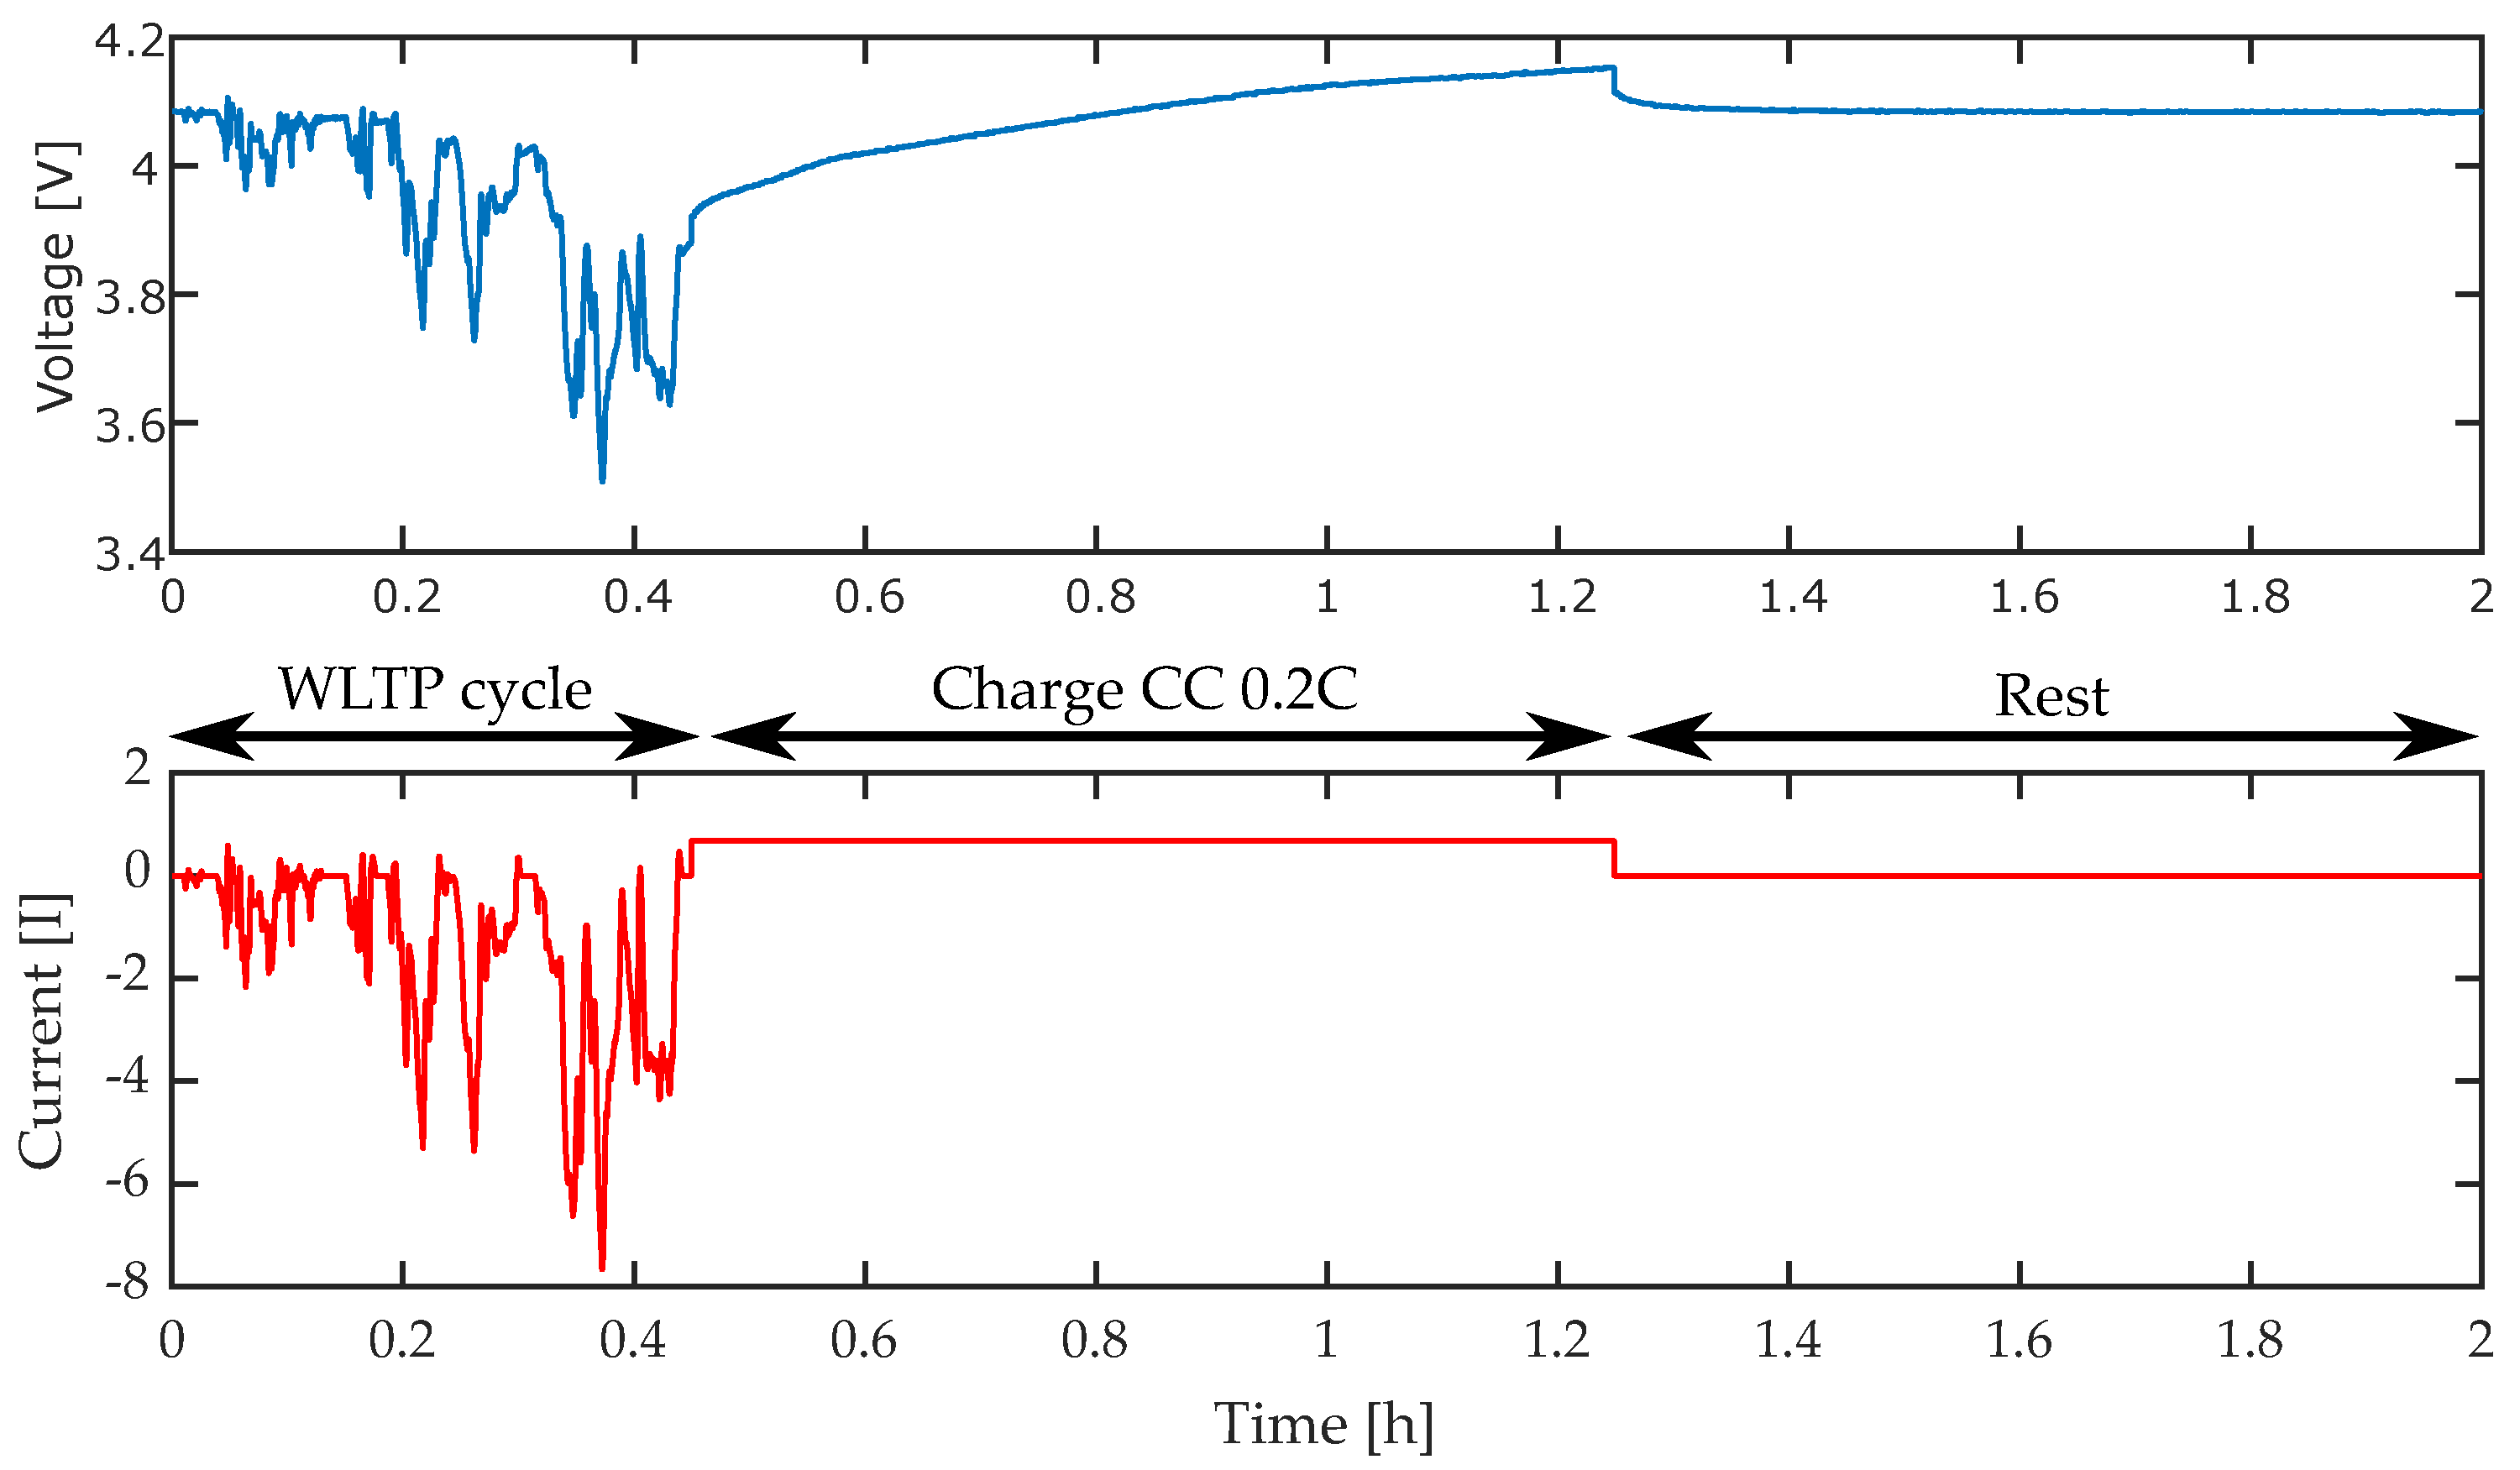
To carry out the aging process the cells are distributed in three groups and subjected to successive discharge cycles according to the World Harmonized Light-duty Vehicle Test Procedure (WLTP) for class B vehicles at three different temperatures (15 °C, 25 °C and 35 °C). The batteries are charged to 90% SOC with 0.2C (i.e., 0.68 A) just after each driving cycle followed by a rest period before repeating the aging procedure. As shown in
Figure 3 each described discharging/charging cycle takes 2 h to complete. After a week of testing equivalent to 84 driving cycles, the cells are characterized by a reference performance test (RPT). This test consists of a first full cycle at low current to stabilize the battery followed by another cycle to measure the capacity and efficiency of the cell.
The OCV-SOC relationship is measured both at beginning of life state (BOL) and after 350 full cycles, which corresponds to 6.5%, 7.35% and 7.65% capacity fade for the cells aged at 15 °C, 25 °C and 35 °C, respectively.
The battery is charged and discharged at a constant low rate of 0.2C until the upper and lower cutoff voltage is reached. The OCV-SOC curve is obtained by averaging the values of both, charge and discharge curves. The OCV-SOC relationship is measured at 5 different temperatures (5 °C, 15 °C, 25 °C, 35 °C and 40 °C).
3. SOC Determination
Battery capacity can be represented by different terms. The rated capacity () represents the capacity that a fresh new battery is capable of delivering from a fully charged state until it is completely discharged, reaching the cut-off voltage under a determined C-rate and ambient temperature.
However, as the battery degrades, its capacity is reduced respect to the BOL condition, so the actual capacity () is used to describe the capacity at a determined degradation state, C-rate and temperature.
Hence the SOC can be defined as the ratio between the remaining capacity (
) and the actual capacity, usually expressed as a percentage:
The charge variation between two different points in time can be calculated by integrating the current, what is commonly known as Coulomb counting:
Thus the SOC at a determined time can be expressed as the SOC of a previous time plus the charge variation between both points in time.
The Coulombic efficiency of the battery during the charging and discharging processes depends on the current applied and the battery temperature during operation. Lower battery temperatures lead to a maximum capacity decrease while C-rate effect would have influence mainly at low temperatures. The actual capacity is established at the reference conditions (0.2C and 25 °C), this causes an inaccuracy when estimating the SOC at any other condition. A compensation factor, denoted as
, is introduced in the current integration process to normalize the SOC estimation to the reference conditions.
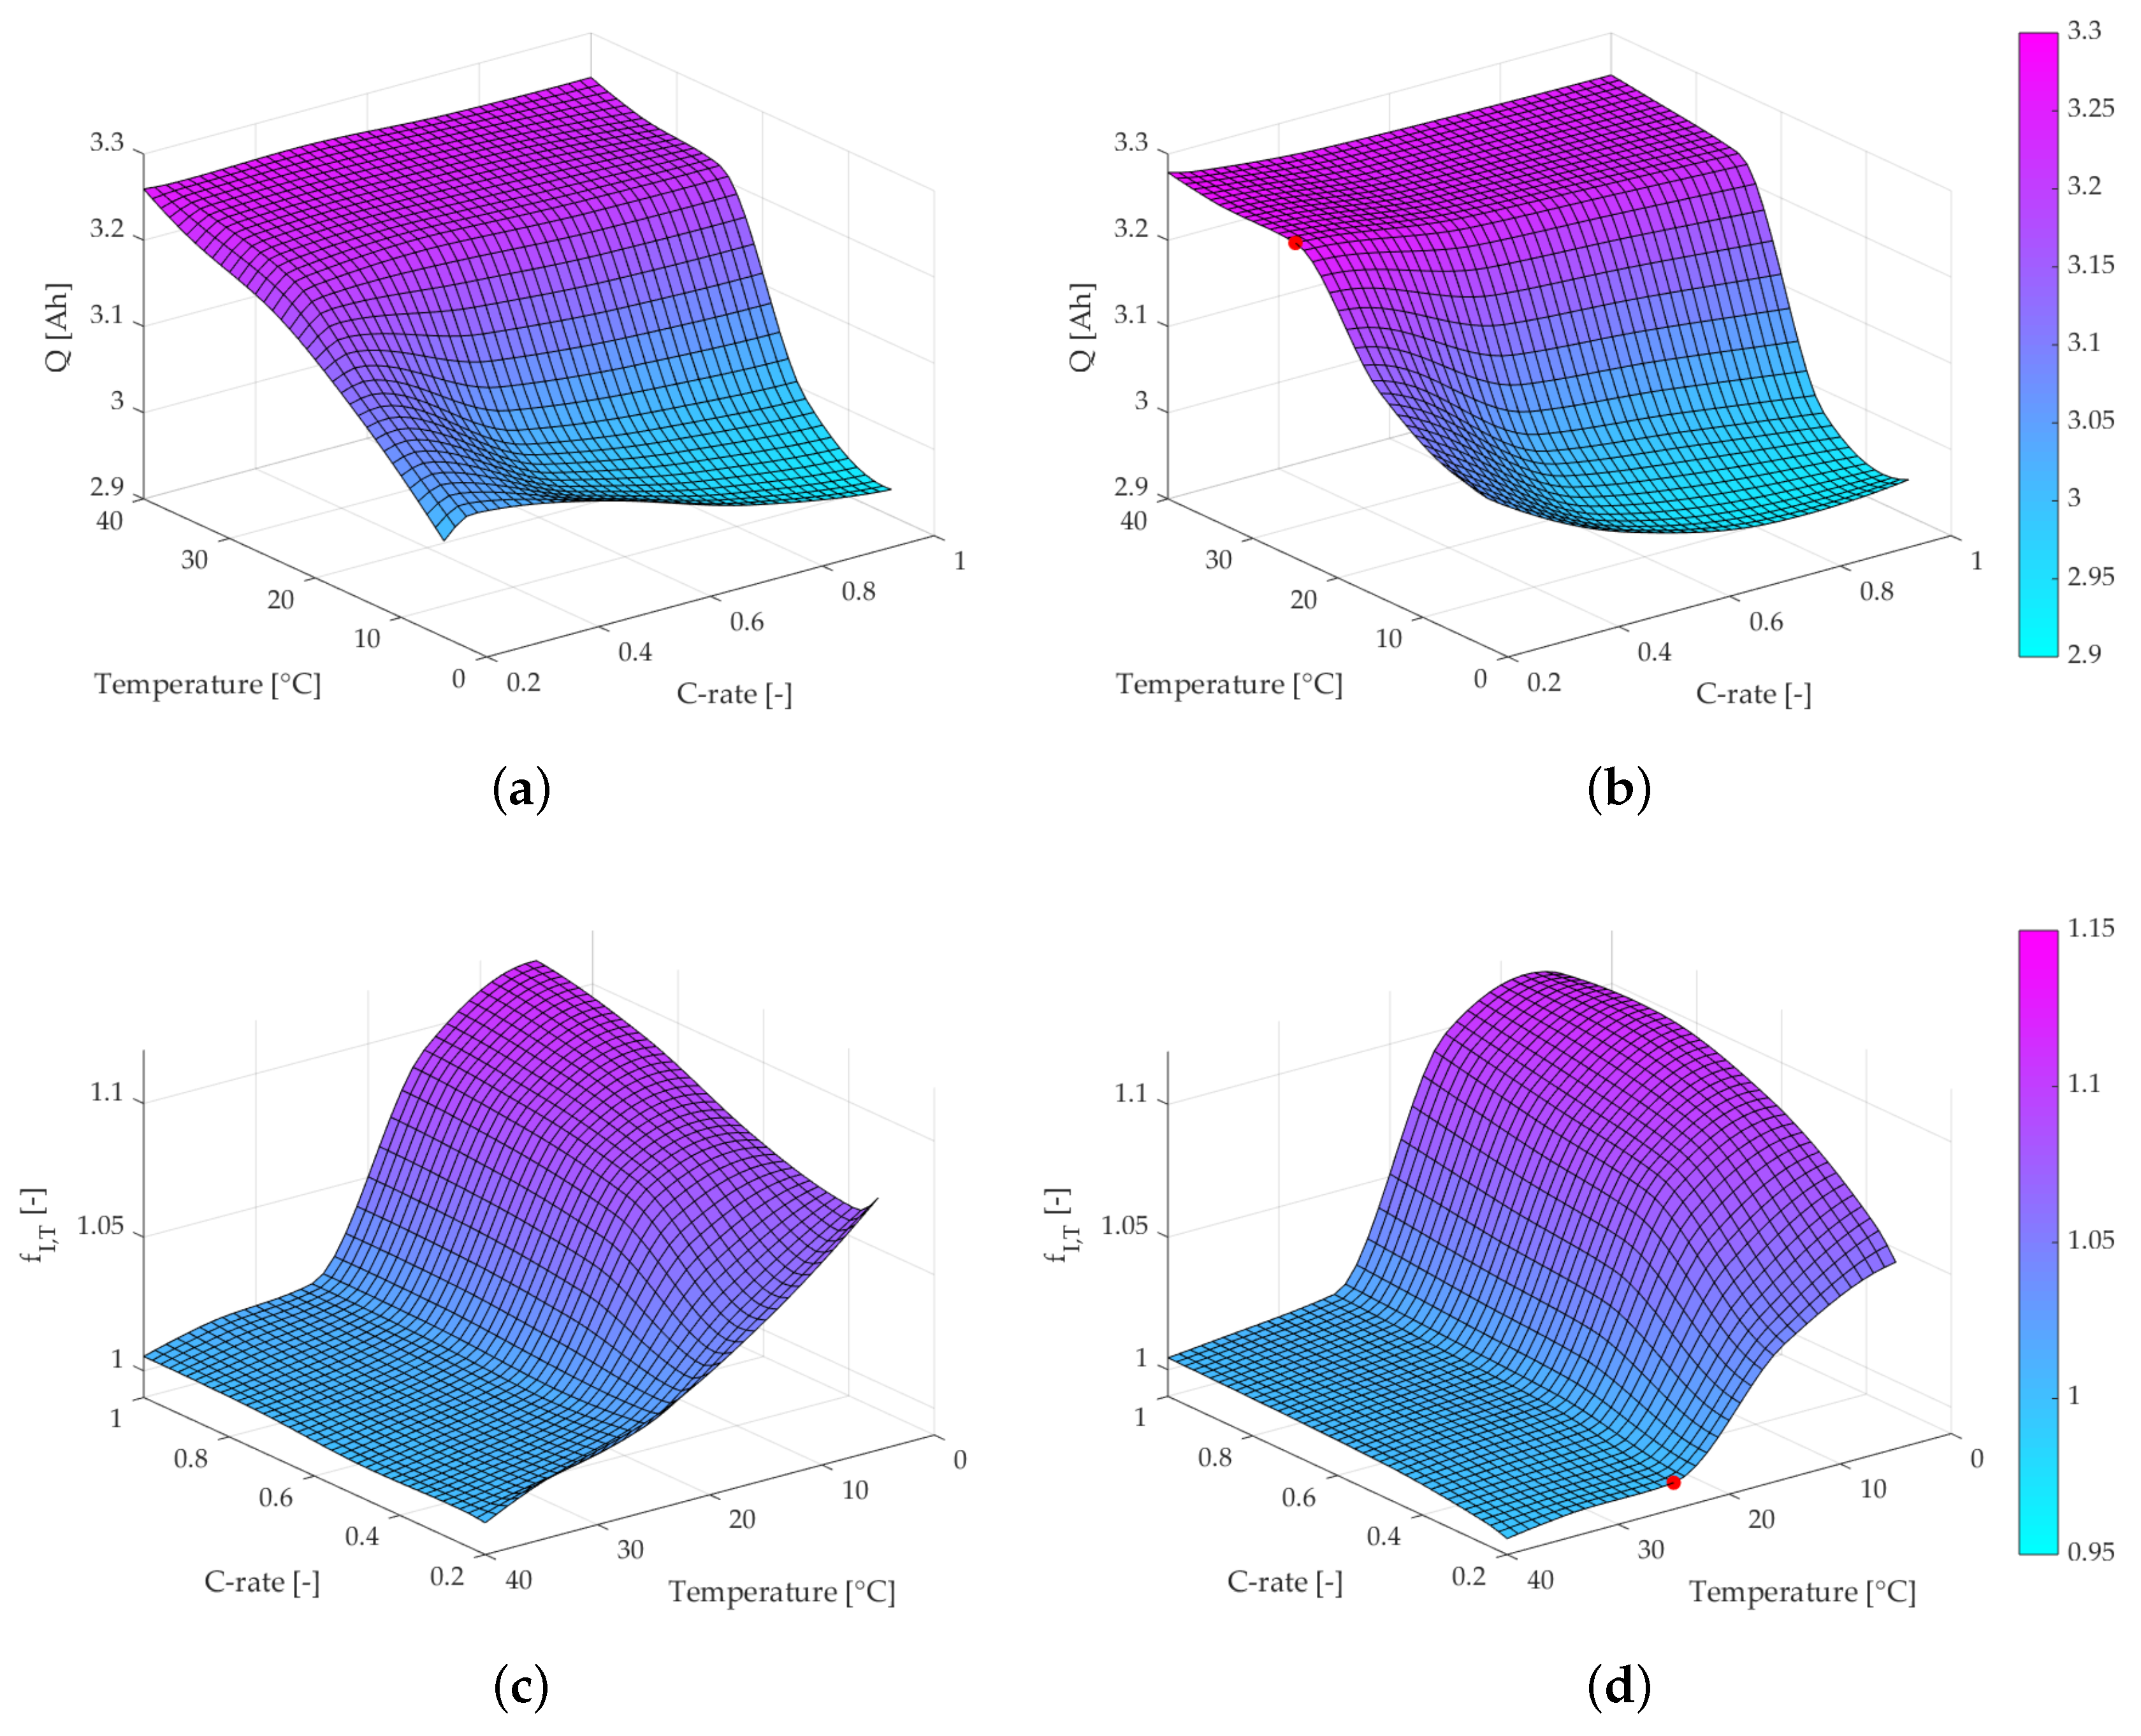
Figure 4a,b show the charge and discharge capacity at different temperature and current conditions. While temperatures above 20 °C have a minor influence on the measured capacity, lower temperatures produce a decrease in both charging and discharging capacity. High currents also lead to a capacity reduction, mostly at low temperatures. The compensation factor is defined as the ratio between the capacity at the reference condition and the capacity at the actual operating condition. In this work this relationship is assumed to be constant with the degradation of the battery and it is measured at BOL state.
Figure 4c,d show the compensation factor values used by the proposed algorithm, the red dot represents the reference conditions (0.2C and 25 °C) to establish
, so that
.
Once the use of Coulomb counting at different operation conditions is solved and the actual SOC can be estimated from the SOC of a previous time, the challenge is to avoid the cumulative errors produced by the incremental estimation. OCV-SOC relationship is used to set a new estimation starting point when the battery is at a rest period. Generally, a long relaxation time is required to measure the OCV [
9], however, measuring it at shorter rest periods can minimize the cumulative error.
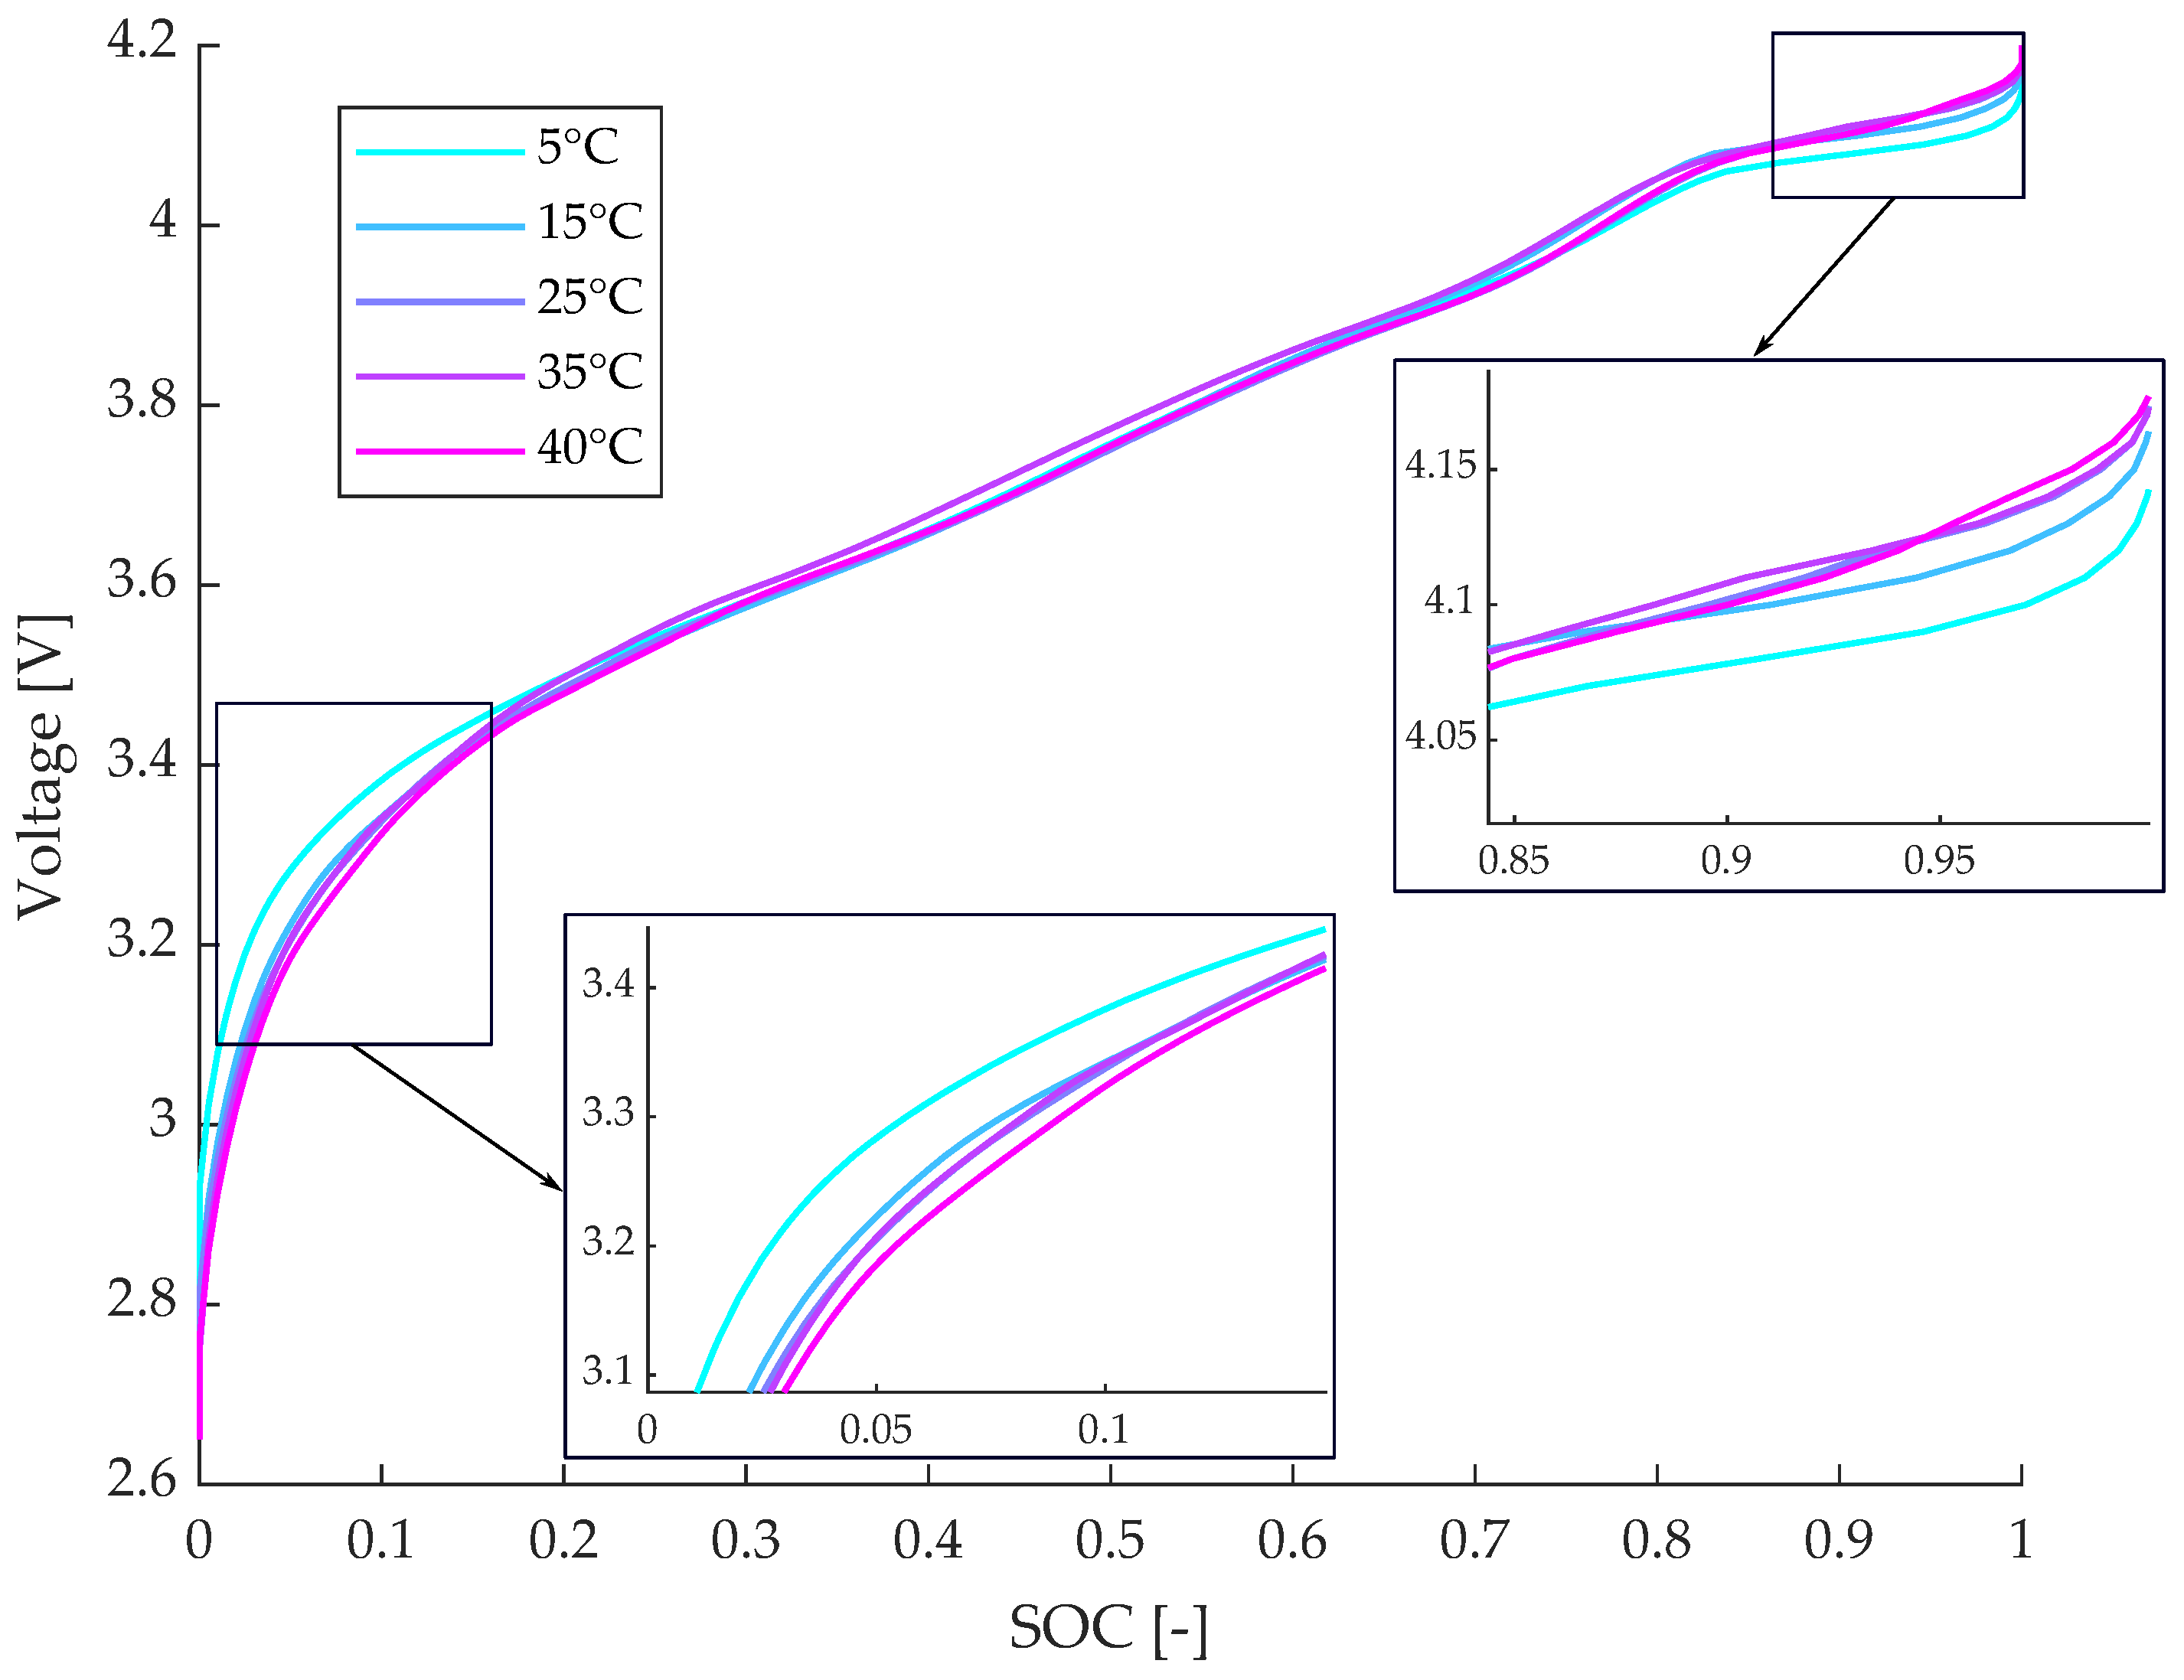
Figure 5 shows the OCV curves measured at different temperatures. The five curves show the same behavior within the 0.2–0.8 SOC range, however, lower temperatures show higher voltages at the lower end of the curve and lower voltages at the higher end. The error produced by using the OCV-SOC relationship to estimate the SOC at a different temperature could be unacceptable in these SOC ranges, especially for SOC higher than 0.8. Thus is convenient to measure the OCV at different temperatures and interpolate the battery temperature to obtain the SOC.
4. SOH Determination
In many applications it is of high importance to know the degradation level of the battery, as it determines the maximum capacity the battery is able to deliver. Furthermore, when the SOC estimation method is based on the capacity integration, knowledge of the actual capacity is crucial to ensure an accurate estimation.
Performing a full charge and discharge cycle at low current is the easiest and obvious method to get the actual capacity; however, this procedure is time-consuming and incompatible with the normal use of the battery and thus not suitable for online estimation in most cases.
As an alternative, it is possible to measure the partial capacity between two known SOC levels to infer the total capacity. Therefore, in this work it is proposed the use of Equation (
3) taking advantage of the SOC estimated by OCV, resulting in:
where,
Hence, it is possible to estimate the actual capacity of the battery by measuring the transferred charge without affecting the normal operation of the battery. The accuracy of the method will depend on the magnitude of as well as on the q measurement error, which is influenced by operating conditions (current and temperature) and the self discharging effect.
In order to minimize the error, a recursive least squares filter is used to determine the actual capacity from previous estimations as addressed in [
12]. A forgetting factor is included to give less weight to older samples.
5. Proposed Algorithm and Verification
The flow chart shown in
Figure 6 describes the process for estimating the SOC and SOH of the battery. First of all, the actual values of current, voltage and temperature are collected. If the current is different from zero, the algorithm measures the accumulated charge, compensating the temperature and the current, and estimates the SOC from it. If the value of the current is zero for a minimum time of 25 min, it is then considered to be on idle state and a look-up table is used to estimate the SOC from the OCV and temperature. Hence the active periods of the battery begin and end with an OCV-based SOC estimation. If the magnitude of the SOC increment is sufficient for a capacity estimation, the SOH is updated.
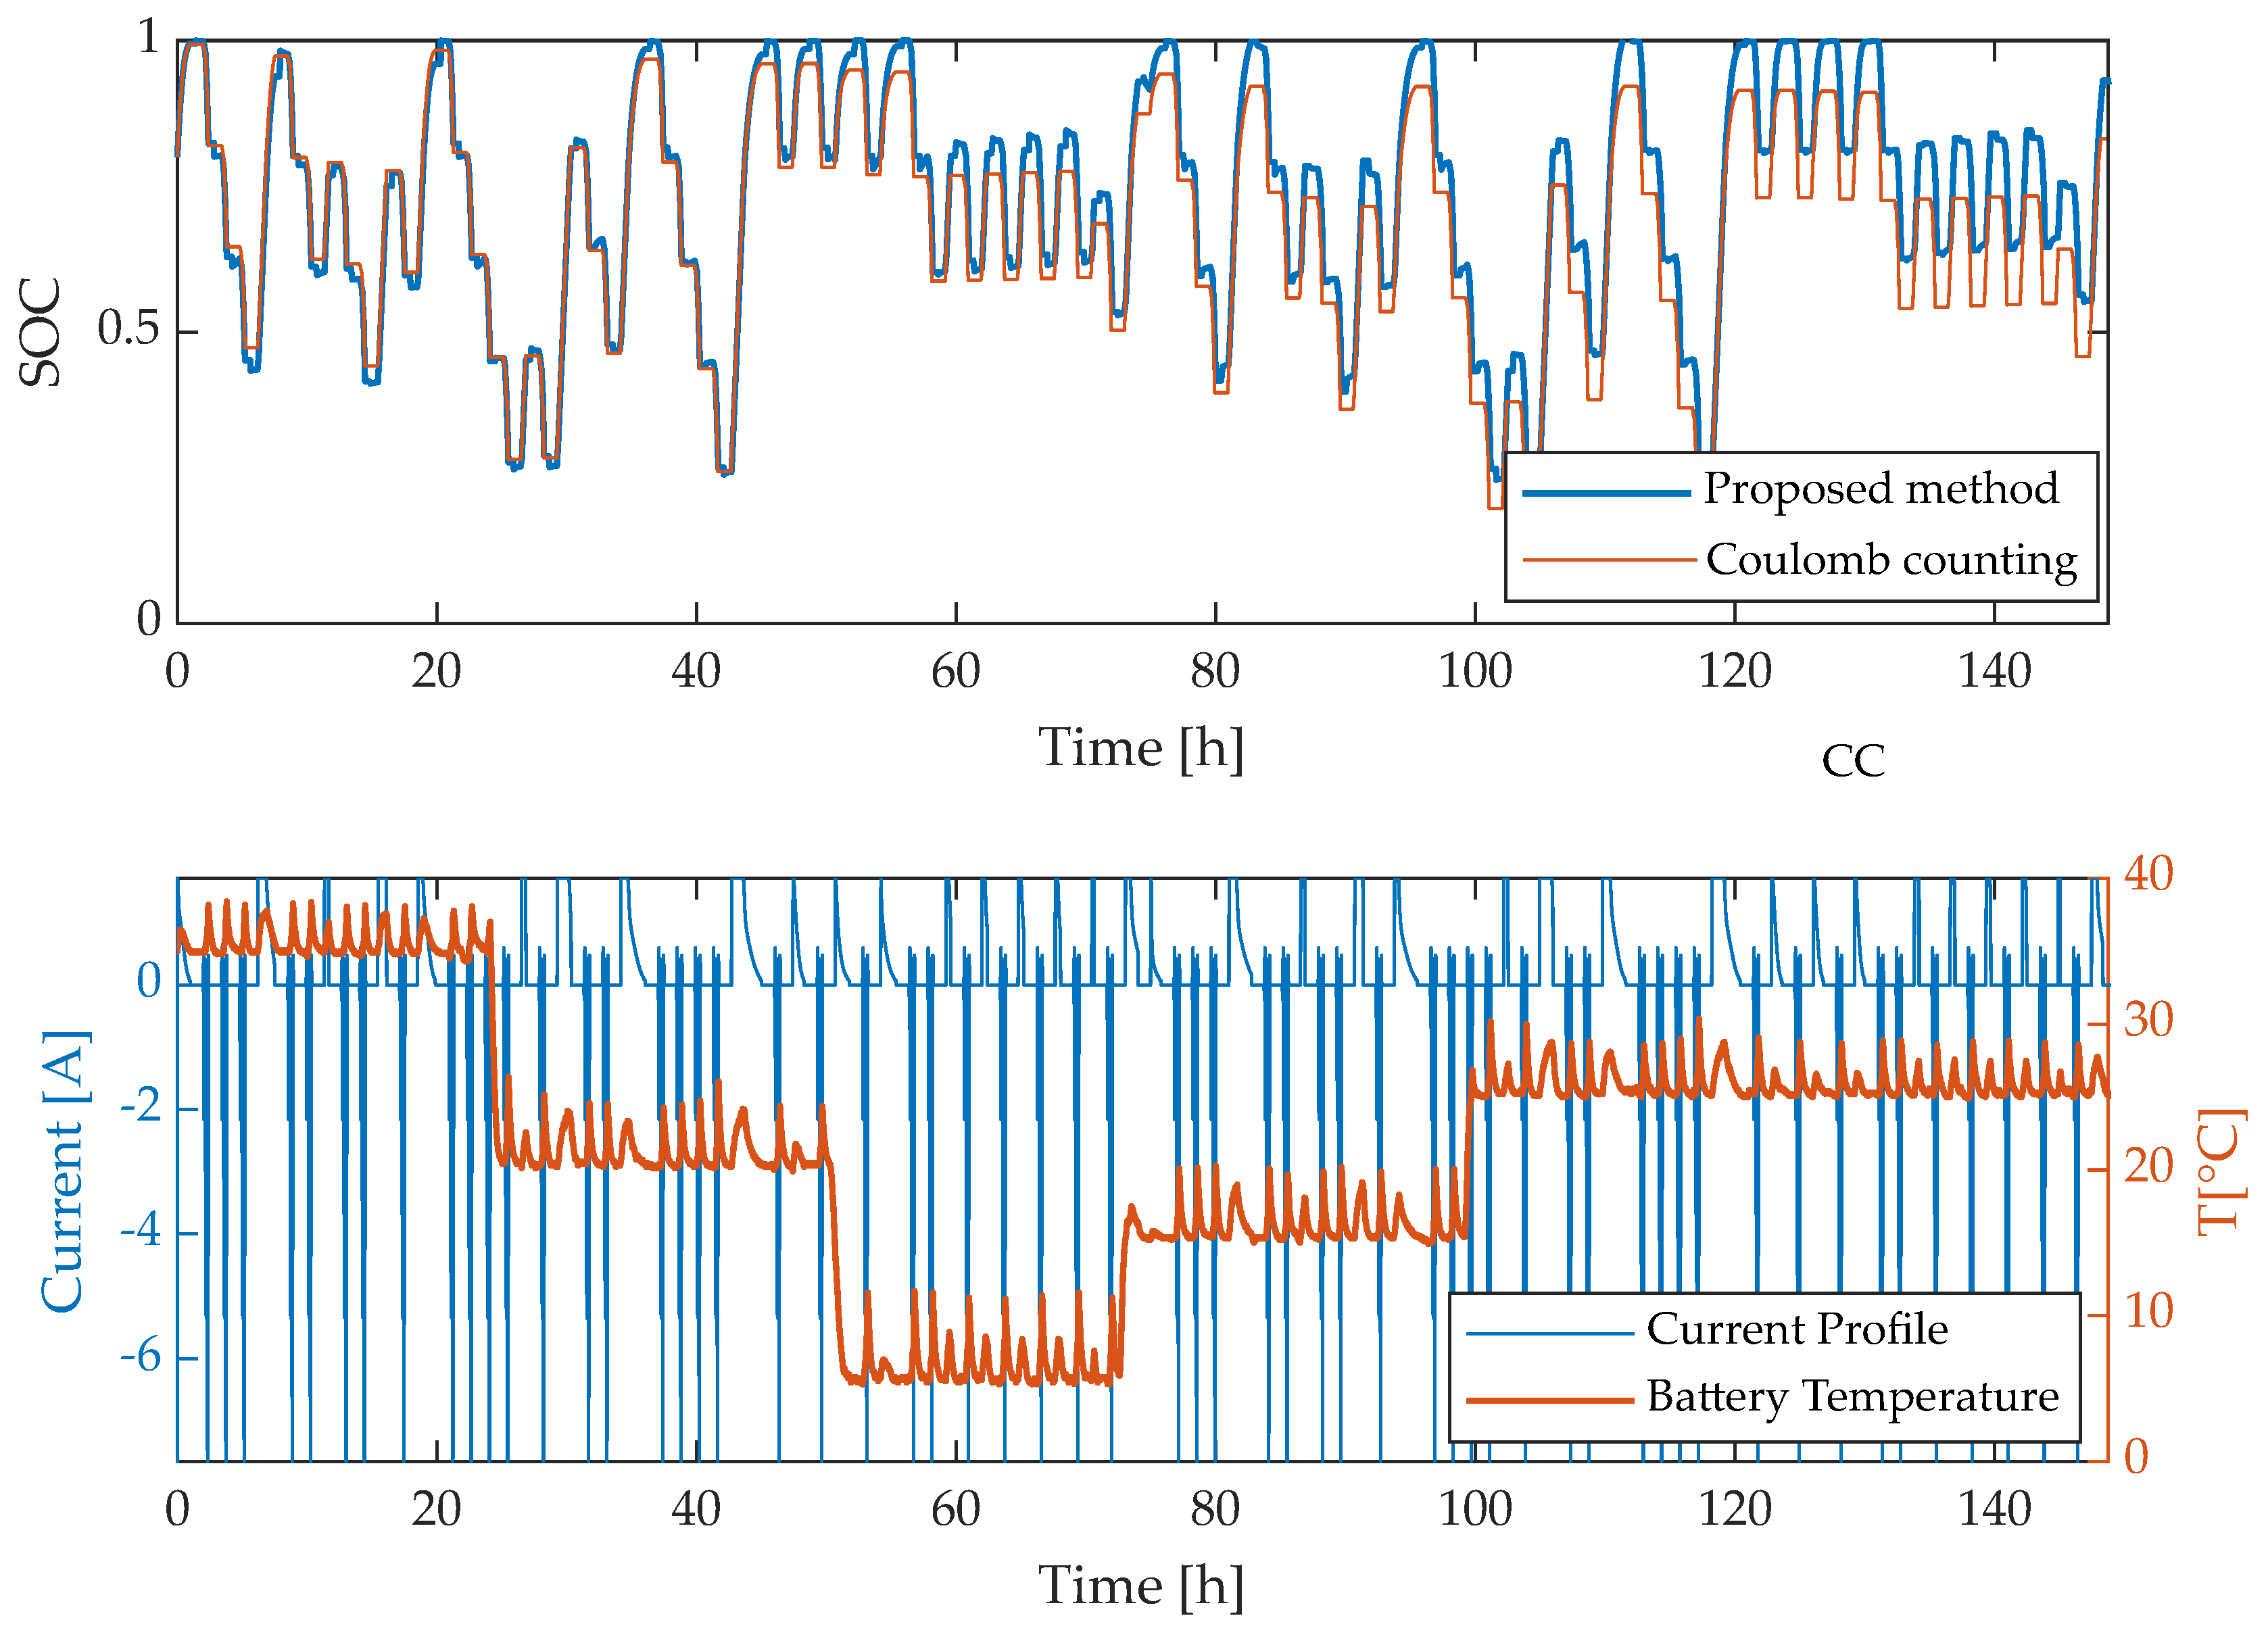
A verification test using the aged cells was designed to acquire experimental data at dynamic conditions. As shown in
Figure 7a sequence of WLTP cycles at different SOC levels is used to verify the algorithm for SOC and SOH estimation. A total of 58 cycles were performed at different temperatures, with one hour of resting between cycles and charge periods. The voltage, current and temperature of the battery are logged with 1 Hz.
Several times during the test, the battery is fully charged (CC-CV) to the 100% SOC, this state is used to evaluate the error of the method.
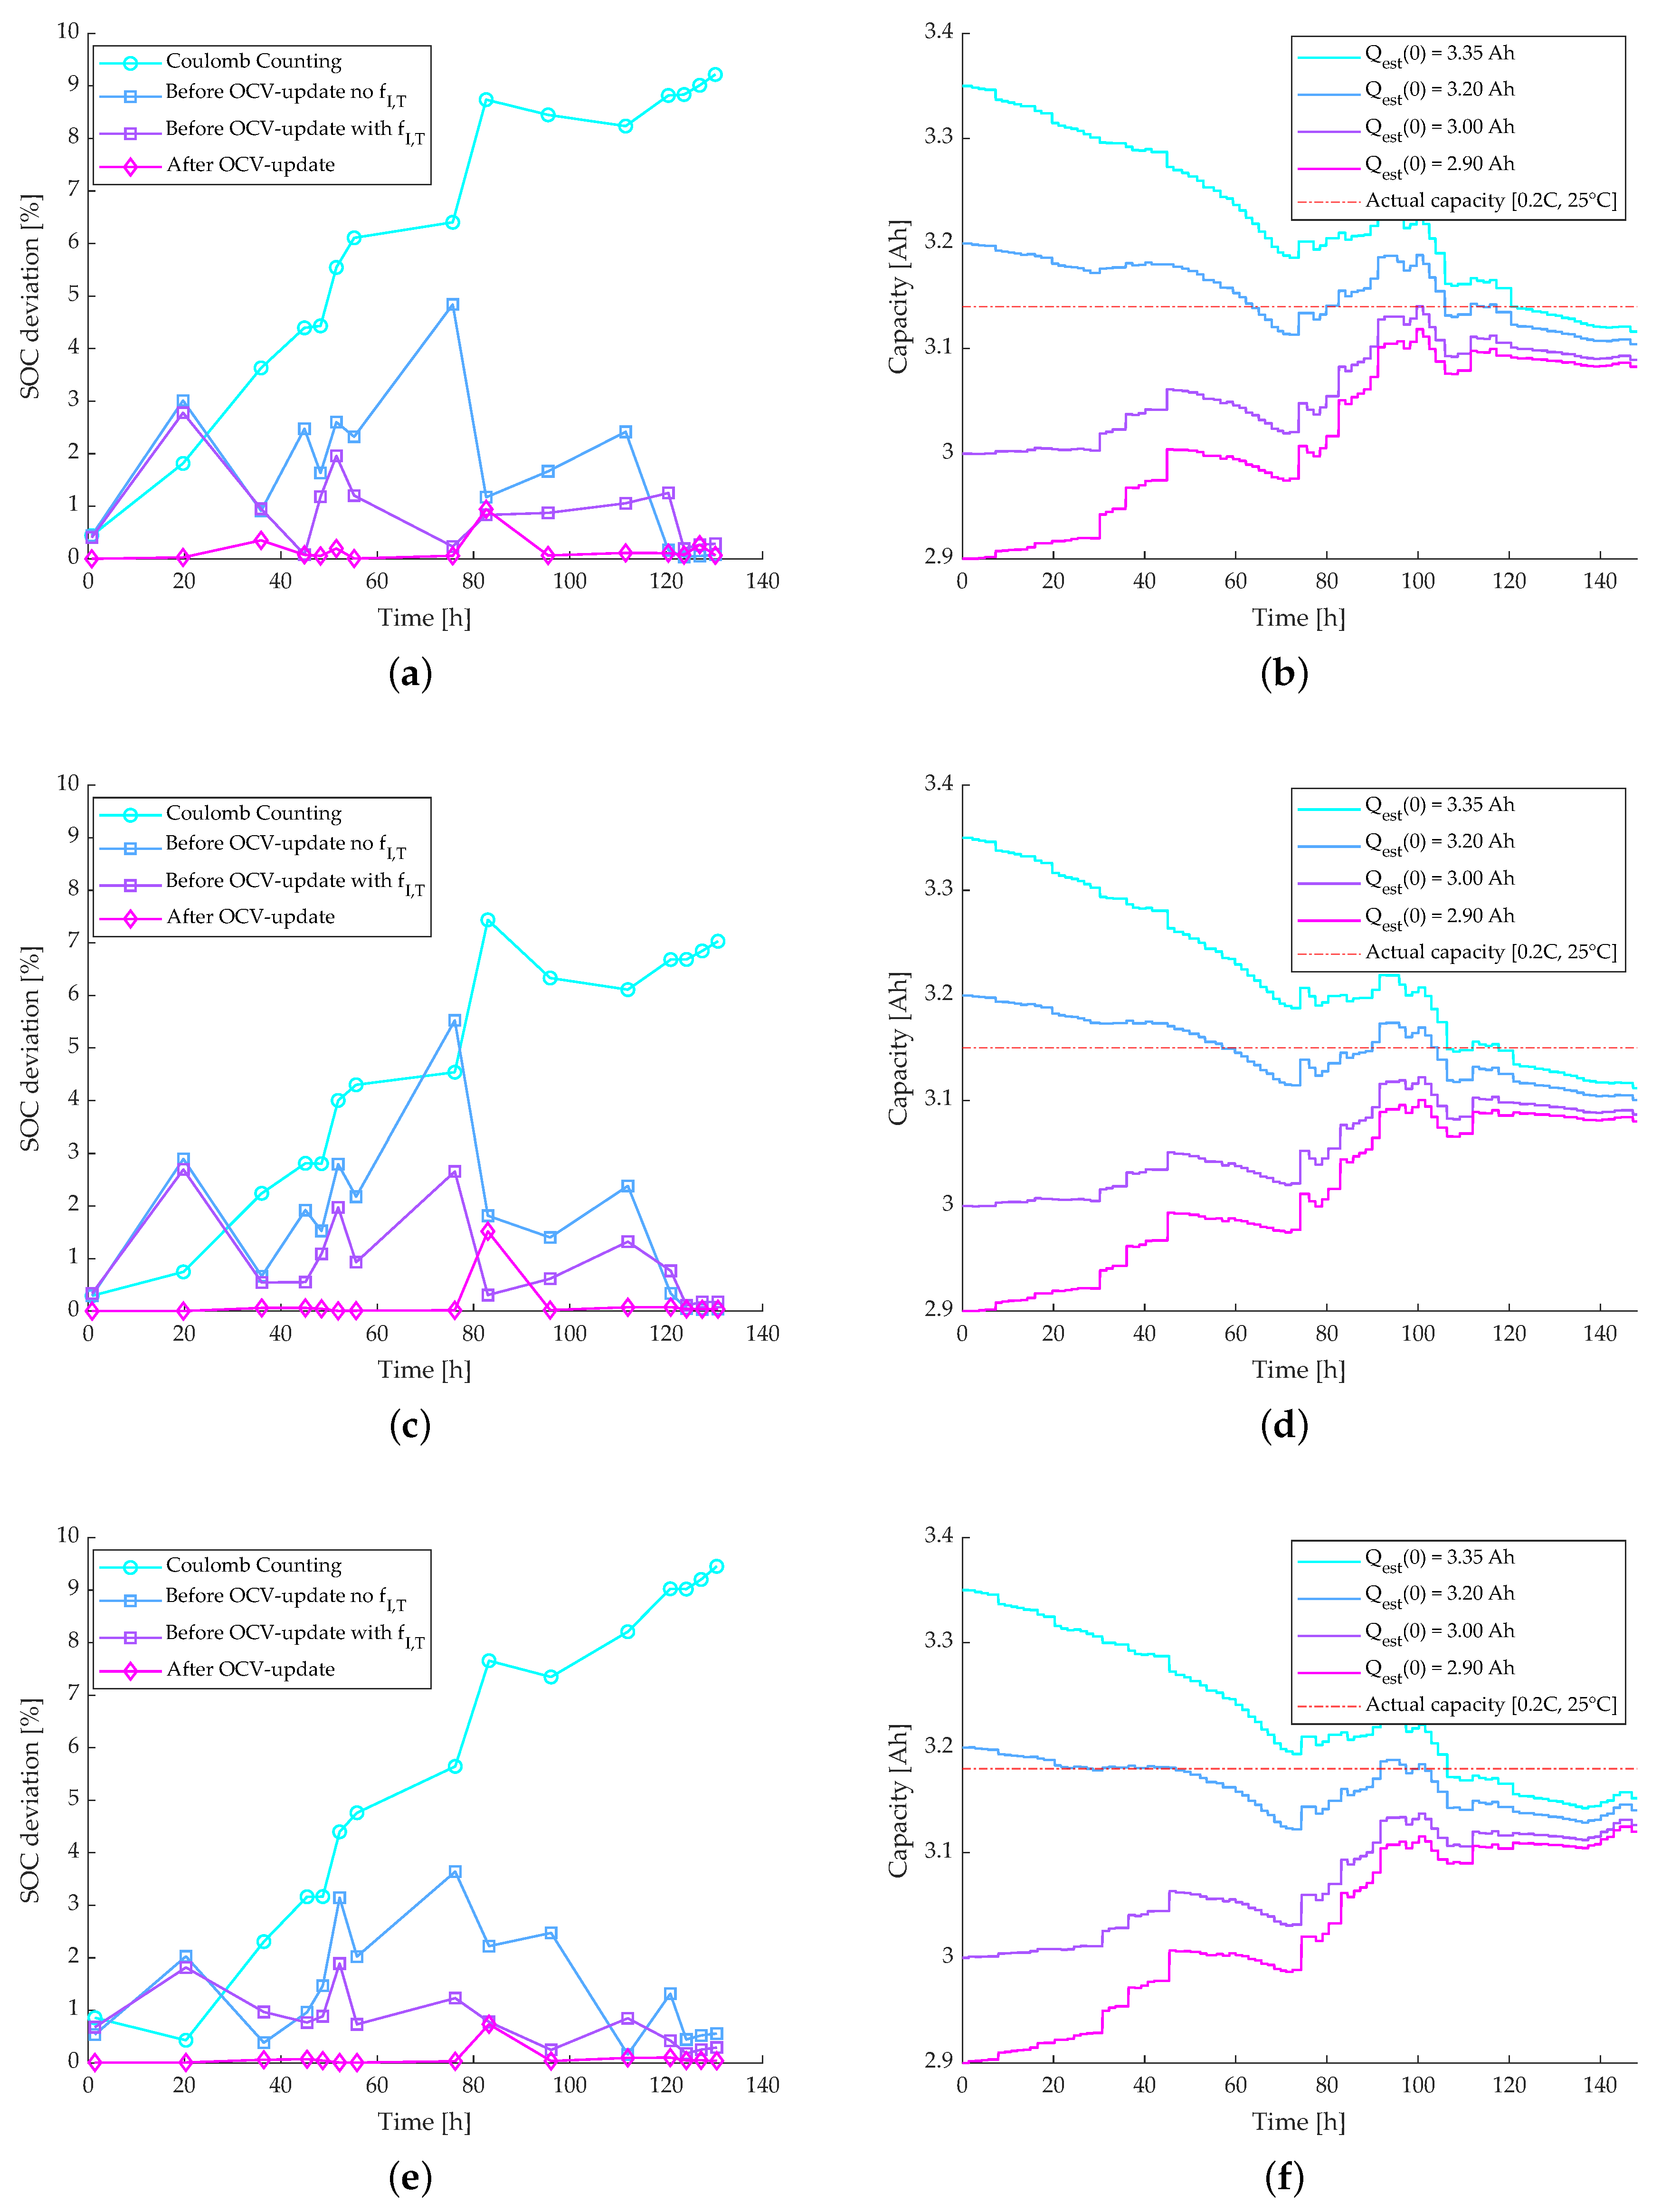
Figure 8 displays the results for the three cells aged at 35 °C, 25 °C and 15 °C respectively.
Figure 8a,c,e compare the absolute SOC error of the traditional Coulomb counting method with the proposed method, before and after updating the estimation using the OCV. The error using only Coulomb counting constantly increases with time as it is accumulated in every iteration. The use of OCV to update the estimate limits the maximum error to 5% while the compensation factor reduces it below 2.5% during the next cycle. The error after the OCV update is negligible although it could be higher in SOC areas where the OCV presents a less steeper slope.
Figure 8b,d,f display the actual capacity estimation during the verification test under different capacity starting values. Throughout the test, the four estimations converge around the same value with a maximum estimation error of 0.05 Ah for the cell aged at 25 °C. An insufficient rest time makes the algorithm over-valuate
which results in an underestimation of the capacity. This test was limited to one hour rest time for practical reasons, however, longer relaxation periods are expected to reduce the gap in a real application.
6. Conclusions
An improved coulomb counting method for estimating the SOC and SOH of Lithium-ion batteries is proposed in this work. The coulombic efficiency of charging and discharging processes of the NMC batteries used was studied for different working conditions, as well as the effect of the temperature on the OCV. The results of this analysis are the key to develop a simple but accurate estimation algorithm.
The use of the OCV-SOC relationship allows us to reset the SOC estimation more frequently and thus to reduce the accumulated error. Moreover, it provides an effective mechanism for those applications which never or rarely reach the low or high ends of the SOC range.
The relaxation period affects the estimation of the SOC and SOH. In this work the effectiveness of the proposed method was demonstrated for resting times as low as one hour, obtaining absolute errors below 3% in the SOC estimation. However, the results also reflect that the relaxation time depends on the operating conditions, requiring longer periods for lower temperatures. In future improvements of this algorithm, the use of dynamic conditions for setting the minimum relaxation time will be considered.
Author Contributions
Conceptualization, A.G., E.S. and D.-I.S.; methodology, A.G.; software, A.G.; validation, A.G.; formal analysis, A.G.; investigation, A.G.; resources, E.S. and D.-I.S.; data curation, A.G.; writing—original draft preparation, A.G.; writing—review and editing, E.S. and D.-I.S.; visualization, A.G.; supervision, E.S. and D.-I.S.; project administration, E.S. and D.-I.S.; funding acquisition, E.S. and D.-I.S. All authors have read and agreed to the published version of the manuscript.
Funding
This research was funded by Electric Mobility Europe Call 2016 (ERA-NET COFUND) and Innovation Fund Denmark grant number 7064-00011B.
Conflicts of Interest
The authors declare no conflict of interest.
Abbreviations
The following abbreviations are used in this manuscript:
| BMS | Battery Management System |
| BOL | Beginning Of Life |
| CC | Constant Current |
| CV | Constant Voltage |
| NMC | Nickel Manganese Cobalt Oxide |
| RLS | Recursive Least Squares |
| RPT | Reference Performance Test |
| OCV | Open Circuit Voltage |
| SOC | State of Charge |
| SOH | State of Health |
| WLTP | World Harmonized Light-duty Vehicle Test Procedure |
References
- Stroe, A.I.; Knap, V.; Stroe, D.I. Comparison of lithium-ion battery performance at beginning-of-life and end-of-life. Microelectr. Reliab. 2018, 88–90, 1251–1255. [Google Scholar] [CrossRef]
- Bubbico, R.; Greco, V.; Menale, C. Hazardous scenarios identification for Li-ion secondary batteries. Saf. Sci. 2018, 108, 72–88. [Google Scholar] [CrossRef]
- Hannan, M.; Lipu, M.; Hussain, A.; Mohamed, A. A review of lithium-ion battery state of charge estimation and management system in electric vehicle applications: Challenges and recommendations. Renew. Sustain. Energy Rev. 2017, 78, 834–854. [Google Scholar] [CrossRef]
- Ng, K.S.; Moo, C.S.; Chen, Y.P.; Hsieh, Y.C. Enhanced coulomb counting method for estimating state-of-charge and state-of-health of lithium-ion batteries. Appl. Energy 2009, 86, 1506–1511. [Google Scholar] [CrossRef]
- Dang, X.; Yan, L.; Jiang, H.; Wu, X.; Sun, H. Open-circuit voltage-based state of charge estimation of lithium-ion power battery by combining controlled auto-regressive and moving average modeling with feedforward-feedback compensation method. Int. J. Electr. Power Energy Syst. 2017, 90, 27–36. [Google Scholar] [CrossRef]
- Lee, J.; Nam, O.; Cho, B. Li-ion battery SOC estimation method based on the reduced order extended Kalman filtering. J. Power Sources 2007, 174, 9–15. [Google Scholar] [CrossRef]
- Zhi, L.; Peng, Z.; Zhifu, W.; Qiang, S.; Yinan, R. State of Charge Estimation for Li-ion Battery Based on Extended Kalman Filter. Energy Procedia 2017, 105, 3515–3520. [Google Scholar] [CrossRef]
- Wassiliadis, N.; Adermann, J.; Frericks, A.; Pak, M.; Reiter, C.; Lohmann, B.; Lienkamp, M. Revisiting the dual extended Kalman filter for battery state-of-charge and state-of-health estimation: A use-case life cycle analysis. J. Energy Storage 2018, 19, 73–87. [Google Scholar] [CrossRef]
- Stroe, D.I.; Swierczynski, M.; Stroe, A.I.; Knudsen Kaer, S. Generalized Characterization Methodology for Performance Modelling of Lithium-Ion Batteries. Batteries 2016, 2, 37. [Google Scholar] [CrossRef] [Green Version]
- Stroe, D.; Swierczynski, M.; Kær, S.K.; Teodorescu, R. Degradation Behavior of Lithium-Ion Batteries During Calendar Ageing—The Case of the Internal Resistance Increase. IEEE Trans. Ind. Appl. 2018, 54, 517–525. [Google Scholar] [CrossRef] [Green Version]
- Einhorn, M.; Conte, F.V.; Kral, C.; Fleig, J. A Method for Online Capacity Estimation of Lithium Ion Battery Cells Using the State of Charge and the Transferred Charge. Ind. Appl. IEEE Trans. 2010, 48, 736–741. [Google Scholar] [CrossRef]
- Plett, G.L. Battery Management Systems; Artech House: Norwood, MA, USA, 2016; Volume 2. [Google Scholar]
© 2020 by the authors. Licensee MDPI, Basel, Switzerland. This article is an open access article distributed under the terms and conditions of the Creative Commons Attribution (CC BY) license (http://creativecommons.org/licenses/by/4.0/).


