Article

Experimental Assessment of Flow, Performance, and Loads for Tidal Turbines in a Closely-Spaced Array

1
School of Engineering, Institute for Energy Systems, The University of Edinburgh, Edinburgh EH9 3FB, UK
2
Department of Mechanical, Aerospace and Civil Engineering, The University of Manchester, Manchester M13 9PL, UK
*
Authors to whom correspondence should be addressed.
Submission received: 9 February 2020 / Revised: 27 March 2020 / Accepted: 8 April 2020 / Published: 16 April 2020
(This article belongs to the Section A3: Wind, Wave and Tidal Energy)

Abstract

:
Tidal stream turbines are subject to complex flow conditions, particularly when installed in staggered array configurations where the downstream turbines are affected by the wake and/or bypass flow of upstream turbines. This work presents, for the first time, methods for and results from the physical testing of three 1/15 scale instrumented turbines configured in a closely-spaced staggered array, and demonstrates experimentally that increased power extraction can be achieved through reduced array separation. A comprehensive set of flow measurements was taken during several weeks testing in the FloWave Ocean Energy Research Facility, with different configurations of turbines installed in the tank in a current of 0.8 m/s, to understand the effect that the front turbines have on flow through the array and on the inflow to the centrally placed rearmost turbine. Loads on the turbine structure, rotor, and blade roots were measured along with the rotational speed of the rotor to assess concurrently in real-time the effects of flow and array geometry on structural loading and performance. Operating in this closely-spaced array was found to improve the power delivered by the rear turbine by 5.7–10.4% with a corresponding increase in the thrust loading on the rotor of 4.8–7.3% around the peak power operating point. The experimental methods developed and results arising from this work will also be useful for further scale-testing elsewhere, validating numerical models, and for understanding the performance and loading of full-scale tidal stream turbines in arrays.

Graphical Abstract

1. Introduction

Full-scale tidal current turbines have now been installed in small arrays, generating and exporting electricity to the local network for several years, both with individual unit capacity up to 1.5 MW [1], and smaller 100 kW units operated in an array in Shetland since 2016 [2]. These are demonstrating full-scale devices at pre-commercial status, corresponding to a technology readiness level of 6–7. The UK Crown Estate has granted seabed leases for 30 tidal current developments which, for commercial scale, will be deployed in arrays. For efficient use of the seabed the arrays may be closely spaced. For commercial operation this will require arrays of multiple devices. It is therefore important to understand the hydrodynamic (and potential electro-dynamic) interaction between these turbines, including the potential to increase the overall power generated by a carefully optimised layout of the array. Tank testing of instrumented scaled models provides the opportunity to explore these physical effects in a relatively low-cost, repeatable, controlled laboratory environment, which can be used to complement and validate computer numerical modelling of potential array concepts.
This paper presents the methods employed and results from a significant experimental campaign that shows how the flow conditions in the FloWave current and wave test tank (EP/I02932X/1) are modified by the presence of and energy extracted by an array of three 1.2 m rotor diameter 1/15 scale model tidal turbines. These turbines were made and tested at the University of Edinburgh, as part of the work of the EPSRC-sponsored SuperGen UK Centre for Marine Energy Research (EP/I027912/1), each identical with a 3-bladed horizontal axis turbine and four-quadrant controlled power take-off. The diameter-based Reynolds Number, Equation (1), for all tests was 1.08 × 10 6 , where ρ is the density and μ the kinematic viscosity of water.
R e D = ρ U ¯ D μ .
The flow measurements were made at over 150 spatial locations for four array installation configurations: with one, two, or three turbines installed, plus baseline empty tank measurements. This paper also reports the results of the investigation of how power developed and loading on the rear turbine were influenced both by the presence and defined operation of the front row turbines.
The results presented in this work arise from some of the largest laboratory-scale array tests of tidal current turbines undertaken or published to date. Testing at this large scale is necessary to reduce scale effects and to provide more representative understanding of full-scale turbine performance and loading in the sea.
The remainder of the paper is laid out as follows: Section 1.1 and Section 1.2 summarise other relevant work on testing arrays of turbines, Section 2 describes the experimental set-up, methods, and analysis methods. The results obtained are covered in Section 3 and Section 4, considering first the influence of the turbine array on flow velocities, and then how this affects loading and power. Section 5 discusses the relevance and implications of these findings, followed by the conclusions that may be drawn in Section 6.

1.1. Previous Studies of Tidal Stream Turbine Arrays

The commercial deployment of tidal energy farms that is underway requires the deployment of arrays of multiple tidal current turbines in close proximity to one another, mandating an improved understanding of the interaction between individual turbines. A review of issues encountered when designing large arrays of tidal turbines was conducted by Vennell et al. [3], including a summary of key numerical modelling studies.
Due to the complex nature of turbulent flow around the machines in an array of rotating turbines, scale model testing is important to explore the physical processes, understand the modifications to the flow field, measure and characterise turbine performance and loading—with the resulting data and knowledge essential to validate numerical models.
Some previous tank tests of tidal turbine arrays have used static porous actuator disks to represent the energy extraction by the turbines [4,5,6]. In other tests, arrays of relatively small turbines (typically less than 0.4 m in diameter) have been used [7,8,9,10], with [9,10] considering cross-flow turbines and where the water depth was not scaled. A configuration with two 0.7 m diameter turbines, one directly in the wake of the other, has been tested in a flume [11,12]. Subsequently, Gaurier et al. [13] tested three of these turbines in a staggered array similar to the one presented in this work, but with 2 D separation between the front turbines and the rear located 4 D downstream. It is noted that in [7,8,11,12,13], the turbines were tested suspended from above the free surface, rather than bed-mounted, and only the thrust on the whole turbine and support structure was measured. Recently, two 1.2 m diameter turbines were tested at FloWave in a side-by-side configuration to assess the potential for constructive interference effects between them, which showed an increase in both power and thrust [14].
Apart from the above, the authors are not aware of other published studies of arrays of multiple large-scale turbines (≳ 1 m diameter), highlighting the novelty of this work. Indeed the lack of data showing multi-turbine wake interactions was stated in [7]. As mentioned, the only other large three-turbine array tests were presented in [13], where the downstream separation was 4 D and the blockage induced by the two upstream turbines was 9.6 % . They show detailed velocity measurements and turbine performance for two turbulence intensities and different lateral offsets of the rear turbine. In this current work, we explore a single array configuration with a downstream separation of just 1 D ; exploring the implications of a highly compact array configuration. The blockage introduced by the upstream turbines is 4.5 % , noting that blockage corrections are considered necessary above 5 % [15].

1.2. Other Studies Using the Supergen UKCMER Tidal Turbines

The method and results of the experimental study presented here are from measurements made on a fully instrumented turbine installed as part of an array and subjected to realistic flow conditions in the FloWave combined current and wave test tank. Previous studies have demonstrated the design and results obtained from this turbine operating singly, not as part of an array [16,17,18]. Other results from this experimental campaign, exploring and reporting the influence of wave loading on a single turbine, are presented in [19,20,21].

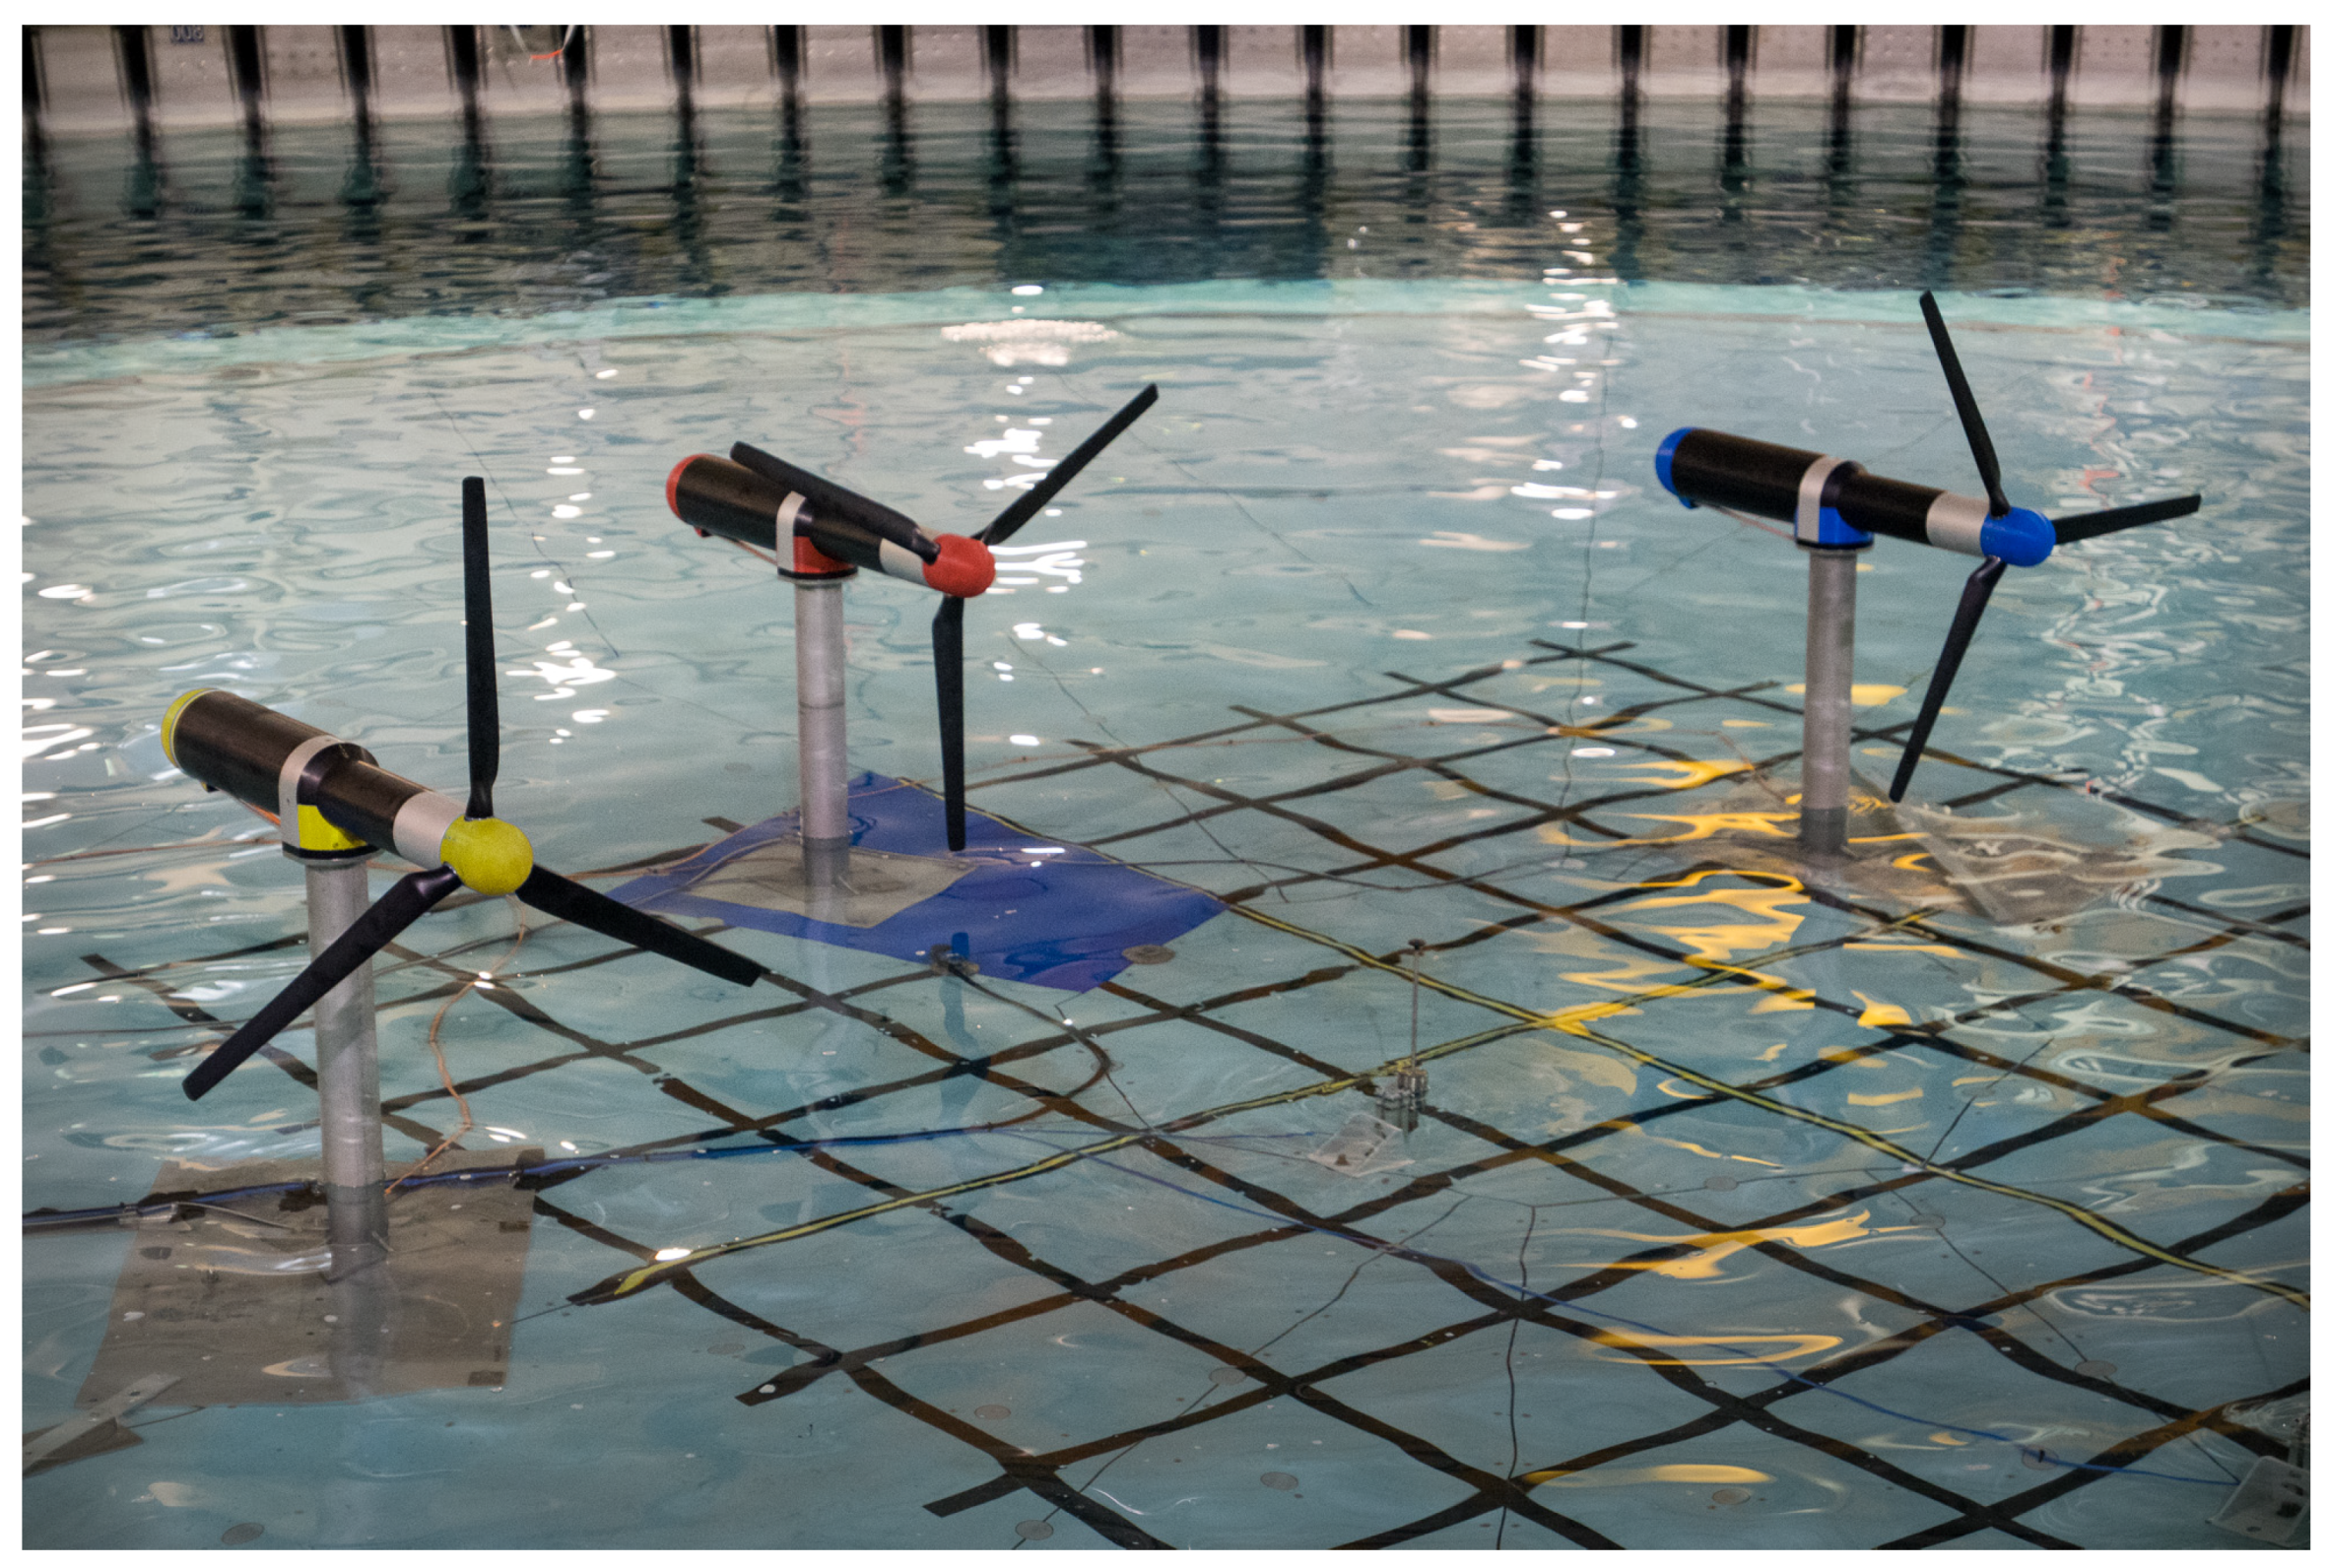
2. Experimental Set-Up and Methods

2.1. The FloWave Ocean Energy Research Facility

All the experimental work discussed in this paper was carried out at the FloWave Ocean Energy Research facility at the University of Edinburgh [22]. FloWave comprises a 25 m diameter circular tank, with an operating water depth of 2 m. In the centre is a 15 m diameter buoyant floor, that can be raised out of the water for model installation. A movable gantry spans across the tank, used to provide access to the floor and for mounting instrumentation.
As shown in Figure 1, currents are generated by 28 impeller units mounted in the plenum chamber below the test floor. The flow is directed across the test volume of the tank by turning vanes mounted around the outside of the floor, below and in front of the wavemakers. Full details of the flow generation are given in Robinson et al. [23,24].
Due to the method of generating flow in a circular tank, there is some spatial variation of the mean flow across the test area. Characterisation by Noble et al. [25] shows there is a ∼50 m2 region of relatively straight uniform flow ( ± 10 % ) in the tank centre. Baseline turbulence characterisation of the tank’s test area was conducted by Sutherland et al. [26]. Turbulence intensity I U at 0.8 m/s is 5–10% and integral lengthscale U is typically in the range 0.1 m to 0.5 m. At the primary turbine location these values are approximately 8% and 0.3 m.
The flow in the tank was set at the design flow speed of the turbine model [17], nominally 0.8 m/s inflow at a hub-height location without the turbine installed in the tank, which is consistent with previous tests with a single turbine [18]. This corresponds to a full-scale flow speed of 3.1 m/s.

2.2. Turbines and Instrumentation

An array of three similar turbines was used in these tests, one fully instrumented primary turbine with two additional turbines upstream to alter the inflow conditions as would happen in an array.
The turbines are a generic bed-mounted horizontal-axis three-bladed design, representative of many turbines proposed, modelled, or installed to date (e.g., [1,27]). The turbine models are nominally 1:15 scale, corresponding to an 18 m diameter prototype. The design and manufacture of one of the model turbines used for these tests, including on-board instrumentation, is fully described in Payne et al. [17]. The blades have been designed to provide a rotor thrust coefficient similar to a full-scale generic turbine across a range of turbine rotational speeds. A summary of key turbine dimensions is provided in Table 1. To simulate the power take-off, a brushless servo motor is connected in a direct-drive set-up, i.e., without gearbox. The servo motor was operated in speed control and was controlled using an ABB MotiFlex e180 servo drive [28]. Torque and thrust on the whole rotor is measured via a transducer connected to the hub, with absolute angular position of the blades measured through an encoder on the motor shaft. For the primary turbine only, streamwise root bending moment (RBM) sensors are also fitted to each blade. The Turbine instrumentation was logged at 256 Hz. Note that all the measurements reported in this paper were made upstream of the servo drive.
The fully instrumented primary turbine (red fairing in Figure 2) was mounted on a six degree of freedom load-cell to measure forces and moments on the foundation (although not used in this analysis). This load-cell is flush-mounted within the tank floor, which dictates the location of this turbine, with the tower offset ∼ 1.6 m downstream and ∼ 0.5 m to the side of the tank centre.

2.3. Array Configurations

To investigate array effects on the primary turbine, two additional identical turbines were placed upstream to alter the inflow, as shown in Figure 3. The hubs of the front turbines were positioned one rotor diameter ( 1 D ) upstream and 1.5 D either side of the primary turbine hub, giving a transverse separation of 3 D .
The flow measurements and loading tests were conducted for three array configurations (AC) as shown in Figure 3: AC1 with only the primary turbine installed; AC2 with the front two turbines but not the primary turbine; and AC3 with the full three turbine array. The location of each specific turbine was kept constant in all cases. For baseline comparison, the flow was measured in the tank without any turbines installed, shown as configuration AC0 in Figure 3.
The blockage ratio, defined as the turbine blade swept area relative to the tank cross-sectional area, is approximately 2.3 % for each turbine, giving 4.6 % upstream blockage to the primary turbine, and 6.8 % total blockage for the combined three turbine array. The horizontal dimension of the tank is large enough that the edges of the tank have a limited impact on the bypass flow around turbines. The vertical scale of the rotor diameter to water depth was designed to be similar to that for real turbine installations (e.g., [29,30], which is important to accurately model the interaction between tidal stream turbines, as in this study.
The local coordinate system used for these tests has the origin at the primary turbine hub, with X positive in the streamwise direction. Distances are normalised by the turbine diameter D of 1.2 m.

2.4. Flow Measurements

Flow measurements were obtained through acoustic Doppler velocimetry using a Nortek Vectrino Profiler ADV [31] at 100 Hz sample rate. The short-range profiling capability of the instrument was not used for these tests, with only a single measurement point used. The tank was periodically seeded with neutrally-buoyant glass micro-spheres to produce and maintain the mean correlation between beams > 95 % . The velocity range was set to 1.8 m/s to prevent wrapping due to high velocity spikes.
For this study, point measurements of flow were taken at various locations to characterise the inflow, wake, and region between the turbines. All flow measurements were taken at hub height, 1 m ( 0.83 D ) above the tank floor. Flow in the tank was allowed to reach steady-state before any measurements were made. A 256 s measurement of U , V , W velocity components was used to characterise the flow at each point of interest, based on previous experience at FloWave [26].
The flow measurement data were processed to remove outlier spikes using the MATLAB ‘despiking toolbox’ implemented in Mori et al. [32] based on the method of Goring and Nikora [33]. The mean value of each 25,600 sample flow measurement was taken for the streamwise, transverse, and vertical velocity components U ¯ , V ¯ , W ¯ , with the standard deviation σ U , and turbulence intensity I U (Equation (2)) calculated for the streamwise component.
I U = σ U U ¯ .
Due to time constraints and other investigation priorities, the number and position of flow measurement points varies slightly between array configurations. It was not possible to measure flow within 0.3 m of the turbine rotor. Table 2 summarises the specifications of the instrumentation used in the test programme.

3. Influence of Turbine Arrays on Flow Conditions

The first part of the results investigates the influence of the different turbine array configurations on the flow conditions in the tank, with a focus on the inflow conditions for the primary turbine. All flow measurements are taken at hub height, and the turbines were operated at their design speed of 90 rpm for these tests. Flow through the turbine array is influenced by the turbines, therefore rotational speeds of the turbines are quoted in rpm, rather than tip-speed ratio (TSR), in all the results discussed in this paper. A nominal TSR can be calculated for reference based on the nominal inflow velocity of 0.8 m/s.

3.1. Spatial Analysis of Flow Variation

The influence of the turbine arrays on both inflow and wake along the centreline of the array in the streamwise direction is shown in Figure 4, for the four configurations described in Figure 3. For all cases with turbines in the tank, there is an inflow deficit to the array of 0.05– 0.1 m/s (5–12%) upstream of X / D = - 1 . This is most pronounced for the three turbine array with a higher overall blockage. With just the two front turbines in the tank (configuration AC2) the flow velocity at the location of the rear turbine rotor X / D = 0 is similar to the empty tank baseline (AC0). This demonstrates the flow acceleration between the two front turbines. For the single and triple turbine arrays (AC1 and AC3) there is a significant wake deficit. For the three-turbine array, this deficit is reduced, showing the influence of the increase in flow velocity persisting through to the primary turbine.
There is a limited impact of the turbines on inflow fluctuations, characterized by σ U and I U , which are similar to the empty tank conditions (AC0). Downstream of the array, the increased turbulence in the wake is clearly visible in Figure 4, with I U > 20 % compared to the empty tank baseline of 6%. Interestingly I U appears similar or greater for the single turbine compared to the triple turbine array, despite increased σ U for the latter. This can be attributed to the way I U is defined as a function of flow velocity (Equation (2)), and the reduced wake deficit for the triple turbine array.
Due to the re-circulation of currents at FloWave [22,23], consideration was given to blockage in the tank and how this affects the flow re-circulation. Figure 5 shows the wake of a single turbine as a function of rpm, with more blockage and higher wake deficit at higher rpm, as would be expected. The inflow does not show a significant variation with rpm however, suggesting that the wake deficit has fully recovered in the return path through the impellers. A similar situation is shown in Figure 4, where the wake for a single turbine is slower than for the three turbine array but the inflow is of similar magnitude.
To investigate the flow regime in the region between the turbines, a grid of flow measurements were made with spacing X / D = 1 / 4 and Y / D = 1 / 2 . This is shown in Figure 6 as both X Y vectors and U , V , W components. The flow is relatively straight and uniform for most of the measurement locations and array configurations, however a number of interesting effects are present.
Considering the first streamwise velocity U. Comparing AC1 to AC0, the upstream blockage (induction region) from the single turbine is clearly visible with a reduction in flow >5% at all measurement points, even at X / D = - 1 , Y / D = ± 1 . For AC3, the presence of the primary turbine leads to a faster flow at Y / D = ± 1 compared to AC2 due to local bypass flow.
The flow of water around the turbines is visible in the transverse component V. The outwards flow around the primary turbine can be seen in AC1 and AC3, while recovery of the inward constriction between the front two turbines is apparent in AC2 and AC3. With no obstructions from the rear turbine in AC2 the flow is relatively straight >1D downstream of the blade tips.
The three-dimensional rotating wake vortex of the front two turbines is apparent in the vertical flow component W at Y / D = ± 1 for cases with them installed (AC2 and AC3) compared to those without (AC0 and AC1). As all three turbines rotate in the same direction, anti-clockwise when looking at the rotors from upstream, the wake vortices shed from either side are opposing. At Y / D = 1 this results in the wake being forced down, resulting in W becoming more negative for AC2 and AC3. Conversely, at Y / D = - 1 , W is more positive, co-incidentally canceling out the slight downward trend seen at this location in the empty tank (AC0).
The slight asymmetry in the magnitude of these effects may result from a number of factors: the off-centre array location, an artefact of the rotating turbines, and/or it may be a slight misalignment (∼10 mm) of the velocity measurement points with respect to the blade tips.

3.2. Frequency Domain Analysis of Spatial Flow Variation

Frequency domain analysis enables a more detailed assessment of the nature of the flow disturbance induced by the turbines. As detailed in Section 3.1, the introduction of the front two turbines results in significant changes to the magnitude, direction, and variability of the flow. The presence of the turbines is also expected to introduce flow disturbances corresponding to multiples of the rotational speed, which may subsequently influence the loading on the primary turbine. The frequency domain analysis presented in this section assesses this, and is carried out using a Fast Fourier Transform (FFT) applied to the U, V and W velocity components at various spatial locations.
Examples of the frequency domain flow outputs are presented in Figure 7. This figure shows the U velocity components for AC3 (see Figure 3), at three streamwise positions and at three transverse positions (where data exists). It is evident that the upstream velocity does not contain any frequency content corresponding to the rotational speed of the turbine, 1 p , whereas immediately downstream of the front two turbines ( X / D = - 3 / 4 ) there is significant energy content at 1 p , 2 p , 3 p and 6 p . These appear to dissipate quickly downstream, and at X / D = - 1 / 4 these components are no longer significant or visually discernible. Immediately in front of the primary turbine ( X / D = - 1 / 4 ) a peak at 1 p is present, which due to the rapid decay of rotation-induced fluctuations downstream of the front two turbines, appears to be flow variation resulting from the primary turbine itself.
Apparent in Figure 7 is a small, broad, peak centred at around 4.7 Hz for some of the measurements. This peak, which is rather, unfortunately, close to 3 p , appears to be intermittent vibration of the ADV mounting. Care must, therefore, be taken not to confuse this vibration with 3 p velocity content. The narrow banded and large peaks associated with 3 p content facilitate this.
To assess the spatial variability of rotation-specific frequency components, a metric has been defined. This enables a single number to describe the relative frequency content at multiples N of the rotational frequency p for each velocity component. This metric k is defined as follows:
k U , N p = N p - δ f N p + δ f S U ( f ) d f 0 S U ( f ) d f .
where S U is the energy spectrum of velocity vector U , and δ f is half the width of the bin used for integration. This δ f has been chosen to allow for slight rotational speed variations, whilst ensuring the energy resulting from the aforementioned ADV vibrational peak at 4.7 Hz is omitted. A value of 0.03 Hz was utilised.
The metric defined in Equation (3) has been applied to all data corresponding to points presented in Figure 6, with all turbines operating at 90 rpm. The resulting spatial variation of k U , 3 p is shown for U, V and W components in Figure 8 for array configurations AC0, AC1, AC2 and AC3. Assessing Figure 7 along with the U component of Figure 8, it is evident that the metric defined in Equation (3) is describing the relative magnitude of peaks at multiples of the rotational speed well.
As noted in Figure 7, it is observed that there is an increase in 1 p , 2 p , 3 p and 6 p velocity content in U behind the front turbines: Y / D = ± 1 . This decreases rapidly with increasing X indicating that the dissipation rate is high. This is also evident in Figure 8 and occurs for U, V, and W components hinting at the three-dimensional nature of the tip vortex structures. The magnitude of the 3 p content is shown to be comparable behind both of the front two turbines. Assessing Y / D = ± 0.5 and Y / D = 0 , it is clear that this disturbance does not propagate significantly in the transverse direction and hence does not affect the downstream turbine.
As mentioned, in Figure 7 and Figure 8 there is the appearance of significant 3 p peak in U immediately in front of the primary turbine ( X / D = - 1 / 4 ) when all three turbines are present (AC3). Assessing the two turbine equivalent (AC2) in Figure 8, it is confirmed that this is a result of the primary turbine itself, and is an upstream velocity disturbance associated with the passing of each blade. It is evident that this 3 p velocity fluctuation is a result of the varying pressure field induced by each blade pass, yet it remains unknown why this effect is observed directly in front of the nacelle for AC3 and not AC1. The authors speculate that this may be a result of this effect being highly spatially variable, coupled with minor sensor position discrepancies, O ( 10 mm ) , between AC1 and AC3 measurement programmes.

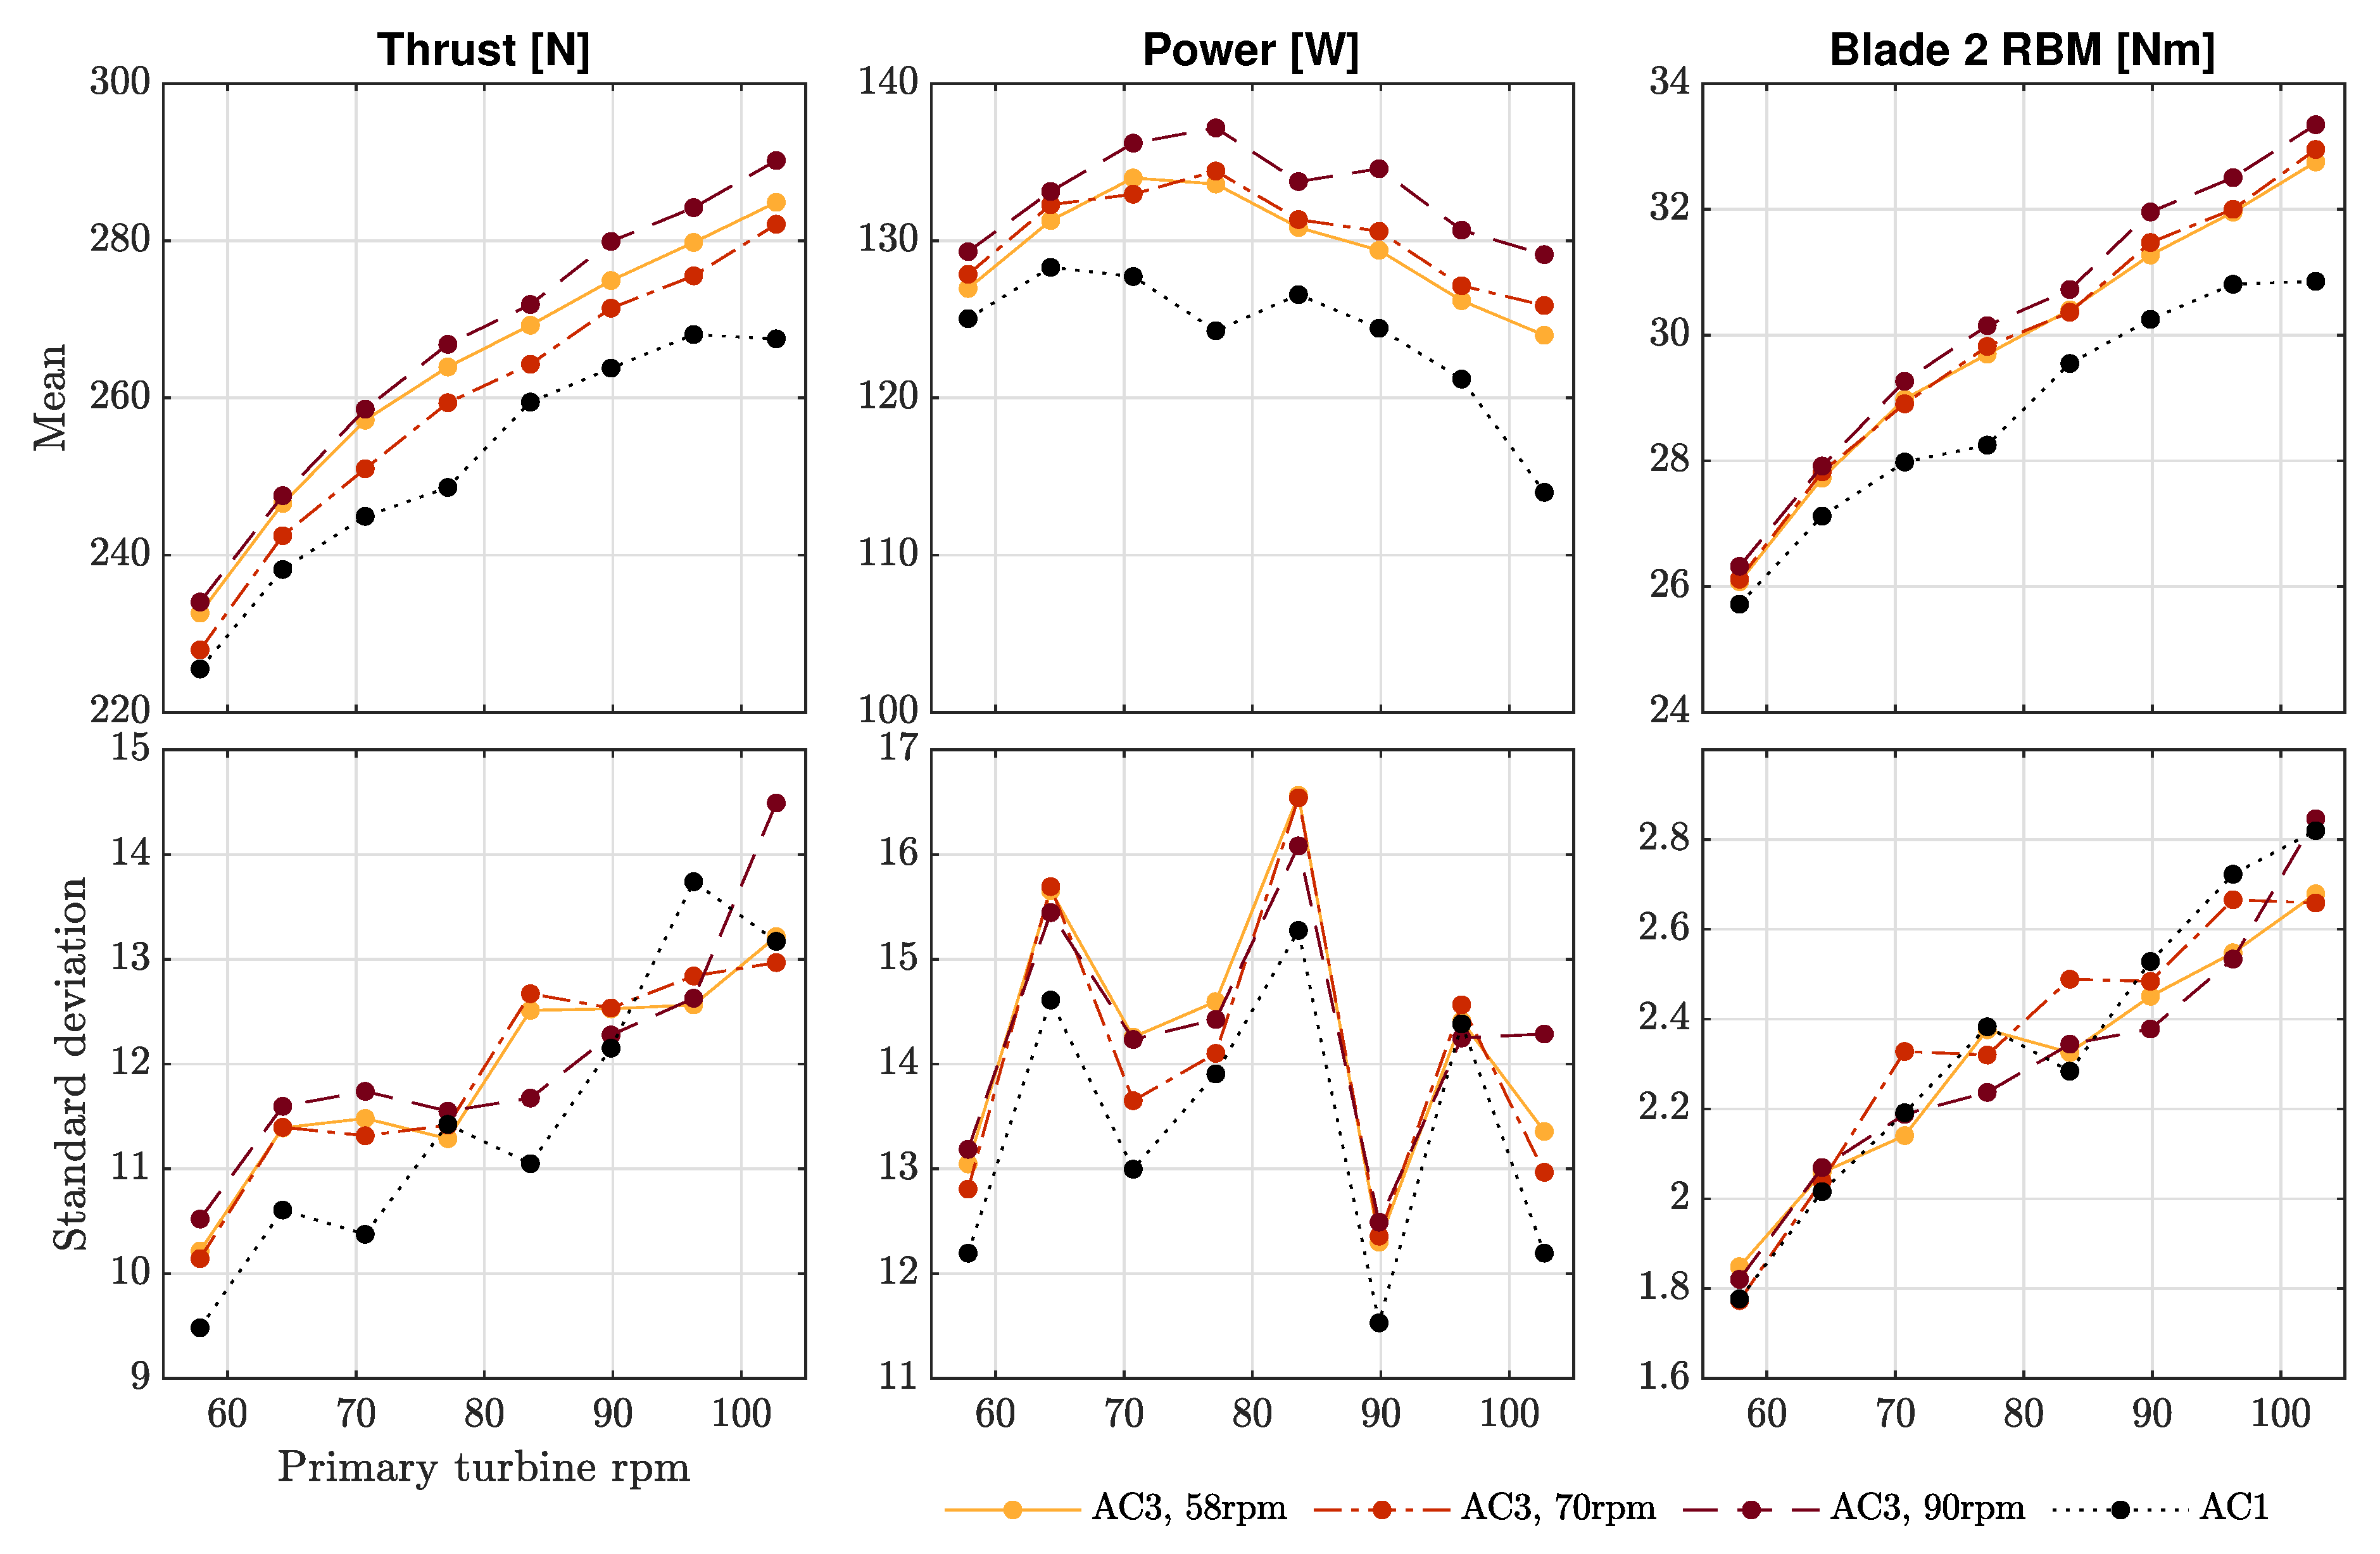
4. Influence of Turbine Array on Loading and Power

The second part of the results considers the effect of the turbine array on the loads experienced and power extracted by the primary turbine. This is achieved by comparing the single turbine to the triple turbine array (configurations AC1 and AC3). For these tests the front two turbines were operated at 58 rpm, 70 rpm, and 90 rpm (nominal TSR of 4.5, 5.5, and 7 respectively). For each of these cases, the primary turbine was operated at a range of rotational speeds ranging from 58 rpm to 104 rpm (8 points in total).

4.1. Time-Domain Turbine Response

Figure 9 shows the mean thrust, power and root bending moment of one of the blades of the primary turbine as a function of the rotational speed of the primary turbine. Curves from the single turbine case have also been plotted for comparison. It was not possible to use normalised quantities (like C p , C t and TSR) due to difficulty in selecting a nominal flow velocity for the array owing to the modification of inflow velocities by the array.
It is evident from Figure 9 that the presence of the front row of turbines increases the flow velocity experienced by the primary turbine (as discussed in Section 3.1). This subsequently causes an increase in the loads experienced. Operating the front row turbines at higher rotational speeds increases the blockage, further increasing the velocity along with the measured power, thrust and RBM. Hence, when the front row turbines are operated at 90 rpm the largest values are recorded. Around the optimum power operating point (70–84 rpm) the thrust experienced by the primary turbine and the RBM of the turbine blade were 4.8–7.3% and 4.0–6.7% higher respectively when operating in the array with the front row turbines operating at 90 rpm. For both thrust and RBM increasing the rotational speed of the primary turbine serves to increases the mean load along with the standard deviation. The increase in the mean loads clearly indicates increased inflow velocities experienced by the primary turbine when operating in the array (AC3) when compared to the single turbine case (AC1). This is not directly seen in Figure 4, where the inflow velocity measured at hub height in the AC1 and AC3 cases are similar. This figure only shows single point flow velocity measurements made, which do not give full information of the inflow velocities seen by the whole rotor.
The power curves follow the standard power versus speed curve of the turbine (see [19]). Owing to the higher flow velocities (and slightly higher C p values), the power extracted by the main turbine is significantly higher when in the array. The power extracted by the primary turbine increased by 5.7–10.4% when in the array with the front row turbines operating at 90 rpm. The measured power curve of the main turbine is higher with the front row turbines operate at 90 rpm than at 58 rpm or 70 rpm. The difference in the power extracted is not significant between the two lower rotational speeds.
The measured thrust, power and blade RBM are tabulated in Table 3 for selected cases. Values are given both for the model-scale measurements and at full-scale equivalent, based on the nominal 1:15 scale factor of the turbine.

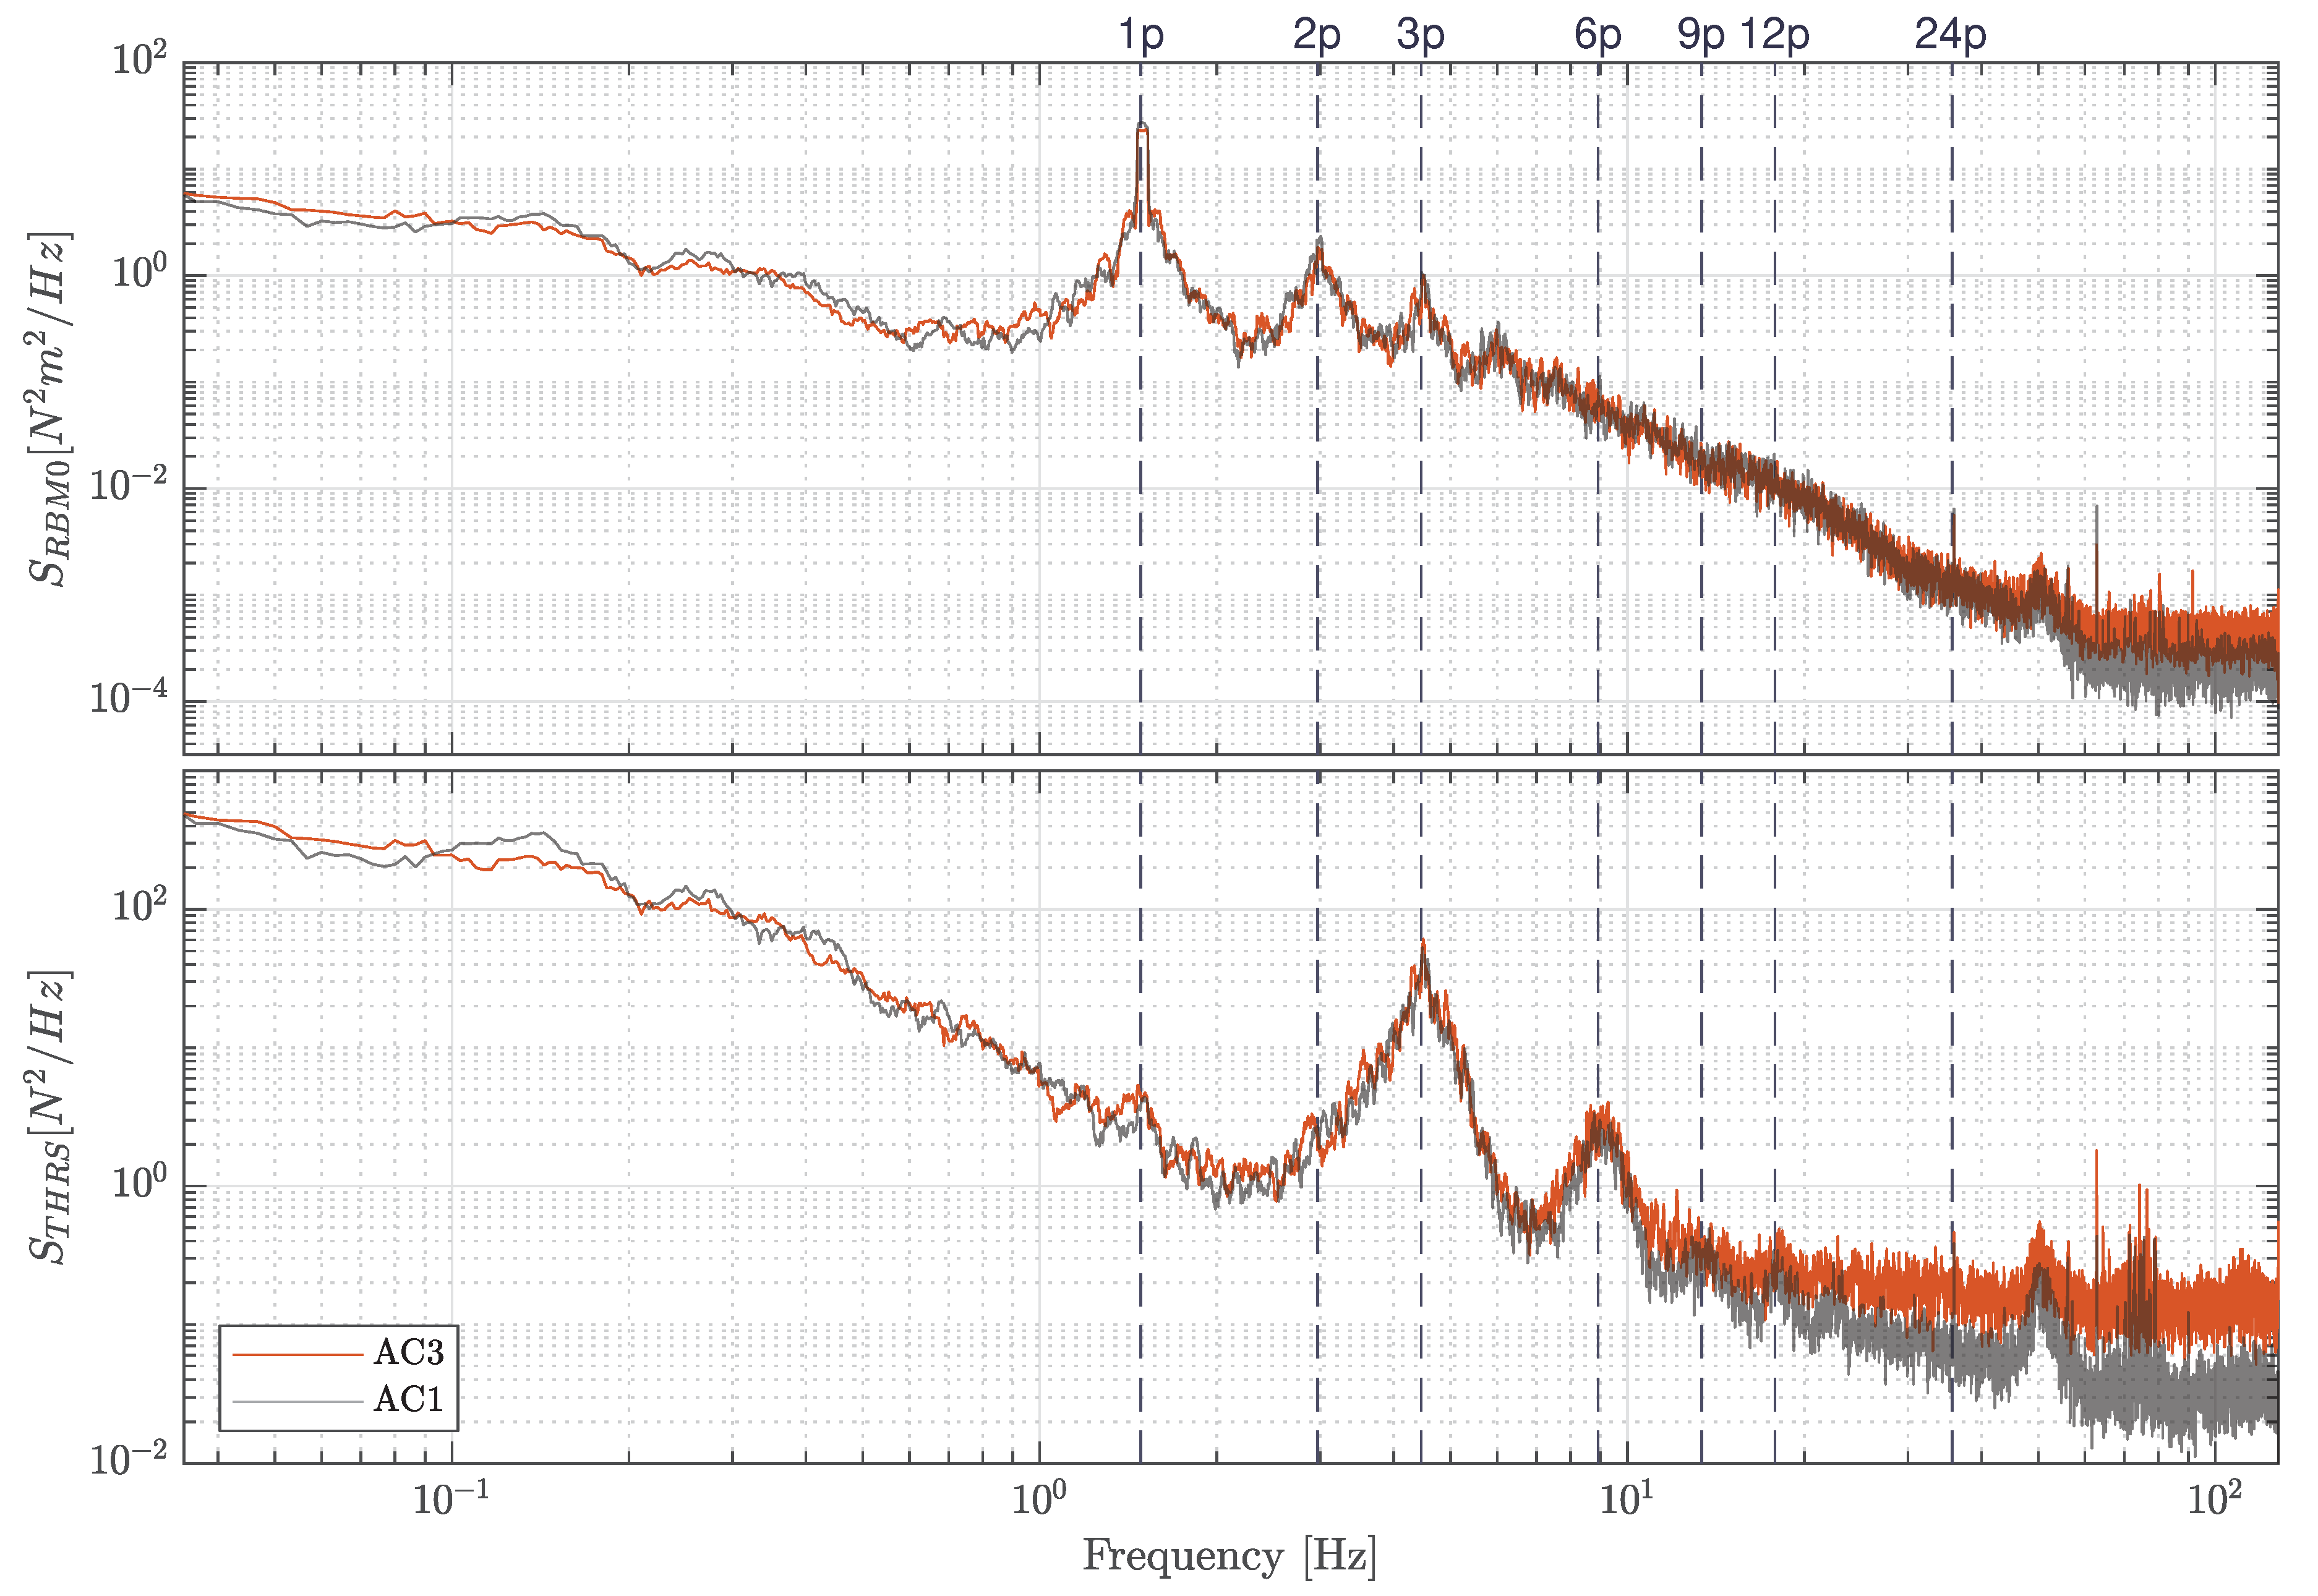
4.2. Frequency-Domain Turbine Response

In this section, the loads experienced by the rotor and the blades of the single turbine and the array cases (AC1 and AC3), are compared in the frequency domain through spectral density plots of the measurements made.
Figure 10 shows the spectral density plots of the thrust and the blade RBM with all turbines operating at 90 rpm for AC3 and AC1. There are peaks in the plots that correspond to physical events during turbine rotation. In the spectral density plot of the blade RBM, the main peak is at 1 p (occurring once per revolution) and corresponds to the tower shadow effect and velocity shear. This 1 p peak amplitude is higher than the low-frequency turbulence-induced load. Further peaks at 2 p and 3 p are seen, which are harmonics of the 1 p peak, which can be explained by the azimuthal variation of the RBM of the blades discussed and shown in Payne et al. [16]. In the spectral density plot of thrust, the 3 p peak has the highest amplitude and corresponds to the 1 p peak observed in the RBM. The amplitudes of the peaks at 6 p and 9 p decrease with increasing frequency and, therefore, indicate that they are harmonics of the 3 p peak. The 12 p peak is due to motor cogging effects, introduced by the 12-pole motor used in the turbine, while the 24 p peak is its second harmonic. A small peak at 1 p is seen, which was also seen with the turbine tested in the dry, which is most likely due to some mechanical artefact (for example some misalignment in the drive train). For clarity on Figure 10 only the case with the font turbines operating at 90 rpm is shown. The plots for AC3 at all front turbine rotational speeds tested (58 rpm, 70 rpm and 90 rpm) are very similar.
Comparing the array and single turbine cases (AC3 and AC1), the difference in the spectral density plots is extremely small. Note that due to the log scale being used, the differences between the plots in the high-frequency range seem to be magnified, but are small relative to the net energy content of the signal. The spectral density plot of turbine thrust shows smaller peaks at the 9 p , 12 p and 24 p frequencies for the single turbine (AC1) when compared to the array (AC3).

5. Discussion

Using larger-scale models in a laboratory environment facilitates measurement that increases understanding of the complex flow conditions around the array of turbines on test, because environmental conditions can be repeatably controlled as required and unwanted scale effects are minimised. The relatively larger physical size of the turbine also permits the inclusion of more comprehensive measurement instrumentation.
As noted in Section 2.3, numerical BEM-CFD modelling [34] has shown that a staggered array with 3 D lateral spacing between the front turbines increases flow speed and thus power produced by the rearmost turbine. The results of the physical modelling described in this paper substantiates this finding. The tests also provide valuable insight into the loading experienced by the rear turbine, both in the closely-spaced staggered array configuration that may be compared to measurements made on one unit on its own.
The increased flow speed seen by the rear turbine in this closely-packed staggered array offers some performance and economic benefit in terms of increased power generation. The upstream turbine wakes, and associated turbulence, do not appear to directly influence the loading on the downstream turbine. This is evidenced by the spectral analysis of the velocities and turbine loads, and supports the conclusions made for much larger downstream separations in [13]. The reduction in wake deficit seen for the primary (downstream) turbine may also lead to an increase in power for subsequent rows of turbines, however additional (numerical) modelling would be required to test this hypothesis.
Constructing a closely-packed array, as simulated in this work, offers the prospect of more efficient use of the seabed and a slight reduction in the extent of interconnecting cabling, compared to an installation with more typical 10–15 diameter spacing between rows of turbines. Access for installation, operation, and maintenance activities may, however, be more complex.
The influence of the incident flow angle relative to the axis of the turbine array was not assessed, as most deployments are expected to be aligned with the predominant direction of the flow of the tidal current. Over the full tidal cycle the changing direction of flow will vary the angle of incidence on the array. This could be an interesting case to explore, however, as even in the ‘design‘ direction there may be an increased influence of a front-row turbine on those behind, a factor of both the flow angle and array geometry. In addition, there may be asymmetrical flow acceleration between the front turbines, leading to more complex loading on the rear turbine. It will be prudent to simulate these situations numerically before performing additional tank tests for validation.

6. Conclusions

The results of the experimental work presented show, for the first time, results from three larger-scale instrumented tidal stream turbines in a closely spaced staggered array. Most significantly, modification of the flow field resulting from the presence of upstream turbines, and the consequent acceleration of inflow to those downstream influences both the loading of, and power produced by, the downstream turbines. This will help inform the design and optimisation of the layout of tidal turbine arrays.
Specifically, this work has shown that the addition of two upstream turbines increases both the power and thrust acting on the downstream turbine, irrespective of the rotational speed of the turbines. Increasing the rotational speed of the front row serves to further increase the power developed by the rear turbine due to the higher resulting effective blockage. At the peak power operating point the mean power of the rear turbine is observed to increase by 5.7–10.4% with a corresponding increase in mean thrust of 4.8–7.3%. Through statistical and frequency-domain analysis of the flow measurements and turbine loads, it may be concluded that this increase in power does not come at the expense of increased unsteady loading from the wake induced by the upstream turbines.
The experimental results presented in this paper represent the first large-scale experimental tests of a closely-spaced array of three tidal turbines, and validate findings from numerical models to provide new insight into the associated flow field and turbine performance and loading. Additionally, two corresponding datasets [35,36] from these physical model tests are available to others to provide valuable assistance when calibrating and validating numerical models of tidal stream turbine arrays.

Author Contributions

Investigation, D.R.N., S.D., A.N., B.G.S., J.S.; methodology, D.R.N., S.D., A.N., B.G.S., J.S.; formal analysis and visualisation, D.R.N., S.D., A.N.; writing—original draft preparation, D.R.N.; writing—review and editing, D.R.N., S.D., A.N., B.G.S., J.S., A.K.; work package leader and project co-investigator, A.K. All authors have read and agreed to the published version of the manuscript.

Funding

This research was funded by The UK Engineering and Physical Sciences Research Council through SuperGen UK Centre for Marine Energy Research (EP/M014738/1) and FloWTurb: Response of Tidal Energy Converters to Combined Tidal Flow, Waves and Turbulence (EP/N021487/1). The authors also acknowledge support from the EPSRC for funding the FloWave Ocean Energy Research facility (EP/I02932X/1).

Acknowledgments

The authors are extremely grateful to all the staff at the FloWave facility and others who worked on this series of test for their assistance in making this research possible.

Conflicts of Interest

The authors declare no conflict of interest.

Abbreviations

The following abbreviations are used in this manuscript:
ACArray Configuration
ADVAcoustic Doppler Velocimeter/Velocimetry
FFTFast Fourier Transform
RBMRoot Bending Moment
TSRTip-Speed Ratio

References

  1. SIMEC Atlantis Energy. The MeyGen Tidal Scheme Project. Available online: https://simecatlantis.com/projects/meygen/ (accessed on 15 April 2019).
  2. Nova Innovation. Bluemull Sound, Shetland. Available online: https://www.novainnovation.com/bluemull-sound (accessed on 4 February 2019).
  3. Vennell, R.; Funke, S.W.; Draper, S.; Stevens, C.; Divett, T. Designing large arrays of tidal turbines: A synthesis and review. Renew. Sustain. Energy Rev. 2015, 41, 454–472. [Google Scholar] [CrossRef]
  4. Myers, L.; Bahaj, A. An experimental investigation simulating flow effects in first generation marine current energy converter arrays. Renew. Energy 2012, 37, 28–36. [Google Scholar] [CrossRef] [Green Version]
  5. Draper, S.; Stallard, T.J.; Stansby, P.K.; Way, S.; Adcock, T.A.A. Laboratory scale experiments and preliminary modelling to investigate basin scale tidal stream energy extraction. In Proceedings of the 10th European Wave and Tidal Energy Conference (EWTEC2013), Aalborg, Denmark, 2–5 September 2013. [Google Scholar]
  6. Cooke, S.C.; Willden, R.H.J.; Byrne, B.W.; Stallard, T.; Olczak, A. Experimental Investigation of Thrust and Power on a Partial Fence Array of Tidal Turbines. In Proceedings of the 11th European Wave and Tidal Energy Conference, Nantes, France, 6–11 September 2015; pp. 1–10. [Google Scholar]
  7. Stallard, T.; Collings, R.; Feng, T.; Whelan, J. Interactions between tidal turbine wakes: Experimental study of a group of three-bladed rotors. Philos. Trans. Ser. A Math. Phys. Eng. Sci. 2013, 371, 20120159. [Google Scholar] [CrossRef]
  8. Dhomé, D.; Piriou, L.; Cazenave, T. Array Configuration Testing—SABELLA; Technical Report; Marine Renewables Infrastructure Network (MARINET): Brussels, Belgium, 2015. [Google Scholar]
  9. Ordonez-Sanchez, S.; Sutherland, D.; Payne, G.S.; Bruce, T.; Gebreslassie, M.; Belmont, M.R.; Moon, I. Experimental evaluation of the wake characteristics of cross flow turbine arrays. Ocean Eng. 2017, 141, 215–226. [Google Scholar] [CrossRef] [Green Version]
  10. Sutherland, D.; Ordonez-Sanchez, S.; Belmont, M.R.; Moon, I.; Steynor, J.; Davey, T.A.D.; Bruce, T. Experimental optimisation of power for large arrays of cross-flow tidal turbines. Renew. Energy 2018, 116, 685–696. [Google Scholar] [CrossRef] [Green Version]
  11. Mycek, P.; Gaurier, B.; Germain, G.; Pinon, G.; Rivoalen, E. Numerical and experimental study of the interaction between two marine current turbines. Int. J. Mar. Energy 2013, 1, 70–83. [Google Scholar] [CrossRef] [Green Version]
  12. Mycek, P.; Gaurier, B.; Germain, G.; Pinon, G.; Rivoalen, E. Experimental study of the turbulence intensity effects on marine current turbines behaviour. Part II: Two interacting turbines. Renew. Energy 2014, 68, 876–892. [Google Scholar] [CrossRef] [Green Version]
  13. Gaurier, B.; Carlier, C.; Germain, G.; Pinon, G.; Rivoalen, E. Three tidal turbines in interaction: An experimental study of turbulence intensity effects on wakes and turbine performance. Renew. Energy 2019, 148, 1150–1164. [Google Scholar] [CrossRef]
  14. McNaughton, J.; Cao, B.; Vogel, C.R.; Willden, R.H.J. Model scale testing of multi-rotor arrays designed to exploit constructive interference effects. In Proceedings of the 13th European Wave and Tidal Energy Conference, Napoli, Italy, 1–6 September 2019; pp. 1–8. [Google Scholar]
  15. Whelan, J.I.; Graham, J.M.; Peiró, J. A free-surface and blockage correction for tidal turbines. J. Fluid Mech. 2009, 624, 281–291. [Google Scholar] [CrossRef]
  16. Payne, G.S.; Stallard, T.; Martinez, R.; Bruce, T. Variation of loads on a three-bladed horizontal axis tidal turbine with frequency and blade position. J. Fluids Struct. 2018, 83, 156–170. [Google Scholar] [CrossRef]
  17. Payne, G.S.; Stallard, T.; Martinez, R. Design and manufacture of a bed supported tidal turbine model for blade and shaft load measurement in turbulent flow and waves. Renew. Energy 2017, 107, 312–326. [Google Scholar] [CrossRef]
  18. Martinez, R.; Payne, G.; Bruce, T. Preliminary results on the effects of oblique current and waves on the loadings and performance of tidal turbines. In Proceedings of the 12th European Wave and Tidal Energy Conference (EWTEC2017), Cork, Ireland, 27 August–1 September 2017. [Google Scholar]
  19. Draycott, S.; Payne, G.; Steynor, J.; Nambiar, A.; Sellar, B.; Venugopal, V. An experimental investigation into non-linear wave loading on horizontal axis tidal turbines. J. Fluids Struct. 2019, 84, 199–217. [Google Scholar] [CrossRef]
  20. Draycott, S.; Nambiar, A.; Sellar, B.; Davey, T.; Venugopal, V. Assessing extreme loads on a tidal turbine using focused wave groups in energetic currents. Renew. Energy 2019, 135, 1013–1024. [Google Scholar] [CrossRef] [Green Version]
  21. Draycott, S.; Steynor, J.; Nambiar, A.; Sellar, B.; Venugopal, V. Experimental assessment of tidal turbine loading from irregular waves over a tidal cycle. J. Ocean Eng. Mar. Energy 2019, 5, 173–187. [Google Scholar] [CrossRef] [Green Version]
  22. Ingram, D.M.; Wallace, A.R.; Robinson, A.; Bryden, I.G. The design and commissioning of the first, circular, combined current and wave test basin. In Proceedings of the Oceans 2014 MTS/IEEE, Taipei, Taiwan, 7–10 April 2014. [Google Scholar]
  23. Robinson, A.; Ingram, D.M.; Bryden, I.G.; Bruce, T. The generation of 3D flows in a combined current and wave tank. Ocean Eng. 2015, 93, 1–10. [Google Scholar] [CrossRef]
  24. Robinson, A.; Ingram, D.M.; Bryden, I.G.; Bruce, T. The effect of inlet design on the flow within a combined waves and current flumes, test tank and basins. Coast. Eng. 2015, 95, 117–129. [Google Scholar] [CrossRef]
  25. Noble, D.R.; Davey, T.A.D.; Smith, H.C.M.; Kaklis, P.; Robinson, A.; Bruce, T. Spatial variation in currents generated in the FloWave Ocean Energy Research Facility. In Proceedings of the 11th European Wave and Tidal Energy Conference (EWTEC2015), Nantes, France, 6–11 September 2015. [Google Scholar]
  26. Sutherland, D.R.; Noble, D.R.; Steynor, J.; Davey, T.A.D.; Bruce, T. Characterisation of current and turbulence in the FloWave Ocean Energy Research Facility. Ocean Eng. 2017, 139, 103–115. [Google Scholar] [CrossRef]
  27. Parkinson, S.G.; Collier, W.J. Model validation of hydrodynamic loads and performance of a full-scale tidal turbine using Tidal Bladed. Int. J. Mar. Energy 2016, 16, 279–297. [Google Scholar] [CrossRef]
  28. ABB Motion Control. User’s Manual MotiFlex e180 Servo Drive; Technical Report; ABB: Zürich, Switzerland, 2016. [Google Scholar]
  29. Pacific Northwest National Laboratory. MeyGen Tidal Energy Project—Phase I. Available online: https://tethys.pnnl.gov/annex-iv-sites/meygen-tidal-energy-project-phase-i (accessed on 20 May 2019).
  30. SIMEC Atlantis Energy. AR1500 Tidal Turbine. Available online: https://www.atlantisresourcesltd.com/wp/wp-content/uploads/2016/08/AR1500-Brochure-Final-1.pdf (accessed on 20 May 2019).
  31. Nortek. Vectrino Profiler Technical Specification; Nortek: Providence, RI, USA, 2013. [Google Scholar]
  32. Mori, T.; Naganuma, K.; Kimoto, R.; Yakushiji, R.; Nagaya, S. Hydrodynamic and hydroacoustic characteristics of the Flow Noise Simulator. In Proceedings of the 5th ASME-JSME Joint Fluids Engineering Conference, San Diego, CA, USA, 30 July–2 August 2007; pp. 121–127. [Google Scholar] [CrossRef]
  33. Goring, D.G.; Nikora, V.I. Despiking Acoustic Doppler Velocimeter Data. J. Hydraul. Eng. 2002, 128, 117–126. [Google Scholar] [CrossRef] [Green Version]
  34. Malki, R.; Masters, I.; Williams, A.J.; Nick Croft, T. Planning tidal stream turbine array layouts using a coupled blade element momentum—Computational fluid dynamics model. Renew. Energy 2014, 63, 46–54. [Google Scholar] [CrossRef] [Green Version]
  35. Noble, D.R.; Draycott, S.; Nambiar, A.; Sellar, B.; Steynor, J.; Lennon, M.; Davey, T.; Kiprakis, A. Flow Data Around Three Supergen UKCMER Tidal Turbines in a Closely Spaced Staggered Array at FloWave; Edinburgh DataShare: Edinburgh, UK, 2020. [Google Scholar]
  36. Noble, D.R.; Draycott, S.; Nambiar, A.; Sellar, B.; Steynor, J.; Lennon, M.; Davey, T.; Kiprakis, A. Turbine Loading and Performance Data for Three Supergen UKCMER Tidal Turbines in a Closely Spaced Staggered Array at FloWave; Edinburgh DataShare: Edinburgh, UK, 2020. [Google Scholar]
Figure 1. Sectional schematic of FloWave basin showing: (A) wavemaker paddles around circumference; (B) turning vanes and flow conditioning filters; (C) current drive impeller units; (D) buoyant raisable floor ( 15 mØ) below test area [25].
Energies 13 01977 g001
Figure 2. Turbine array installed in FloWave, as the floor descends after installation. Fully instrumented primary turbine (red fairing) in the centre between front turbines (yellow and blue). Array layout and configurations tested are shown in Figure 3. Grid on tank floor relative to tank centre, with 0.5 m spacing.
Energies 13 01977 g002
Figure 3. (left) Three turbine array layout, and (right) four configurations tested: AC0 empty tank, AC1 primary turbine only, AC2 upstream turbines only, and AC3 full array.
Energies 13 01977 g003
Figure 4. Transect along centreline of array ( Y / D = 0 ) at hub height. Sub-panels show mean velocity U ¯ , mean velocity relative to empty tank Δ U ¯ , standard-deviation σ U , and turbulence intensity I U .
Energies 13 01977 g004
Figure 5. Transect along primary turbine centreline ( Y / D = 0 ), showing inflow and wake at varying rotational speed for configuration AC1, with AC0 for comparison.
Energies 13 01977 g005
Figure 6. Variation of flow between turbine locations. Subplots show (left) X–Y velocity vectors relative to turbine/blade positions, and (right) U ¯ V ¯ W ¯ at points on five streamwise transects. For details of array layout and configurations tested see Figure 3.
Energies 13 01977 g006
Figure 7. Example spectral density plots for streamwise velocity component U at seven positions for configuration AC3 with all three turbines operating at 90 rpm.
Energies 13 01977 g007
Figure 8. Relative energy content (defined by Equation (3)) at three times the rotational speed in U, V and W velocity components for various spatial locations. Shown for all array configurations defined in Figure 3.
Energies 13 01977 g008
Figure 9. Average and standard deviation of thrust and power of the turbine plus root bending moment of a blade all as a function of rotational speed. Each plot shows these forces/moments for the primary turbine with the front two turbines operating at three different rotational speeds (AC3) and also shows the comparable single turbine case (AC1).
Energies 13 01977 g009
Figure 10. Spectral density plots of the thrust and the blade root bending moment experienced by the primary turbine, with the front two turbines (AC3) and from the single turbine case (AC1). All turbines operating at 90 rpm.
Energies 13 01977 g010
Table 1. Key turbine dimension (from [17]).
Rotor diameter (mm) 1200( 1 D )
Nacelle length (mm) 1030
Nacelle diameter (mm)hub to tower120
beyond tower160
Hub height (mm) 1000( 0 . 83 D )
Tower diameter (mm) 102
Distance from rotor plane to tower axis (mm)486( 0 . 4 D )
Table 2. Description of installed instrumentation and variables measured.
InstrumentationVariables MeasuredSample Rate [Hz]
Vectrino Profiler ADVVelocity components, U, V, W.100
Bespoke TST InstrumentationTorque, T,256
Thrust, Q,
Streamwise root bending moment, R B M ,
Rotational position, θ .
Table 3. Thrust and power of the turbine plus root bending moment of a blade for selected rotational speeds. Values given for model scale and full scale equivalent.
Measured Model Scale (0.8 m/s)Full Scale Equivalent (3.1 m/s)
Array Config.Front Turbines rpmPrimary Turbine rpmThrust [N]Power [W]Blade RBM [Nm]Thrust [kN]Power [MW]Blade RBM [MNm]
AC1 58225.5125.025.72761.11.6351.302
AC1 70244.9127.727.98826.61.6701.417
AC1 90263.8124.430.25890.31.6261.531
AC1104267.5114.030.86902.91.4901.562
AC358 90274.9129.431.27927.91.6911.583
AC370 90271.4130.631.47916.11.7071.593
AC390 58234.0129.326.32789.91.6901.333
AC390 70258.6136.229.27872.71.7801.482
AC390 90279.9134.631.96944.71.7591.618
AC390104290.2129.133.35979.51.6881.688

