The Effect of Renewable and Nuclear Energy Consumption on Decoupling Economic Growth from CO2 Emissions in Spain


1
Department of Econometrics and Statistics, Faculty of Economics, Nicolaus Copernicus University in Toruń, Gagarina 13A, 87-100 Toruń, Poland
2
Faculty of Management, Czestochowa University of Technology, Al. Armii Krajowej 19B, 42-201 Częstochowa, Poland
*
Author to whom correspondence should be addressed.
Energies 2020, 13(9), 2124; https://0-doi-org.brum.beds.ac.uk/10.3390/en13092124
Submission received: 28 March 2020
/
Revised: 18 April 2020
/
Accepted: 20 April 2020
/
Published: 25 April 2020
(This article belongs to the Section C: Energy Economics and Policy)
Abstract
:This study examines the relationship between renewable and nuclear energy consumption, carbon dioxide emissions and economic growth by using the Granger causality and non-linear impulse response function in a business cycle in Spain. We estimate the threshold vector autoregression (TVAR) model on the basis of annual data from the period 1970–2018, which are disaggregated into quarterly data to obtain robust empirical results through avoiding a sample size problem. Our analysis reveals that economic growth and CO2 emissions are positively correlated during expansions but not during recessions. Moreover, we find that rising nuclear energy consumption leads to decreased CO2 emissions during expansions, while the impact of increasing renewable energy consumption on emissions is negative but insignificant. In addition, there is a positive feedback between nuclear energy consumption and economic growth, but unidirectional positive causality running from renewable energy consumption to economic growth in upturns. Our findings do indicate that both nuclear and renewable energy consumption contribute to a reduction in emissions; however, the rise in economic activity, leading to a greater increase in emissions, offsets this positive impact of green energy. Therefore, a decoupling of economic growth from CO2 emissions is not observed. These results demand some crucial changes in legislation targeted at reducing emissions, as green energy alone is insufficient to reach this goal.
1. Introduction
Over the past two decades, countries around the world have been struggling to reduce global warming and avoid the dangerous consequences of climate change [1]. As the burning of fossil fuels is the main culprit, the greenhouse gas (GHG) emissions (chiefly CO2 emissions) resulting from their combustion have received considerable attention [2,3]. Therefore, the challenge is to improve the energy supply industry so as to produce safer and cheap energy while simultaneously reducing GHG emissions. Any attempt requires finding alternative energy sources to fossil fuels. Both nuclear and renewable (hydro, solar, wind, biomass and geothermal) energy sources could provide solutions to the problem of energy security and climate change [3,4,5]. In practice, however, the impact of renewable and nuclear energy consumption on GHG emissions may not be straightforward. Even if commissioning a new renewable or nuclear power plant caused the closure of a coal-fired power station, it could also result in a lower price for coal, which, in turn, would encourage other energy consumers to burn it in place of cleaner energy sources, thus raising the level of CO2 emissions overall [4]. Therefore, the extent to which increased consumption of either nuclear or renewable energy mitigates emissions over time is an open question.
Another question of special importance is whether the development of “green” and conservation energy policies can allow societies to maintain the sustainable development of the economy. As economic growth typically necessitates expanding the consumption of energy and thus emissions, the objective of economic growth seems to be in conflict with that of emissions reductions. However, the economic literature and concrete examples from some countries show that it is possible to reconcile a low-carbon strategy with economic development [6]. Therefore, the vast body of literature seeks to determine whether economic growth can be decoupled from emissions, i.e., economies grow but emissions do not [7,8,9,10,11,12,13].
There is a common assumption in environmental science and policy analyses that the green energy development will contribute considerably to decoupling economic growth from CO2 emissions [14,15,16,17,18]; here, decoupling means that green energy sources (both renewable and nuclear energy) have a countereffect on emissions so that, despite the boosting effect economic growth has on emissions, emissions could stabilize or decline due to increases in renewable and nuclear energy production [19]. However, some empirical studies have shown that renewable energy generation often does not lead to the anticipated environmental benefits thanks to complex interactions in political and economic systems [20,21]. In addition, the common assumption that renewables primarily compete with fossil fuels is not necessarily valid as, in affluent countries with high levels of renewables, a growth in renewables tends to suppress nuclear power, thereby unintentionally strengthening the reliance on fossil fuels [19].
The purpose of this paper is to evaluate the effects of increased renewable and nuclear energy on economic growth and CO2 emissions in Spain, which, for many years, has been at the forefront of green energy implementation both in Europe and worldwide. Our research is innovative in that it explores the impact of renewable and nuclear energy on CO2 emissions and economic growth in a business cycle context, implying that this influence may be different during recessions and expansions. We apply the threshold vector autoregression (TVAR) model and then examine the abovementioned relationship using a causality analysis and non-linear impulse response function in separate regimes describing different phases of the business cycle, as they have a specific characteristic and require specific regime-dependent policies. Most studies examining this relationship have ignored the potentially different impact of renewables and nuclear on CO2 emissions over the business cycle and applied annual time series data, while our study uses the data obtained through the disaggregation of annual data to quarterly data. Only a few scholars have converted the energy consumption data from annual frequency to quarterly or monthly frequency in order to avoid the sample size problem and capture potential non-linearity and asymmetry in the studied relationship [22,23]. To the best of our knowledge, there is no such study that applies the threshold VAR approach to identify the possible non-linear relationship between green energy consumption, emissions and economic growth in Spain.
Our research also contributes to the existing literature in that it investigates whether the development of renewable and nuclear energy leads to a stabilization of emissions without hindering economic growth, i.e., whether green energy contributes to the decoupling of economic growth from CO2 emissions in Spain, using a relatively longer period of time (1970–2018). In addition, we address the empirical question of whether renewables have the tendency to squeeze out nuclear power.
The rest of the paper is organized as follows. Section 2 presents the literature review. Section 3 provides a description of the data and discusses country-specific energy policies. Section 4 introduces the econometric framework. Section 5 analyzes the empirical results of this study, including the Granger causality in the context of a threshold VAR model and non-linear impulse response function in separate regimes of the business cycle. Finally, Section 6 concludes.
2. Literature Review
There are numerous studies that have been devoted to examining the relationships between total energy consumption, economic growth and greenhouse gas emissions [24,25,26]. These studies have provided conflicted results, leading to mixed conclusions and unclear political implications, mainly due to using various econometric methodologies, proxies of economic growth or environmental pollution for different countries and time periods [27]. Moreover, the lack of uniformity in the empirical results may be a consequence of the varying importance of certain energy resources for a country over the studied period [28]. Taking into account the fact that developing low-carbon energy may meet the rising energy demand and achieve a reduction in CO2 emissions from fossil fuel combustion, optimize the economic structure and help with achieving sustainable economic growth, more and more studies have been focused on the clean energy-income-emissions nexus [29].
Two streams of research can be distinguished in the literature devoted to the expansion of low-carbon energy sources. The first strand addresses the strategy of carbon dioxide emissions reduction through the development of clean energy sources, while the second explores the dynamic linkage between clean energy consumption and economic growth in the framework of the promotion or inhibition theory [29]. In the first context, many studies, such as [30,31,32], using either time series or panel data methods, provided evidence that nuclear energy supported the carbon dioxide mitigation. In particular, Zafrilla et al. [32] recommended the development of nuclear facilities to achieve the Spanish European Energy Roadmap goals. Conversely, Jin and Kim [5] stated that the development and expansion of renewable, not nuclear, energy are pivotal to preventing global warming. The negative and significant association between RES (renewable energy consumption) and CO2 emissions, indicating the improvement of environmental quality by decreasing the CO2 emissions from fossil energy resources, has been confirmed by many researchers [33,34,35,36]. In the case of Spain, the need of new regulations related to increasing renewable sources and promoting energy innovation for fulfilling sustainable goals was stressed [37]. Silva et al. [38] concluded that policies dedicated to RES development, such as demand-side management, ought to be implemented in Spain in order to achieve environmental goals at the lowest possible cost.
On the other hand, other scholars stated that there was a lack of strong evidence supporting the hypothesis that the expansion of renewable energy could prevent environmental degradation [31,39,40]. Such conclusions have mainly been drawn since the share of renewables in the total energy production was insufficient to mitigate CO2 emissions at a country level [40]. Moreover, rising energy demand could hinder policy makers’ ability to increase the RES share in the energy mix due to the limited substitution of fossil fuels during periods of peak energy demand [39,41].
According to recent studies, clean energy development may lead to boosting economic activity (the promotion theory) or impeding economic growth (the inhibition theory) [29]. Therefore, it is essential to identify the causality between these two variables, as the high cost of clean energy development may be absorbed by the economic system in the short term, while renewable energy expansion ought to improve the sustainable development in the long run [29,42]. These interdependencies are usually considered in the background of four testable hypotheses: the growth hypothesis, the conservation hypothesis, the feedback hypothesis and the neutrality hypothesis [43]. The growth hypothesis was verified in many studies where nuclear energy [44,45] or renewable energy [33,37,43] was treated as a proxy of clean energy use in the economy. It was stressed that clean energy development fostered economic growth through green technologies’ spillover effect, while structural changes were associated with shifting to less energy-intensive production or the better allocation of capital and labor resources. In turn, some researchers found evidence for the validity of the conservation hypothesis, which meant that economic growth determined the clean energy consumption level of a country [31,46,47]. A number of studies have also emerged that confirm the feedback hypothesis, assuming that clean energy consumption and economic growth are interdependent and complement each other [39,48]. Apergis and Payne [39] suggested that a government policy introducing renewable energy production tax credits or renewable energy certificates could stimulate economic growth and reduce the dependence on foreign energy sources in the analyzed OECD countries, including Spain. Finally, some research has confirmed the neutrality hypothesis as a consequence of the immaturity of the renewable [49,50] or nuclear [31] energy market at the initial stage of its development.
It is worth stressing that there are regional differences in the pattern of causal relationships between clean energy consumption and economic growth [22,28,29,51]. Based on a literature review, Singh et al. [43] pointed out that the growth hypothesis was valid for countries with a higher income, while the neutrality hypothesis held true for countries with a lower income. Such disparity in results indicates the need for investigating the gross domestic product-clean energy nexus for each country separately by means of time series techniques. This approach can help decision-makers to choose the appropriate environmental management instruments, which will support the sustainable development of each particular country.
To sum up, it should be noted that the most existing research related to the clean energy‒income‒emission nexus has focused more on the identification of Granger causality relationships than on the asymmetric interactions between variables and their potential political implications. To our best knowledge, only Lahiani et al. [22] and Luqman et al. [44] have pointed out the asymmetric association, both in the long run and the short run, between renewable and nuclear energy consumption, real income and CO2 emissions, which required the use of special non-linear econometric models for the identification of causal relationships. Their empirical findings revealed that positive and negative shocks to renewable and nuclear energy consumption may have different impacts on economic growth.
3. Data and Country-Specific Energy Policies
Annual observations of nuclear (NUC, in thousand tons of oil equivalent (toe)) and renewable (RES, in thousand toe) energy consumption and carbon dioxide emissions (CO2, in million tons) for the period 1970–2018 were sourced from the BP Energy Outlook 2019 database. All data were converted to quarterly observations by means of the Denton-Cholette method [52] in Eviews software to take advantage of a larger number of observations when estimating the threshold VAR model. The seasonally adjusted quarterly data on gross domestic product (GDP, in millions of constant 2010 U.S. dollars) were taken from the OECD database (see Supplementary Materials).
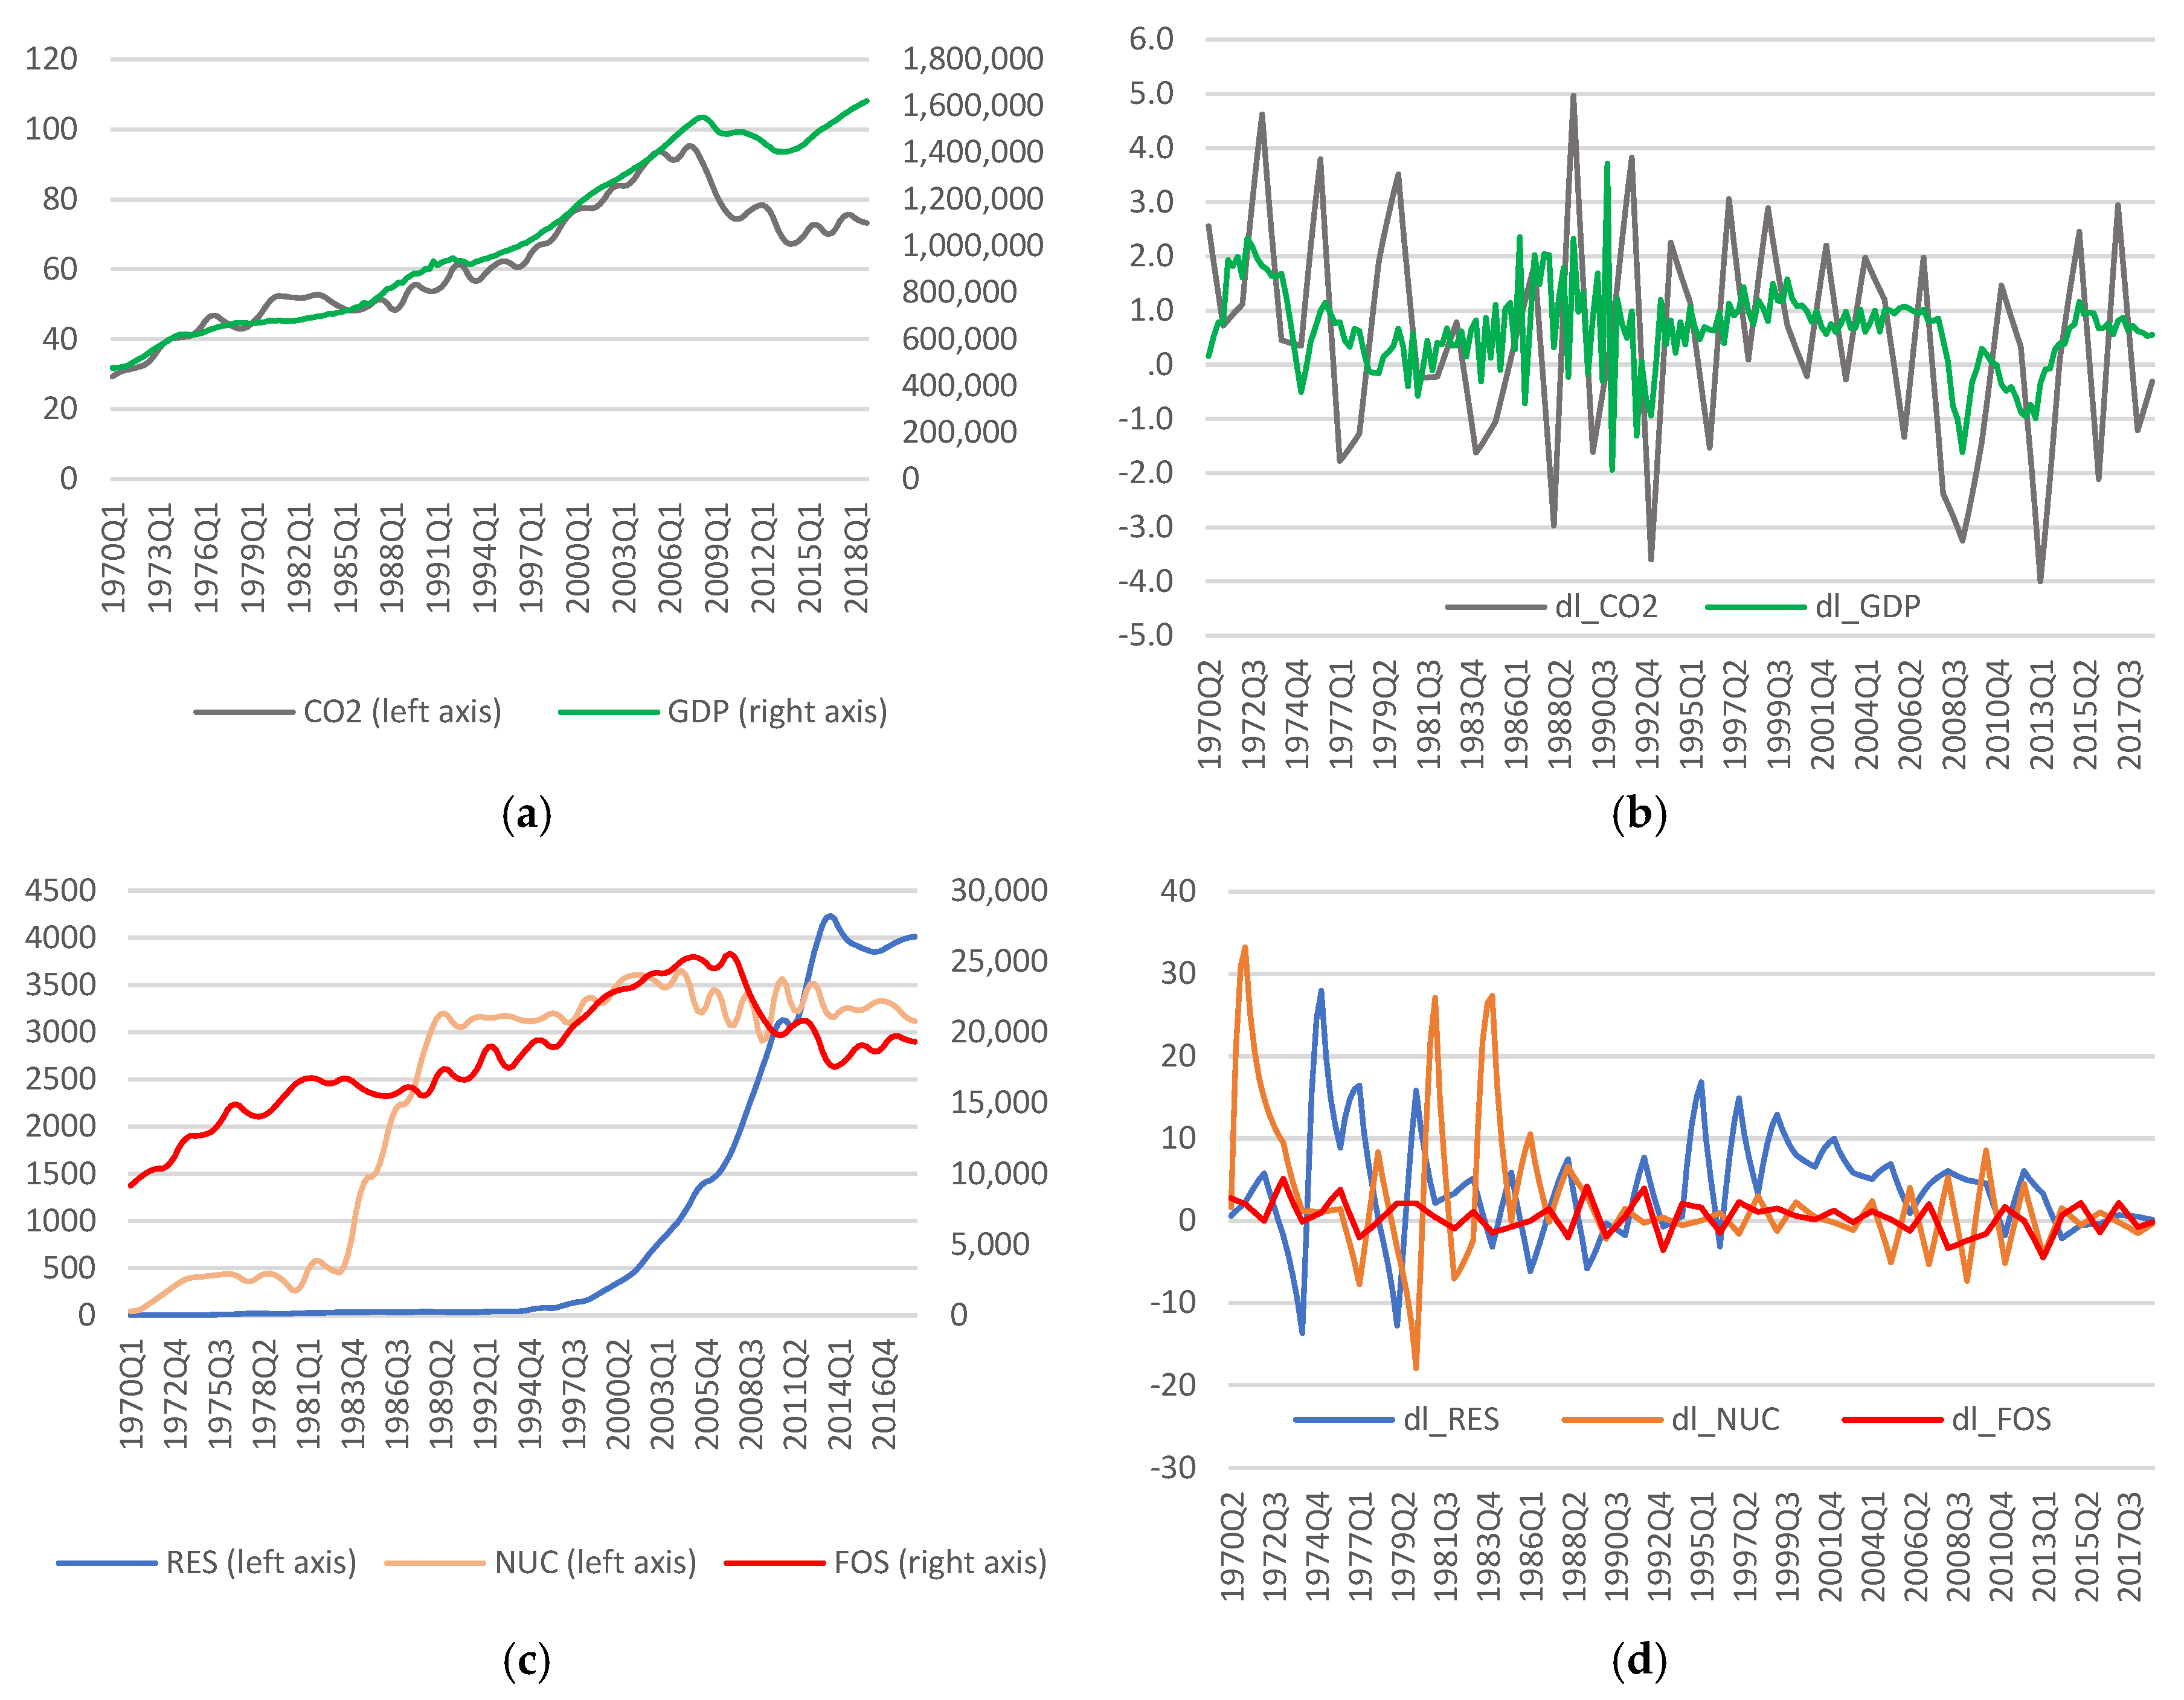
Figure 1 shows that, from the end of the 1970s, there has been a considerable increase in nuclear energy consumption in Spain, along with, since 2000, an increase in renewable energy consumption, accompanied by high rates of growth. Changes in low-carbon power consumption are the background to fossil fuel use as the energy sector continues to be the world’s leading fossil-fuel consumer and source of energy-related CO2 emissions [53]. Moreover, the carbon emission factor for fossil fuels is nearly twice that of natural gas (0.949 kg CO2 e/kWh—hard coal, 0.519 kg CO2 e/kWh—oil and 0.485 kg CO2 e/kWh—natural gas), and almost zero for nuclear and renewable energy [54]. As seen in Figure 1, a clear upward trend in fossil fuel use lasted until the first symptoms of the financial crisis (2007); after that, increases and decreases in the consumption of fossil fuels occurred cyclically depending on the phase of a business cycle in the Spanish economy. Similarly, changes in CO2 emissions are, in general, procyclical. We observe that carbon dioxide emissions have not declined in periods of steady economic growth, and the emissions growth rate has not been slower than the GDP growth rate. Hence, it needs to be highlighted that the decoupling of economic growth from emissions has not occurred in Spain yet. Moreover, it seems that the growth rate of RES consumption has been accompanied by a decrease in the growth rate of nuclear energy since the economic crisis.
As various energy sources have an extremely different impact on carbon dioxide emissions, it is worth looking at the structure of primary energy consumption in Spain. In 1970, conventional fossil fuels were dominant in the primary energy mix (oil—63.1% and coal—21.9%), with a negligible share of low-carbon energy consumption (nuclear energy—0.4%, renewables—0.1%). In the next three decades, oil and coal consumption (71.5%) was reduced in favor of significant growth in natural gas (10%) and nuclear energy (11.1%) use. While oil has still contributed by far the largest share (47%) to the primary energy mix in Spain, since 2014 renewables (11%–12%) and natural gas (17%–19%) have been increasingly important energy sources in the economy. Hydroelectricity constitutes only a fraction of Spanish primary energy consumption (5%–7%), but a pumped storage hydroelectric system is considered a key element in the ongoing energy transition in Europe. Such a structure of primary energy consumption reflects the availability of different fossil fuel deposits in Spain, as well as the natural environmental potential of the country and both the social and economic costs associated with the development of renewable energy.
Some of the changes in primary energy consumption in Spain might be explained by the structural breaks in the economy or the energy sector. Spain stands as an example of a country whose energy market structure remained critical due to a strong duopoly and weak connections with the rest of Europe until 2007. Late liberalization of the energy market, which resulted in the creation of the Iberian Electricity Market in 2007, as well as the high dependence of the security of energy supply on fossil fuel imports, may explain the changes in the primary energy mix [38]. Due to generous subsidies for green energy producers, Spain experienced a sudden transformation of its renewable development mode as a consequence of Spain’s National Renewable Energy Action Plan 2010–2020, in which an increase in the share of renewables to 20% of final energy consumption by 2020 was assumed. However, the financial crisis that slammed the Spanish economy has forced not only Spain but also several other European governments to use feed-in-tariffs to cut their subsidies, which caused a dearth of new installations between 2012 and 2015. The government has also revised contracts to providers of renewable energy, reducing their returns considerably in order to decrease the debts for the RES development incurred before the financial crisis. The entering into force of the “sun tax” in 2015 contributed to blocking Spain from continuing its long-standing movement to renewable energy production and the development of a domestic industry in both wind turbines and solar energy.
Another explanation is related to stricter environmental standards, which require the reduction of CO2 emissions in the EU by at least 40% below the 1990 level by 2030 (the Paris Agreement, October 2014) and working towards carbon neutrality by 2050. Moreover, Spain will have to cut its own greenhouse gas emissions to 26% by 2030 compared to 2005 in sectors such as transport, agriculture, buildings and waste management (The Effort Sharing Regulation, April 2018). The environmental commitments made by the Spanish government required rapid changes in the national energy mix, which aimed to minimize the share of coal in favor of an increase in the share of renewable energy and natural gas. To do this, the production subsidies for domestic coal industry have been phased out by 2018, together with the purchase requirement of domestic coal by electricity generators (Framework Plan for Coal Mines and Mining Communities 2013–2018). In the hope of strengthening the renewable sector in Spain, the government also scrapped the controversial “sun tax” in 2018.
In turn, the activities of the Spanish government in the realm of new capacity market development and financial support for energy producers to respond to peak demand are in line with programs directed to the RES sector. Namely, this support enables the building of pumped storage, which offers the ability to store energy produced from RES when it is difficult to integrate these resources into the power system [55]. This utility-scale storage technology may help to meet sustainable criteria for grid stability and reliability, mainly due to its important role in balancing different renewable energy sources [56]. It is worth stressing that companies covered by the EU ETS may be differentiated by their carbon dioxide emissions and environmental indicators, so corporate emissions targets should be set for the medium term in order for a company to be able to adjust to new regulations. Low-carbon modernization of energy sector companies in Spain will be implemented more efficiently only if the clear link between corporate compensation and environmental performance retains importance in the governmental sustainability programs.
4. Methods: Threshold VAR Model and GIRF
The threshold vector autoregressive model (TVAR) is a piecewise linear model with different autoregressive matrices in each regime. The regimes characterize the state of the economy and are determined by the transition variable. We assume only one threshold value for the transition variable, which is in line with the general concept of the business cycle with two main regimes (upper regime for expansion phase and lower regime for recession phase of the business cycle); see [57]. Hence, we treat the changes in GDP as the threshold variable in our model.
The TVAR model with two regimes can be written as follows:
where Yt is the vector containing log differences of carbon dioxide emissions, GDP, renewable energy consumption and nuclear energy consumption. μ1 and μ2 are regime-dependent intercepts, B1(L) and B2(L) are lag polynomial matrices changing across regimes, and εt ~ NID(0, σ2) is a vector of structural disturbances. ct−d is the threshold variable (with a possible delay (d)) that determines the regime in which the system is. I(ct−d > γ) is a Heaviside indicator function that equals 1 when the threshold variable ct−d exceeds the threshold value γ and 0 otherwise. γ is estimated according to Chan’s search method [58], where the Conditional Least Square (CLS) method is used for the estimation of unknown threshold values. Minimization of the objective function,
is done through a grid search, where the value of the threshold variable is sorted and a certain percentage of the first and last values is excluded to ensure a minimal number of observations in each regime. Then the sum of squares (SSR) is estimated for each selected threshold value and the one that minimizes the SSR is taken as the estimator [59]. The parameters of the threshold VAR model were estimated through ordinary least square (OLS) conditional on the threshold variable, the number of regimes and the lag order [60].
Before estimating a threshold VAR model, we need to test a threshold effect in the variable system. We use the Wald test statistic for testing the null hypothesis of no differences between regimes. The sup-Wald test statistics is the maximum Wald statistics over all possible threshold values. Andrews and Ploberger [61] suggest the avg- and exp- versions of Wald test statistics, where avg-Wald is the average Wald statistics over all possible threshold values, and exp-Wald is a function of the sum of exponential Wald statistics. To conduct the p-values of the test statistics we use the method in [62], which involves simulating and empirical distribution of sup-, avg- and exp-Wald statistics.
Based on the constructed TVAR model, Granger causality (standard approach) and non-linear impulse response analyses were conducted in each regime. The generalized impulse response function (GIRF) allows us to investigate the dynamics of the model and is able to capture the non-linearities in the impulse response, conditional on the history, the size and the direction (sign) of the shock [63]. It is clear that the impacts of shocks will be different in the threshold model because the initial conditions (ωt−1) matter, which means the path of IRF will be different if a particular shock is started in a low (negative) or high (positive) regime.
The GIRF function is the difference between two conditional expectations with a single exogenous shock. Moreover, the GIRF allows the regimes to switch after a shock and shows different outcomes for different signs of shocks (positive and negative) and different sizes of shocks (+/− one standard deviation or +/− two standard deviations) [57,64].
5. Empirical Results
5.1. Tests for Non-Linearity and TVAR Model
All variables expressed in natural logarithms are tested for the unit roots [65]. The results tabulated in Table 1 and Table 2 indicate that the null hypothesis, if a unit root is present, cannot be rejected at the conventional 5% significance level, but is rejected in all cases when the variables are expressed as first differences. This means that all variables appear to be integrated of the first order, I(1).
Before testing for the threshold value in the vector autoregression representation of the data, we selected the optimal lag order by estimating the linear VAR model. The optimal lag order was determined by using BIC (Bayesian information criterion). This criterion selected two as the optimal lag for the TVAR model. We used EViews 11 and the ThSVAR Add-in to perform the estimation and the generalized impulse response function of TVAR.
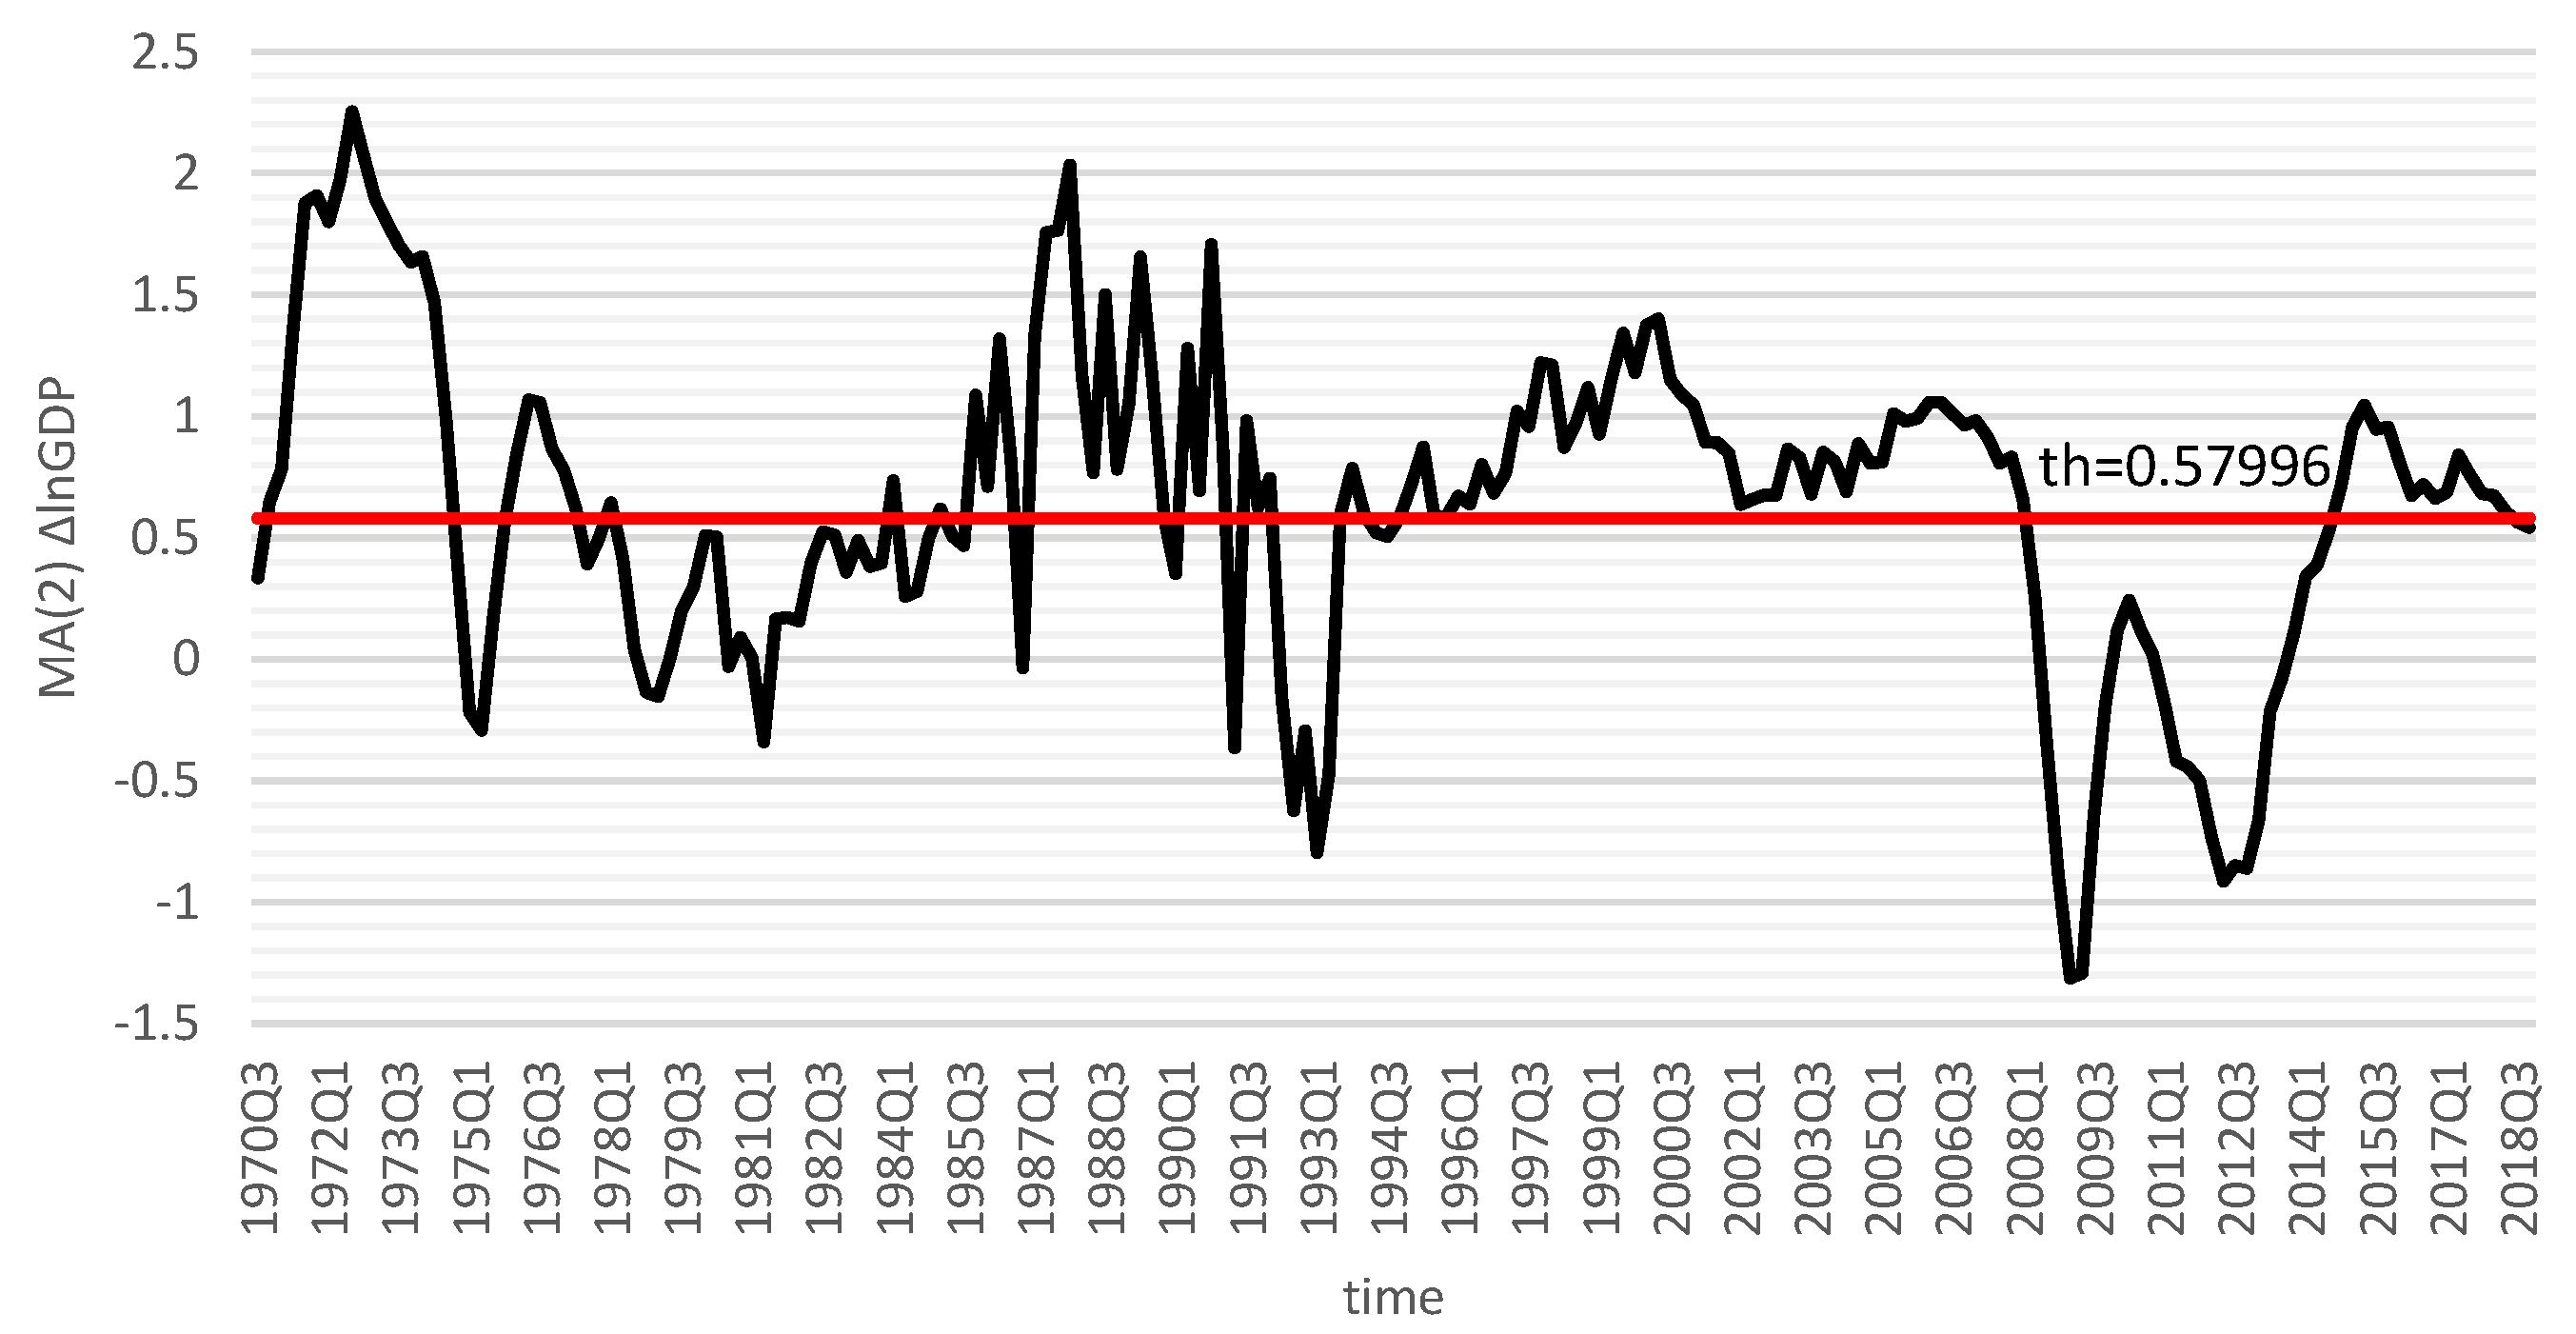
Table 3 presents tests of a linear VAR against a threshold. It is seen from Table 3 that there is strong evidence of threshold effects for the two-quarter moving average of ∆lnGDP. All three test statistics for threshold behavior (sup-Wald, avg-Wald and exp-Wald) provided enough evidence to reject the null hypothesis ( no threshold effect in VAR system), because the p-value is smaller than the significance level (). The estimated threshold value is 0.57966 (see Figure 2). It is seen that the changes in GDP below the threshold value constitute a low regime (recessions), and above the threshold value, an upper regime (expansions).
5.2. Granger Causality in Regimes
After the estimation of the TVAR models, we ran tests for Granger causality (Table 4). It is seen that the pattern of causality differs between the upper regime (expansionary period) and the lower regime (recessionary period). The results provide evidence of bilateral Granger causality between CO2 emissions and GDP in the upper regime (during expansions), but no causality in the lower regime (during recessions). This indicates that it may not be possible to reduce CO2 emissions without hindering economic growth in Spain. Hence, this result may strengthen those who support the view that combating global warming would be a burden on the Spanish economy. Our results are consistent with findings reported by Menyah and Wolde-Rufael [31], who found bidirectional causality between emissions and economic growth, and only partially consistent with Jaforullah and King’s [66] findings of unidirectional causality from real income to CO2 emissions.
In relation to nuclear energy consumption and emissions, Table 4 shows that there is a unidirectional Granger causality running from nuclear energy consumption to CO2 emissions in the upper regime but without feedback. However, there is no causality between renewable energy consumption and CO2 emissions in any direction. This is consistent with [27,67,68] but in contrast to Jaforullah and King’s [4] findings of no causality between nuclear energy consumption and emissions but unidirectional causality running from renewable energy consumption to emissions. Hence, our results seem to indicate that increasing the reliance on nuclear energy, unlike renewable energy, represents an effective strategy for mitigating CO2 emissions—opposite conclusions to [4]. This greater importance of nuclear power than renewable energy in our study reflects the course of changes in the Spanish energy mix, i.e., first, nuclear power has evolved since the end of the 1970s; also, since 2000, the renewable energy market has started to grow. In addition, the intensive development of RES technologies in Spain has been stopped by cuts in renewable energy subsidies and the introduction of the “sun tax” in 2015.
Table 4 also indicates that there is a bidirectional causality running between GDP and nuclear energy consumption during expansions (upper regime). Similar results are obtained for the linear model. This is consistent with the findings of Apergis et al. [67] and Menyah and Wolde-Rufael [31], and partly consistent with Omri et al.’s [51] findings of unidirectional causality running from nuclear energy consumption to GDP, but contrary to Payne and Taylor [69], who found no causality between nuclear energy consumption and economic growth. We also found a unidirectional causality running from renewable energy consumption to GDP in the upper regime, unlike in the linear model. According to the promotion theory [29], this pattern of causality between nuclear and GDP, and renewables and GDP, may suggest that during expansions the economy can more easily bear the higher costs of investments in green energy at an early stage of its development and even accept the slowdown of its growth. However, it is expected that in the long run, green energy development will support sustainable economic growth.
5.3. Generalized Impulse Response Functions in Regimes
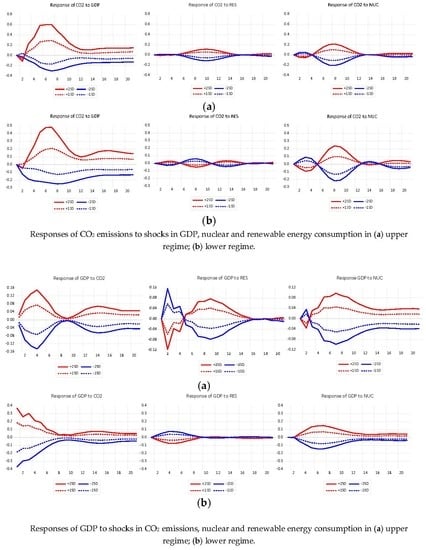
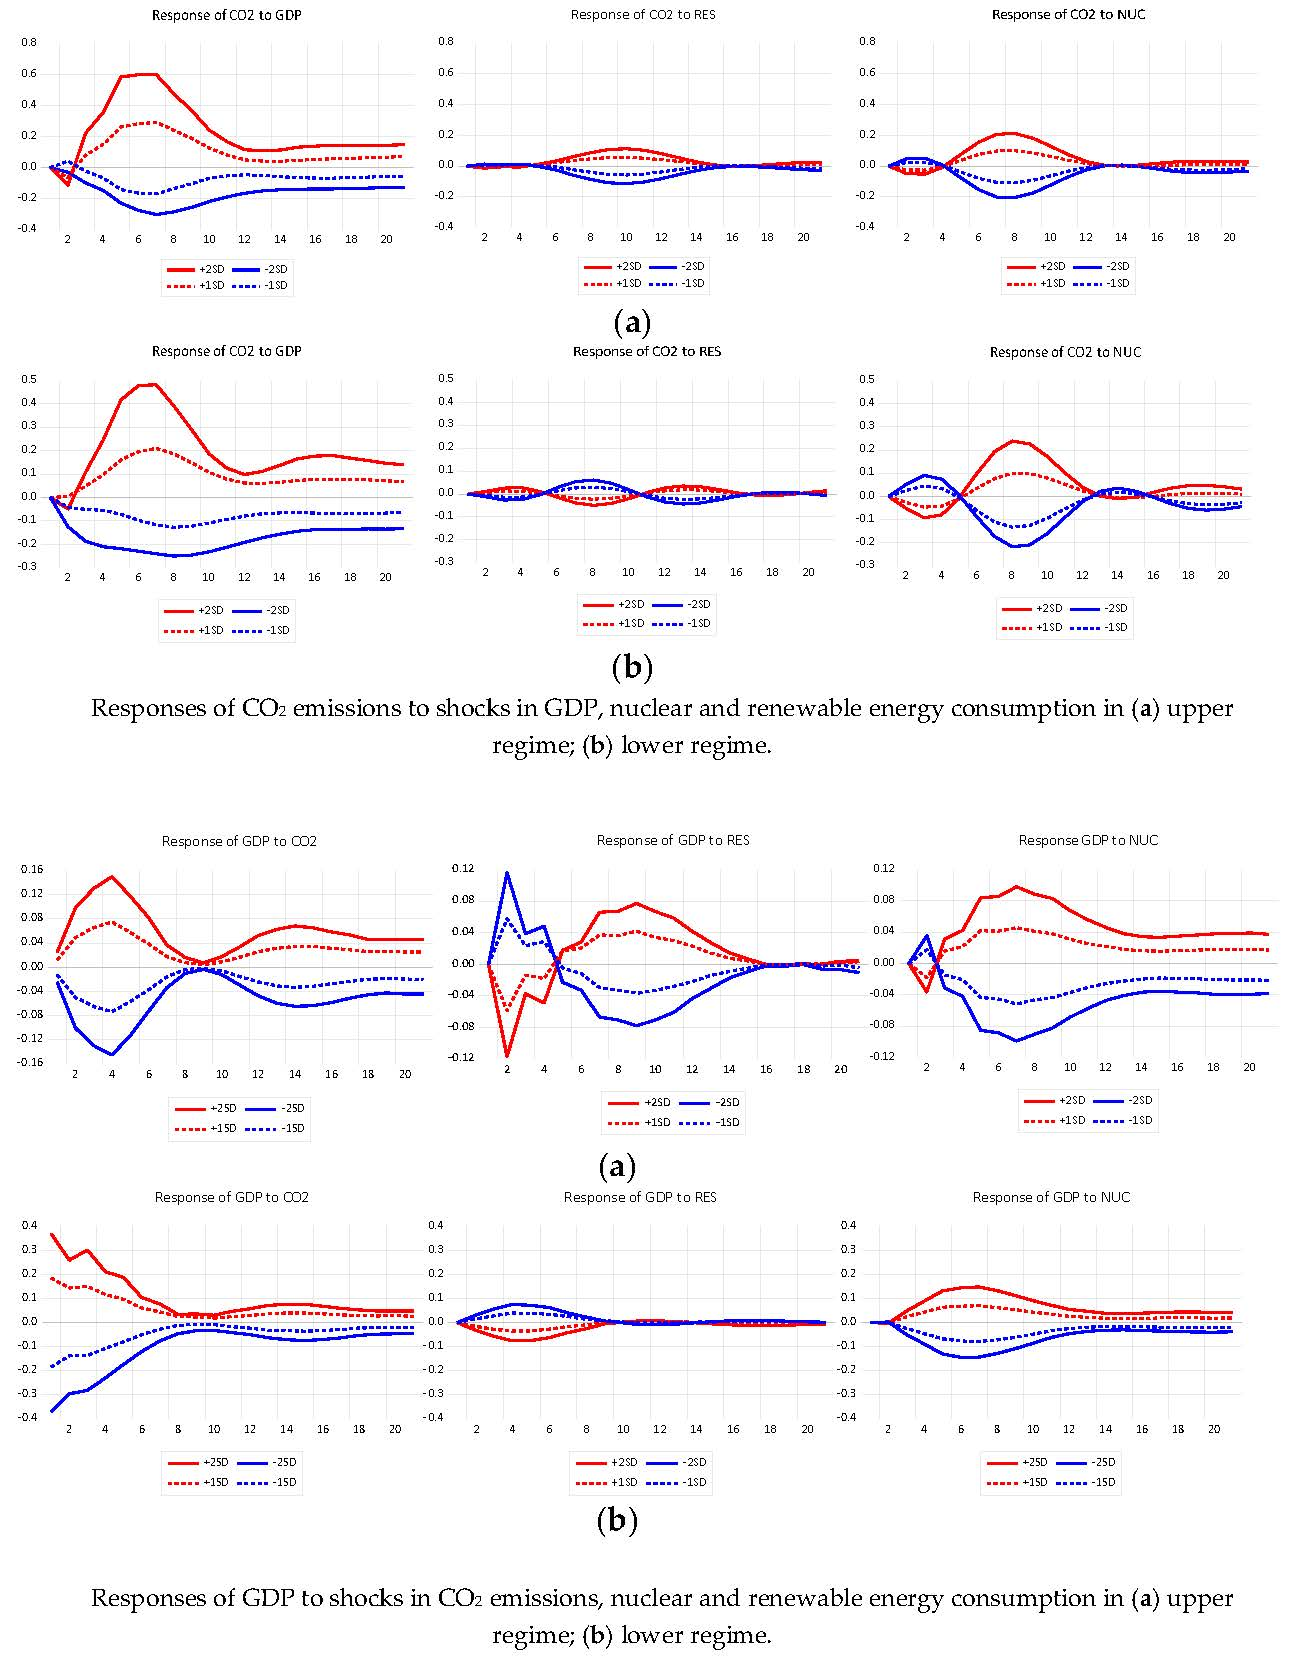
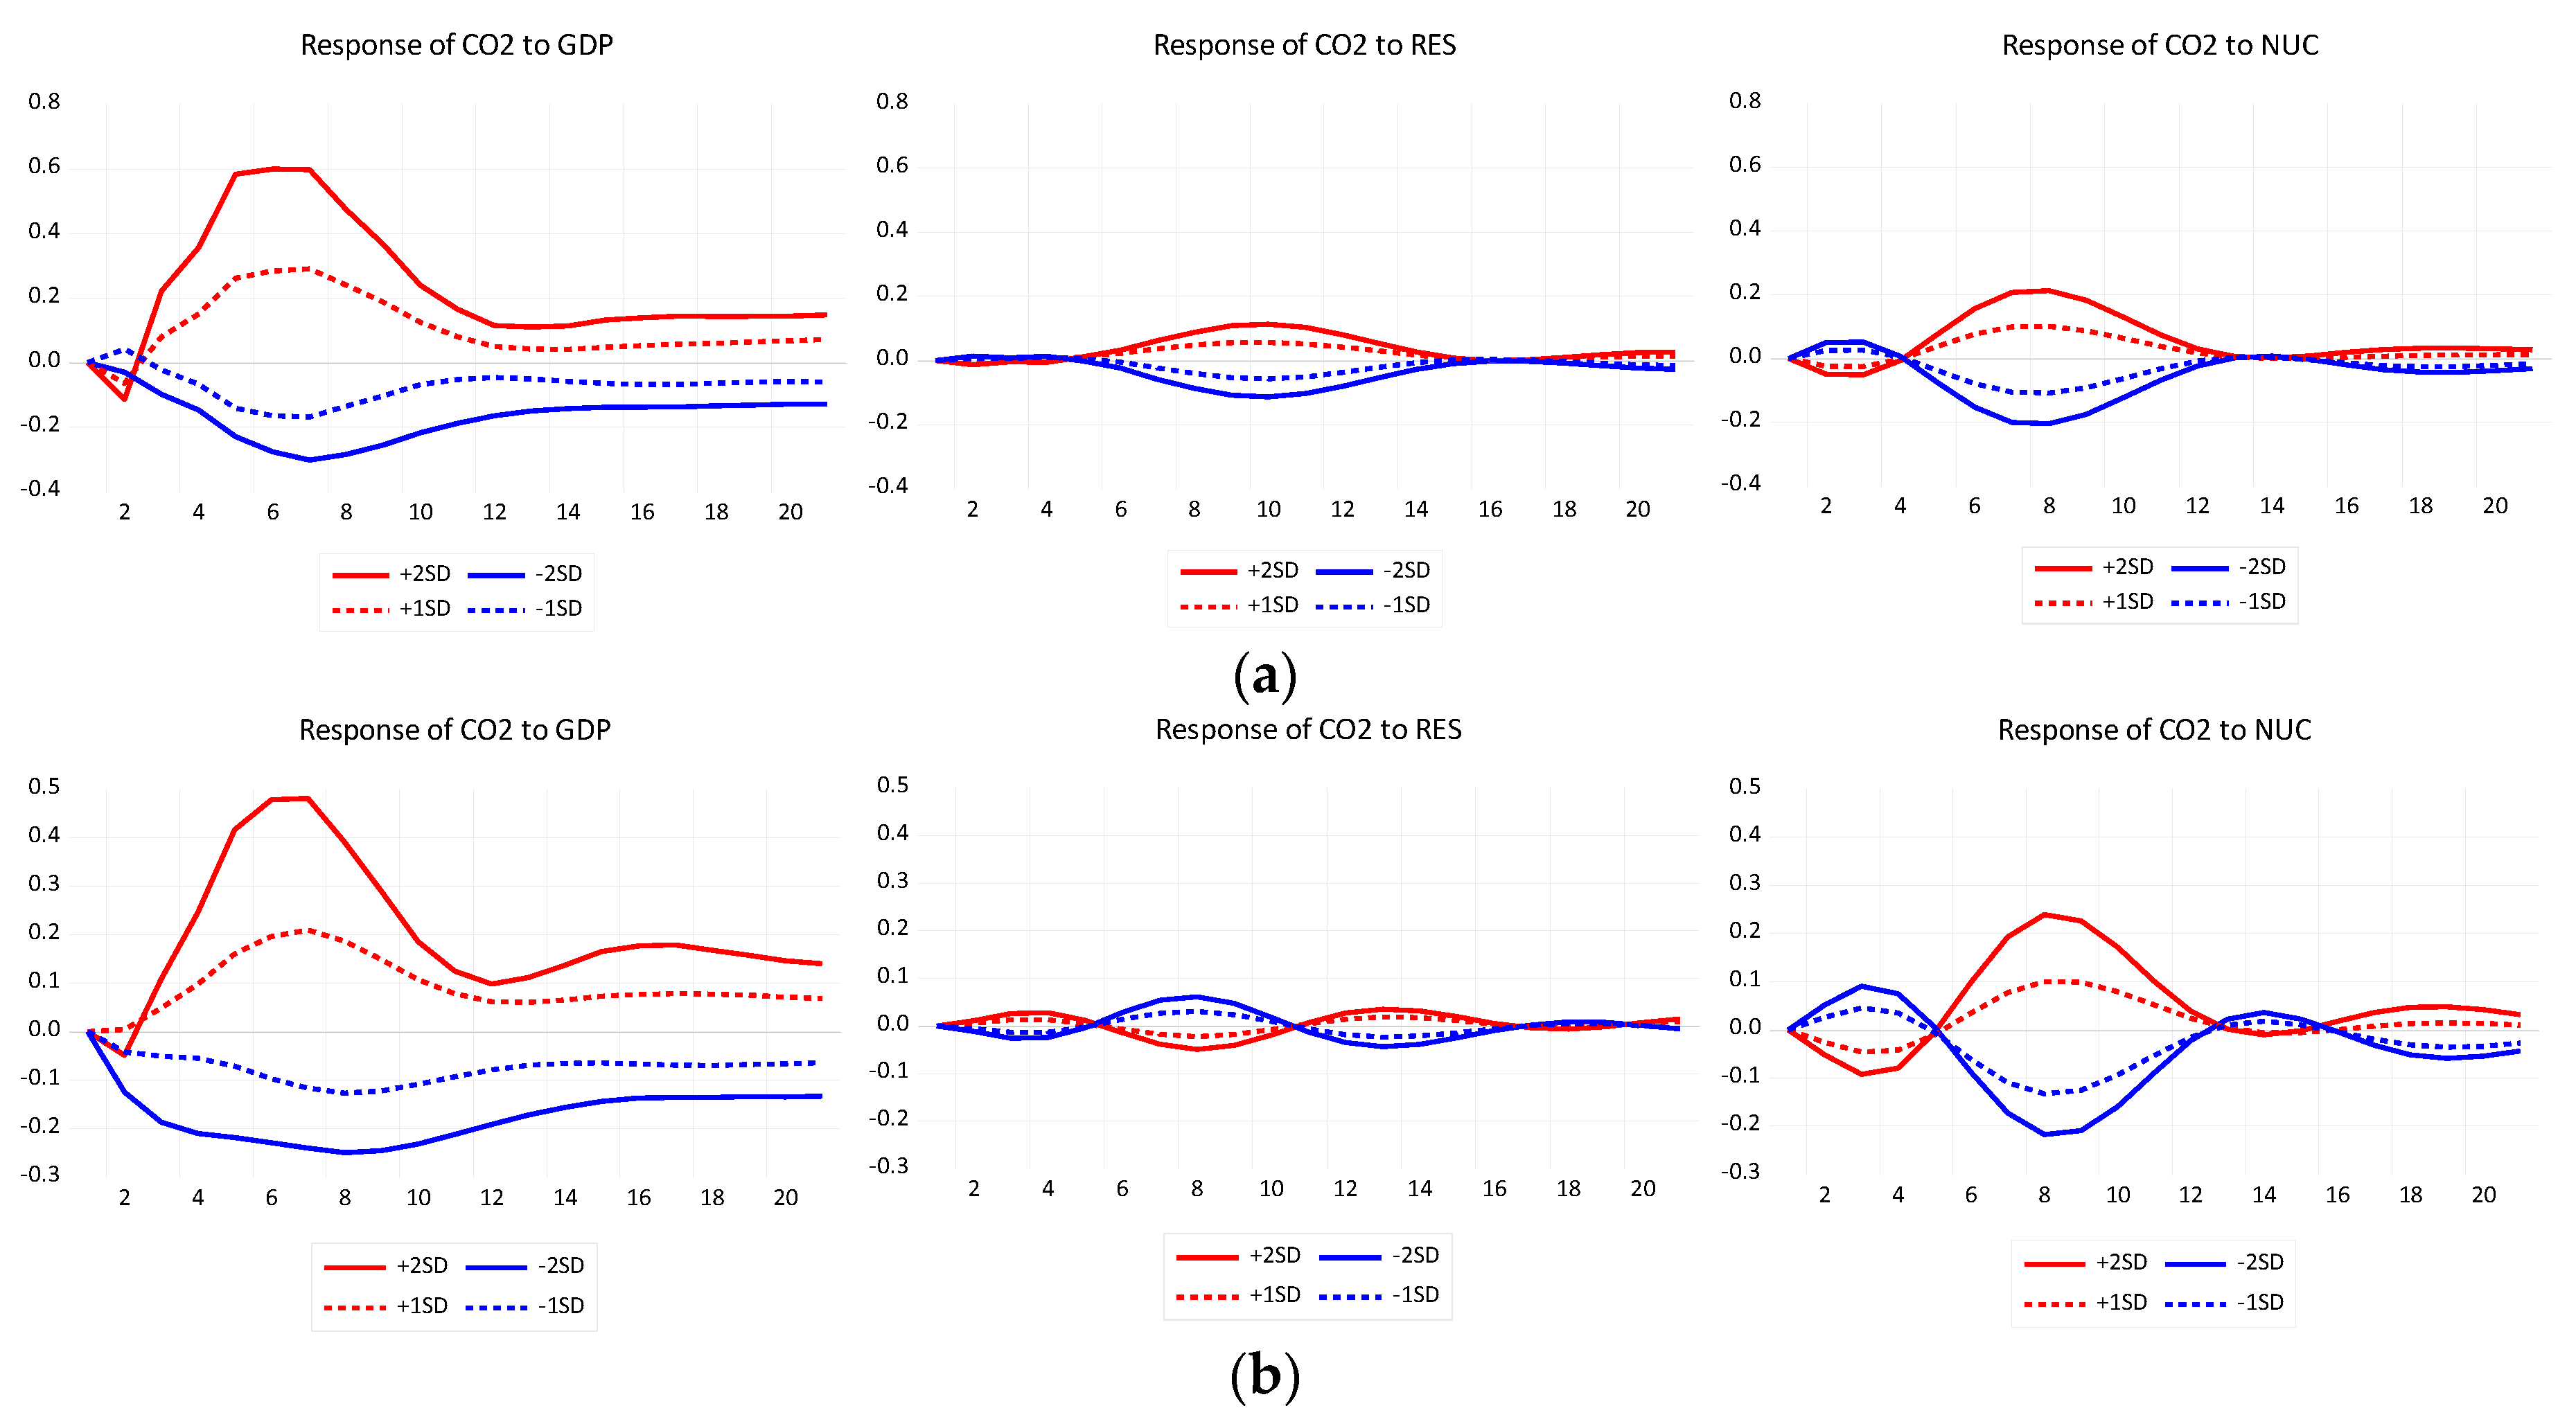
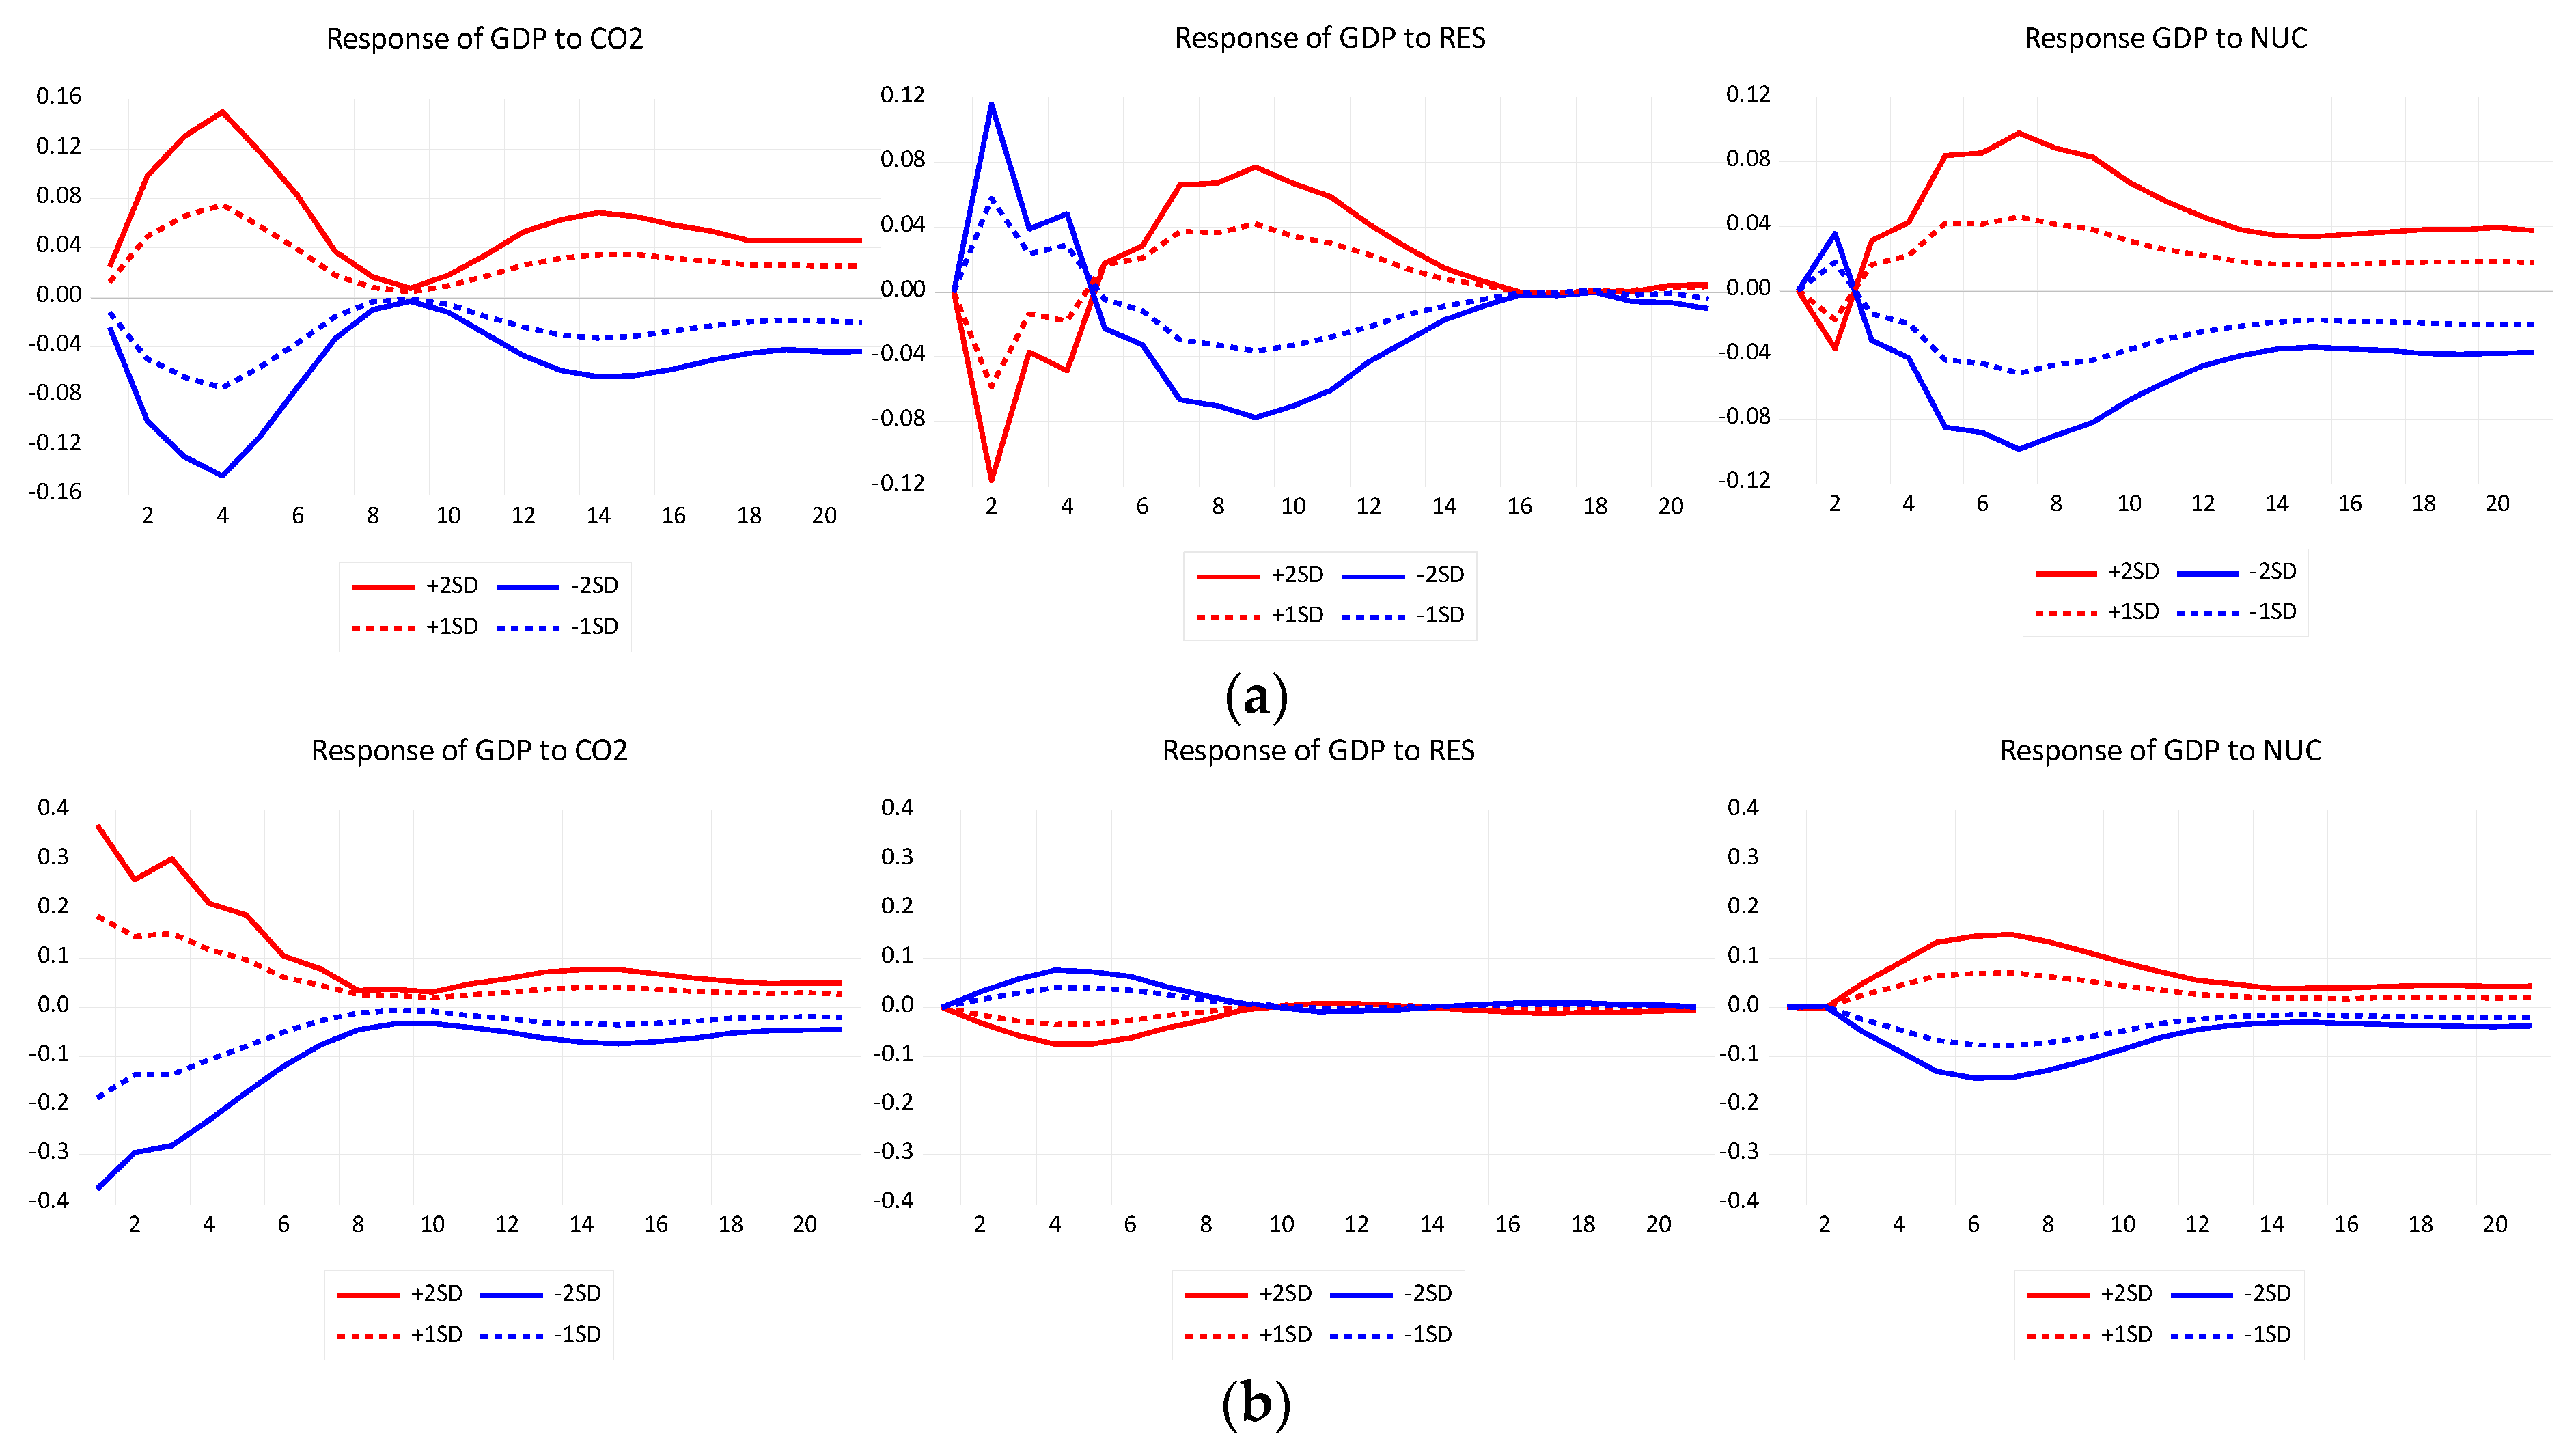
To complement the causality analysis, we applied impulse response functions in order to examine the impacts of innovations in all variables in the system, especially on carbon emissions and economic growth, focusing on significant causal links (Figure 3, Figure 4, Figure 5 and Figure 6). What is striking about the GIRF is that the response of CO2 emissions to GDP shocks is much greater than to the RES and NUCLEAR shocks, in both regimes. One and two standard deviation (1SD and 2SD) positive shocks in GDP have a positive effect on CO2 emissions. This is what we expected to obtain as all economic activity produces carbon dioxide, so emissions tend to be greater in periods of greater economic activity. Figure 3 suggests the existence of asymmetric responses of CO2 emissions to GDP shocks during expansionary periods (upper regime), i.e., the responses of emissions to negative shocks in GDP are not the mirror image of positive GDP shocks; this means that emissions decline but not as much as they grow in the case of positive GDP shocks. It is worth noticing that the upper regime emissions’ response to negative GDP shocks is slightly stronger (deeper) than in the lower regime. In a contraction period (lower regime), an increase in emissions (although insignificant) is observed due to positive shocks in GDP, which is not surprising as lower economic growth still produces carbon dioxide emissions. In turn, responses of GDP are symmetric within a given regime but differ between regimes. In the upper regime, the effect of positive (negative) shocks in CO2 emissions on GDP is positive (negative), but after a year, the trend reaches a peak and then starts declining. In the lower economic activity regime, the response of GDP to positive (negative) emissions shocks is positive (negative), but from the very beginning, it is declining (growing but negative), however insignificantly. Combining this GIRF performance with the causality pattern, i.e., bidirectional causality between emissions and GDP, we can conclude that a conservation policy aimed at reducing CO2 emissions will hinder economic growth, so again, it is evidence that economic growth cannot be decoupled from CO2 emissions. Hence, it seems that a reduction in CO2 emissions can be obtained only at the cost of economic growth, unless the rising demand for energy due to economic development will be met by the increased production of green energy.
It is interesting that the response of emissions to 1SD and 2SD positive shocks in nuclear energy consumption is initially negative but after a year becomes positive (Figure 3). This means that increasing the nuclear energy consumption does contribute to the abatement of emissions; however, this effect quickly wears off. The pattern of emission responses is similar across regimes, but the impact of nuclear shocks on emissions is insignificant in the lower regime (Table 4). What is surprising is that emissions barely respond to RES shocks (independently of sign and size); in fact, they do respond negatively (Figure 3), but the decline in emissions is insignificant (Table 4). Despite the expansion of solar and wind power in Spain, renewable energy alone is not able to mitigate CO2 emissions; some crucial changes in politics and legislation are needed to effectively reduce carbon dioxide emissions. Obviously, increasing renewable and nuclear energy consumption does trigger a reduction in CO2 emissions; however, the increase in emissions due to economic growth is much greater, so a decoupling of economic growth from emissions is not observed.
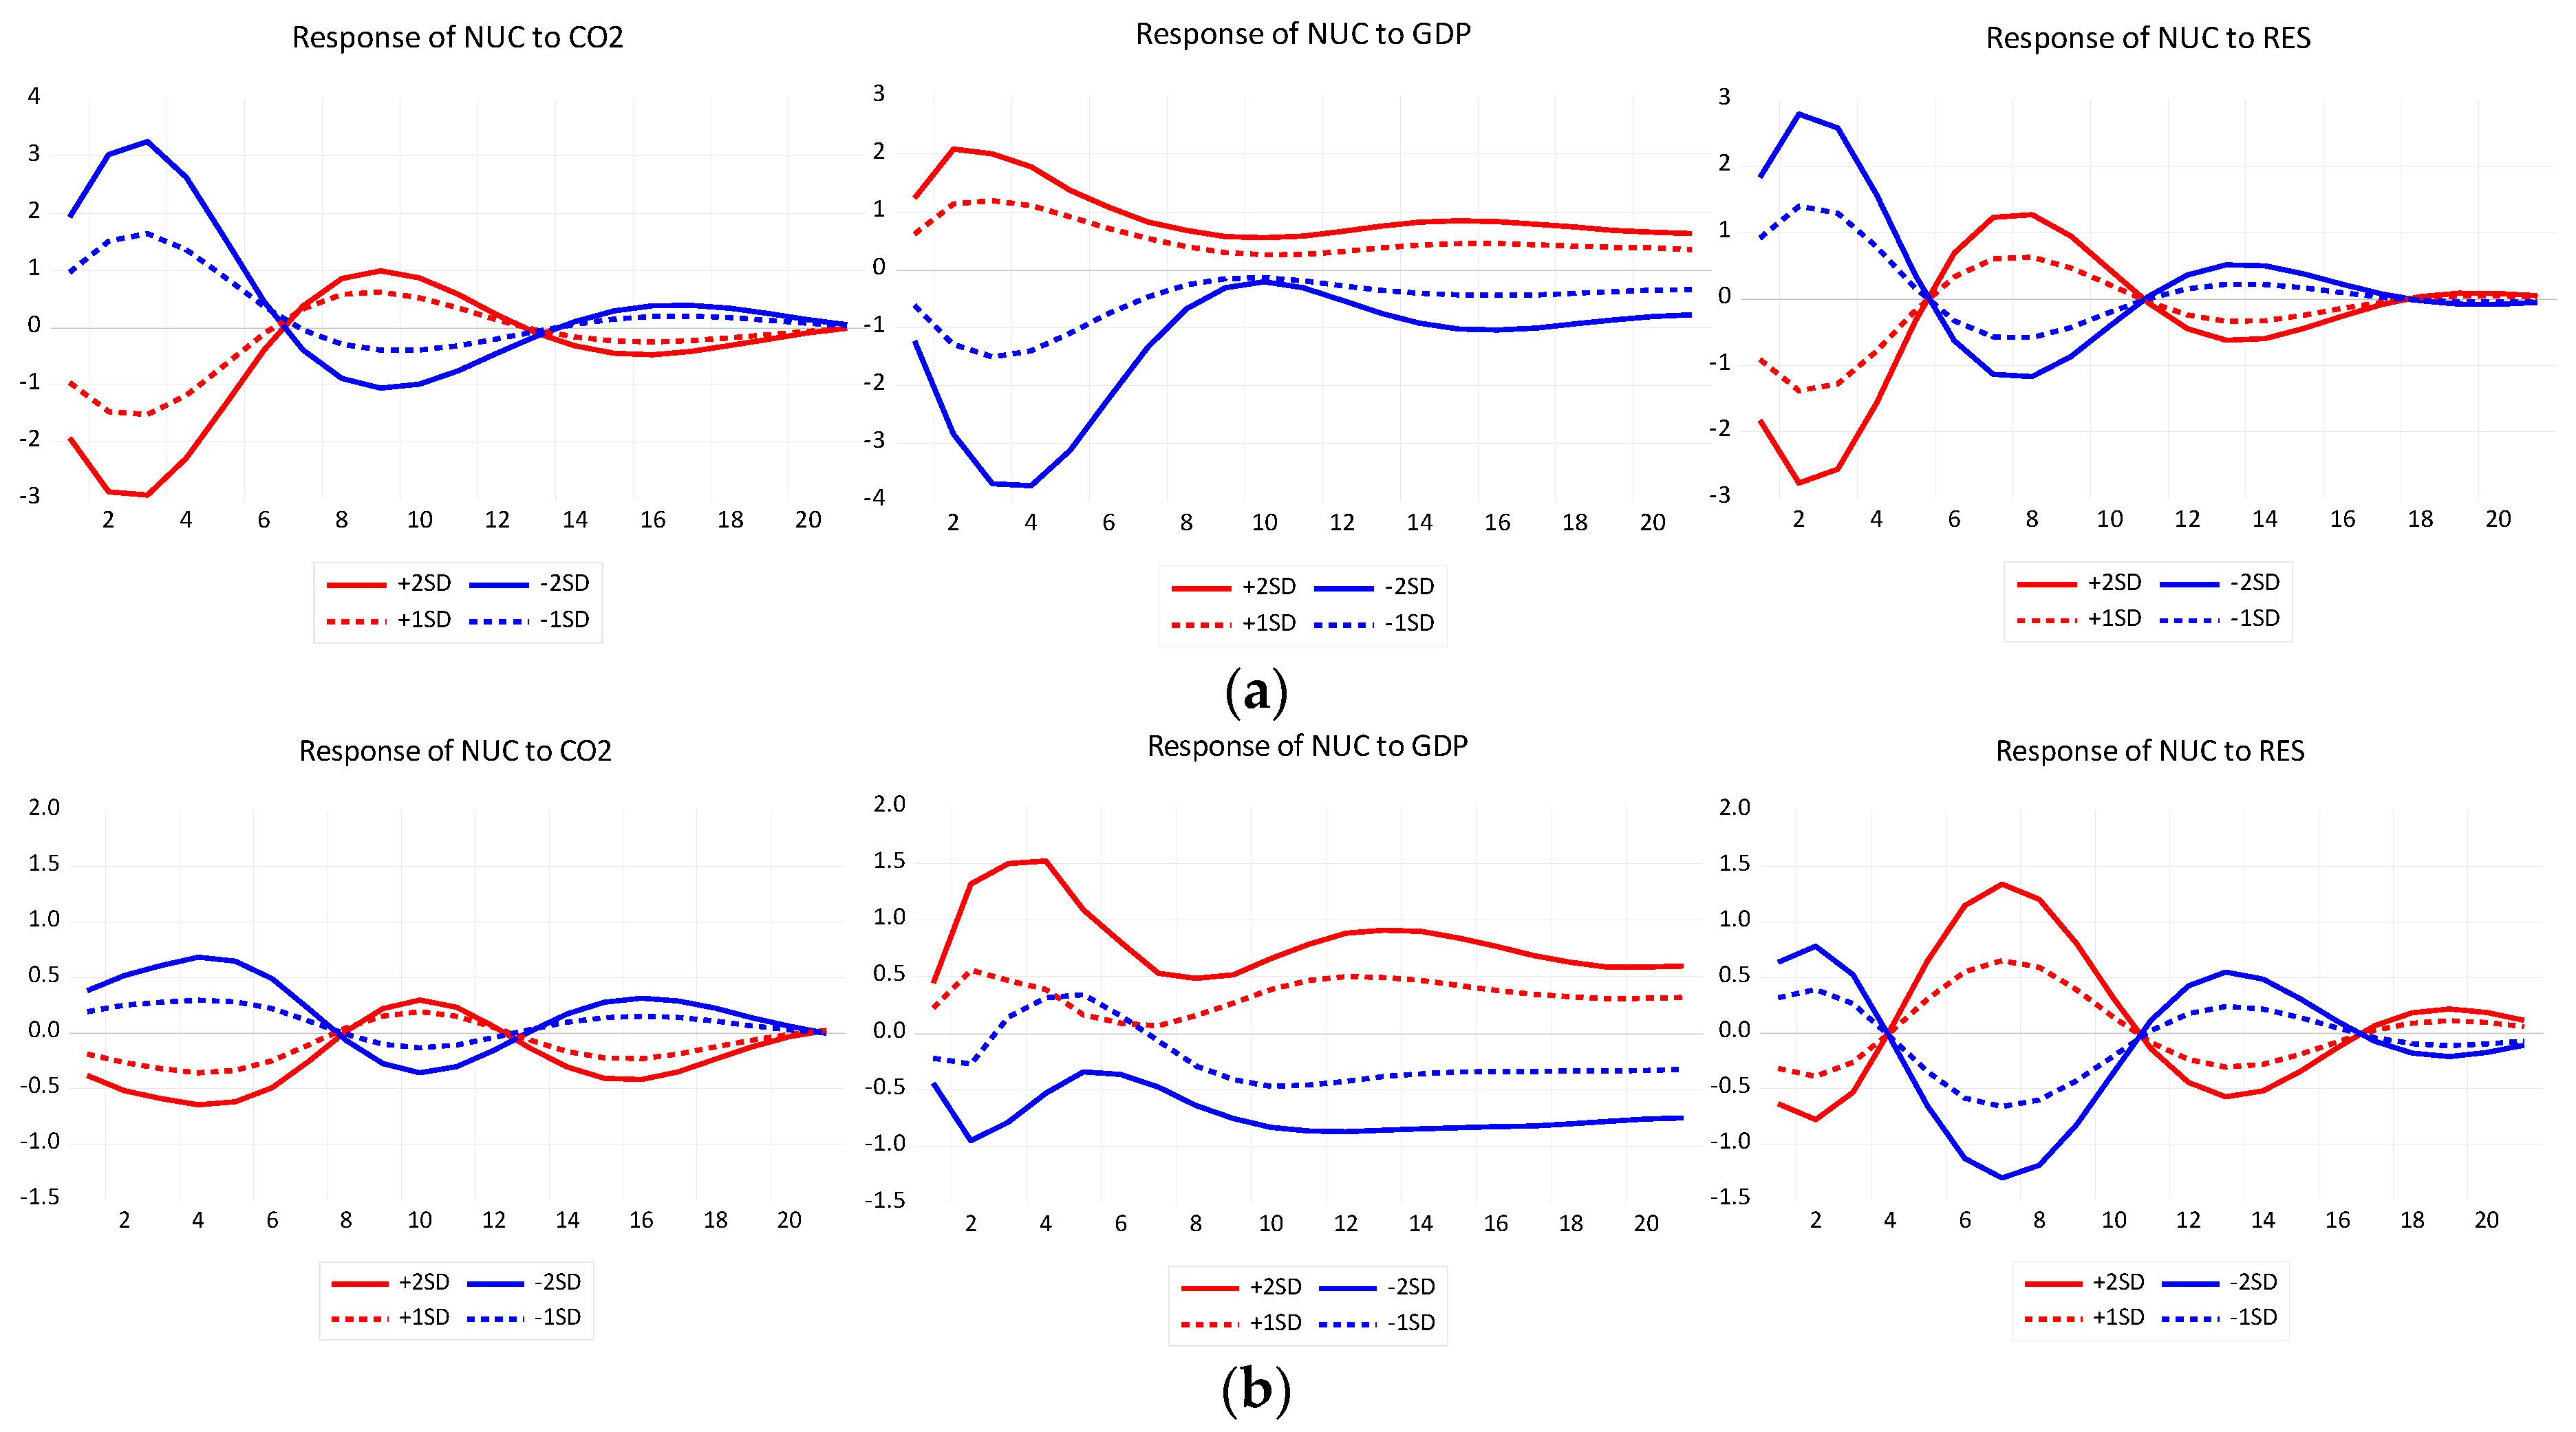
When it comes to the effect of positive shocks in nuclear energy consumption, the economy reacts positively, but the effect soon wears off (Figure 4). At the same time, responses of nuclear energy consumption to positive (negative) shocks in GDP are positive (negative); see Figure 5. These findings indicate that nuclear energy consumption and GDP are interdependent, i.e., nuclear energy consumption stimulates economic growth and vice versa. Moreover, this relationship highlights the importance of the nuclear energy sector in Spain, not only in the context of economic development, but also in terms of global warming and climate change, the depletion of fossil fuel-based resources and high volatile oil prices.
When it comes to the effects of RES shocks, we see that the responses of GDP to positive shocks in renewable energy consumption are negative, but after a year they become positive (the responses to negative shocks in renewable energy consumption are the mirror image of positive shocks); see Figure 4. This suggests that an increase in renewable energy consumption tends to promote economic growth but with a delay. One possible explanation for the initial decrease in GDP caused by an increase in renewable energy consumption is that for many years green energy infrastructure has been subsidized in Spain and a positive impact of renewables on economic growth has only been seen with a delay after reaching a threshold level.
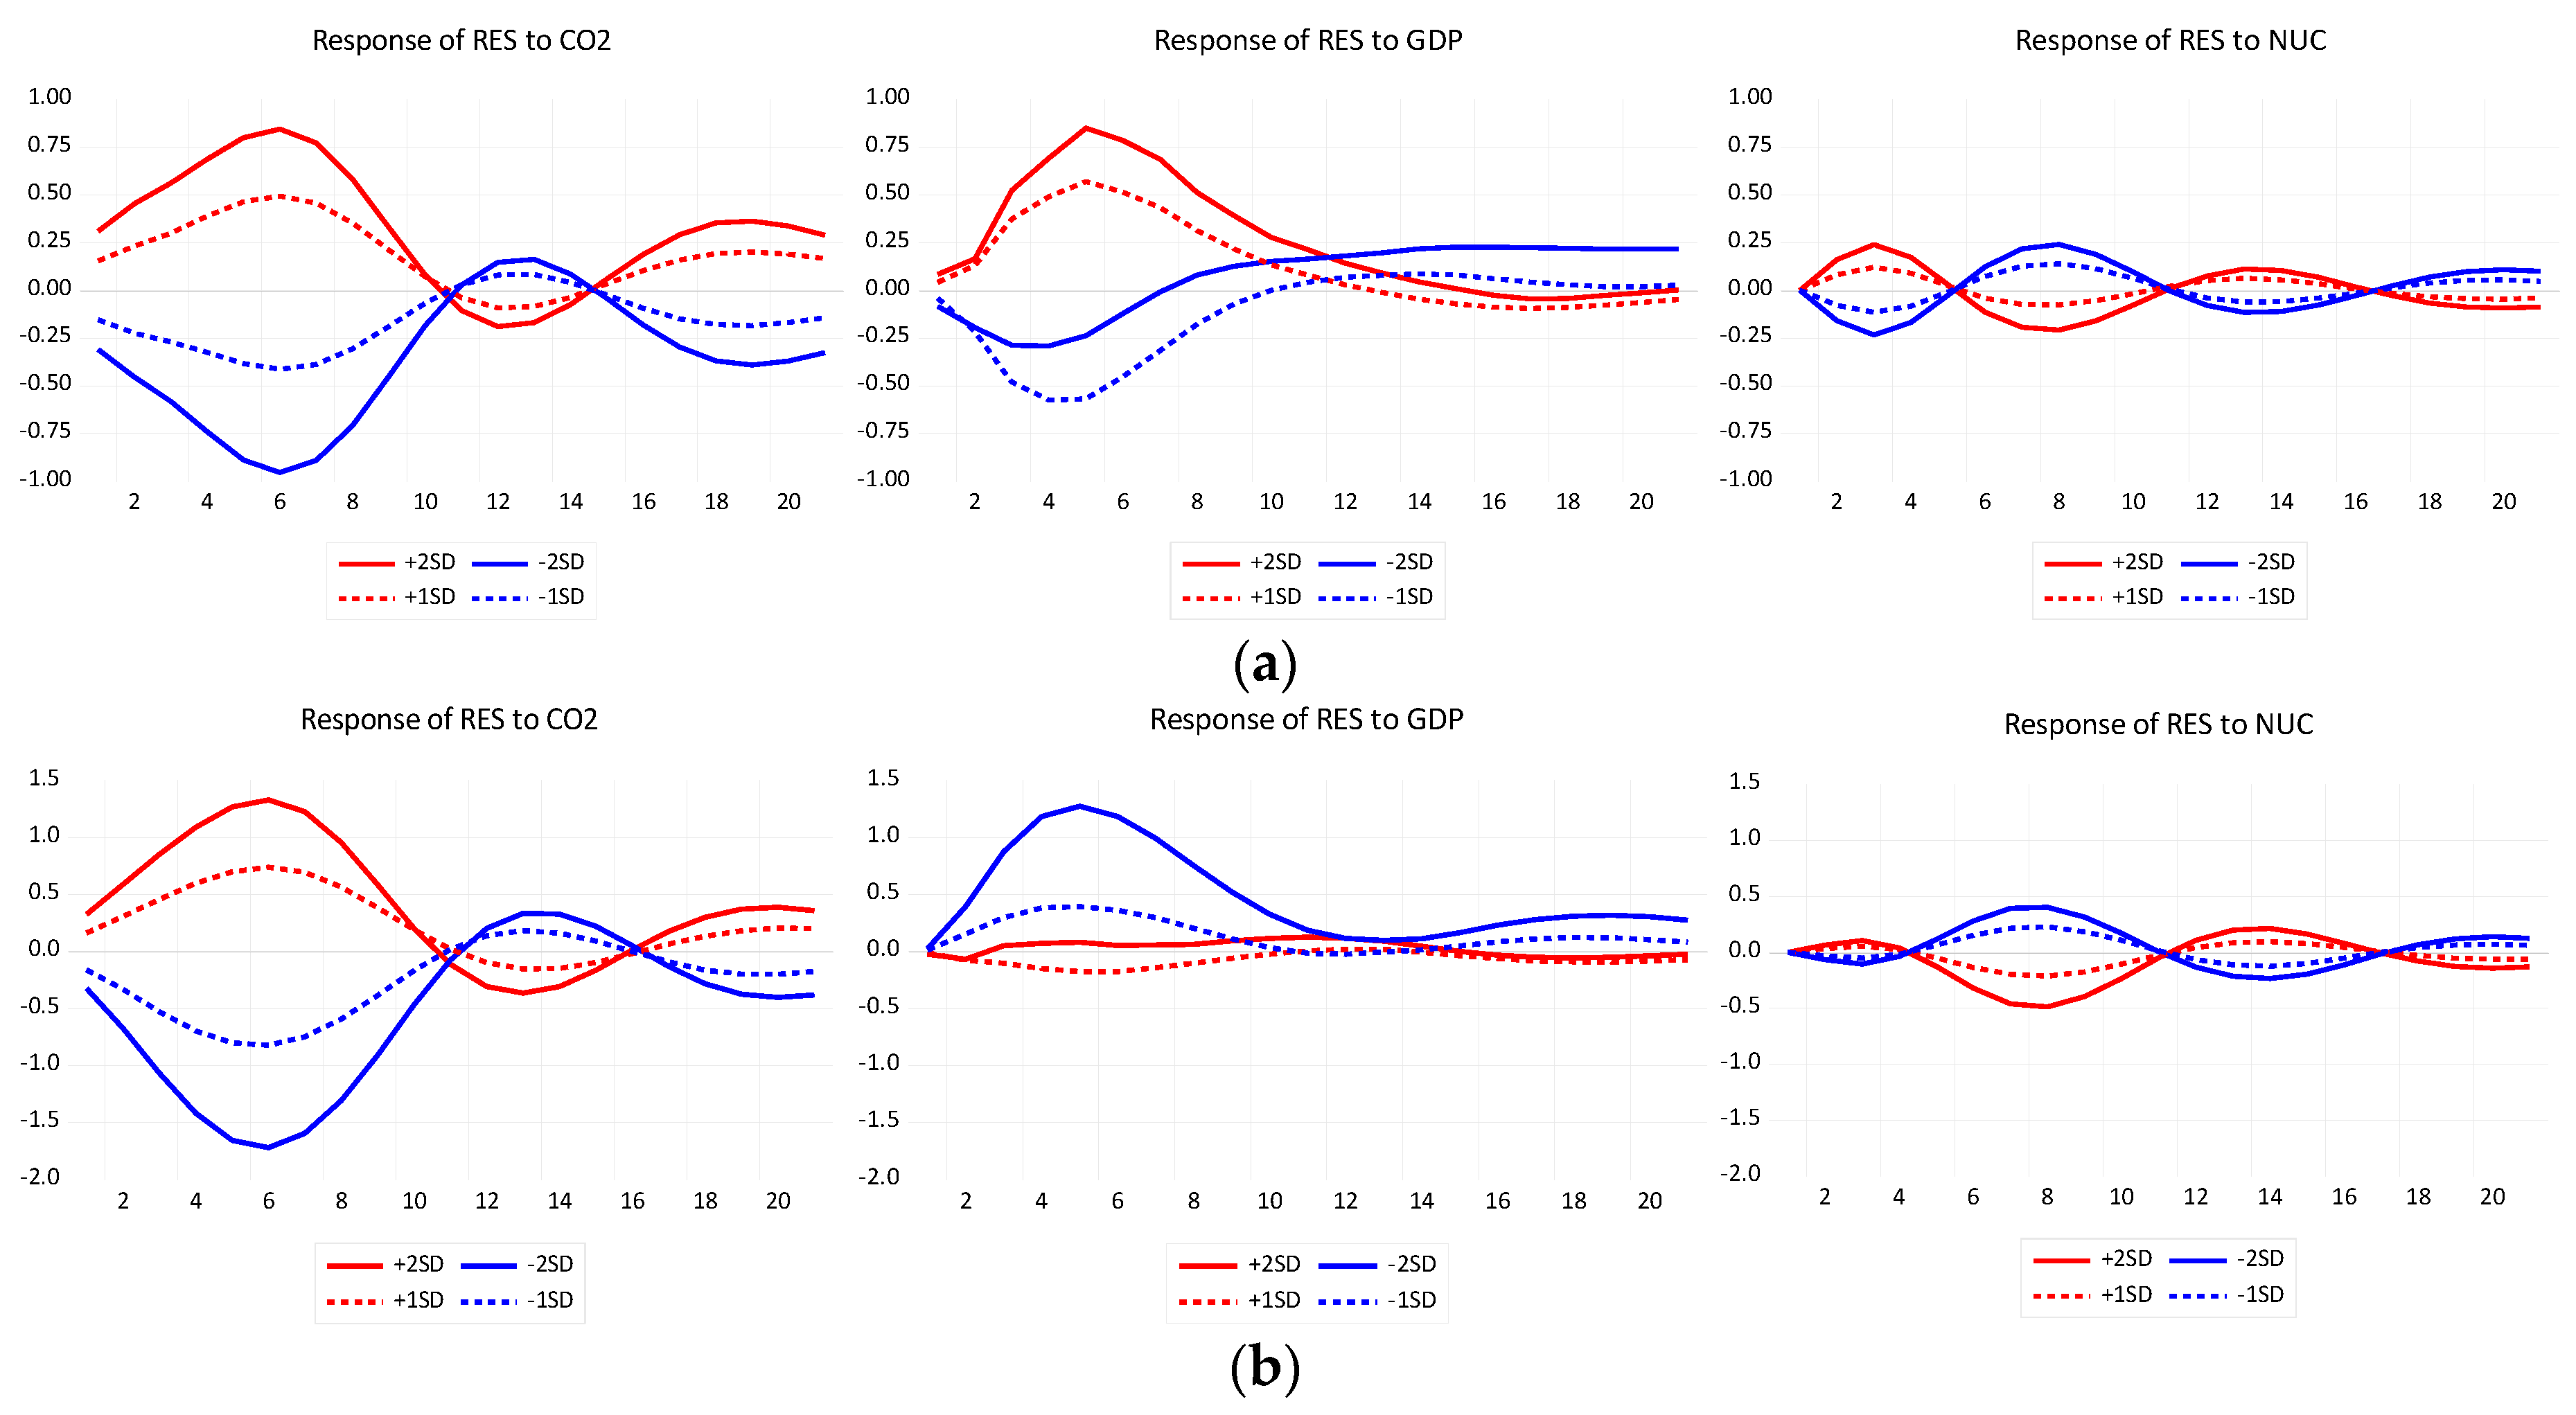
From an examination of Figure 6, it is seen that the responses of renewable energy consumption to changes in GDP seem to be asymmetric within a given regime and across regimes. Although GDP insignificantly Granger-causes renewable energy consumption, examining the impact of changes in GDP on RES may provide useful insights into the procyclical reactions of RES to changes in GDP in the short run. The responses of RES to positive shocks in CO2 emissions are positive and symmetric in both regimes, but insignificant (Table 4). However, this response pattern may be a mark of the increase in the share of renewable energy and its capability to reduce carbon emissions. It is also seen that renewable energy consumption barely responds to shocks in nuclear energy consumption (Figure 6). Interestingly, the opposite reaction, i.e., response of nuclear energy consumption to positive shocks in RES is much larger and negative (Figure 5), although insignificant. This finding seems to indicate that renewable energy has a certain tendency to take the place of nuclear power.
6. Discussion and Conclusions
The objective of the present study was to explore the effects of growing renewable and nuclear energy on economic growth and carbon dioxide emissions in Spain for the period 1970–2018 by applying the threshold vector autoregression (TVAR) model, causality analysis and non-linear impulse response functions in separate regimes describing different phases of the business cycle. The empirical evidence indicates a bidirectional causality between CO2 emissions and economic growth in the upper regime (during expansionary periods), but no causality in the lower regime (during recessionary periods). Furthermore, our analysis reveals that a positive shock on GDP has a positive impact on CO2 emissions, and vice versa. This feedback relationship between carbon dioxide emissions and economic growth suggests that economic development still comes at a cost of environmental quality (there is no decoupling of emissions and economic growth), which requires policymakers to seek a green development path quickly. In addition, we find evidence of a unidirectional relationship running from nuclear energy consumption to CO2 emissions in the upper regime. In general, a positive shock on the nuclear energy consumption decreases CO2 emissions; however, this effect fades quickly. Surprisingly, we find no evidence that the development of renewable energy in Spain has materially lowered emissions. This indicates that the development of green energy alone is insufficient to reduce CO2 emissions effectively as the increase in emissions due to economic growth is still much greater than the decrease in emissions due to the development of green energy. As a result, a decoupling of economic growth from CO2 emissions cannot be observed. These findings demand crucial changes in legislation targeted at reducing emissions.
Furthermore, our findings show that nuclear energy consumption and economic growth are positively interrelated and complement each other. On the one hand, this implies that an increase in nuclear energy consumption boosts economic growth; on the other hand, according to the feedback hypothesis, excessive energy protection and energy conservation policies adversely influence nuclear energy consumption and may lead to pressure on economic growth. We also find unidirectional causality running from renewable energy consumption to economic growth. However, the positive shock in renewable energy consumption causes an increase in economic growth but with some delay (four quarters). Nevertheless, the positive influence of the use of renewable energy on economic growth enhances the development of the renewable energy sector, which provides an additional argument in support of renewable energy as an important energy source in Spain.
Our results indicate negative causality between nuclear energy consumption and carbon dioxide emissions but an insignificant impact of renewable energy consumption on emissions in the study period (1970–2018), suggesting that the contribution of nuclear energy to the abatement of CO2 emissions and global warming is greater than that of renewable energy. However, recent changes (in 2019) in Spanish energy policies have made this conclusion untenable in the long run. Since 2019, Spain has dramatically reduced its reliance on coal-fired power, and as a consequence, CO2 emissions from electricity generation fell by 33.3% in 2019 in comparison to 2018 (43 million tons of carbon dioxide released into the atmosphere in 2019 by the power sector compared to 64.5 million in 2018), according to figures from Red Eléctrica de España [70], the national power grid operator. Thus, Spain achieved in one year (2019) its goal of not using coal in power plants to generate electricity, which was expected to take a decade (by 2030). Spain was able to reach such a substantial reduction in emissions as it stopped providing state aid to its failing coal mines because of the need to adapt to European Union regulations and the poor profitability of national coal deposits.
Another reason for the reduction in emissions was the agreement of EU countries to set a price for releasing carbon dioxide that was sufficiently high to discourage the use of fossil fuels. During 2019, the price of a ton of CO2 was equal to €25, meaning that in many European countries, coal-fired electricity has not been as profitable as other options like natural gas or renewable energy. This indicates that, after nearly 15 years, the EU emissions trading scheme has proved to be a useful instrument for fighting climate changes in Europe.
Another explanation for the reduction in coal-powered electricity is the drop in natural gas price and the introduction of renewable energy. Green energy installations increased by 10% in 2019. The REE reported that 36.8% of the country’s electricity came from renewable energy sources, and in addition, 58.6% was free of CO2 emissions (from both renewable and nuclear power). The fall in coal-fired power stations is expected to be reflected in a global fall in carbon dioxide emissions in 2019, although the transportation sector, which is lagging behind other sectors, such as power generation, when it comes to decarbonization, may hold Spain back in the fight against climate change. The transportation sector (namely cars and trucks) accounts for 27% of the Spanish economy’s dioxide emissions, while industry contributed 19% and the power sector 17%. It seems that—like in recent years—the drop in power plant emissions will be compensated for by the rise in transportation emissions (the government’s forecast admitted that Spain’s greenhouse gas emissions from transportation will grow by 15% between 2020 and 2030).
In addition, the Spanish government hopes to move away from nuclear energy [71] by 2035 (this source of energy has covered almost 20%–25% of mainland Spanish electricity demand over the last 15 years). Nuclear energy does not have such support in many societies and is resisted by environmental groups due to problems like the extremely long lifetime of radioactive waste, the disastrous consequences in the event of accidents and the high costs of construction, maintenance and dismantling of the power plants. Therefore, nuclear energy in Spain is to be replaced by renewable energy with gas as a backup, but this transition must be made gradually so as not to provoke shocks in the market and the price.
Although it is still too early to make a categorical assessment, these deep changes in Spanish energy policy seem to lay the foundation for a decoupling of emissions and economic activity in the future. However, the general question arises of whether the decarbonization of not just the Spanish economy but also other world economies is sufficient to avoid dangerous climate change and ensure achievable warming of less than 2 °C. Recent publications by climate scientists [72,73,74] are alarming: they suggest that these downward trends in energy and carbon intensity are insufficient to decouple economic growth and CO2 emissions, and that they are nowhere close to what is needed to meet the longer-term Paris pledges or the recommendations of the IPCC (2018). They warn that even if global emissions are drastically cut down in line with the 66% below 2 °C goal of COP21 (Paris climate agreement of December 2015), a series of self-reinforcing bio-geophysical feedbacks and tipping cascades (like melting sea ice or deforestation) could still contribute to the continued warming of the planet. Therefore, without a concerted policy shift to deep decarbonization, a fast transition to renewable energy sources, structural changes in production, consumption and transportation, and a transformation of finance, the decoupling will not even come close to what is needed [73,74,75]. On the other hand, there are projections [74,76] that, even under the optimistic assumption that humanity manages to bring about historically unprecedented reductions in carbon intensity and energy intensity in order to keep warming below 1.5 °C, future global economic growth must be substantially below the historical annual income growth rate (1.93%) during 1971–2015. However, the economic, political and social consequences of this are hard to predict.
Supplementary Materials
Author Contributions
Dataset preparation and literature review, A.W.; formal analysis, M.P., A.G., and A.W.; methodology, A.G.; conceptualization, supervision and project administration, M.P.; writing—original draft, revision and editing, M.P., A.G., A.W. All authors have read and agreed to the published version of the manuscript.
Funding
This research received no external funding.
Conflicts of Interest
The authors declare no conflict of interest.
References
- IPCC Summary for Policymakers—Global Warming of 1.5 °C, an IPCC Special Report. Available online: https://www.researchgate.net/publication/329866816_Summary_for_Policymakers_In_Global_warming_of_15C_An_IPCC_Special_Report (accessed on 25 February 2020).
- Intergovernmental Panel on Climate Change (IPCC). Mitigation of Climate Change: Energy Systems. Fifth Assessment Report; IPCC: Geneva, Switzerland, 2014. [Google Scholar]
- WEO-2015 Special Report: Energy and Climate Change—Analysis—IEA; IEA: Paris, France, 2015.
- Jaforullah, M.; King, A. Does the use of renewable energy sources mitigate CO2 emissions? A reassessment of the US evidence. Energy Econ. 2015, 49, 711–717. [Google Scholar] [CrossRef]
- Jin, T.; Kim, J. What is better for mitigating carbon emissions—Renewable energy or nuclear energy? A panel data analysis. Renew. Sustain. Energy Rev. 2018, 91, 464–471. [Google Scholar] [CrossRef]
- Berahab, R. Decoupling economic growth from CO2 emissions in the world. Policy Notes Policy Briefs 2017. [Google Scholar]
- Choi, E.; Heshmati, A.; Cho, Y. An Empirical Study of the Relationships between CO2 Emissions, Economic Growth and Openness; IZA Discussion Paper, 5304; Institute of Labor Economics (IZA): Bonn, Germany, 2010. [Google Scholar]
- Jorgenson, A.K.; Clark, B. Are the economy and the environment decoupling? A comparative international study, 1960–2005. Am. J. Sociol. 2012, 118, 1–44. [Google Scholar] [CrossRef]
- Mikayilov, J.I.; Hasanov, F.J.; Galeotti, M. Decoupling of CO2 emissions and GDP: A time-varying cointegration approach. Ecol. Indic. 2018, 95, 615–628. [Google Scholar] [CrossRef]
- Piłatowska, M.; Włodarczyk, A. Decoupling Economic Growth From Carbon Dioxide Emissions in the EU Countries. Montenegrin J. Econ. 2018, 14, 7–26. [Google Scholar] [CrossRef]
- Richmond, A.K.; Kaufmann, R.K. Is there a turning point in the relationship between income and energy use and/or carbon emissions? Ecol. Econ. 2006, 56, 176–189. [Google Scholar] [CrossRef]
- Tapio, P. Towards a theory of decoupling: Degrees of decoupling in the EU and the case of road traffic in Finland between 1970 and 2001. Transp. Policy 2005, 12, 137–151. [Google Scholar] [CrossRef] [Green Version]
- Vavrek, R.; Chovancova, J. Decoupling of Greenhouse Gas Emissions from Economic Growth in V4 Countries. Procedia Econ. Financ. 2016, 39, 526–533. [Google Scholar] [CrossRef] [Green Version]
- IEA Global Energy-Related Emissions of Carbon Dioxide Stalled in 2014. Available online: https://www.iea.org/news/global-energy-related-emissions-of-carbon-dioxide-stalled-in-2014 (accessed on 26 February 2020).
- Fischer-Kowalski, M. (Ed.) Decoupling Environmental Resource Use and Economic Growth Summary; UNEP: Nairobi, Kenya, 2011; ISBN 978-92-807-3167-5. [Google Scholar]
- Fosten, J.; Morley, B.; Taylor, T. Dynamic misspecification in the environmental Kuznets curve: Evidence from CO2 and SO2 emissions in the United Kingdom. Ecol. Econ. 2012, 76, 25–33. [Google Scholar] [CrossRef] [Green Version]
- Jackson, R.B.; Canadell, J.G.; Le Quéré, C.; Andrew, R.M.; Korsbakken, J.I.; Peters, G.P.; Nakicenovic, N. Reaching peak emissions. Nat. Clim. Chang. 2016, 6, 7–10. [Google Scholar] [CrossRef] [Green Version]
- Weizsäcker, E.U.; de Larderel, J.; Hargroves, K.; Hudson, C.; Smith, M.; Rodrigues, M. Decoupling 2 Technologies, Opportunities and Policy Options; UNEP: Nairobi, Kenya, 2014; ISBN 978-92-807-3383-9. [Google Scholar]
- York, R.; McGee, J.A. Does Renewable Energy Development Decouple Economic Growth from CO2 Emissions? Socius 2017, 3. [Google Scholar] [CrossRef] [Green Version]
- McGee, J.A. Does certified organic farming reduce greenhouse gas emissions from agricultural production? Agric. Human Values 2015, 32, 255–263. [Google Scholar] [CrossRef]
- York, R. Do alternative energy sources displace fossil fuels? Nat. Clim. Chang. 2012, 2, 441–443. [Google Scholar] [CrossRef]
- Lahiani, A.; Sinha, A.; Shahbaz, M. Renewable energy consumption, income, CO2 emissions, and oil prices in G7 countries: The importance of asymmetries. J. Energy Dev. 2018, 43, 157–191. [Google Scholar]
- Sharif, A.; Mishra, S.; Sinha, A.; Jiao, Z.; Shahbaz, M.; Afshan, S. The renewable energy consumption-environmental degradation nexus in Top-10 polluted countries: Fresh insights from quantile-on-quantile regression approach. Renew. Energy 2020, 150, 670–690. [Google Scholar] [CrossRef] [Green Version]
- Acaravci, A.; Ozturk, I. On the relationship between energy consumption, CO2 emissions and economic growth in Europe. Energy 2010, 35, 5412–5420. [Google Scholar] [CrossRef]
- Magazzino, C. The relationship between CO2 emissions, energy consumption and economic growth in Italy. Int. J. Sustain. Energy 2014, 35, 844–857. [Google Scholar] [CrossRef]
- Mercan, M.; Karakaya, E. Energy Consumption, Economic Growth and Carbon Emission: Dynamic Panel Cointegration Analysis for Selected OECD Countries. Procedia Econ. Financ. 2015, 23, 587–592. [Google Scholar] [CrossRef] [Green Version]
- Tiwari, A.K. A structural VAR analysis of renewable energy consumption, real GDP and CO2 emissions: Evidence from India. Econ. Bull. 2011, 31, 1793–1806. [Google Scholar]
- Ozcan, B.; Ari, A. Nuclear Energy Consumption-economic Growth Nexus in OECD: A Bootstrap Causality Test. Procedia Econ. Financ. 2015, 30, 586–597. [Google Scholar] [CrossRef] [Green Version]
- Han, D.; Li, T.; Feng, S.; Shi, Z. Application of threshold regression analysis to study the impact of clean energy development on China’s carbon productivity. Int. J. Environ. Res. Public Health 2020, 17, 1060. [Google Scholar] [CrossRef] [Green Version]
- Baek, J.; Pride, D. On the income-nuclear energy—CO2 emissions nexus revisited. Energy Econ. 2014, 43, 6–10. [Google Scholar] [CrossRef]
- Menyah, K.; Wolde-Rufael, Y. CO2 emissions, nuclear energy, renewable energy and economic growth in the US. Energy Policy 2010, 38, 2911–2915. [Google Scholar] [CrossRef]
- Zafrilla, J.E.; Cadarso, M.Á.; Monsalve, F.; De La Rúa, C. How carbon-friendly is nuclear energy? A hybrid MRIO-LCA model of a Spanish facility. Environ. Sci. Technol. 2014, 48, 14103–14111. [Google Scholar] [CrossRef]
- Bhattacharya, M.; Awaworyi Churchill, S.; Paramati, S.R. The dynamic impact of renewable energy and institutions on economic output and CO2 emissions across regions. Renew. Energy 2017, 111, 157–167. [Google Scholar] [CrossRef]
- Dogan, E.; Seker, F. Determinants of CO2 emissions in the European Union: The role of renewable and non-renewable energy. Renew. Energy 2016, 94, 429–439. [Google Scholar] [CrossRef]
- Shafiei, S.; Salim, R.A. Non-renewable and renewable energy consumption and CO2 emissions in OECD countries: A comparative analysis. Energy Policy 2014, 66, 547–556. [Google Scholar] [CrossRef] [Green Version]
- Vasylieva, T.; Lyulyov, O.; Bilan, Y.; Streimikiene, D. Sustainable Economic Development and Greenhouse Gas Emissions: The Dynamic Impact of Renewable Energy Consumption, GDP, and Corruption. Energies 2019, 12, 3289. [Google Scholar] [CrossRef] [Green Version]
- Balsalobre-Lorente, D.; Shahbaz, M.; Roubaud, D.; Farhani, S. How economic growth, renewable electricity and natural resources contribute to CO2 emissions? Energy Policy 2018, 113, 356–367. [Google Scholar] [CrossRef] [Green Version]
- Silva, S.; Soares, I.; Pinho, C. The impact of renewable energy sources on economic growth and CO2 emissions—A svar approach. Eur. Res. Stud. J. 2012, 15, 133–144. [Google Scholar] [CrossRef] [Green Version]
- Apergis, N.; Payne, J.E. Renewable energy consumption and economic growth: Evidence from a panel of OECD countries. Energy Policy 2010, 38, 656–660. [Google Scholar] [CrossRef]
- Bulut, U. The impacts of non-renewable and renewable energy on CO2 emissions in Turkey. Environ. Sci. Pollut. Res. 2017, 24, 15416–15426. [Google Scholar] [CrossRef]
- Aguirre, M.; Ibikunle, G. Determinants of renewable energy growth: A global sample analysis. Energy Policy 2014, 69, 374–384. [Google Scholar] [CrossRef] [Green Version]
- Pang, R.Z.; Deng, Z.Q.; Hu, J.L. Clean energy use and total-factor efficiencies: An international comparison. Renew. Sustain. Energy Rev. 2015, 52, 1158–1171. [Google Scholar] [CrossRef]
- Singh, N.; Nyuur, R.; Richmond, B. Renewable Energy Development as a Driver of Economic Growth: Evidence from Multivariate Panel Data Analysis. Sustainability 2019, 11, 2418. [Google Scholar] [CrossRef] [Green Version]
- Luqman, M.; Ahmad, N.; Bakhsh, K. Nuclear energy, renewable energy and economic growth in Pakistan: Evidence from non-linear autoregressive distributed lag model. Renew. Energy 2019, 139, 1299–1309. [Google Scholar] [CrossRef]
- Mbarek, M.B.; Khairallah, R.; Feki, R. Causality relationships between renewable energy, nuclear energy and economic growth in France. Environ. Syst. Decis. 2015, 35, 133–142. [Google Scholar] [CrossRef]
- Ocal, O.; Aslan, A. Renewable energy consumption-economic growth nexus in Turkey. Renew. Sustain. Energy Rev. 2013, 28, 494–499. [Google Scholar] [CrossRef]
- Sadorsky, P. Renewable energy consumption, CO2 emissions and oil prices in the G7 countries. Energy Econ. 2009, 31, 456–462. [Google Scholar] [CrossRef]
- Chen, S.; Saud, S.; Bano, S.; Haseeb, A. The nexus between financial development, globalization, and environmental degradation: Fresh evidence from Central and Eastern European Countries. Environ. Sci. Pollut. Res. 2019, 26, 24733–24747. [Google Scholar]
- Menegaki, N.A. Growth and renewable energy in Europe: A random effect model with evidence for neutrality hypothesis. Energy Econ. 2011, 33, 257–263. [Google Scholar] [CrossRef]
- Simionescu, M.; Bilan, Y.; Krajňáková, E.; Streimikiene, D.; Gędek, S. Renewable Energy in the Electricity Sector and GDP per Capita in the European Union. Energies 2019, 12, 2520. [Google Scholar] [CrossRef] [Green Version]
- Omri, A.; Ben Mabrouk, N.; Sassi-Tmar, A. Modeling the causal linkages between nuclear energy, renewable energy and economic growth in developed and developing countries. Renew. Sustain. Energy Rev. 2015, 42, 1012–1022. [Google Scholar] [CrossRef]
- Tahir, A.; Ahmed, J.; Ahmed, W. Robust Quarterization of GDP and Determination of Business Cycle Dates for IGC Partner Countries; SBP Working Paper Series; State Bank of Pakistan: Karachi, Pakistan, 2018. [Google Scholar]
- Bildirici, M.E.; Gökmenoğlu, S.M. Environmental pollution, hydropower energy consumption and economic growth: Evidence from G7 countries. Renew. Sustain. Energy Rev. 2017, 75, 68–85. [Google Scholar] [CrossRef]
- Dones, R.; Heck, T.; Hirschberg, S. Greenhouse Gas Emissions from Energy Systems, Comparison and Overview | Request PDF. Available online: https://www.researchgate.net/publication/253408795_Greenhouse_Gas_Emissions_from_Energy_Systems_Comparison_and_Overview (accessed on 17 March 2020).
- Moreno, J.; Bhattarai, M.; Trouille, B. Pumped Storage in Spain—International Water Power. Available online: https://www.waterpowermagazine.com/features/featurepumped-storage-in-spain/ (accessed on 18 March 2020).
- Kougias, I.; Szabó, S. Pumped hydroelectric storage utilization assessment: Forerunner of renewable energy integration or Trojan horse? Energy 2017, 140, 318–329. [Google Scholar] [CrossRef]
- Baum, A.; Koester, G.B. The Impact of Fiscal Policy on Economic Activity over the Business Cycle-Evidence from a Threshold VAR Analysis; Discussion Paper Series 1: Economic Studies; Deutsche Bundesbank: Frankfurt, Germany, 2011. [Google Scholar]
- Chan, K.S. Consistency and Limiting Distribution of the Least Squares Estimator of a Threshold Autoregressive Model. Ann. Stat. 1993, 21, 520–533. [Google Scholar] [CrossRef]
- Stigler, M. Threshold Cointegration: Overview and Implementation in R Matthieu Stigler. 2010. Available online: http://stat.ethz.ch/CRAN/web/packages/tsDyn/vignettes/ThCointOverview.pdf (accessed on 12 February 2020).
- Ferraresi, T.; Roventini, A.; Fagiolo, G. Fiscal Policies and Credit Regimes: A TVAR Approach. J. Appl. Econom. 2015, 30, 1047–1072. [Google Scholar] [CrossRef] [Green Version]
- Andrews, D.; Ploberger, W. Optimal Tests When a Nuisance Parameter Is Present Only under the Alternative. Econometrica 1994, 62, 1383–1414. [Google Scholar] [CrossRef]
- Hansen, B.E. Inference When a Nuisance Parameter Is Not Identified Under the Null Hypothesis. Econometrica 1996, 64, 413–430. [Google Scholar] [CrossRef]
- Koop, G.; Pesaran, M.H.; Potter, S.M. Impulse response analysis in nonlinear multivariate models. J. Econom. 1996, 74, 119–147. [Google Scholar] [CrossRef]
- Balke, N.S. Credit and Economic Activity: Credit Regimes and Nonlinear Propagation of Shocks. Rev. Econ. Stat. 2000, 82, 344–349. [Google Scholar] [CrossRef]
- Ng, S.; Perron, P. LAG Length Selection and the Construction of Unit Root Tests with Good Size and Power. Econometrica 2001, 69, 1519–1554. [Google Scholar] [CrossRef] [Green Version]
- Chontanawat, J.; Hunt, L.C.; Pierse, R. Does energy consumption cause economic growth?: Evidence from a systematic study of over 100 countries. J. Policy Model. 2008, 30, 209–220. [Google Scholar] [CrossRef]
- Apergis, N.; Payne, J.E.; Menyah, K.; Wolde-Rufael, Y. On the causal dynamics between emissions, nuclear energy, renewable energy, and economic growth. Ecol. Econ. 2010, 69, 2255–2260. [Google Scholar] [CrossRef]
- Wolde-Rufael, Y.; Menyah, K. Nuclear energy consumption and economic growth in nine developed countries. Energy Econ. 2010, 32, 550–556. [Google Scholar] [CrossRef]
- Payne, J.E.; Taylor, J.P. Nuclear energy consumption and economic growth in the U.S.: An empirical note. Energy Sources Part B Econ. Plan. Policy 2010, 5, 301–307. [Google Scholar] [CrossRef]
- REE (Red Electrica de Espana). Demand for Electricity in Spain Falls 1.3% in June; REE: Madrid, Spain, 2019. [Google Scholar]
- AleaSoft. Nuclear Energy: Fifty Years at the Base of the Spanish Electricity Mix; AleaSoft: Barcelona, Spain, 2019. [Google Scholar]
- Steffen, W.; Rockström, J.; Richardson, K.; Lenton, T.M.; Folke, C.; Liverman, D.; Summerhayes, C.P.; Barnosky, A.D.; Cornell, S.E.; Crucifix, M.; et al. Trajectories of the Earth System in the Anthropocene. Proc. Natl. Acad. Sci. USA 2018, 115, 8252–8259. [Google Scholar] [CrossRef] [Green Version]
- IPCC. Summary for Policymakers of IPCC Special Report on Global Warming of 1.5 °C Approved by Governments; IPCC: Geneva, Switzerland, 2018. [Google Scholar]
- Storm, S.; Schröder, E. Economic Growth and Carbon Emissions: The Road to ‘Hothouse Earth’ is Paved with Good Intentions. SSRN Electron. J. 2019. [Google Scholar] [CrossRef] [Green Version]
- Storm, S. How the Invisible Hand is Supposed to Adjust the Natural Thermostat: A Guide for the Perplexed. Sci. Eng. Ethics 2017, 23, 1307–1331. [Google Scholar] [CrossRef] [Green Version]
- Ward, J.D.; Sutton, P.C.; Werner, A.D.; Costanza, R.; Mohr, S.H.; Simmons, C.T. Is decoupling GDP growth from environmental impact possible? PLoS ONE 2016, 11, e0164733. [Google Scholar] [CrossRef] [PubMed] [Green Version]
Figure 1.
CO2 emissions, GDP, nuclear and renewable energy and fossil fuel consumption in Spain over the period of 1970Q1–2018Q4. (a) CO2 emissions (in millions of tons) and GDP (in 2010 U.S. dollars); (b) growth rates of CO2 emissions and GDP; (c) renewable and nuclear energy and fossil fuel consumption (in thousand toe); and (d) growth rates of renewables, nuclear energy and fossil fuel consumption. Note: Fossil fuel (coal and oil) consumption (FOS, in thousand toe) was calculated using data retrieved from the BP Energy Outlook 2019 database.

Figure 2.
Transition variable (two-quarter moving average of ΔlnGDP) and threshold value.

Figure 3.
Responses of CO2 emissions to shocks in GDP, nuclear and renewable energy consumption in (a) upper regime; (b) lower regime.
Figure 3.
Responses of CO2 emissions to shocks in GDP, nuclear and renewable energy consumption in (a) upper regime; (b) lower regime.

Figure 4.
Responses of GDP to shocks in CO2 emissions, nuclear and renewable energy consumption in (a) upper regime; (b) lower regime.
Figure 4.
Responses of GDP to shocks in CO2 emissions, nuclear and renewable energy consumption in (a) upper regime; (b) lower regime.

Figure 5.
Responses of nuclear energy consumption to shocks in CO2 emissions, GDP and renewable energy consumption in (a) upper regime; (b) lower regime.
Figure 5.
Responses of nuclear energy consumption to shocks in CO2 emissions, GDP and renewable energy consumption in (a) upper regime; (b) lower regime.

Figure 6.
Responses of renewable energy consumption to shocks in CO2 emissions, GDP and nuclear energy consumption in (a) upper regime; (b) lower regime.
Figure 6.
Responses of renewable energy consumption to shocks in CO2 emissions, GDP and nuclear energy consumption in (a) upper regime; (b) lower regime.


Table 1.
The Ng‒Perron unit root test results for levels of variables.
| Variable | MZa | MZt | MSB | MPT |
|---|---|---|---|---|
| lnCO2 | −1.15919 | −0.51794 | 0.44681 | 44.1338 |
| lnGDP | −7.88524 | −1.86864 | 0.23698 | 11.8845 |
| lnRES | −5.70229 | −1.63417 | 0.28658 | 15.8819 |
| lnNUC | −0.23262 | −0.15519 | 0.66713 | 92.5518 |
| Asymptotic critical values | ||||
| 1% level | −23.8 | −3.42 | 0.143 | 4.03 |
| 5% level | −17.3 | −2.91 | 0.168 | 5.48 |
| 10% level | −14.2 | −2.62 | 0.185 | 6.67 |
Note: c + t—with intercept and trend, number of lags was chosen based on the Modified BIC.
Table 2.
The Ng‒Perron unit root test results for first differences of variables.
| Variable. | MZa | MZt | MSB | MPT |
|---|---|---|---|---|
| ∆lnCO2 | −8.66916 ** | −2.02095 ** | 0.23312 * | 3.06510 ** |
| ∆lnGDP | −12.3738 ** | −2.48168 ** | 0.20056 ** | 2.00267 ** |
| ∆lnRES | −19.5373 *** | −3.12432 *** | 0.15992 *** | 1.25827 *** |
| ∆lnNUC | −16.5068 *** | −2.86917 *** | 0.17382 *** | 1.49836 *** |
| Asymptotic critical values | ||||
| 1% level | −13.8 | −2.58 | 0.174 | 1.78 |
| 5% level | −8.1 | −1.98 | 0.233 | 3.17 |
| 10% level | −5.7 | −1.62 | 0.275 | 4.45 |
Note: c—with intercept, number of lags was chosen based on the modified BIC; *, **, *** = rejection of the null hypothesis about the presence of unit root at a significance level of 10%, 5%, or 1%.
Table 3.
Test for threshold effects.
| Test Statistics | Value | p-Value |
|---|---|---|
| sup-Wald | 145.73 | <0.01 |
| avg-Wald | 113.07 | <0.01 |
| exp-Wald | 62.24 | <0.01 |
Table 4.
Test for Granger causality in regimes.
| Dependent Variable. | Causes (Short-Run Effects) | ||||
|---|---|---|---|---|---|
| ∆CO2 | ∆GDP | ∆NUC | ∆RES | ||
| Linear VAR model | |||||
| ∆CO2 | - | 10.24 *** | 0.748 | 0.187 | |
| ∆GDP | 6.446 ** | - | 3.034 * | 1.253 | |
| ∆NUC | 0.027 | 5.101 * | - | 2.682 | |
| ∆RES | 0.578 | 0.445 | 0.49 | - | |
| Threshold VAR model | |||||
| Upper regime | ∆CO2 | - | 8.086 *** | 2.376 * | 0.344 |
| ∆GDP | 2.299 * | - | 3.371 * | 2.611 * | |
| ∆NUC | 0.592 | 7.115 *** | - | 1.189 | |
| ∆RES | 0.03 | 0.07 | 0.362 | - | |
| Lower regime | ∆CO2 | - | 1.035 | 0.237 | 0.002 |
| ∆GDP | 0.353 | - | 0.217 | 0.317 | |
| ∆NUC | 0.623 | 1.950 | - | 1.294 | |
| ∆RES | 1.785 | 1.056 | 0.011 | - | |
Note: ***, **, * stand for significance at the 1%, 5% and 10% level, respectively.
© 2020 by the authors. Licensee MDPI, Basel, Switzerland. This article is an open access article distributed under the terms and conditions of the Creative Commons Attribution (CC BY) license (http://creativecommons.org/licenses/by/4.0/).
Share and Cite
MDPI and ACS Style
Piłatowska, M.; Geise, A.; Włodarczyk, A. The Effect of Renewable and Nuclear Energy Consumption on Decoupling Economic Growth from CO2 Emissions in Spain. Energies 2020, 13, 2124. https://0-doi-org.brum.beds.ac.uk/10.3390/en13092124
AMA Style
Piłatowska M, Geise A, Włodarczyk A. The Effect of Renewable and Nuclear Energy Consumption on Decoupling Economic Growth from CO2 Emissions in Spain. Energies. 2020; 13(9):2124. https://0-doi-org.brum.beds.ac.uk/10.3390/en13092124
Chicago/Turabian StylePiłatowska, Mariola, Andrzej Geise, and Aneta Włodarczyk. 2020. "The Effect of Renewable and Nuclear Energy Consumption on Decoupling Economic Growth from CO2 Emissions in Spain" Energies 13, no. 9: 2124. https://0-doi-org.brum.beds.ac.uk/10.3390/en13092124
Note that from the first issue of 2016, this journal uses article numbers instead of page numbers. See further details here.