Influence of Sulfate Ions on the Combined Application of Modified Water and Polymer Flooding—Rheology and Oil Recovery


Institute of Subsurface Energy Systems, Clausthal University of Technology, 38678 Clausthal-Zellerfeld, Germany
*
Author to whom correspondence should be addressed.
Energies 2020, 13(9), 2356; https://0-doi-org.brum.beds.ac.uk/10.3390/en13092356
Submission received: 19 March 2020
/
Revised: 25 April 2020
/
Accepted: 1 May 2020
/
Published: 8 May 2020
(This article belongs to the Special Issue Developments in Oil and Gas Engineering)
Abstract
:Oil recovery using modified/smart water technology can be maximized by optimizing the composition of the injected water. Brine optimization is also believed to improve polymer flooding performance. This chapter assesses and defines the potential impact of combining low-salt-modified water with polymer flooding, based on the presence of sulfate in the injection water. Hence, we evaluated the influence of sodium sulfate on (1) polymer viscoelasticity, under the assumption that the phenomena exists, and (2) oil recovery and pressure response. Mainly, a comprehensive rheological evaluation and two-phase core flood experiments are the focus of this work. Composition of injection brine is optimized after having synthetic seawater as a base brine. Core-flood experiments were performed in a secondary, tertiary and a sort of post-tertiary (quaternary) mode to evaluate the feasibility of applying both processes (modified water and polymer flood). Obtained data was subsequently cross-analyzed and as an overall observation, sodium sulfate helped with improving polymer viscosity compared to sodium chloride or divalent cation presence. Moreover, optimized modified water, with the higher amount of sulfate ions, showed an additional oil recovery in both secondary and tertiary mode of about 5.0%. Additionally, polymer injection in tertiary mode, after modified-water injection, showed significant additional oil recovery.
1. Introduction
An increase in oil recovery by using water with low-salinity components in sandstone reservoirs was first observed by Martin [1]. Later on, subsequent studies have found that not only could low-salinity water flooding (LSWF) lead to an increase in oil recovery, but also, smart/modified water flooding (SWF) can contribute to higher oil recovery. Some researchers have used the terms low salinity and smart/modified water synonymously [2]. On the one hand, low salinity defines the dilution of injected water (i.e., sea water) with fresh water in order to reduce the total dissolved solids (TDS) [3,4]; thus, ionic strength of the injected water is reduced, but hardness could be the same. On the other hand, smart/modified water deals with the manipulation of ionic strength (hardness) of the injected water [5]. This manipulation aims to disturb the established rock-oil-brine ionic equilibrium, which could result in optimum oil recovery by improving the microscopic displacement efficiency. Hence, the hardness of the injected water is also manipulated with the ions’ concentration. Different mechanisms have been appointed as the ones favoring oil recovery due to SWF, but wettability alteration is believed to be the main driver [6,7,8,9]. Further recovery mechanisms can be mineral dissolution, fines migration, multicomponent ion change (MIE) [10] and surface potential change.
Previous studies using carbonate and sandstone rock samples have confirmed that the presence of divalent cations (Ca+2, Mg+2) in the formation water and the spiked (increased) amount of SO4−2 in the injected brine have resulted in an increase in oil recovery [11,12,13,14,15]. The combination of divalent cations and spiked sulfate is expected to disturb the ionic equilibrium of the rock-brine-oil system in the reservoir. It has also been found that sulfate ions can displace the long-chain carboxylic acids (oil component) adsorbed on the rock surface and further reduce the adsorption of these acids on the rock surface [16,17].
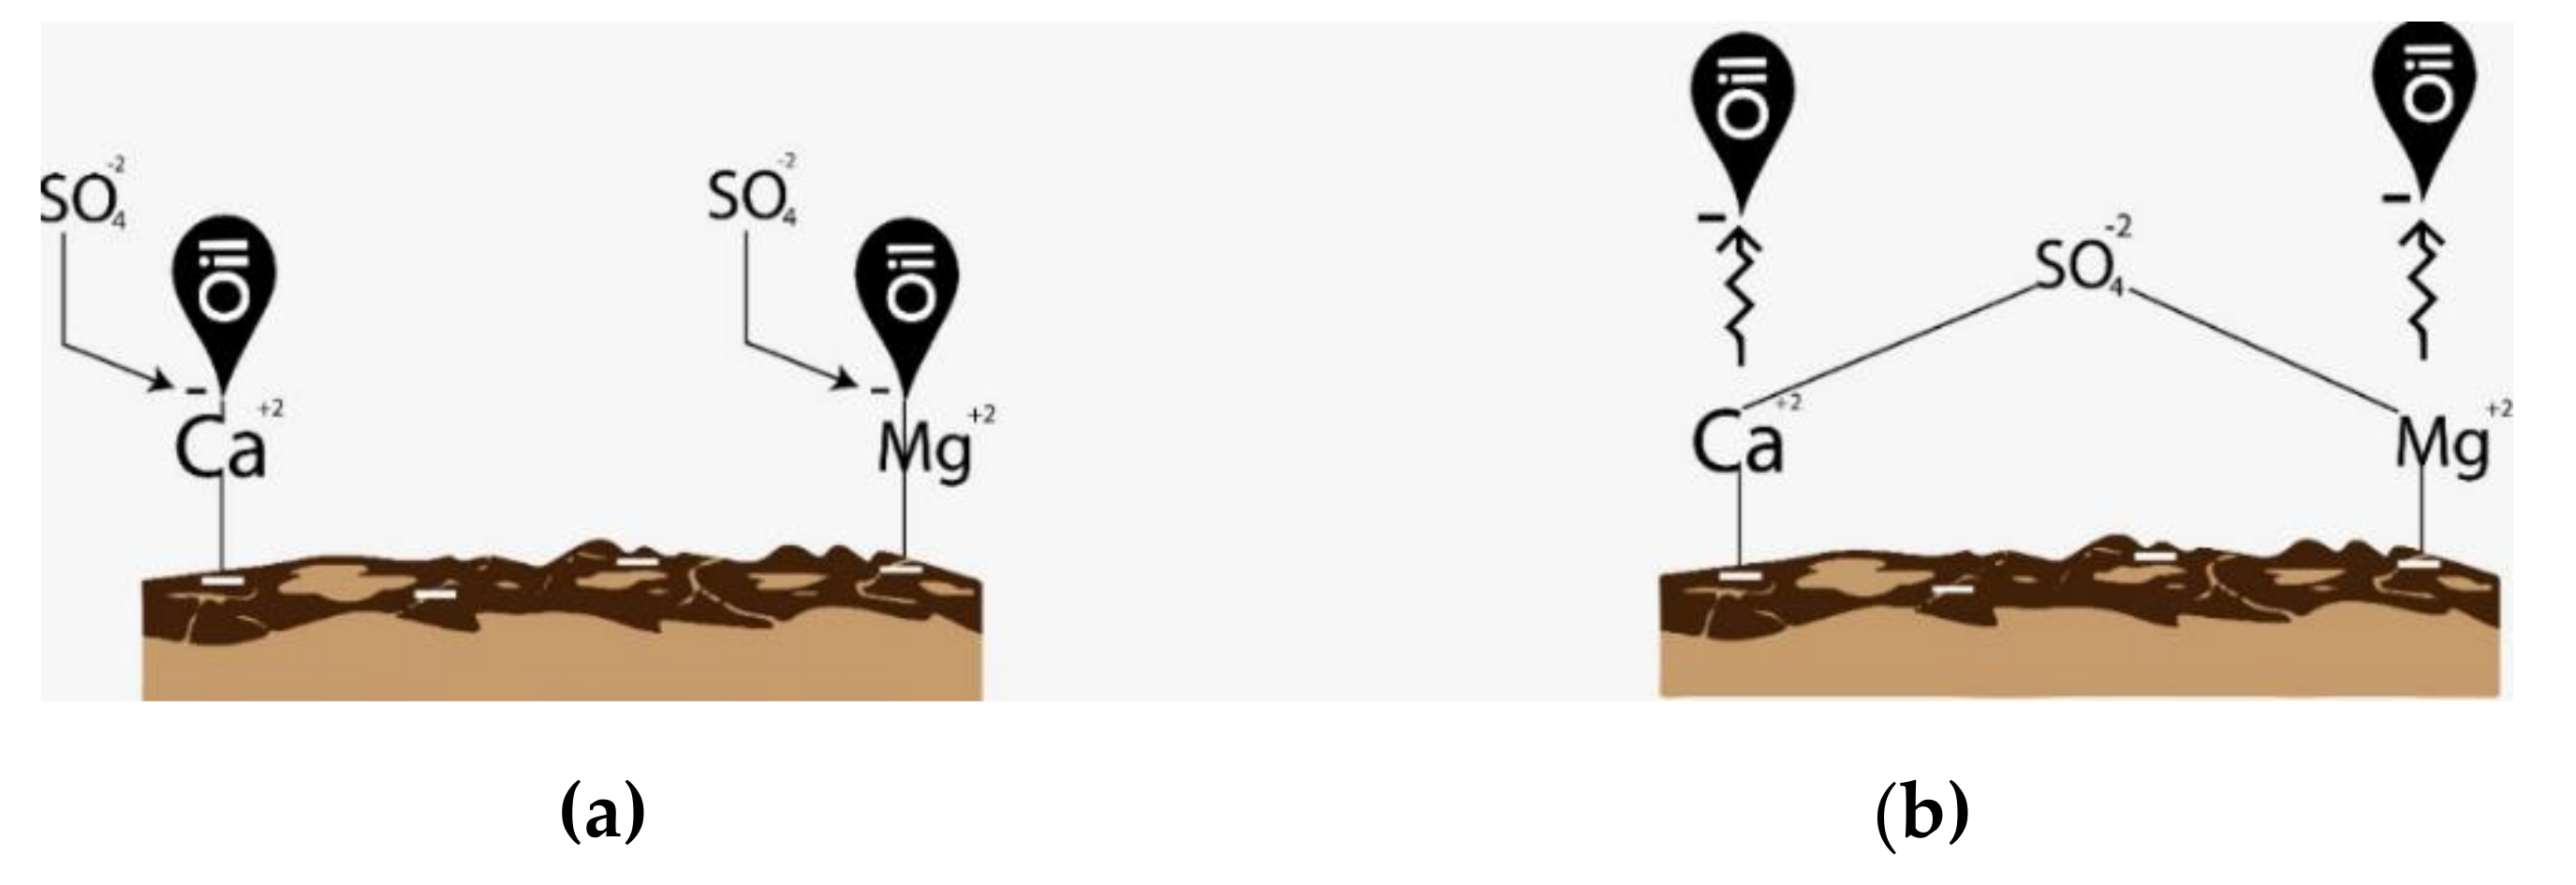
For sandstone reservoirs, clay and quartz are negatively charged surfaces under the reservoir pH conditions and the negative polar compounds of the oil are attached to the rock-surface through divalent ions’ bridging (Ca+2 and Mg+2 present in formation brine) [18]. The positive polar compounds of the oil are directly attached to negatively charged rock surfaces. This chemical bondage results in an oil wetting condition of the sandstone reservoir, as presented in Figure 1A. It is therefore expected that the spiked amount of SO4−2 in the injected brine will disturb the ionic equilibrium of the system, resulting in the replacement of the negative polar compound present in the oil with SO4−2 through Ca+2 and Mg+2 bridging the rock surface. Thus, oil polar compounds are released and SO4−2 are attached to the rock surface through ionic bridging, resulting in a water-wet state rock surface [18], as shown in Figure 1B. The described process will be catalyzed if low-saltwater flooding is performed. Low salt will further dilute the divalent cations in the formation brine and will cause the release of the negative polar compounds of the oil.
Spiked divalent ions normally used to design modified water are termed as the potential determining ions (PDI), which could contribute to additional oil recovery, according to Zhang et al. [14]. The non-PDI are monovalent ions that have no significant influence to contribute additional oil recovery. Thus, monovalent ions should either be removed or require dilution to design smart/modified water. Among divalent PDI, sulfate is the most effective ion in both sandstone and carbonate reservoirs [17] for modified water design. In spite of that, a too-high concentration of the sulfate can be problematic when more of the dissolved material than could be dissolved (supersaturation) by divalent cations (Ba+2, Sr+2 and Ca+2) is present in the formation water. Due to the supersaturation and chemical reactions, precipitation of CaSO4, BaSO4 and SrSO4 will occur (scaling problems). If the reservoir temperature is high enough, then this scaling issue can be even worse, as high temperature enhances the precipitation process [19,20]. This scaling process, in turn, will cause strong injectivity issues due to the generated formation damage and pore plugging around the wellbore [21,22,23].
Those scaling and injectivity problems will challenge the efficiency of smart/modified water injection and will make any project un-economical. In 2016, Ghosh et al. [21] studied ways to predict the formation of precipitation using a simulation technique and presented the scale control methods. Furthermore, modified water with the increased amount of sulfate in combination with other enhanced oil recovery (EOR) methods is expected to produce the additional oil recovery owing to the multi-recovery mechanism.
As one step further, the combination of polymer flooding with other EOR techniques has demonstrated positive effects on oil recovery [24,25,26,27,28]. The performance of the polymer flood is dependent on the ionic composition of reservoir brine or make-up water [29,30,31,32]. The higher the ionic composition of brine, the higher the decrease in polymer viscosity, which in turn will negatively influence polymer viscoelasticity [29,33,34,35,36].
In practice, a reservoir is pre-flushed with low-salinity water to reduce reservoir brine salinity [37]. By that logic, polymer flooding, after the modified water flooding, is expected to recover additional oil. Pre-flush-modified water will alter the reservoir wettability and detach the long-chain acidic carboxylic group. Follow-up low-concentration polymer flood after modified water will recover this detached and trapped oil because of the improved mobility ratio [38]. Similarly, diluted brine injection in combination with the polymer flood has shown an increase in recovery in sandstone core plugs [25,28,38]. This is because of the combined process of both EOR techniques (wettability alteration by low saltwater and improved displacement efficiency by polymer flood). Additionally, modified water will require a smaller polymer concentration to design a favorable mobility ratio. Hence, a lesser amount of polymer will be required to achieve the desired viscoelastic properties [39]. These polymer viscoelastic properties improve the displacement efficiency on a micro-scale during polymer flooding [40,41].
Additionally, over the past years, studies have investigated the role of interfacial rheology (dynamic interface response) in the brine-oil system [42]. Improved dynamic stability forms a mechanically viscoelastic interfacial surface at the brine–oil interface and will support a snap-off of big oil droplets. Studies show that this viscoelastic film is formed when the naphthenic acids and asphaltene present in crude oil and divalent ions in the aqueous phase are accumulated at the interface [43,44], but this layer is sensitive to brine salinity and forms a more stable layer under low-salt brines. Experiments have been conducted in which sulfate was found to improve interfacial rheology between two phases and result in higher oil recovery [41]. In other words, from a fluid–fluid interaction point of view, sulfate could improve this viscoelastic interface, resulting in oil phase snap-off suppression and an increase in the oil drop size [44]. This fluid–fluid interaction is developed at the interface between the oil polar compounds and ions present in the brine.
This work focuses on investigating the impact of the sulfate ions for the design of modified water flooding in the sandstone reservoir rock. Low-concentration polymer flooding is adopted as the mobility controller after modified water to observe any additional oil recovery because of multi-recovery mechanisms. First, brine flooding was implemented for 1.5 pore volume (PV) and subsequently, polymer flooding was performed to define the synergies/benefits of the low-cost hybrid EOR technique.
Different injection schemes of low-salinity hybrid EOR methods have been proposed and the promising oil recovery results have been investigated [45,46,47,48,49,50,51,52,53,54,55]. Some researchers proposed combining foam injection with low salinity, while others proposed surfactant and smart water flooding to achieve the optimum oil recovery results. Similarly, literature has presented the potential benefits of combining water containing low-salt compounds and polymer [25,50,51,52,53,54]. However, little attention has been given to how sulfate optimization can boost the benefits even higher, not only on the added value for polymer application but also for the oil recovery. Results obtained in this investigation concluded that spiked sulfate in low-salt brine acted as a PDI to catalyze the wettability alteration process. Equally, low-concentration polymer solutions in spiked sulfate brine improved the polymer viscoelastic properties in porous media, resulting in a higher pressure drop to contribute additional oil recovery. It is there where the novel information is found. We provide an important set of data that serve as additive information to the existing body of literature and that can be of great benefit for the state of knowledge in the petroleum industry, in the constant search for cost-efficient EOR processes.
2. Overall Methodology and Approach
In order to evaluate the influence of sodium sulfate on (1) polymer viscoelasticity, under the assumption that the phenomena exists, and (2) oil recovery and pressure response due to the injection of optimized injection brine in porous media, the following steps or methodology was adopted to gather the data and draw conclusions upon:
- Brine preparation and optimization: Two distinct groups of brines were prepared, including sulfate concentration changes, with one group keeping similar TDS and the second varying hardness.
- Polymer preparation and comprehensive rheological characterization: Polymer solutions were prepared, mainly with a viscosity ratio of 2 between oil and polymer. Subsequently, solutions were characterized in a detailed manner using steady-shear viscosity, elongational viscosity measurements, first normal stress differences (N1) and oscillatory (the latter two as attempts).
- Mechanical degradation of polymer solutions: This step allowed for understanding and defining any possible degradation prior to the core face and to draw better conclusions on polymer performance.
- Two-phase core flooding experiments: Core plugs were saturated to initial water saturation (Swi) using the porous plate method, before each experiment took place. Subsequently, different chemical slugs were injected to observe pressure response and define oil recovery.
3. Materials and Methods
3.1. Fluids and Chemicals
3.1.1. Brine Composition
Two groups of brines have been prepared for this study, which for the sake of simplicity are named Brine Group A (BGA) and Brine Group B (BGB) without further meaning. Brines were filtered through a 0.2 μm Millipore filter by applying 2.0 Bar of N2 pressure in order to avoid any undissolved component.
The first group (Brine Group A (BGA)) was used to evaluate the effects of brine hardness and sulfate content on polymer viscosity. Synthetic seawater (SSW) has been used as a base brine and the objective was to keep the total dissolved solids of ≈5 g/L (Table 1).
The second group (Brine Group B (BGB)) of brines was prepared to design a modified water based on sulfate. Brine composition was optimized using synthetic seawater (SSW) as a base brine. Brine optimization was achieved by doubling the amount of sulfate, whilst diluting (in fresh water) the SSW-brine to a tenth of its initial concentration. The detailed composition of the four brines utilized in the second group can be seen in Table 2.
3.1.2. Polymer Solutions
Polymer Solutions: Flopaam 6035 S was used to prepare the diluted solution (provided by SNF Floerger from Andrezieux, France). Co-polymers of acrylamide and acrylate, suitable for reservoirs with temperature up to 70 °C with high Molecular Weight (MW), reported viscoelastic behavior [35,36]. Diluted solutions using the BGA were prepared keeping a constant polymer concentration (500 ppm). While with BGB, diluted solutions were prepared with the concentrations of 200 ppm, 300 ppm and 500 ppm, using the approach adopted by Hincapie et al. [36]. The approach mainly includes the preparation of a mother solution (10,000 ppm) followed by a stock solution (5000 ppm), subsequently diluted to the lower concentrations. Polymer concentrations were defined to determine the viscosity ratio of two . Diluted solutions were filtered using a 5.0 µm Millipore membrane filter (MF-Millipore from Sigma Aldrich, Germany) to avoid any undissolved fish eyes.
3.1.3. Oil
Centrifuged and degassed dead crude oil was used for all experiments. Oil was filtered through a 5.0 μm Millipore filter (from Sigma Aldrich, Germany) to avoid the solid particles and thick residue. The main crude oil properties measured at 22 °C were density (g/cm3) 0.88, °API 29.42 and η (mPa·s) 23.00.
3.2. Porous Media
Bentheimer core plugs were used for the experimental evaluations (see summary in Table 3). Core plugs have an average length and diameter of 60 and 30 mm, respectively. Cores were dried by placing them in an oven at 60 °C for at least 3 days. Porosity (Φ) was measured using a Micromeritics 1340 pycnometer, and permeability by using a gas permeameter (kg) and brine (kb).
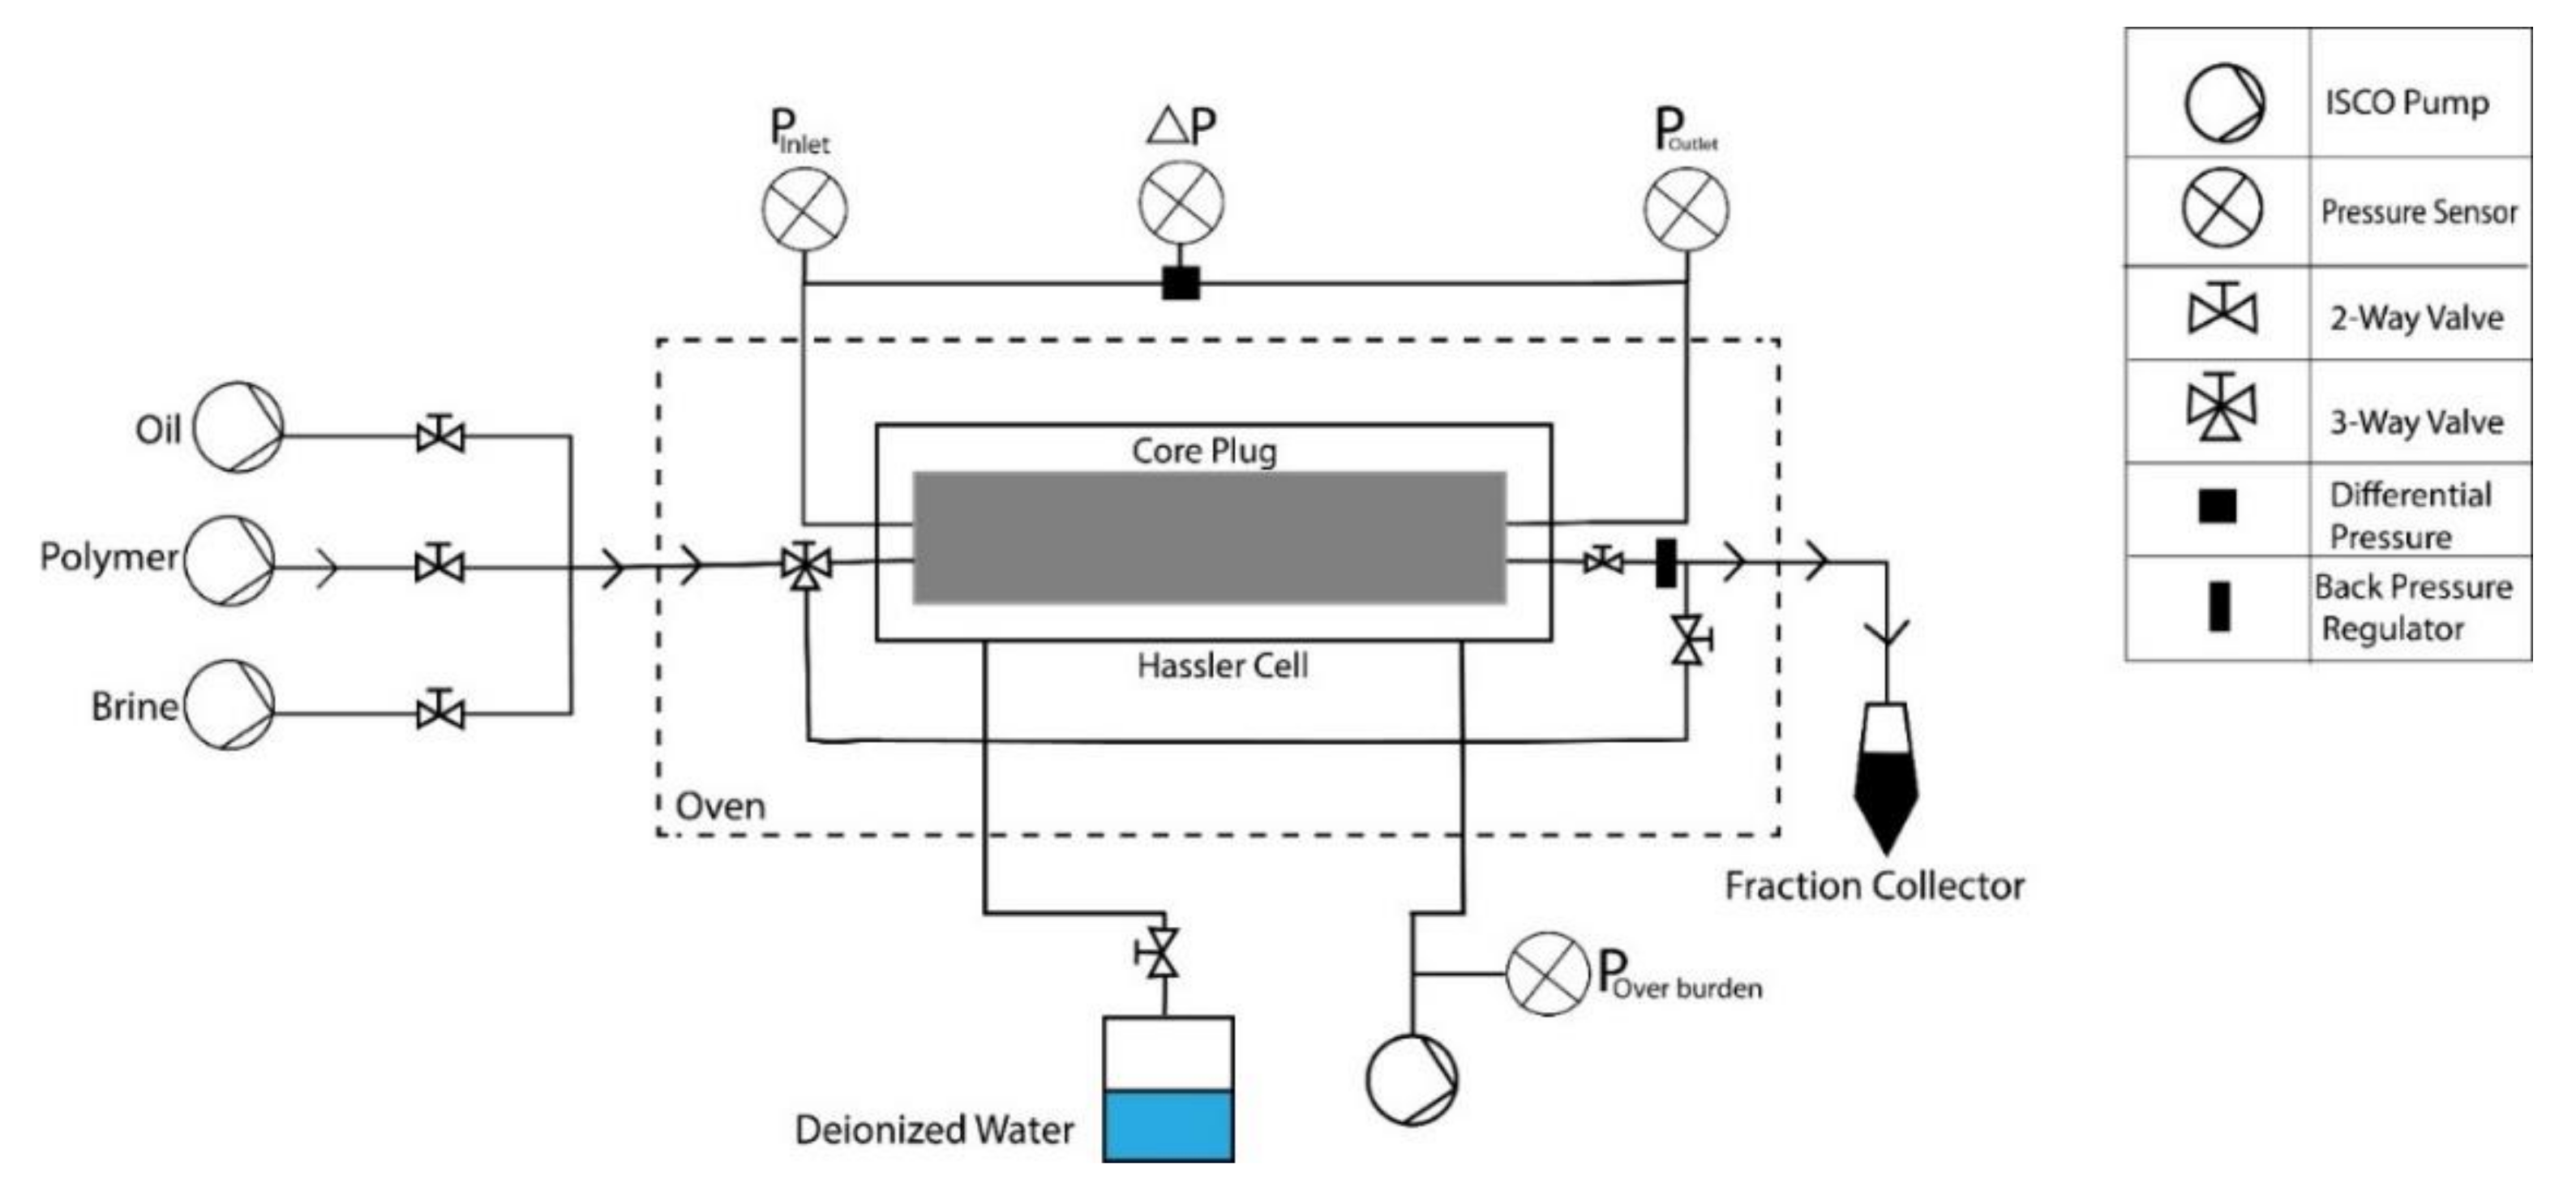
Figure 2 provides a schematic representation of the core-flood setup. It consists of three ISCO pumps (Teledyne ISCO from Lincoln, USA) connected in a multi-flow arrangement (infusion/withdrawal). The core plug is placed in a core holder that receives confining pressure of 30.0 bar, applied using an ISCO injection pump by a control pressure mode. A backpressure valve of 2.0 bar was used to establish system pressure. The following steps were performed for core preparation and two-phase experimental evaluation:
- Water saturation: Vacuum saturation was used for initial water saturation at 100% brine.
- Permeability to water (brine): SSW brine was injected at three injection rates (0.5, 1.0 and 0.5 mL/min).
- Oil saturation to initial water saturation (Swi): Oil saturation of core plugs was performed using a porous plate with a maximum injection pressure of 8.0 bar.
- Core ageing for wettability alteration: All cores were aged at 45 °C (core flooding experiments’ temperature) for three weeks prior to each core flood experiment, in order to establish attachment of polar components on the core. Skauge et al. [57] observed good wettability alteration within 3 weeks of ageing at 50 °C.
- Two-phase flooding experiments: The workflow/sequence adopted for the core flooding experiments is listed in Table 4. Bump-rate injection was performed to avoid capillary end effects before tertiary mode flooding (except core Bent 5.1).
Mechanical Degradation of Polymer—Before Entering the Plug Face
Polymer solutions were injected through stainless-steel pipeline (Inner diameter = 1/8 inch) located between the injection pump and the core plug inlet. Polymer solutions were pumped at a rate of 0.15 mL/min (the same injection rate of the core flood) to investigate polymer mechanical degradation that occurs through pipes and valves. The main rationale is to define/determine in which percentage polymer degradation occurs before entering the core plugs. Degradation is therefore determined based on a comparison of the steady-shear viscosity before and after using Equation (2).
where, = viscosity of the original solution, and = viscosity of the degraded solution.
According to different authors, e.g., Reference [58], mechanical degradation is caused by the constant shear rate exerted by the pipe walls. Shear rate can be calculated using Equation (3):
where Q = injection rate in m3/s, and R = inner diameter of pipe in m.
3.3. Fluids Investigation
3.3.1. e-VROC®—Extensional Viscometer-Rheometer on a Chip
For assessing apparent extensional viscosity of the polymer solutions, an e-VROC® (extensional viscometer-rheometer on a chip) was used. It measures viscosity by monitoring the fluid flow through a microfluidic hyperbolic shape of converging-diverging geometry within a cell. Additional information of the device can be found in References [34,35].
3.3.2. Rheological Measurements
Rheological experiments were performed using a Kinexus pro+ rheometer by Malvern Instruments Ltd (Malvern, United Kingdom) to characterize polymer solutions. Two different stainless-steel (316) geometries, double-gap cell and cone-plate, were used. The type of double-gap geometry used was DG24/27 R0427 SS, where the bob outer diameter is 24 mm and cup inner diameter is 27 mm. Steady-shear viscosity and Small-Amplitude Oscillatory Shear (SAOS) measurements were performed using the double-gap geometry. The cone and plate geometry used was CP1/60 SR 2756 SS, where the cone angle is 1° over a 60 mm diameter plate. First Normal Stress Difference (N1) was measured using the cone-plate geometry. Fresh polymer solutions were utilized for each measurement, starting from lower to higher shear rates. Rheometer calibration was performed prior to each measurement and viscosity measurements were performed for fresh solutions (at specific temperature) in order to avoid the possible minor changes in polymer molecular structure. For further details on the detailed rheological measurement evaluation, refer to the authors’ previous publications, specifically Reference [36], with further details in References [31,33,34].
4. Results and Discussion
4.1. Comprehensive Rheological Evaluation
4.1.1. Steady-Shear Rheology (Shear Viscosity)
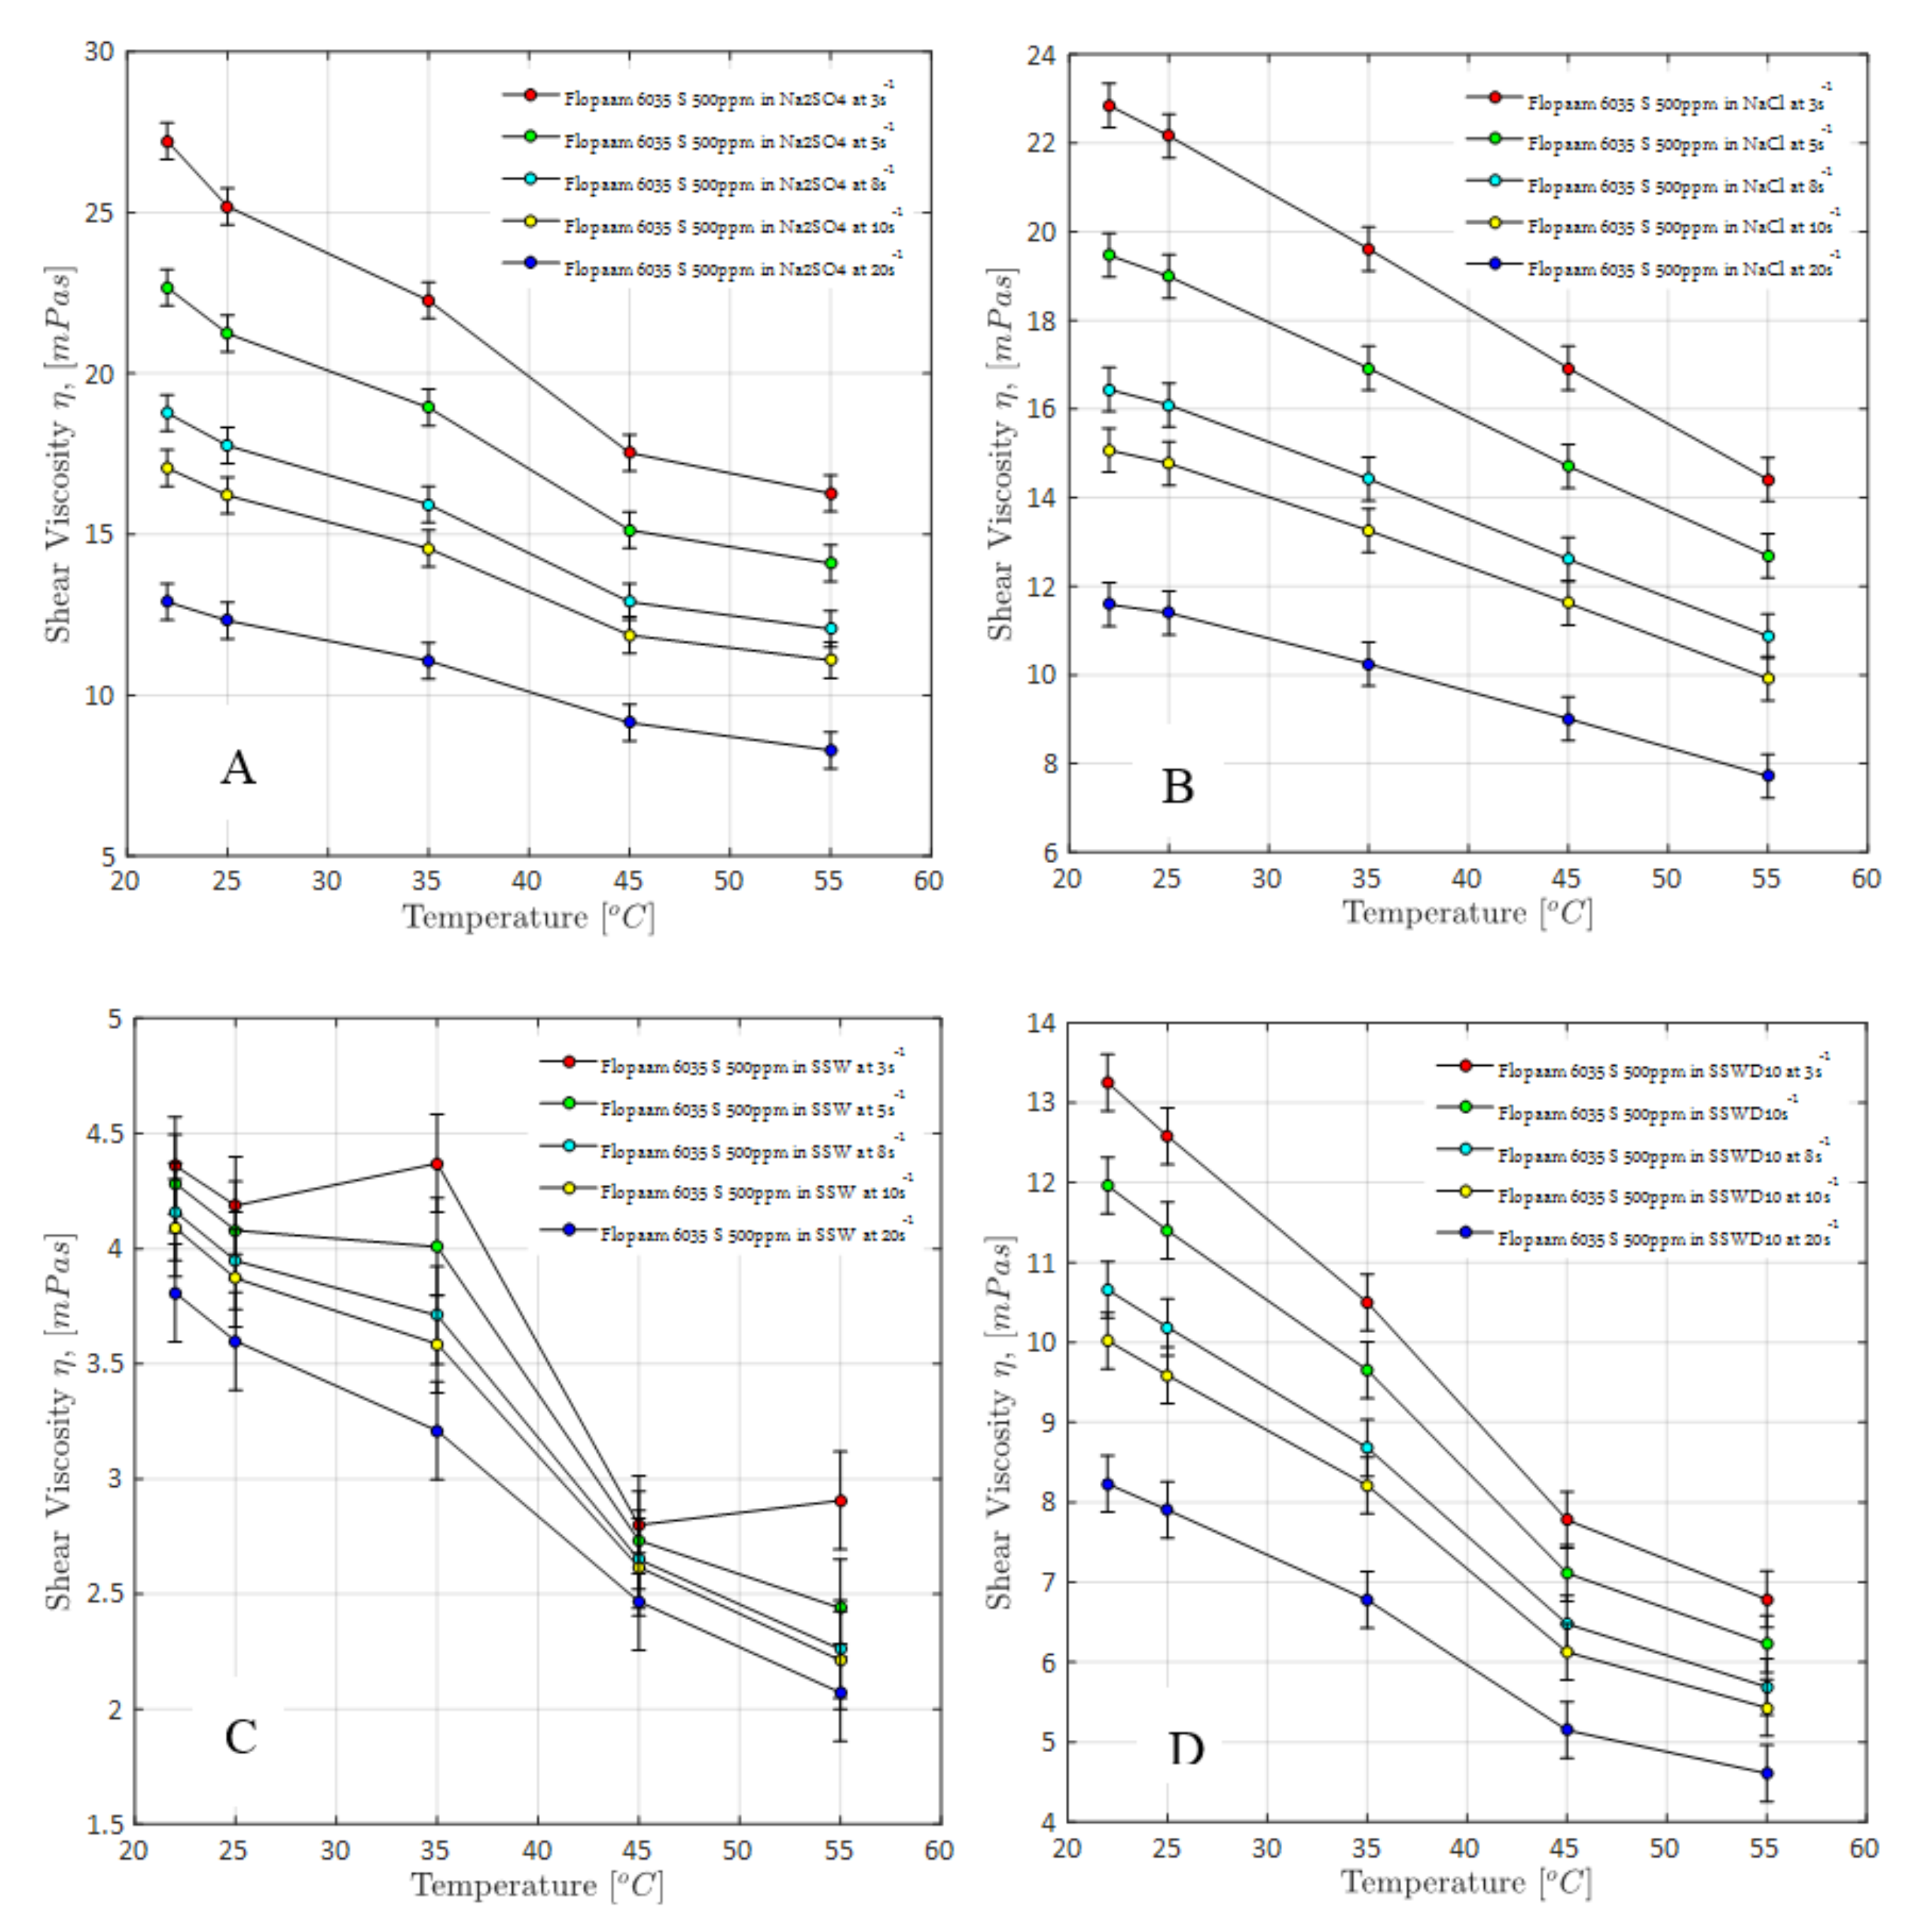
Data gathered for the shear viscosity of polymer solutions is presented in Figure 3 for a temperature ramp between 22 and 55 °C (every five degrees C). Five different shear rates (s−1) are presented: 3, 5, 8, 10 and 20 s−1. As one might expect, a proportional increase in temperature and shear rate decrease steady-shear viscosity. On the one hand, viscosity loss for solutions prepared in NaCl brine depicted a linear decline over the performed temperature ramp, as shown in Figure 3B. On the other hand, for the other three solutions, it did not follow a linear decline, as presented in Figure 3A,C,D. One explanation could be the presence and activity of divalent ions (SO4−2, Ca+2, Mg+2). Overall, polymer solutions containing sodium sulfate depicted higher shear viscosity than those without, but there seems to be a critical temperature at which the results remained unchanged. Between 45 and 55 °C, the observed shear viscosity of solutions (with/without SO4−2) was minimized. The observations on a critical temperature led us to move ahead with the core flooding experiments using 45 °C as the fixed temperature.
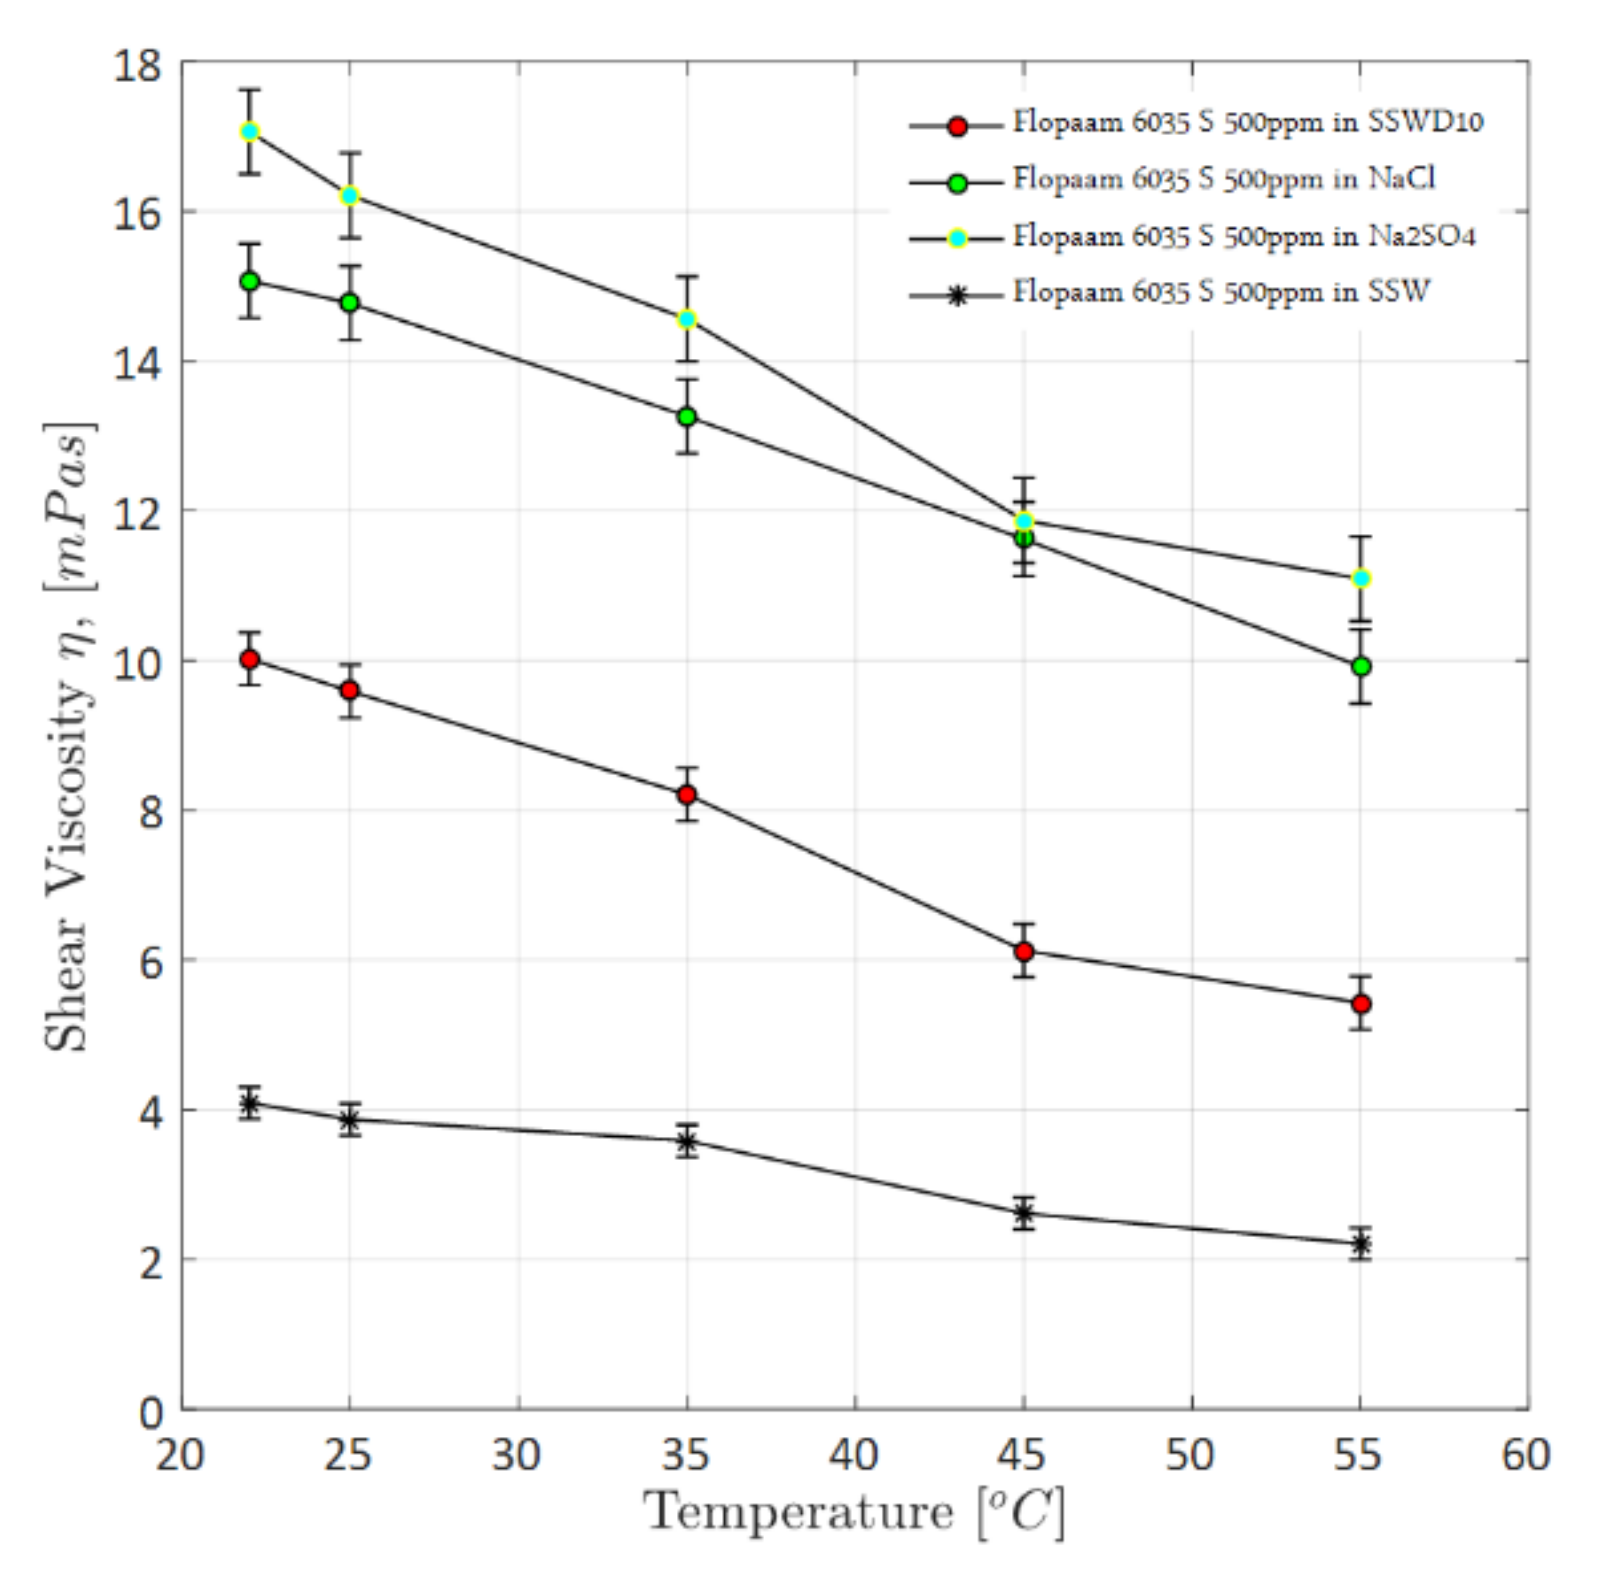
Figure 4 shows the measured shear viscosity for the BGA brines (Table 1) with a shear rate reference of 10 s−1. From Figure 4, it can be seen that polymer solutions in the presence of SO4−2 depicted the highest viscosifying power, from 22 to 55 °C. Furthermore, an increase in brine hardness and salinity (TDS) significantly decreased the shear viscosity of the polymer solution. This is in agreement with previous results reported by the author of Reference [30]. Moreover, comparing the power law trend (decline) for the solutions, only the polymer prepared in NaCl showed a linear decline. One reason is to attribute this behavior to be the sole presence of monovalent ions compared to other solutions that contain those divalent ions (SO4−2, Ca+2, Mg+2). In addition, from Figure 4, we can also assume that the activity of divalent ions is stronger at a temperature range between 22 and 45 °C, with a rapid decrease in solutions’ viscosity. Once the temperature is increased (45 to 55 °C range), the activity of these ions is decreased, consequently depicting a minimized viscosity difference. Further, comparing the influence of divalent cations (Ca+2, Mg+2) and an ion in solution (SO4−2), both opposite charges have shown the differing impact on polymer viscosity. For instance, the presence of SO4−2 resulted in the solution with the highest viscosity, while the presence of Ca+2 and Mg+2 resulted in the solution with the lowest viscosity at TDS of 5 g/L.
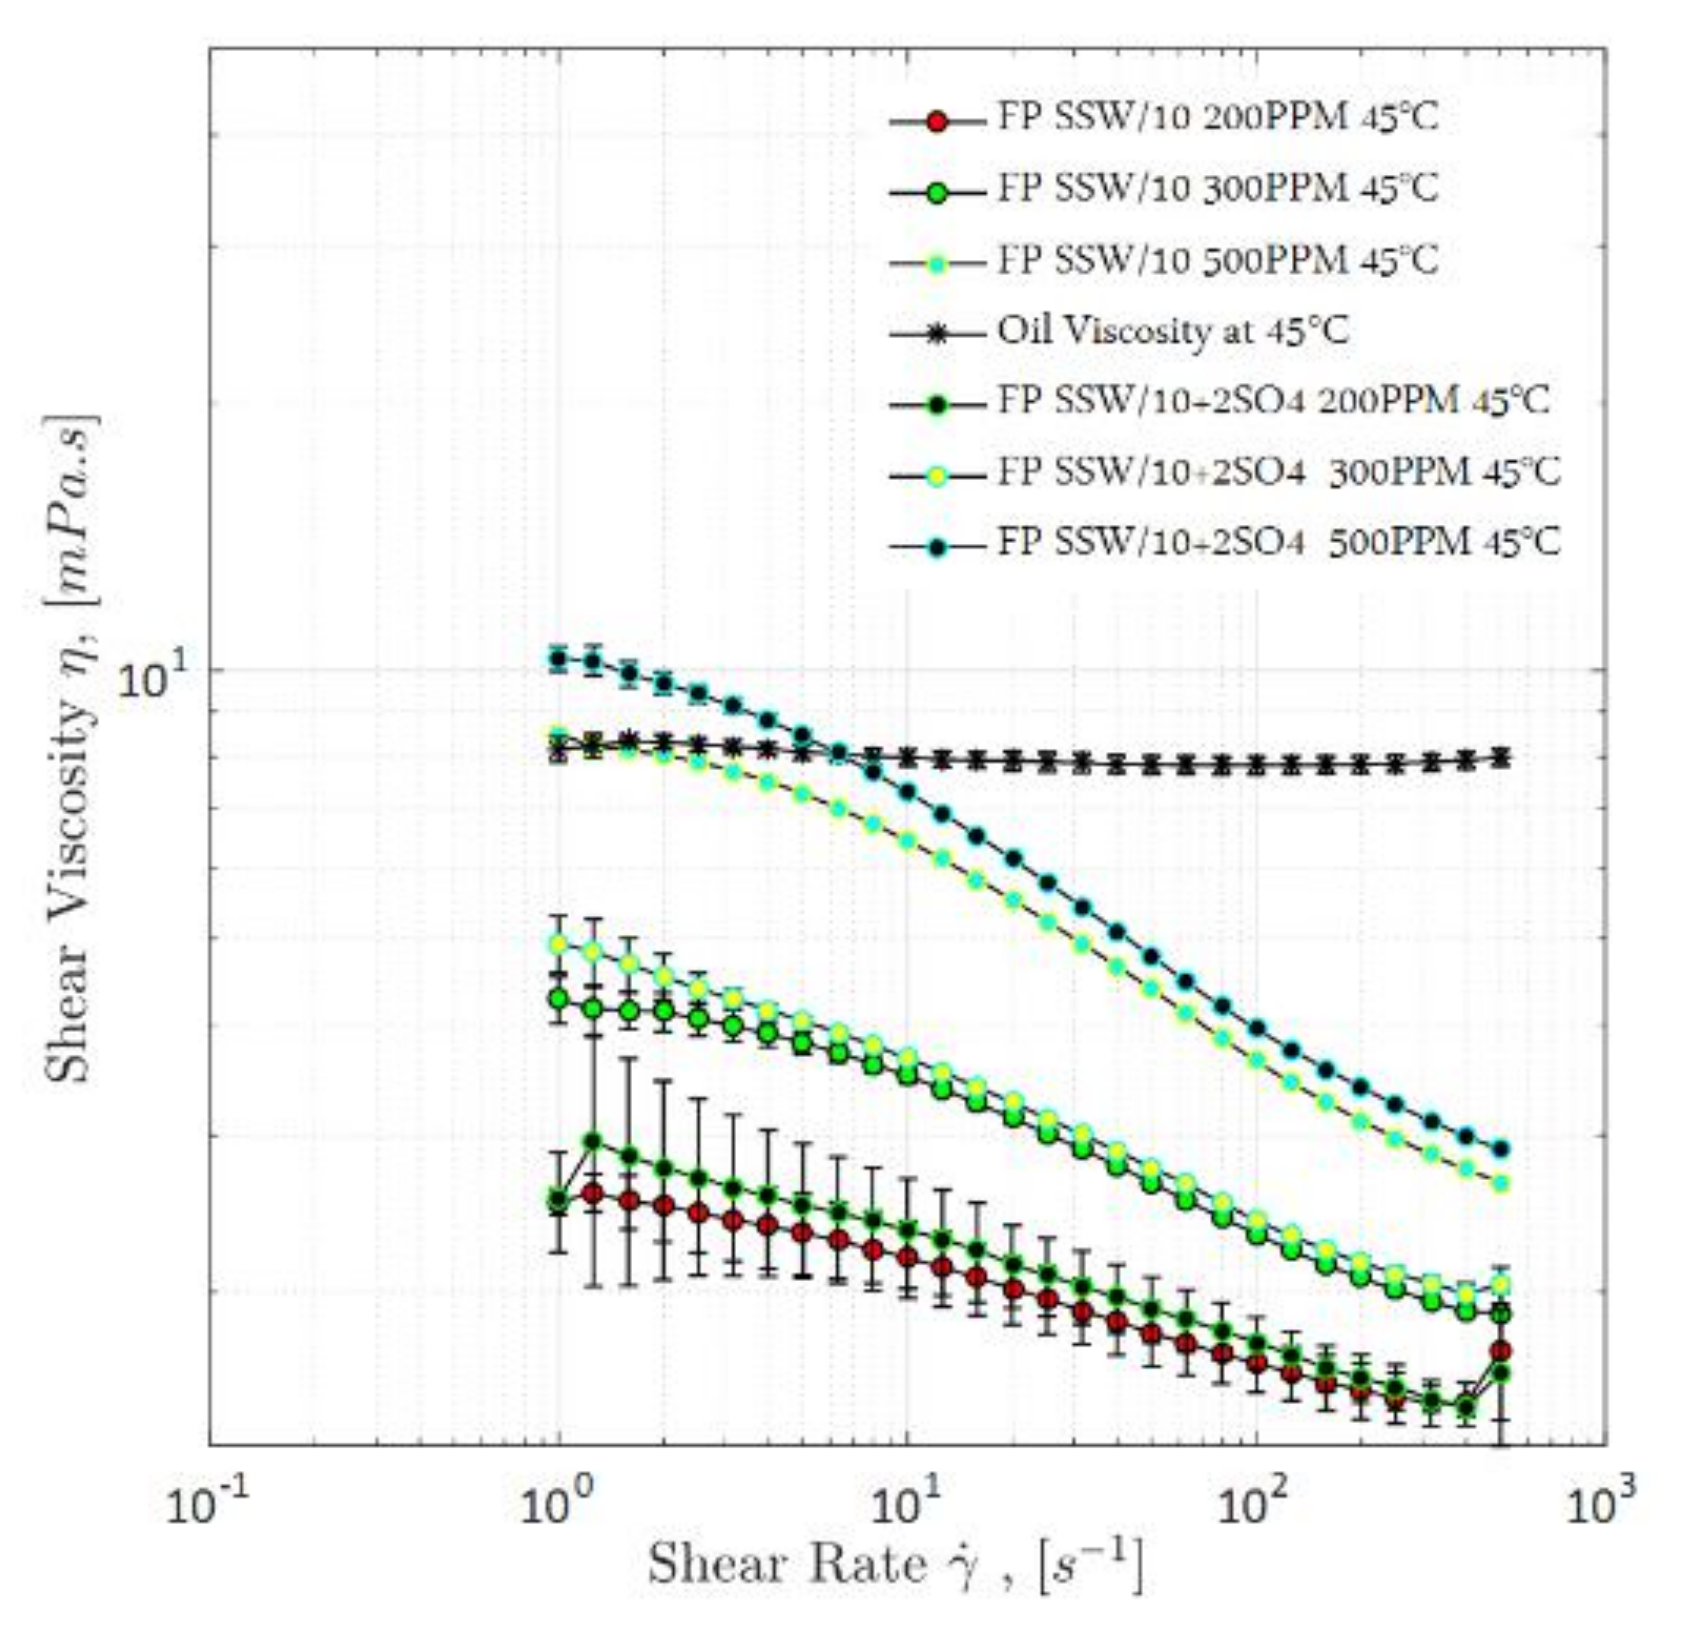
A comparison of the shear viscosity for all polymer solutions is presented in Figure 5, over the full range of shear rate. This data helped to define the concentration required to reach the target polymer viscosity, as the objective was to select the polymer concentration that exhibits half of the oil viscosity; hence, the concentration of 300 ppm (≈3.7 mPa·s) was adopted. Note that at 300 ppm polymer concentration, a slightly higher viscosity was measured for diluted solutions containing double the amount of sulfate, compared to the normal diluted brine (3.67 mPa·s > 3.45 mPa·s). In other words, an increase in the polymer solution viscosity is depicted with the increase of sulfate content. We attribute this behavior mainly to the decrease in brine hardness, with the increase in sodium sulfate (as per Equation (1)). Therefore, the hardness of the brine shows a stronger impact compared to salinity (TDS).
From Figure 5, one could also observe that 200 ppm polymer solutions depicted higher measurement errors. We assume that the low-polymer concentration leads not only to less stable solutions but also to the inertia error of the rheometer device having a stronger impact, as seen by the longer measurement time [35]. More stable data was observed once concentration was higher, and hence resulted in reduced measurement error.
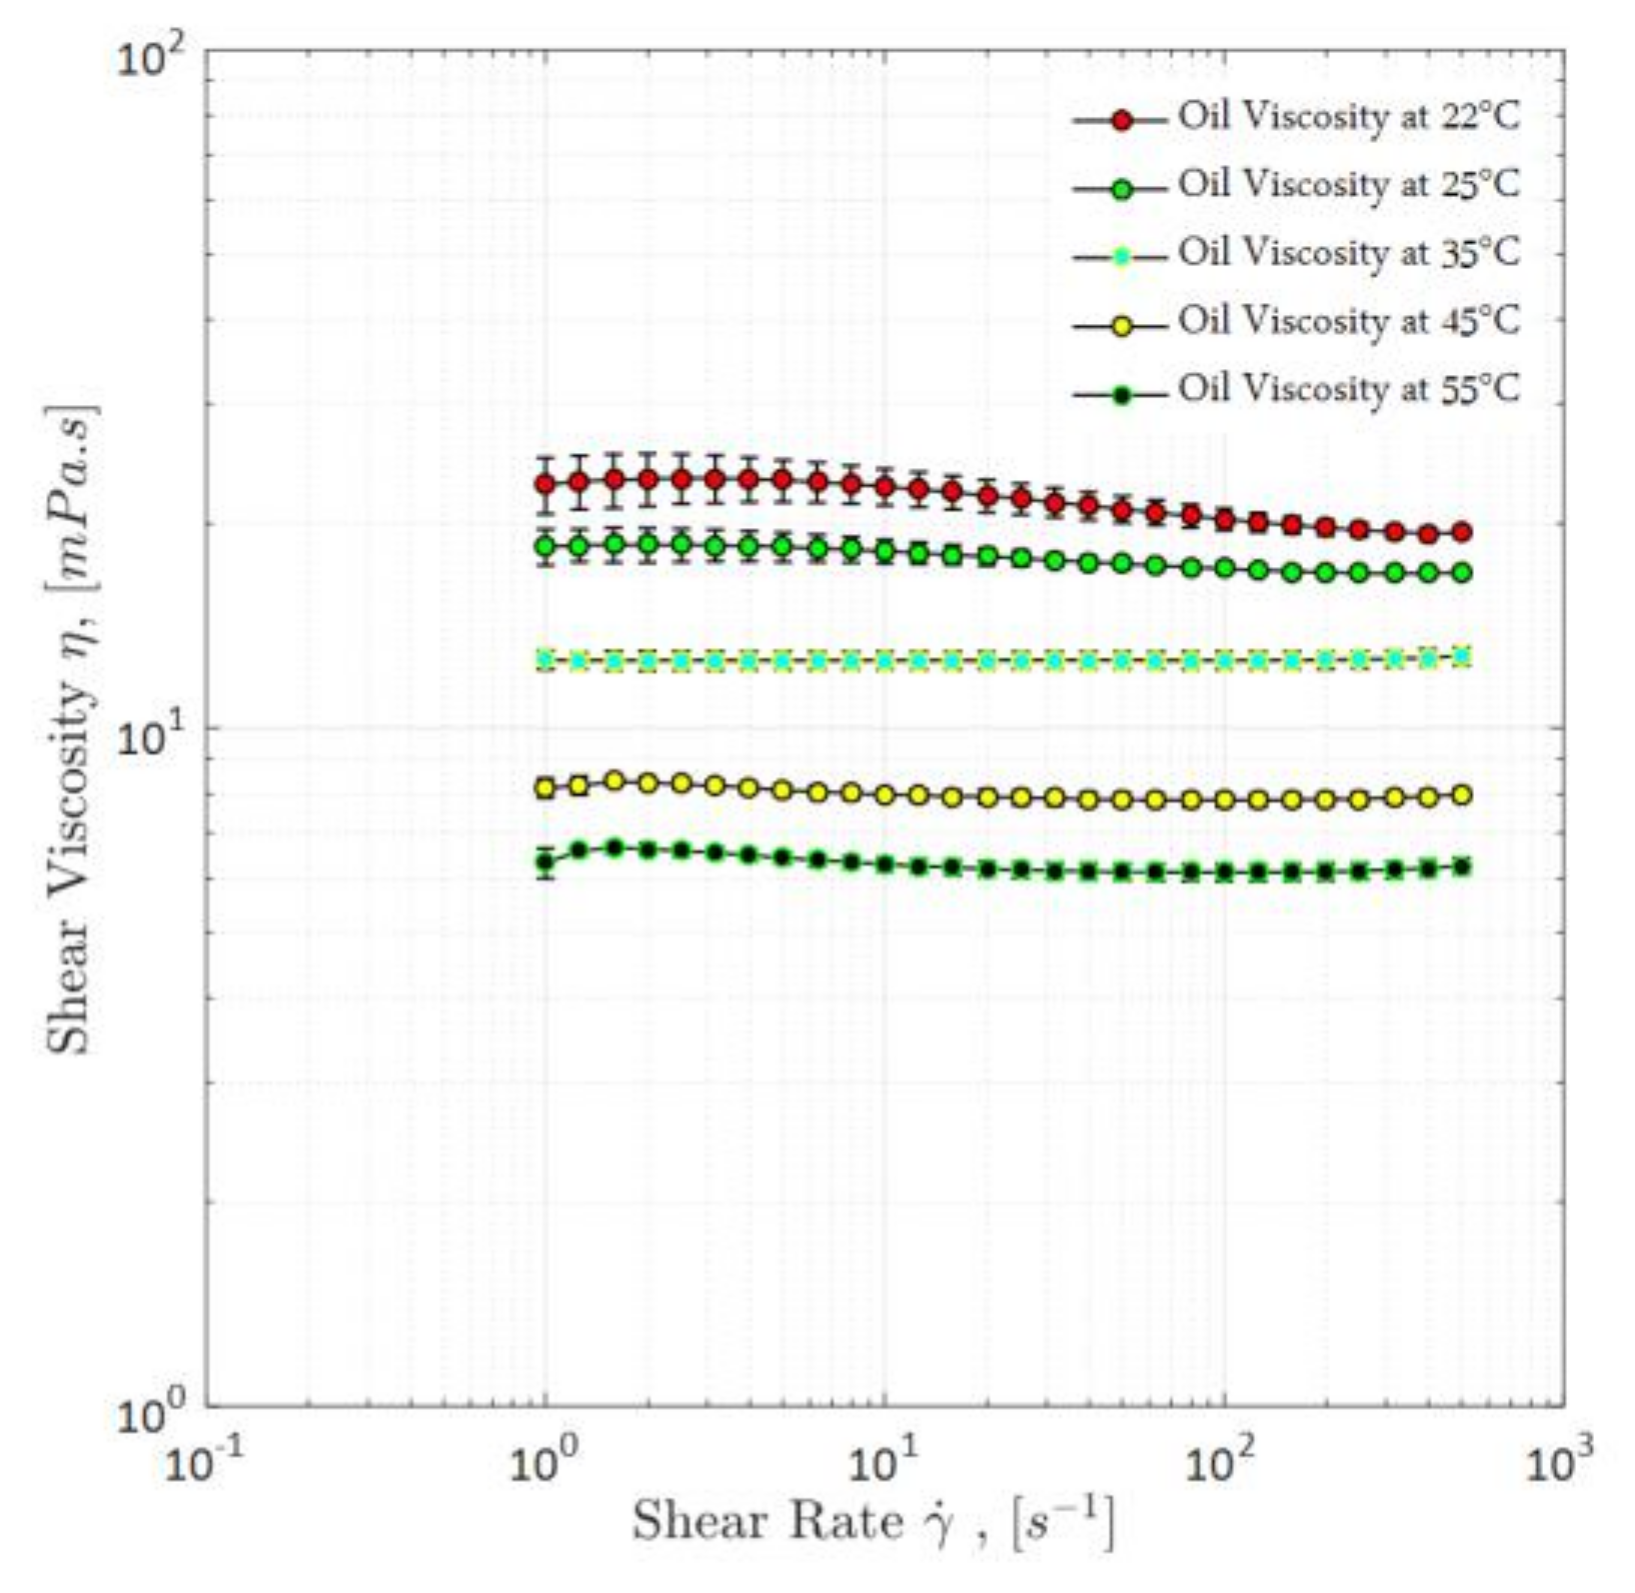
As additional information, the shear viscosity of oil was measured at different temperatures, shown in Figure 6. The adopted temperature range was similar to that used for the polymer evaluations (22 to 55 °C). As expected, oil shear viscosity decreased proportionally with a temperature increase, also depicting Newtonian behavior. Note that this evaluation helped with defining the polymer concentrations with respect to oil viscosity. Core flooding experiments were performed at 45 °C with an oil viscosity of 8.0 mPa·s (10 s−1 shear rate).
4.1.2. Viscoelasticity Evaluations—Small-Amplitude Oscillatory Shear and First Normal Stress Difference, N1
Polymer viscoelastic behavior was evaluated using SAOS response and first normal stress differences measurements. Oscillatory measurements were performed to define the viscous and elastic properties of the polymer solutions. The characterization focuses on the elastic modulus (G′) and viscous modulus (G″), measured against the angular frequency. A viscoelastic material has both liquid-like (viscous) and solid-like (elastic) properties depending upon the deformational stress and relaxation time (time required for the material to relax). If the stress is applied for a shorter time than the relaxation time of a material, then it regains its original molecular structure and exhibits solid-like behavior. However, if the applied stress interval exceeds the relaxation time of a specific material, permanent deformation is caused in the molecular structure and the material exhibits liquid-like behavior. Relaxation time is measured as the inverse of angular frequency (rad/second) at the crossover point of both moduli (viscous and elastic G′ = G″). Materials with a higher relaxation time have strong viscoelastic properties; however, with no or less relaxation time, they have mainly viscous properties.
Similarly, normal stress differences (N1) caused by force normal to shear flow also represent the elastic behavior of the polymer solutions. N1 effects are measured due to tension in the flow streamlines. N1 is a quantitative measurement to evaluate non-linear viscoelastic response by monitoring the normal forces on a rotational rheometer. Mathematically, N1 is defined as N1 = σxx − σyy, where σxx is the stress induced in the direction of applied stresses, and σyy is the normal stress in the force direction.
Based on observations in the literature [59,60,61], it can be concluded that high-molecular-weight hydrolyzed polyacrylamides have good viscoelastic properties and can contribute to additional oil recovery. Therefore, it is essential to characterize polymer viscoelastic properties before performing polymer flooding to understand the flow dynamics in porous media.
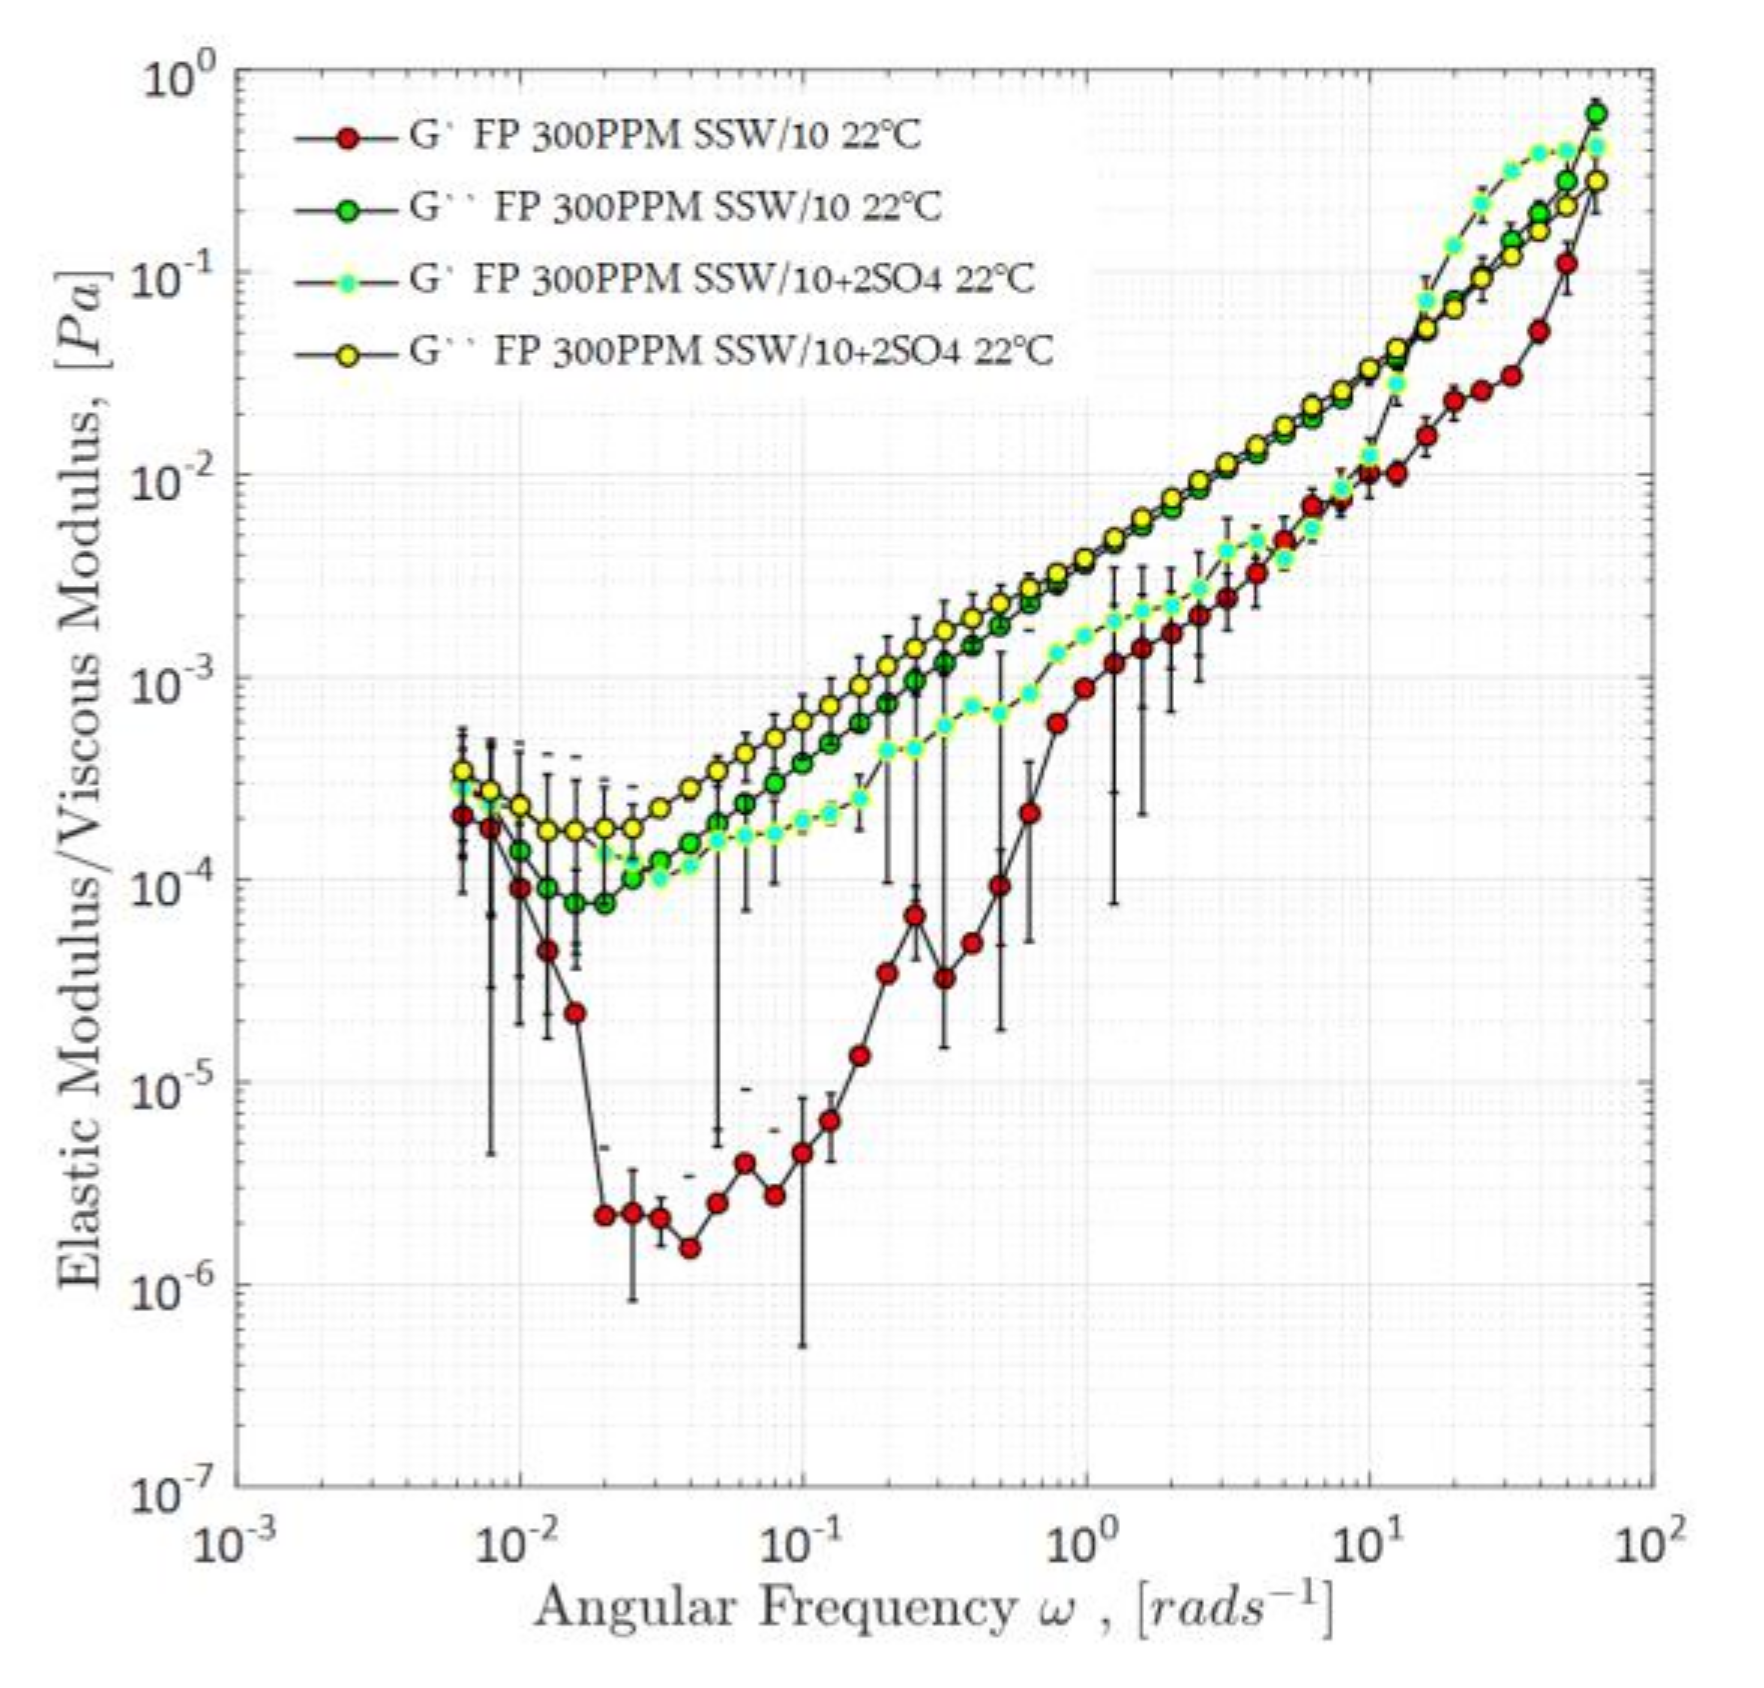
Repeated measurements were performed in order to gather information on viscoelasticity response, without much success. At the first step, angular frequency measurements were performed to define G′ and G″ (elastic modulus and viscous modulus, respectively) for both polymer solutions (300 ppm) at 45 °C. The theory refers that the crossover point between G′ and G″ allows for defining the relaxation time, appointed as the characteristic time required by the polymer coil to relax from a deformed state to its equilibrium configuration [35,36].
In spite of the different attempts, no crossover point was observed for either polymer solution (300 ppm) at 45 °C. Subsequently, the same measurements were performed at room temperature (22 °C), as presented in Figure 7. Once again, no crossover was observed for solutions diluted in synthetic seawater (DSSW). In spite of this, the modified solution with a doubled amount of sulfate depicted a crossover point and a very small relaxation time of ≈ 0.1 s. One may argue that this crossover point is in the margin error or the torque limits of the rheometer. As previously described, G″ is the viscous modulus and defines the energy dissipation. Figure 7 summarizes that G″ of both polymer solutions are overlapping at high angular frequencies. However, G″ for polymer solution prepared in sulfate-modified brine is higher compared to polymer solution prepared in diluted seawater at low angular frequency (<1.0 rad/second). This observation concludes that the spiked amount of sulfate in brine improves polymer viscous properties and the results are in line with the results of steady-shear viscosity previously described in Figure 4 and Figure 5. Similarly, G′ defines the energy storage capacity and the indication of elastic response. Looking at the G′ curves for both polymer solutions, polymer with an increased amount of sulfate depicted the higher values compared to the other polymer solution, however with an exception between 5–10 (rads−1) angular frequencies. Higher G′ values at low angular frequency for polymer solution prepared in sulfate-modified brine concludes the slightly improved elasticity as compared to the second solution. However, focusing on the standard procedure of relaxation time measurement of polymer solutions, it was impossible to completely predict the polymer solutions viscoelastic response with low concentration. Polymers’ viscoelastic response is prominent while flowing through pores and pore throats. Oscillatory measurements provide only linear viscoelastic response, but fail to predict the behavior of solutions through converging-diverging geometry.
A further attempt was to perform first normal stress difference evaluations, to confirm any viscoelastic response during flow of the solutions. N1 is referred to as the viscoelastic response of the polymer under flow [35,36]. However, no N1 response could be measured for either solution (SSWD and SW) at 22 and 45 °C, leading us to further investigate the polymer solutions, defining apparent elongational viscosity (Figure 8).
4.1.3. Apparent Elongational Viscosity
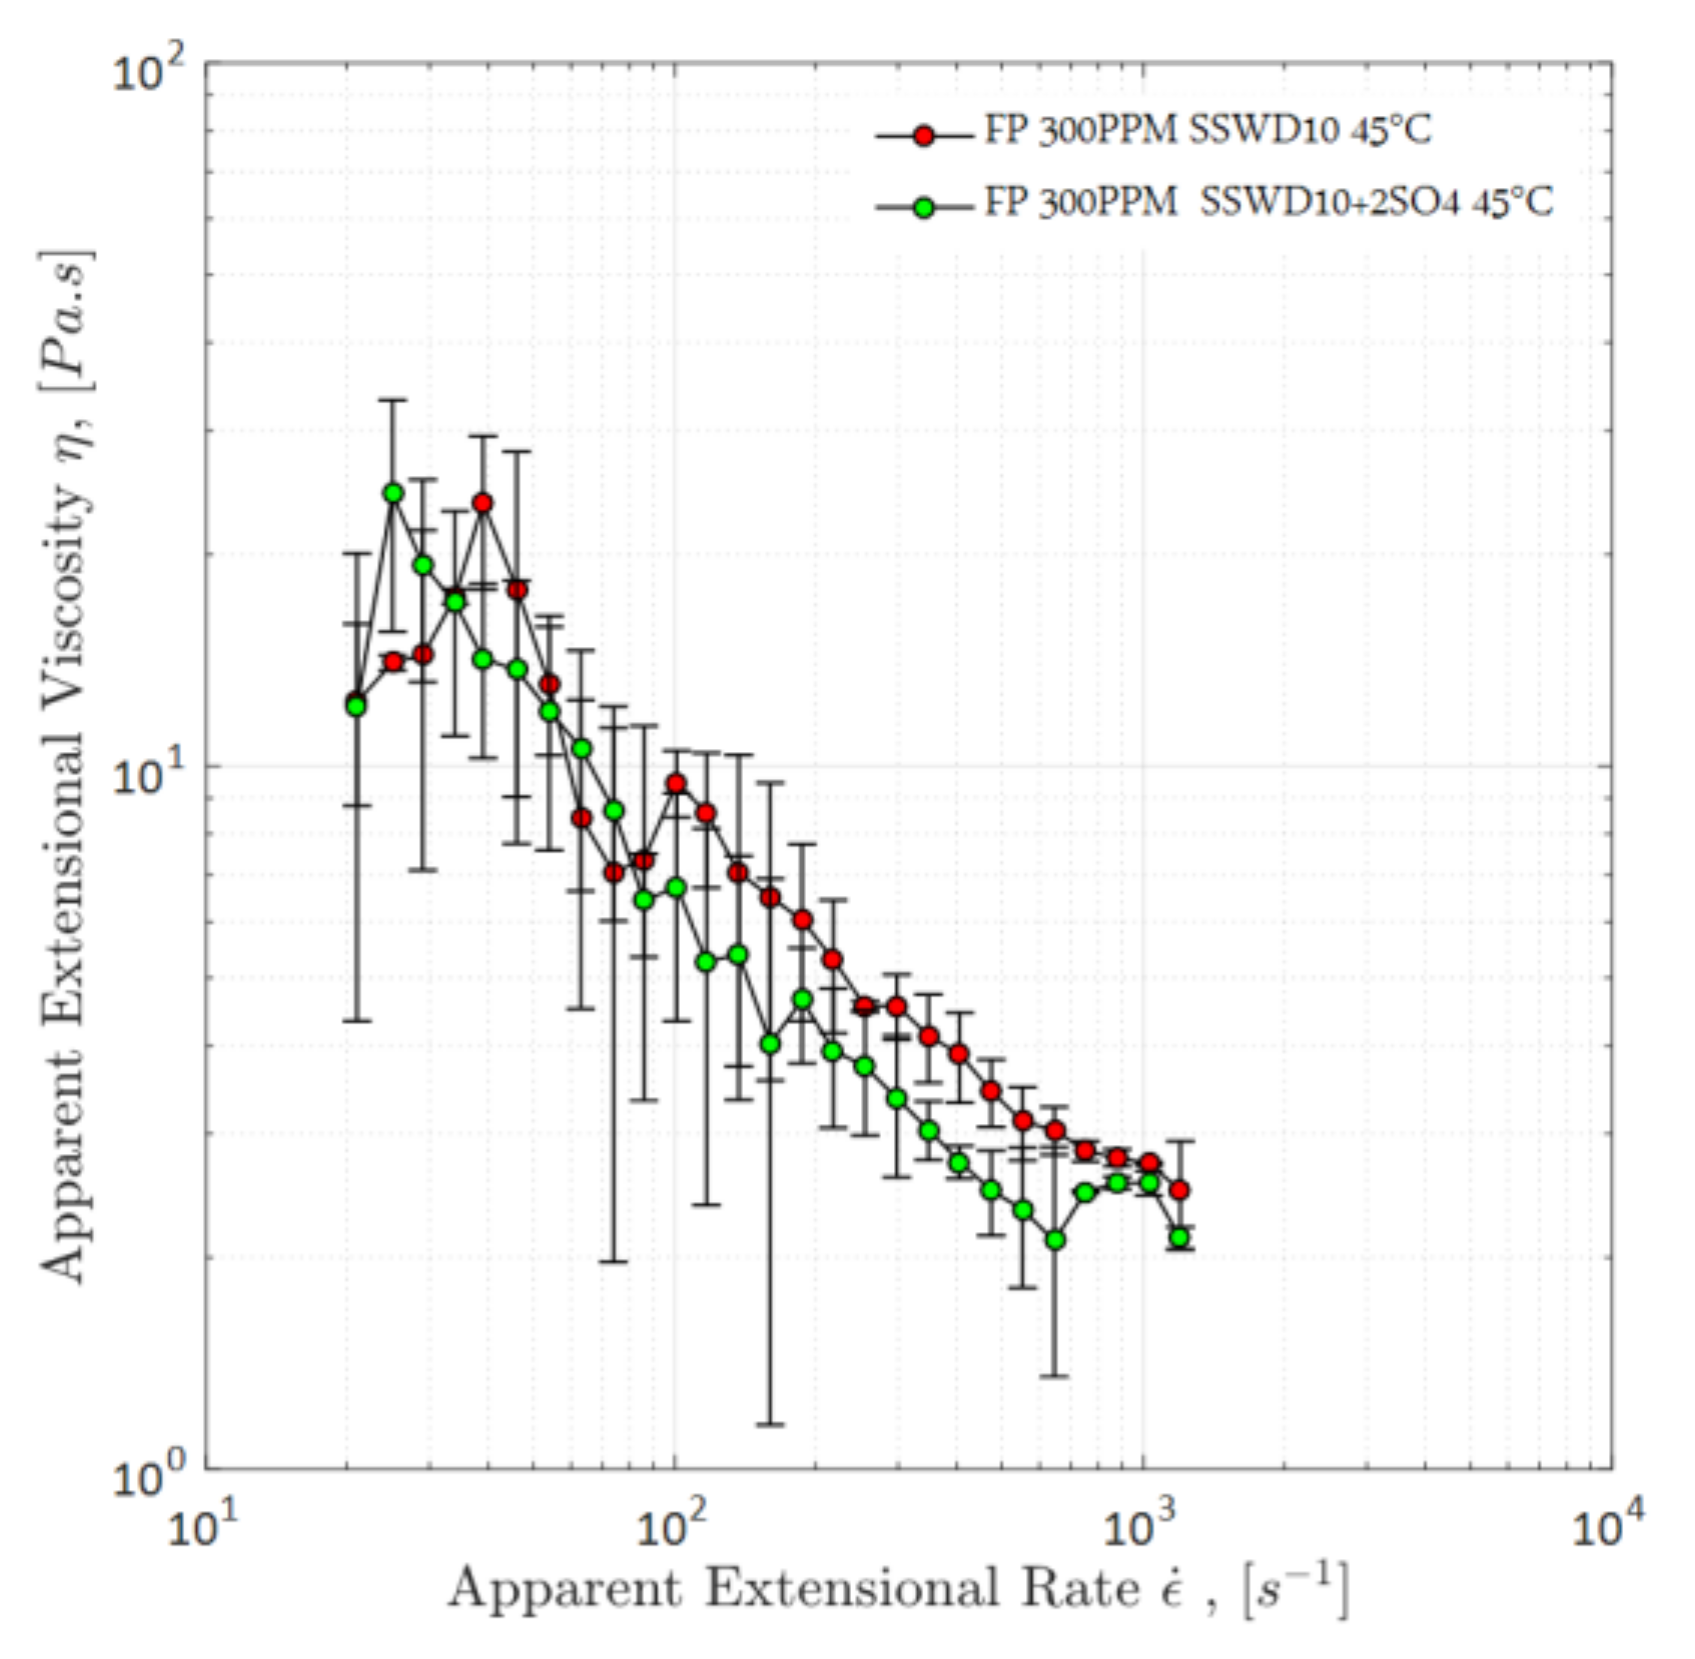
Figure 8 shows the apparent elongational measurements at 45 °C for polymer solutions prepared in DSSW and SW. The objective is to analyze the impact of sulfates on polymer elongational properties. From Figure 8, two important features can be seen between low and high apparent extensional rates:
- The measurement errors, as described with error bars: At lower apparent extensional rates, both solutions exhibited a wider range of measurement errors compared to higher apparent extensional rates. One reason for the errors could be that the elongational measurement is not unique, and there is no device that can reproduce the same behavior of fluids. Moreover, at lower extensional rates, the sensitivity of measurement is higher compared to higher rates. The error bar indicates that the polymer prepared in SW is more sensitive than the polymer solution in DSSW (wider range of error bar).
- The measurement response: Nearly the same elongational viscosity was observed for both solutions, considering the range of error bars between apparent extensional rates of 10–100 s−1. At high extensional rates, the DSSW solution (without sulfates) had slightly higher elasticity compared to SW, but both exhibited a decline in elastic response between apparent extensional rates of 100–1000 s−1. For flow through porous media, the extensional rate for the low to medium range is more important compared to the high rates in Figure 8. Furthermore, the elongational response of a fluid can be different while flowing through porous media (core plug). Whereas flow through porous media fluid experiences series of converging-diverging geometries; for this measurement, only one hyperbolic shape converging-diverging geometry was used. Elongational response of fluid became stronger with multiple contraction and elongation of polymer molecules.
4.1.4. Overall Observations on Rheological Evaluations
Summarizing the results of oscillatory and elongation measurements, it can be concluded that both polymer solutions depicted almost the same viscoelastic response at field-scale low-extensional rates and angular frequencies. The main factor is the low-polymer concentration for these solutions. A clear difference can be justified by increasing the polymer concentration/viscosity. Viscoelastic response of both solutions can be further compared based on the pressure response during polymer flooding in core plugs. Polymer solution with higher viscoelasticity exhibited a higher pressure drop in the core plug at the same injection rate [30].
4.1.5. Polymer Stability Analysis
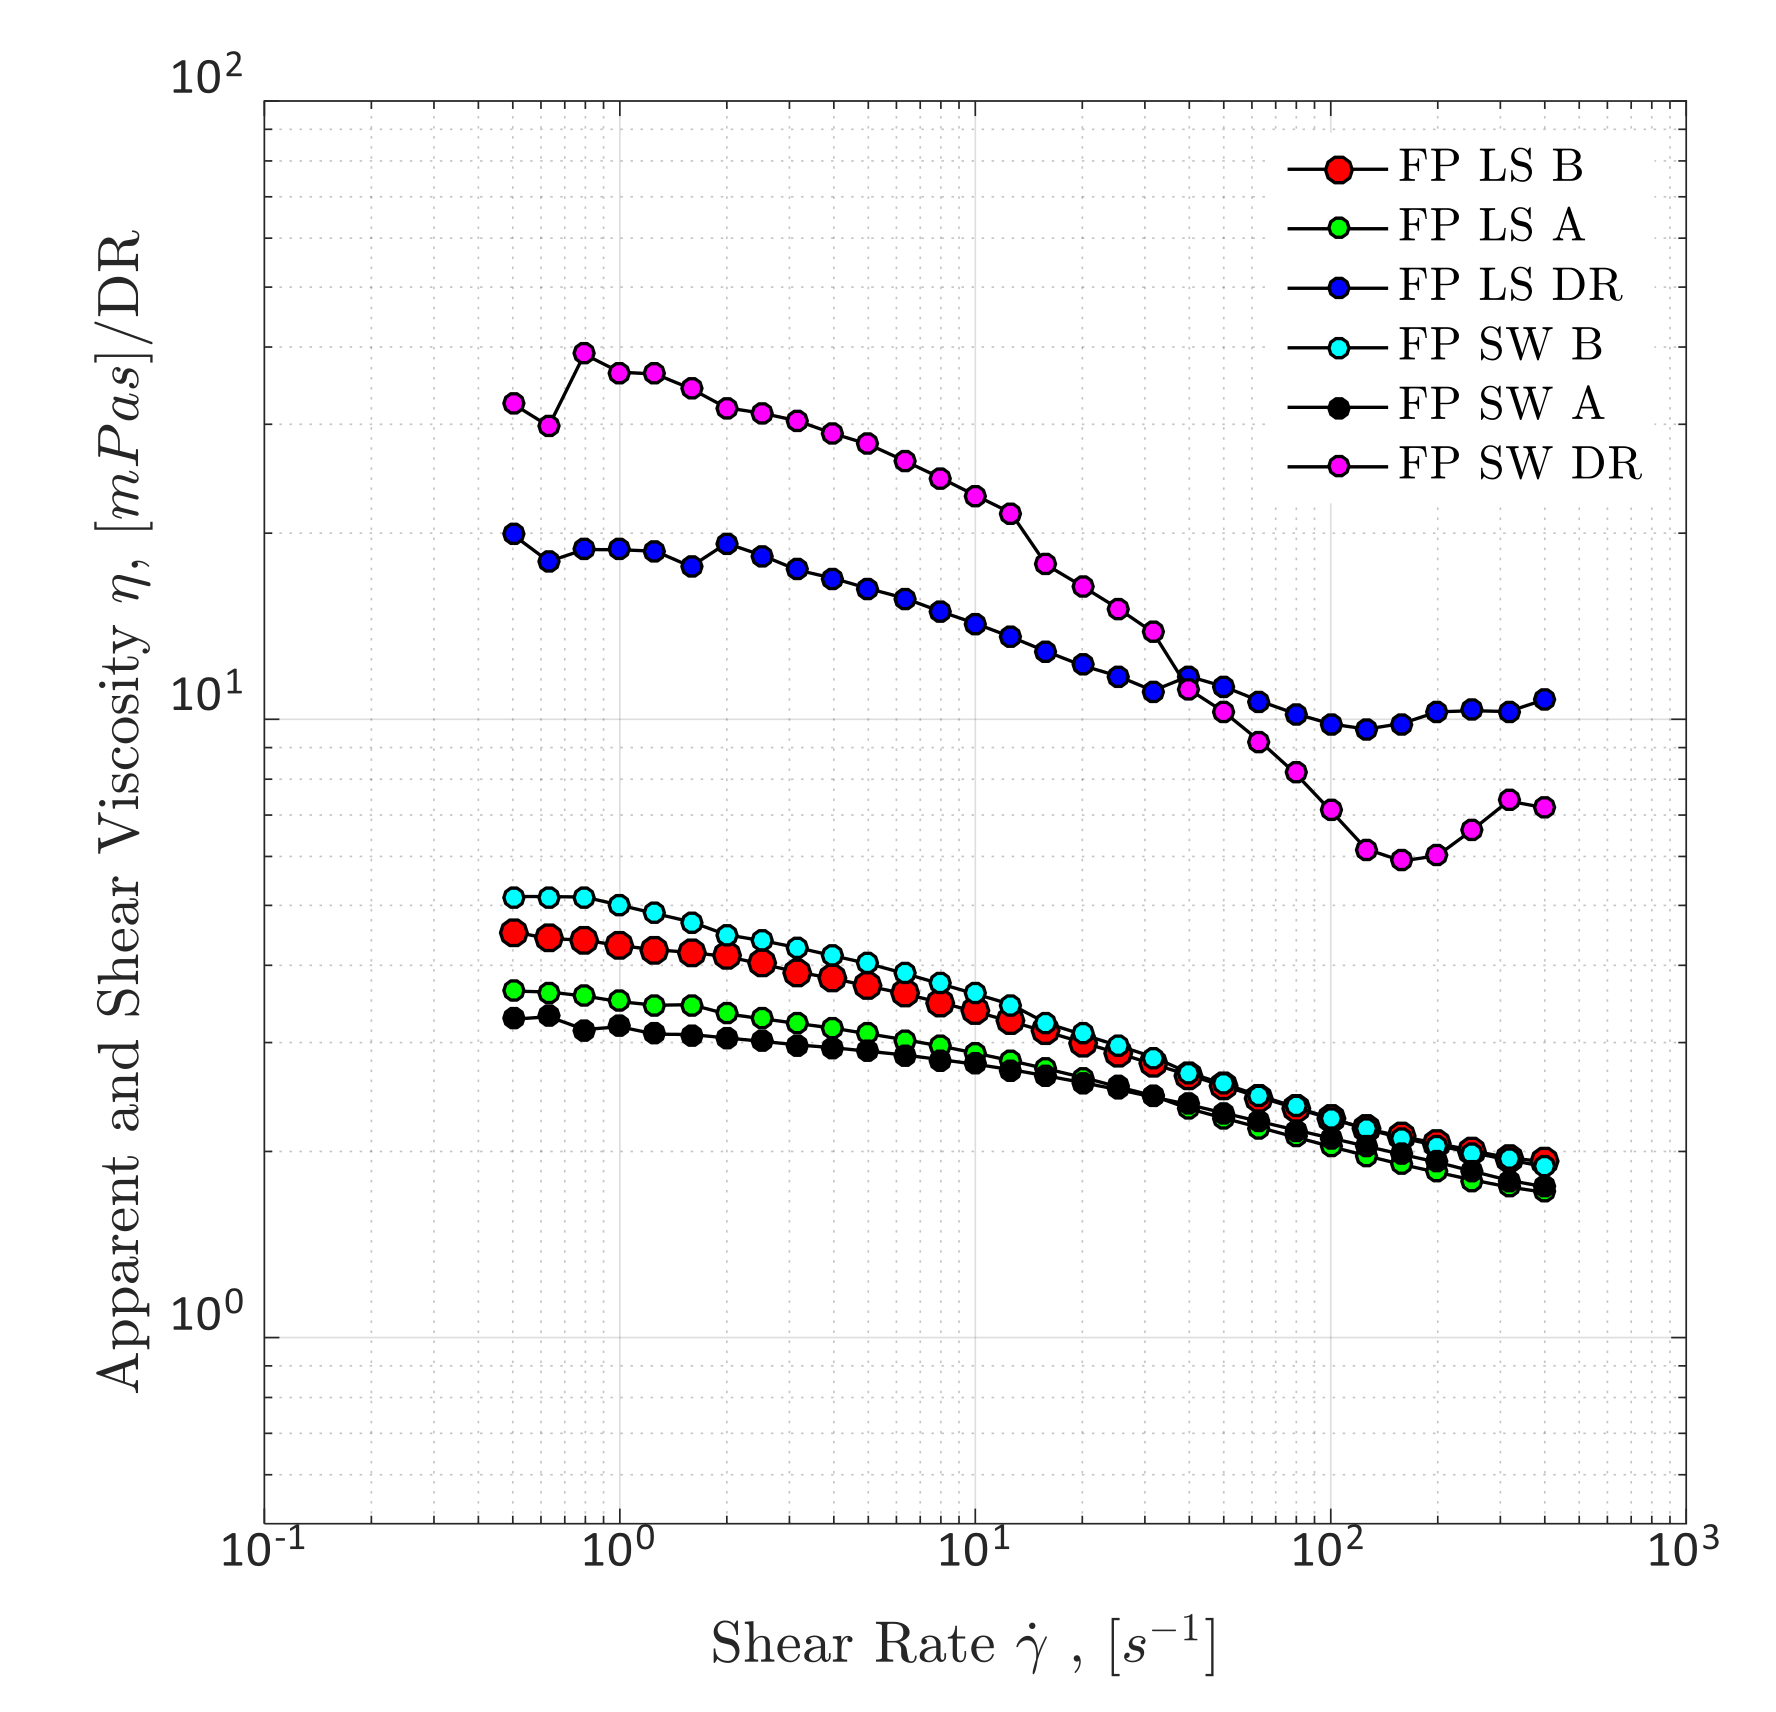
Figure 9 represents the degradation rate of polymer solutions that occurred while flowing through flow lines before entering the core plugs. The idea was to define any possible polymer degradation taking place prior to getting in contact with the core face. 300 ppm polymer-SW has shown a higher degradation rate as compared to 300 ppm polymer-DSSW at low to intermediate shear rates (similar behavior as that reported for the e-VROC response). A possible reason for the higher degradation rate of 300 ppm polymer-SW is supported by the increased amount of monovalent sodium cations present in the brine. Flow across the pipeline induced/supported the ionic interaction of sodium cations with anionic ions of polymer, which resulted in the increased degradation rate, even though the solution polymer-SW has shown higher shear viscosity for fresh solutions, but a significant decrease in polymer-SW viscosity owing to mechanical degradation. A decrease in polymer viscosity can be clearly seen from Figure 9. An increase in sulfate can enhance the polymer viscoelastic properties in porous media but it can significantly develop polymer sensitivity to mechanical degradation.
4.2. Core Flood Experiments and Oil Recovery Observations
Table 5 summarizes the recovered oil based on the core flood sequences adopted for this study. Secondary-mode and tertiary-mode flooding were performed for all core flooding, adopting the flood sequence in Table 4. Post-tertiary-mode flooding was performed in only two core plugs (Bent 5.4 and Bent 5.5). Polymer flooding was used for the post-tertiary-mode for mobility control after brine flooding in both experiments. The objective was to observe any extra oil recovery due to the viscosity difference between tertiary-mode and post-tertiary (quaternary)-mode flooding.
For the first core flood experiment, Bent 5.1, Figure 10 describes the recovery profile and pressure differential across the core as the function of injected pore volumes. The oil recovery factor at the end of the secondary-mode polymer flooding was 41.85%. An increase in pressure response for polymer flooding can be seen in Figure 10. However, diluted SSW in tertiary-mode injection did not change the recovery factor, although 58.15% of oil (remaining oil saturation) was present in the core. This shows that the diluted SSW flood followed the same flow path, which was already adopted by polymer because of the viscosity difference. As polymer viscosity is half of the oil viscosity, diluted SSW could displace only pre-flushed polymer because of its lower viscosity compared to oil. Diluted SSW flood had no interaction with oil in the core to contribute to extra oil recovery and did not mobilize trapped and unflushed oil droplets. Nevertheless, the pressure profile in Figure 10 indicates slightly higher pressure for diluted SSW compared to the pressure profile of SSW before polymer flooding (Figure 11). The reason for this is the presence of a polymer solution in porous media for Bent 5.1.
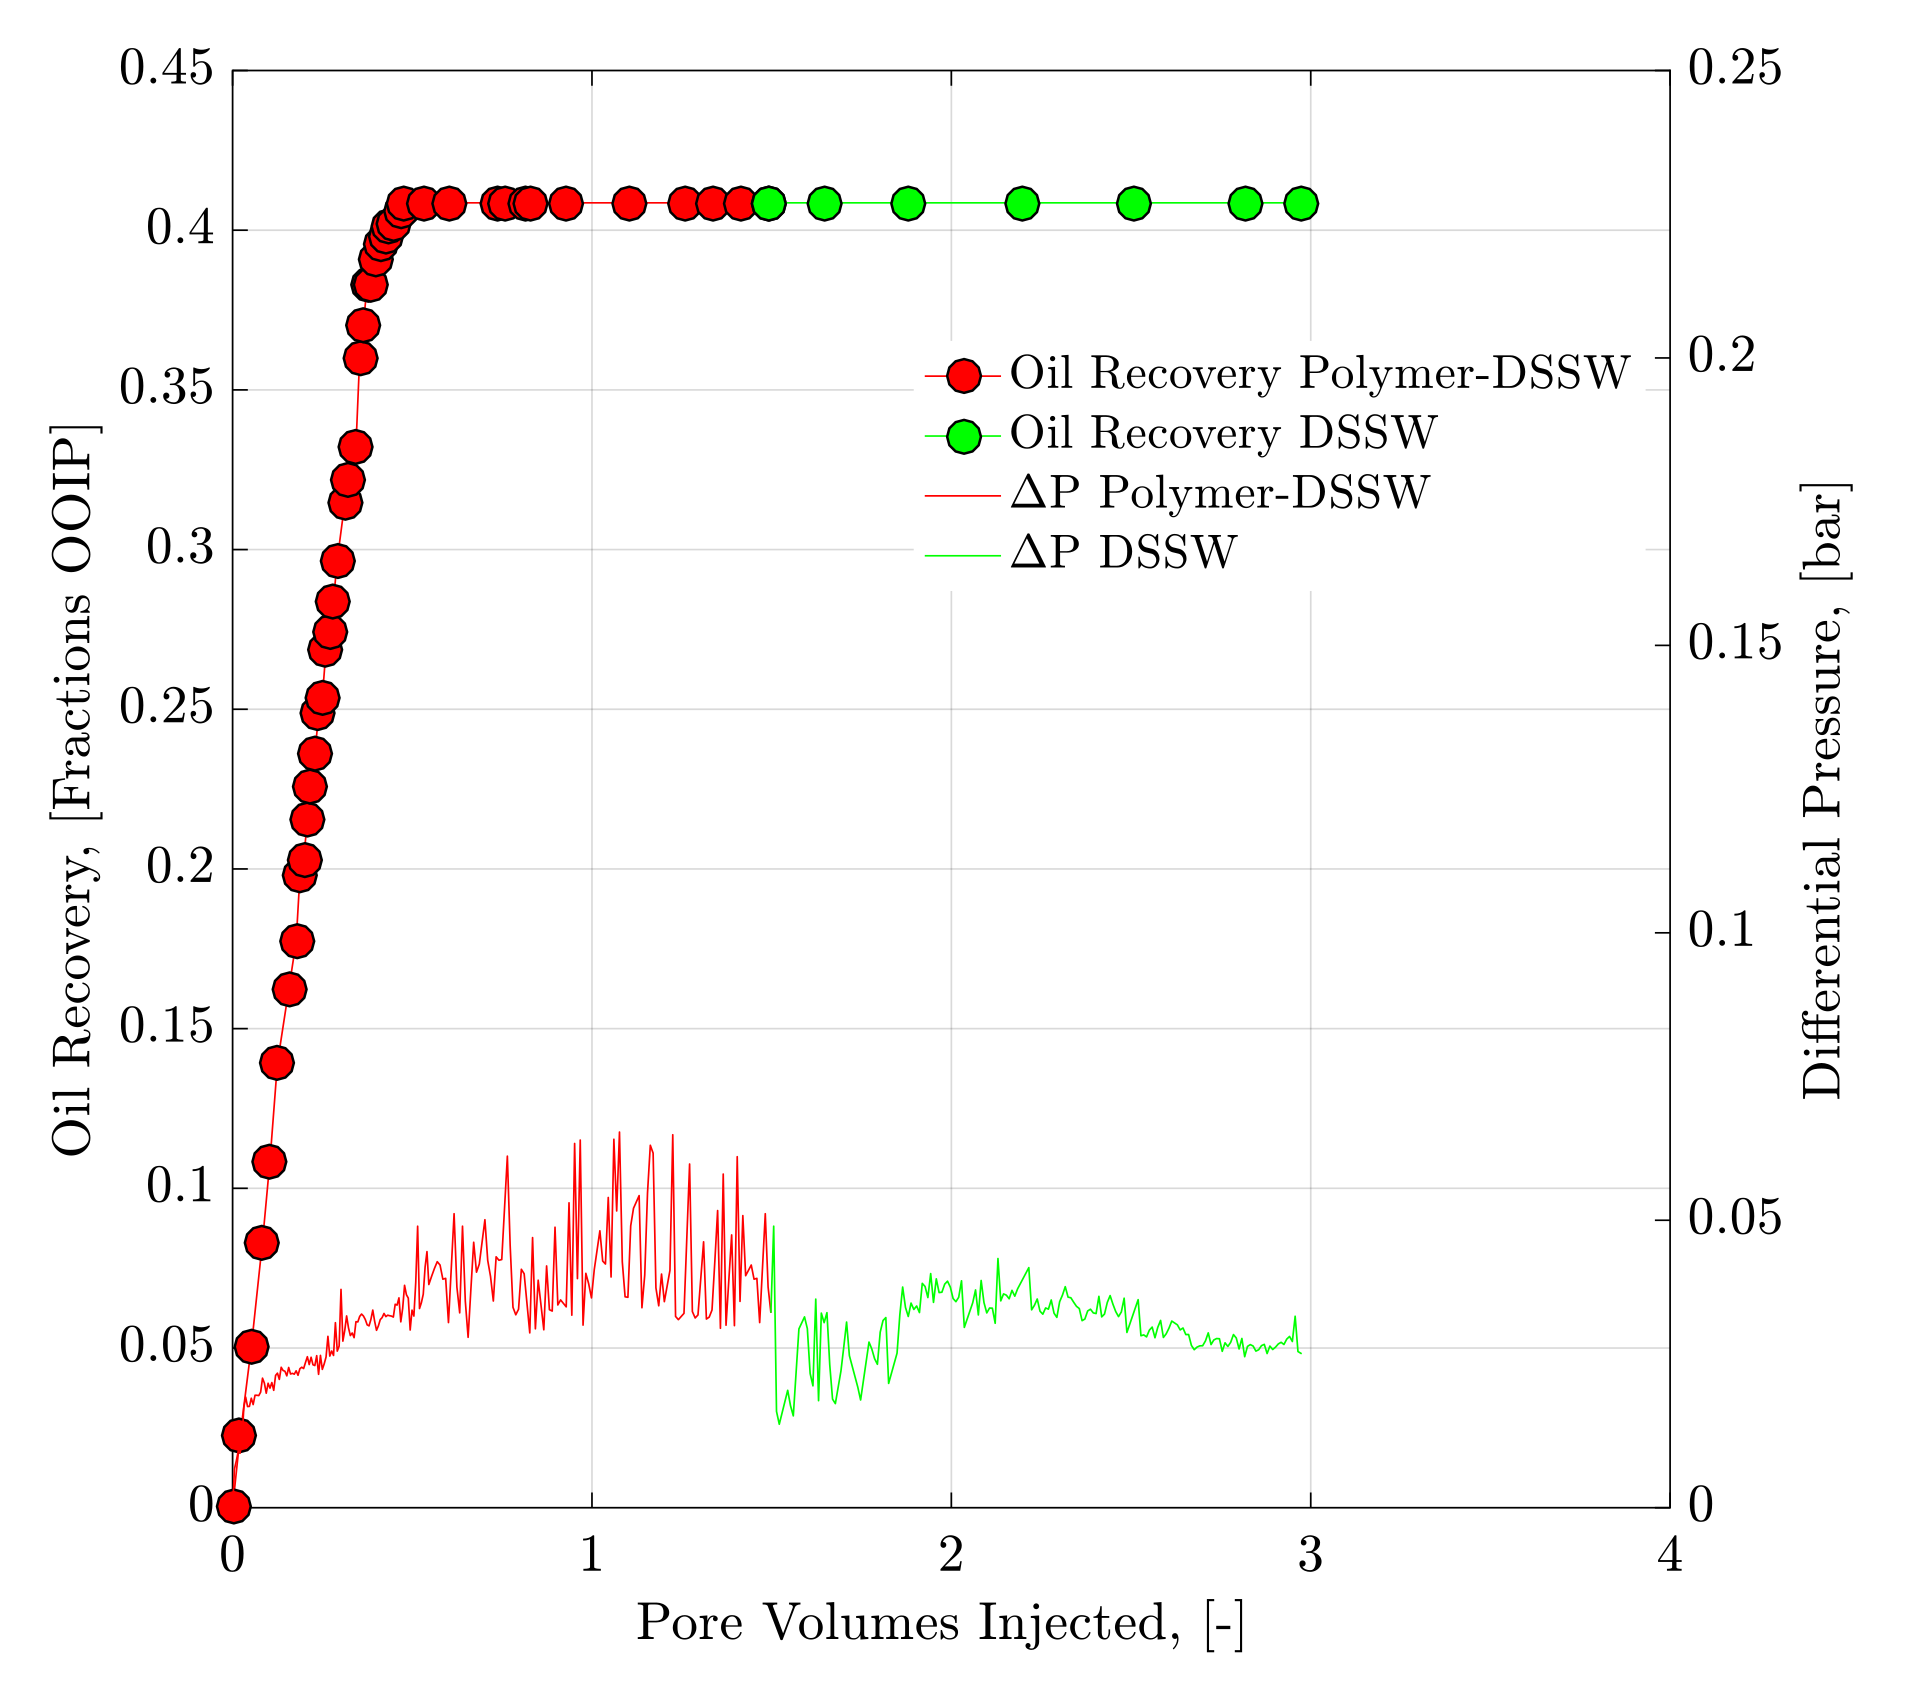
In experiment 2 using the core plug Bent 5.2, the same fluids of experiment 1 were injected but in reverse order. As previously discussed, bump-rate injection for subsequent experiments was performed after secondary-mode brine flooding to eliminate the capillary end effects, if present. Oil recovery from bump rates is not reflected in the results. Figure 11 shows the results of the recovery profile and pressure response for this core (Bent 5.2). The recovery factor of diluted SSW injection as the secondary-mode reaches to around 36.9% oil initial in place, (OIIP) as shown in Figure 11. A significant amount of oil (6.9% OIIP) was produced from the tertiary-mode 300 ppm polymer-DSSW flood. Pressure build-up for polymer flooding can be clearly seen in Figure 11. Comparing the pressure profiles of Bent 5.1 and Bent 5.2 core plugs, 0.05 bar higher pressure for polymer flooding was observed for the Bent 5.2 plug. Additional oil recovery from polymer-DSSW could be due to this higher-pressure response. This pressure response also indicates that prior low-salt flooding helps alter the wettability of the rock and causes the release of oil compounds.
Follow-up tertiary-mode polymer flood experienced resistance in the flow because of the detached and trapped oil in this phase. Moreover, the polymer had slightly higher pressure compared to the polymer flood in Bent 5.1. Hence, polymer flood produces detached and trapped oil droplets because of improved sweep efficiency (additional recovery of 6.9% OIIP).
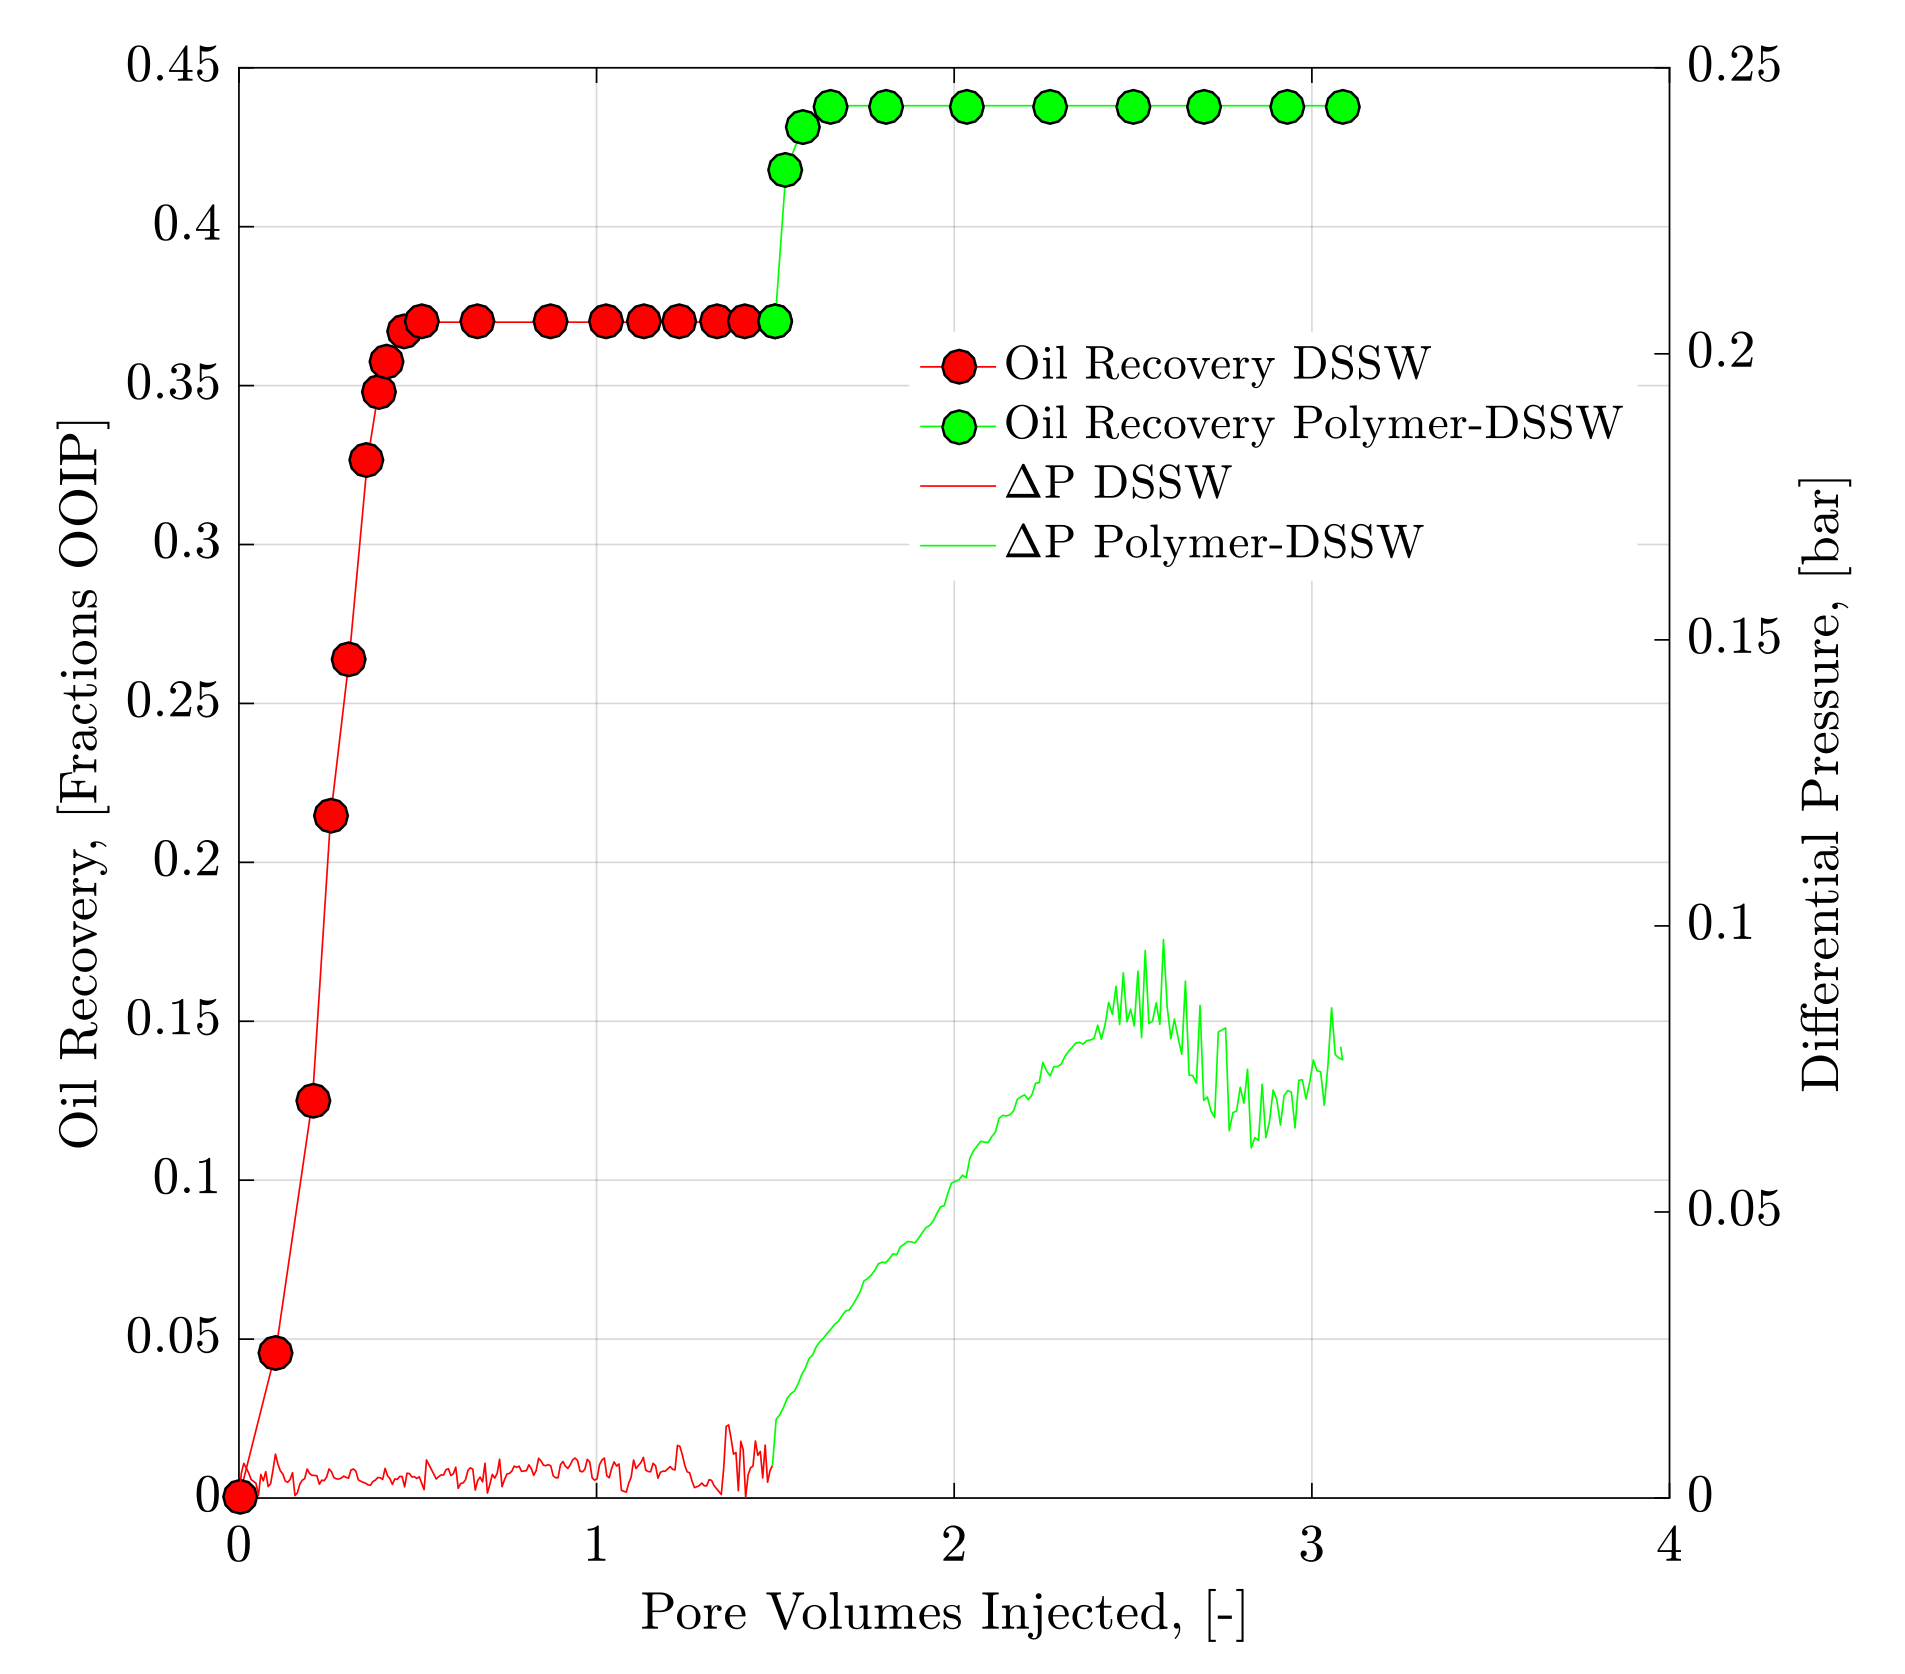
For further comparison, experiment 3 in Bent 5.3 was performed using modified water with doubled sulfates (SW). The injection scheme is similar to that outlined in the previous section (Bent 5.2), but modified water with doubled sulfates (SW) was injected instead of the diluted SSW. The results show 1% higher oil recovery of about 37.87% OIIP in secondary-mode sulfate-modified water flooding compared to secondary-mode DSSW flooding in Bent 5.2.
The incremental oil recovery from 300 ppm polymer-SW flooding in the tertiary mode was 9.6% OIIP. The final oil recovery reached 47.47% OIIP (Figure 12), leaving a remaining oil saturation of 52.53% OIIP compared to the remaining oil saturation in the Bent 5.2 core, which was 56.20% OIIP. One reason for this high recovery is the pressure response, shown in Figure 11 and Figure 12. The pressure drop along the Bent 5.3 core was double for polymer-SW compared to polymer-DSSW (at PV = 2.5). Therefore, the increased oil recovery can mainly be attributed to improved viscoelastic properties of polymer-SW in porous media owing to sulfates. Fluid optimization in the previous section was not significantly different for the viscoelastic properties of both polymers. This behavior further clarifies that linear viscoelastic (oscillatory and e-VROC) measurements cannot wholly predict the fluid response in porous media.
As previously discussed, viscoelastic properties are controlled through the converging-diverging geometry of the flow path in porous media. Single-phase core flooding/sand packs/micromodel flooding can predict the viscoelastic response in porous media. The second reason for higher recovery could be the multi-EOR process in the secondary- and tertiary-modes, as explained by prior research [25,28,62,63]. The sulfate-modified low-saltwater flood may have disturbed the ionic equilibrium in the oil-rock-brine system in the reservoir, which resulted in detaching the long-chain carboxylic acids (oil) adsorbed during the aging process (wettability alteration). Follow-up polymer-SW produced this oil due to improved mobility and viscoelastic forces. Polymer-SW produced 2.7% extra oil compared to the polymer-DSSW due to stronger viscoelastic response in porous media, which resulted in higher injection pressure at the same injection rate [30].
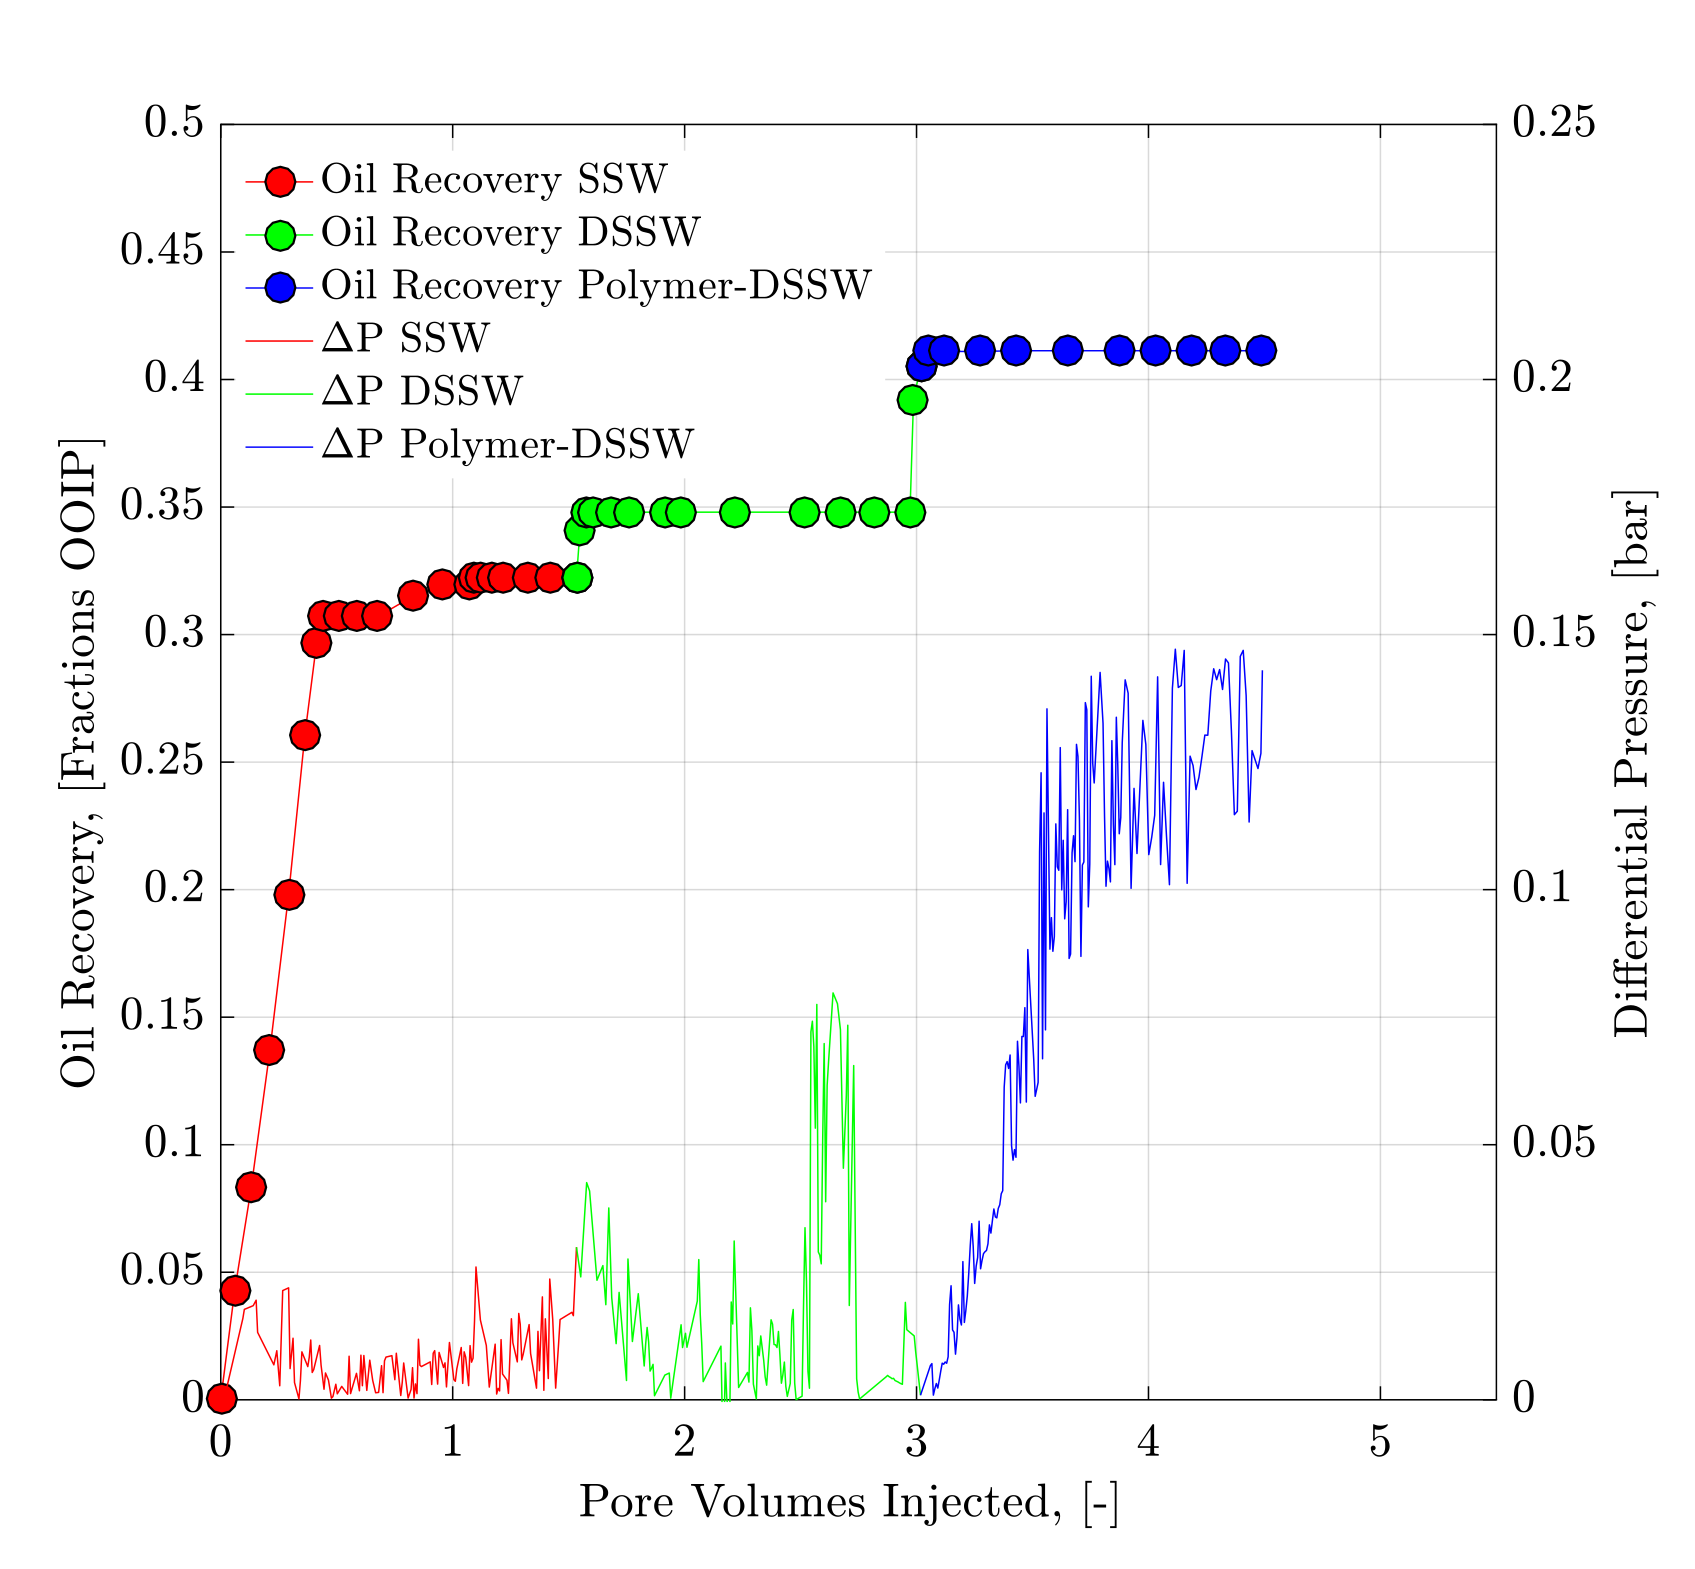
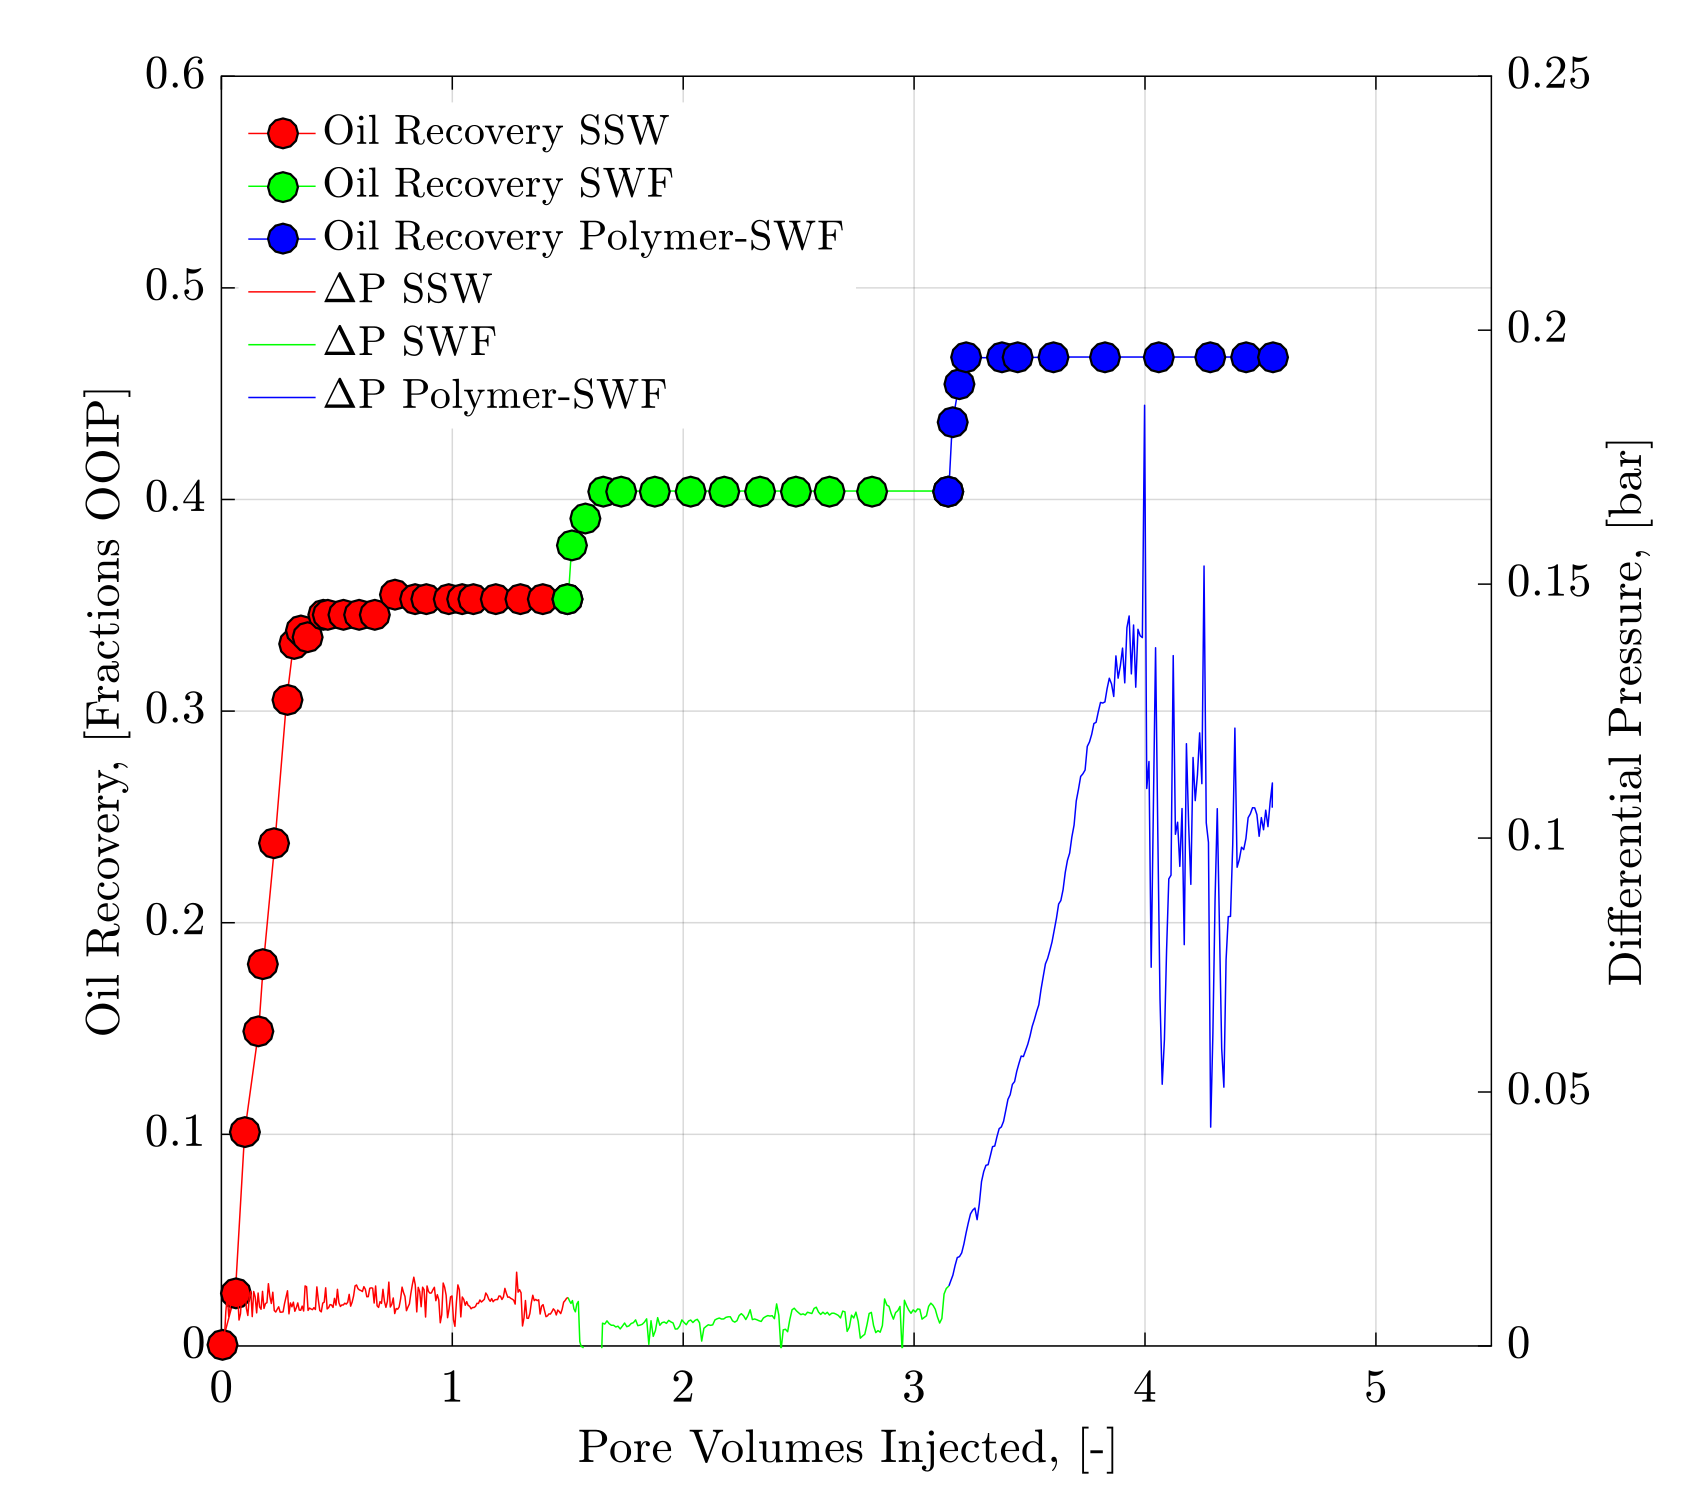
For further investigation, core flooding was performed using SSW as the secondary mode in the Bent 5.4 and Bent 5.5 core plugs, as shown in Figure 13 and Figure 14. Both core plugs produced lower recovery (29.68% and 33.50% OIIP) compared to DSSW flooding, SW water flooding and polymer flooding in the secondary-mode, as mentioned in previous sections. Although SSW has slightly higher viscosity than DSSW and sulfate-modified low-salinity water as a result of higher TDS, extra recovery in Bent 5.2 and Bent 5.3 was due to the low-salt effect and modified water (proposed wettability alteration process). Both brines (DSSW, SW) alter the wettability to be more water-wet compared to SSW and contribute to higher recovery.
Furthermore, DSSW as the tertiary-mode results in only 2.5% extra oil recovery, as described in Figure 13. Nevertheless, sulfate-modified water flood tertiary-mode flooding in Bent 5.5 produced 5.0% extra oil recovery, which is double that compared to DSSW flooding in Bent 5.4. This 2.5% recovery difference further proves that wettability alteration through sulfate-modified water is stronger than DSSW. We can also see from the secondary recovery of both brines in Bent 5.2 and Bent 5.3 plugs, that through sulfate-modified water, they produced 1% higher recovery than DSSW. The last four core flooding experiments indicated that sulfate-modified low-salinity water worked better than diluted synthetic seawater in altering the wettability. Interestingly, polymer flooding in the post-tertiary-mode produced almost the same oil recovery in both core plugs (6.30% of OIIP). However, overall, the difference in recovery for both plugs increased to 3% OIIP after polymer flooding due to multi-EOR processes.
Lastly, comparing the recovery from five core floods in Table 5, it can be concluded that the multi-EOR application of sulfate-modified water flooding in secondary and polymer-SW in the tertiary-mode performed efficiently, resulting in the highest recovery versus the lowest pore volume injected.
5. Conclusions
Based on the obtained data and observations of the experimental conditions presented here, the proposed sulfate-modified low-salt water process produced important results that indicate its potential influence on wettability alteration. Moreover, the work presented here provides a detailed workflow to evaluate the combined application of modified water and polymer flooding. Researchers assessing similar processes can implement this workflow.
The evaluation of polymer performance provides important findings; in particular, polymer solutions prepared in the presence of sulfate in the brine had higher viscosity compared to other brines with the same TDS (g/L). According to the rheological evaluation, linear viscoelastic measurements cannot clearly differentiate the viscoelastic response between the polymer solutions due to the lower concentrations implemented in this work. Nevertheless, the increase in sulfate led to an enhancement of the polymer viscoelastic properties determined through the increase in injection pressure observed from the core flooding experiments. The evaluation also shows that increasing the amount of sulfate made the solution more sensitive to mechanical degradation when flowing through pipes and valves. Current industry applications seek to use low shear valves to minimize this impact.
For the two-phase flooding, core floods showed that low-salt or sulfate-modified water flooding should be performed before polymer flooding to achieve higher oil recovery. Otherwise, brine flooding after polymer flooding will follow the same path of pre-injected polymer without having contact with oil. Furthermore, sulfate-modified water flooding and DSSW injection produced almost the same recovery in the secondary-mode. However, in the tertiary-mode, polymer injection after sulfate-modified low-salinity water flooding produced 4% more oil compared to polymer flooding after DSSW. It is assumed that this additional oil is due to the higher pressure/viscoelastic response for polymer-SW. Finally, recovery experiments showed that SW and DSSW contributed to extra recovery compared to SSW in the secondary mode due to wettability alteration; however, the overall combination of SW and polymer resulted in the higher recovery. The findings obtained by the two-phase flooding experiments support that both brines (SW and DSSW) induce wettability alteration of the rock, pointing out that the wettability change for the case of sulfate-modified water strongly follows the presence of 2SO4−2 as a catalyst for the alteration to take place.
Author Contributions
M.T. performed experiments and defined methodology. R.E.H. worked on conceptualization and results validation, L.G. reviewed and performed editing. All authors have read and agreed to the published version of the manuscript.
Funding
This research received no external funding.
Acknowledgments
We acknowledge support given by the Open Access Publishing Fund of Clausthal University of Technology.
Conflicts of Interest
The authors declare no conflict of interest.
Abbreviations/Nomenclature
| A | After |
| B | Before |
| DR | Degradation Rate |
| EOR | Enhanced oil recovery |
| FP | Flopaam 6035 S |
| DSSW | Ten-times diluted synthetic seawater |
| DSSWF | Ten-times diluted synthetic seawater flood |
| OIIP | Oil initial in place |
| Polymer-DSSW | Polymer solution prepared in ten-times diluted synthetic seawater |
| Polymer-SW | Polymer solution prepared in sulfate-modified water |
| SR | Shear Rate |
| SSW | Synthetic sea water |
| SW | Smart water |
| SWF | Smart water flood |
| TDS | Total dissolved solids |
| ΔΡ | Pressure drop across the core |
| kb | Permeability to brine |
| kg | Permeability to gas |
References
- Martin, J.C. The Effects of Clay on the Displacement of Heavy Oil by Water. Venez. Ann. Meet. 1959. [Google Scholar] [CrossRef]
- Yousef, A.A.; Al-Saleh, S.; Al-Jawfi, M.S. Smart WaterFlooding for Carbonate Reservoirs: Salinity and Role of Ions. In Proceedings of the SPE Middle East Oil and Gas Show and Conference, Manama, Bahrain, 25–28 September 2011. [Google Scholar] [CrossRef]
- Nasralla, R.A.; Nasr-El-Din, H.A. Coreflood Study of Low Salinity Water Injection in Sandstone Reservoirs. SPE/DGS Saudi Arabia Sect. Tech. Symp. Exhib. 2011. [Google Scholar] [CrossRef]
- Shiran, B.S.; Skauge, A. Wettability and Oil Recovery by Low Salinity Injection. In Proceedings of the SPE EOR Conference at Oil and Gas West Asia, Muscat, Oman, 16–18 April 2012. [Google Scholar] [CrossRef]
- Suman, Y.K.; Shirif, E.; Ibrahim, H.; Ala-Ktiwi, A. Evaluation of Low Saline “Smart Water” Enhanced Oil Recovery in Light Oil Reservoirs. World J. Eng. Technol. 2014, 2, 13–22. [Google Scholar] [CrossRef]
- Bagci, S.; Kok, M.V.; Türksoy, U.; Baǧci, S. Effect of Brine Composition on oil Recovery by Waterflooding. Pet. Sci. Technol. 2001, 19, 359–372. [Google Scholar] [CrossRef]
- Ligthelm, D.J.; Gronsveld, J.; Hofman, J.; Brussee, N.; Marcelis, F.; Van Der Linde, H. Novel Waterflooding Strategy By Manipulation Of Injection Brine Composition. In Proceedings of the EUROPEC/EAGE Conference and Exhibition; Society of Petroleum Engineers (SPE), Amsterdam, The Netherlands, 8–11 June 2009. [Google Scholar] [CrossRef]
- Morrow, N.; Buckley, J. Improved Oil Recovery by Low-Salinity Waterflooding. J. Pet. Technol. 2011, 63, 106–112. [Google Scholar] [CrossRef]
- Webb, K.J.; Black, C.J.J.; Tjetland, G. A Laboratory Study Investigating Methods for Improving Oil Recovery in Carbonates. In Proceedings of the International Petroleum Technology Conference, Doha, Qatar, 21–23 November 2005. [Google Scholar] [CrossRef]
- Lager, A.; Webb, K.; Black, C. Impact of Brine Chemistry on Oil Recovery. In Proceedings of the IOR 2007—14th European Symposium on Improved Oil Recovery, Cairo, Egypt, 22–24 April 2007; EAGE Publications: Houten, The Netherlands, 2007. [Google Scholar]
- Awolayo, A.; Sarma, H.; Alsumaiti, A.M. A Laboratory Study of Ionic Effect of Smart Water for Enhancing Oil Recovery in Carbonate Reservoirs. In Proceedings of the SPE EOR Conference at Oil and Gas West Asia, Muscat, Oman, 31 March–2 April 2014. [Google Scholar] [CrossRef]
- Fathi, S.J.; Austad, T.; Strand, S. Water-Based Enhanced Oil recovery (EOR) by “Smart Water” in Carbonate Reservoirs. In Proceedings of the SPE EOR Conference at Oil and Gas West Asia, Muscat, Oman, 16–18 April 2012. [Google Scholar] [CrossRef]
- Zahid, A.; Stenby, E.H.; Shapiro, A.A. Smart Waterflooding (High Sal/Low Sal) in Carbonate Reservoirs. In Proceedings of the SPE Europec/EAGE Annual Conference, Copenhagen, Denmark, 4–7 June 2012. [Google Scholar] [CrossRef]
- Zhang, P.; Tweheyo, M.T.; Austad, T. Wettability alteration and improved oil recovery by spontaneous imbibition of seawater into chalk: Impact of the potential determining ions Ca2+, Mg2+, and SO42−. Colloids Surf. A Physicochem. Eng. Asp. 2007, 301, 199–208. [Google Scholar] [CrossRef]
- Zhang, P.; Tweheyo, M.T.; Austad, T. Wettability Alteration and Improved Oil Recovery in Chalk: The Effect of Calcium in the Presence of Sulfate. Energy Fuels 2006, 20, 2056–2062. [Google Scholar] [CrossRef]
- Gomari, K.R.; Hamouda, A.A.; Denoyel, R. Influence of sulfate ions on the interaction between fatty acids and calcite surface. Colloids Surf. A Physicochem. Eng. Asp. 2006, 287, 29–35. [Google Scholar] [CrossRef]
- Karoussi, O.; Hamouda, A.A. Imbibition of Sulfate and Magnesium Ions into Carbonate Rocks at Elevated Temperatures and Their Influence on Wettability Alteration and Oil Recovery. Energy Fuels 2007, 21, 2138–2146. [Google Scholar] [CrossRef]
- Garcia-Olvera, G.; Alvarado, V.; Alvarado, V. Interfacial rheological insights of sulfate-enriched smart-water at low and high-salinity in carbonates. Fuel 2017, 207, 402–412. [Google Scholar] [CrossRef]
- Bin Merdhah, A.B.; Yassin, A.A.M. Laboratory Study and Prediction of Calcium Sulphate at High-Salinity Formation Water. Open Pet. Eng. J. 2008, 1, 62–73. [Google Scholar] [CrossRef] [Green Version]
- Yuan, M. Effect of Temperature on Barium Sulfate Scale Inhibition of Diethylene Triamine Penta (Methylene Phosphonic Acid). In Advances in Crystal Growth Inhibition Technologies; Springer Science and Business Media LLC: Boston, MA, USA, 2005; pp. 151–163. [Google Scholar] [CrossRef]
- Ghosh, B.; Sun, L.; Osisanya, S. Smart-Water EOR Made Smarter A Laboratory Development. In Proceedings of the International Petroleum Technology Conference, Bangkok, Thailand, 14–16 November 2016. [Google Scholar] [CrossRef]
- Andersen, K.; Halvorsen, E.; Sælensminde, T.; Østbye, N. Water Management in a Closed Loop—Problems and Solutions at Brage Field. In Proceedings of the SPE European Petroleum Conference, Paris, France, 24–25 October 2000. [Google Scholar] [CrossRef]
- Graham, G.; Boak, L.; Hobden, C. Examination of the Effect of Generically Different Scale Inhibitor Species (PPCA and DETPMP) on the Adherence and Growth of Barium Sulphate Scale on Metal Surfaces. Int. Symp. Oilfield Scale 2001. [Google Scholar] [CrossRef]
- Luo, H.; Al Shalabi, P.E.W.; Delshad, M.; Panthi, K.; Sepehrnoori, K. A Robust Geochemical Simulator to Model Improved-Oil-Recovery Methods. SPE J. 2016, 21, 55–73. [Google Scholar] [CrossRef]
- Shiran, B.S.; Skauge, A. Enhanced Oil Recovery (EOR) by Combined Low Salinity Water/Polymer Flooding. Energy Fuels 2013, 27, 1223–1235. [Google Scholar] [CrossRef]
- Sheng, J.J. Critical review of low-salinity waterflooding. J. Pet. Sci. Eng. 2014, 120, 216–224. [Google Scholar] [CrossRef]
- Sheng, J.J.; Leonhardt, B.; Azri, N. Status of Polymer-Flooding Technology. J. Can. Pet. Technol. 2015, 54, 116–126. [Google Scholar] [CrossRef]
- Shiran, B.S.; Skauge, A. Similarities and Differences of Low Salinity Polymer and Low Salinity LPS (Linked Polymer Solutions) for Enhanced Oil Recovery. J. Dispers. Sci. Technol. 2014, 35, 1656–1664. [Google Scholar] [CrossRef]
- Sorbie, K.S.; Phil, K.S.S.D. Polymer-Improved Oil Recovery; Springer: Dordrecht, The Netherlands, 1991; ISBN 978-94-011-3044-8. [Google Scholar]
- Tahir, M.; Hincapie, R.E.; Be, M.; Ganzer, L. Experimental Evaluation of Polymer Viscoelasticity during Flow in Porous Media: Elongational and Shear Analysis. In Proceedings of the SPE Europec Featured at 79th EAGE Conference and Exhibition, Paris, France, 12–15 June 2017. [Google Scholar] [CrossRef]
- Tahir, M.; Hincapie, R.E. Coexistence of Shear and Elongational Components of Flow Paths through Porous Media during Polymer-Flooding Applications. In Proceedings of the 77th EAGE Conference and Exhibition, Madrid, Spain, 1–4 June 2015. [Google Scholar]
- Vermolen, E.C.; Van Haasterecht, M.J.; Masalmeh, S.K.; Faber, M.J.; Boersma, D.M.; Gruenenfelder, M.A. Pushing the envelope for polymer flooding towards high-temperature and high-salinity reservoirs with polyacrylamide based ter-polymers. In Proceedings of the SPE Middle East Oil and Gas Show and Conference, Manama, Bahrain, 25–28 September 2011. [Google Scholar] [CrossRef]
- Be, M.; Hincapie, R.E.; Rock, A.; Gaol, C.L.; Tahir, M.; Ganzer, L. Comprehensive Evaluation of the EOR Polymer Viscoelastic Phenomenon at Low Reynolds Number. In Proceedings of the SPE Europec Featured at 79th EAGE Conference and Exhibition, Paris, France, 12–15 June 2017. [Google Scholar] [CrossRef]
- Elhajjaji, R.R.; Hincapie, R.E.; Tahir, M.; Rock, A.; Wegner, J.; Ganzer, L. Systematic Study of Viscoelastic Properties During Polymer-Surfactant Flooding in Porous Media (Russian). In Proceedings of the SPE Russian Petroleum Technology Conference and Exhibition, Moscow, Russia, 24–26 October 2016. [Google Scholar] [CrossRef]
- Hincapie, R.E. Pore-Scale Investigation of the Viscoelastic Phenomenon during Enhanced Oil Recovery (EOR) Polymer Flooding through Porous Media; Papierflieger: Clausthal-Zellerfeld, Germany, 2016. [Google Scholar]
- Hincapie, R.E.; Duffy, J.; O’Grady, C.; Ganzer, L. An Approach to Determine Polymer Viscoelasticity Under Flow Through Porous Media by Combining Complementary Rheological Techniques. In Proceedings of the SPE Asia Pacific Enhanced Oil Recovery Conference, Kuala Lumpur, Malaysia, 11–13 August 2015. [Google Scholar]
- Garcia-Olvera, G.; Alvarado, V. The Potential of Sulfate as Optimizer of Crude Oil-Water Interfacial Rheology to Increase Oil Recovery During Smart Water Injection in Carbonates. In Proceedings of the SPE Improved Oil Recovery Conference, Tulsa, OK, USA, 11–13 April 2016. [Google Scholar] [CrossRef]
- Skauge, A.; Shiran, B. Low Salinity Polymer Flooding. In Proceedings of the IOR 2013—17th European Symposium on Improved Oil Recovery, Saint Petersburg, Russia, 16–18 April 2013. [Google Scholar] [CrossRef]
- Sohrabi, M.; Mahzari, P.; Farzaneh, S.A.; Mills, J.R.; Tsolis, P.; Ireland, S. Novel Insights into Mechanisms of Oil Recovery by Use of Low-Salinity-Water Injection. SPE J. 2017, 22, 407–416. [Google Scholar] [CrossRef]
- Graham, G.M.; Boak, L.S.; Hobden, C.M. Examination of the Effect of Generically Different Scale Inhibitor Species (PPCA and DETPMP) on the Adherence and Growth of Barium Sulphate Scale on Metal Surfaces. In International Symposium on Oilfield Scale, Aberdeen, UK, 30–31 January 2001; Society of Petroleum Engineers: Amsterdam, The Netherlands, 2001. [Google Scholar] [CrossRef]
- Wei, B.; Romero-Zerón, L.; Rodrigue, D. Oil displacement mechanisms of viscoelastic polymers in enhanced oil recovery (EOR): A review. J. Pet. Explor. Prod. Technol. 2013, 4, 113–121. [Google Scholar] [CrossRef] [Green Version]
- Al-Saedi, H.; Flori, R.E.; Mortadha, A. Investigation of Smart Water Flooding in Sandstone Reservoirs: Experimental and Simulation Study Part 2; Missouri University of Science and Technology: Rolla, MO, USA, 2018. [Google Scholar] [CrossRef]
- Mohamed, M.I.; Alvarado, V. Smart Water Flooding in Berea Sandstone at Low Temperature: Is Wettability Alteration the Sole Mechanism at Play? In Proceedings of the SPE Annual Technical Conference and Exhibition, San Antonio, TX, USA, 9–11 October 2017. [Google Scholar] [CrossRef]
- Verruto, V.J.; Kilpatrick, P.K. Water-in-Model Oil Emulsions Studied by Small-Angle Neutron Scattering: Interfacial Film Thickness and Composition. Langmuir 2008, 24, 12807–12822. [Google Scholar] [CrossRef]
- Hybrid Enhanced Oil Recovery using Smart Waterflooding; Gulf Professional Publishing: Houston, TX, USA, 2019; ISBN 9780128172988.
- Torrijos, I.D.P.; Puntervold, T.; Strand, S.; Austad, T.; Bleivik, T.H.; Abdullah, H.I. An experimental study of the low salinity Smart Water—Polymer hybrid EOR effect in sandstone material. J. Pet. Sci. Eng. 2018, 164, 219–229. [Google Scholar] [CrossRef]
- Shabib-Asl, A.; Ayoub, M.A.; Elraies, K.A. A new hybrid technique using low salinity water injection and foam flooding for enhanced oil recovery in sandstone rock. J. Pet. Sci. Eng. 2019, 174, 716–728. [Google Scholar] [CrossRef]
- Kilybay, A.; Ghosh, B.; Thomas, N.C.; Sulemana, N.T. Hybrid EOR Technology: Carbonated Water-Smart Water Flood Improved Recovery in Oil Wet Carbonate Formation: Part-II. In Proceedings of the SPE Oil and Gas India Conference and Exhibition, Mumbai, India, 4–6 April 2017. [Google Scholar] [CrossRef]
- Xu, X.; Saeedi, A. Evaluation and Optimization Study on a Hybrid EOR Technique Named as Chemical-Alternating-Foam Floods. Oil Gas Sci. Technol. Rev. de l’IFP 2017, 72, 1. [Google Scholar] [CrossRef] [Green Version]
- Almansour, A.O.; AlQuraishi, A.A.; AlHussinan, S.N.; Alyami, H.Q. Efficiency of enhanced oil recovery using polymer-augmented low salinity flooding. J. Pet. Explor. Prod. Technol. 2017, 7, 1149–1158. [Google Scholar] [CrossRef] [Green Version]
- Kozaki, C. Efficiency of Low Salinity Polymer Flooding in Sandstone Cores. Master’s Thesis, The University of Texas at Austin, Austin, TX, USA, 2012. [Google Scholar]
- Mohammadi, H.; Jerauld, G. Mechanistic Modeling of the Benefit of Combining Polymer with Low Salinity Water for Enhanced Oil Recovery. In Proceedings of the SPE Improved Oil Recovery Symposium, Tulsa, OK, USA, 14–18 April 2012. [Google Scholar] [CrossRef]
- Pourafshary, P.; Moradpour, N. Hybrid EOR Methods Utilizing Low-Salinity Water. Enhanc. Oil Recovery Process. New Technol. 2019. [Google Scholar] [CrossRef] [Green Version]
- AlSofi, A.M.; Wang, J.; AlBoqmi, A.M.; Alotaibi, M.B.; Ayirala, S.; Alyousef, A. Smart Water Synergy with Chemical EOR for a Slightly Viscous Arabian Heavy Reservoir. In Proceedings of the SPE Heavy Oil Conference and Exhibition, Kuwait City, Kuwait, 6–8 December 2016. [Google Scholar] [CrossRef]
- Tabary, R.; Douarche, F.; Bazin, B.; Lemouzy, P.M.; Moreau, P.; Morvan, M. Design of a Surfactant/Polymer Process in a Hard Brine Context: A Case Study Applied to Bramberge Reservoir. In Proceedings of the SPE EOR Conference at Oil and Gas West Asia, Muscat, Oman, 16–18 April 2012. [Google Scholar] [CrossRef]
- Tay, A.; Oukhemanou, F.; Wartenberg, N.; Moreau, P.; Guillon, V.; Delbos, A.; Tabary, R. Adsorption Inhibitors: A New Route to Mitigate Adsorption in Chemical Enhanced Oil Recovery. In Proceedings of the SPE Asia Pacific Enhanced Oil Recovery Conference, Kuala Lumpur, Malaysia, 11–13 August 2015. [Google Scholar] [CrossRef]
- Skauge, T.; Djurhuus, K.; Reichenbach-Klinke, R. Visualization of Heavy Oil Mobilization by Associative Polymer. In Proceedings of the SPE Europec featured at 80th EAGE Conference and Exhibition, Copenhagen, Denmark, 11–14 June 2018. [Google Scholar] [CrossRef]
- Severs, E.T.; Austin, J.M. Flow Properties of Vinyl Chloride Resin Plastisols. Ind. Eng. Chem. 1954, 6, 2369–2375. [Google Scholar] [CrossRef]
- Wang, D.; Wang, G.; Xia, H. Large Scale High Visco-Elastic Fluid Flooding in the Field Achieves High Recoveries. In Proceedings of the SPE Enhanced Oil Recovery Conference, Kuala Lumpur, Malaysia, 19–21 July 2011. [Google Scholar] [CrossRef]
- Yin, H.; Wang, D.; Zhong, H. Study on Flow Behavoirs of Viscoelastic Polymer Solution in Micropore with Dead End. In Proceedings of the SPE Annual Technical Conference and Exhibition, San Antonio, TX, USA, 24–27 September 2006. [Google Scholar] [CrossRef]
- Demin, W.; Jiecheng, C.; Huifen, X.; Qun, L.; Jingping, S. Viscous-Elastic Fluids Can Mobilize Oil Remaining after Water-Flood by Force Parallel to the Oil-Water Interface. In Proceedings of the SPE Asia Pacific Improved Oil Recovery Conference, Kuala Lumpur, Malaysia, 6–9 October 2001. [Google Scholar] [CrossRef]
- Tahir, M.; Hincapie, R.E.; Foedisch, H.; Abdullah, H.; Ganzer, L. Impact of Sulphates Presence During Application of Smart Water Flooding Combined with Polymer Flooding. In Proceedings of the SPE Europec Featured at 80th EAGE Conference and Exhibition, Copenhagen, Denmark, 11–14 June 2018. [Google Scholar] [CrossRef]
- Tahir, M.; Hincapie, R.E.; Foedisch, H.; Strobel, G.-J.; Ganzer, L. Potential Benefits of Fluid Optimization for Combined Smart-Water and Polymer Flooding: Impact on Remaining Oil Saturation. In Proceedings of the SPE Russian Petroleum Technology Conference, Moscow, Russia, 22–24 October 2019. [Google Scholar] [CrossRef]
Figure 1.
Wettability alteration of sandstone rock surface through the sulfate ions. (a) Refers to oil-wet and (b) refers to water-wet condition of reservoir.
Figure 1.
Wettability alteration of sandstone rock surface through the sulfate ions. (a) Refers to oil-wet and (b) refers to water-wet condition of reservoir.

Figure 2.
Sketch of core flood experimental setup.

Figure 3.
Steady-shear viscosity of polymer solutions at a temperature range of 22–55 °C and shear rates of 3, 5, 7, 10 and 20 s−1. Diluted solutions were prepared in four different brines, described in Table 1. (A) Represents diluted solution prepared in Na2SO4 brine, (B) shows solution prepared in NaCl brine, (C) depicts results of solutions prepared in SSW, while (D) represents solutions prepared in diluted SSW.

Figure 4.
Comparison of steady-shear viscosity of polymer solutions at a temperature range of 22–55 °C and shear rate of 10 s−1. The diluted solutions were prepared in four different brines, described in Table 1.
Figure 4.
Comparison of steady-shear viscosity of polymer solutions at a temperature range of 22–55 °C and shear rate of 10 s−1. The diluted solutions were prepared in four different brines, described in Table 1.

Figure 5.
Steady-shear viscosity of polymer solutions at a temperature of 45 °C. Polymer solutions are prepared in Brine 3 and Brine 4 of Table 2 with concentrations of 200, 300 and 500 ppm.
Figure 5.
Steady-shear viscosity of polymer solutions at a temperature of 45 °C. Polymer solutions are prepared in Brine 3 and Brine 4 of Table 2 with concentrations of 200, 300 and 500 ppm.

Figure 6.
Steady-shear viscosity of oil sample TM-206 at a temperature range of 22–55 °C. Errors observed in the range of ~3%.
Figure 6.
Steady-shear viscosity of oil sample TM-206 at a temperature range of 22–55 °C. Errors observed in the range of ~3%.

Figure 7.
Oscillatory measurements of G′ and G″ as a function of angular frequency for Flopaam 6035 S at 22 °C.
Figure 7.
Oscillatory measurements of G′ and G″ as a function of angular frequency for Flopaam 6035 S at 22 °C.

Figure 8.
Apparent extensional viscosity as a function of apparent extensional rate for polymer solutions of Flopaam 6035 S at 45 °C.
Figure 8.
Apparent extensional viscosity as a function of apparent extensional rate for polymer solutions of Flopaam 6035 S at 45 °C.

Figure 9.
Viscosity loss and mechanical degradation of polymer solutions through stainless-steel pipe before entering the core plug. B represents the fresh solution while A represents the degraded solution through stainless-steel pipe connections.
Figure 9.
Viscosity loss and mechanical degradation of polymer solutions through stainless-steel pipe before entering the core plug. B represents the fresh solution while A represents the degraded solution through stainless-steel pipe connections.

Figure 10.
Oil recovery and pressure drop versus pore volume (PV) injected for Bent 5.1 core plug. Red represents the experimental data for secondary mode injection of polymer-DSSW, while green is for the tertiary injection mode of DSSWF.
Figure 10.
Oil recovery and pressure drop versus pore volume (PV) injected for Bent 5.1 core plug. Red represents the experimental data for secondary mode injection of polymer-DSSW, while green is for the tertiary injection mode of DSSWF.

Figure 11.
Oil recovery and pressure drop versus PV injected for Bent 5.2 core plug. Red color represents the experimental data for secondary mode injection of DSSW while green color is for the tertiary injection mode of polymer-DSSW.
Figure 11.
Oil recovery and pressure drop versus PV injected for Bent 5.2 core plug. Red color represents the experimental data for secondary mode injection of DSSW while green color is for the tertiary injection mode of polymer-DSSW.

Figure 12.
Oil recovery and pressure drop versus PV injected for Bent 5.3 core plug. Red color represents the experimental data for secondary-mode injection of smart water flood while green color is for the tertiary injection mode of polymer-SW.
Figure 12.
Oil recovery and pressure drop versus PV injected for Bent 5.3 core plug. Red color represents the experimental data for secondary-mode injection of smart water flood while green color is for the tertiary injection mode of polymer-SW.

Figure 13.
Oil recovery and pressure drop versus PV injected for Bent 5.4 core plug. Red color represents the experimental data for secondary-mode injection of SSW, green color is for the tertiary injection mode of DSSWF and blue color is for the post-tertiary injection mode of polymer-DSSW.
Figure 13.
Oil recovery and pressure drop versus PV injected for Bent 5.4 core plug. Red color represents the experimental data for secondary-mode injection of SSW, green color is for the tertiary injection mode of DSSWF and blue color is for the post-tertiary injection mode of polymer-DSSW.

Figure 14.
Oil recovery and pressure drop versus PV injected for Bent 5.4 core plug. Red color represents the experimental data for secondary-mode injection of SSW, green color is for the tertiary injection mode of smart water flood and blue color is for the post-tertiary injection mode of polymer-SW.


Table 1.
Composition of the brines used in Brine Group A (BGA) to dissolve the polymer solutions.
| Chemical Formula | Composition (g/L) | |||
|---|---|---|---|---|
| SSW* | SSW/10 | (NaCl)5 | (Na2SO4)5 | |
| NaCl | 23.9744 | 2.3974 | 5.0000 | - |
| KCl | 0.8009 | 0.0801 | - | - |
| CaCl₂ | 1.1077 | 0.1108 | - | - |
| MgCl₂·6H₂O | 11.0412 | 1.1042 | - | - |
| SrCl₂·6H₂O | 0.0268 | 0.0027 | - | - |
| Na₂SO₄ | 3.9332 | 0.3933 | - | 5.0000 |
| NaHCO₃ | 0.2758 | 0.0275 | - | - |
| TDS** | 41.1596 | 4.1160 | 5.0000 | 5.0000 |
| Hardness (R+1) | 0.1300 | 0.1300 | 0 | 0 |
SSW* = Synthetic sea water, and TDS** = Total dissolved solids.
Table 2.
Composition of the brines used in Brine Group B (BGB) to design modified water and to dissolve the polymer solutions.
Table 2.
Composition of the brines used in Brine Group B (BGB) to design modified water and to dissolve the polymer solutions.
| Chemical Formula | Composition (g/L) | |||
|---|---|---|---|---|
| Brine 1 | Brine 2 | Brine 3 (DSSW*) | Brine 4 (SW) | |
| SSW | SSW + 2SO4 | SSW/10 | (SSW + 2SO4)/10 | |
| Nacl | 23.9744 | 23.9744 | 2.3974 | 2.3974 |
| KCl | 0.8009 | 0.8009 | 0.0801 | 0.0800 |
| CaCl₂ | 1.1077 | 1.1077 | 0.1108 | 0.1107 |
| MgCl₂·6H₂O | 11.0412 | 11.0412 | 1.1041 | 1.1041 |
| SrCl₂·6H₂O | 0.0268 | 0.0268 | 0.0027 | 0.0026 |
| Na₂SO₄ | 3.9332 | 7.8664 | 0.3933 | 0.7866 |
| NaHCO₃ | 0.2754 | 0.2754 | 0.0275 | 0.0275 |
| TDS | 41.1596 | 45.0928 | 4.1156 | 4.5092 |
| Hardness (R+1) | 0.1300 | 0.1150 | 0.1300 | 0.1150 |
| pH @ 22 °C | 5.8300 | - | 5.7800 | 5.2800 |
| IFT (mN/m) with Oil @ 22 °C | - | - | 9.4000 | 8.8700 |
DSSW* = Ten times diluted synthetic seawater.
Table 3.
Characteristics of the core plugs used in this work.
| Core | L | D | phi, Φ | kg | kb | PV | Swc | Soi |
|---|---|---|---|---|---|---|---|---|
| mm | mm | % | mD | mD | ml | % | % | |
| Bent 5.1 | 60.10 | 29.55 | 23.33 | 2510 | 1684 | 9.61 | 18.15 | 81.85 |
| Bent 5.2 | 59.95 | 29.55 | 23.69 | 2714 | 1964 | 9.74 | 24.60 | 75.40 |
| Bent 5.3 | 60.10 | 29.50 | 23.54 | 2835 | 1976 | 9.67 | 24.60 | 75.40 |
| Bent 5.4 | 60.00 | 29.55 | 24.10 | 2848 | 1608 | 9.91 | 20.60 | 79.40 |
| Bent 5.5 | 60.05 | 29.55 | 24.10 | 3029 | 2114 | 9.92 | 20.70 | 79.30 |
| Mean | 60.04 | 29.54 | 23.75 | 2787 | 1869 | 9.77 | 21.73 | 78.27 |
Phi, Φ = Porosity, Kg = Permeability to gas, Kb = Permeability to brine, PV = Pore volume, Swc = Connate water saturation, and Soi = Initial oil saturation.
Table 4.
Implemented sequence/workflow to perform the core flooding experiments.
| No. | Core | Secondary | Bump-Rate | Tertiary | Quaternary |
|---|---|---|---|---|---|
| 1 | Bent 5.1 | Polymer-DSSW | - | DSSWF | |
| 2 | Bent 5.2 | DSSWF | Bump-Rate | Polymer-DSSW | |
| 3 | Bent 5.3 | SWF | Bump-Rate | Polymer-SW | |
| 4 | Bent 5.4 | SSW | Bump-Rate | DSSWF | Polymer-DSSW |
| 5 | Bent 5.5 | SSW | Bump-Rate | SWF | Polymer-SW |
| Q (mL/min) | 0.10 | 0.33 | 0.15 | 0.15 | |
| Q (ft/day) | 1 | 3.3 | 1.5 | 1.5 | |
Table 5.
Summary and comparison of core flood recoveries and flooding processes.
| Experimental Description | Name | Φ (%) | PV (cm3) | k, Brine (md) | k, gas (md) | Soi (%) | Swc (%) | Additional RF (OIIP) (%) | Total RF (OIIP) EOR (%) | |
|---|---|---|---|---|---|---|---|---|---|---|
| Secondary Mode 45 °C | ||||||||||
| 1 | Polymer-DSSW | Bent 5.1 | 23.33 | 9.61 | 1684 | 2510 | 81.85 | 18.15 | - | 40.85 |
| 2 | DSSWF | Bent 5.2 | 23.69 | 9.74 | 1964 | 2714 | 75.40 | 24.60 | - | 36.90 |
| 3 | SWF | Bent 5.3 | 23.54 | 9.67 | 1976 | 2835 | 75.40 | 24.60 | - | 37.87 |
| 4 | SSW | Bent 5.4 | 24.10 | 9.91 | 1608 | 2848 | 79.40 | 20.60 | - | 32.22 |
| 5 | SSW | Bent 5.5 | 24.10 | 9.92 | 2114 | 3029 | 79.30 | 20.70 | - | 35.27 |
| Tertiary Mode 45 °C | ||||||||||
| 1 | DSSWF | Bent 5.1 | 23.33 | 9.61 | 1684 | 2510 | 81.85 | 18.15 | 0 | 40.85 |
| 2 | Polymer-DSSW | Bent 5.2 | 23.69 | 9.74 | 1964 | 2714 | 75.40 | 24.60 | 6.90 | 43.80 |
| 3 | Polymer-SW | Bent 5.3 | 23.54 | 9.67 | 1976 | 2835 | 75.40 | 24.60 | 9.60 | 47.47 |
| 4 | DSSWF | Bent 5.4 | 24.10 | 9.91 | 1608 | 2848 | 79.40 | 20.60 | 2.50 | 34.72 |
| 5 | SWF | Bent 5.5 | 24.10 | 9.92 | 2114 | 3029 | 79.30 | 20.70 | 5.00 | 40.27 |
| Post-tertiary (Quaternary) Mode 45 °C | ||||||||||
| 4 | Polymer-DSSW | Bent 5.4 | 24.10 | 9.91 | 1608 | 2848 | 79.40 | 20.60 | 6.30 | 41.02 |
| 5 | Polymer-SW | Bent 5.5 | 24.10 | 9.92 | 2114 | 3029 | 79.30 | 20.70 | 6.40 | 46.67 |
RF = Recovery factor, OIIP = Oil initial in place.
© 2020 by the authors. Licensee MDPI, Basel, Switzerland. This article is an open access article distributed under the terms and conditions of the Creative Commons Attribution (CC BY) license (http://creativecommons.org/licenses/by/4.0/).
Share and Cite
MDPI and ACS Style
Tahir, M.; Hincapie, R.E.; Ganzer, L. Influence of Sulfate Ions on the Combined Application of Modified Water and Polymer Flooding—Rheology and Oil Recovery. Energies 2020, 13, 2356. https://0-doi-org.brum.beds.ac.uk/10.3390/en13092356
AMA Style
Tahir M, Hincapie RE, Ganzer L. Influence of Sulfate Ions on the Combined Application of Modified Water and Polymer Flooding—Rheology and Oil Recovery. Energies. 2020; 13(9):2356. https://0-doi-org.brum.beds.ac.uk/10.3390/en13092356
Chicago/Turabian StyleTahir, Muhammad, Rafael E. Hincapie, and Leonhard Ganzer. 2020. "Influence of Sulfate Ions on the Combined Application of Modified Water and Polymer Flooding—Rheology and Oil Recovery" Energies 13, no. 9: 2356. https://0-doi-org.brum.beds.ac.uk/10.3390/en13092356
Note that from the first issue of 2016, this journal uses article numbers instead of page numbers. See further details here.