
Development of a Flexible Framework Multi-Design Optimization Scheme for a Hand Launched Fuel Cell-Powered UAV


Department of Mechanical Engineering, American University of Sharjah, Sharjah 26666, United Arab Emirates
*
Author to whom correspondence should be addressed.
Energies 2021, 14(10), 2951; https://0-doi-org.brum.beds.ac.uk/10.3390/en14102951
Submission received: 5 March 2021
/
Revised: 2 May 2021
/
Accepted: 10 May 2021
/
Published: 20 May 2021
(This article belongs to the Special Issue Design, Modeling, and Optimization of Novel Fuel Cell Systems)
Abstract
:This paper presents different methods for the design of a hand-launchable, fixed wing, fuel cell-powered unmanned aerial vehicle (UAV) to maximize flight endurance during steady level flight missions. The proposed design methods include the development of physical models for different propulsion system components. The performance characteristics of the aircraft are modeled through empirical contributing analyses in which each analysis corresponds to an aircraft subsystem. The contributing analyses are collected to form a design structure matrix which is included into a multi-disciplinary analysis to solve for the design variables over a defined design space. The optimal solution is found using a comprehensive optimization tool developed for long endurance flight missions. Optimization results showed a significant improvement in UAV flight endurance that reached up to 475 min with take-off ratio equals to 59 min/kg. Wind tunnel and bench-top tests and HiL simulation tests are performed to validate the results obtained from the optimization tools. Validated optimization results showed an increase of the overall UAV flight endurance by 19.4% compared to classical approaches in design methods.
1. Introduction
The UAV and fuel cell industries are seeking to enhance the capability and performance of miniature unmanned aerial vehicles (MUAVs) powered by fuel cells as propulsion systems [1,2,3]. MUAVs are primarily used for surveillance, target engagement and tracking missions [4]. Such missions require the MUAV to possess long endurance performance characteristics capable of maximizing the UAV flight time [5]. Hence, there will be more fuel and a larger UAV propulsion system size in terms of engines, fuel storage and other components. Similarly, electric propulsion systems that utilize batteries as the main power source also require more batteries to increase the endurance of the UAV, and hence, increase UAV weight. This leads to an increase in UAV size and thus more drag force. At a certain point, the UAV will reach a threshold in which adding more fuel or batteries will increase the total weight and size, and in turn, will decrease the endurance. Moreover, such a solution is not effective, as it will increase both the initial and the running costs. Second, there is a need for new power sources that lower the dependence on fossil fuel and achieves more sustainability. Third, an environmentally friendly power source such as solar cells or fuel cells will be considered as a better alternative to internal combustion engines [6,7].
Hand launched unmanned aerial vehicles are considered to be a good choice for small scale UAVs designed for long endurance flight missions as they have many advantages over other types of MUAVs [8,9,10]. First, hand launched UAVs do not require runways or mechanical launching aids. Second, they require less training and less setup time. Third, they can have longer endurance because they require less power for take-off during flight missions. Figure 1 shows a sample of the most popular MUAVs in which endurance versus take-off mass is shown. It can be concluded from Figure 1 that more endurance requires more take-off mass. Improving MUAVs performance characteristics requires a combination of reducing the take-off mass and increasing the flight duration.
Deployment of PEMFC hand launched UAVs emerges some challenges that can lead to better performance characteristics. There is a contradiction between the takeoff mass requirements and long endurance flight missions which results in high take-off/endurance ratio such as in [11,12]. Increasing the endurance means increasing the energy storage. Increasing the energy storage results in the increase of the takeoff mass. However, the takeoff mass is limited to the ability of the user. There is a need for a well-developed flexible optimization scheme to give the optimal solution among the tradeoff between flight endurance and takeoff mass.
Most MUAVs shown in Figure 1 use batteries as the main power supply [13,14]. PEM fuel cells have proposed a very good solution due their high energy densities that can reach up to five times compared to lithium ion batteries [15,16]. Talking about PEM fuel cell includes the study and analysis of fuel cell subsystems as well. PEMFC is a very sensitive and costly device that should be analyzed correctly. PEMFC models still need further validation and analysis when integrated in MUAV propulsion systems because they tend to show difficulties with temperature change and transient response [17,18,19,20].
A high-level conceptual design study of small-scale long-endurance aircraft was performed in [20]. It was found that fuel cell model that depends on polarization curve resulted in accurate fuel cell voltage and current predictions. Lindhal and his team introduced a mathematical derivation, simulation and validation of a simple propulsion system for UAV at steady state conditions [13]. The propulsion system components used were a solid oxide fuel cell (SOFC) as the power source, motor controller, brushless motor and propeller. The results validation showed a good agreement between simulation and wind tunnel test results. A team from Colorado State University succeeded in designing, building and flying a fuel cell powered UAV [11]. The goal of the study was to achieve 24 h endurance. The team was able to achieve up to 28 h of flight but the aircraft had a high take-off/endurance ratio. Wagner et al. in [14] have developed an in-depth mathematical formulation for a hand launched UAV to achieve long endurance. The optimization technique used to solve the DSM was a genetic algorithm. Results showed that a notable improvement of the UAV endurance from 2 h to almost 6 h. However, the main power source was a lithium polymer battery and not a fuel cell. Moreover, a basic fuel cell powered UAV was carried by a team from Sydney University [17]. It included a preliminary design with a demonstrator to validate the UAV performance. The work included a good aerodynamic modeling. However, fuel cell system model was poor because the reference presented only the rate of hydrogen consumption of the PEMFC without further investigation. Furrutter et al. designed a small PEM fuel cell powered UAV. The fuel cell was used in the steady flight condition and it had a power supply of 100 W. Mathematical formulation and derivation was presented in [18] with the achievement of total endurance of 150 s and the designed UAV showed a high drag force. Lapena Rey et al. in [19] succeeded to achieve a 4 h theoretical endurance for 200 W PEM fuel cell powered UAV. The team used a hydrogen generator kit as a fuel source. The MUAV succeeded to fly for 130 min and the hydrogen generator faced thermal activity that limited the UAV flight endurance. Another fuel cell powered UAV was introduced in [12] using a 550 W PEM fuel cell integrated with Li-Po battery. A qualitative and quantitative analysis for hydrogen storage tank was implemented. Thermal management that depended on a fin-and-tube radiator with an external fan was designed instead of having traditional radiators that would have a high surface area. The UAV succeeded to fly for 23 h and 19 min with the achievement of specific energy of 1170 Wh/kg.
This paper presents the design, development and validation of a flexible optimization scheme that can be used in the design of any PEMFC powered UAV of a small scale with validated design results. The major contributions of this research concentrate on the integration of PEMFC and its components into the optimization scheme. This in term includes hydrogen subsystem and oxygen subsystem. In addition, the integration of the wing/tail design/selection into the optimization scheme are considered in the analysis. The paper also developed a flexible selection scheme that can be utilized by other interested researches in the field. This scheme composed of hundreds of commercial off-the-shelf components that includes propellers, motors, hydrogen tanks and PEMFCs in which the selected components in the optimization will produce the optimum flight endurance. The results are validated through both wind tunnel tests and the development of a novelty method of the HiL simulation tests. The new developed MDO can be successfully implemented by other researches and be used in MATLAB optimization toolbox easily.
To meet this paper objectives, the paper is organized as follows: Section 2 describes the technical approach. Section 3 includes the UAV conceptual design which defines the UAV baseline configuration. Section 4 includes the preliminary UAV design which includes the development of the multi-disciplinary design analysis (optimization of inner loop modeling). Section 5 includes the detail design which includes the development of the multi-disciplinary design optimization (optimization of outer loop modeling). Section 6 includes the results of the analysis and the validation of results through wind-tunnel tests and hardware in the loop simulation tests.
2. Technical Approach
The design process is divided into three main parts; UAV conceptual design level, UAV preliminary design level and then a detail design level. In the UAV conceptual design level, the design requirements and constraints are specified. After that, the design space exploration process defines a number of alternatives through a matrix of alternatives that meets the design requirements. Then, the base line aircraft configuration is analyzed through a qualitative and quantitative study for the matrix of alternatives. Based on that, design variables and design matrices are defined.
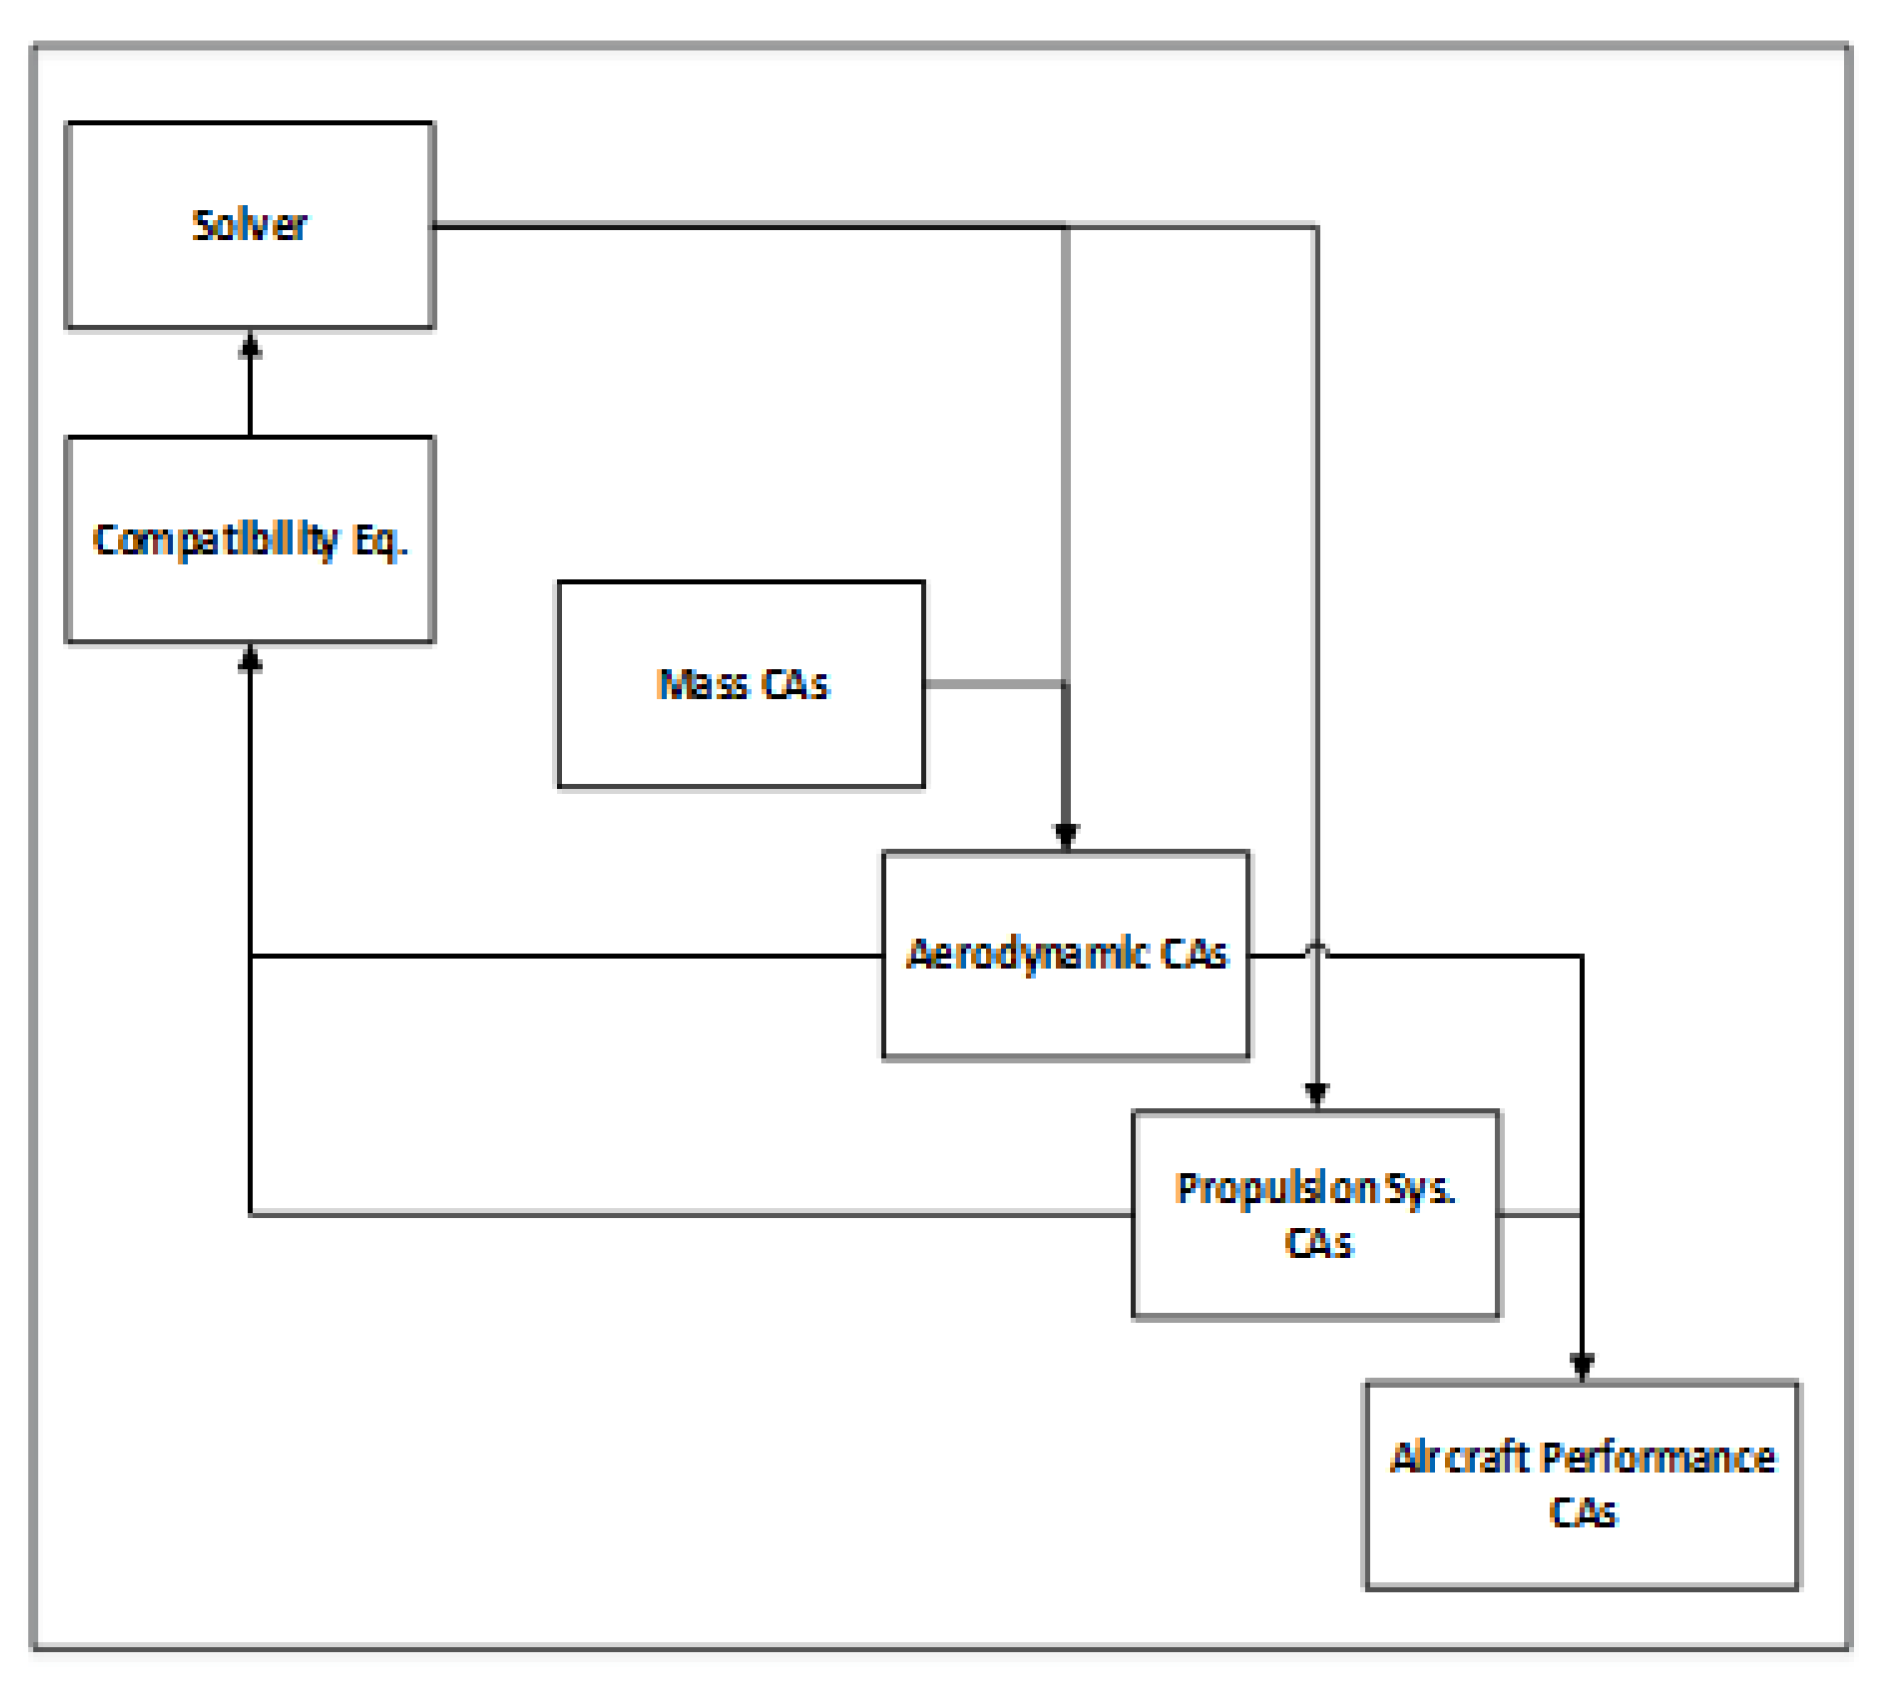
Aircraft design consists of subsystems which are described as multi-disciplinary complex systems by nature such as fuel cell and propeller subsystems. This requires simplifications and decomposition schemes to provide a well-structured method for analyzing the MDA which are done in the preliminary design stage. Figure 2 illustrates the process of obtaining a logical MDA for aircraft design. First, different design variables and objectives should be defined. These design variables are modeled in their contribution analyses. A design structure matrix is needed for managing the flow of information among different contributing analyses. DSM should be fitted into MDA framework solution scheme that guarantees that all design objectives are met. MDA flexible framework includes compatibility equations and nonlinear solvers. So, the preliminary design level allows for in depth analysis for the baseline UAV defined in the conceptual design. In addition, all powertrain components are modeled in this stage.
The detail design part main objective is to optimize the different propulsion system components and design variables to the given PEM fuel cell and fuselage including the total aircraft mass. In this stage, all components’ models are defined but the components themselves are not selected yet because there are many commercial off-the-shelf components that are visualized in the optimization space. As a result, an optimization scheme is developed in this part to select the components of the powertrain and wing geometry and obtain all their design variables that will result in the optimum aircraft endurance. The optimization scheme best described as “mixed discrete continuous” because the solution is structured based on DSM rather than a close form mathematical model for the objective function. Genetic algorithm stands to be one among the best solution methodologies for such optimization scheme. In addition, results comparison and validation through conducting wind tunnel test and hardware in the simulation (HiL) tests are carried on in this section.
The UAV conceptual design task is to define a baseline aircraft configuration through defining a design space and defining an initial UAV structural design.
2.1. Design Space Definition
The aircraft is a hand-launched UAV which is considered to be a small scale aircraft with maximum take-off weight equals to 85 N. This weight is considered to guarantee hand-launchability. In addition, design requirements are necessary to satisfy the UAV to fly at low altitude and low cruising speed of 200 m and 20 m/s, respectively. This flight speed ensures that the Reynolds number will stay in the laminar region.
A quantitative study of the market was achieved to select the fuel cells that can be integrated with the UAV. Three fuel cells of interest were found; 200 W, 400 W Aeropack Horizon fuel cells and 500 W Ion Tiger fuel cell. Since the design is for long endurance flight mission, it was decided to choose the 200 W fuel cell as the total aircraft weight will not exceed 85 N. Hence, the design of the UAV should have a high aerodynamic efficiency, low drag, low pitching moment and ease of manufacturing. Based on these design requirements, a matrix of alternatives is built to down select the conceptual aircraft design attributes as shown in Table 1. Based on quantitative and qualitative calculations and statistics as well as previous aircraft projects, the final conceptual design was selected from hundreds of possible combinations from the matrix of alternatives.
The selected vehicle configuration is conventional which is used widely for small scale UAVs due its proper gripping surface. Aircraft mass will vary during the optimization process based on the selection process of different propulsion system components and wing airfoil. As a result, canard vehicle configuration was not selected due sensitivity to weight changes and weight distribution. While flying wing selection contradicts with the hand launchability design requirement.
For better stability and control of the aircraft, tapered planform with conventional tail was selected. For the wing type, a high wing was selected based on historical data of hand launched fixed wing aircrafts and taking into consideration ease of hand-launchability. In addition, the wing is placed in a way that the aircraft center of gravity is below the wing neutral point, as this will cause an opposing moment due any pitch disturbance.
In addition, a high aspect ratio equals initially to 10 was selected because of high aerodynamic efficiency design requirement criteria. Fuselage shape was cylindrical as it’s easier to manufacture taking into consideration propulsion system components’ sizes. The landing gear selection resulted in a simple retractable landing gear. Finally, a tractor propeller position was selected for lower drag and pitching moment.
Chemical hydride technology was not feasible in the selection of hydrogen storage because it has a high cost and it needs a continuous maintenance and change of its special catalyst. Carbon fiber showed better weight specifications than aluminum composites tanks. As a result, it was decided to use carbon fiber material in the hydrogen storage tank design process.
Aircraft structural material is composed mainly of carbon fiber due its high strength and stress specifications with lightweight specifications compared to other composites. The wing tubes are made of carbon fiber sandwiched structure with balsa wood due its softness specifications.
2.2. Initial Aircraft Structural Design Sizing
The total lift and drag coefficients are obtained by defining the cruise speed and maximum weight. Then, fuselage is designed taking into consideration different components’ sizes.
A parametric study was conducted to set initial values for the coefficient of lift, wing surface area and UAV total weight assuming an altitude of 1000 m as shown in Figure 3 using integrated Lift equation. The parametric study resulted in air cruise speed equals to 17.8 m/s, which is close to the design requirement. The coefficient of lift is set equal to 0.4, wing surface area equals to 0.9 m2 and UAV weight equals to 75 N. Even though lower cruise speed is possible, it will lead to higher coefficient of lift, which is considered less practical and harder to achieve. While using the integrated Drag equation and knowing that maximum power available is 200 W, another parametric study was conducted to specify the maximum coefficient of drag. The value resulted is CDmax = 0.067.
Total drag coefficient is composed of induced drag and parasitic drag covered by the following equations:
where is total coefficient of lift, represents Oswald efficiency factor ranges from 0.85 to 0.95 depending on how much elliptic the shape is [21]. Parasitic drag is drag generated from other non-lifting parts such as fuselage. Hence, total drag coefficient is:
Based on the selected values of the aspect ratio and UAV weight and wing surface area, the wing geometry design specifications are shown in Table 2. For vertical and horizontal wings, sizing is based on coefficient of vertical and horizontal wings covered by the following equations and results summarized in Table 3. Finally, cylindrical streamlined fuselage shape is designed with specifications shown in Table 4.
3. UAV Preliminary Design
The preliminary design task is to develop a multi-disciplinary analysis scheme that allows better analyzing and designing of UAV powertrain and aerodynamics by decomposing the design into smaller subsystems called contributing analyses. Components’ models are developed under steady state conditions because dynamic response occurs for a small period of time that will have a negligible effect on total endurance.
3.1. Powertrain Contributing Analyses
The powertrain system is decomposed into six CA’s: hydrogen tank CA, PEM fuel cell and its subsystems CA, propeller CA, motor CA, and UAV performance analysis.
3.1.1. Hydrogen Tank Contributing Analysis
Hydrogen is stored in a composite fully wrapped pressure vessel, carbon fiber cylinder. The hydrogen tank shape and configuration depends on several criteria such as fuselage and type of tank [22]. The final shape is a cylindrical geometry with hemispherical end caps. The cylinder thickness of the overwrap should be enough to resist both the axial stress and the hoop stress that are caused by the pressure load. The total cylinder thickness can be obtained from the following relation [23,24]:
and the total tank mass is obtained as:
where is linear load sharing factor of safety to yield, is tank mounting/bosses/tubing mass fraction, is hydrogen tank liner mass, is hydrogen tank composite overwrap mass, is the hydrogen mass, mreg regulator mass, r is the cylinder radius. The volume (V) required by this amount of hydrogen stored at a pressure (P) is calculated using the Redlich-Kwong relation [25].
3.1.2. PEMFC Contributing Analysis
The fuel cell model consists of three main parts; fuel cell output voltage, fuel cell hydrogen consumption and fuel cell oxygen consumption. PEMFC output voltage is represented by its polarization curve obtained experimentally by connecting the PEMFC to the load directly and operated until it reaches its full output power [26] as shown in Figure 4. Hydrogen consumption can be calculated from Faraday’s law [27]:
where UH2 is the hydrogen utilization factor. It is defined as the ratio between the fuel flow that reacts and the input fuel flow. The typical value used is ranged from 0.8 to 0.9 [28]. Also, the fuel, oxidant and water generated output should be taken into consideration. Oxygen consumption can be calculated from Faraday’s law as well:
where UO2 is the oxidant utilization factor which is defined as the ratio between the oxidant flow that reacts and the input air flow rate. The typical value used is 0.21.
3.1.3. Air Supply Subsystem
Air will be supplied for both cooling and oxygen reactant supply. 2 axial DC fans are used to supply air from atmosphere to the fuel cell system. The reason behind using double fans instead of a single fan is mainly because of sizing issues. In addition, two fans will allow for better distribution of air through the fuel cell which results in better utilization factor and better cooling. The power needed is considered as a loss or parasitic load [27] as follows:
where , .
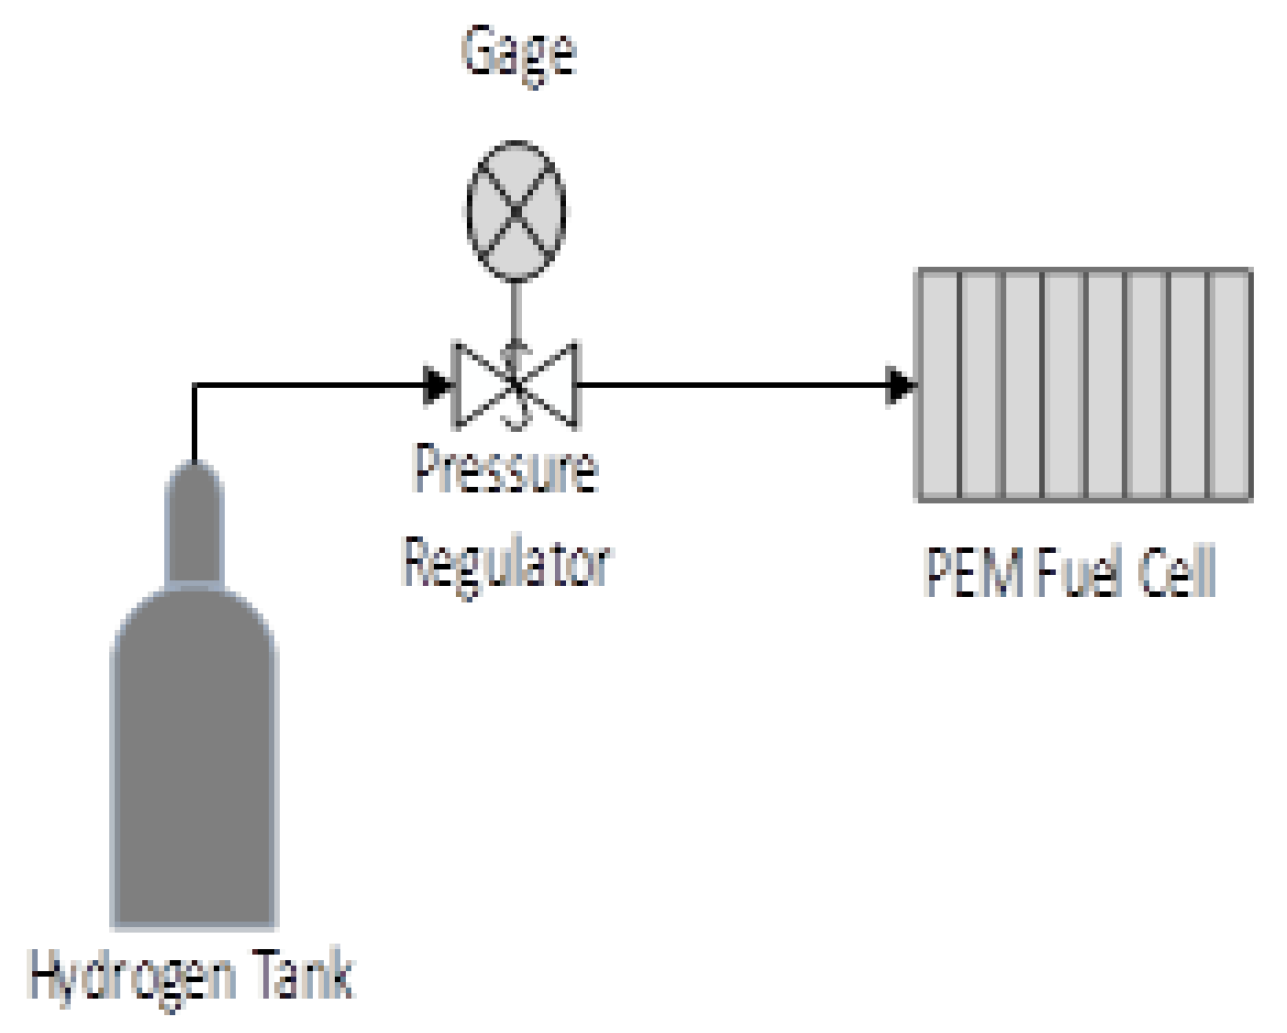
3.1.4. Hydrogen Supply Subsystem
For hydrogen supply subsystem, the dead-end mode technique is used for connecting the hydrogen supply to the stack as shown in Figure 5. This technique is considered as the simplest mode of connecting the hydrogen supply to the stack especially in the case of a simple small low temperature PEM stack [28]. In dead-end mode, one or more pressure regulators are connected between the pressure supply and the stack to lower the hydrogen supplied pressure to the required operating point.
3.1.5. Electric Motor Contributing Analysis
A brushless direct current electric motor (BLDC) will be used because it has higher efficiency than brushed DC electric motors. BLDC motor model treats the motor subsystem as steady state with assumption that the controller has the ability to state the position of the rotor [29]. Hence, an equivalent motor circuit with conventional lumped parameter is used where motor voltage and torque are obtained as follows [30,31]:
where is the BLDC resistance per winding appearing with a factor of two due two windings for each commutating sequence, is the motor speed constant, is motor drag coefficient and is the torque of electric origin. Equations (10) and (11) can be converted to “no load” terms of current I0 and voltageV0 data usually supplied by manufacturers by calculating a drag coefficient.
Taking into consideration the speed controller losses, motor output voltage and current are covered by the following equations [32]:
where represents the speed controller duty cycle, is the speed controller output current and is the speed controller output voltage. is the speed controller efficiency and is the speed controller internal resistance.
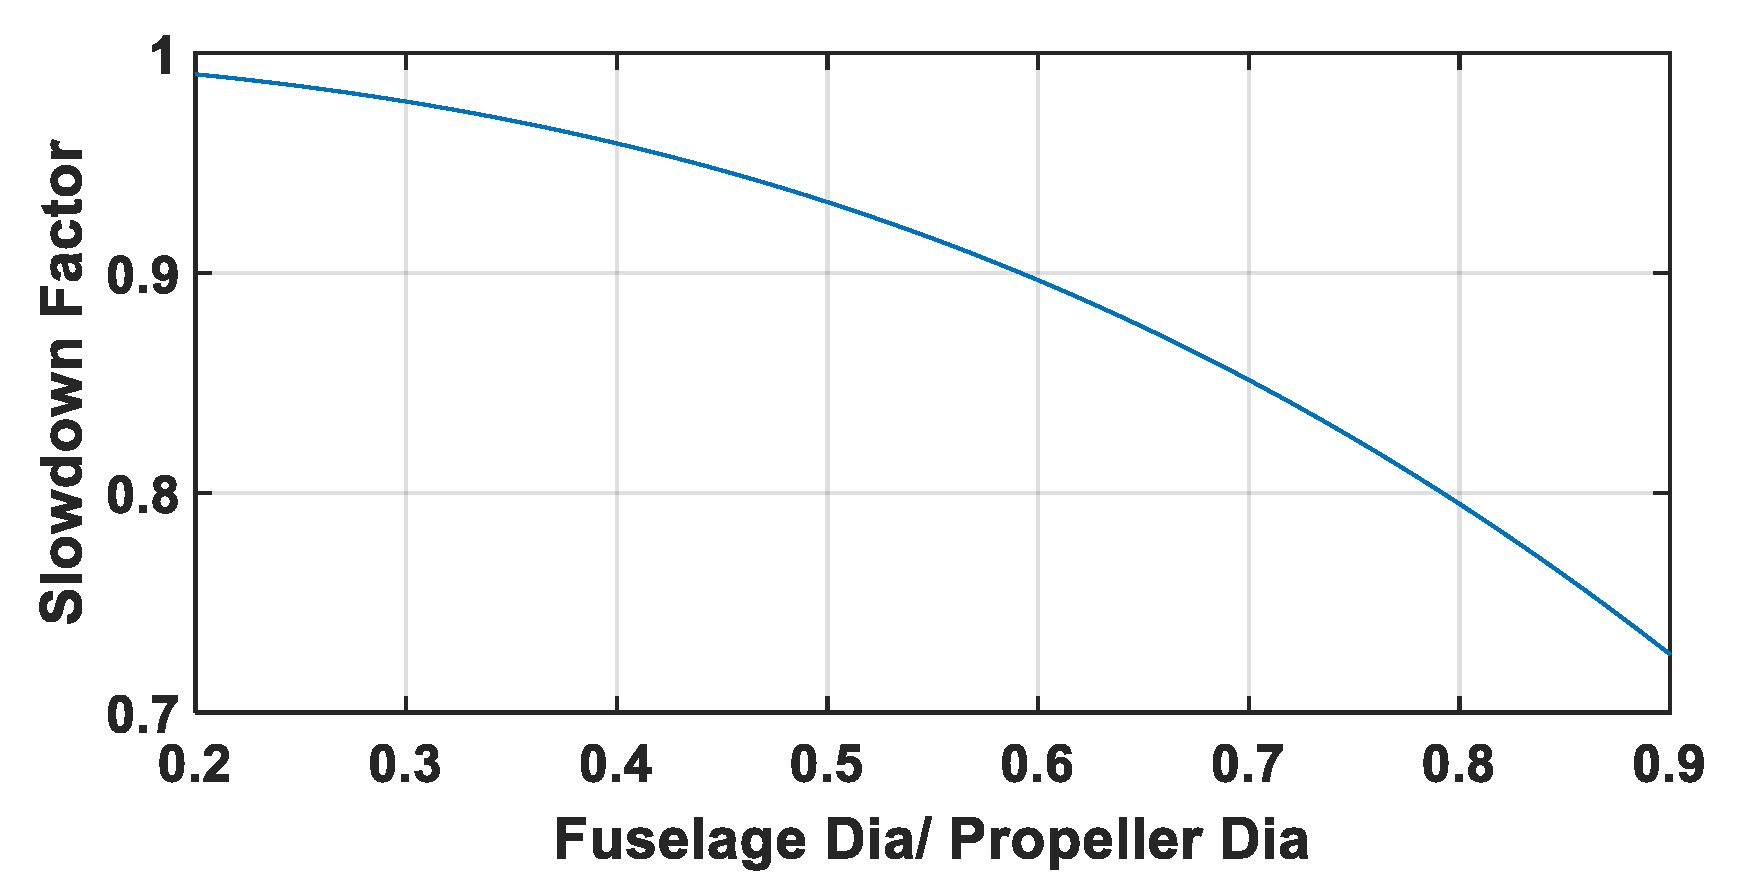
3.1.6. Propeller Contributing Analysis
Propeller model is based on the non-dimensional coefficients defined by the vortex theory [33,34]. To calculate for the propeller- fuselage interference, a corrected factor is used that is derived based on experimental data done by Lowry in [35,36] as follows (Figure 6):
where is the fuselage diameter and dp is the propeller diameter.
3.1.7. Performance Contributing Analysis
Performance contributing analysis calculates the propeller efficiency, motor efficiency, fuel cell efficiency and endurance of the aircraft as follows:
3.2. UAV Airframe and Aerodynamics Contributing Analyses
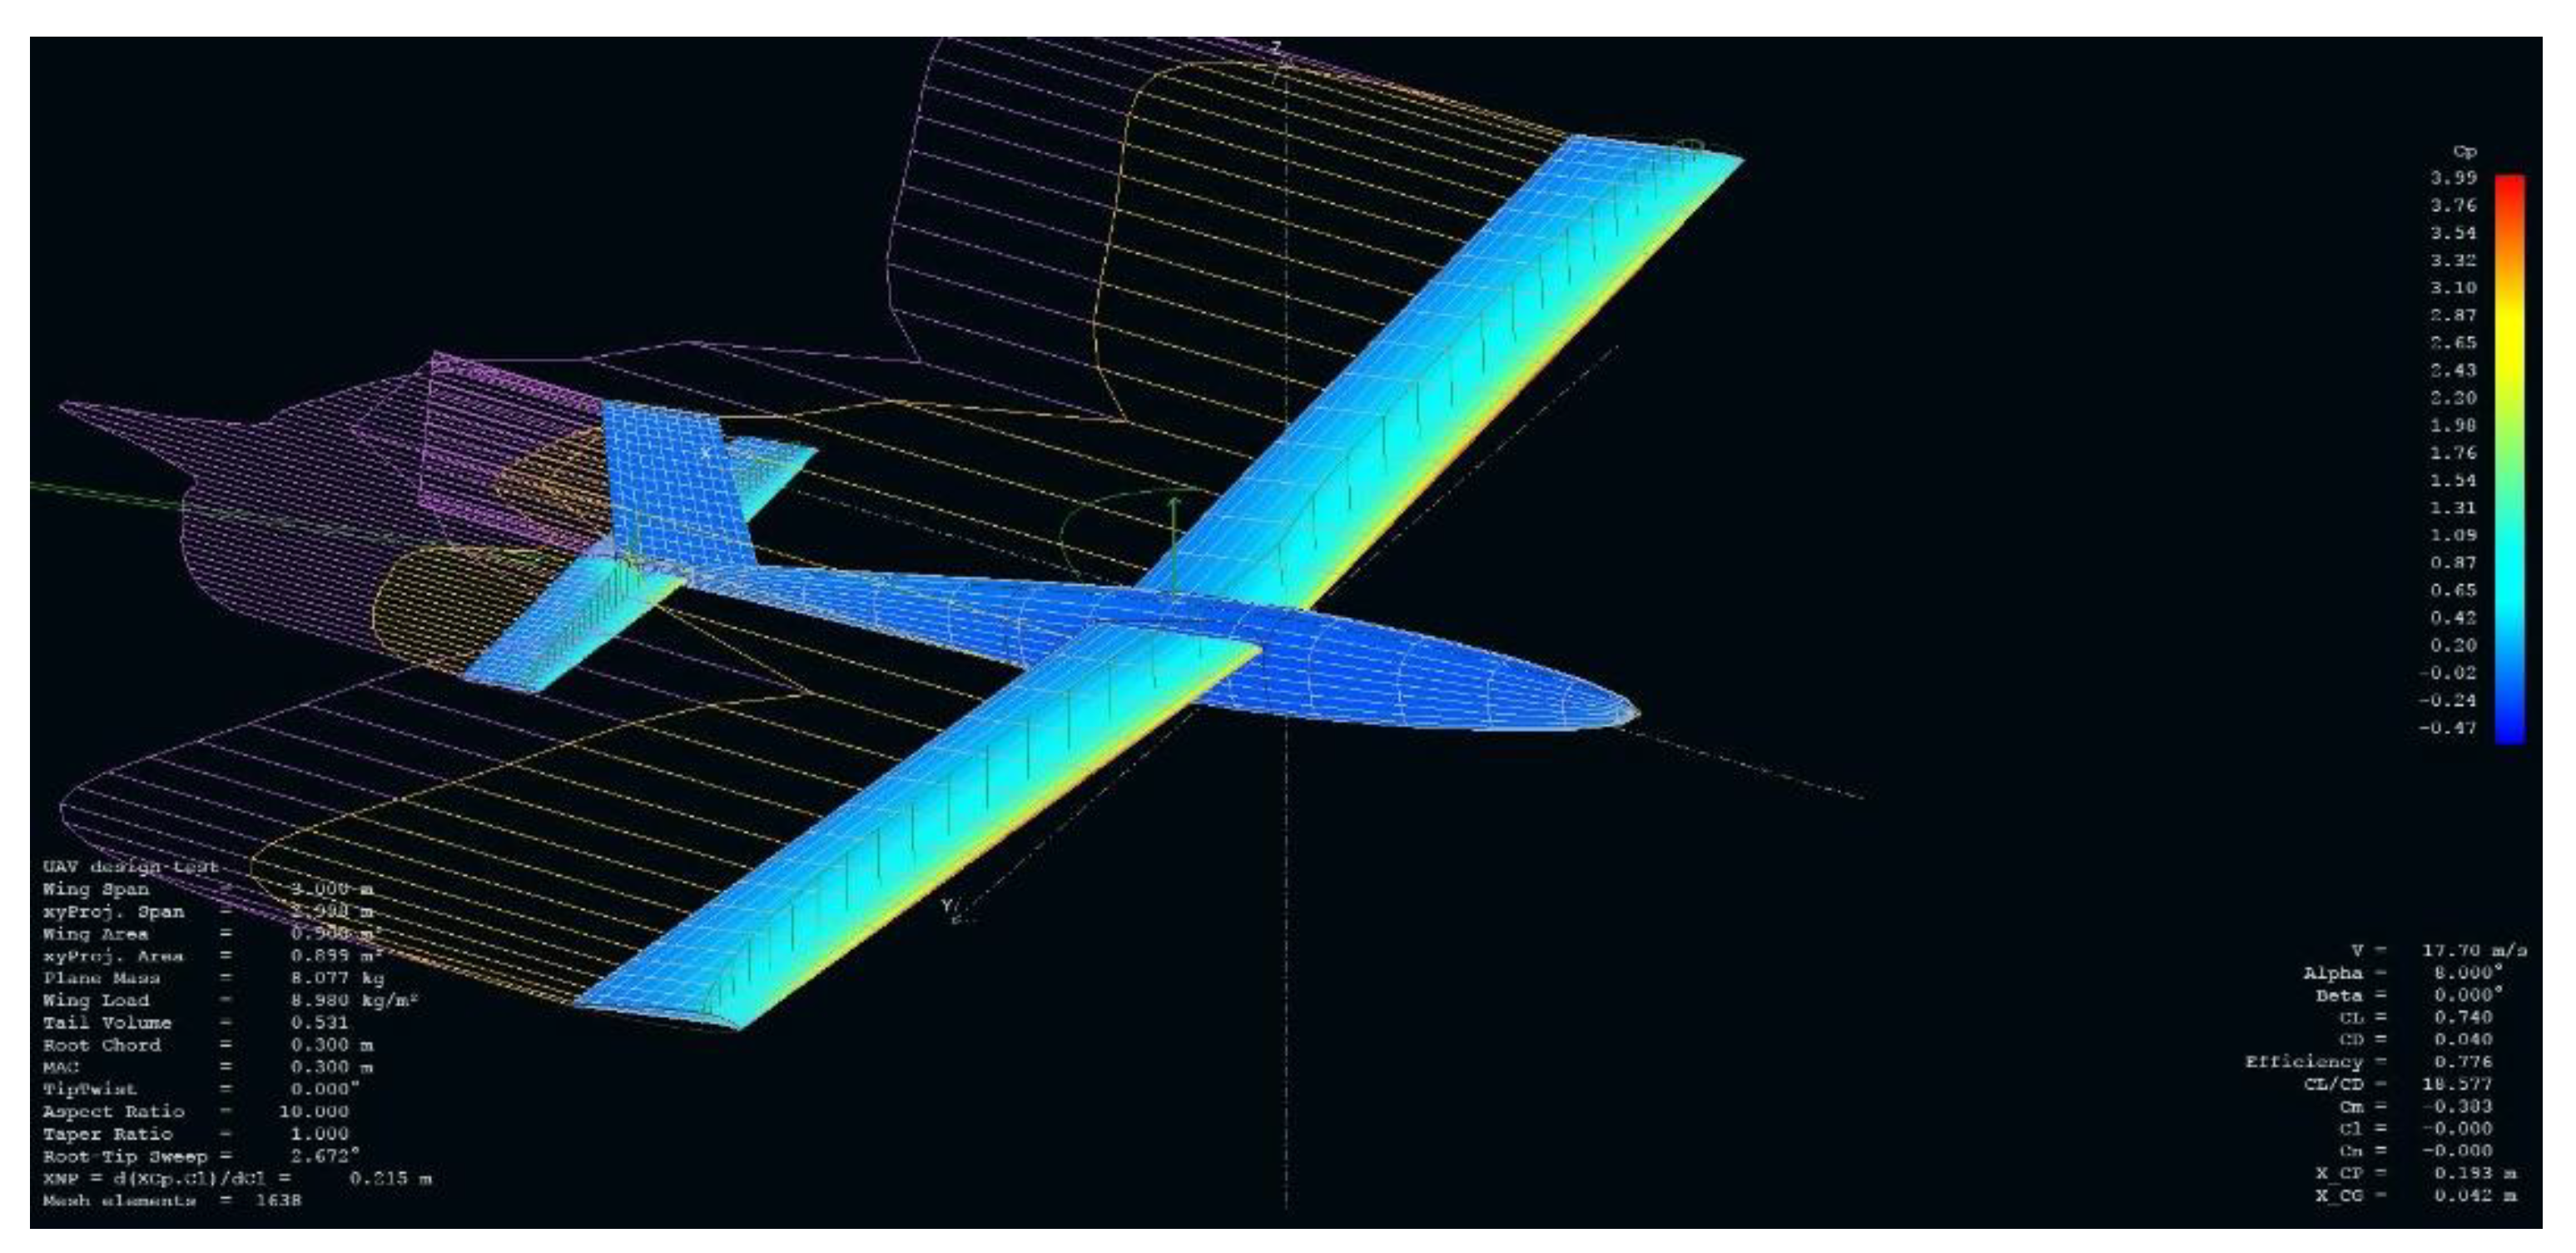
3.2.1. UAV Simulation Model
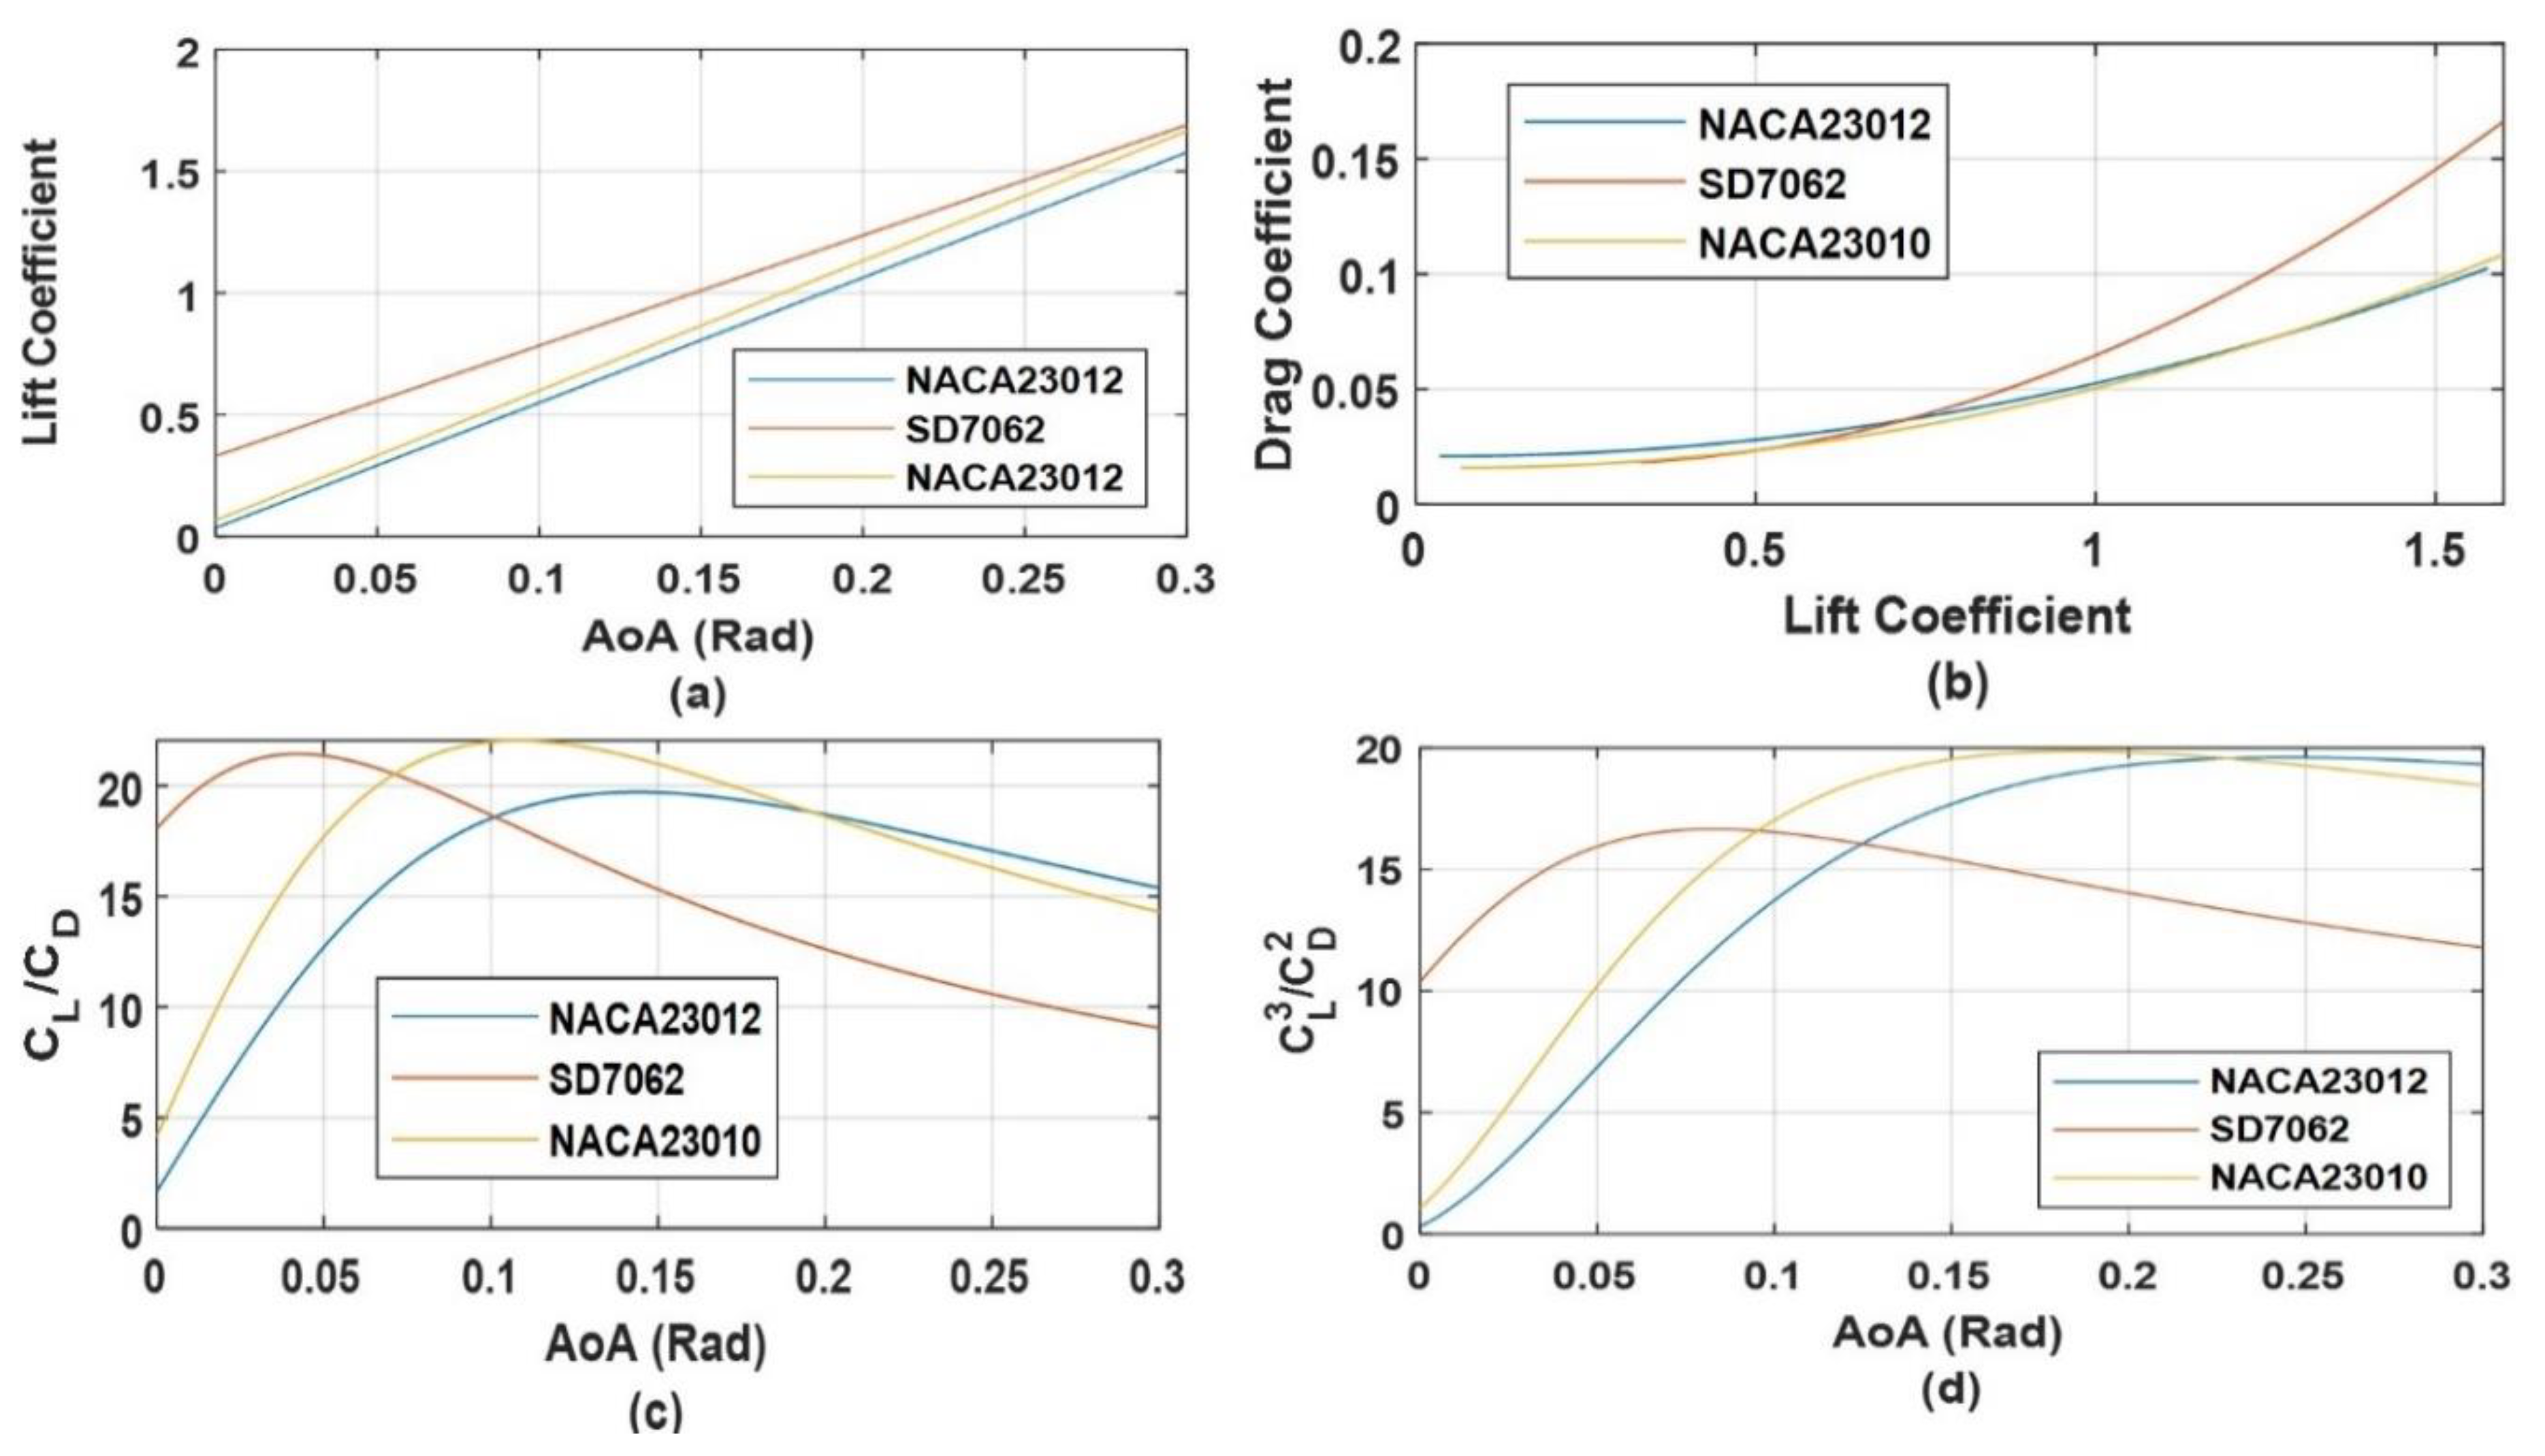
The aerodynamic simulation for the proposed aircraft was done using XFLR5 for a range of angle of attacks at a fixed Reynold number of 400,000 as shown in Figure 7. The resulted relations of the coefficients of lift and drag at an angle of for three low speed airfoils; NACA23010, SD7062, NACA 23012 are as follows:
Figure 8 represents a parametric analysis of the effect of changing the angle of attack on UAV performance characteristics.
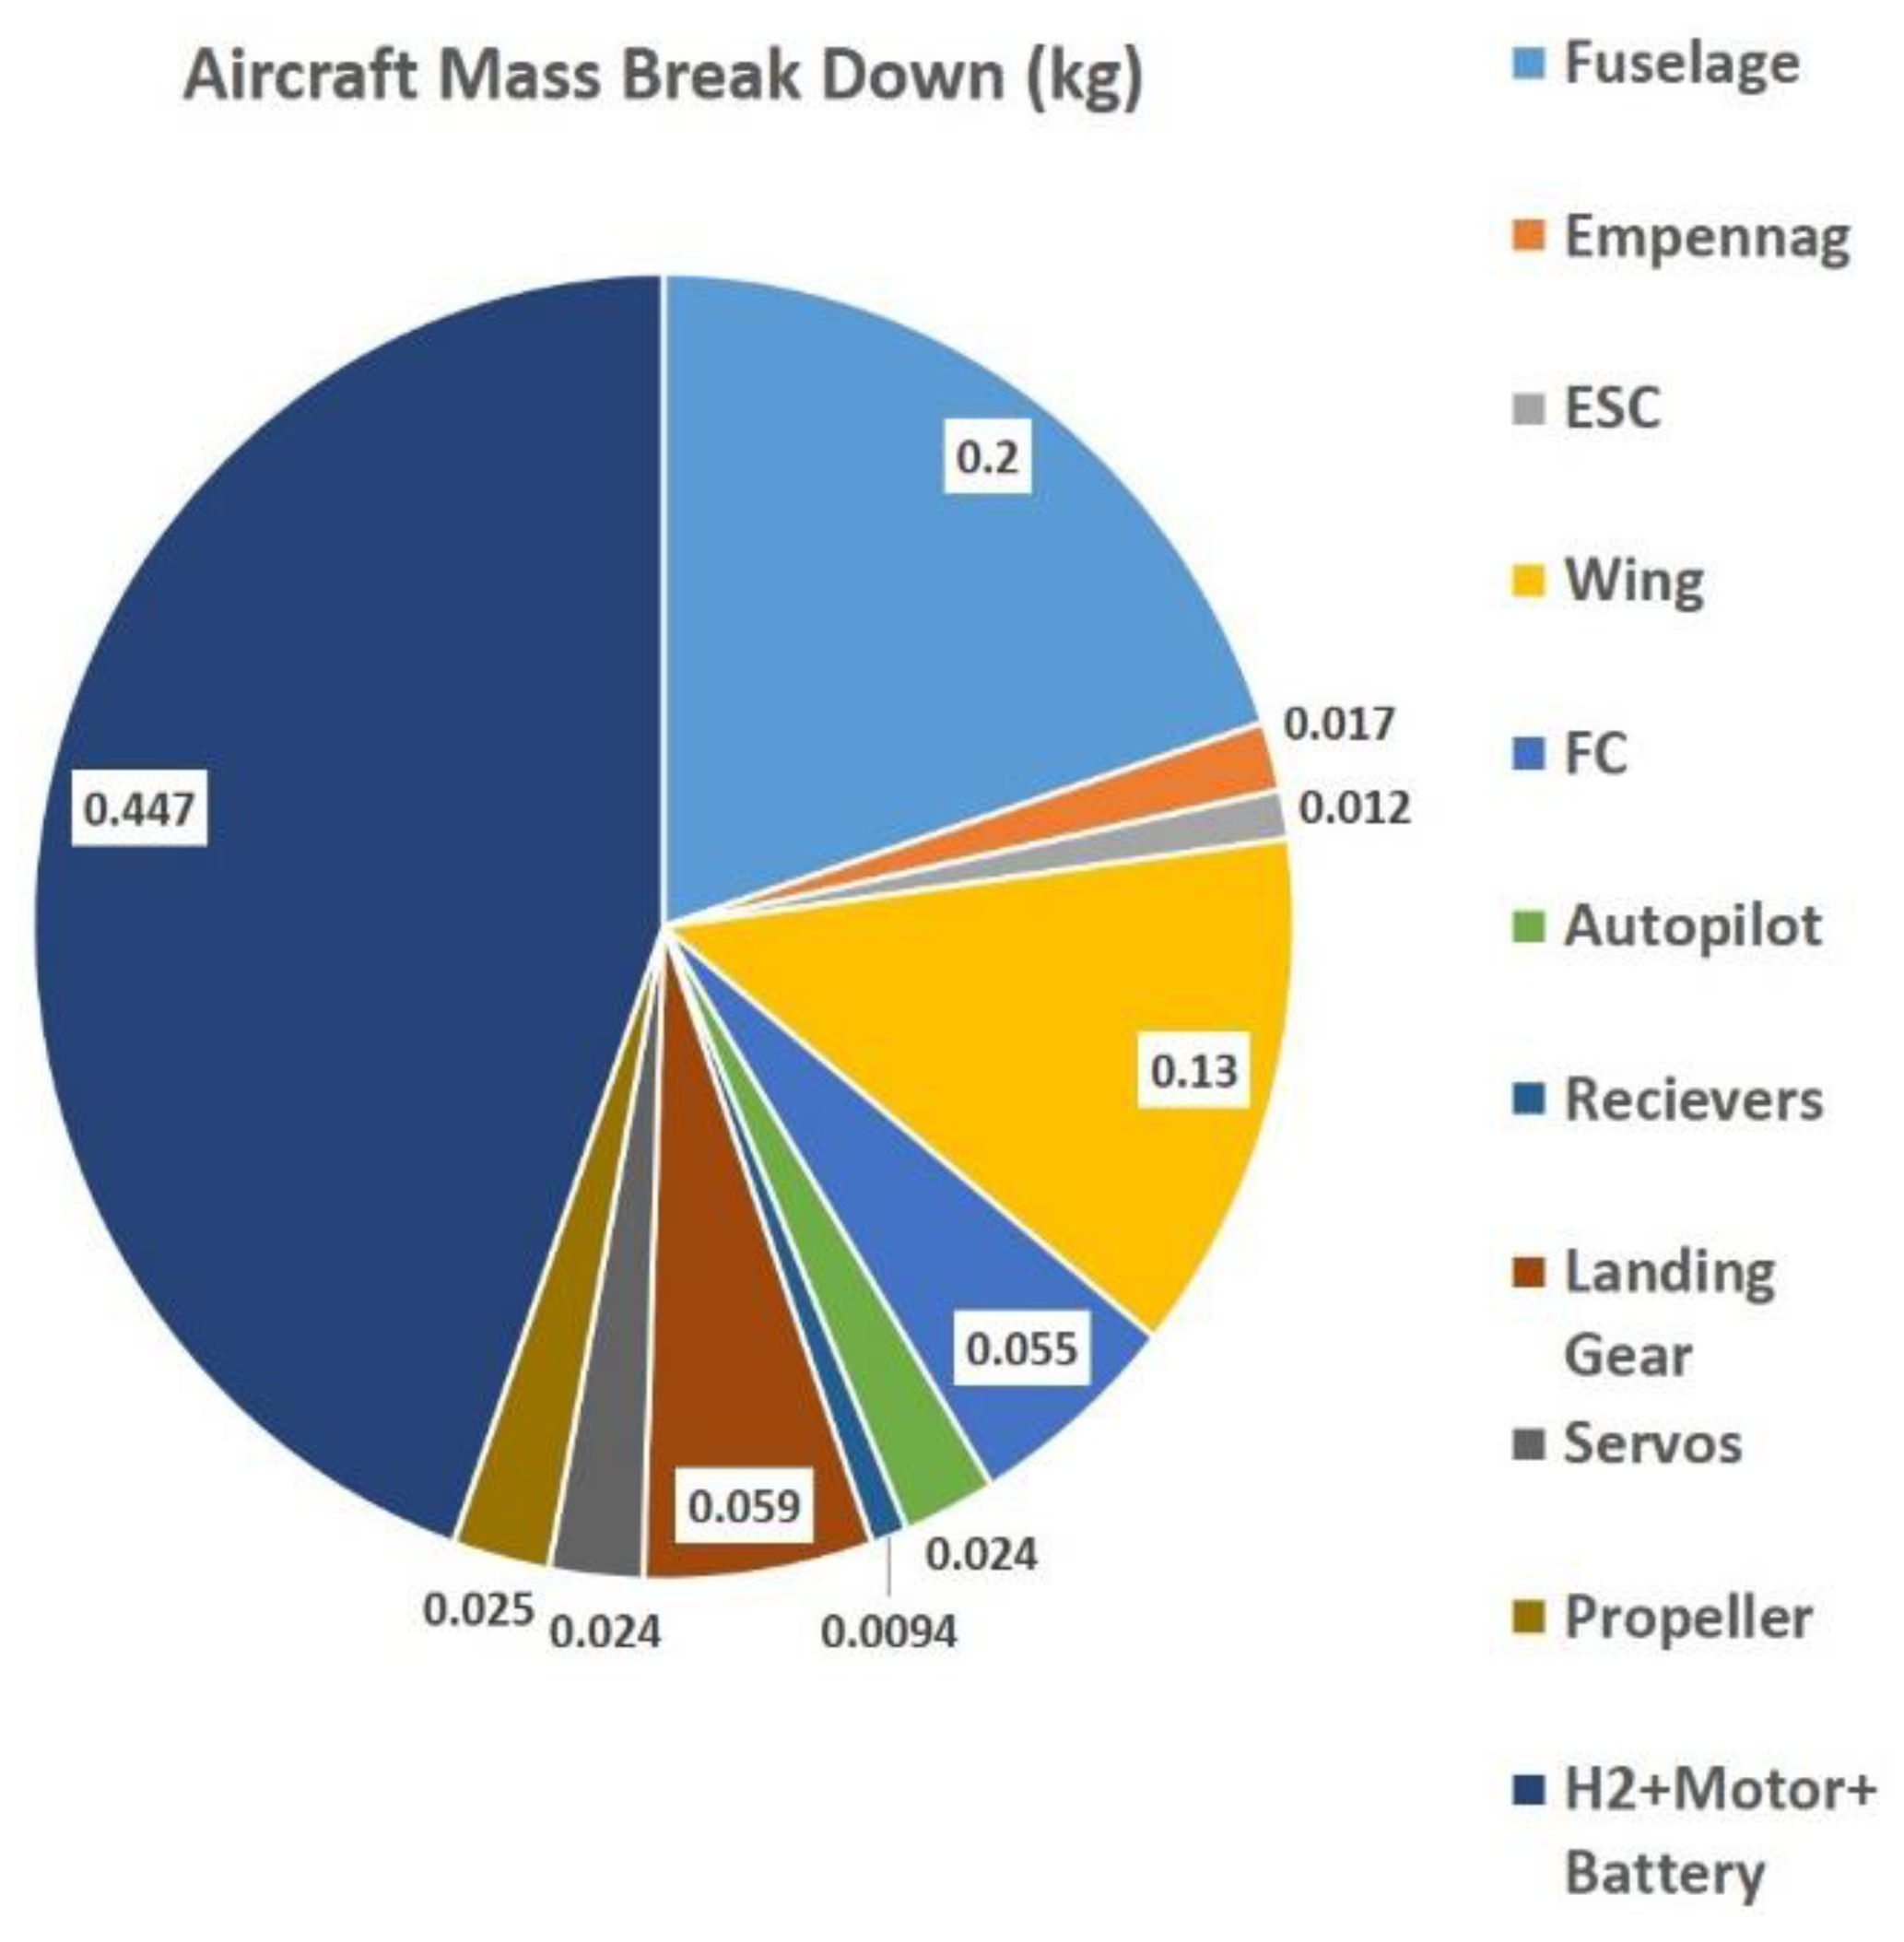
3.2.2. UAV Weight Tabulation CA
The aircraft weight breakdown consists of two main parts. The first part includes the UAV fixed masses which are the airframe that includes the fuselage weight, wing and tail weight, PEMFC weight and landing gear weight. While the second part includes the components that needs to be specified which are the hydrogen tank mass, hydrogen content mass, electric motor mass and propeller mass. Those components correspond to 44.7% of the total UAV weight as shown in Figure 9.
3.2.3. Aerodynamic Contributing Analysis
The meeting point between the propulsion system and aerodynamic system is power. The power available from the propulsion system must equal the power required by aerodynamic in steady flight condition as follows:
Available thrust can then be obtained as follows:
where is the coefficient of thrust, is air density, is propeller diameter and is rotational speed of the propeller.
To maximize the range, thrust should be minimized. As a result, should be maximized, while to maximize endurance, power should be minimized. As a result, it is necessary to maximize [37].
3.3. Design Structure Matrix
The flow of inputs and outputs between the different CAs requires a manageable system which is described as the design structure matrix. CAs are organized diagonally from upper left to lower right. Flow of data is shown as the lines connecting the CAs in which CAs are executed serially from left to right. The interaction between different CAs requires a flexible framework to execute all of CAs and guarantees that all feedback variables are in harmony with other outputs as shown in Figure 10.
3.4. MDA with Simultaneous Analysis
The technique used here is a MATLAB function “fsolve”. It evaluates the convergance or divergance percentage between xi and xi+1 by minimizaing the merit function using the the trust region dogleg method for solving nonlinear systems.
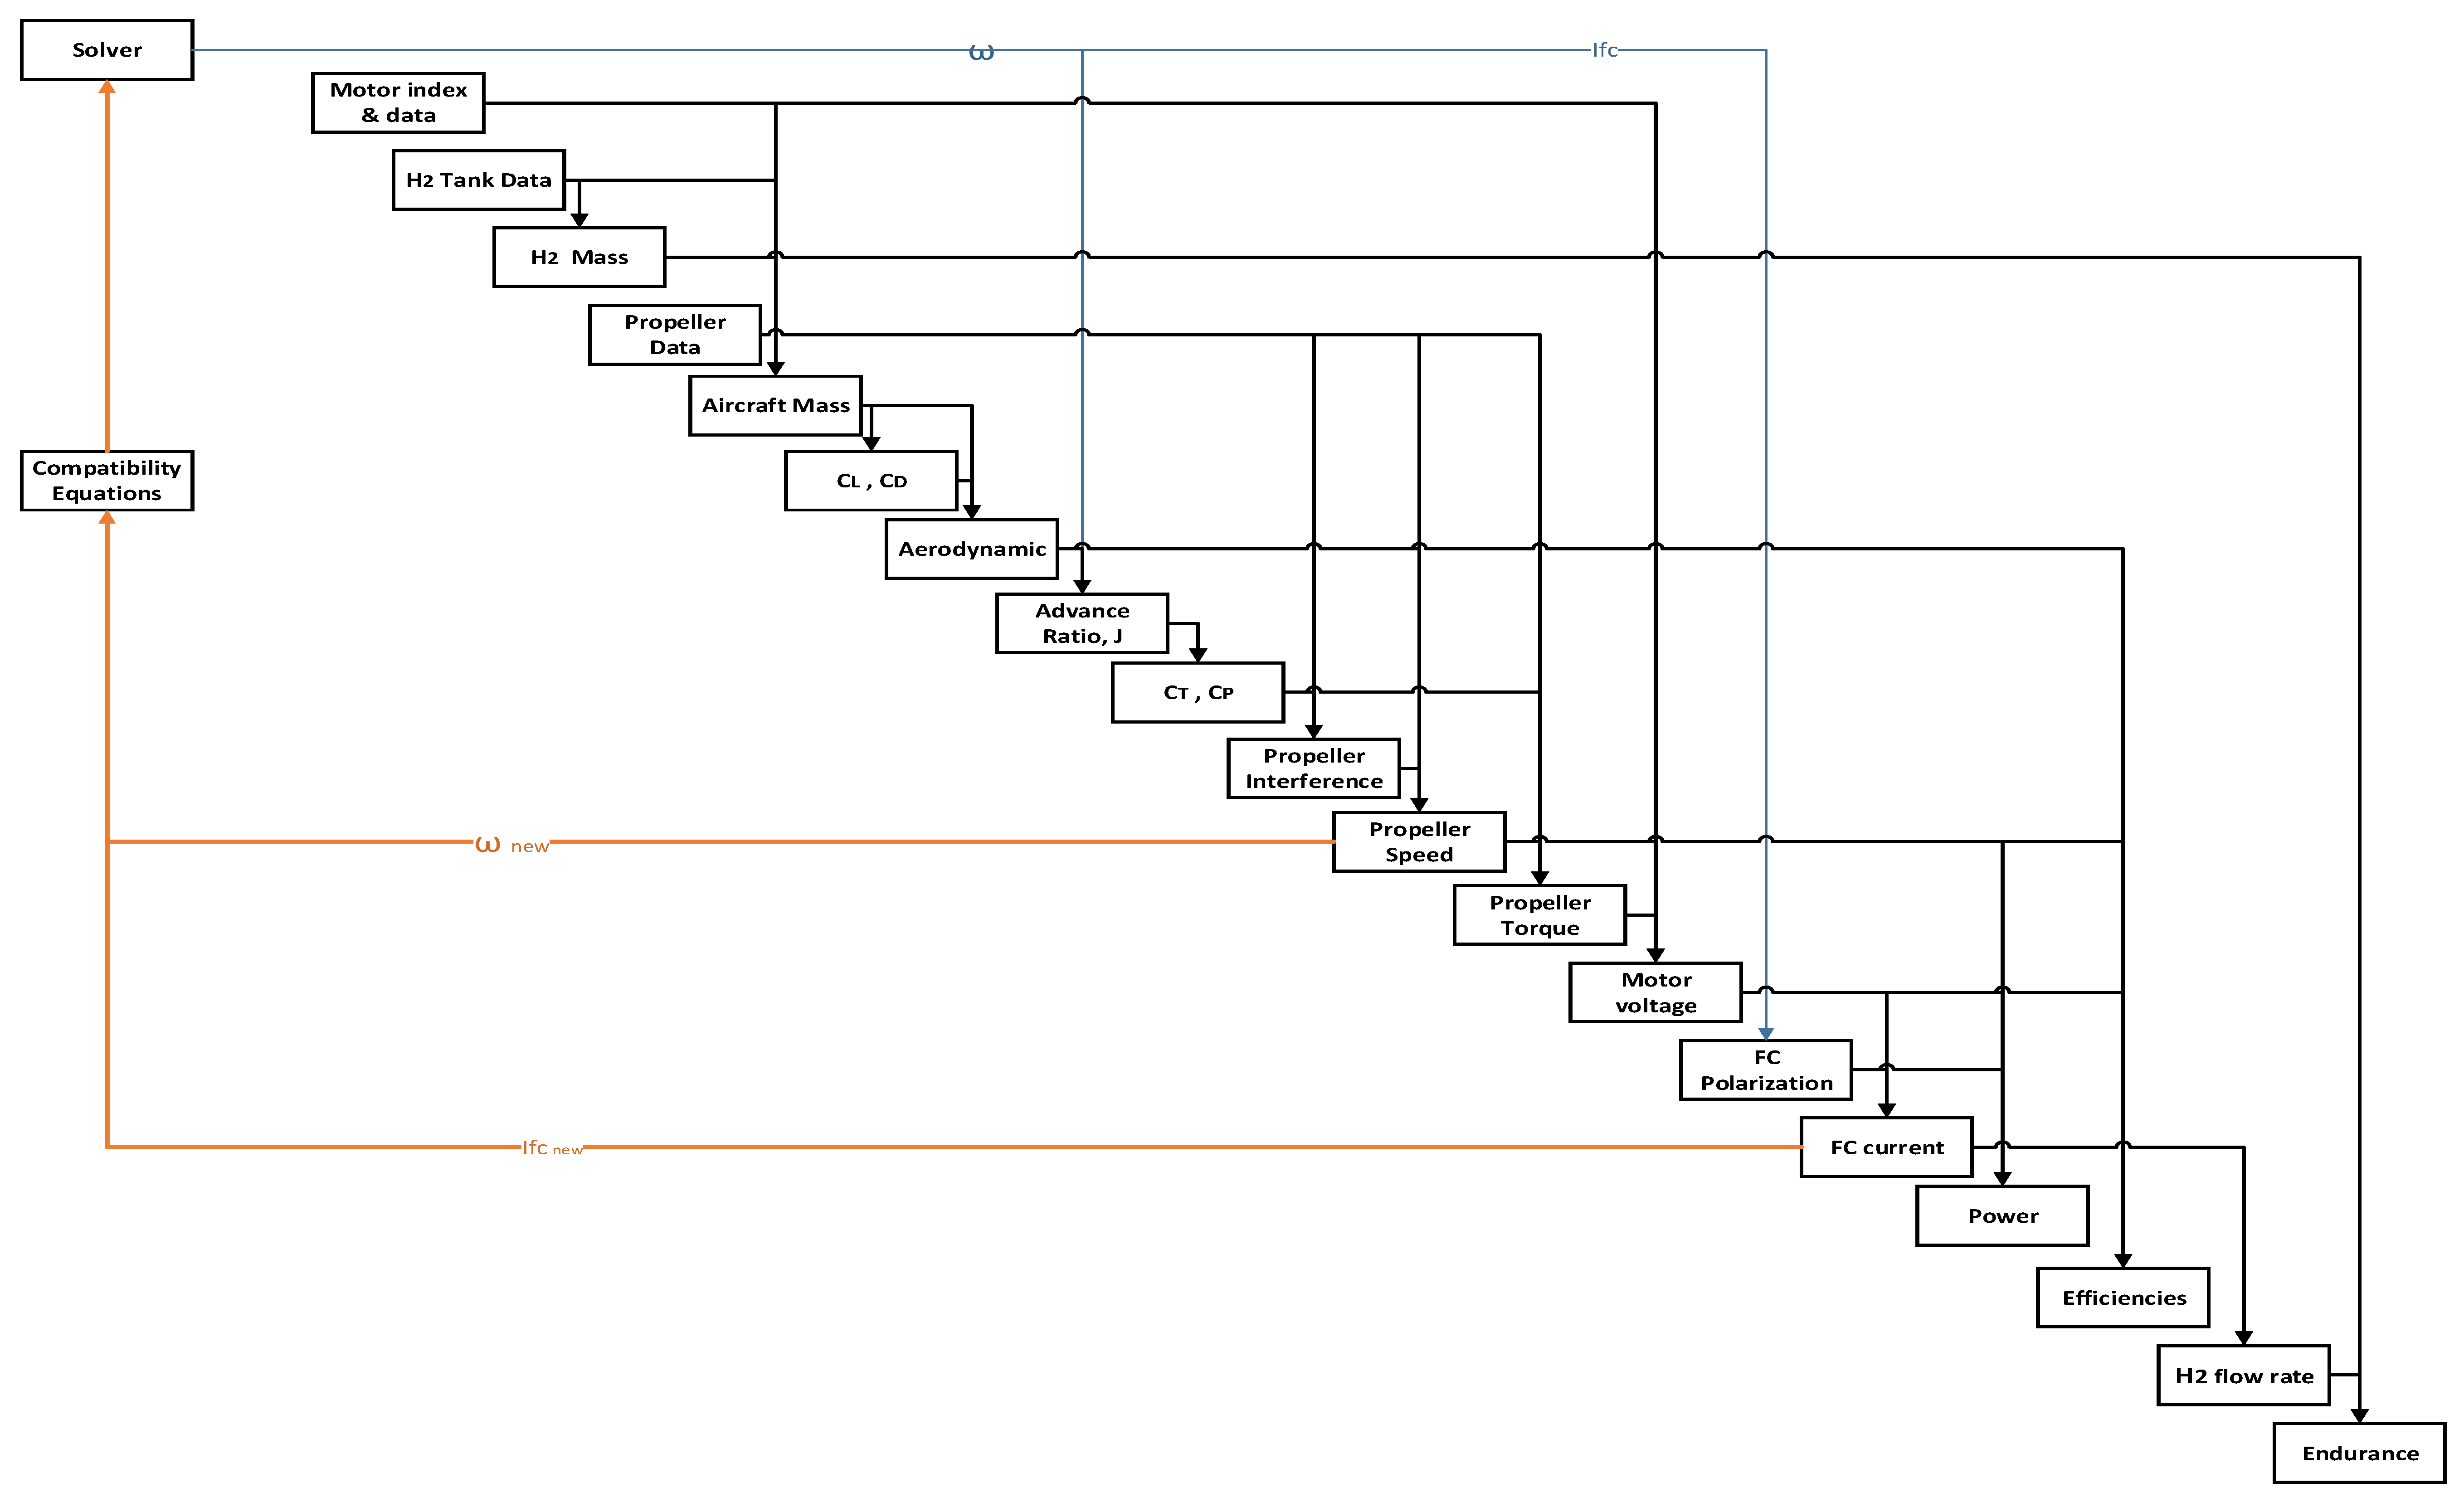
The resulted MDA is shown in Figure 11. The solver variables are the fuel cell current and propeller speed. These variables are set to some initial values. As the analysis begins. The new resulted variable values are fed back through the loop to the MDA again.
For a predefined wing airfoil and propulsion system components such as hydrogen tank, fuel cell, motor and propeller, aircraft total mass and hydrogen content can be obtained. Coefficient of lift and drag can be obtained based on the calculated total aircraft mass and the predefined angle of attack. The required cruise speed and thrust required are then obtained from the aerodynamic box. With the guessed value of rotational speed, the advance ratio could be obtained and propeller corrected coefficients can be obtained. Using the required thrust obtained and coefficient of thrust, the new value of propeller speed can be obtained and fed back. The propeller speed and Cp obtained will be used to get the propeller torque. The motor current and voltage can then be obtained. With the fuel cell current initial value, the fuel cell voltage can be obtained using the polarization curve equation. Neglecting the motor speed controller losses will lead to the power delivered from the fuel cell be the same as the motor power. Dividing the calculated motor power over the new fuel cell voltage will result in the new fuel cell current. Finally, efficiencies of different components are calculated and the aircraft endurance is obtained.
The new variables of fuel cell current and propeller speed are fed to the compatibility equations before passing them to the fsolve solver. The solver keeps iterating the variables until the compatibility equations are values are less than the presetted tolerance value. The compatibility equations defined are:
Those equations are set equal to zero. If the compatibility equation solution is less than the preset tolerance value, the nonlinear system of equations is implicitly solved. This flexible MDA can solve all the UAV design variables for a given UAV geometry and propulsion system. MDA development analysis is important for the development of the multi-disciplinary design optimization (MDO) scheme as it represents the main structure for the MDO and its evaluation.
4. UAV Detailed Design (Optimization)
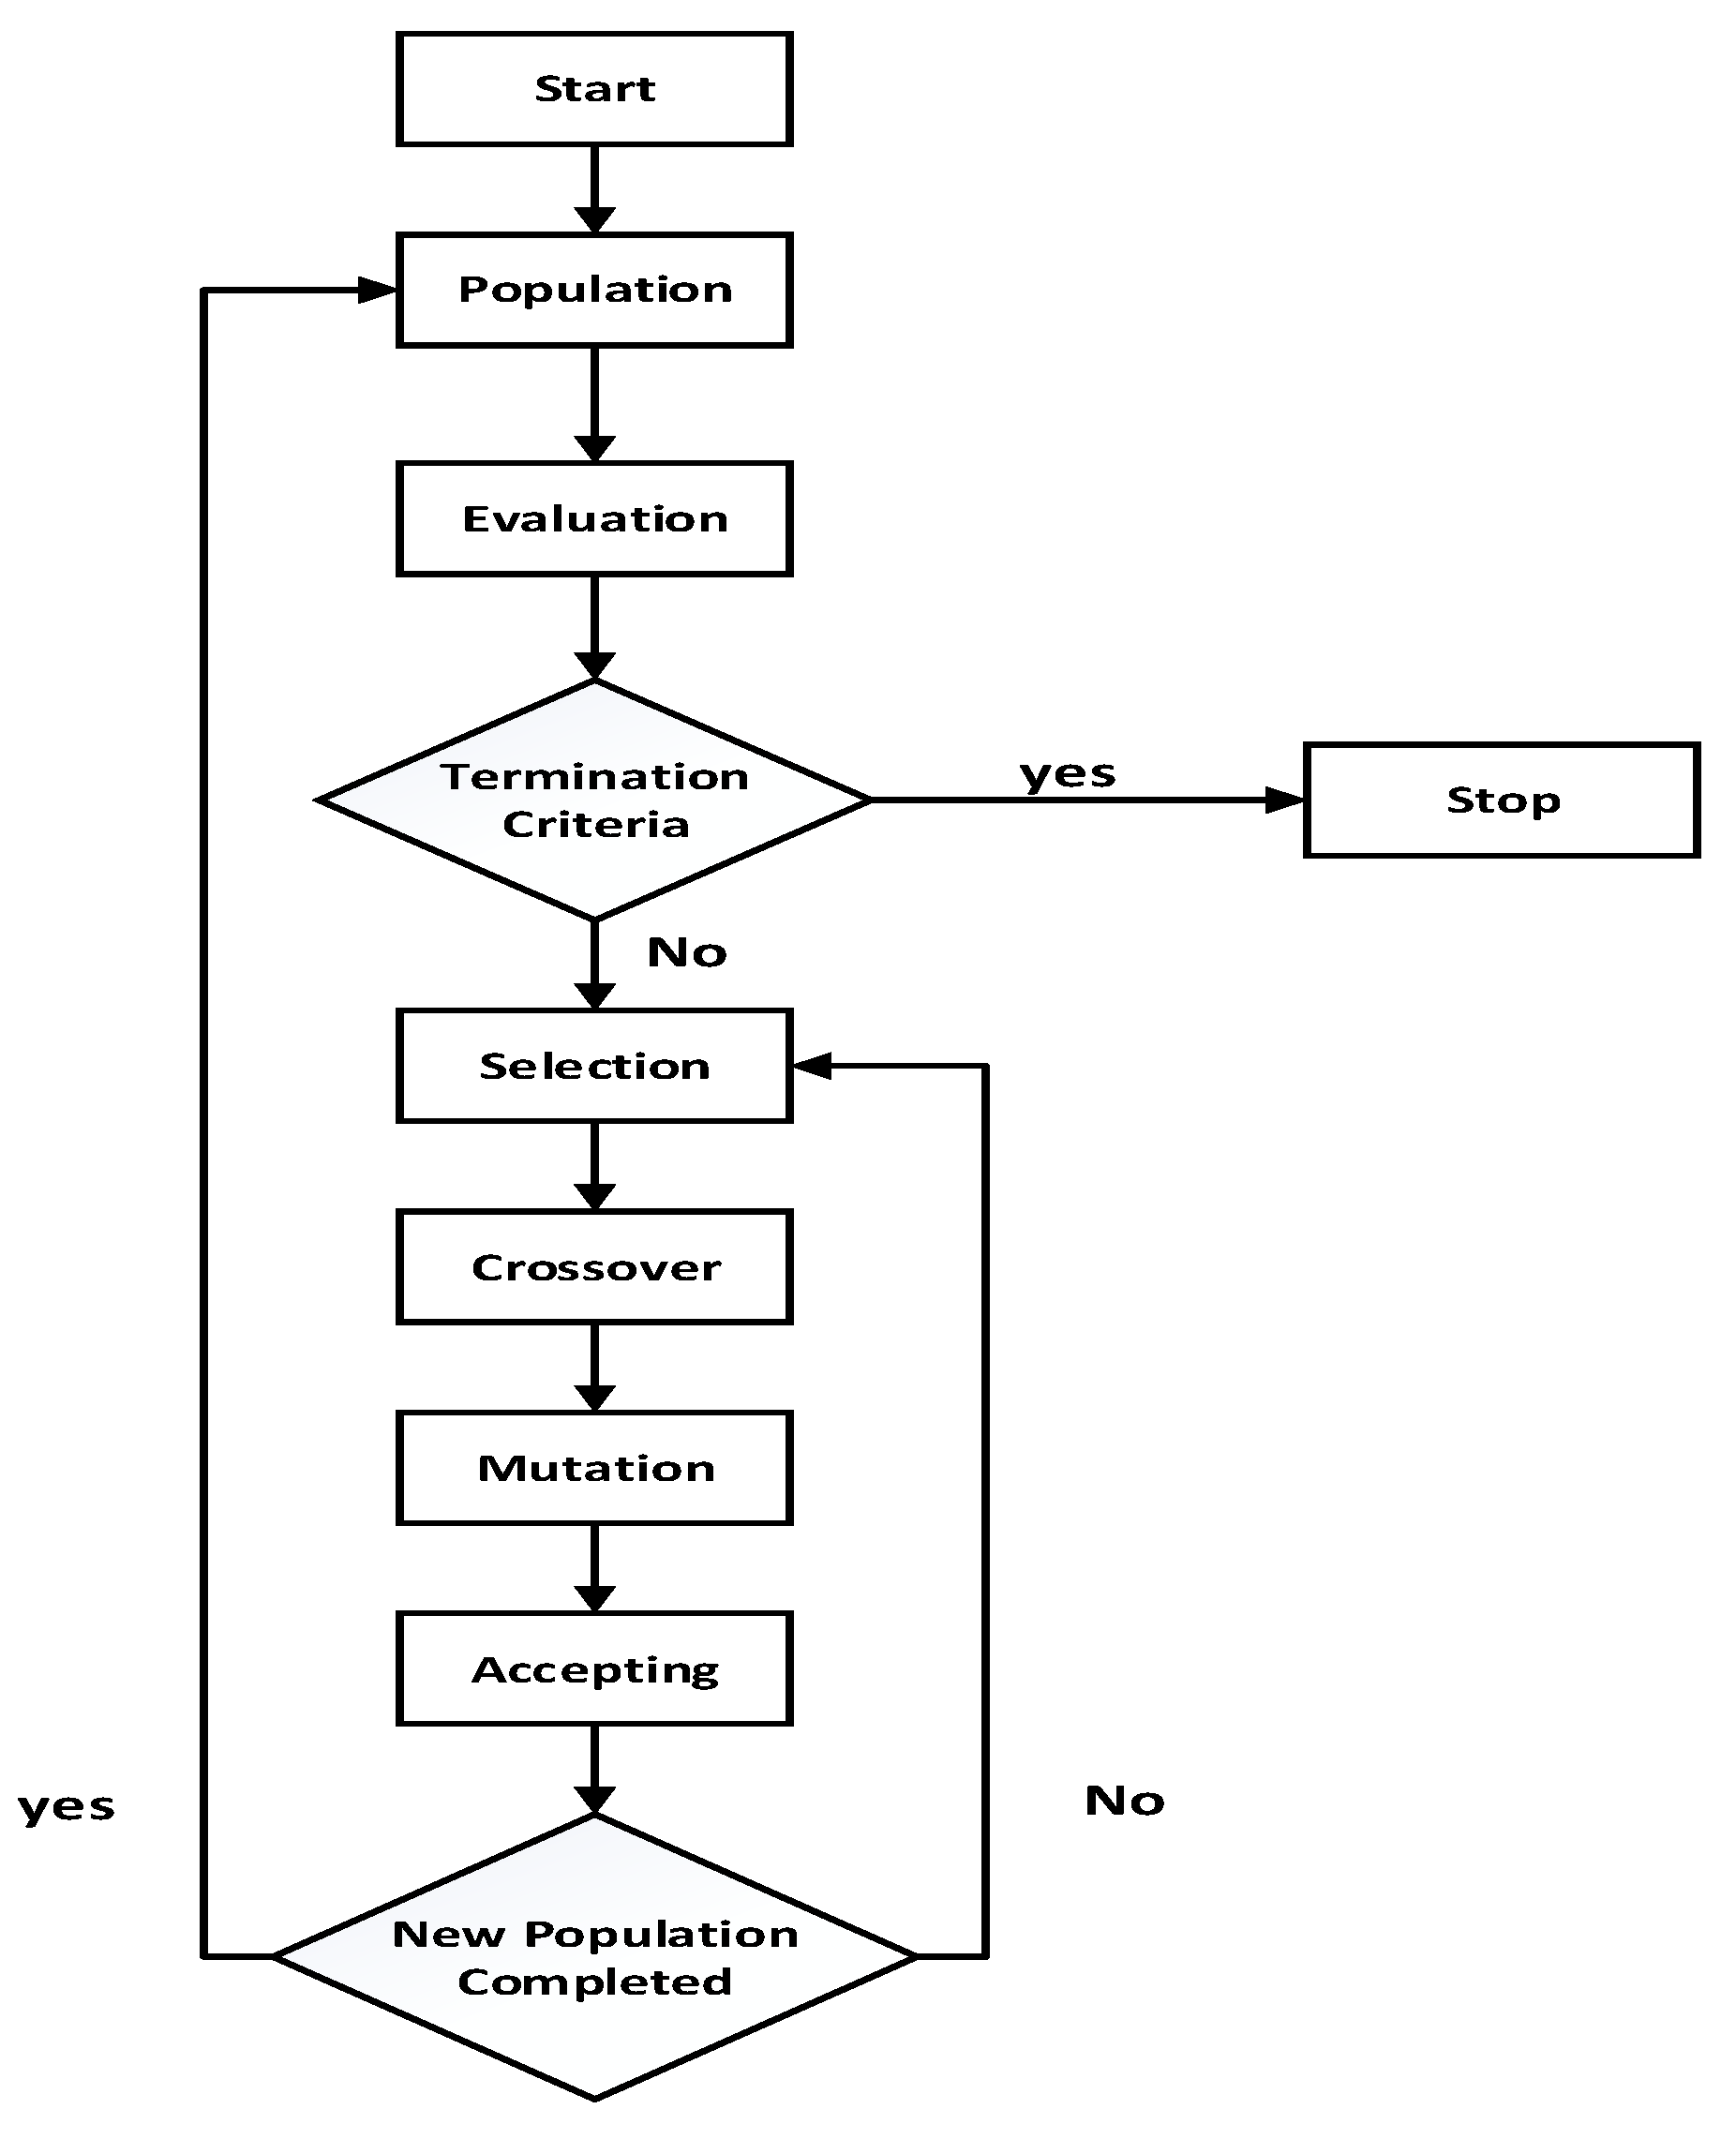
Genetic algorithms are commonly used technique to search for optimal operational points especially in cases of complex problems where there is no fixed mathematical formulation frame to solve the optimization problem [38,39,40]. GA optimization technique depends on evolutionary programming to search for optimal results [41]. GA flowchart is shown in Figure 12.
4.1. Genetic Algorithm Problem Formulation
The objective function of interest is the aircraft endurance. The optimization scheme main task is to maximize the objective function given in Equation (29):
The negative sign in Equation (29) is introduced to maximize the endurance.
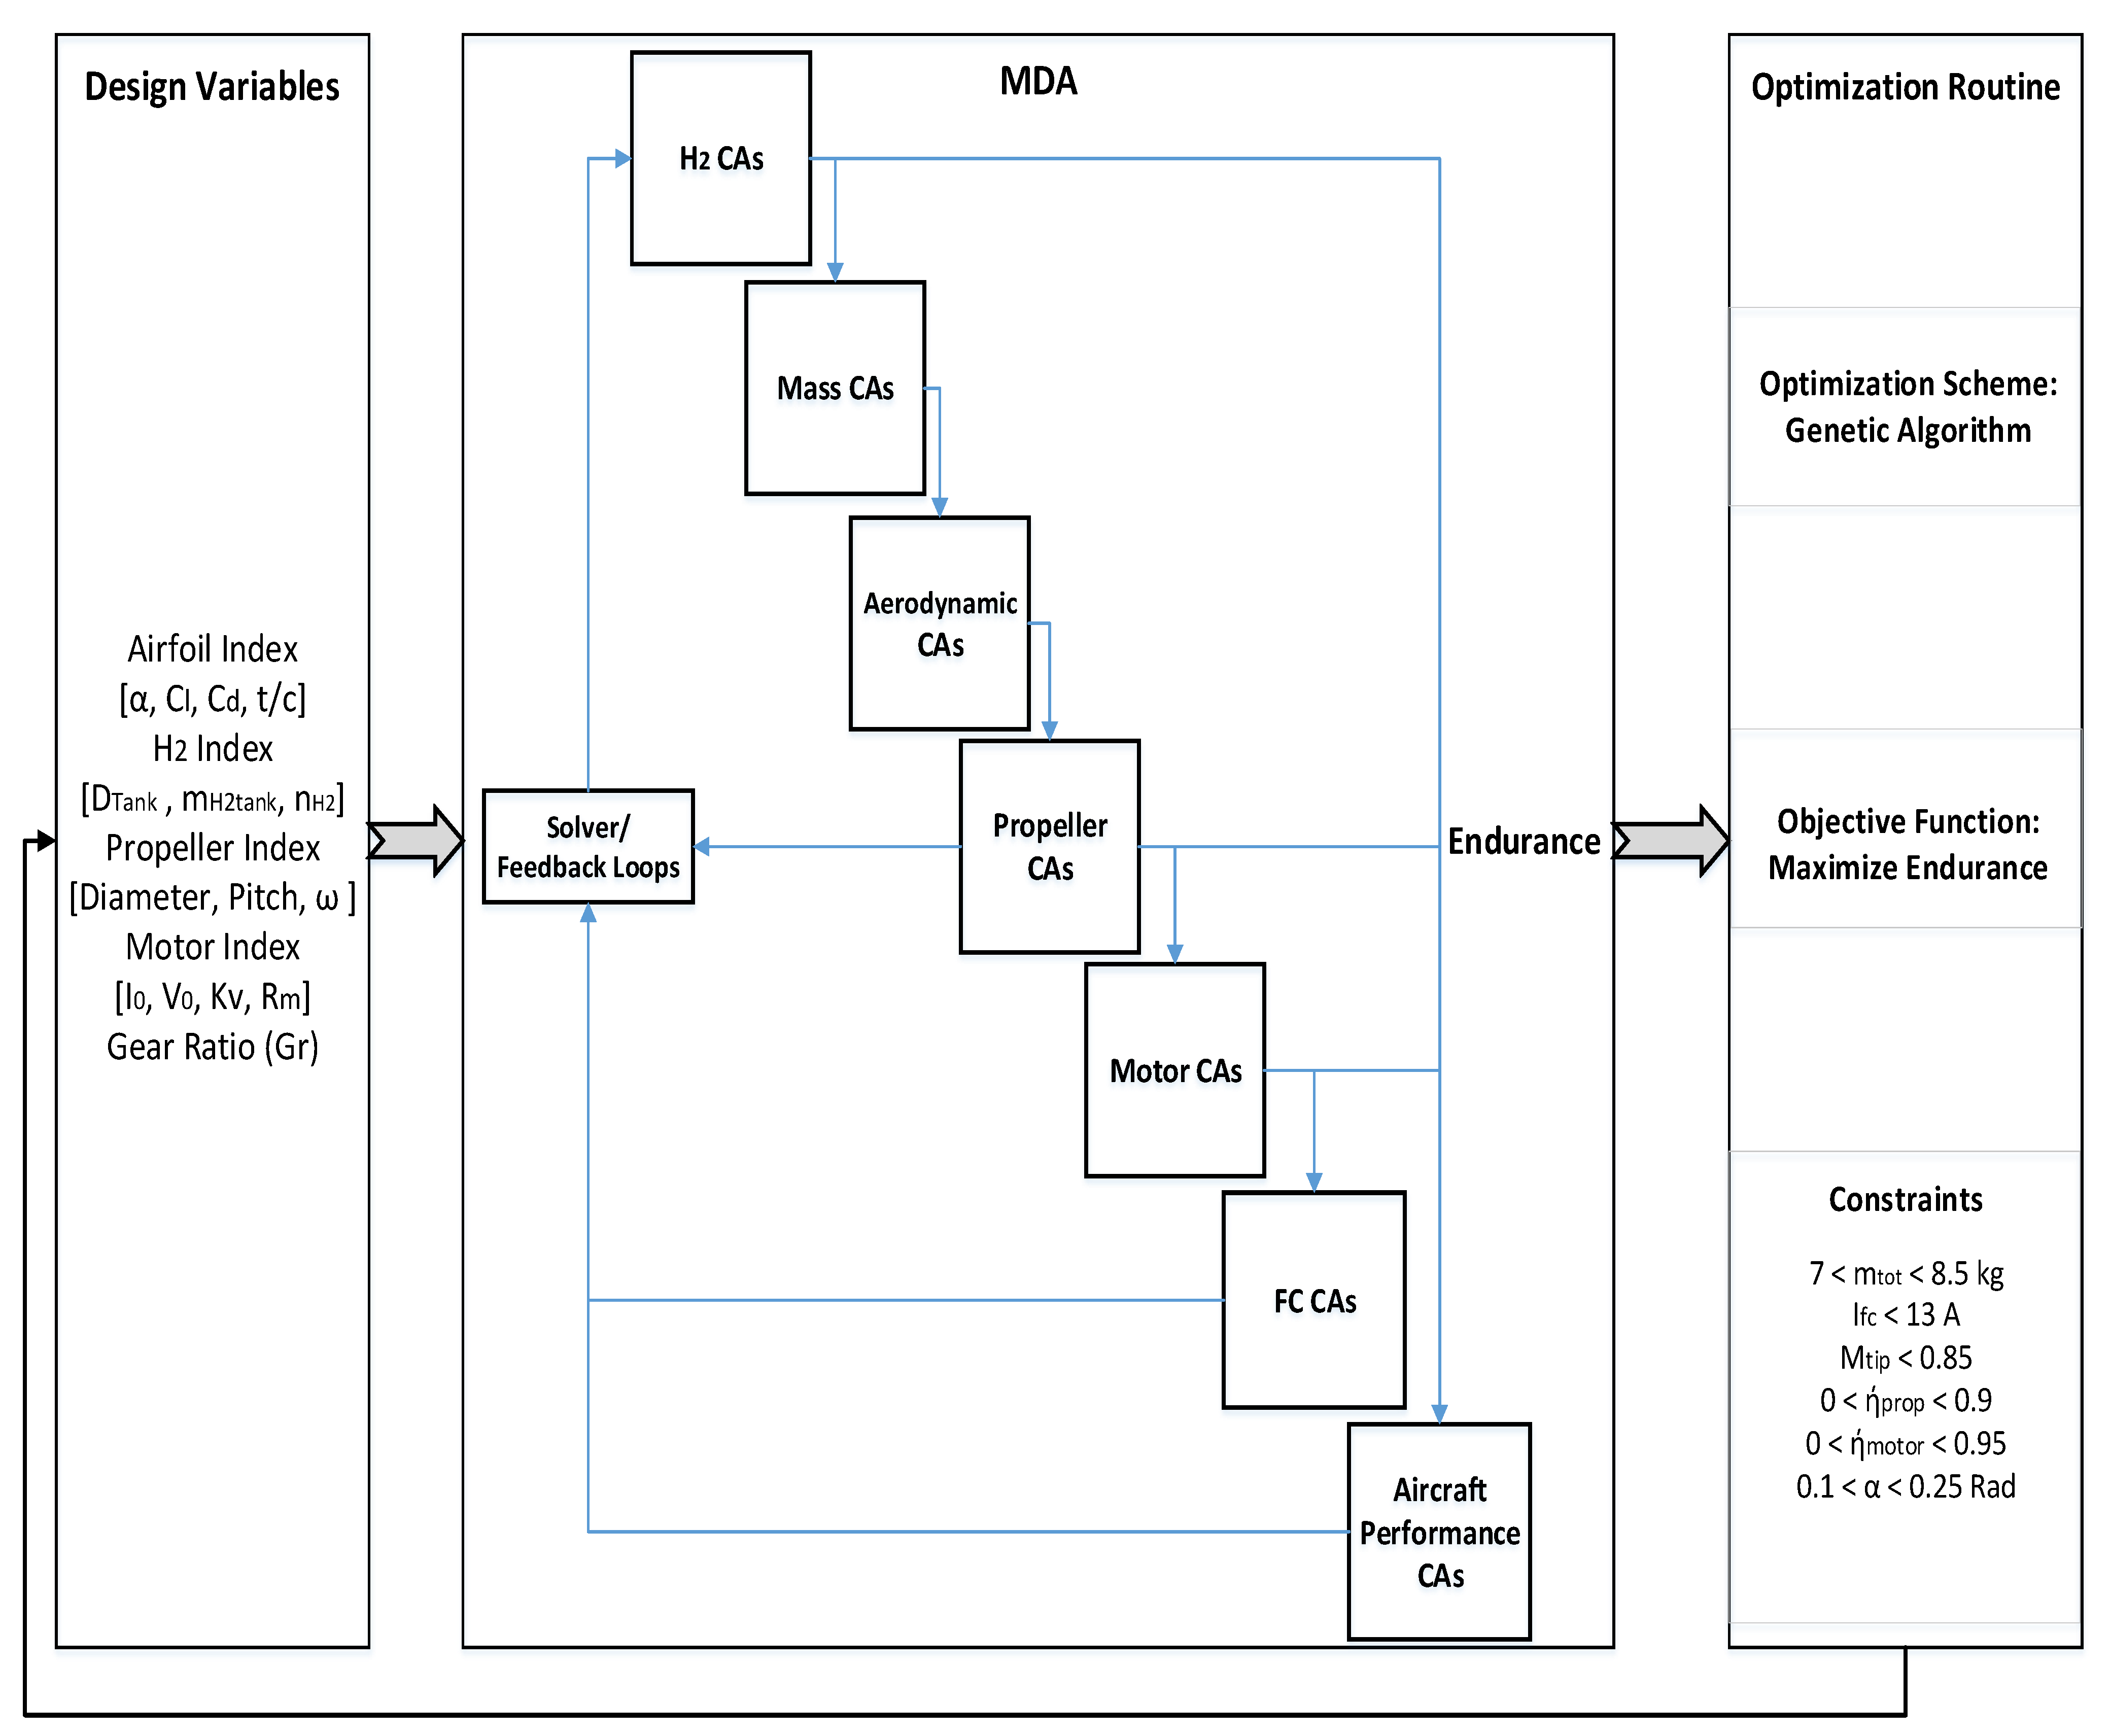
Design variables and constraints are illustrated in Figure 13. The optimization scheme involves discrete and continuous design variables. These design variables are the airfoil index, motor index, propeller index, and hydrogen tank index. Design variables associated with the component indexes are illustrated in Figure 13. Since commercially off-the-shelf (COTS) ready components will be used, thousands of possible combinations of wing geometries, hydrogen tanks, motors and propellers could be visualized. For this study, 3 selected airfoils, 42 available BLDC motors’ models supplied from Hacker Motors and AXI Motors are selected for the analysis and 57 propellers ranges from 12–27 inch diameter manufactured by APC are selected and the PEMFC current ranged from 0 to 13 A. For hydrogen tank, the selection process will be done after getting the hydrogen tank design variables solution but the maximum allowable diameter is 180 mm and length of 400 mm to guarantee its fit in the fuselage.
Design constraints are defined to guarantee the feasibility of the proposed solutions. These constraints are the aircraft mass, fuel cell current, propeller tip Mach number, motor and propeller efficiency, and angle of attack as presented in Figure 13.
The developed genetic algorithm code will be used is the GA toolbox and direct search box provided by MATLAB. The evaluation of the fitness function used is the same that is developed in the design structure matrix as indicated in Figure 13. After defining the optimization scheme, objective functions, all design variables and constraints; the multi-disciplinary design optimization is obtained as presented in Figure 13. This optimization scheme stands as the baseline flexible framework that can vary depending on the implementation.
4.2. Optimization Results
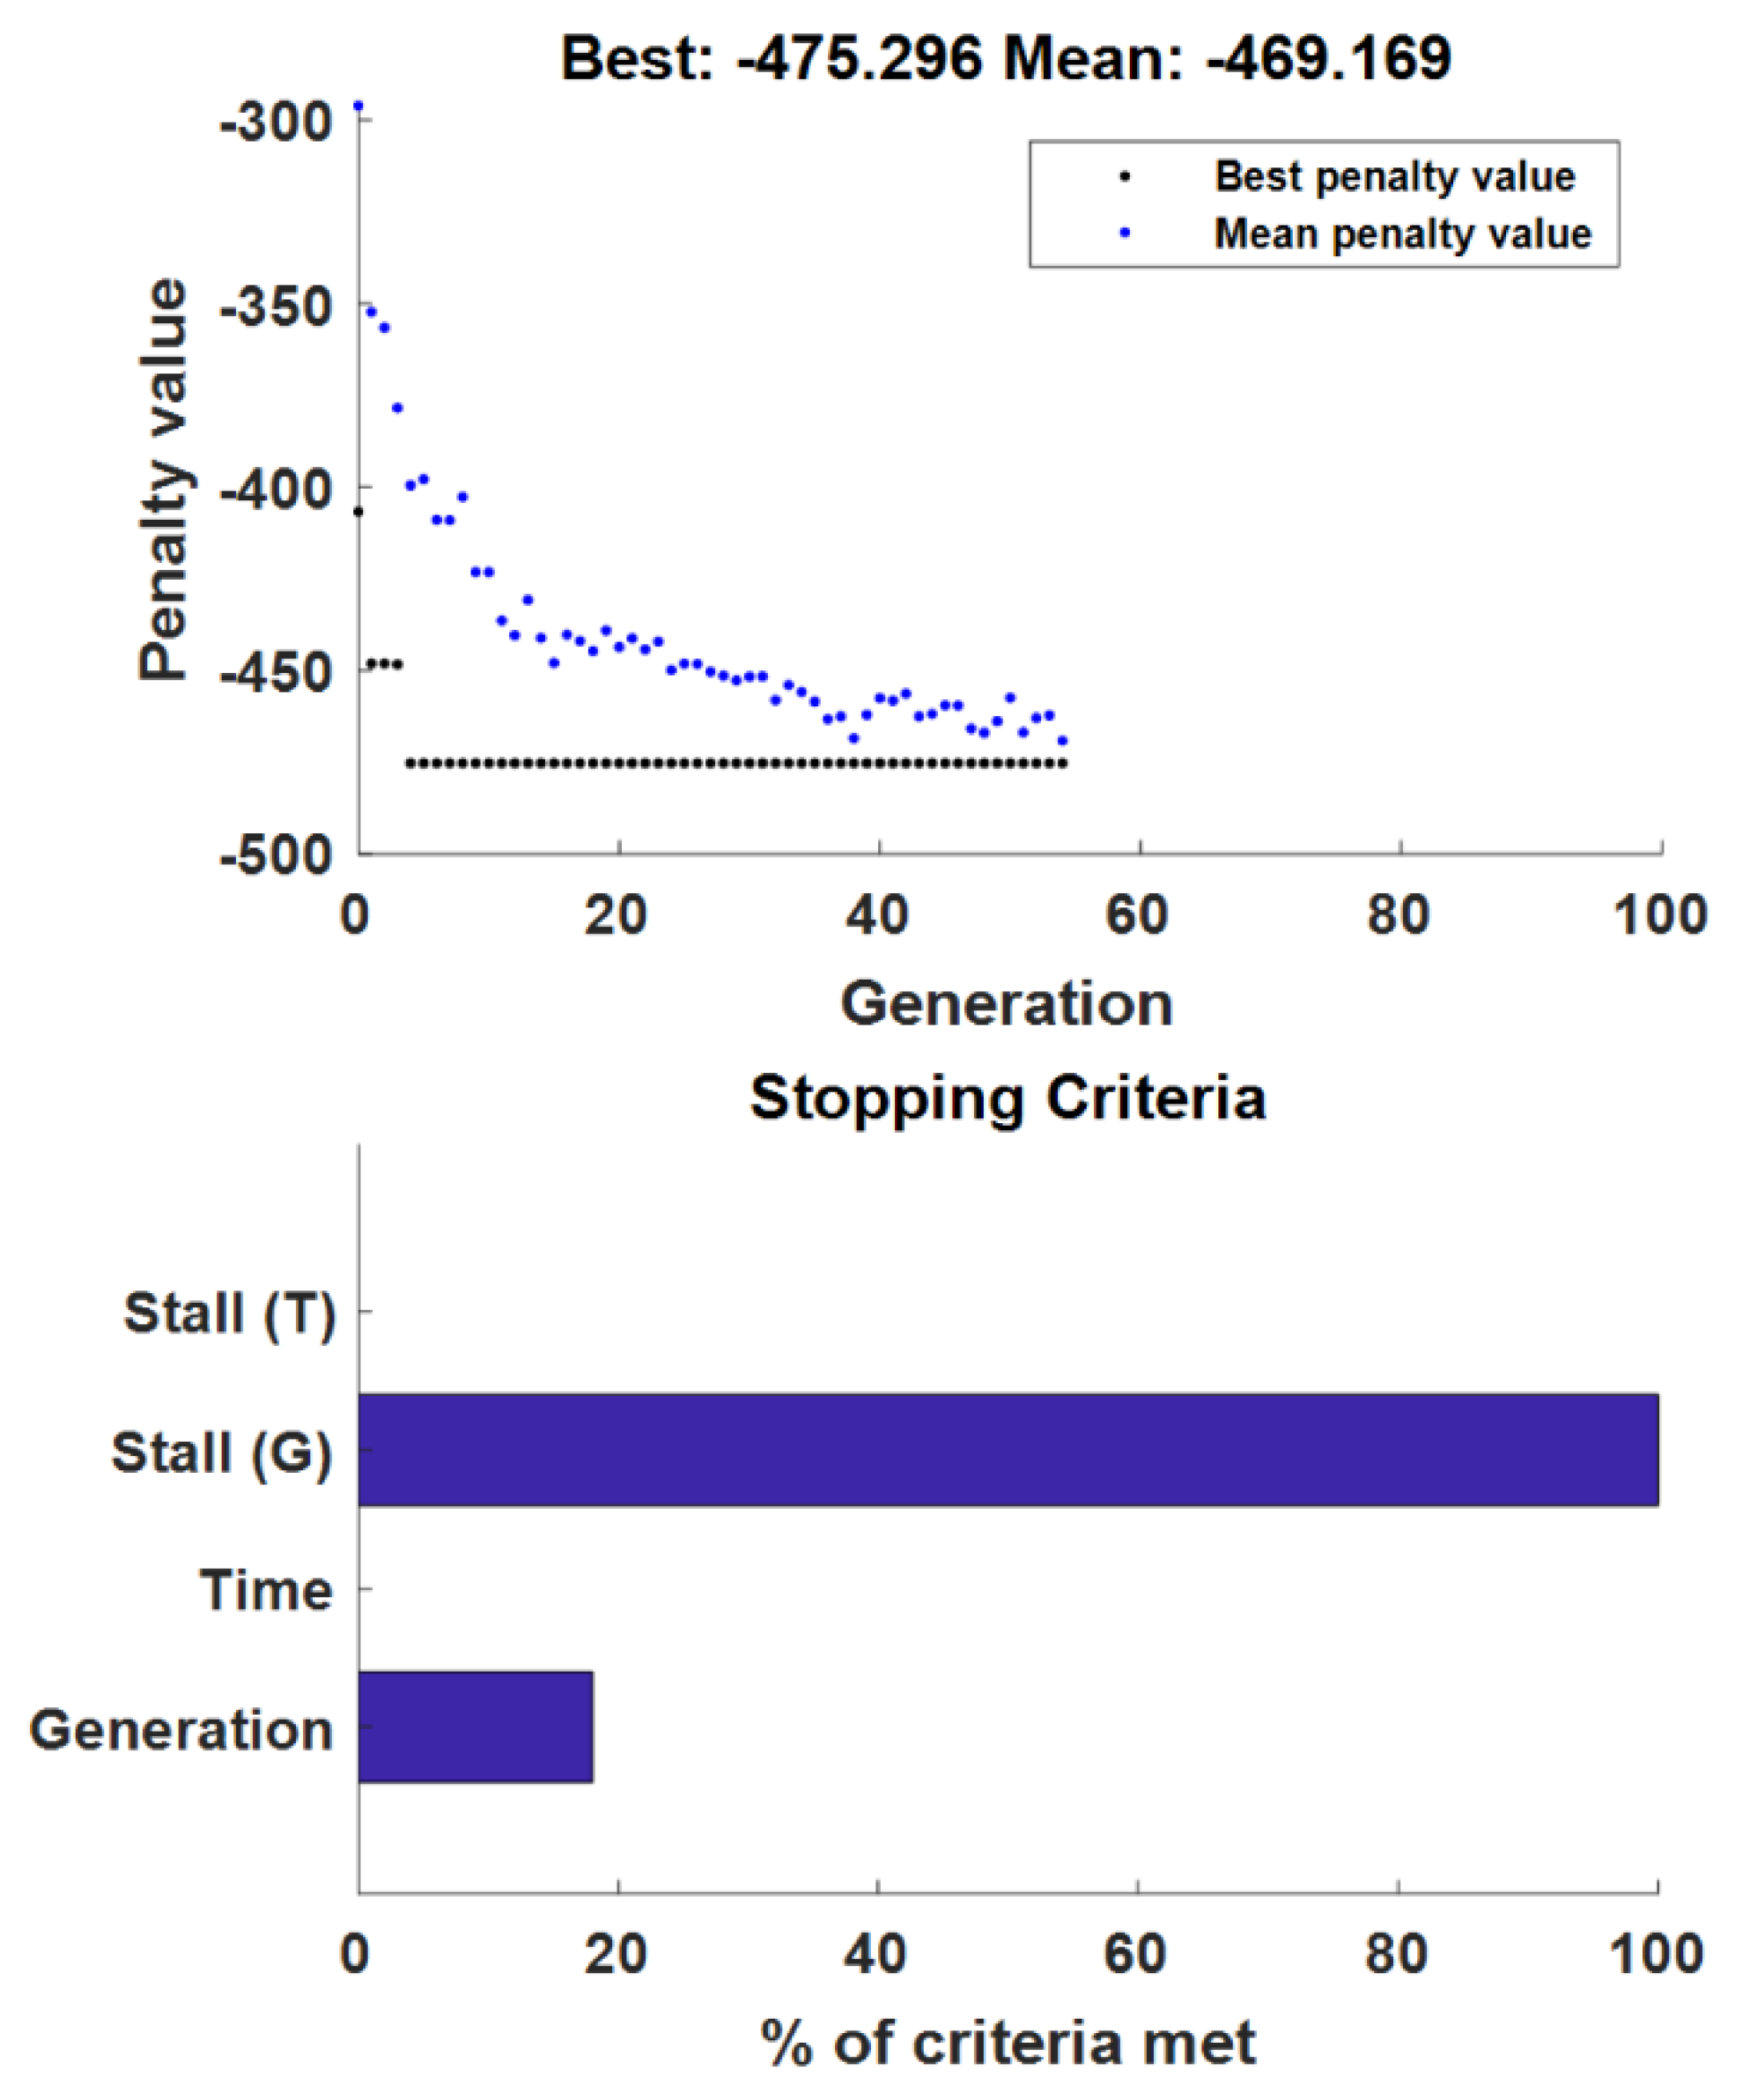
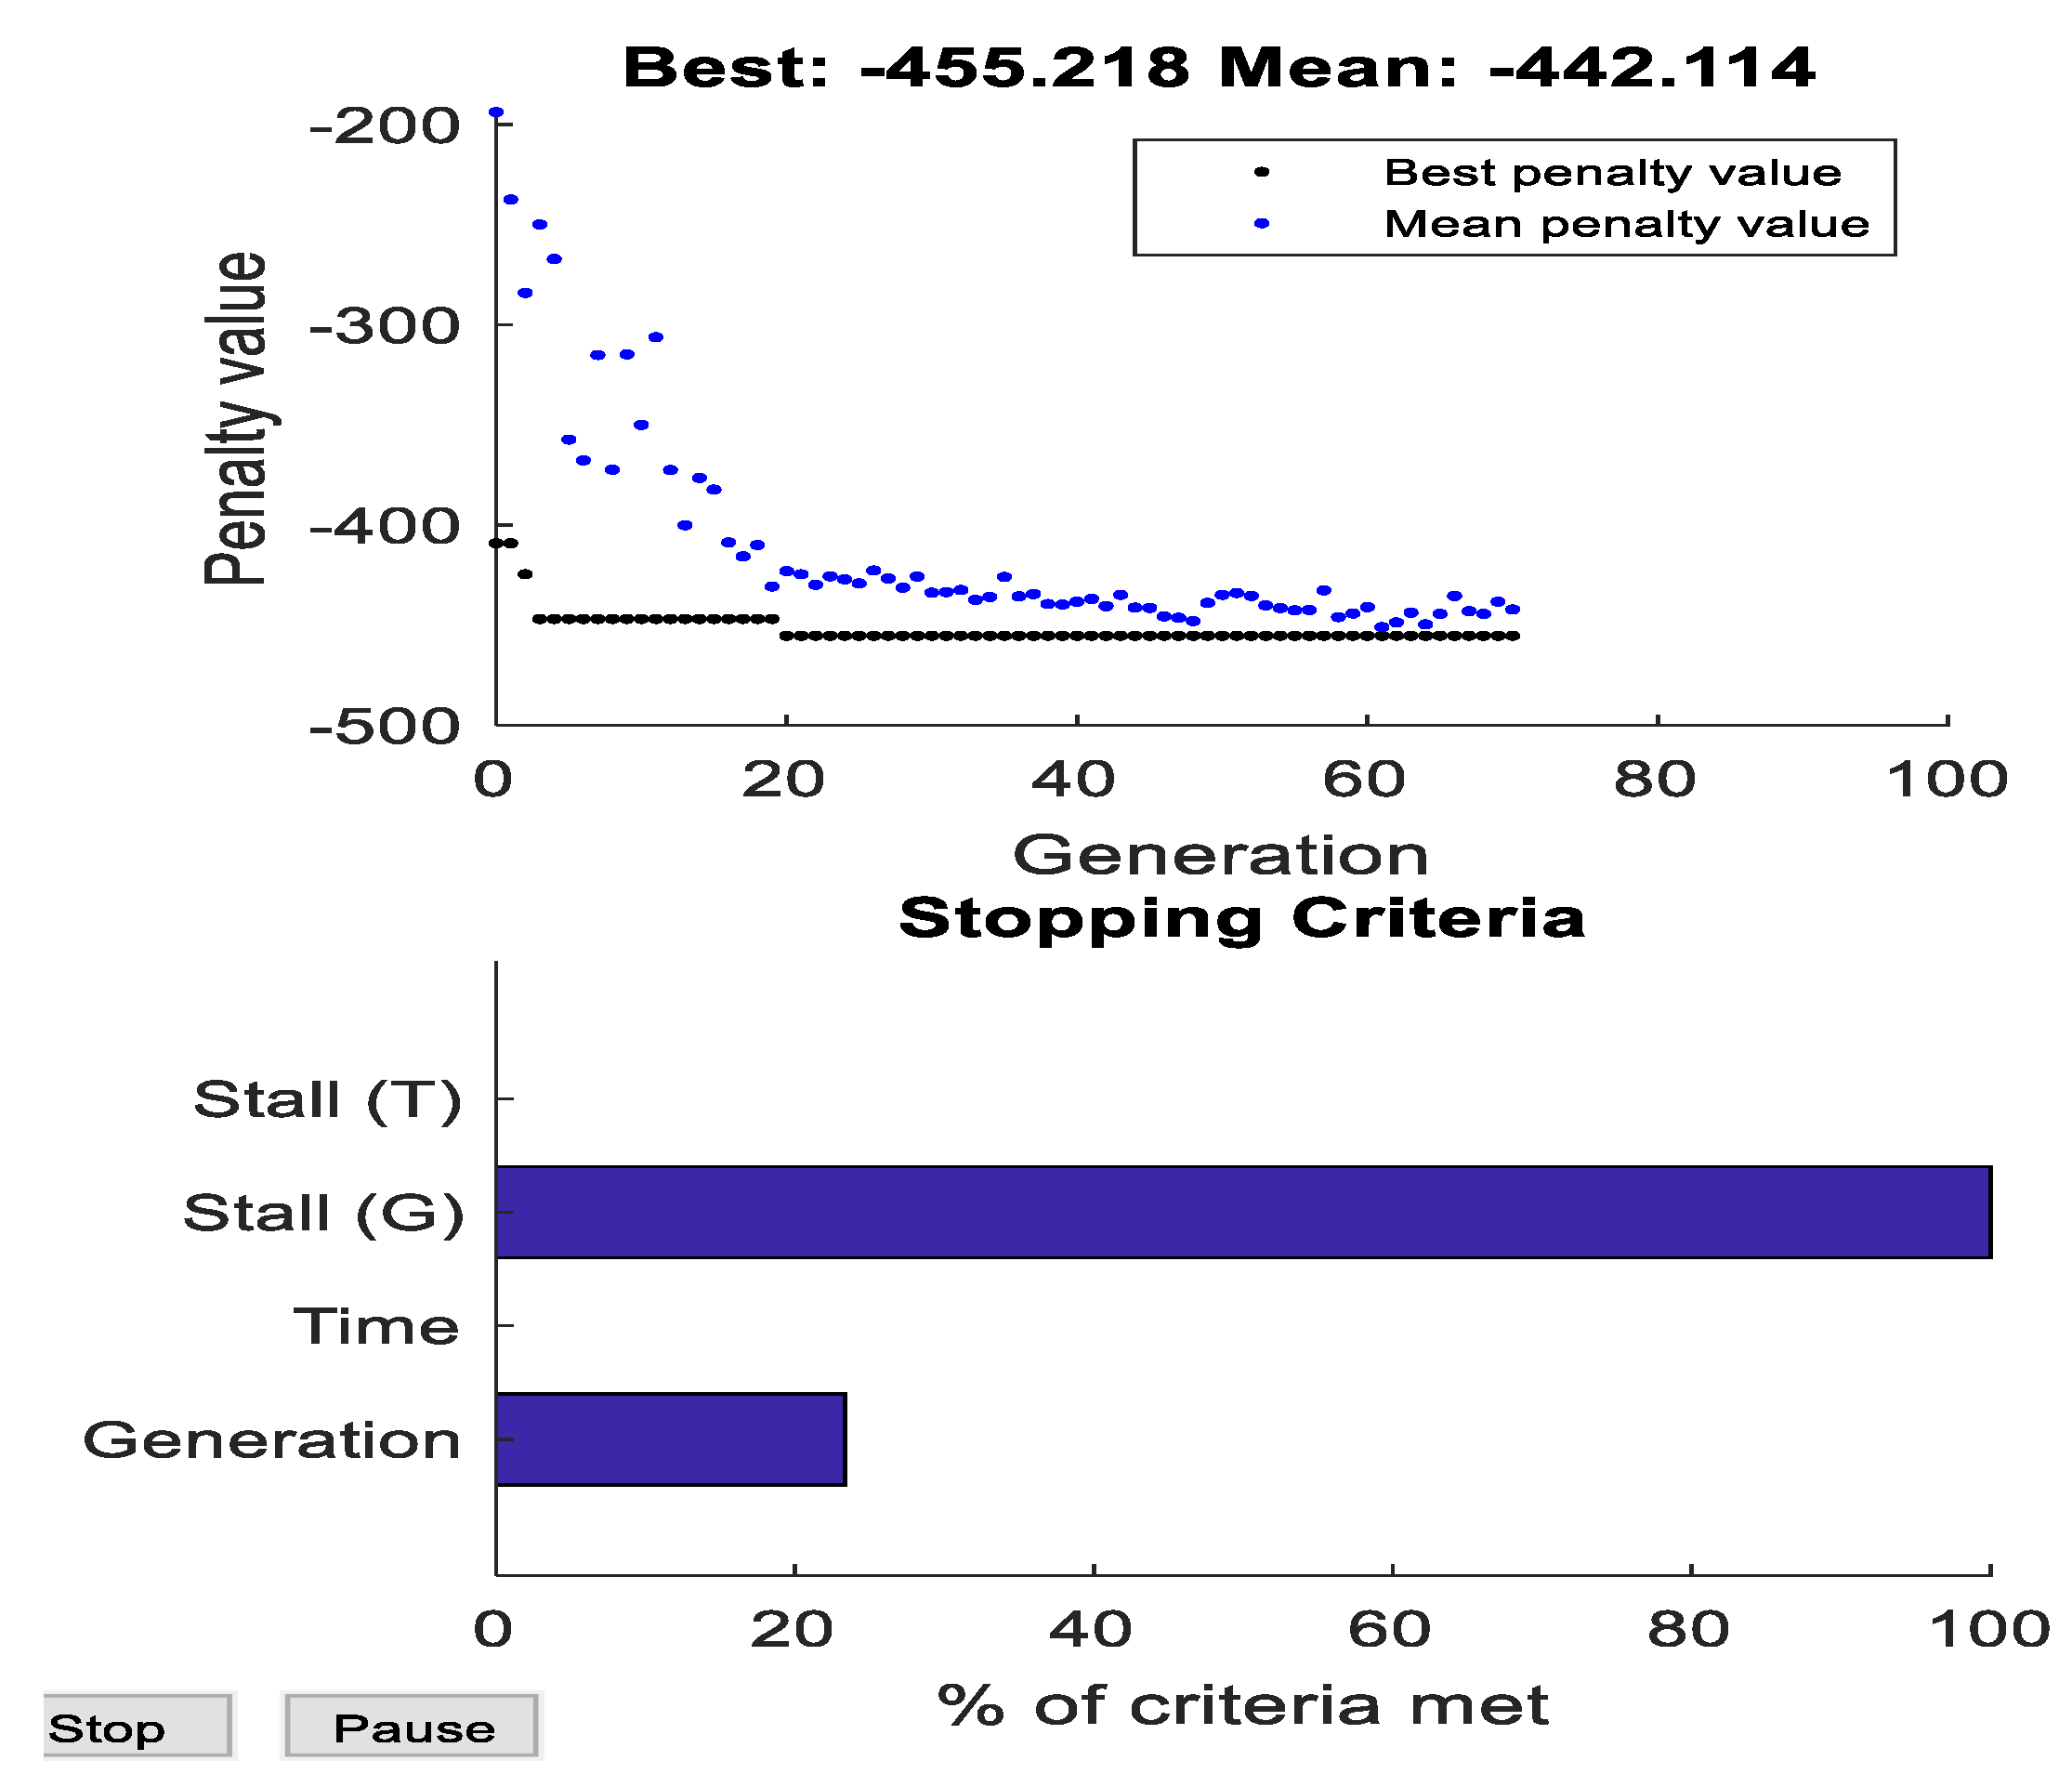
The problem formulation of the multi-disciplinary design optimization analysis is fully summarized in Table 5 and Table 6. This analysis was conducted assuming steady level flight performance using genetic algorithm as the optimization routine. The evolution history of the optimization scenarios are also presented in Figure 14 and Figure 15 in which the top graph represents the penalty function value while the bottom one represents the stopping criteria. Figure 14 shows the obtained results for the maximum endurance while Figure 15 shows the results for the maximum range.
The penalty function graph indicated in blue dots represents the mean value of the penalty function while the black dots represent the best value at each generation. The penalty function evaluation consists of two main parameters namely constraints and fitness functions. For each parameter, the penalty function picks a design entity from the created population mentioned above at each generation for checking its consistency with the design parameter. In the case of consistency, the fitness function value is set to be equal to the value of the penalty function. Otherwise, the value of the penalty function is also set to be equal to the maximum fitness value among the worst feasible members of the population. For the subsequent generation, the values chosen are those with the minimum penalty function values. As the optimization routine process is carried on, each new generation is converged to the best penalty function value. This is because of the reproduction process of the new generation that takes into consideration the relation of the best penalty function and new parents selection process.
Bottom graph included the stopping criteria in which if any of the termination criteria are met, it will cause the optimization process to be stopped. The stall time criteria evaluates the improvement of the objective function over a specified time interval. The time interval is set equal to the time criteria, which is set to be equal to infinity. The stall generations criteria evaluate the weighted average change in fitness value for a stall generation that is equal to almost 50. The specified value for the change is sit equal to a tolerance value of 1 × 10⁻⁶. Finally, the number of generations is set to be 100. If the optimization process reaches the maximum number of generations, the process is terminated. As can be seen from Figure 14 and Figure 15, the optimization process for maximum endurance was terminated after 59 generations and 2403 fitness functions evaluations. As for the range optimization process, a total number of 2841 fitness function values were evaluated and 70 generations were created. For both scenarios, the stall (G) generation criteria was satisfied as the change in the stall generation was too small, less than 1 × 10⁻⁶, and the penalty function value converged to the minimum objective function value.
Selected indices for both scenarios resulted from the optimization process are listed in Table 7. The selected airfoil that resulted in both maximum endurance and maximum range is NACA23010. As stated previously, to maximize endurance, should be maximized which corresponds to an angle of attack equals 11° for UAV with NACA23010 airfoil. While in order to maximize range, should be maximized which corresponds to an angle of attack equals to 7° for the same UAV. UAV with NACA23010 gave better performance characteristics in terms of endurance and range than other airfoils.
The hydrogen tank diameter is 144 mm and length of 322 mm. The calculated weight is 1.65 kg. The nearest commercially available carbon fiber tank has specifications of 130 mm diameter, 300 mm length and 1.55 kg weight. The total UAV weight constraint limited the hydrogen tank size because the bigger the hydrogen tank, the more compressed hydrogen will be.
Hydrogen consumption is always a function of the generated fuel cell current. Thus, the lower the fuel cell current, the lower the hydrogen consumption and a higher endurance is achieved. The resulted fuel cell current value is the lowest possible operational value in both cases. Motor index chosen for both cases is the same due its lower Kv compared to other motors indices. A motor with low Kv produces lower rotational speed than a high Kv motor at the same voltage. In order to compensate for that, a propeller with bigger diameter relatively is required. Hence, the resulted propeller indices for both scenarios are relatively high especially in the first scenario where higher thrust is required.
Other performance parameters are listed in Table 8. Power produced in the second scenario is higher than the first one. This is because the rotational speed in the second scenario is higher. As a result, the hydrogen flow rate in the second scenario is higher as well. Finally, the coefficients of lift and drag for the first scenario are higher than the second scenario. This is due to the fact that angle of attack that produces the longest flight endurance is higher than the angle of attack that produces the maximum flight range.
5. Results’ Validation and Discussion
5.1. Wind Tunnel Tests
To validate the optimization tool results, a wind tunnel experimental setup was developed in an open circuit low speed wind tunnel that has a cross section of 90 by 72 cm and a maximum airspeed of 40 m/s as shown in Figure 16. The test stand is composed of a load cell that measures thrust force produced by the propeller. Power source used is the Aeropack fuel cell that can supply up to 200 W. Hydrogen tank chosen was ultra-weight carbon fiber 1.25 L that includes high purity compressed hydrogen with a two step down pressure regulators.
Selected propeller was 16 by 11 inches and electric motor Hacker C50 15 XL electric motor with kv equals to 173 RPM/volt. The chosen propeller and motor were available in the lab and has the closest performance characteristics to those resulted from the optimization scheme.
Calibrated instruments and their accuracies used in the experimental setup are described in Table 9. Uncertainty analysis was conducted for all measured and calculated variables using the Kline-McClintok method explained in [35] as follows:
where R is the result, is the uncertainty result, are the dependent variables and are the associated uncertainty of those variables. Experiments were conducted in a lab environment and under conditions where the airspeed equals 16 m/s in which the used fuel cell input current and voltage values are obtained from optimization scheme results.
Table 10 compares results obtained from optimization techniques and those obtained from experiments. All obtained results are acceptable with error range less 10%. The least error is in the thrust required while the maximum is in the propeller advance ratio. This due the fact that cruise velocity contributes to the advance ratio with a factor of 2. That is the double. Propeller model that uses a slow factor proofed to be a very good choice when designing a small UAV. In addition, fuel cell model that depends on the polarization curve had also showed a good agreement with the experimental results.
Fuel cell electrical DC output power was measured to be 96.31 W. The fuel cell used 4.87 W as the feedback power for the FC microcontrollers and small DC motor. The electric input motor was 91.44 W. The motor produced a net mechanical power as a rotational speed equals to 81.28 W. This represents a 10.15 W losses due speed controller and motor internal resistance. Propeller output power as a propulsive power was measured to be 74.58 W with 6.71 W losses. System total utilization of power is 77.43% taking into consideration the fuel cell as input power and propeller propulsive power as output power. The power utilization is considered to be high with compared to other propulsion systems.
5.2. HiL Simulation Test
It was decided to perform a complete HiL simulation test to validate the flight endurance obtained from optimization before building the demonstration aircraft. The PEMFC is considered as a very expensive component that should be treated carefully. Performing a HiL simulation test would allow to better study the propulsion system behavior especially the fuel cell behavior during the entire flight without the need to perform a real flight test. The HiL test is provided with transitional hard stops and fail-safes to avoid system failure or components damage.
HiL simulation consists of three main components; hardware simulation, software simulation and interface components. The design of HiL simulation requires a tradeoff between the hardware components and software components.
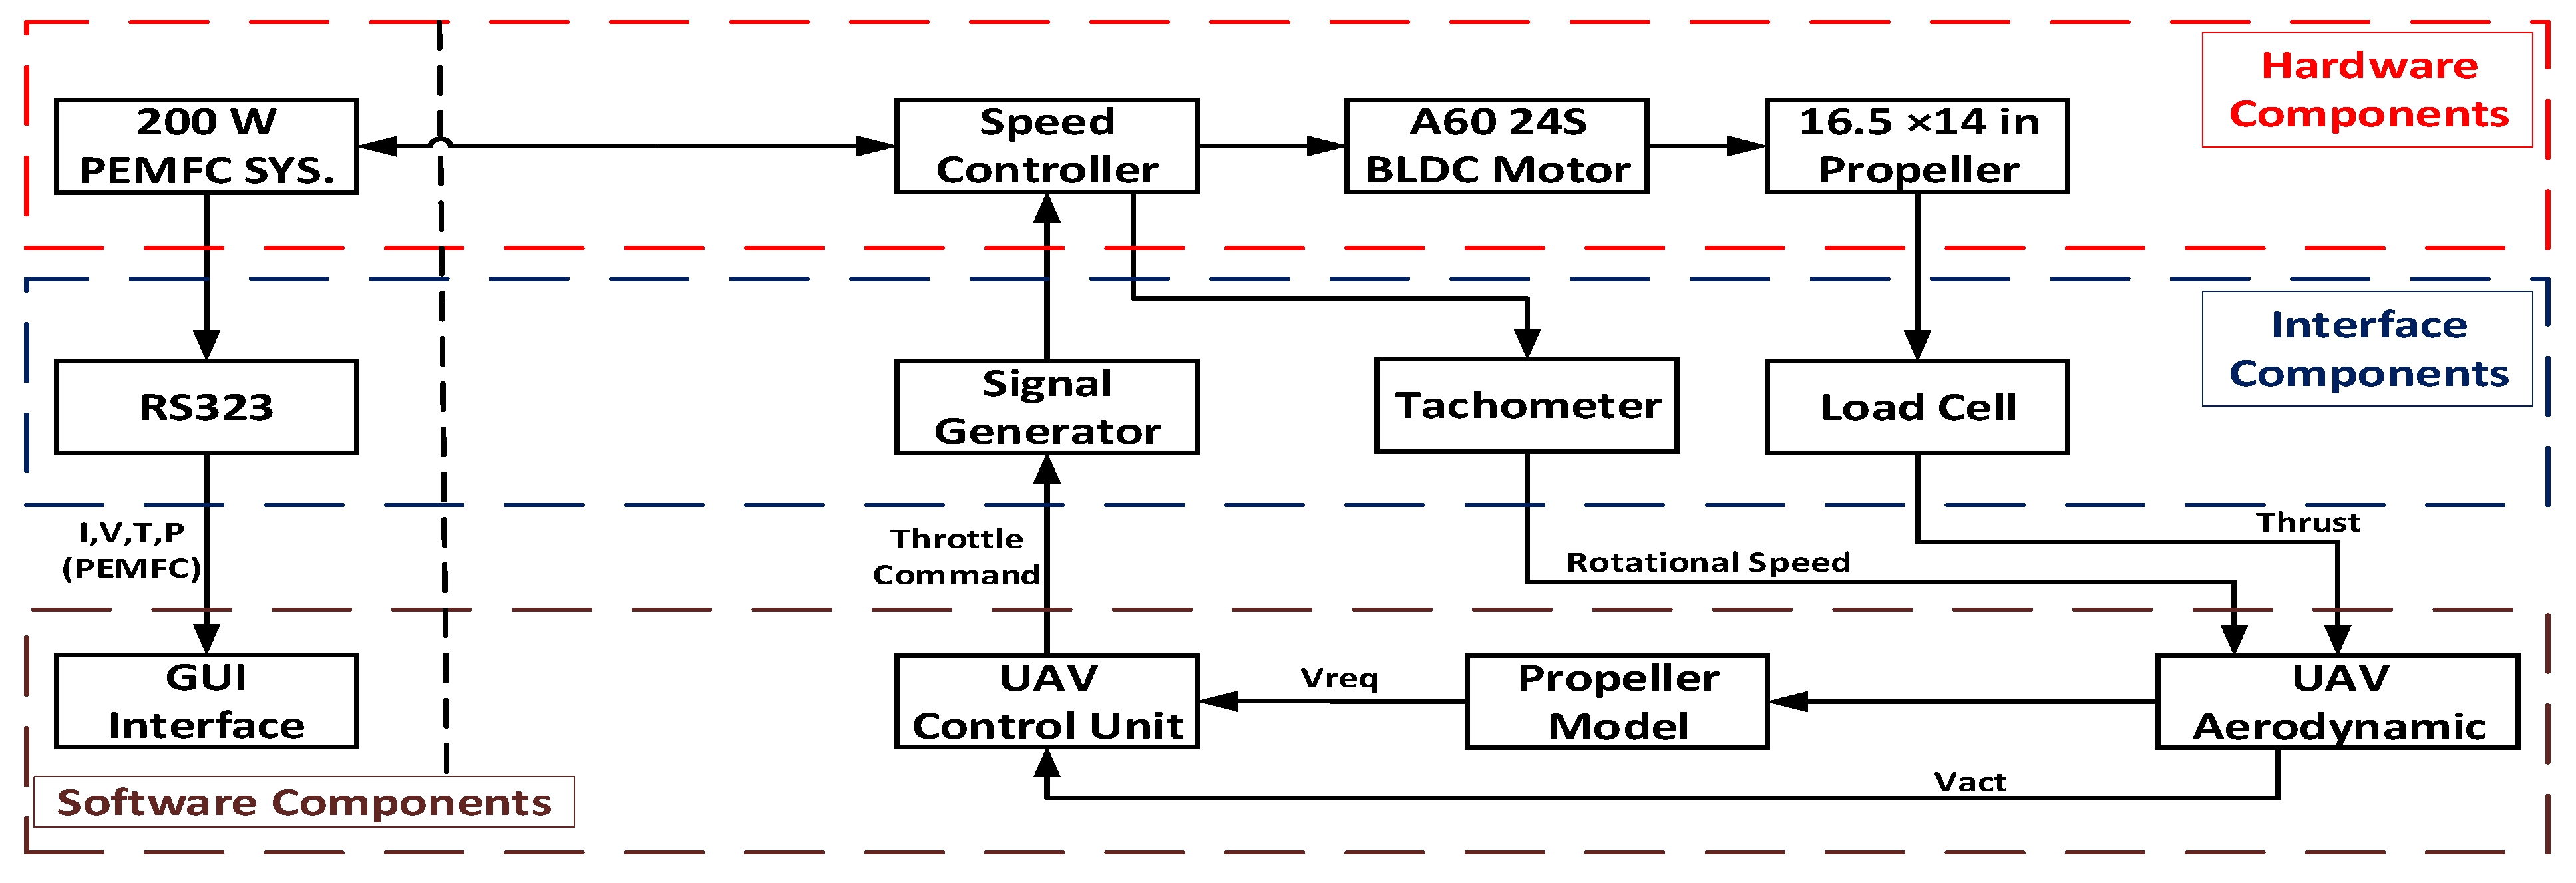
The proposed design is shown in Figure 17. The hardware simulation includes the 200 W Horizon Aeropack PEMFC system (Horizon, Singapore), compressed hydrogen supplied from ultra-weight carbon fiber tank with 3.0 L high purity hydrogen content, a Hacker BLDC motor model number A60 24S (Hacker Motor GmbH, Ergolding, Germany) with a voltage constant of 200 RPM/V and 16.5 × 14 inch propeller supplied by APC (APC, Woodland, CA, USA). The software simulation includes the aircraft aerodynamics, UAV control unit and the propeller model. Interface components regulate and monitor the hardware components and feed the inputs to the software simulation and delivers throttle command to the electric motor.
The PEMFC stack supplies the required electrical power to rotate the electric motor shaft via a DC electrical bus connection between the PEMFC and BLDC motor. The shaft rotates causing the propeller to prop with a specific rotational speed controlled by the speed controller which in turns receives a throttle command from the UAV control unit via signal generator. Generated thrust values are passed to the aircraft model to calculate the actual drag and lift forces and actual airspeed velocity with the angle of attack being defined previously. In addition, the propeller model calculates the coefficient of thrust and the corresponding thrust required which is used to obtain the required velocity. Both the actual velocity and required velocity are fed into the UAV control unit. Based on the difference between the actual and required velocities, the velocity hold controller generates a throttle command to the speed controller of the electric motor.
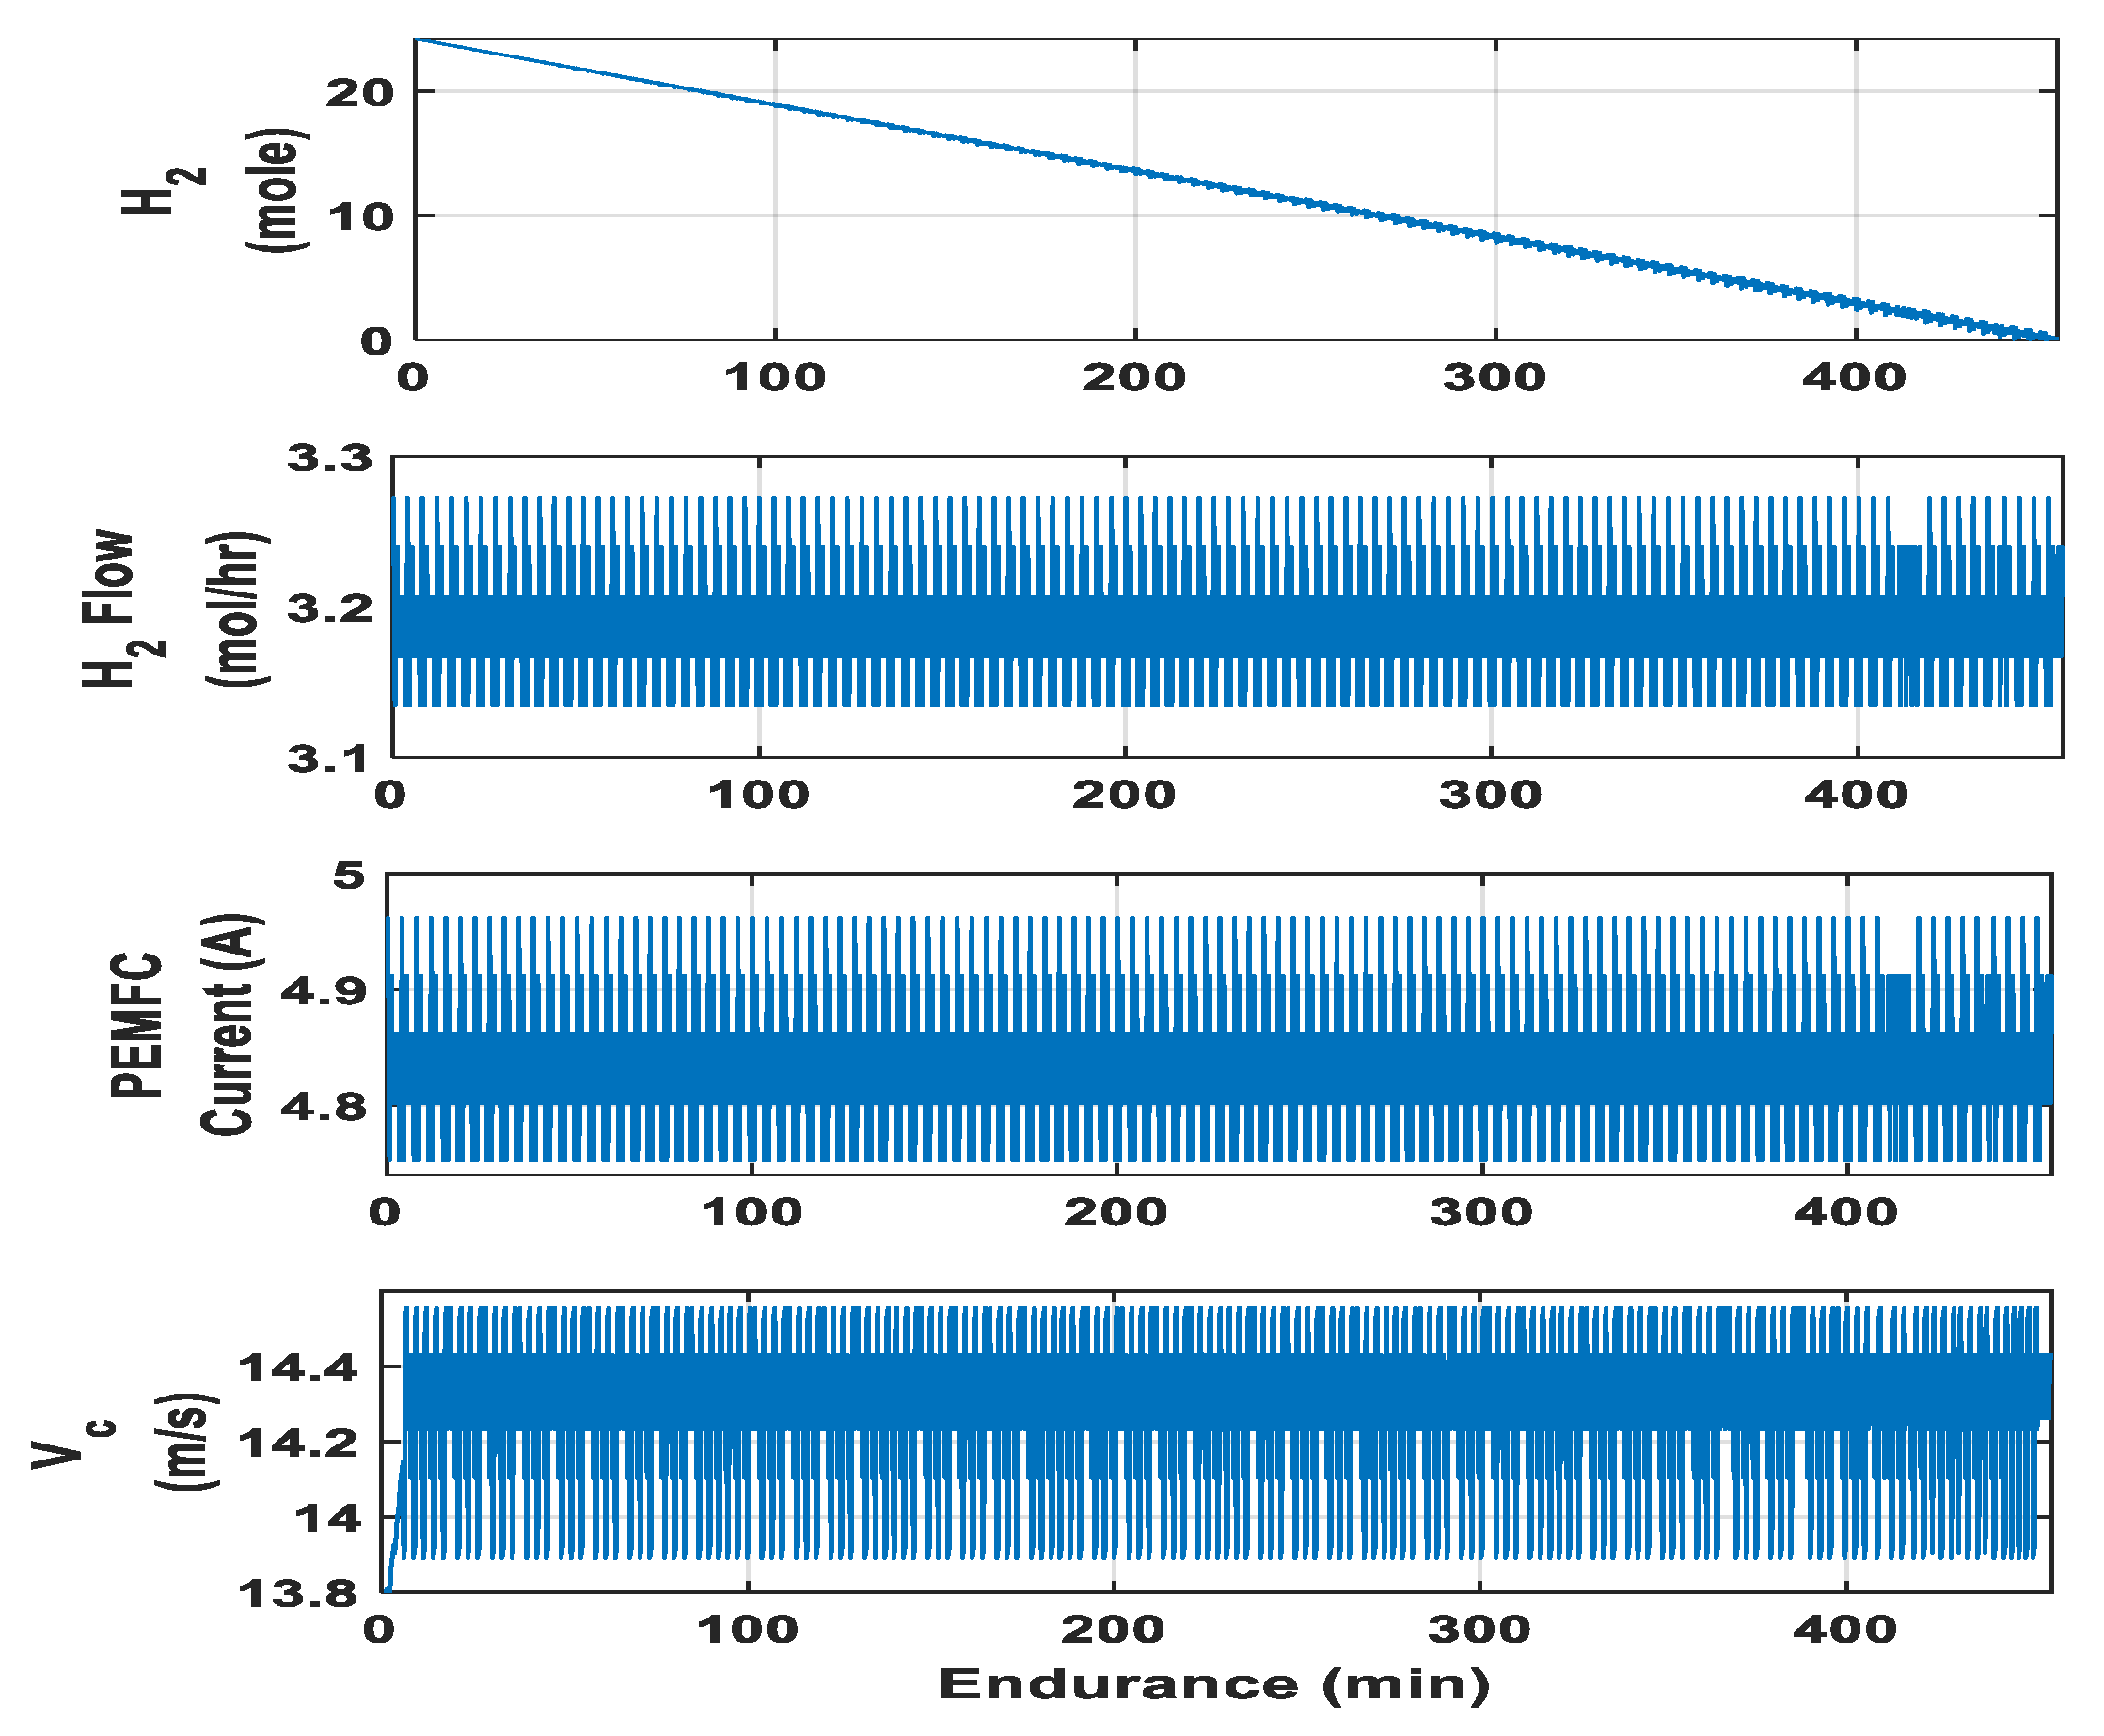
HiL simulation test results are shown in Figure 18. The measured endurance was 458.7 min with 475.3 min obtained from optimization results. The associated error percentage is 3.62% which considered very acceptable. Even though a total hydrogen content of 24.2 mole was included in the hydrogen tank, only 20.88 mole was utilized. As the hydrogen content was decreasing due hydrogen supply to the fuel cell, the hydrogen pressure inside the vessel was decreasing as well. When the hydrogen pressure decreased to less than 0.4 bar which is the required pressure by the fuel cell, the fuel cell suffered difficulties in operation which led to stop the HiL simulation test. The UAV cruise velocity average is 13.25 m/s which is also close to the cruise velocity resulted from optimization.
5.3. Discussion and Comparison of Results
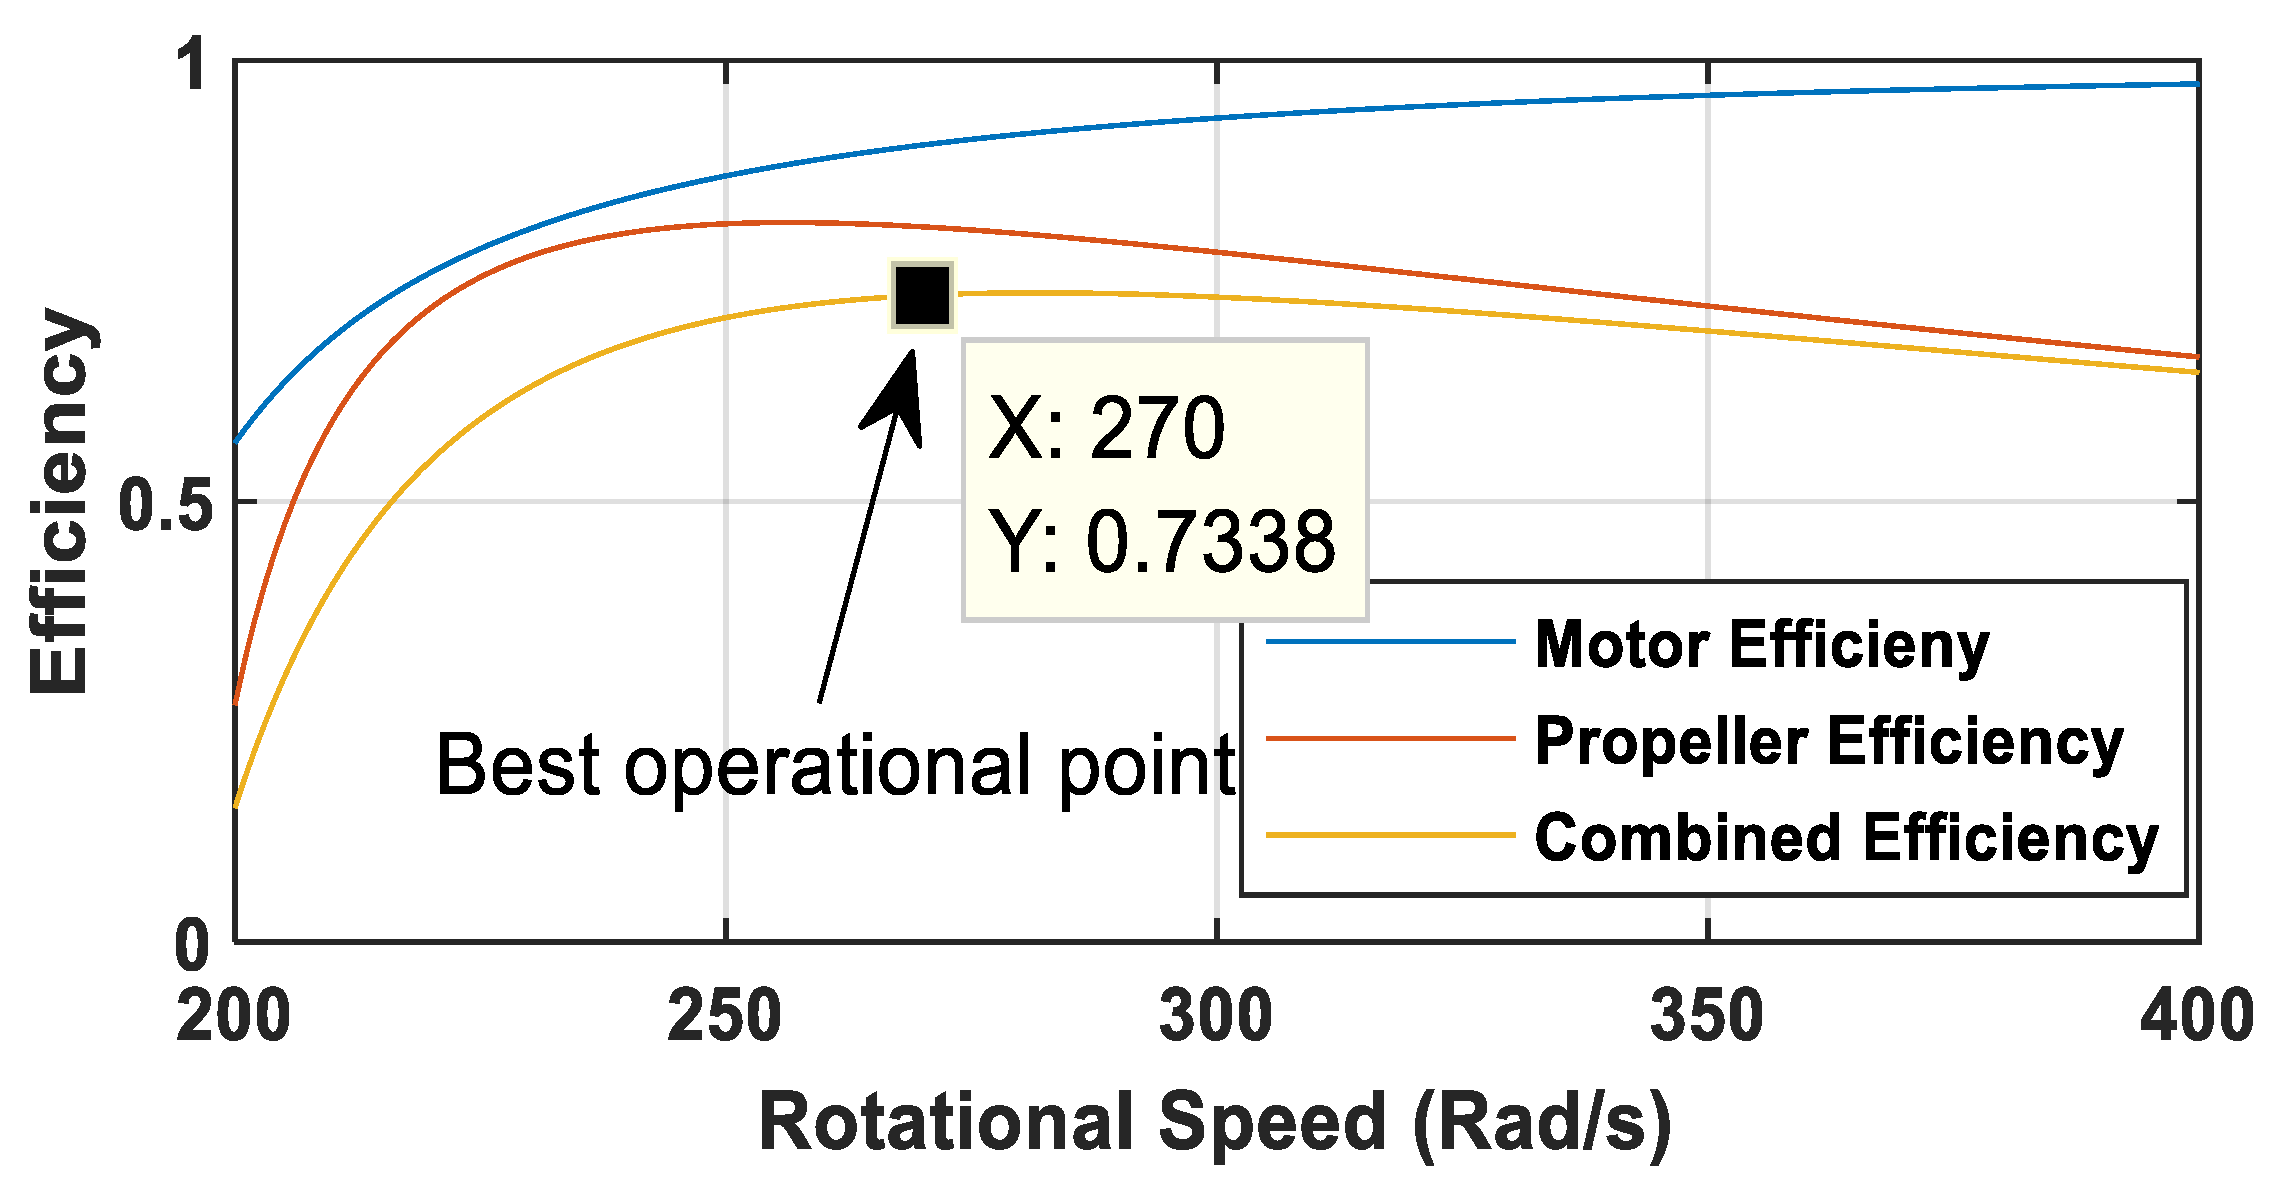
The UAV propulsion system design using the classical approach depends on selecting the propeller-motor combination based on their combined efficiency as shown in Figure 19. The classical approach design resulted in selecting APC propeller of 20 by 13 inch for the Hacker A60 24S motor, the one resulted from optimization. After specifying the operational point, the fuel cell current and voltage is obtained. The calculated endurance for this set of propeller-motor combination is 383 min. This represents a total of 19.4% difference from the endurance resulted from the developed optimization routine.
Going back to Figure 1, the PUMA fuel cell aircraft achieved the maximum endurance for small scale fuel cell powered UAV. The take-off mass ratio to endurance was 20 min/kg. The maximum obtained result from the optimization scheme was 475 min. This represents a ratio of 59 min/kg which is almost three times PUMA’s ratio.
6. Conclusions
In this study, a flexible optimization tool was successfully developed for the design of a hand launched fixed wing fuel cell-powered UAV. The design was decomposed into three levels. In the conceptual design level, the aircraft baseline configuration was defined. While in the preliminary design level, the aircraft design was decomposed into subsystems defined as contributing analyses. For the hydrogen storage vessels, it was found that storing hydrogen in a composite fully wrapped vessels such as carbon-fiber increased the hydrogen content because it has better performance characteristics than other types of tanks in terms of pressure, volume and weight. In addition, a fuel cell model that used polarization curve fit showed acceptable results in terms of obtaining the required voltage and current. A propeller model that includes the effect of propeller-fuselage interference showed consistent results. The inclusion of components’ masses in the design process resulted in the increase of the endurance-takeoff mass ratio.
The contributing analyses were combined in a multidisciplinary analysis through a design structure matrix. The developed MDA is considered as a flexible framework scheme for the design of small-scale fuel cell-powered UAVs and can be modified based on the design requirements. The MDA is solved iteratively by setting the non-linear compatibility equations equal to zero. The solver used in the analysis was “fsolve” function in Matlab that uses the trust region dogleg method for solving nonlinear systems.
In the detailed design process, an optimization tool for the design of the UAV powertrain was developed and analyzed. The optimization technique used was genetic algorithm in which hydrogen tank, motor and propeller combinations were varied until an optimal solution was defined. The genetic algorithm is considered to be a very good choice to such design processes because it has flexibility in defining many near optimal designs. Results showed that the lower the fuel cell current, the better aircraft endurance is achieved. In addition, a motor-propeller combination in which bigger diameter propeller and lower motor voltage constant proofed to improve the UAV endurance.
The design tool results were verified using a wind tunnel experimental setup and HiL simulation tests. The setup was developed in which it simulated the real flying conditions in terms of air speed velocity, temperature and ambient pressure. The result error margin was less than 10% showing the optimization results and experimental results were consistent. Further work will include real time flight tests for the aircraft to validate the aerodynamic models.
The measured endurance was 458.7 min as compared with 475.3 min obtained from the optimization results. The associated error percentage is about 3.62% which is considered to be very acceptable for this type of work.
Author Contributions
Conceptualization, Z.O.A. and M.G.; methodology, Z.O.A.; software, Z.O.A.; validation, M.G. and Z.O.A.; formal analysis, Z.O.A.; investigation, Z.O.A.; resources, M.G.; data curation, M.G.; writing—original draft preparation, Z.O.A.; writing—review and editing, M.G.; visualization, M.G.; supervision, M.G.; project administration, M.G.; funding acquisition, M.G. All authors have read and agreed to the published version of the manuscript.
Funding
The American University of Sharjah-Mechanical Engineering Department, funded this research.
Institutional Review Board Statement
Not applicable.
Acknowledgments
We would like to thank Mohamed Zulkefle for his valuable contribution to the work especially his assistance in conducting the wind tunnel tests.
Conflicts of Interest
The authors declare no conflict of interest.
Nomenclature
| zero lift slope for the airfoil, rad−1 | |
| wing span, m | |
| l | total coefficient of drag |
| total coefficient of lift | |
| total coefficient of thrust | |
| horizontal tail coefficient of volume | |
| vertical tail coefficient of volume | |
| specific heat | |
| l | total drag, N |
| l | speed controller duty cycle |
| fuselage diameter, m | |
| propeller diameter, m | |
| single cell output power, W | |
| E | endurance, seconds |
| e | Oswald efficiency |
| tank mounting/bosses/tubing mass fraction | |
| gear ratio | |
| fuel cell system feedback current, A | |
| motor current, A | |
| motor voltage constant, RPM. V−1 | |
| total horizontal tail length, m | |
| total vertical tail length, m | |
| air flow rate, kg/s | |
| hydrogen tank composite overwrap mass, kg | |
| hydrogen tank liner mass, kg | |
| mreg | regulator mass, kg |
| the hydrogen mass, kg | |
| total tank mass, kg | |
| hydrogen flow rate, mole.s−1 | |
| hydrogen consumption, mole | |
| oxygen consumption, mole | |
| number of cells in a PEMFC | |
| n | hydrogen content, mole |
| atmospheric pressure, atm | |
| air ambient pressure, Pa | |
| Pressure after fan, Pa | |
| propeller generated torque, N.m | |
| Rm | winding resistance, ohm |
| speed controller internal resistance | |
| r | cylinder radius, m |
| total area of lifting surface, m2 | |
| horizontal tail Surface area, m2 | |
| vertical tail Surface area, m2 | |
| total cylinder thickness, m | |
| motor output voltage, Volt | |
| fuel cell fan power, W | |
| liner load sharing factor of safety to yield | |
| drag coefficient for motor | |
| motor output torque, N.m | |
| torque of electric origin, N.m | |
| maximum shear stress, N. m2 | |
| fluid kinematic viscosity, m2.s−1 | |
| rotational speed of the propeller, rad.s−1 | |
| Air density at a certain flight altitude, kg.m−3 | |
| fuel cell stack efficiency | |
| efficiency of the electric motor | |
| ηp | propeller efficiency |
| Subscripts | |
| AR | aspect ratio |
| AoA | angle of attack |
| BLDC | brushless direct current motor |
| DSM | design structure matrix |
| HiL | hardware in the loop simulation test |
| MDA | multi-disciplinary analysis |
| MDO | multi-disciplinary design optimization |
| PEMFC | polymer electrolyte membrane fuel cell |
| MUAV | miniature unmanned aerial vehicle |
References
- Szabolcsi, R. Robust Control System Design for Small UAV Using H2-Optimization. Land Forces Acad. Rev. 2018, 23, 151–159. [Google Scholar] [CrossRef] [Green Version]
- Oktay, T.; Konar, M.; Onay, M.; Aydin, M.; Mohamed, M.A. Simultaneous small UAV and autopilot system design. Aircr. Eng. Aerosp. Technol. 2016, 88, 818–834. [Google Scholar] [CrossRef]
- Hannan, M.; Azidin, F.; Mohamed, A. Hybrid electric vehicles and their challenges: A review. Renew. Sustain. Energy Rev. 2014, 29, 135–150. [Google Scholar] [CrossRef]
- Wang, D.; Lv, H.; Wu, J. In-flight initial alignment for small UAV MEMS-based navigation via adaptive unscented Kalman filtering approach. Aerosp. Sci. Technol. 2017, 61, 73–84. [Google Scholar] [CrossRef]
- Jaeger, M.; Adair, D. Conceptual design of a high-endurance hybrid electric unmanned aerial vehicle. Mater. Today Proc. 2017, 4, 4458–4468. [Google Scholar] [CrossRef]
- Sliwinski, J.; Gardi, A.; Marino, M.; Sabatini, R. Hybrid-electric propulsion integration in unmanned aircraft. Energy 2017, 140, 1407–1416. [Google Scholar] [CrossRef]
- Ahn, H.; Ahn, J. Design and Analysis of a Solar-Power Mini-UAV for Extended Endurance at Low Altitude. Int. J. Aeronaut. Space Sci. 2019, 20, 561–569. [Google Scholar] [CrossRef]
- Choi, T.; Soban, D.; Mavris, D. Creation of a Design Framework for All-Electric Aircraft Propulsion Architectures. In Proceedings of the 3rd International Energy Conversion Engineering Conference, AIAA 2005–5549, San Francisco, CA, USA, 15–18 August 2005. [Google Scholar]
- Guerra, M.; Döll, C. Finite Time Tracking Control for a Small UAV Using Input-Output Linearization; IFAC-PapersOnLine: Toulouse, France, 2017; Volume 50, pp. 10280–10286. [Google Scholar] [CrossRef]
- Chianucci, F.; Disperati, L.; Guzzi, D.; Bianchini, D.; Nardino, V.; Lastri, C.; Rindinella, A.; Corona, P. Estimation of canopy attributes in beech forests using true colour digital images from a small fixed-wing UAV. Int. J. Appl. Earth Obs. Geoinf. 2016, 47, 60–68. [Google Scholar] [CrossRef] [Green Version]
- Rhoads, G.; Bradley, T.; Wagner, N.; Taylor, B.; Keen, D. Design and Flight Test Results for a 24 Hour Fuel Cell Unmanned Aerial Vehicle. In Proceedings of the 8th Annual International Energy Conversion Engineering Conference, AIAA 2010-6690, Nashville, TN, USA, 25–28 July 2010. [Google Scholar]
- Swider-Lyons, K.; Stroman, R.; Page, G.; Schuette, M.; Mackrell, J.; Rodgers, J. Hydrogen Fuel Cell Pro-pulsion for Long Endurance Small UAVs. In Proceedings of the AIAA Centennial of Naval Aviation Forum “100 Years of Achievement and Progress”, AIAA 2011-6975, Virginia Beach, VA, USA, 21–22 September 2011. [Google Scholar]
- Lindahl, P.; Moog, E.; Shaw, S.R. Simulation, Design, and Validation of an UAV SOFC Propulsion System. IEEE Trans. Aerosp. Electron. Syst. 2012, 48, 2582–2593. [Google Scholar] [CrossRef]
- Wagner, N.; Boland, S.; Taylor, B.; Keen, D.; Nelson, J.; Bradley, T. Powertrain Design for Hand-Launchable Long Endurance Unmanned Aerial Vehicles. In Proceedings of the 47th AIAA/ASME/SAE/ASEE Joint Propulsion Conference & Exhibit, AIAA 2011-6047, San Diego, CA, USA, 31 July–3 August 2011. [Google Scholar]
- Baldic, J.; Osenar, P.; Lauder, N.; Launie, P. Fuel cell systems for long duration electric UAVs and UGVs. SPIE Def. Secur. Sens. 2010, 7707, 770703. [Google Scholar] [CrossRef]
- Daud, W.; Rosli, R.; Majlan, E.; Hamid, S.; Mohamed, R.; Husaini, T. PEM fuel cell system control: A review. Renew. Energy 2017, 113, 620–638. [Google Scholar] [CrossRef]
- Verstraete, D.; Cazzato, L.; Romeo, G. Preliminary Design of a Fuel Cell Based Hybrid Electrical UAV. In Proceedings of the 28th Congress of the ICAS, Paper ICAS 2012-1.8.2, Brisbane, Australia, 28 September 2012; Available online: https://www.icas.org/ICAS_ARCHIVE/ICAS2012/PAPERS/654.PDF (accessed on 22 January 2021).
- Furrutter, M.K.; Meyer, J. Small fuel cell powering an unmanned aerial vehicle. In Proceedings of the AFRICON 2009, Nairobi, Kenya, 23–25 September 2009; pp. 1–6. [Google Scholar] [CrossRef]
- Lapeña-Rey, N.; Blanco, J.; Ferreyra, E.; Lemus, J.; Pereira, S.; Serrot, E. A fuel cell powered unmanned aerial vehicle for low altitude surveillance missions. Int. J. Hydrog. Energy 2017, 42, 6926–6940. [Google Scholar] [CrossRef]
- Moffitt, B.; Bradley, T.; Mavris, D.; Parekh, D. Design Space Exploration of Small-Scale PEM Fuel Cell Long Endurance Aircraft. In Proceedings of the 6th AIAA Aviation Technology, Integration and Operations Conference (ATIO), AIAA 2006-7701, Wichita, KS, USA, 27 September 2006. [Google Scholar]
- Raymer, D. Aircraft Design, 4th ed.; AIAA: Washington, DC, USA, 2006; pp. 369–373. [Google Scholar]
- Khandelwal, B.; Karakurt, A.; Sekaran, P.R.; Sethi, V.; Singh, R. Hydrogen powered aircraft: The future of air transport. Prog. Aerosp. Sci. 2013, 60, 45–59. [Google Scholar] [CrossRef]
- Kulkarni, S.V.; Zweben, C.H. Composites in Pressure Vessels and Piping, Presented at the Energy Technology Conference; ASME: Houston, TX, USA, 1977. [Google Scholar]
- Nisbett, J.K.; Budynas, R.G. Shigley’s Mechanical Engineering Design, 7th ed.; McGraw-Hill: New York, NY, USA; pp. 593–598.
- MacQuarrie, D.A.; Simon, J.D. Physical Chemistry: A Molecular Approach, 2nd ed.; University Science Books: Sausalito, CA, USA, 1997; pp. 328–329. [Google Scholar]
- Bayrak, Z.U.; Kaya, U.; Oksuztepe, E. Investigation of PEMFC performance for cruising hybrid powered fixed-wing electric UAV in different temperatures. Int. J. Hydrog. Energy 2020, 45, 7036–7045. [Google Scholar] [CrossRef]
- Barbir, F. PEM Fuel Cells Theory and Practice, 2nd ed.; Elsevier: Boston, MA, USA, 2014; pp. 159–161. [Google Scholar]
- Hauer, K.H. Analysis Tool for Fuel Cell Vehicle Hardware and Software (Controls) with an Application to Fuel Economy Comparisons of Alternative System Designs. Ph.D. Thesis, University of California, Davis, CA, USA, 2001. [Google Scholar]
- Gupta, R.B. Hydrogen Fuel Production Transport and Storage, 1st ed.; CRC Press: Boca Raton, FL, USA, 2009. [Google Scholar]
- Ogasawara, S.; Akagi, H. An approach to position sensorless drive for brushless DC motors. IEEE Trans. Ind. Appl. 1991, 27, 928–933. [Google Scholar] [CrossRef]
- Yedamale, P. Brushless DC (BLDC) Motor Fundamentals, 3rd ed.; Microchip Technologies: Chandler, AZ, USA, 2003; pp. 15–18. [Google Scholar]
- Toliyat, H.; Kliman, G. Handbook of Electric Motors, 3rd ed.; Taylor & Francis: New York, NY, USA, 2004; pp. 115–118. [Google Scholar]
- Phillips, W. Mechanics of Flight, 1st ed.; John Wily & Sons: Hoboken, NJ, USA, 2004; pp. 165–168. [Google Scholar]
- Moffitt, B.; Bradley, T.; Parekh, D.; Mavris, D. Validation of Vortex Propeller Theory for UAV Design with Uncertainty Analysis. In Proceedings of the 46th AIAA Aerospace Sciences Meeting and Exhibit, AIAA 2008-406, Reno, Nevada, USA, 10 January 2008. [Google Scholar]
- Jin, K.; Ruan, X.; Yang, M.; Xu, M. A Hybrid Fuel Cell Power System. IEEE Trans. Ind. Electron. 2008, 56, 1212–1222. [Google Scholar] [CrossRef]
- Lowry, J.T. The Bootstrap Approach to Aircraft Performance (Part Two—Constant-Speed Propeller Airplanes). Available online: https://www.avweb.com/features_old/the-bootstrap-approach-to-aircraft-performancepart-two-constant-speed-propeller-airplanes/ (accessed on 30 January 2021).
- Anderson, J.D.; Hunter, L.P. Introduction to Flight. Phys. Today 1987, 40, 125. [Google Scholar] [CrossRef] [Green Version]
- Lagorse, J.; Paire, D.; Miraoui, A. Sizing optimization of a stand-alone street lighting system powered by a hybrid system using fuel cell, PV and battery. Renew. Energy 2009, 34, 683–691. [Google Scholar] [CrossRef]
- Maheri, A.; Noroozi, S.; Vinney, J. Application of combined analytical/FEA coupled aero-structure simulation in design of wind turbine adaptive blades. Renew. Energy 2007, 32, 2011–2018. [Google Scholar] [CrossRef]
- Dawoud, S.M.; Lin, X.; Okba, M.I. Hybrid renewable microgrid optimization techniques: A review. Renew. Sustain. Energy Rev. 2018, 82, 2039–2052. [Google Scholar] [CrossRef]
- Dufo-López, R.; Bernal-Agustín, J.L. Design and control strategies of PV-Diesel systems using genetic algorithms. Sol. Energy 2005, 79, 33–46. [Google Scholar] [CrossRef]
Figure 1.
Endurance (min) vs. Take-Off Mass (g) for Most Popular MUAVs.

Figure 2.
Design Process for Long Endurance Aircraft Mission.

Figure 3.
Parametric Study for UAV Cruise Speed versus: (a) Coefficient of Lift. (b) UAV Weight. (c) Coefficient of Drag (d) Wing Surface Area.
Figure 3.
Parametric Study for UAV Cruise Speed versus: (a) Coefficient of Lift. (b) UAV Weight. (c) Coefficient of Drag (d) Wing Surface Area.

Figure 4.
Polarization Curve for Aeropack Fuel Cell of 200 W.

Figure 5.
Hydrogen Supply Subsystem Schematic.

Figure 6.
Slowdown Factor Based on Lawry Approach [35].
Figure 6.
Slowdown Factor Based on Lawry Approach [35].

Figure 7.
Proposed UAV Simulation Using XFLR5 at Re 400000.

Figure 8.
Effect of Airfoil Variation on: (a) CL for the Proposed UAV (b) Drag Polar for the Proposed UAV (c) on CL/CD for the Proposed UAV (d) CL(3/2)/CD for the Proposed UAV.
Figure 8.
Effect of Airfoil Variation on: (a) CL for the Proposed UAV (b) Drag Polar for the Proposed UAV (c) on CL/CD for the Proposed UAV (d) CL(3/2)/CD for the Proposed UAV.

Figure 9.
Aircraft Mass Breakdown.

Figure 10.
Common DSM Used in Aircraft Design.

Figure 11.
Developed MDA for Endurance at Steady Flight Level.

Figure 12.
General Flow Chart for GA.

Figure 13.
Optimization Scheme for Steady Level Flight Mission.

Figure 14.
Evolution History for the Optimization Process for Maximum Endurance.

Figure 15.
Evolution History for the Optimization Process for Maximum Range.

Figure 16.
Pictorial view of the wind tunnel experimental setup: (a) Internally. (b) Externally.

Figure 17.
Schematic of the HiL simulation.

Figure 18.
HiL simulation test results.

Figure 19.
Classical Approach Methodology.


Table 1.
Matrix of Alternatives for Aircraft Conceptual Design.
| Attribute | Alt1 | Alt2 | Alt3 |
|---|---|---|---|
| Vehicle | conventional | flying wing | canard |
| Wing Position | low | Mid | High |
| Planform | Straight | Tapered | Elliptical |
| Aspect Ratio | low | Mid | High |
| Tail | Conventional | T-tail | V-tail |
| Fuselage | Cylindrical | Elliptical | |
| Prop Position | Pusher | Tractor | |
| Structure | Wood | Composite | Combination |
| Landing gear | Fixed | Retractable | None |
| Hydrogen Storage | Chemical Hydride | Carbon Fiber Tank | Aluminum Composite tank |
Bold: It represents the selected choice from other alternative options.
Table 2.
Wing Geometry Specifications.
| Design Variable | Value | Unit |
|---|---|---|
| Wing Loading | 7.5 | Kg/m2 |
| Wing Area | 0.9 | m2 |
| Wing Span | 3 | m |
| Aspect Ratio | 10 | - |
| Taper Ratio | 1 | - |
| Root chord, Tip chord | 0.3 | m |
| Mean aerodynamic chord | 0.3 | m |
| Dihedral angle | 2 | degrees |
Table 3.
Tail Geometry Specifications.
| Vertical Tail | Horizontal Tail | ||
|---|---|---|---|
| Vertical Tail area | 0.06 m2 | Horizontal Tail area | 0.14 m2 |
| Vertical Tail Span | 0.27 m | Horizontal Tail Span | 0.84 m |
| Aspect Ratio Vertical Tail | 5 | Aspect Ratio Horizontal Tail | 5 |
| Taper Ratio | 0.8 | Taper Ratio | 0.7 |
| Tail Volume | 0.02 | Tail Volume | 0.5185 |
| Length from Vertical tail AC to CG | 0.9 m | Length from Horizontal tail AC to C | 1 m |
Table 4.
Fuselage Geometry Specifications.
| Variable | Value (mm) |
|---|---|
| Length | 1750 |
| Max Width and Height | 180 |
| Length/width | 9.722 |
Table 5.
Design Variables Formulation for MDO Analysis.
| Design Variable | Value | Units |
|---|---|---|
| Airfoil index | 1–4 | Unit less |
| Motor index | 1–42 | Unit less |
| Propeller index | 1–57 | Unit less |
| Hydrogen tank diameter Hydrogen tank Length | 0–180 0–350 | mm |
| Gear ratio | 1–10 | Unit less |
| FC Current | 0–13 | A |
Table 6.
Design Parameters Used in the MDO Analysis.
| Design Parameter | Value | Unit |
|---|---|---|
| Altitude | 200 | m |
| Air density | 1.225 | kg/m3 |
| Viscosity | 0.000015 | m3/s |
| Gravity | 9.81 | N/kg |
| Wing surface area | 0.9 | m2 |
| Faraday constant | 26.801 | A.h/mol |
| Ideal gas constant | 8.314472 | J/mol. K |
| Hydrogen utilization | 0.9 | Unit less |
| Air temperature | 298.15 | K |
Table 7.
MDO Results for Steady Level Flight.
| Design Variable | Max Endurance | Max Range | Units/Component |
|---|---|---|---|
| Airfoil index | 3 | 3 | NACA23010 |
| Motor index | 6 | 6 | Unit Less |
| Propeller index | 8 | 6 | Unit less |
| Hydrogen tank index | 8 | 8 | 130 mm × 300 mm |
| Gear ratio | 1 | 1 | Unit less |
| Fuel cell current | 3.66 | 3.46 | A |
| Propeller speed | 299.44 | 333.45 | Rad/s |
| Time | 475.3 | 455.2 | min |
Table 8.
Performance Parameters Resulted from GA MDO Analysis.
| Design Variable | Max Endurance | Max Range | Unit |
|---|---|---|---|
| Propeller diameter | 16.5 | 16 | in |
| Propeller pitch | 14 | 12 | in |
| Propeller advance ratio | 0.669 | 0.739 | - |
| Hydrogen tank diameter | 0.13 | 0.13 | m |
| Hydrogen tank mass | 1.55 | 1.55 | kg |
| Cruise velocity | 13 | 16.3 | m/s |
| Thrust required | 5.23 | 4.55 | N |
| Propeller torque | 0.276 | 0.25 | N.m |
| Aircraft total mass | 7.06 | 7.06 | kg |
| Coefficient of lift | 1.08 | 0.713 | - |
| Coefficient of drag | 0.0568 | 0.0325 | - |
| Angle of attack | 0.192 | 0.122 | Rad |
| Hydrogen content | 20.17 | 20.17 | mole |
| Hydrogen flow rate | 2.546 | 2.66 | mole/hr |
| Propeller efficiency | 84.7% | 87% | - |
| Motor efficiency | 87.5% | 88% | - |
| Fuel cell voltage | 27.48 | 27.35 | V |
| Motor voltage | 14.25 | 16.32 | V |
| Motor current | 5.77 | 2.23 | A |
| Power | 79.74 | 83.34 | W |
Table 9.
Instrument Used in the Experimental Setup.
| Instrument | Type | Measured Quantity | Unit | Accuracy |
|---|---|---|---|---|
| Load Cell | ELFF-T2M-100N from Measurement Specialties | Thrust | N | |
| Pressure Transducer | MPXV7002 MPXA6115A | Dynamic Pressure Ambient absolute Pressure | kPa | |
| Electronic Speed Controller Datalog | Phoenix ICE HV 85 | Rotational Speed | RPM | |
| Power supply Ammeter | DT9205A | Current | A | |
| Power Supply Voltmeter | DT9205A | Voltage | V | |
| Thermocouple | ES545892 | Temperature | Celsius | |
| RS-232 cable | 19,200, 8 bit, parity-none, 1 stop bit | Hydrogen Flow Rate, output power | L/min W | - |
Table 10.
Comparison of Optimization Results and Wind Tunnel Test Results.
| Parameter | Optimization | Experiment | |
|---|---|---|---|
| Fuel Cell Current (A) | 3.46 | 3.51 | 1.425 |
| Propeller Speed (Rad/s) | 333.45 | 325.28 | 2.5 |
| Ct | 0.0510 | 0.0522 | 2.3 |
| J | 0.739 | 0.813 | 9.1 |
| Cruise Velocity (m/s) | 16 | 17.18 | 6.432 |
| Thrust Required (N) | 4.55 | 4.583 | 0.72 |
| Hydrogen flow rate (mole/h) | 2.66 | 2.83 | 6.01 |
| Fuel Cell Voltage (V) | 27.35 | 27.55 | 0.726 |
| Power (W) | 83.34 | 81.28 | 1.08 |
Publisher’s Note: MDPI stays neutral with regard to jurisdictional claims in published maps and institutional affiliations. |
© 2021 by the authors. Licensee MDPI, Basel, Switzerland. This article is an open access article distributed under the terms and conditions of the Creative Commons Attribution (CC BY) license (https://creativecommons.org/licenses/by/4.0/).
Share and Cite
MDPI and ACS Style
Alrayes, Z.O.; Gadalla, M. Development of a Flexible Framework Multi-Design Optimization Scheme for a Hand Launched Fuel Cell-Powered UAV. Energies 2021, 14, 2951. https://0-doi-org.brum.beds.ac.uk/10.3390/en14102951
AMA Style
Alrayes ZO, Gadalla M. Development of a Flexible Framework Multi-Design Optimization Scheme for a Hand Launched Fuel Cell-Powered UAV. Energies. 2021; 14(10):2951. https://0-doi-org.brum.beds.ac.uk/10.3390/en14102951
Chicago/Turabian StyleAlrayes, Zaid O., and Mohamed Gadalla. 2021. "Development of a Flexible Framework Multi-Design Optimization Scheme for a Hand Launched Fuel Cell-Powered UAV" Energies 14, no. 10: 2951. https://0-doi-org.brum.beds.ac.uk/10.3390/en14102951
Note that from the first issue of 2016, this journal uses article numbers instead of page numbers. See further details here.