Article

Mass Transport Limitations of Water Evaporation in Polymer Electrolyte Fuel Cell Gas Diffusion Layers

1
Electrochemistry Laboratory, Paul Scherrer Institut (PSI), CH-5232 Villigen, Switzerland
2
Institute of Computational Physics (ICP), Zurich University of Applied Sciences (ZHAW), CH-8401 Winterthur, Switzerland
3
Laboratory of Physical Chemistry, ETH Zürich, CH-8093 Zürich, Switzerland
*
Author to whom correspondence should be addressed.
Submission received: 9 April 2021 / Revised: 14 May 2021 / Accepted: 16 May 2021 / Published: 20 May 2021
(This article belongs to the Special Issue Design, Modeling, and Optimization of Novel Fuel Cell Systems)

Abstract

:
Facilitating the proper handling of water is one of the main challenges to overcome when trying to improve fuel cell performance. Specifically, enhanced removal of liquid water from the porous gas diffusion layers (GDLs) holds a lot of potential, but has proven to be non-trivial. A main contributor to this removal process is the gaseous transport of water following evaporation inside the GDL or catalyst layer domain. Vapor transport is desired over liquid removal, as the liquid water takes up pore space otherwise available for reactant gas supply to the catalytically active sites and opens up the possibility to remove the waste heat of the cell by evaporative cooling concepts. To better understand evaporative water removal from fuel cells and facilitate the evaporative cooling concept developed at the Paul Scherrer Institute, the effect of gas speed (0.5–10 m/s), temperature (30–60 °C), and evaporation domain (0.8–10 mm) on the evaporation rate of water from a GDL (TGP-H-120, 10 wt% PTFE) has been investigated using an ex situ approach, combined with X-ray tomographic microscopy. An along-the-channel model showed good agreement with the measured values and was used to extrapolate the differential approach to larger domains and to investigate parameter variations that were not covered experimentally.

1. Introduction

During polymer electrolyte fuel cell (PEFC) operation, water is generated as a by-product of the electrochemical reaction. This water, besides being absorbed by the proton conductive membrane and evaporating on the anode [1,2], commonly leaves the PEFC cathode either in liquid or gaseous form through the gas channels in the cathode side of the bipolar plates [3,4]. The transport path for either gas or liquid water removal is the same, with both having to progress from the cathode catalyst layer (CL) through a fibrous gas diffusion layer (GDL) to the gas channels. In PEFCs, besides distributing the reactant gases, the GDL provides electrical conductivity between the CL and the bipolar plates, conducts heat away from the CL, and serves as mechanical support to the membrane [5,6,7,8]. In the case of gaseous removal of water, evaporation might occur in the CL or the GDL structure and is followed by Fickian diffusion through the GDL’s pore spaces to the gas channel [9]. For liquid removal, product water accumulations in the GDL eventually grow so large in size that they break through into the gas channel where the formed droplets are carried away by the gas flow [10,11,12,13,14,15]. This mechanism of water accumulation and subsequent growth of clusters has the undesired side effect of blocking the pore space, which should be avoided in order to maintain undisturbed supply of reactant gas to the active sites in the CL [16,17]. It is thus desirable to transport as much water as possible out of the cell in vapor form, minimizing the accumulation of liquid water.
A novel cooling strategy developed at the Paul Scherrer Institute aims to use patterned wettability GDLs to remove heat through the phase change from liquid to vapor [18,19,20]. The artificial distribution of hydrophobic and hydrophilic GDL domains enables tailor-made patterns of water filled lines with high levels of evaporation rates and necessitates a good understanding of the vapor removal mechanisms, ultimately limiting the rate of evaporation. Understanding the characteristic mechanisms and limitations to evaporative water removal in the framework of PEFCs and quantifying them has been the aim of many scientific works, both experimentally [21,22,23,24,25] and numerically [26,27,28,29,30,31,32]. However, the reported evaporation values show a wide spread [31,33] and some measurements performed on differential cell scales leave open questions of how evaporative flux scales with GDL thickness and gas type are used in the evaporation rate measurements, as reported by Lal et al. [21]. They observed that doubling the diffusive distance did not halve the diffusive flux, as was expected under differential conditions, while the evaporation increase due to changing from nitrogen to hydrogen in the gas channel fell short of the theoretical effect the increased diffusivity should have. Boundary effects, caused by the differential cell approach with very small evaporative domains, could be a potential origin of these inconsistencies. They can lead to large deviations when upscaling to larger domains or even make it impossible to do so, also because accumulations of water vapor in the gas stream can become decisive or invalidate the assumption of differential operation.
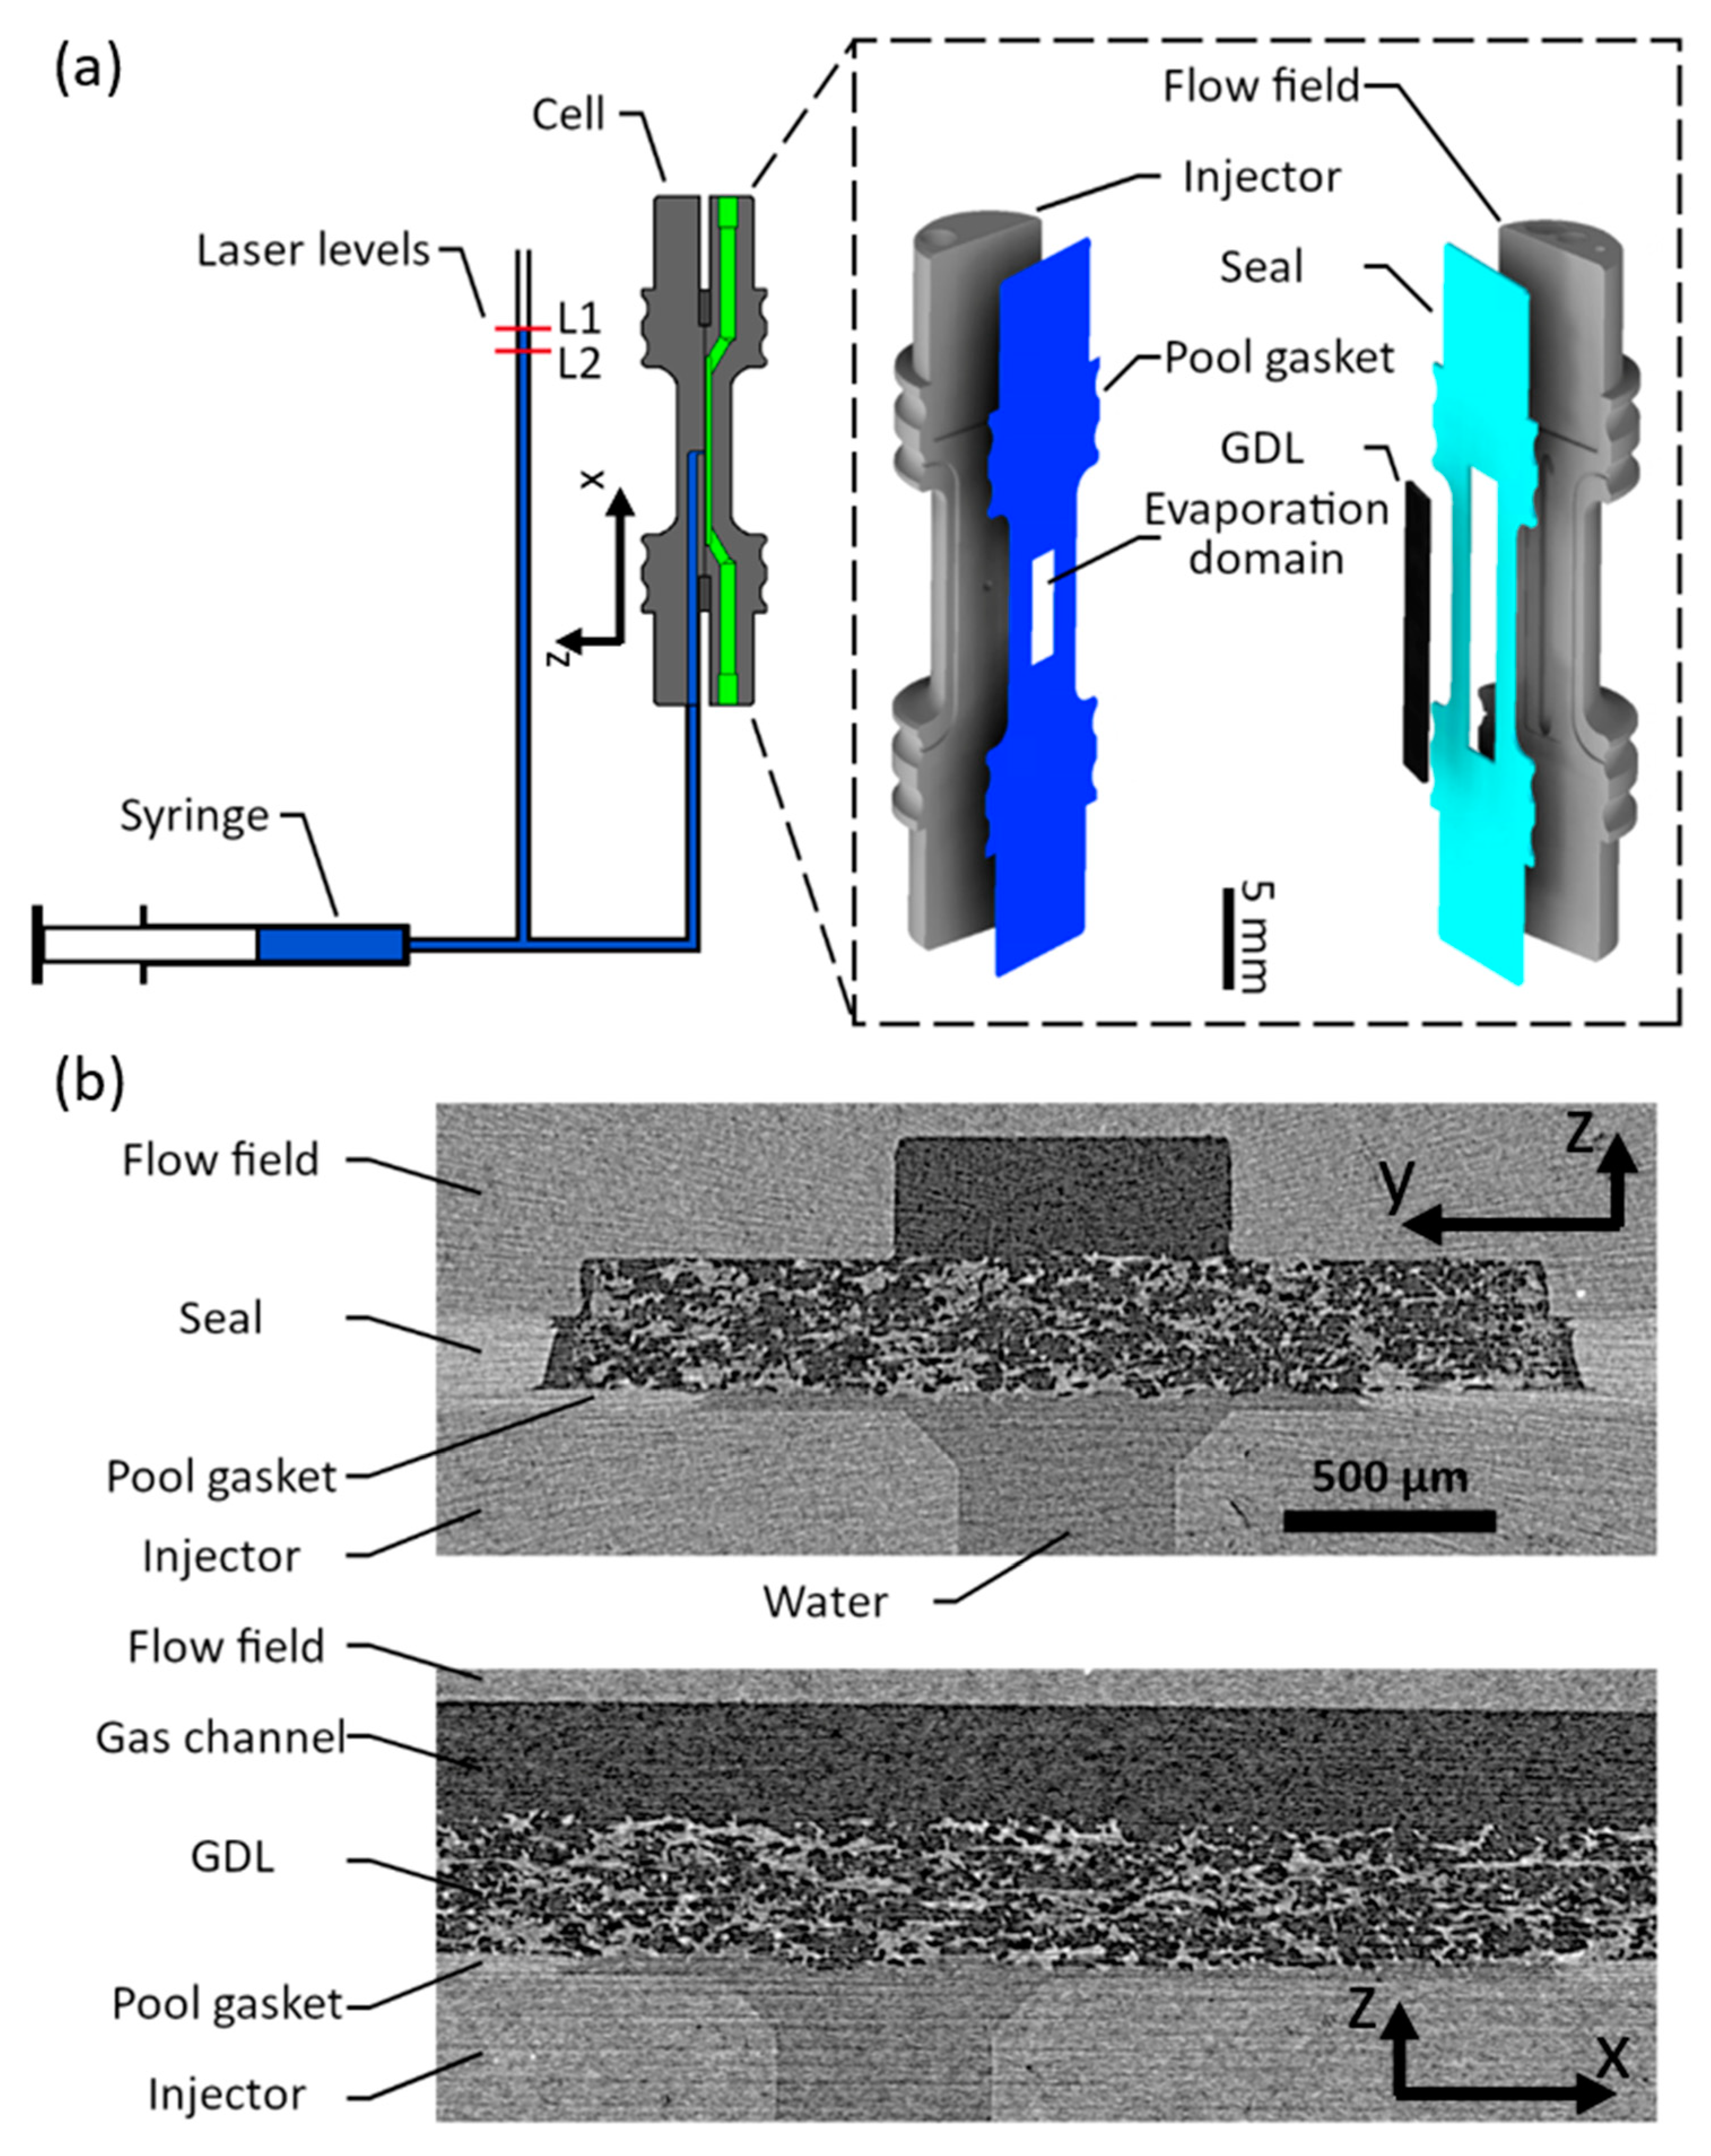
Hence, in this study, we perform direct evaporation rate measurements from a differential ex situ cell, imitating a fuel cell GDL and gas channel. To control all relevant boundary conditions during the experiment and ensure comparability between multiple runs, liquid water was prevented from entering the GDL domain, resulting in pure diffusive transport and avoiding sample specific water cluster formations. The goal of this study is to quantify evaporative water removal for differently sized evaporative domains and help unify the available literature results. In addition to the presented experimental results, a numerical 2D model was applied. It accounts for diffusion in the GDL domain and combined convective and diffusive transport in the gas channel to provide further insights into the governing processes and phenomena. Spatially resolved information of the distribution of the water vapor concentration profiles deepens the understanding of water evaporation and helps explain the experimentally observed trends. Moreover, the modelling work allows extrapolations to larger domains and to compare the differential cell results to evaporation rates determined in larger cells.

2. Materials and Methods

The experiments were designed to emulate evaporative water removal from a saturated catalyst layer through the GDL into a gas channel and investigate the effects of temperature, gas flow, and evaporation domain size on the evaporation rates. An ex situ cell design [11,34] (Figure 1a) was chosen to assure controllability of the boundary conditions and compatibility with X-ray tomographic microscopy (XTM), which is commonly used to determine the distribution of water inside fuel cell GDLs [22,23,34,35,36,37,38,39]. The configuration of water and GDL during the evaporation measurement can be seen in the XTM images in Figure 1b.

2.1. Materials and Setup

The GDL, a TGP-H 120 10 wt% PTFE (Toray Industries, Inc., Tokyo, Japan) with a nominal thickness of 370 µm and an average porosity of 78%, was placed in the cell, consisting of a flow field and an injector, both made from graphite (BMA5, Eisenhuth GmbH & Co. KG, Osterode am Harz, Germany). This GDL was chosen to keep overall evaporative fluxes moderate to avoid thermal gradients as much as possible. The onset of thermal limitations was observed for thinner GDLs at 80 °C in a similar setup [21]. A seal was placed around the GDL, preventing leakage of vapor and controlling the GDL compression. The seal is made up of a 160 µm PTFE and a 25 µm FEP foil. In combination with a 125 µm groove in the flow field, this resulted in a compressed GDL thickness of 310 µm and a compression of 16%. The flow field simulates a gas channel (width 800 µm, depth 300 µm) of a fuel cell, while the injector is used to supply the water to the base of the GDL via a small hole. Both the injector and the flow field can be heated using resistive heating pouches and their temperature monitored with temperature sensors (PT100).
To define the evaporation domain, a hydrophobic FEP foil with a rectangular cutout was used. The foil contained water in the rectangular cutout and prevented uncontrolled spreading of the water underneath the GDL. This way, a well-defined evaporation domain was created with a predictable geometrical water surface area. The evaporation domains realized in this study all had a width of 1.6 mm and varying length along the channel between 0.8 and 10 mm. Note that, to change the size of the evaporation domain, a new cell had to be assembled with a new GDL, seal, and gaskets.
The evaporation domain was filled with deionized water using an external syringe pump (Legato® 110, KD Scientific Inc., Holliston, MA, USA) to a pressure pw, which was controlled using a laser level sensor (L1) placed on a riser column. Every centimeter of water in the column above the evaporation domain in the cell resulted in an increase in water pressure of 1 mbar. For the experiments in this study, L1 was set to 5 mbar (5 cm) to obtain good filling of the evaporation domain without penetration of water into the bulk of the GDL. Preventing the water from advancing into the GDL ensured that the geometrical distance from the waterfront to the gas channel was even, reproducible, and defined only by the compressed GDL thickness.
X-ray tomographic microscopy in a CT scanner (Nanotom, GE Sensing & Inspection, Wunstorf, Germany) was employed to verify proper filling of the evaporation domain with water. Additionally, it enabled the validation of the level of compression of the GDLs in the cells and confirmed that the water did not extend into the GDL domain. An example of this can be seen in Figure 1b, showing the water in the evaporation domain of the pool gasket and following the contour of the GDL without penetration. The average vertical distance from the waterfront to the gas channel was confirmed using this method and found to be 310 µm.
The gas flowing through the channel in the flow field was dry nitrogen at the respective cell temperature with velocities between 0.5 m/s and 10 m/s. These velocities span flow rates commonly encountered in air fed cathode gas channels of large cells as well as high velocities of interest for evaporative cooling. The flow rate was controlled by a mass flow controller (F-201CV-500-AAD-33-V, Bronkhorst, AK Ruurlo, The Netherlands) at 25 °C in accordance with the experimental parameters in Table 1. For comparability, all flow rates reported in this study refer to the dry gas flow rate at 25 °C, before being heated and guided into the cell.

2.2. Measurement Procedure

At the start of each measurement, water was injected into the system until the water level in the riser reached L1 (Figure 1a), at which point the injection was stopped. Owing to the presence of evaporation in the cell, the water volume in the system then started to decrease, resulting in a drop of the water level in the riser. The time ( t L 1 L 2 ) it took for the water in the riser column to drop to a second laser level L2, which was located one centimeter below L1, was then measured. With the measured time and the known volume of water stored between L1 and L2 ( Δ V L 1 L 2 = 1.96 µL), the evaporation rate q was determined. Note again, that to ensure a constant evaporation front in the cell, the laser levels L1 and L2 were both positioned a few centimeters above the cell, resulting in a slight overpressure in the water of ~500 Pa. This pressure, while not enough to push any water into the GDL domain, acts as a buffer to prevent movement of the water front in the cell during evaporation rate determinations and ensured that the change in water volume manifested in the riser exclusively. All measured evaporation rates were corrected for a system intrinsic loss rate (1.33 nL/s), which originated from diffusion through the tubes, imperfections in the fittings, as well as the riser column being open to the ambient atmosphere at the top. The latter was kept low by the riser column extending roughly one meter beyond L1, limiting the diffusion of water from this location while keeping the system open to ambient pressure at the water air interface in the riser. This type of measurement was repeated three times for the temperatures and gas speeds investigated. A full list of the experimental parameter variations is available in Table 1.

3. Numeric Analysis

A two-dimensional, isothermal, macro-homogeneous along-the-channel model was implemented in MATLAB® (R2019b, © The MathWorks, Inc., Natick, MA, USA), taking into account Fickian diffusion in both the GDL and gas channels, as well as convection in the gas channel. Figure 2 gives an overview of the two-dimensional modelling domain along the center line of the gas channel. Note that, with this 2D modeling approach, contributions from the third dimension (perpendicular to the gas channel) are not captured. The simulation domain also includes the inlet and outlet domains of 1.3 mm in addition to the evaporative domain length (L).
While a more in-depth description of the model implementation is included in the Appendix A, the main parameters are given in Table 2.

4. Results and Discussion

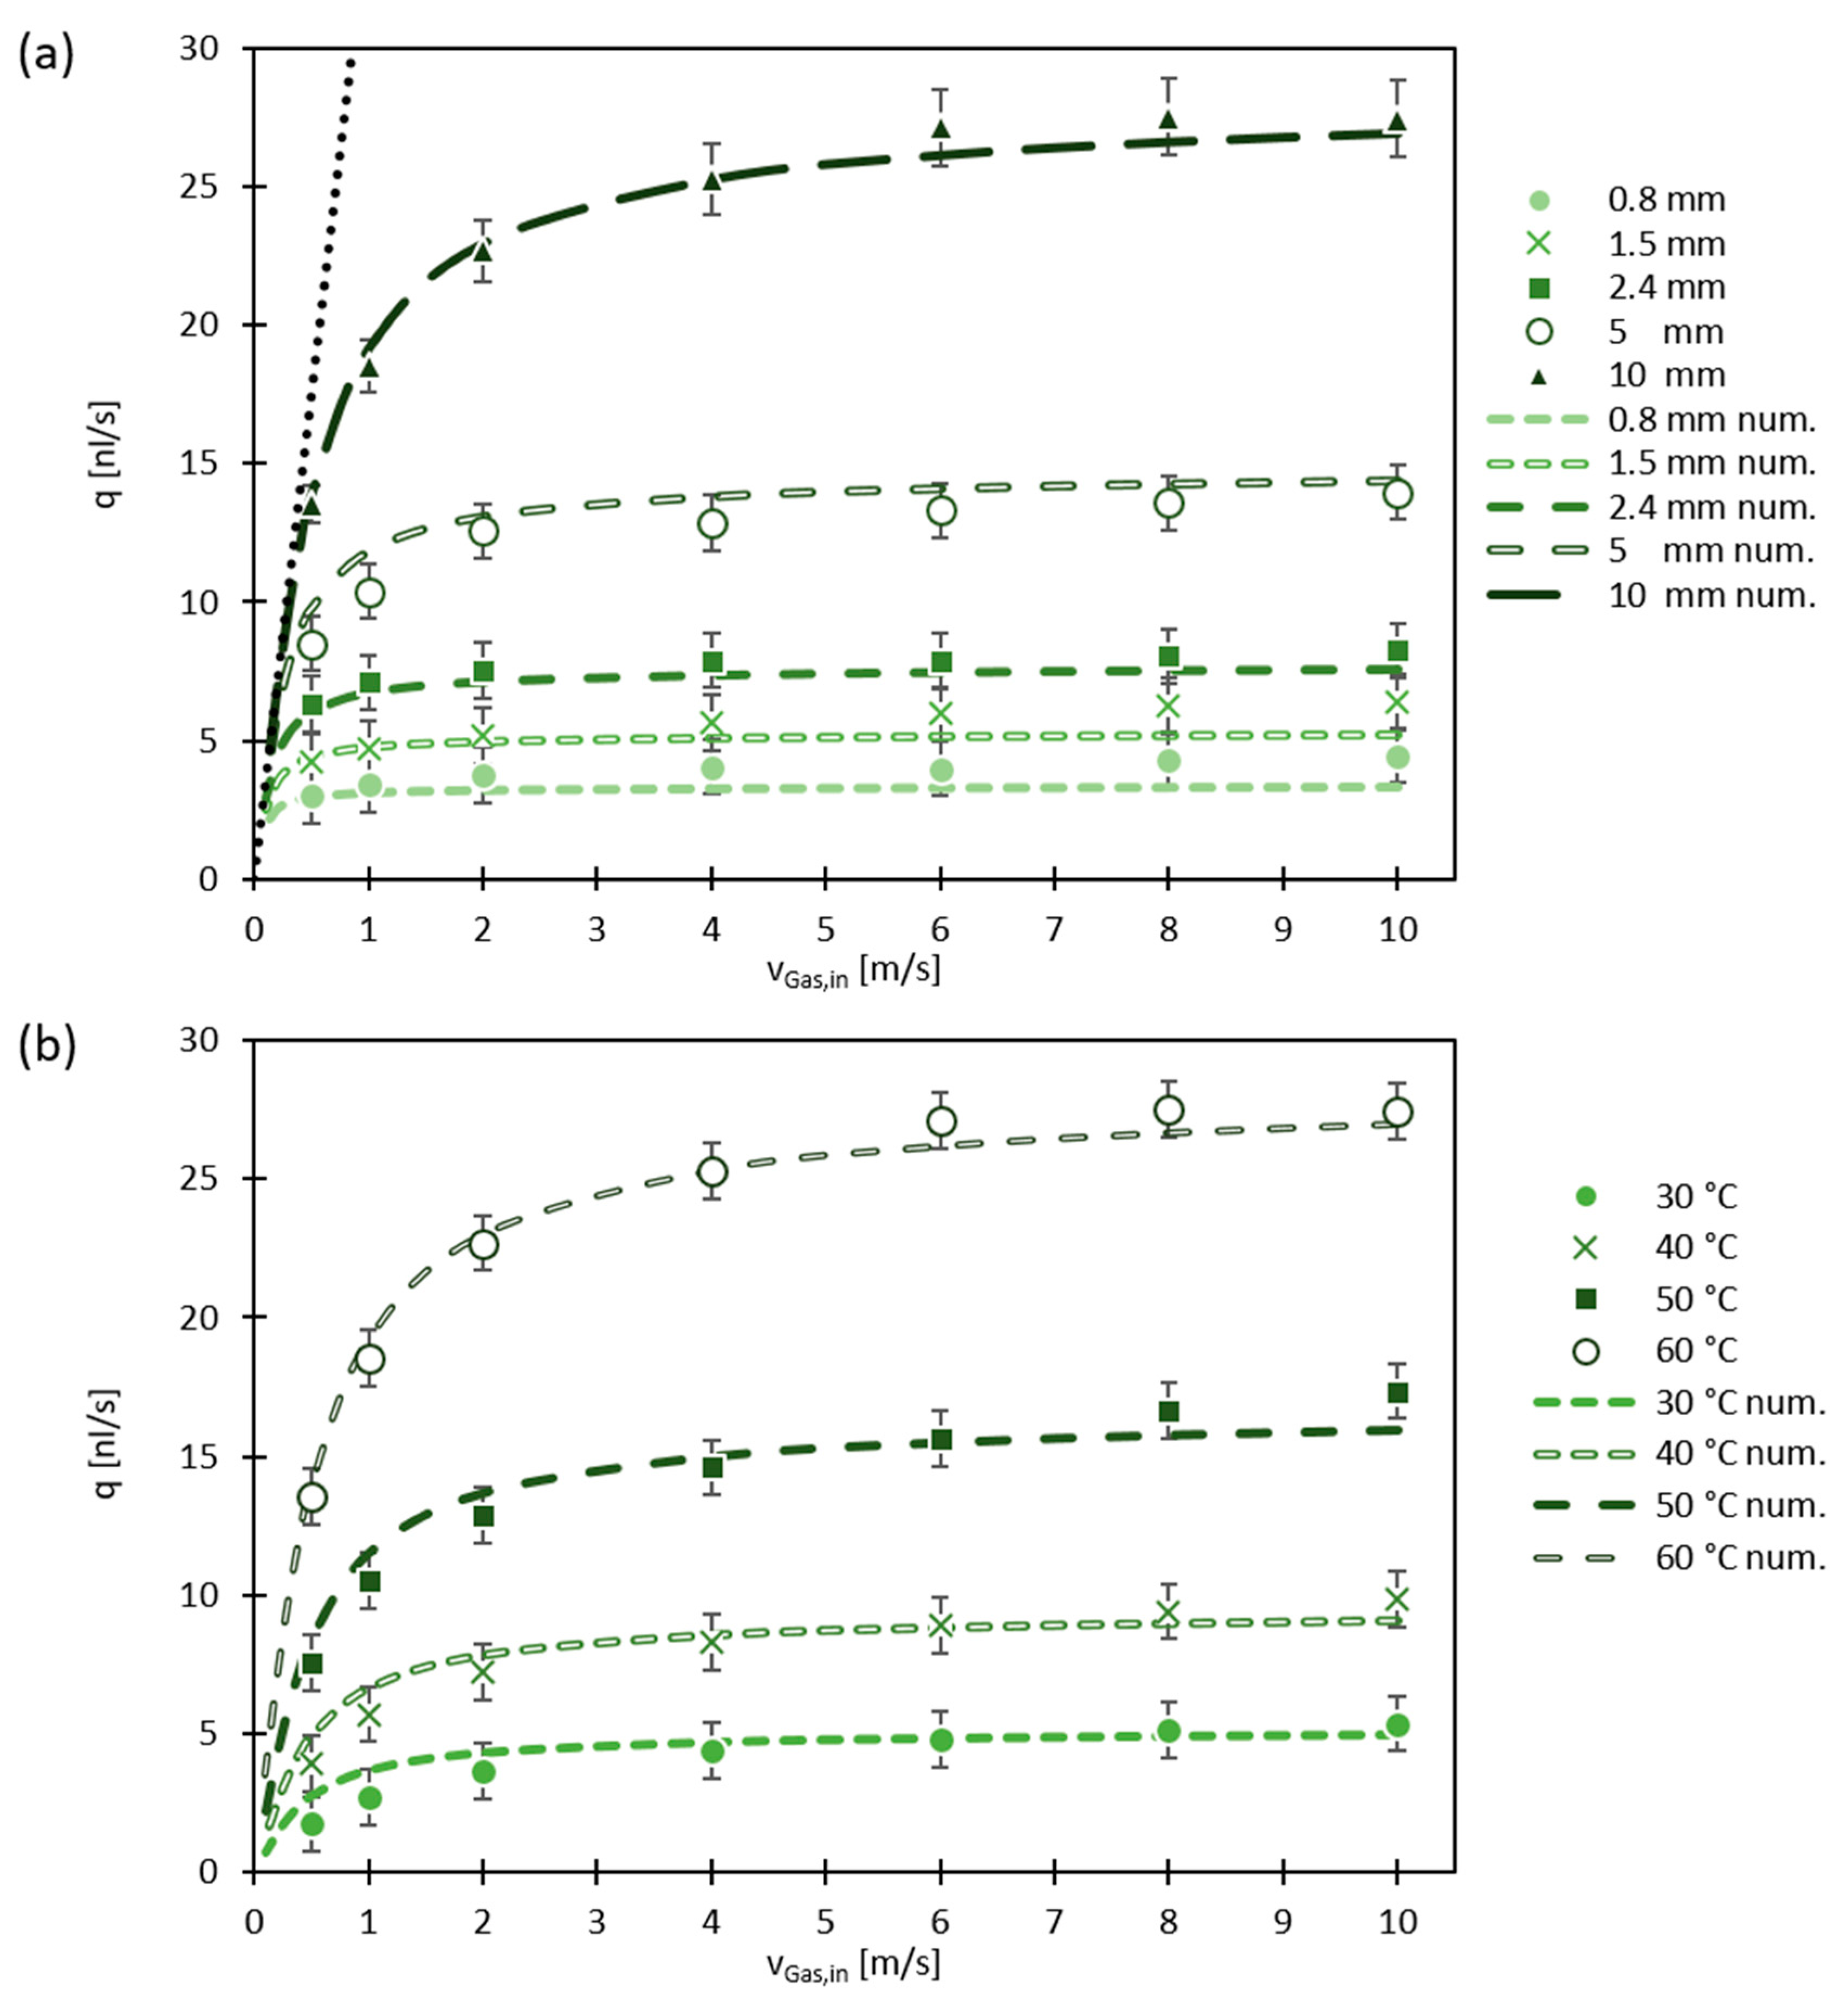
As the experiment was designed to only evaporate water from a predefined geometry underneath the GDL without liquid water penetration into the GDL domain, water transport to the gas channel occurs primarily in the form of diffusion. Once in the gas channel, the gas stream carries the vapor out of the cell. The dependence of the evaporation rate q on the gas flow rate v G a s , i n can be seen in Figure 3a for a temperature of 60 °C.
Especially for the longer evaporation domains, the evaporation rate first increases drastically with increasing gas flow rates, following the limit of maximum moisture saturation in the gas channel as indicated by the dotted line. For shorter domains, this effect is not so pronounced, as almost all investigated gas flow rates offer sufficient convective vapor removal to maintain low saturation in the gas channel. For lower velocities, a decrease of the evaporation rate was observed, indicating a significant increase of saturation in the carrier gas over the evaporation domain. At higher gas flow rates, for all L, a plateau was reached, after which an increase of gas flow rate showed only a minor or no increase in evaporation. This indicates that the mechanism limiting vapor transfer has shifted away from the gas channel to the GDL domain, and diffusion driven transport is now dominating the evaporation characteristics. It is assumed that, under the given conditions, diffusion is the only transport mode in the GDL. The vertical error bars represent the maximum error observed when propagating the measurement uncertainties of Δ t L 1 L 2 and Δ V L 1 L 2 .
Δ q = max ( q ( Δ t L 1 L 2 t L 1 L 2 ) 2 + ( Δ V L 1 L 2 V L 1 L 2 ) 2 )
The values obtained from the model show very good agreement with the measured values, indicating that the effects taken into consideration describe the vapor transport processes under the investigated conditions accurately enough to allow extrapolations exceeding the experimentally investigated parameter range.
For different temperatures, at L = 10 mm, the effect of gas flow rate is shown in Figure 3b. An initial increase at low gas velocities can be seen as well as a plateauing at higher gas velocities. The general behavior appears very similar in terms of the average velocity required to reach the plateau being comparable for all temperatures. It was found that, at sufficiently high velocities, the plateau values of the different temperatures relate to each other in accordance with their respective saturation pressures:
q ( T 1 ) q ( T 2 ) = D ( T 1 ) D ( T 2 ) p s a t ( T 1 ) p s a t ( T 2 ) | < v G a s
where q is the evaporation rate at a respective temperature T ,   D the diffusivity,   p s a t is the water saturation pressure, and v G a s is the average gas velocity. This highlights again the transition from convective (saturation) limiting conditions at low velocities to diffusion limited vapor transport at higher velocities.
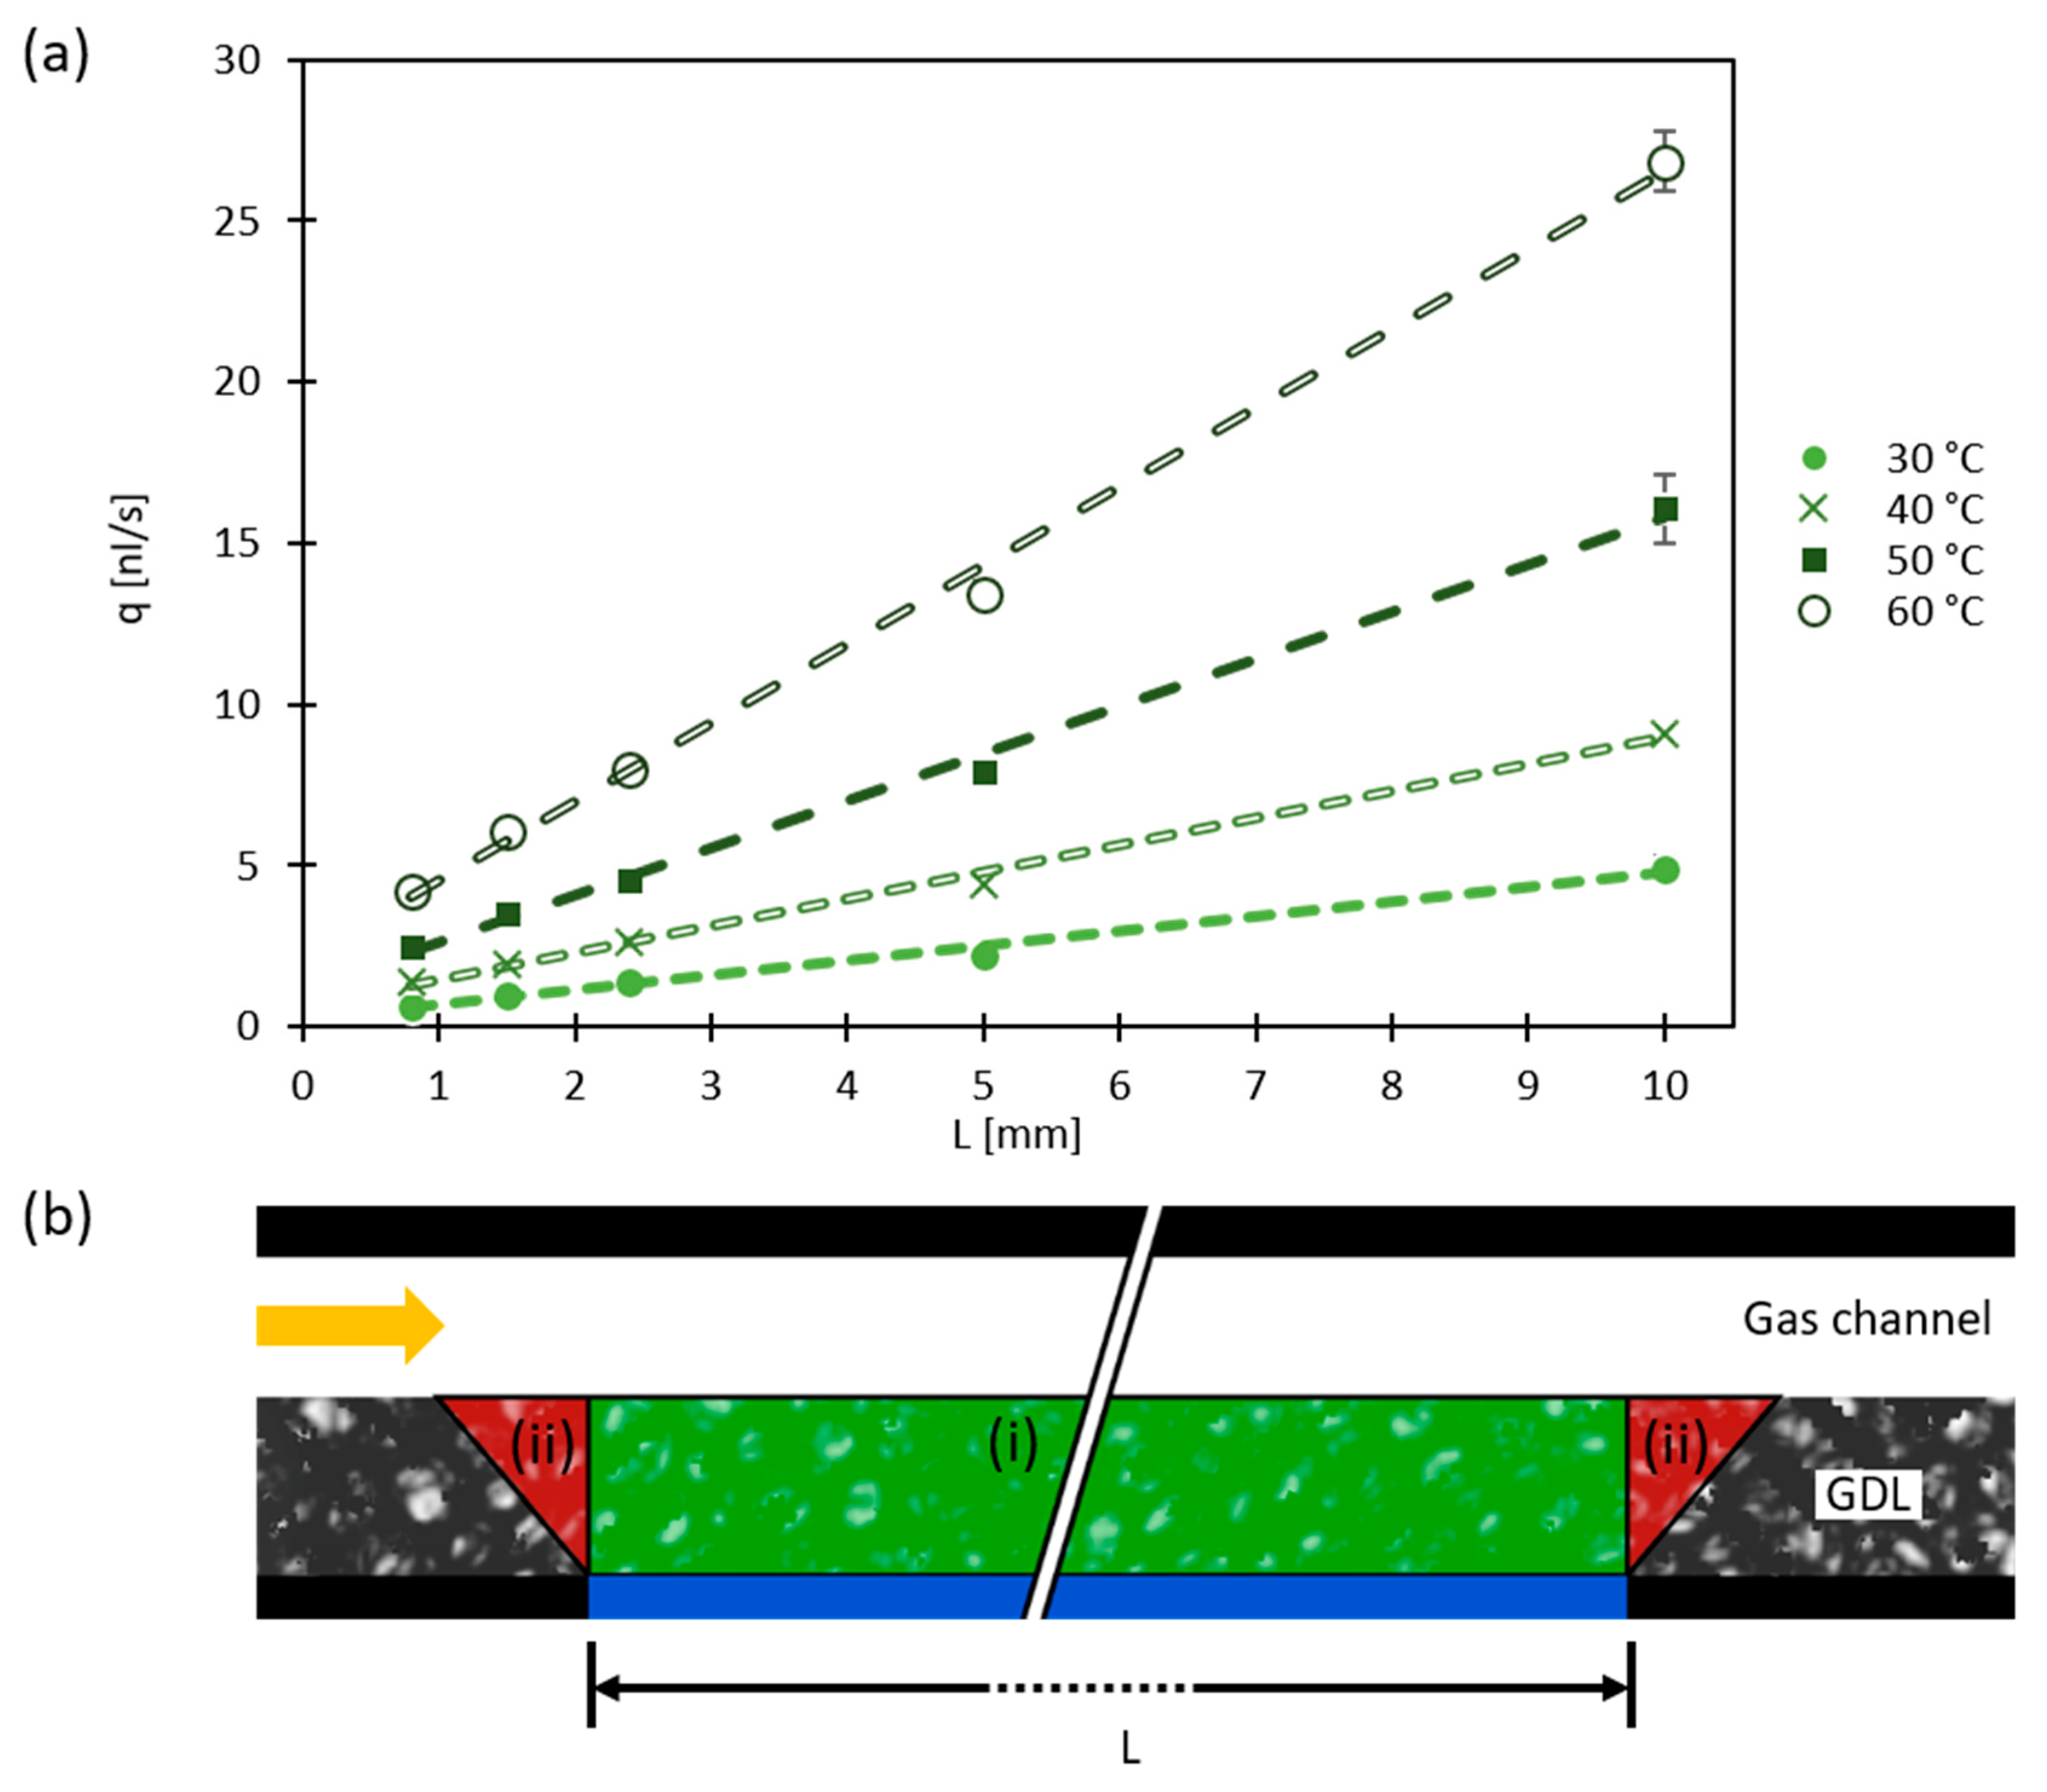
As the evaporation domain did not extend underneath the entire GDL along the gas channel, the diffusive transport can be expected to have a different behavior at the edges of the domain than over the bulk. The contribution of this edge region to the overall evaporation rate as function of L was quantified, considering only results for gas velocities v G a s , i n ≥ 4 m/s to ensure diffusion limited conditions (Figure 4a).
It was found that the evaporation rates follow a linear increase with L for all temperatures indicated by the linear fits (dashed lines, see Figure 4a). These fits have a non-zero ordinate value that can be interpreted as the edge contribution to the overall evaporation rates and enables the quantification of the two diffusion domains:
(i)
Through-plane (TP) diffusion over the bulk of the evaporation domain;
(ii)
In-plane (IP) and through-plane (TP) diffusion on the up and downstream edges of the evaporation domain.
These are indicated schematically in Figure 4b with the bulk and edge contributions in green and red, respectively. Note that this illustration aims just to indicate the locations of these regions, not to define their exact dimensions. This interpretation holds only under differential conditions, where a change in L only affects the contribution of the TP diffusion component to the overall evaporation rate, while the edge contributions remain the same. This effect could be very well observed in this study when varying L between 0.8 and 10 mm, as shown in Figure 4a for high gas velocities (≥4 m/s). The experimentally obtained values for both the slopes of the linear fits and their ordinate values are reported in Table 3. These slope values represent the upper limit of diffusive vapor transport through the GDL domain under optimal, purely diffusion limited conditions at the respective temperatures.
The same averaging and linear fitting has been applied to the evaporation rates obtained by the model at same values for L as used in the measurements and the resulting values for the slopes and ordinates are included in Table 3. The slope values show good agreement, while the ordinate values differ slightly. From this, it can be seen that, at 30 °C, an evaporation domain length of L = 0.5 mm contributes almost equally as much to the total evaporation as its edge domain. At 60 °C, this contribution is even larger, comparable to an evaporation domain of ~1 mm in length. With increasing L, the contribution of this edge domain decreases, reducing to 10% at ~5 mm and ~8.5 mm at 30 °C and 60 °C, respectively.
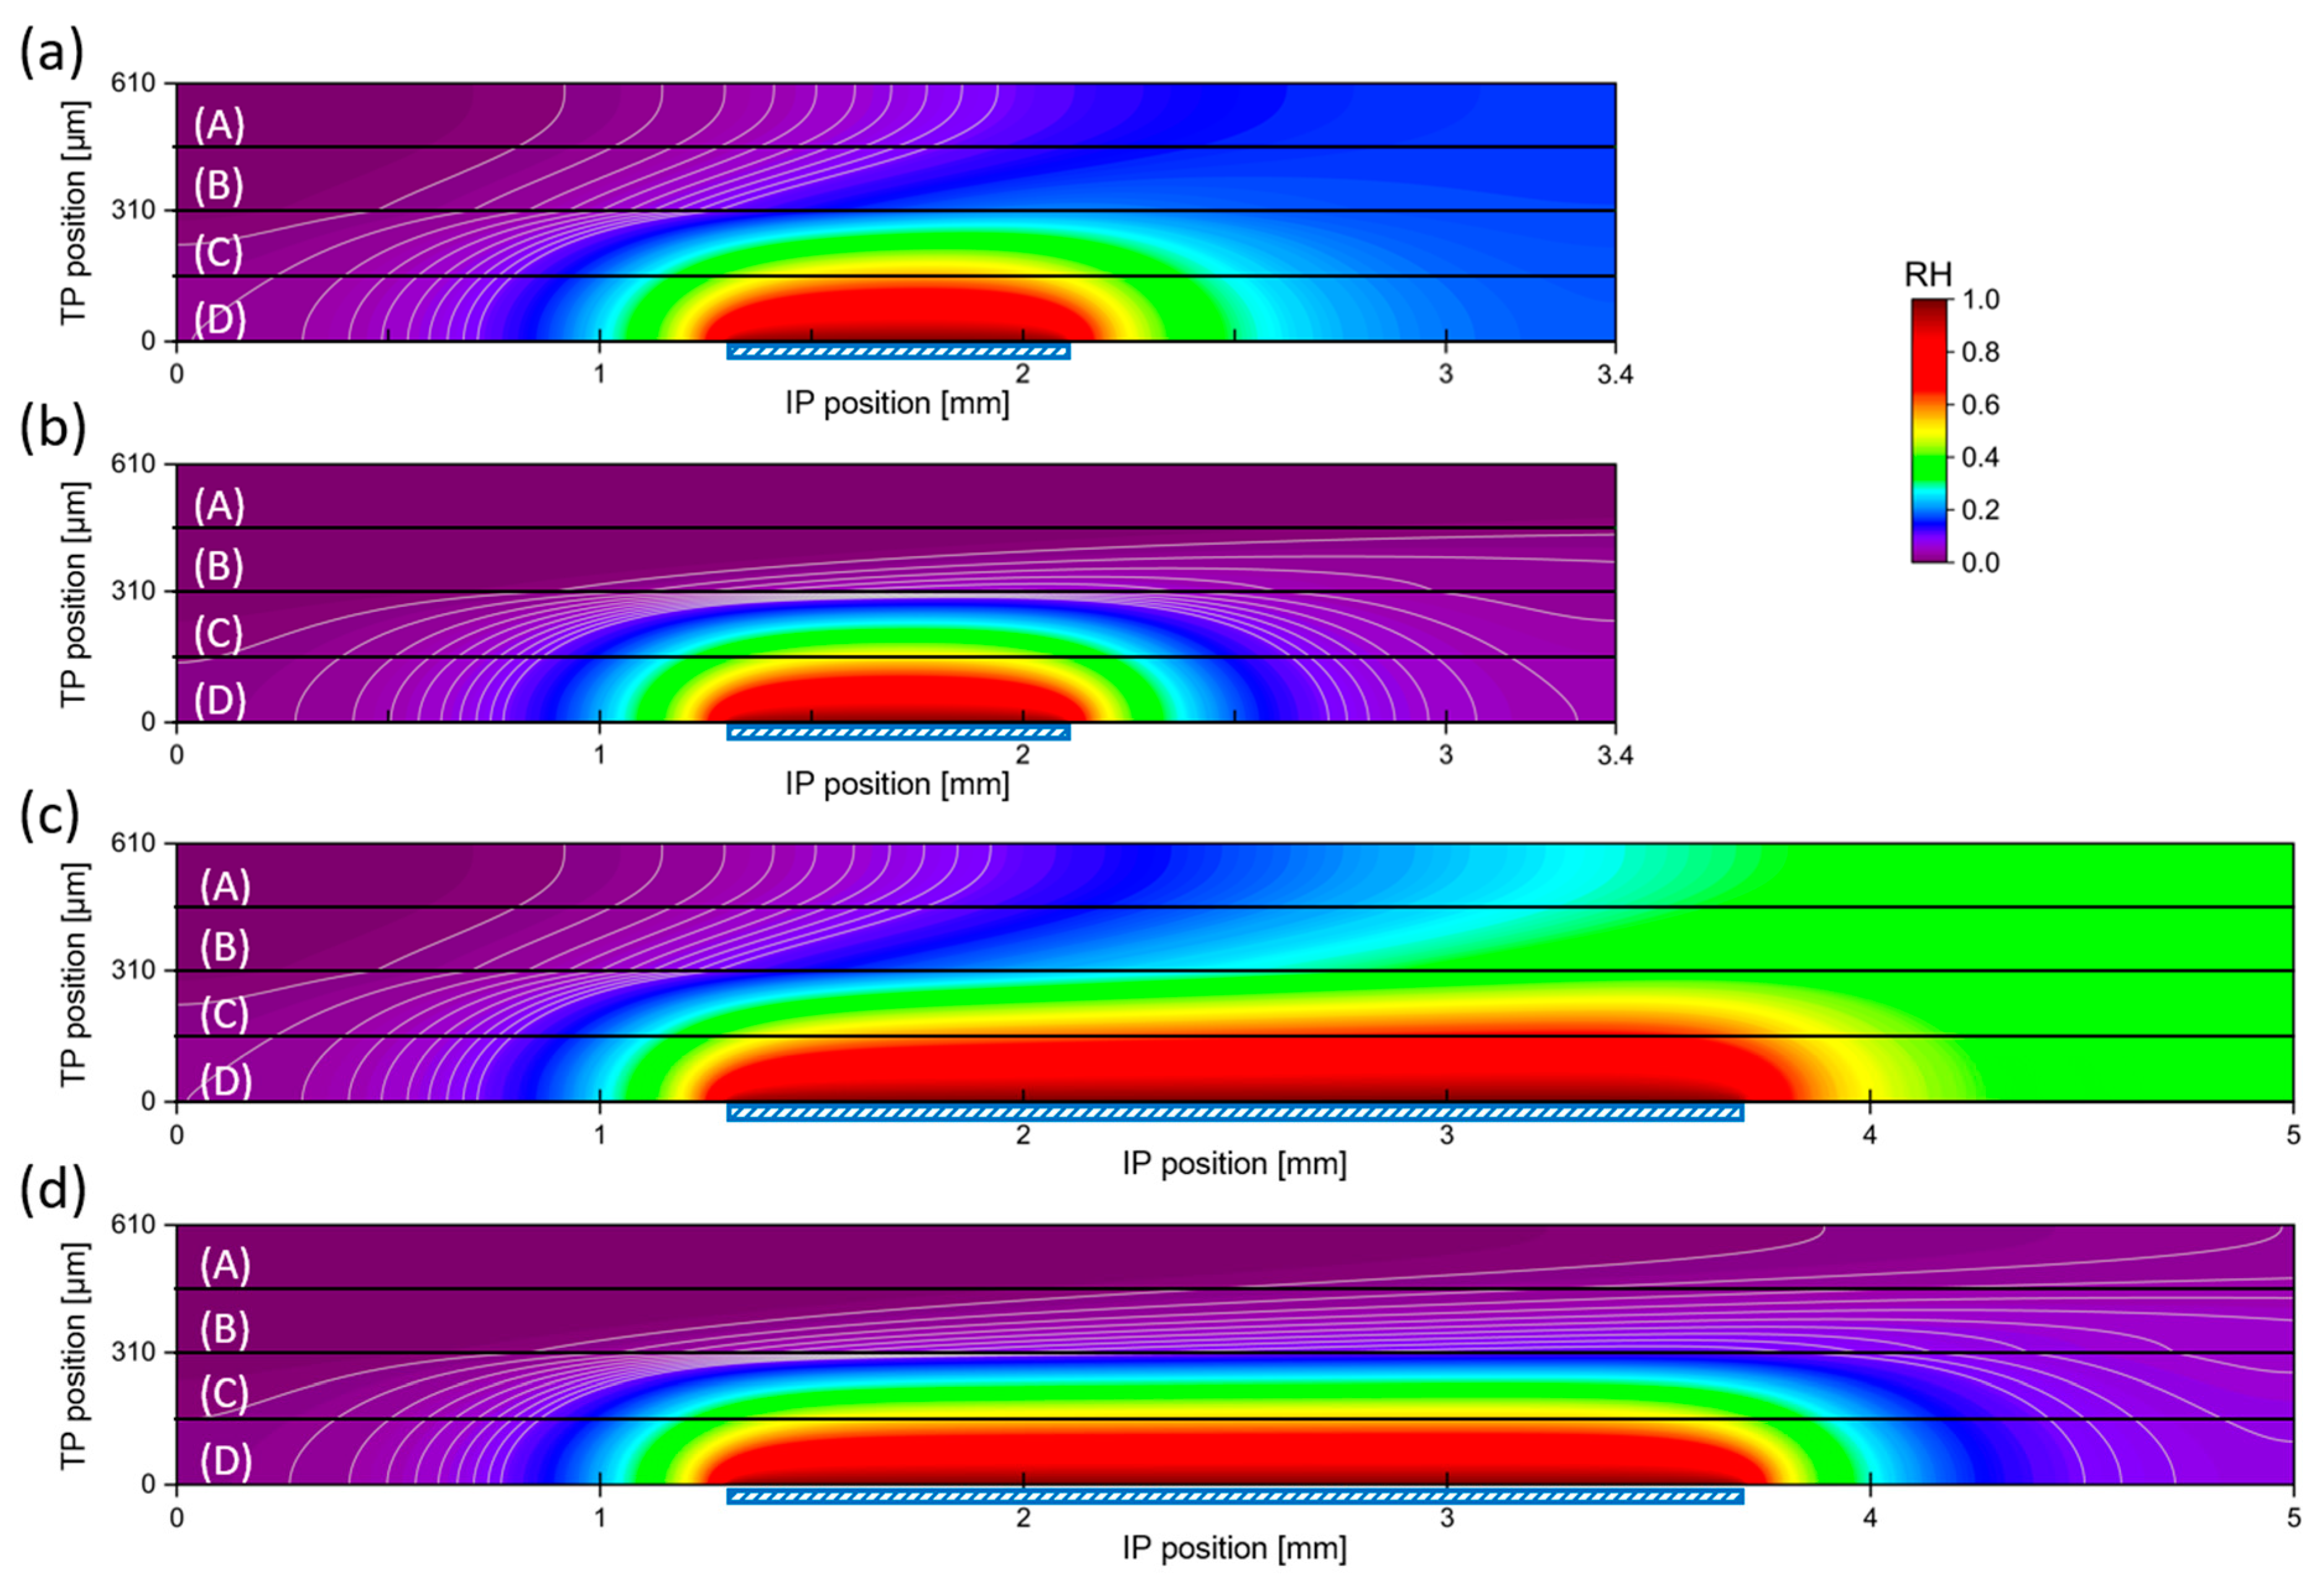
More detailed insight into the edge effects is obtained when looking at the spatial distribution of water vapor inside the GDL and the gas channels. 
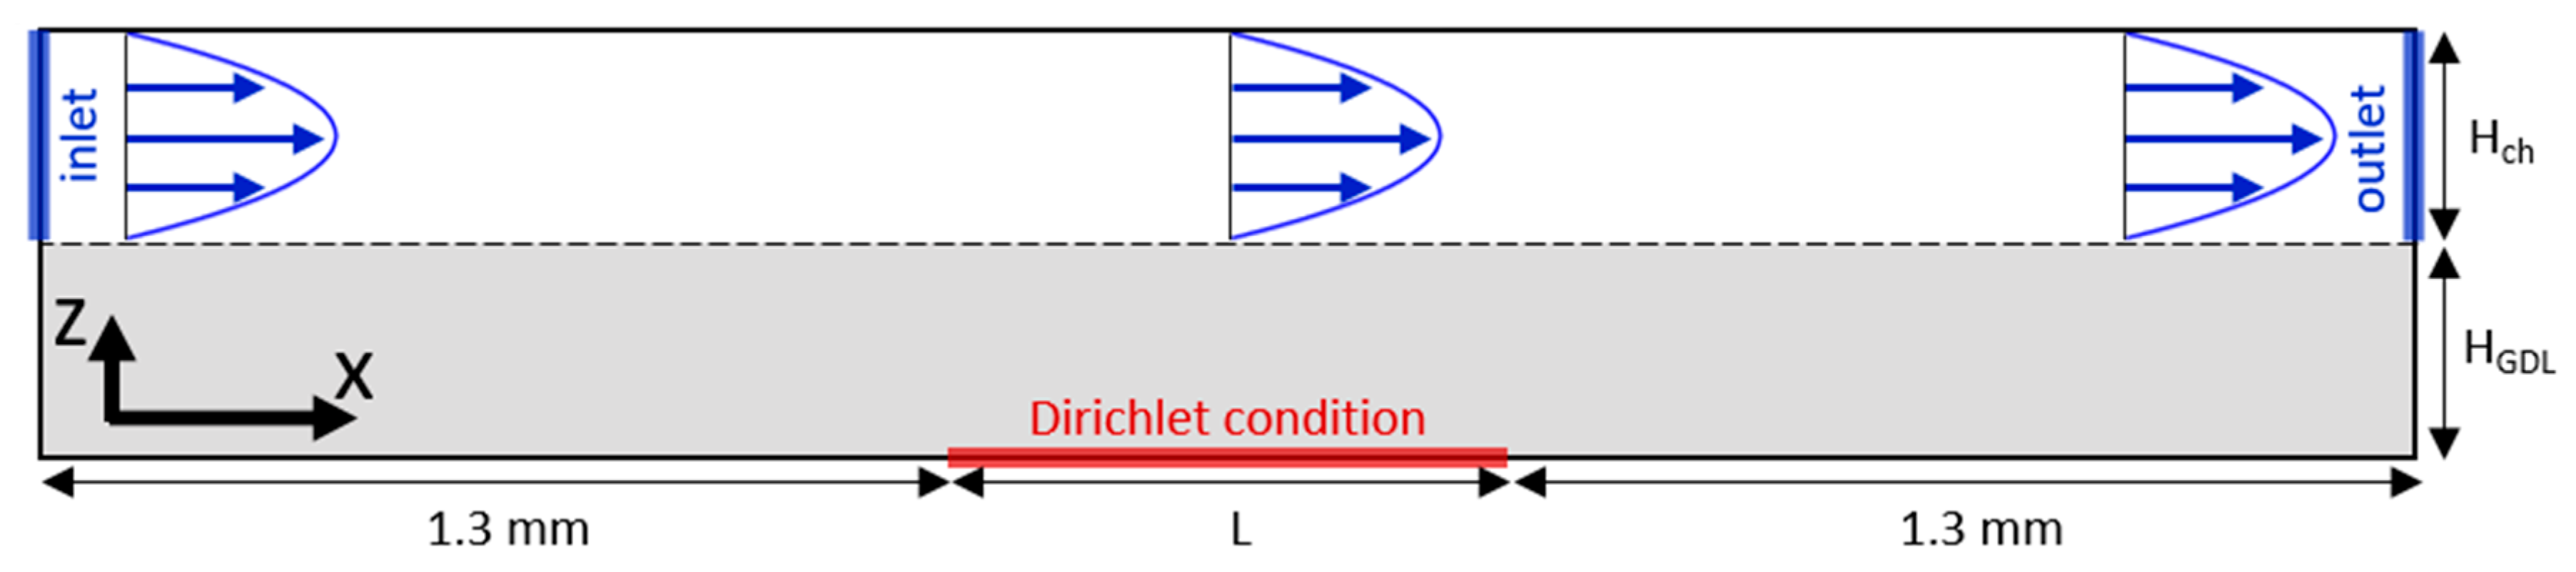
Figure 5 shows the relative humidity (RH) obtained from the model for L = 0.8 and 2.4 mm as well as for v G a s , i n = 0.5 and 6 m/s at a temperature of 60 °C inside the modeling domain in accordance with Figure 2. In this representation, the difference in water concentration between low and high gas velocities over the length of the evaporation domain becomes apparent. While for v G a s , i n = 0.5 m/s (Figure 5a,c), the relative humidity in the gas channel increases substantially over the evaporation domain (up to ~20 and ~40% for L = 0.8 mm and 2.4 mm, respectively), it remains low (<10%) in the case of v G a s , i n = 6 m/s (Figure 5b,d). In the GDL, clear differences can be observed especially around the downstream edge of the evaporation domain. For the case of low gas velocities, the humidity gradients between the bottom of the GDL (line D) and the GDL/gas channel interface (line B) become smaller towards the end of the simulation domain, while they remain almost the same for the case of high gas velocity.
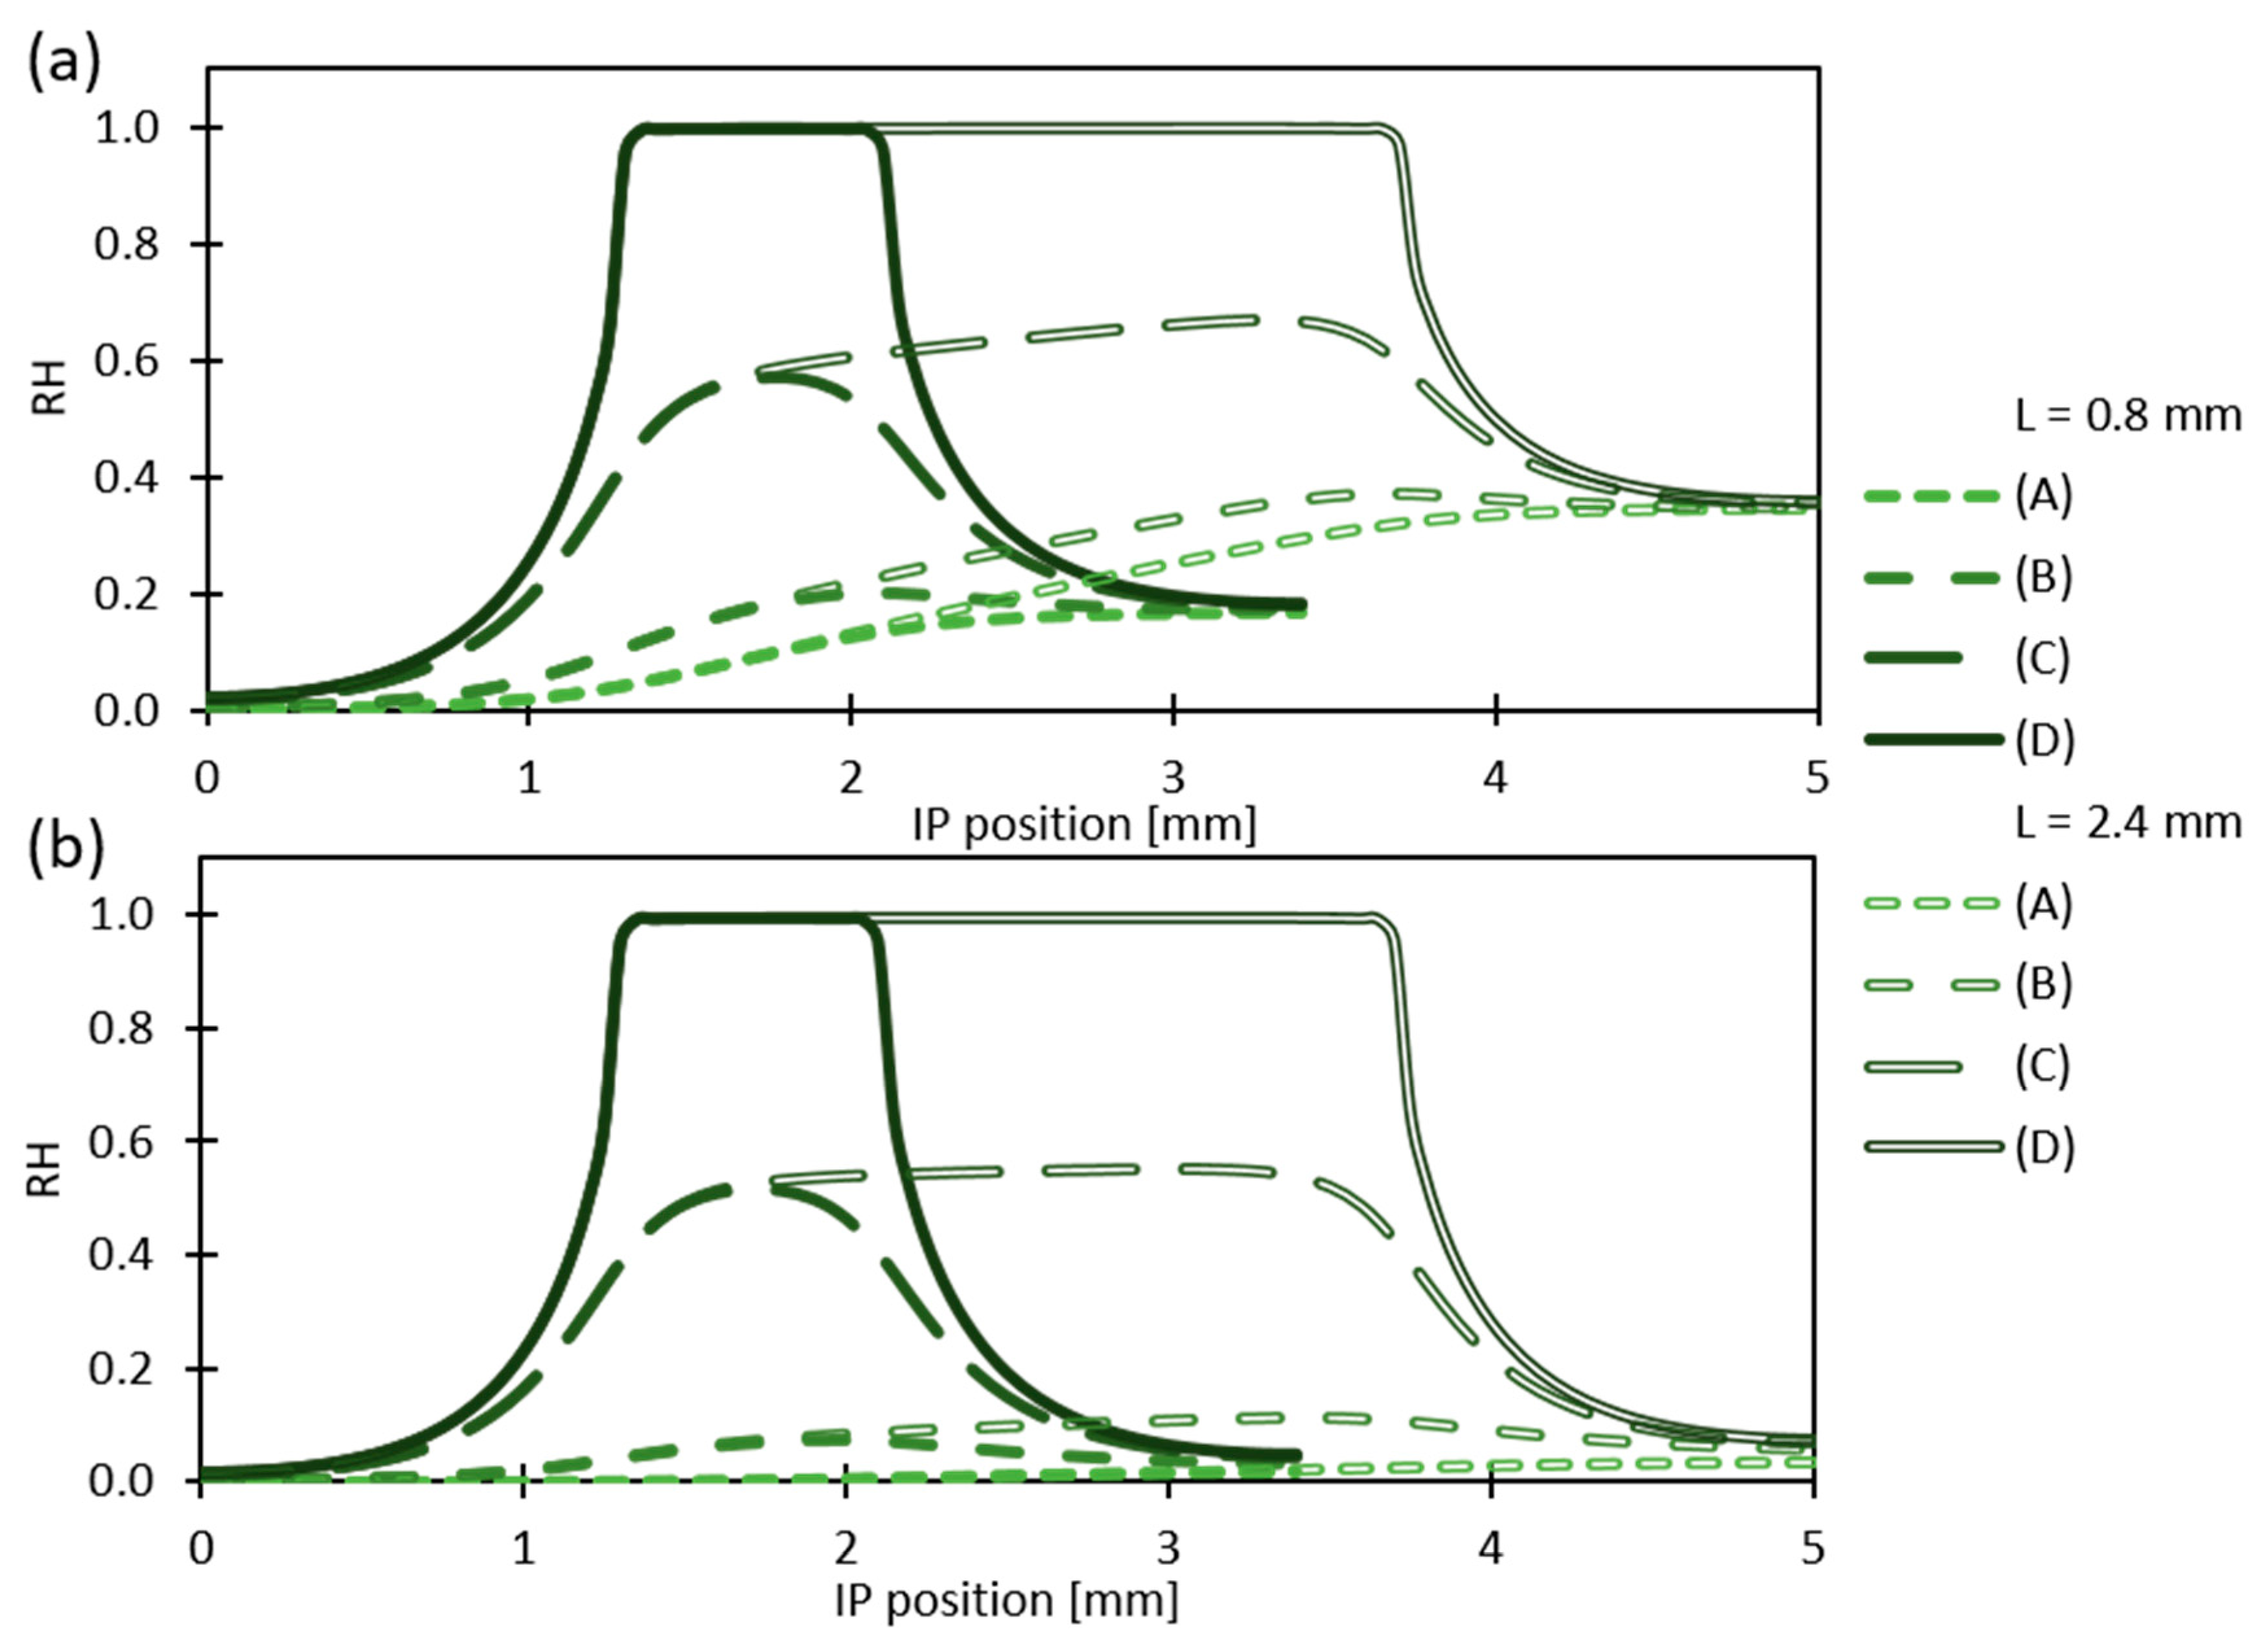
For a more detailed comparison, the relative humidity values shown in Figure 5 were extracted at lines A–D for v G a s , i n = 0.5 m/s and 6 m/s, respectively. It can be seen, especially for L = 2.4 mm, that the humidity extracted at the GDL/gas channel interface (line B) shows a distinct increase along the evaporation domain (starting at x = 1.3 mm) along the x-axis, thus reducing the gradients through the GDL, resulting in reduced evaporation along the channel (Figure 6). Contrarily, for v Gas , in = 6 m/s (Figure 6b), the humidity in the gas channel remains rather constant over the evaporation domain (line A). A slight humidity increase can be observed at the GDL/gas channel interface (line B), which drops back down to ~10% downstream of the evaporation domain as the vapor distributes in the gas channel. With a decreasing humidity gradient, the diffusive flux decreases as well, resulting in a transition away from diffusion-limited to convection limited mass transport when the RH in the channel is dominating. It is apparent that, owing to this saturation increase, the evaporation rate will decrease along the channel until, eventually (for a large enough evaporation domain), the relative humidity in the gas channel will reach unity and no more evaporation can occur. The closer the saturation in the gas channel gets to RH = 1, the more the overall evaporation rate depends on the convective removal via the gas channel.
The model was used to extrapolate to larger evaporation domains and higher temperatures that were not covered experimentally. The reader should keep in mind that the resulting evaporation rates and humidity distributions only hold true for evaporation experiments or cell designs with dedicated liquid feed for evaporative cooling. In conventional PEFCs, the evaporation rates at static conditions will be limited additionally by the local current density and the respective water production. 
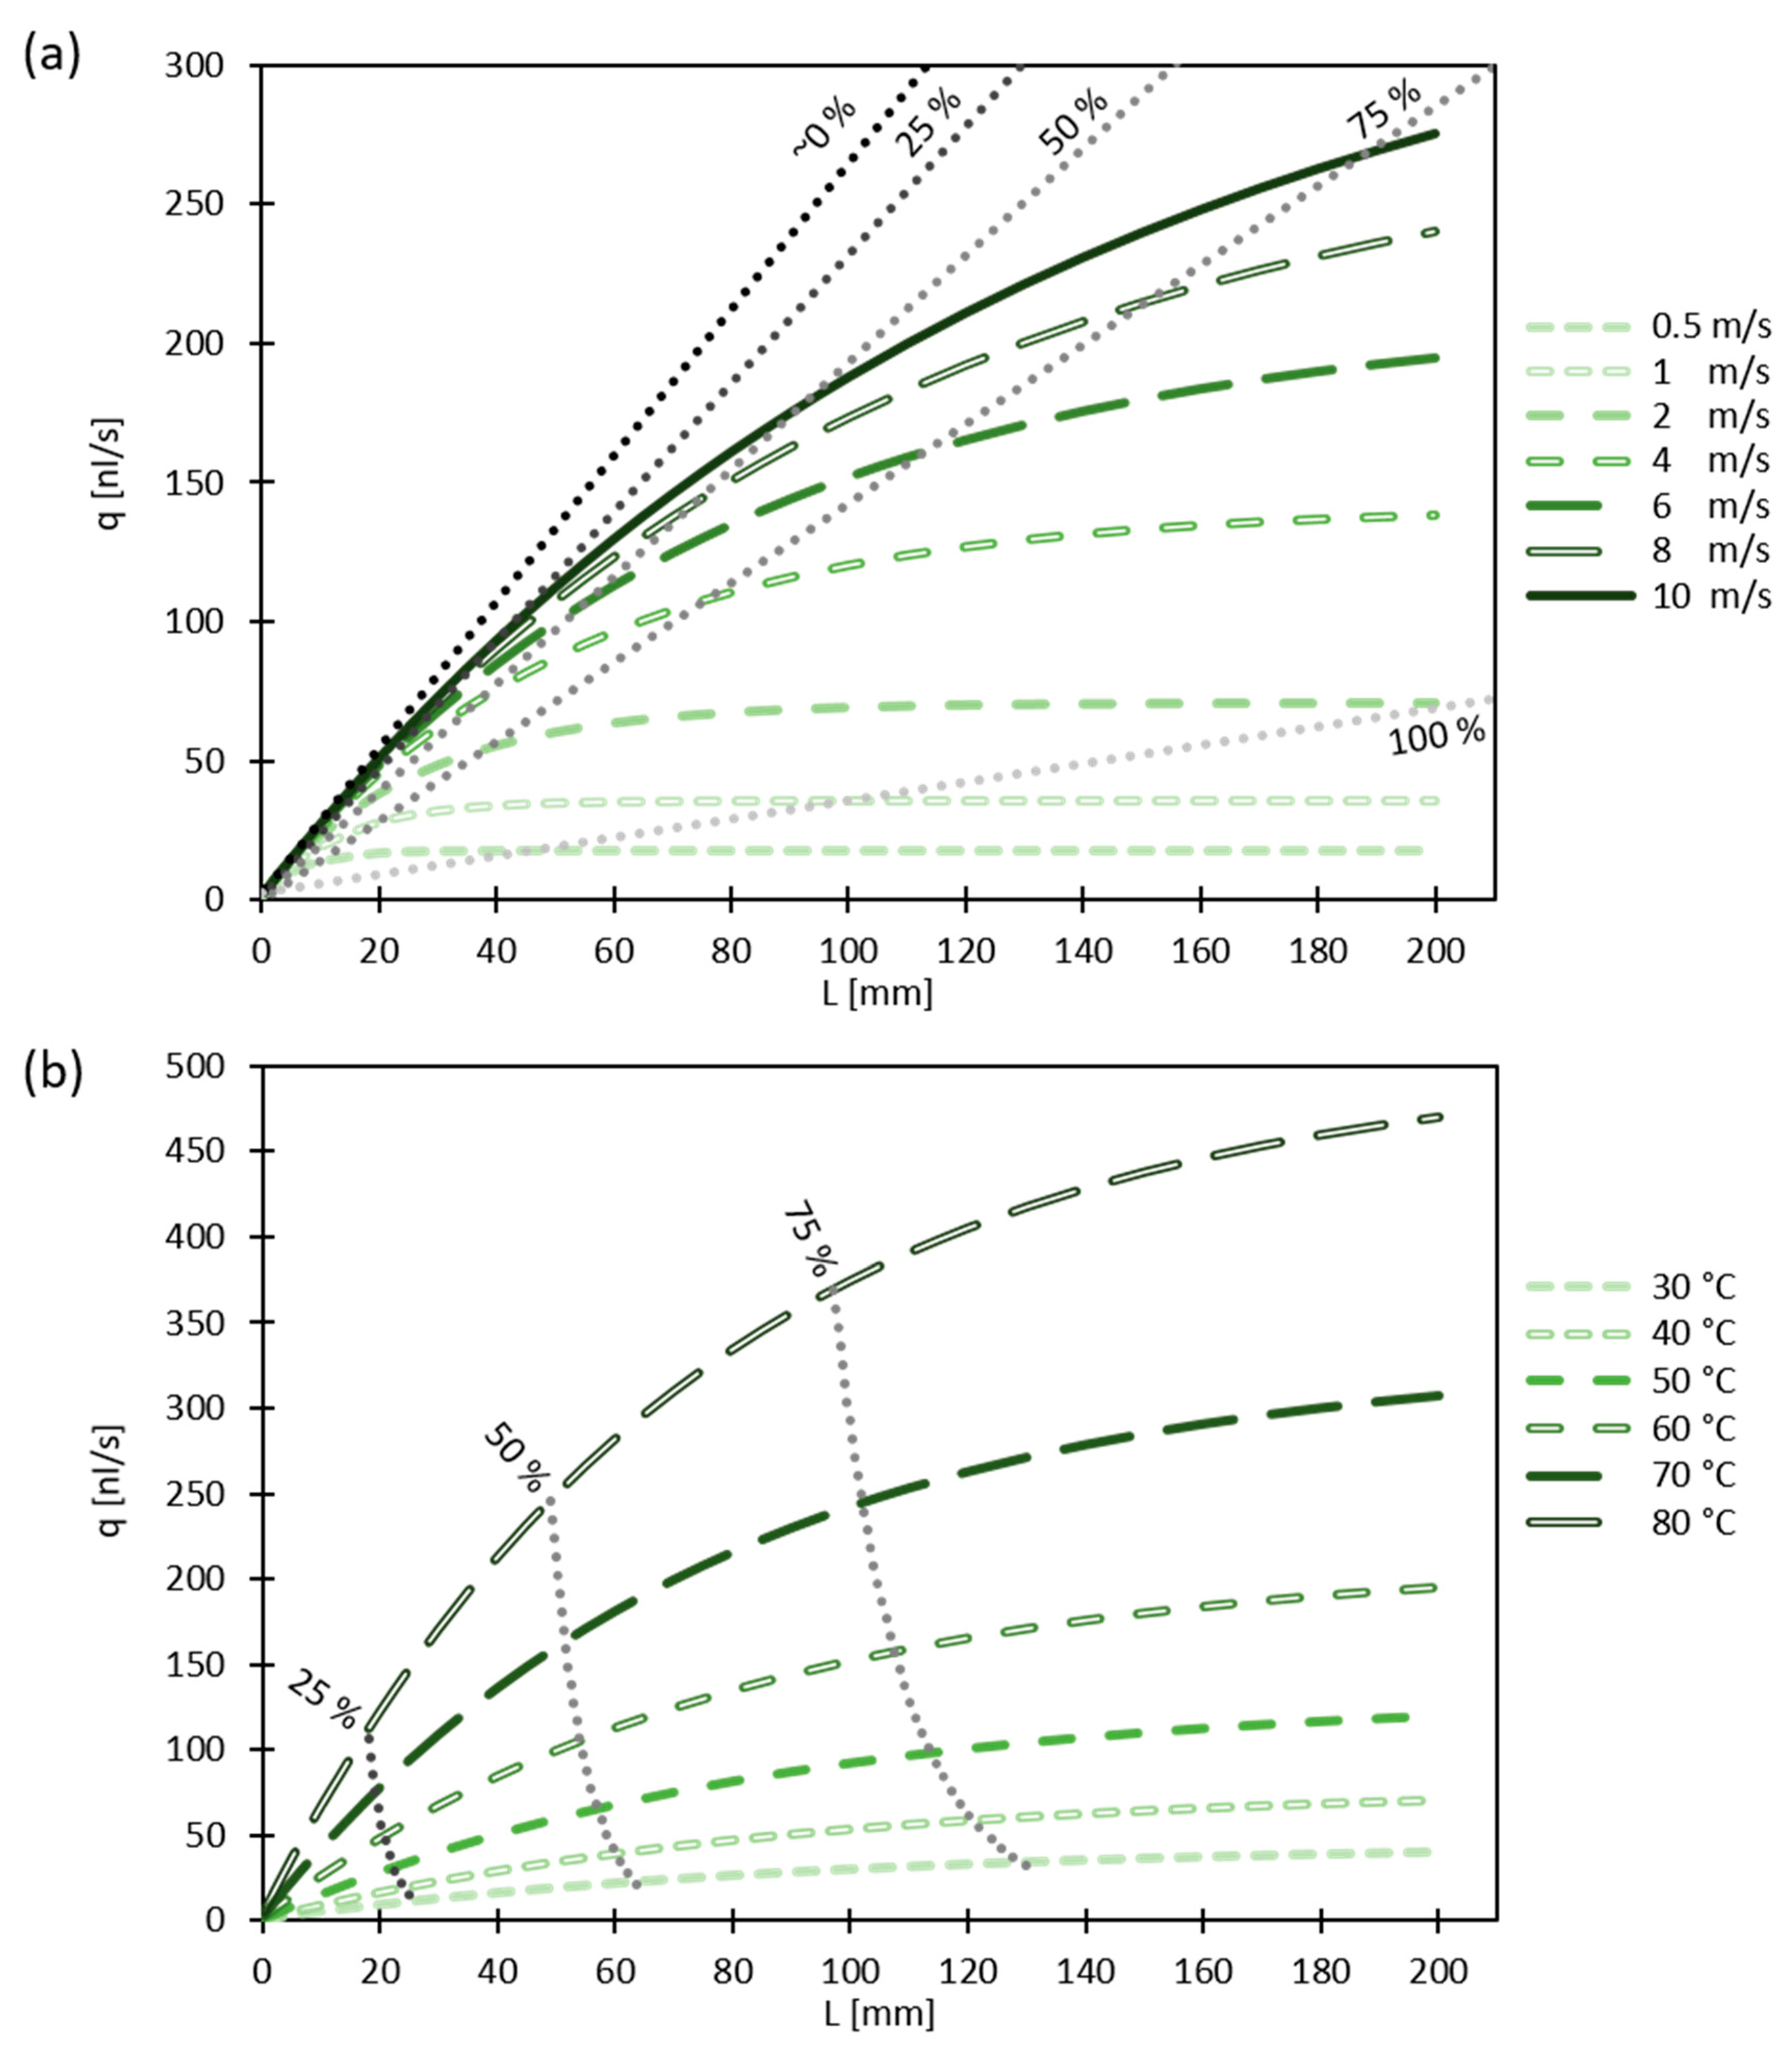
Figure 7a shows the evaporation rates at 60 °C for inlet gas velocities between 0.5 and 10 m/s and L up to 200 mm.
As can be seen, the evaporation rates increase with the length of the evaporation domain as well as the gas velocity. As L increases, the evaporation rates reach a limit; for lower gas velocities, this limit is reached after shorter L compared with higher gas velocities. The dotted lines indicate 25% increments in average relative humidity in the gas channel outlet. The lines indicating 20–100% were extracted by determining the humidity in the gas channel outlet at the respective conditions and extrapolated for visibility. The ~0% line is tangential to the 10 m/s curve at L → 0 mm, where the average humidity in the gas channel was closest to 0%. Initially, for small values of L and thus close to 0% average humidity in the channel outlet, the slope of q with L coincides with the value obtained at differential conditions (Table 3). As L gets larger, the transition from diffusion to saturation limit vapor transport can be observed. For the lower gas velocities, this occurs already at low values of L, while for the higher gas velocities, L can be larger until, even at v G a s , i n = 10 m/s, a significant deviation from pure diffusion limitation can be observed around L = 20 mm as saturation in the gas channel starts to increase. It can be seen that, at an average humidity of 25% in the gas channel, the diffusive transport, while no longer under differential conditions, still plays a dominant role in the vapor transport mechanism. As the average gas channel humidity increases, the convective transport limitation starts to dominate more and more while local evaporation reduces. As an example, for v G a s , i n = 2 m/s, 75% average humidity in the gas channel is already reached at L = 40 mm, where after it would require another 160 mm of evaporation domain to reach full saturation at L = 200 mm.
The temperature dependence of the evaporation rates for L up to 200 mm is shown in Figure 7b at a constant gas inlet velocity of 6 m/s. With increasing L and temperature, the evaporation rates increase. For low values of L, the evaporation rates follow different initial slopes as diffusive transport is limiting in this regime and, with increasing temperature, the diffusivity as well as the concentration gradient through the GDL (driven by the vapor pressure at the water interface) increase. As the average humidity in the gas channel increases for longer evaporation domains, we see a deviation from the respective initial slopes. Overall, it can also be observed that, with increasing temperature, the gas channel saturates faster, reducing the evaporation domain length required for 75% humidity in the channel from L = 130 mm at 30 °C to 95 mm at 80 °C. A humidity of 100% in the gas channel is not reached in this example as the gas velocity of v Gas , in = 6 m/s requires an evaporation domain length greater than 200 mm to be fully saturated under the given conditions.
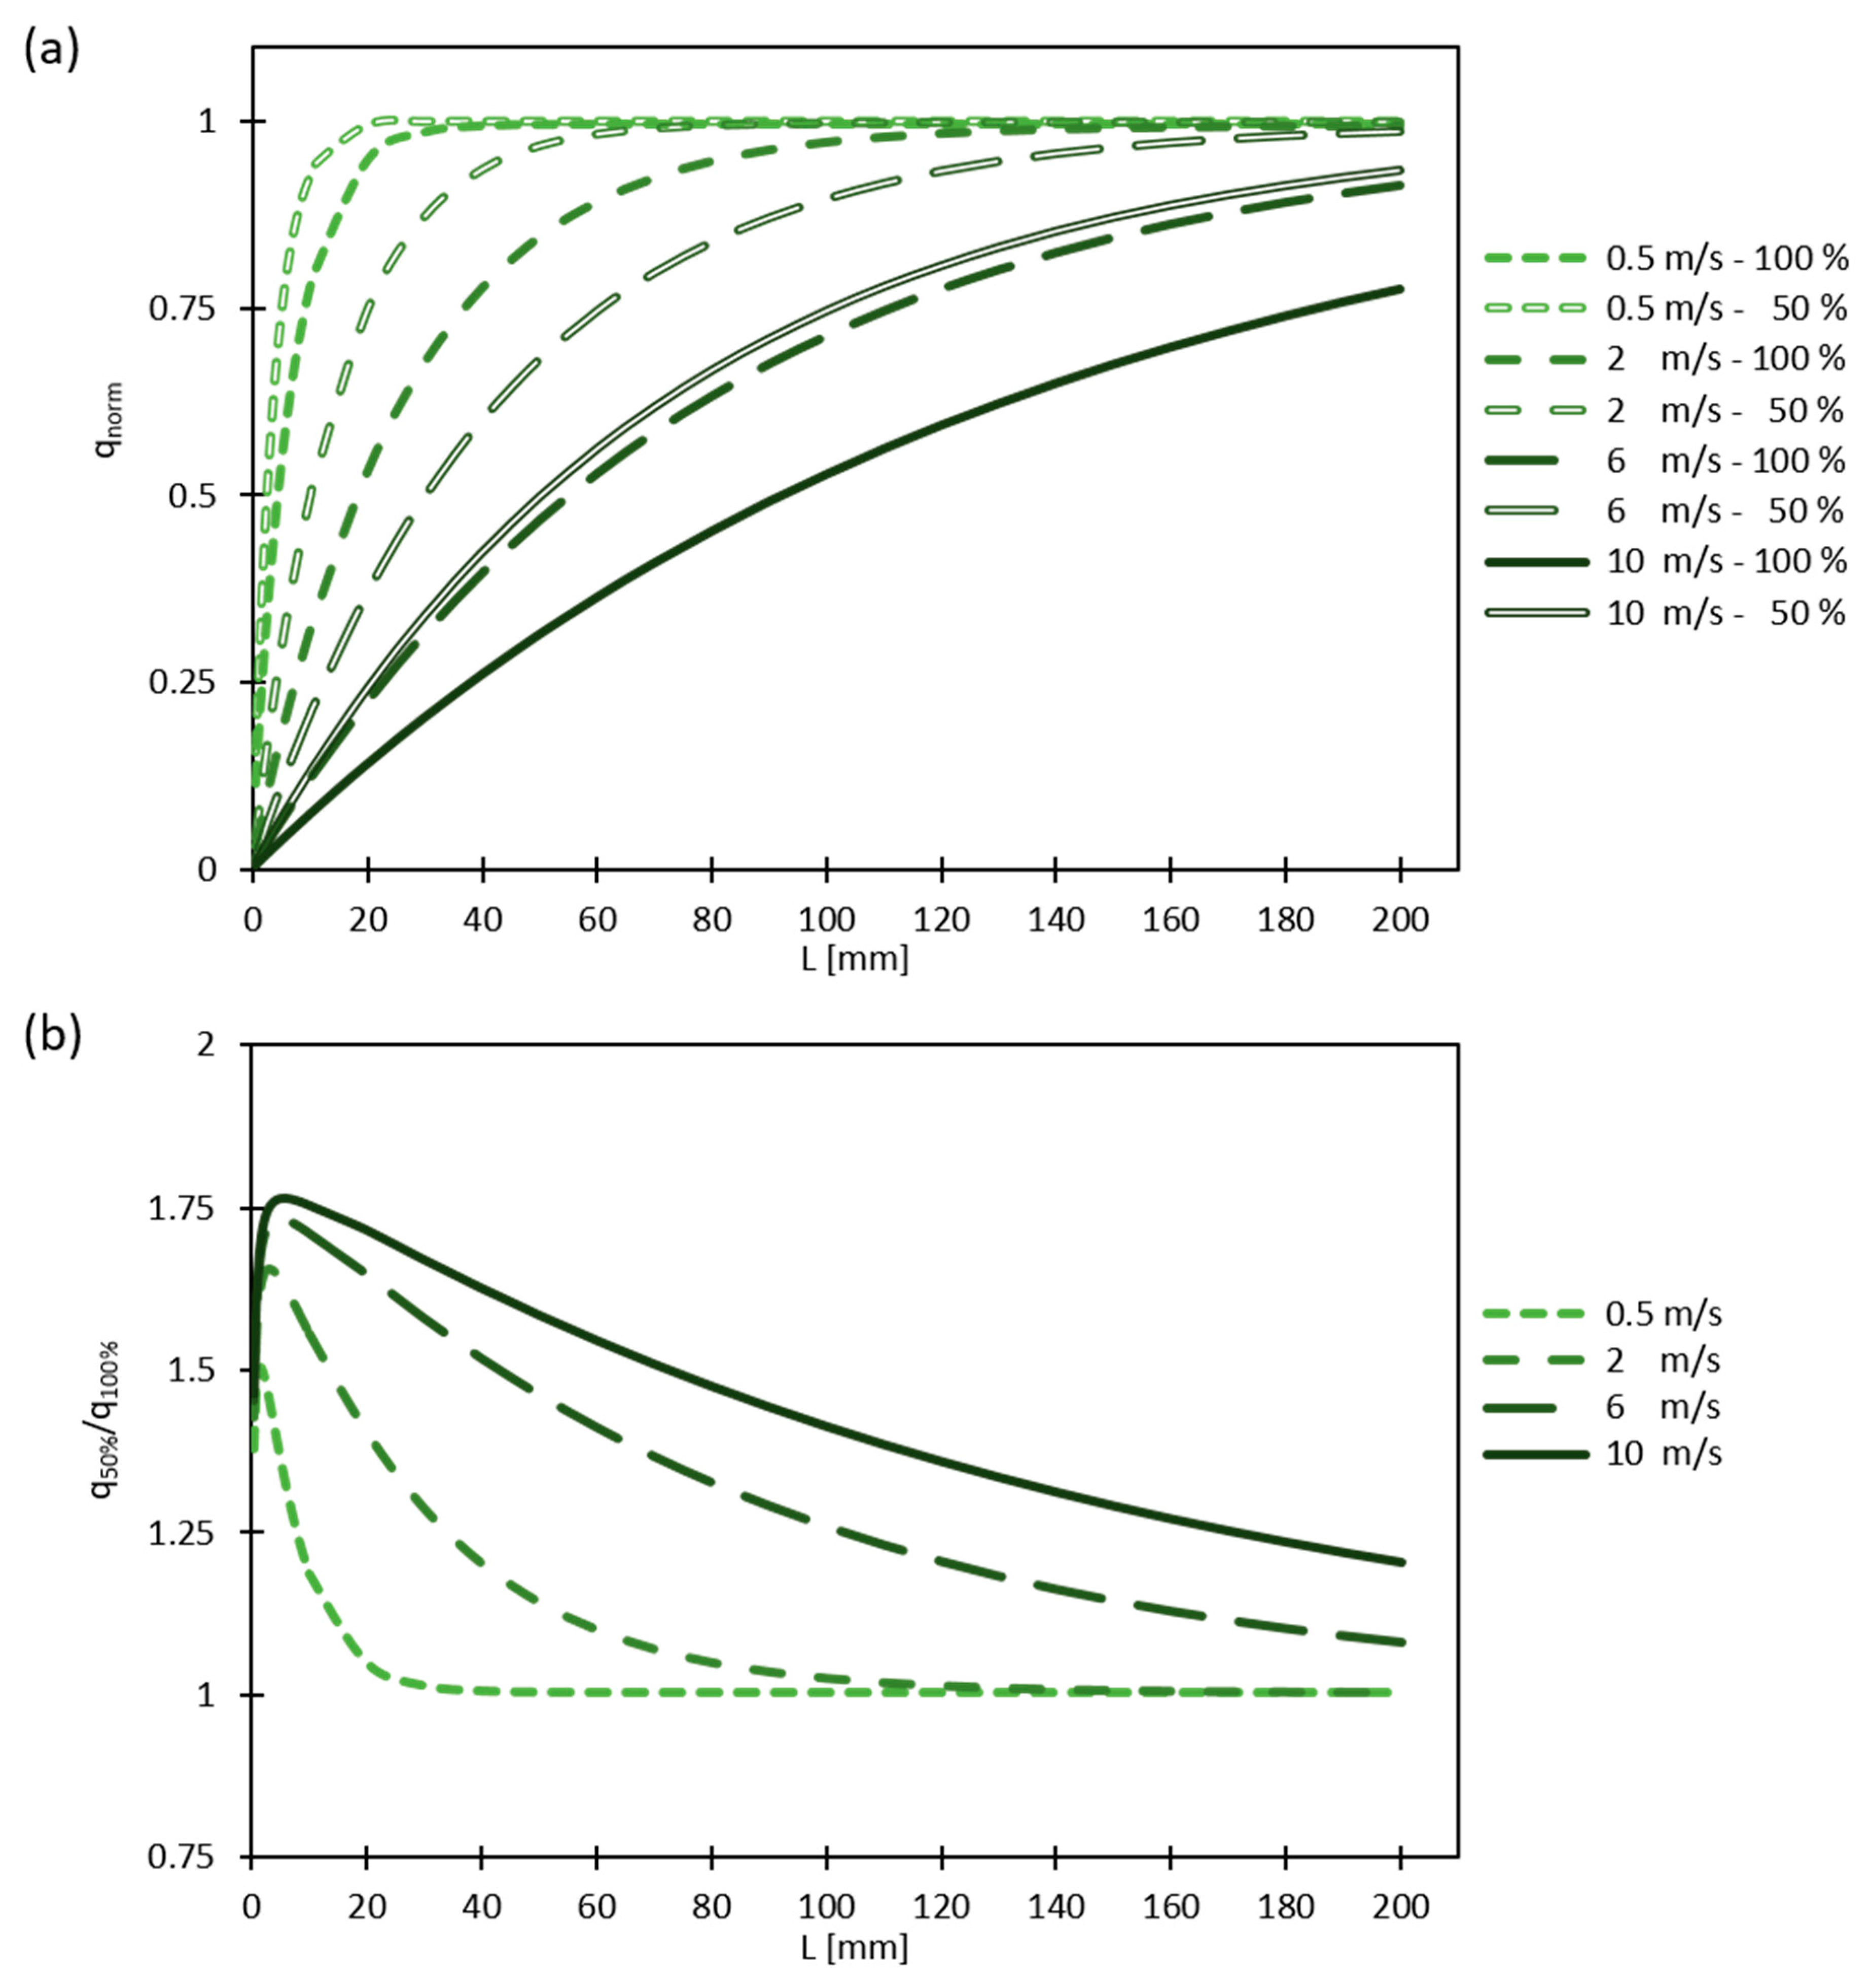
A variation of GDL thickness has been investigated numerically by reducing the simulated GDL thickness by 50% while leaving all other parameters the same to understand the influence of diffusive path length. To better visualize this effect, Figure 8a shows the results in the form of the normalized evaporation rate, q norm , as a function of L for different gas inlet velocities. This normalization is done by dividing the obtained evaporation rates at any given condition with the maximal amount of vapor removable by the fully saturated gas flow at the respective conditions. Note that the normalization to the limiting value at full gas saturation is equivalent to the calculation of the average relative humidity. In an attempt to avoid excessive overlap, only four velocities are shown. In this representation, a thinning of the GDL and the accompanying reduction in diffusive distance results in a higher rate of evaporation as indicated by the steeper increase of evaporation rate with L for thinner GDLs (Figure 8a). This also results in faster saturation of the gas in the channel and, as such, the convective limitation is reached for lower values of L. Ideally, if evaporation is to occur evenly everywhere along the channel, the gas velocity would have to be higher for thinner GDLs than for thicker GDLs.
When only considering through-plane diffusion in the GDL, according to Fick’s law, the length contributes inversely to the diffusive flux:
q 50 % q 100 % L 100 % L 50 % = 2
From the ratios shown in Figure 8b, we see that, in the present system, a reduction of the diffusive pathway by 50% does not result in a doubling of the evaporation rate. This is because, for short evaporation domains, where diffusion is limiting, the contribution of edge diffusion is not negligible and, because it does not scale linearly with the GDL thickness, we do not see the expected rate doubling. As the contribution of this edge diffusion to the overall vapor removal decreases with increasing L, a relative evaporation rate increase can be observed until the rising saturation in the gas channel starts to push the system towards a convective limitation, reducing the effect from the GDL thickness reduction. Thus, for any gas velocity, a GDL thickness reduction only increases the total evaporative water removal if L is small enough to avoid fully saturating the gas channel. This effect of increased evaporation rates has been observed experimentally by Lal et al. [21] who, with a comparable setup, observed that a thickness reduction from TGP-H 120 to TGP-H 060 resulted in an evaporation rate increase that was lower than expected from the reduction in diffusive path length.
While water is generated on the cathode side, evaporation can also occur on the anode. In regular fuel cell operation, this is can occur in specific cases owing to water migration through the membrane [9], but, in recent years, concepts for active water injection on the anode side have also been investigated for cooling purposes [18]. With hydrogen as gas on the anode, the diffusivity of water vapor compared with nitrogen is increased. The effect of this increased diffusivity on evaporation is shown in Figure 9a in the form of q norm at 60 °C for different gas velocities.
Similar to increasing the diffusive vapor transport by reducing the diffusive distance, changing the carrier gas from nitrogen to hydrogen results in an increase in evaporation rates due to the higher diffusivity of water vapor in hydrogen. At this temperature, the diffusivity ratio between hydrogen and nitrogen is ~3.58 [40], resulting in a more drastic change of q with regards to L in hydrogen for small values of L, and thus also a faster buildup of saturation in the gas channel. Contrarily to the reduction of diffusive distance, increasing the diffusivity affects all diffusive transport equally. Thus, for very short evaporation domains, the evaporation rate increases by a factor of 3.58, as shown in Figure 9b, obtained by dividing the evaporation rate in hydrogen by the evaporation rate in nitrogen. As before, the evaporation rate gain reduces with increasing values of L as the saturation in the gas channel slows down the rate of evaporation until, eventually, the gas in the gas channel is fully saturated. For this reason, an increased diffusivity due to a change of gas type does not result in the same increase occurring in the evaporation rates, unless L is unreasonably short. Lal et al. have also observed this effect experimentally for the change from nitrogen to hydrogen as carrier gas with the measured evaporation rates falling short of what would be expected from the change in diffusivity [21]. Note that the effects of changing gas density due to the large difference in molar masses between water vapor and carrier gas are not captured by this model, as Equation (4) assumes that the total gas density stays constant.
From Figure 8 and Figure 9, it becomes especially apparent how important it is to maintain differential conditions in the gas channel when investigating diffusion limited evaporation rates from fuel cell GDLs. This requirement becomes increasingly harder to maintain experimentally for cases with high evaporation rates (high temperatures, thin GDLs, or gases with high vapor diffusivity) and would necessitate very high gas velocities. Furthermore, evaporation rate normalizations with evaporative area have to be carefully examined for the conditions under which they have been acquired, because, for small domains, a normalization with area suggests very high rates of water removal. In reality, such high rates of evaporation do not scale to larger evaporation domains. This is exemplarily shown in Figure 10a,b, which are obtained by dividing the evaporation rates from Figure 7 by the respective area of the evaporation domain to obtain the evaporative flux Q.
Q = q L 1.6   m m
From Figure 10a,b, it can easily be seen how measurements obtained for short domains (low L values) result in very high evaporative fluxes (Q) when normalized with the evaporation domain area. However, these fluxes do not scale with size as the unit would suggest. Contrarily, experiments performed with only long evaporation domains cannot resolve the local differences in vapor removal, which are much larger at the beginning of the domain and reduce while saturation in the gas channel increases along the domain. Therefore, when consulting literature values for evaporation rates from fuel cell GDLs, one has to examine carefully what vapor transport limitation is present, what the boundary conditions are, and what domain size was investigated. While not the subject of the current study, it is important to note that heat transfer limitations may also play a role if the local evaporation rates become too high or thermal conductivities of the measurement setup materials are too low.

5. Conclusions

Diffusive and convective limitations to the evaporation of water from fuel cell GDLs were investigated using an ex situ cell capable of measuring accurate evaporation rates at various fuel cell operation conditions. Furthermore, a 2D along-the-channel model was applied, enabling insights into spatially resolved humidity distributions. The model results showed good agreement with experimental data without the need for any fitting parameters, using only literature values for the structural bulk properties of the GDL together with information about the geometry of the experiment.
Increasing the gas velocity results in an increase of the evaporation rate until eventually a plateau was reached, after which further increases of the gas velocity show almost no further evaporation rate increase. A clear transition from convection limited evaporation, at low gas velocities, to diffusion limited evaporation, at high gas velocities, was observed and the average humidity in the gas channel was identified as the ruling property for the transition. Up to an average humidity of 25% in the gas channel, diffusion through the GDL was the main limitation for the evaporation of water. With increasing saturation in the gas channel, the diffusive vapor transport through the GDL decreased and ceased once the channel saturation reached 100%, as is the case for low gas flow velocities or long domains. In general, an uneven evaporation distribution along the channel was observed where the majority of the water evaporates over a short initial distance, saturating the gas channel and decreasing evaporation further downstream.
From both the experiments and the model, the contributions of through-plane and edge diffusion in the GDL could be identified for diffusion-limited conditions. The contribution of edge diffusion can be almost 50% for a 1 mm evaporative domain, but levels of 10% at L = ~5 mm and ~8.5 mm at 30 °C and 60 °C, respectively. From the through-plane contribution, an upper limit for diffusive vapor transport through the GDL was determined to be 2.44 nL/s/mm at 60 °C.
Reducing the GDL thickness by a factor of 2 did not result in doubling the observed evaporation rates, which was found to be due to the contributions of edge regions of the evaporation domain as well as the accumulation of water vapor along the gas channel. With hydrogen as the carrier gas, and for very short domains, an increase in evaporation was found, which coincided with the increase of diffusivity compared with nitrogen gas. For larger evaporation domains, the saturation buildup in the gas channel reduces the diffusion flux through the GDL, lessening the impact of the increased diffusivity.
These factors highlight the importance of careful analysis of the boundary conditions under which evaporating rates are determined experimentally. Especially values normalized by area run the risk of unintentional bias, as experiments with short domains overestimate the rates of evaporation when scaled to larger domains. Contrarily, measurements performed with large domains do not resolve how unevenly the evaporation is distributed across the evaporative domain.

Author Contributions

Conceptualization, A.M. (Adrian Mularczyk), J.E., F.N.B. and T.J.S.; methodology, A.M. (Adrian Mularczyk), J.E., F.N.B., A.M. (Andreas Michalski) and M.S.; software, A.M. (Adrian Mularczyk), A.M. (Andreas Michalski), M.S. and R.H.; validation, A.M. (Adrian Mularczyk); formal analysis, A.M. (Adrian Mularczyk); investigation, A.M. (Adrian Mularczyk); writing—original draft preparation, A.M. (Adrian Mularczyk), A.M. (Andreas Michalski) and M.S.; writing—review and editing, A.M. (Adrian Mularczyk), A.M. (Andreas Michalski), M.S., R.H., J.E., F.N.B. and T.J.S.; visualization, A.M. (Adrian Mularczyk), A.M. (Andreas Michalski); supervision, J.E., M.S., F.N.B. and T.J.S. All authors have read and agreed to the published version of the manuscript.

Funding

The authors gratefully acknowledge the Swiss National Science Foundation (grant no. 169913), the Swiss Competence Center for Energy Research: Efficient Technologies and Systems for Mobility (SCCER Mobility), and the Swiss Federal Office of Energy (SFOE) (contract number SI/501764-01) for financial support for this research.

Institutional Review Board Statement

Not applicable.

Informed Consent Statement

Not applicable.

Data Availability Statement

The data presented in this study are available on request from the corresponding author.

Acknowledgments

The authors would like thank Yu Kakizawa for his contribution of analyzing the velocity profiles in the gas channel and the GDL using Geodict simulations. Furthermore, Thomas Gloor and Marcel Hottiger are acknowledged for their support towards setup development and software implementation.

Conflicts of Interest

The authors declare no conflict of interest. The funders had no role in the design of the study; in the collection, analyses, or interpretation of data; in the writing of the manuscript, or in the decision to publish the results.

Glossary

AbbreviationMeaning
GDLGas diffusion layer
cConcentration
CLCatalyst layer
dTPTP coefficient
dIPIP coefficient
DDiffusivity
HGDLThickness GDL
HchChannel height
IPIn-plane
PEFCPolymer electrolyte fuel cell
XTMX-ray tomographic microscopy
LEvaporative domain length
L1Laser level 1
L2Laser level 2
m ˙ ev Total evaporative flow rate
QEvaporative flux
qEvaporation rate
tTime
TTemperature
TPThrough-plane
υVelocity
VVolume
WchChannel width
ΔxDomain increment in x
ΔzDomain increment in z

Appendix A

Appendix A.1. Governing Equations

The underlying processes can be described by the convection-diffusion equation.
c t = · ( D c ) · ( v c ) + S
with water vapor concentration c in kg H 2 O / m 3 , time t in s, diffusivity D in m2/s, velocity vector v in m/s, and source/sink term S in kg H 2 O / ( m 3 s ) .
D and v are considered constant along the channel and stepwise constant (over one spatial increment) in the through-plane (TP) direction. As laminar flow is expected in the gas channels (Re < 200), v is assumed to show only a contribution in the x direction. Moreover, the evaporation process at the water surface is modelled as a fully saturated air boundary condition, thus S = 0 inside the computational domain. Based on these assumptions, Equation (A1) can be simplified for two-dimensional diffusion and one-dimensional convection without a source term as follows:
c t = D x ( 2 c x 2 ) + D z ( 2 c z 2 ) v x ( c x )
with D i as the diffusion coefficient and v i as the gas velocity in the respective direction i.

Appendix A.2. Model Implementation

In order to solve Equation (A2), the finite difference method was applied and implemented in MATLAB®. Equation (A3) shows the implicit discretization of the partial differential equation (Equation (A2)), using the central difference scheme for the diffusion process and the upwind scheme for the convection process (as the Peclet number is sufficiently large (Pe > |2|) [43]). The implicit implementation is unconditionally stable with respect to the time step Δ t , and thus allows for rapid and accurate calculation of the steady-state solution.
c x , z t c x , z t 1 Δ t = D x c x 1 , z t 2 c x , z t + c x + 1 , z t Δ x 2 + D z c x , z 1 t 2 c x , z t + c x , z + 1 t Δ z 2 v x c x , z t c x 1 , z t Δ x
where c x , z t is the water vapor concentration at position x, z at time t and Δ is the step size of the respective variable.
The implemented boundary conditions are depicted in Figure 2. Gas with no humidity and a defined velocity profile v x ( z ) enters the channel at the inlet and leaves the channel on the right side at the outlet, leading to convective fluxes across the system boundaries. In order to model the evaporation at the interface between the water and the GDL, fully saturated gas is assumed and, therefore, a Dirichlet boundary condition (full saturation at the interface) is implemented. The saturation concentration is calculated with the Antoine equation as a function of temperature and ideal gas behavior is assumed. Moreover, no-flux conditions are assigned to all other boundaries and the diffusive flux across the channel inlet and outlet is assumed to be negligible. The velocity profile is obtained by first determining v x ( z , y ) using the following equation from Shah et al. [44]:
v x ( z , y ) = v m a x [ 1 ( | z | H c h / 2 ) n ] [ 1 ( | y | W c h / 2 ) m ]
where H c h and W c h are the height and width of the channel, respectively, with n = 2.0125 and m = 3.6739 (according to Shah et al. [44] for the given channel geometry). This profile is then averaged over the y-direction to obtain v x ( z ) as depicted in Figure A1 (solid lines).
Figure A1. Exemplary analytical velocity profiles v x ( z ) (solid lines) compared with velocity profiles obtained from GeoDict simulations (hollow lines). The legend values refer to the system inlet velocity (at standard conditions), while the graph depicts the respective profiles at 60 °C in the channel.
Energies 14 02967 g0a1
To assess the validity of this approach, the obtained profiles were compared to 3D velocity profiles from GeoDict (FlowDict, Navier-Stokes(-Brinkman) LIR from Math2Market GmbH, Kaiserslautern, Germany) simulations of gas flowing through an equivalent channel domain over a Toray GDL. For comparison, the simulated velocity profile was averaged over the width of the channel domain as well (Figure A1, hollow lines). The simulated profiles show good agreement with the analytical velocities in the investigated velocity range and only differ slightly, in that the simulated velocity profiles exhibits some penetration into the upper regions of the GDL domain and a slightly shifted peak position in the channel.
To capture the inhomogeneous effect of the GDL on the diffusion process, the diffusivity in the GDL domain D G D L was derived from the binary diffusivity D with an in-plane (IP) and TP relative diffusivity coefficient, d I P and d T P , respectively, so that D x G D L = d I P D and D z G D L = d T P D . These coefficients were obtained from the literature for bulk GDL properties of Toray GDLs [41,42] and are listed in Table 2.
The formulation of Equation (A3) for each position (x, z) in the model domain with implemented boundary conditions yields a system of linear equations that is solved numerically at each time step for c x , z t . The convergence criteria are set to a relative change in concentration lower than 10−10 between two iterations. To obtain accurate results, the spatial resolution was refined in both dimensions until a further duplication of resolution resulted in less than 0.5% change of the result, yielding a spatial resolution of Δ x = Δ z = 1   µ m .
In order to account for in-plane diffusion effects, the calculation domain in the x direction is required to be larger than L. Therefore, an additional 100 μm was stepwise added on both sides of the evaporation domain, until a further increase of the GDL length led to no significant changes (<0.5%) in the calculated concentration profile. This was achieved at 1.3 mm added length. As the maximum possible gradient on both sides of the evaporation domain is identical and nearly independent of L, this additional channel length is added to both sides of all evaporation domains investigated (see Figure 2).
The total evaporation rate is computed as the stationary flow rate of water exiting the model domain at the channel outlet, as follows:
m ˙ ev = 1 2 W c h Δ z ( c ( 0 ) v ( 0 ) + c ( H c h ) v ( H c h ) + z = Δ z z = H c h Δ z 2 c ( z ) v x ( z ) )
with m ˙ ev being the total evaporative flow rate in k g H 2 O / s , Δ z the height of an element in the through-plane direction in m, and W c h the channel width in m. For better comparison to the experimental results, the volume flow rate of liquid water can be computed as the evaporative flow rate divided by the density of liquid water ρ H 2 O under standard conditions ( V ˙ H 2 O = m ˙ ev / ρ H 2 O ) .

References

  1. Hinatsu, J.T.; Mizuhata, M.; Takenaka, H. Water Uptake of Perfluorosulfonic Acid Membranes from Liquid Water and Water Vapor. J. Electrochem. Soc. 1994, 141, 1493–1498. [Google Scholar] [CrossRef]
  2. Bellows, R.J. Neutron Imaging Technique for In Situ Measurement of Water Transport Gradients within Nafion in Polymer Electrolyte Fuel Cells. J. Electrochem. Soc. 1999, 146, 1099. [Google Scholar] [CrossRef]
  3. Yang, X.G.; Zhang, F.Y.; Lubawy, A.L.; Wang, C.Y. Visualization of Liquid Water Transport in a PEFC. Electrochem. Solid-State Lett. 2004, 7, A408. [Google Scholar] [CrossRef]
  4. Médici, E.F.; Allen, J.S. Evaporation, two phase flow, and thermal transport in porous media with application to low-temperature fuel cells. Int. J. Heat Mass Transf. 2013, 65, 779–788. [Google Scholar] [CrossRef]
  5. Jayakumar, A. A comprehensive assessment on the durability of gas diffusion electrode materials in PEM fuel cell stack. Front. Energy 2019, 13, 325–338. [Google Scholar] [CrossRef]
  6. Park, S.; Popov, B.N. Effect of a GDL based on carbon paper or carbon cloth on PEM fuel cell performance. Fuel 2011, 90, 436–440. [Google Scholar] [CrossRef]
  7. El-Kharouf, A.; Rees, N.V.; Steinberger-Wilckens, R. Gas Diffusion Layer Materials and their Effect on Polymer Electrolyte Fuel Cell Performance—Ex Situ and In Situ Characterization. Fuel Cells 2014, 14, 735–741. [Google Scholar] [CrossRef]
  8. Park, S.; Lee, J.-W.; Popov, B.N. A review of gas diffusion layer in PEM fuel cells: Materials and designs. Int. J. Hydrogen Energy 2012, 37, 5850–5865. [Google Scholar] [CrossRef]
  9. Jayakumar, A.; Sethu, S.P.; Ramos, M.; Robertson, J.; Al-Jumaily, A. A technical review on gas diffusion, mechanism and medium of PEM fuel cell. Ionics 2015, 21, 1–18. [Google Scholar] [CrossRef]
  10. Nagai, Y.; Eller, J.; Hatanaka, T.; Yamaguchi, S.; Kato, S.; Kato, A.; Marone, F.; Xu, H.; Büchi, F.N. Improving water management in fuel cells through microporous layer modifications: Fast operando tomographic imaging of liquid water. J. Power Sources 2019, 435, 226809. [Google Scholar] [CrossRef]
  11. Andersson, M.; Mularczyk, A.; Lamibrac, A.; Beale, S.B.; Eller, J.; Lehnert, W.; Büchi, F.N. Modeling and synchrotron imaging of droplet detachment in gas channels of polymer electrolyte fuel cells. J. Power Sources 2018, 404, 159–171. [Google Scholar] [CrossRef]
  12. Bazylak, A.; Sinton, D.; Djilali, N. Dynamic water transport and droplet emergence in PEMFC gas diffusion layers. J. Power Sources 2008, 176, 240–246. [Google Scholar] [CrossRef]
  13. Tüber, K.; Pócza, D.; Hebling, C. Visualization of water buildup in the cathode of a transparent PEM fuel cell. J. Power Sources 2003, 124, 403–414. [Google Scholar] [CrossRef]
  14. Zhang, F.Y.; Yang, X.G.; Wang, C.Y. Liquid Water Removal from a Polymer Electrolyte Fuel Cell. J. Electrochem. Soc. 2006, 153, A225. [Google Scholar] [CrossRef]
  15. Anderson, R.; Zhang, L.; Ding, Y.; Blanco, M.; Bi, X.; Wilkinson, D.P. A critical review of two-phase flow in gas flow channels of proton exchange membrane fuel cells. J. Power Sources 2010, 195, 4531–4553. [Google Scholar] [CrossRef]
  16. Ihonen, J.; Mikkola, M.; Lindbergh, G.r. Flooding of Gas Diffusion Backing in PEFCs. J. Electrochem. Soc. 2004, 151, A1152. [Google Scholar] [CrossRef] [Green Version]
  17. Shen, J.; Xu, L.; Chang, H.; Tu, Z.; Chan, S.H. Partial flooding and its effect on the performance of a proton exchange membrane fuel cell. Energy Convers. Manag. 2020, 207, 112537. [Google Scholar] [CrossRef]
  18. Cochet, M.; Forner-Cuenca, A.; Manzi, V.; Siegwart, M.; Scheuble, D.; Boillat, P. Novel Concept for Evaporative Cooling of Fuel Cells: An Experimental Study Based on Neutron Imaging. Fuel Cells 2018, 18, 619–626. [Google Scholar] [CrossRef]
  19. Forner-Cuenca, A.; Biesdorf, J.; Lamibrac, A.; Manzi-Orezzoli, V.; Büchi, F.N.; Gubler, L.; Schmidt, T.J.; Boillat, P. Advanced Water Management in PEFCs: Diffusion Layers with Patterned Wettability. J. Electrochem. Soc. 2016, 163, F1038–F1048. [Google Scholar] [CrossRef] [Green Version]
  20. Tranter, T.G.; Boillat, P.; Mularczyk, A.; Manzi-Orezzoli, V.; Shearing, P.R.; Brett, D.J.L.; Eller, J.; Gostick, J.T.; Forner-Cuenca, A. Pore Network Modelling of Capillary Transport and Relative Diffusivity in Gas Diffusion Layers with Patterned Wettability. J. Electrochem. Soc. 2020, 167, 114512. [Google Scholar] [CrossRef]
  21. Lal, S.; Lamibrac, A.; Eller, J.; Büchi, F.N. Determination of Water Evaporation Rates in Gas Diffusion Layers of Fuel Cells. J. Electrochem. Soc. 2018, 165, F652–F661. [Google Scholar] [CrossRef] [Green Version]
  22. Zenyuk, I.V.; Lamibrac, A.; Eller, J.; Parkinson, D.Y.; Marone, F.; Büchi, F.N.; Weber, A.Z. Investigating Evaporation in Gas Diffusion Layers for Fuel Cells with X-ray Computed Tomography. J. Phys. Chem. C 2016, 120, 28701–28711. [Google Scholar] [CrossRef] [Green Version]
  23. Battrell, L.; Patel, V.; Zhu, N.; Zhang, L.; Anderson, R. Imaging of the desaturation of gas diffusion layers by synchrotron computed tomography. J. Power Sources 2019, 416, 155–162. [Google Scholar] [CrossRef]
  24. Quick, C.; Ritzinger, D.; Lehnert, W.; Hartnig, C. Characterization of water transport in gas diffusion media. J. Power Sources 2009, 190, 110–120. [Google Scholar] [CrossRef]
  25. Cho, K.T.; Mench, M.M. Effect of material properties on evaporative water removal from polymer electrolyte fuel cell diffusion media. J. Power Sources 2010, 195, 6748–6757. [Google Scholar] [CrossRef]
  26. Sinha, P.K.; Wang, C.-Y. Gas Purge in a Polymer Electrolyte Fuel Cell. J. Electrochem. Soc. 2007, 154, B1158. [Google Scholar] [CrossRef]
  27. Safi, M.A.; Mantzaras, J.; Prasianakis, N.I.; Lamibrac, A.; Büchi, F.N. A pore-level direct numerical investigation of water evaporation characteristics under air and hydrogen in the gas diffusion layers of polymer electrolyte fuel cells. Int. J. Heat Mass Transf. 2019, 129, 1250–1262. [Google Scholar] [CrossRef]
  28. Safi, M.A.; Prasianakis, N.I.; Mantzaras, J.; Lamibrac, A.; Büchi, F.N. Experimental and pore-level numerical investigation of water evaporation in gas diffusion layers of polymer electrolyte fuel cells. Int. J. Heat Mass Transf. 2017, 115, 238–249. [Google Scholar] [CrossRef]
  29. Weber, A.Z.; Darling, R.M.; Newman, J. Modeling Two-Phase Behavior in PEFCs. J. Electrochem. Soc. 2004, 151, A1715. [Google Scholar] [CrossRef]
  30. Eikerling, M. Water Management in Cathode Catalyst Layers of PEM Fuel Cells. J. Electrochem. Soc. 2006, 153, E58. [Google Scholar] [CrossRef]
  31. Fritz, D.L.; Allen, J.S. Evaporation Modeling for Proton Exchange Membrane Fuel Cells. ECS Trans. 2019, 25, 49–58. [Google Scholar] [CrossRef]
  32. Pasaogullari, U.; Mukherjee, P.P.; Wang, C.-Y.; Chen, K.S. Anisotropic Heat and Water Transport in a PEFC Cathode Gas Diffusion Layer. J. Electrochem. Soc. 2007, 154, B823. [Google Scholar] [CrossRef]
  33. Vetter, R.; Schumacher, J.O. Experimental parameter uncertainty in proton exchange membrane fuel cell modeling. Part I: Scatter in material parameterization. J. Power Sources 2019, 438, 227018. [Google Scholar] [CrossRef] [Green Version]
  34. Mularczyk, A.; Lin, Q.; Blunt, M.J.; Lamibrac, A.; Marone, F.; Schmidt, T.J.; Büchi, F.N.; Eller, J. Droplet and Percolation Network Interactions in a Fuel Cell Gas Diffusion Layer. J. Electrochem. Soc. 2020, 167, 084506. [Google Scholar] [CrossRef] [Green Version]
  35. Xu, H.; Bührer, M.; Marone, F.; Schmidt, T.J.; Büchi, F.N.; Eller, J. Fighting the Noise: Towards the Limits of Subsecond X-ray Tomographic Microscopy of PEFC. ECS Trans. 2017, 80, 395–402. [Google Scholar] [CrossRef]
  36. Eller, J.; Marone, F.; Büchi, F.N. Operando Sub-Second Tomographic Imaging of Water in PEFC Gas Diffusion Layers. ECS Trans. 2015, 69, 523–531. [Google Scholar] [CrossRef]
  37. Xu, H.; Bührer, M.; Marone, F.; Schmidt, T.J.; Büchi, F.N.; Eller, J. Optimal Image Denoising for In Situ X-ray Tomographic Microscopy of Liquid Water in Gas Diffusion Layers of Polymer Electrolyte Fuel Cells. J. Electrochem. Soc. 2020, 167, 104505. [Google Scholar] [CrossRef]
  38. Eller, J.; Rosén, T.; Marone, F.; Stampanoni, M.; Wokaun, A.; Büchi, F.N. Progress in In Situ X-Ray Tomographic Microscopy of Liquid Water in Gas Diffusion Layers of PEFC. J. Electrochem. Soc. 2011, 158, B963. [Google Scholar] [CrossRef]
  39. Zenyuk, I.V.; Parkinson, D.Y.; Hwang, G.; Weber, A.Z. Probing water distribution in compressed fuel-cell gas-diffusion layers using X-ray computed tomography. Electrochem. Commun. 2015, 53, 24–28. [Google Scholar] [CrossRef] [Green Version]
  40. Schwertz, F.A.; Brow, J.E. Diffusivity of Water Vapor in Some Common Gases. J. Chem. Phys. 1951, 19, 640–646. [Google Scholar] [CrossRef]
  41. Moosavi, S.M.; Niffeler, M.; Gostick, J.; Haussener, S. Transport characteristics of saturated gas diffusion layers treated with hydrophobic coatings. Chem. Eng. Sci. 2018, 176, 503–514. [Google Scholar] [CrossRef]
  42. Flückiger, R.; Freunberger, S.A.; Kramer, D.; Wokaun, A.; Scherer, G.G.; Büchi, F.N. Anisotropic, effective diffusivity of porous gas diffusion layer materials for PEFC. Electrochim. Acta 2008, 54, 551–559. [Google Scholar] [CrossRef]
  43. Versteeg, H.K.; Malalasekera, W. An Introduction to Computational Fluid Dynamics: The Finite Volume Method; Pearson Education Ltd.: Harlow, UK; New York, NY, USA, 2007. [Google Scholar]
  44. Shah, R.K.; London, A.L. Chapter VII—Rectangular Ducts. In Laminar Flow Forced Convection in Ducts; Shah, R.K., London, A.L., Eds.; Academic Press: Cambridge, MA, USA, 1978; pp. 196–222. [Google Scholar] [CrossRef]
Figure 1. (a) Experimental setup consisting of syringe, injection cell, and laser levels (L1 and L2), as well as the cell used to measure evaporation rates. The close-up of the injection cell shows the flow field with a single gas channel (gas path highlighted in green), the injector used to guide the water to the base of the gas diffusion layer (GDL), the pool gasket with an exemplary evaporation domain geometry, and the seal used to prevent leakage and control the compression of the GDL. (b) Through-plane X-ray tomographic microscopy (XTM) image along the gas channel of the cell showing the arrangement of the cell components as well as the waterfront established under the GDL. The close-up of the injection cell shows the flow field with a single gas channel (gas path highlighted in green), the injector used to guide the water to the base of the GDL, the pool gasket with an exemplary evaporation domain geometry, and the seal used to prevent leakage and control the compression of the GDL. (b) Reconstructed tomography images perpendicular to and along the gas channel of the cell, showing the arrangement of the cell components as well as the waterfront maintained under the GDL.
Energies 14 02967 g001
Figure 2. Boundary conditions and measures of the model domain. Dirichlet condition at the water/GDL interface (red) and convective flux with defined velocity profile (blue) between the inlet and outlet of the channel, with the gray section highlighting the GDL domain. No-flux conditions are assigned to all other boundaries.
Energies 14 02967 g002
Figure 3. Evaporation rates q measured as a function of gas inlet velocities; (a) at a constant temperature of 60 °C for the measured evaporation domain lengths (markers) and the values obtained by the model (dashed lines); (b) at a constant evaporation domain length of L = 10 mm at different temperatures. The dotted line in (a) indicates the maximum moisture carrying capability of the gas flow in the channel when fully saturated at 60 °C.
Energies 14 02967 g003
Figure 4. (a) Measured evaporation rates averaged over the velocities of 4–10 m/s as a function of L for different temperatures. The lines represent linear fits through the respective data points. The error bars indicate the standard deviation between the evaporation rates at different velocities. (b) Sketch indicating the diffusive domains in the GDL above the evaporation domain of length L. Pure through-plane (TP) diffusion in green and edge contributions in red.
Energies 14 02967 g004
Figure 5. Relative humidity (RH) distributions inside the simulated domain at T = 60 °C: (a) L = 0.8 mm and v G a s , i n = 0.5 m/s; (b) L = 0.8 mm and v G a s , i n = 6 m/s; (c) L = 2.4 mm and v G a s , i n = 0.5 m/s; (d) L = 2.4 mm and v G a s , i n = 6 m/s. The black lines indicate the middle of the gas channel (A), the GDL/gas channel interface (B), the middle of the GDL (C), and the bottom of the GDL (D). For visibility, the white lines mark 1% RH increments up to 10% RH. The blue dashed regions indicate the location and extent of the evaporation domain. In-plane (IP) and TP positions refer to the in-plane (along the channel) and through-plane dimensions of the simulated domain.
Energies 14 02967 g005
Figure 6. Modelled relative humidity (RH) values extracted at lines A–D as indicated in Figure 5 for v G a s , i n = 0.5 m/s shown in (a) and   v G a s , i n = 6 m/s in (b). IP positions refer to the in-plane (along the channel) dimensions of the simulated domain in accordance with Figure 5.
Energies 14 02967 g006
Figure 7. Simulated evaporation rates (q) as a function of the evaporative domain length (L) for (a) different inlet gas velocities at 60 °C and (b) varying temperatures at an inlet velocity of 6 m/s. The dotted lines indicate the average relative humidity at the outlet of the gas channel at the respective conditions.
Energies 14 02967 g007
Figure 8. (a) Normalized evaporation rates as function of evaporative domain length (L) for several gas velocities comparing 100% GDL thickness (310 µm) and 50% GDL thickness (155 µm). (b) Relative evaporation rate increase observed by reducing the GDL by 50% as function of L.
Energies 14 02967 g008
Figure 9. (a) Modelled effect of carrier gas change from nitrogen to hydrogen at 60 °C on the normalized evaporation rate evolution as a function of evaporative domain length (L). (b) Relative evaporation rate increase as a function of L.
Energies 14 02967 g009
Figure 10. Simulated evaporative fluxes (Q), obtained using Equation (4), normalizing the evaporation rates with the area of the evaporation domain as function of the evaporative domain length (L) for (a) different inlet gas velocities at 60 °C and (b) varying temperatures at an inlet velocity of 6 m/s.
Energies 14 02967 g010
Table 1. Experimental parameters.
ParameterRangeUnit
Evaporation domain length (L) (1.6 mm width)0.8, 1.5, 2.4, 5, 10mm
Temperature30, 40, 50, 60°C
Gas velocity 10.5, 1, 2, 4, 6, 8, 10m/s
1 Velocities represent dry gas velocities supplied by the mass flow controller at 25 °C and 1 bar before being heated to the respective experimental temperature.
Table 2. Simulation parameters.
Evaporation Domain Length (L)0–10 mm10–200 mmUnits
Evaporation domain increments0.410mm
Δx110µm
Δz12µm
Computation domain lengthL + 2 × 1.3mm
Thickness GDL (HGDL)155, 310µm
Channel height (Hch)300µm
Channel width (Wch)800µm
Temperature ( T )30, 40, 50, 60°C
Gas inlet velocity ( v G a s , i n )0.5, 1, 2, 4, 6, 8, 10m/s
Diffusivity (H2O in N2) 1(0.176 + 0.0023 T) × 10−4m2/s
Diffusivity (H2O in H2) 1(0.8912 + 0.0039 T) × 10−4m2/s
TP coefficient ( d TP ) 20.28-
IP coefficient ( d IP ) 31.9 × d T P -
1 Linear fit from data for nitrogen and hydrogen with T in °C [40]; 2 from [41]; 3 in-plane (IP)/through-plane (TP) ratio for TGP-H 060 10 wt% PTFE gas diffusion layers (GDLs) from [42].
Table 3. Slopes and ordinates of linear fits to the measured evaporation rates shown in Figure 4a and the respective values obtained from the model.
ExperimentalNumerical
Slope [nL/s/mm]Ordinate [nL/s]Slope [nL/s/mm]Ordinate [nL/s]
30 °C0.460.230.460.26
40 °C0.830.610.840.48
50 °C1.471.121.480.85
60 °C2.442.112.491.44
Publisher’s Note: MDPI stays neutral with regard to jurisdictional claims in published maps and institutional affiliations.

