
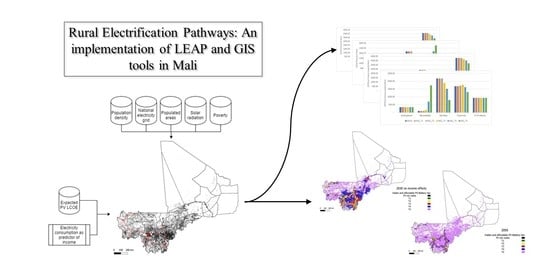
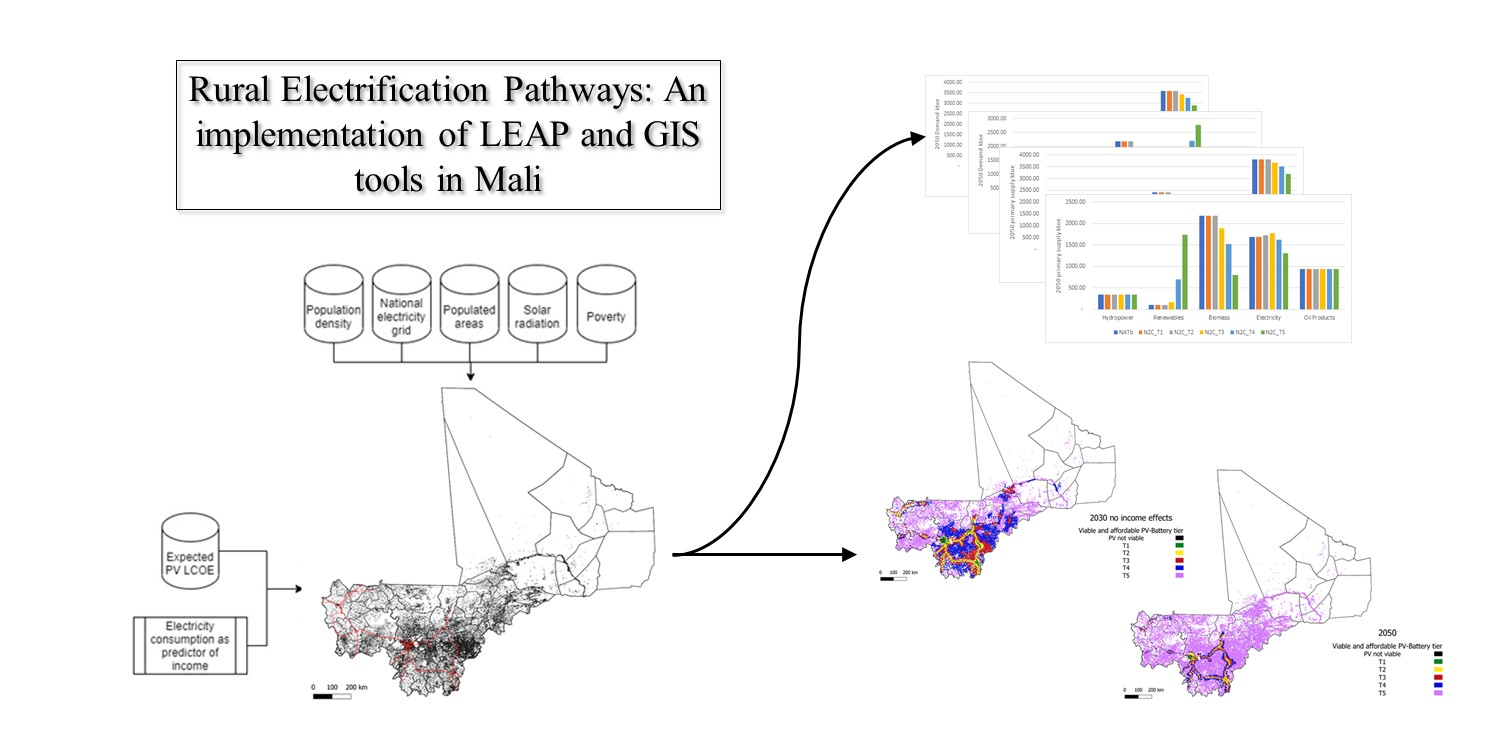
Rural Electrification Pathways: An Implementation of LEAP and GIS Tools in Mali


1
Institute for Technology and Resources Management in the Tropics and Subtropics, TH Köln (University of Applied Sciences), Betzdorfer Strasse 2, 50679 Cologne, Germany
2
Faculty of Sciences and Techniques of the University of Sciences, Techniques and Technologies of Bamako, USTT-B (FAST), Bamako BPE 3206, Mali
*
Author to whom correspondence should be addressed.
Energies 2021, 14(11), 3338; https://0-doi-org.brum.beds.ac.uk/10.3390/en14113338
Submission received: 29 April 2021
/
Revised: 31 May 2021
/
Accepted: 2 June 2021
/
Published: 6 June 2021
(This article belongs to the Special Issue Rural Renewable Energy Utilization and Electrification)
Abstract
:Remote rural populations do not often have the luxury of viable multisource electricity generation systems. Considering fossil fuels for remote populated areas is not often a viable option due to the fuel transportation costs and the population’s socioeconomic status. Extending the grid is often economically prohibitive. This paper proposes possible ways in which Mali could increase the rate of population with access to electricity by 2050 using Low Emission Analysis Platform (LEAP) and geographical information tools. The current energy situation is assessed, and multiple demand and supply scenarios are created to find the most viable option in environmental and economic dimensions. A minimum of 50% reduction of biomass consumption in the residential sector and a maximum of 71% was achieved through the combination of grid extension and decentralized solar PV. Solar PV becomes the preferable option when enough time for the effects of electricity on income is given. When these effects are not present, solar PV is still a better option, as the amount of biomass replaced with electricity is reduced.
1. Introduction
As of 2019, 44% of the global population still lives in rural areas [1]. Even though globally, 82% of the rural population has access to electricity [2] in Sub-Saharan Africa, the access rate barely reaches 31% [3].
The impact electricity access can have on rural populations can be gleaned through the indicators used on multi-criteria decision-making studies [4,5], as most include among their dimensions economic, social, and environmental aspects. Among the indicators themselves, the share of the population with school education, electricity used for income-generating activities, indoor/outdoor pollution, access to entertainment and information, etc., speak about betterment in lifestyle for communities with access to electricity. Other aspects that electricity access has on rural populations also include the betterment of gender inequality and migration patterns [6].
Remote rural populations do not often have the luxury of viable multisource electricity generation systems, even though they are sometimes the most viable option for specific case scenarios [7]. In Sub-Saharan Africa, particularly in Mali, resource assessment points to either the use of renewables such as solar energy, hydropower where available [8], or fossil fuels. Hydropower is limited by the seasonality of Sub-Saharan climate, commonly characterized by rainy and dry seasons, and by location, as with no countrywide electricity grid, the generation remains local. Reaching remote populated areas with modern energy is not a simple task [9]. Recent studies highlight the need for increased research on institutional barriers, frameworks, and incentives to rural electrification [10]. The advantages of using decentralized renewable energy plants versus fossil-fueled generators have been widely studied [11,12,13]. Given the status of the technological advances of energy storage, the sore point of renewables, hybrid systems usually are proposed [14,15,16,17,18,19]. However, considering the use of fossil fuels for remote populated areas is not a viable option when fuel transportation costs and the socio-economic status of specific populations are taken into account.
Another solution is to extend the grid to reach the remote populated areas eventually. This solution, although it could ensure better reliability of the electricity service when coupled with enough centralized generation, is sometimes economically prohibitive [20]. In addition, even when the economics are left aside, reaching the remote locations would take more time than installing decentralized systems. Since un-electrified remote populations often lack economic resources [21], any solution should consider the current situation and seek to improve it.
The relationship between electricity consumption and income is not a new area of research. Isa et al. [22] found on their review study no clear direction for causality between energy consumption and economic growth seen as the Gross Domestic Product (GDP). This result concurs with Bridge et al. [23], where the result is causality that runs both ways between income and energy consumption. The study performed by Narayan and Smyth [24] concluded that in the long run, both employment and income Granger-cause electricity consumption while, in the short-run, electricity consumption has a weak granger-causality on income (GDP). Zhu et al. [25] concluded that residential demand is almost inelastic to income in the short term, while in the long term, some residential demand is elastic to income and price. Like these, most studies use statistical models that take GDP as an indicator to argue the impact of electricity consumption on income. However true, for poor rural populations, GDP is a poor indicator of income. Other studies, such as the one by Obermaier et al. [26], have found immediate social benefits following rural electrification while also failing to identify a direct short-run link between electricity consumption and average household income. Using the mean household income, de Rezende Francisco et al. [27] produced a formula that tries to predict the increase of income due to the increase in electricity consumption for Brazil, achieving an R2 value between 0.91 and 0.85. The work from Opiyo, N. [28] presents results that support the claim that new electrification temporally stimulates an increase in power demand in Sub-Saharan Africa. The present study makes use of the formula from Rezende Francisco et al. [27], modified for Mali under the assumption that both populations behave similarly on the electricity consumption levels considered (more on this step appears in Section 2).
Most of the studies that deal with the effects of electricity demand on income generation either use causality methods, as the studies mentioned above resume, or take specific case studies. Both of these cases use past data to derive or propose patterns. Nevertheless, almost no recent studies make use of this knowledge to propose or study future scenarios. From the studies that deal with spatial data, most of the recent ones make use of software such as Open Source Spatial Electrification Tool (OnSSET) [29] to produce their results [30,31,32,33,34]. Although a handy tool, this software does not consider the effect of electrification on income, and therefore spending capacity, of the population.
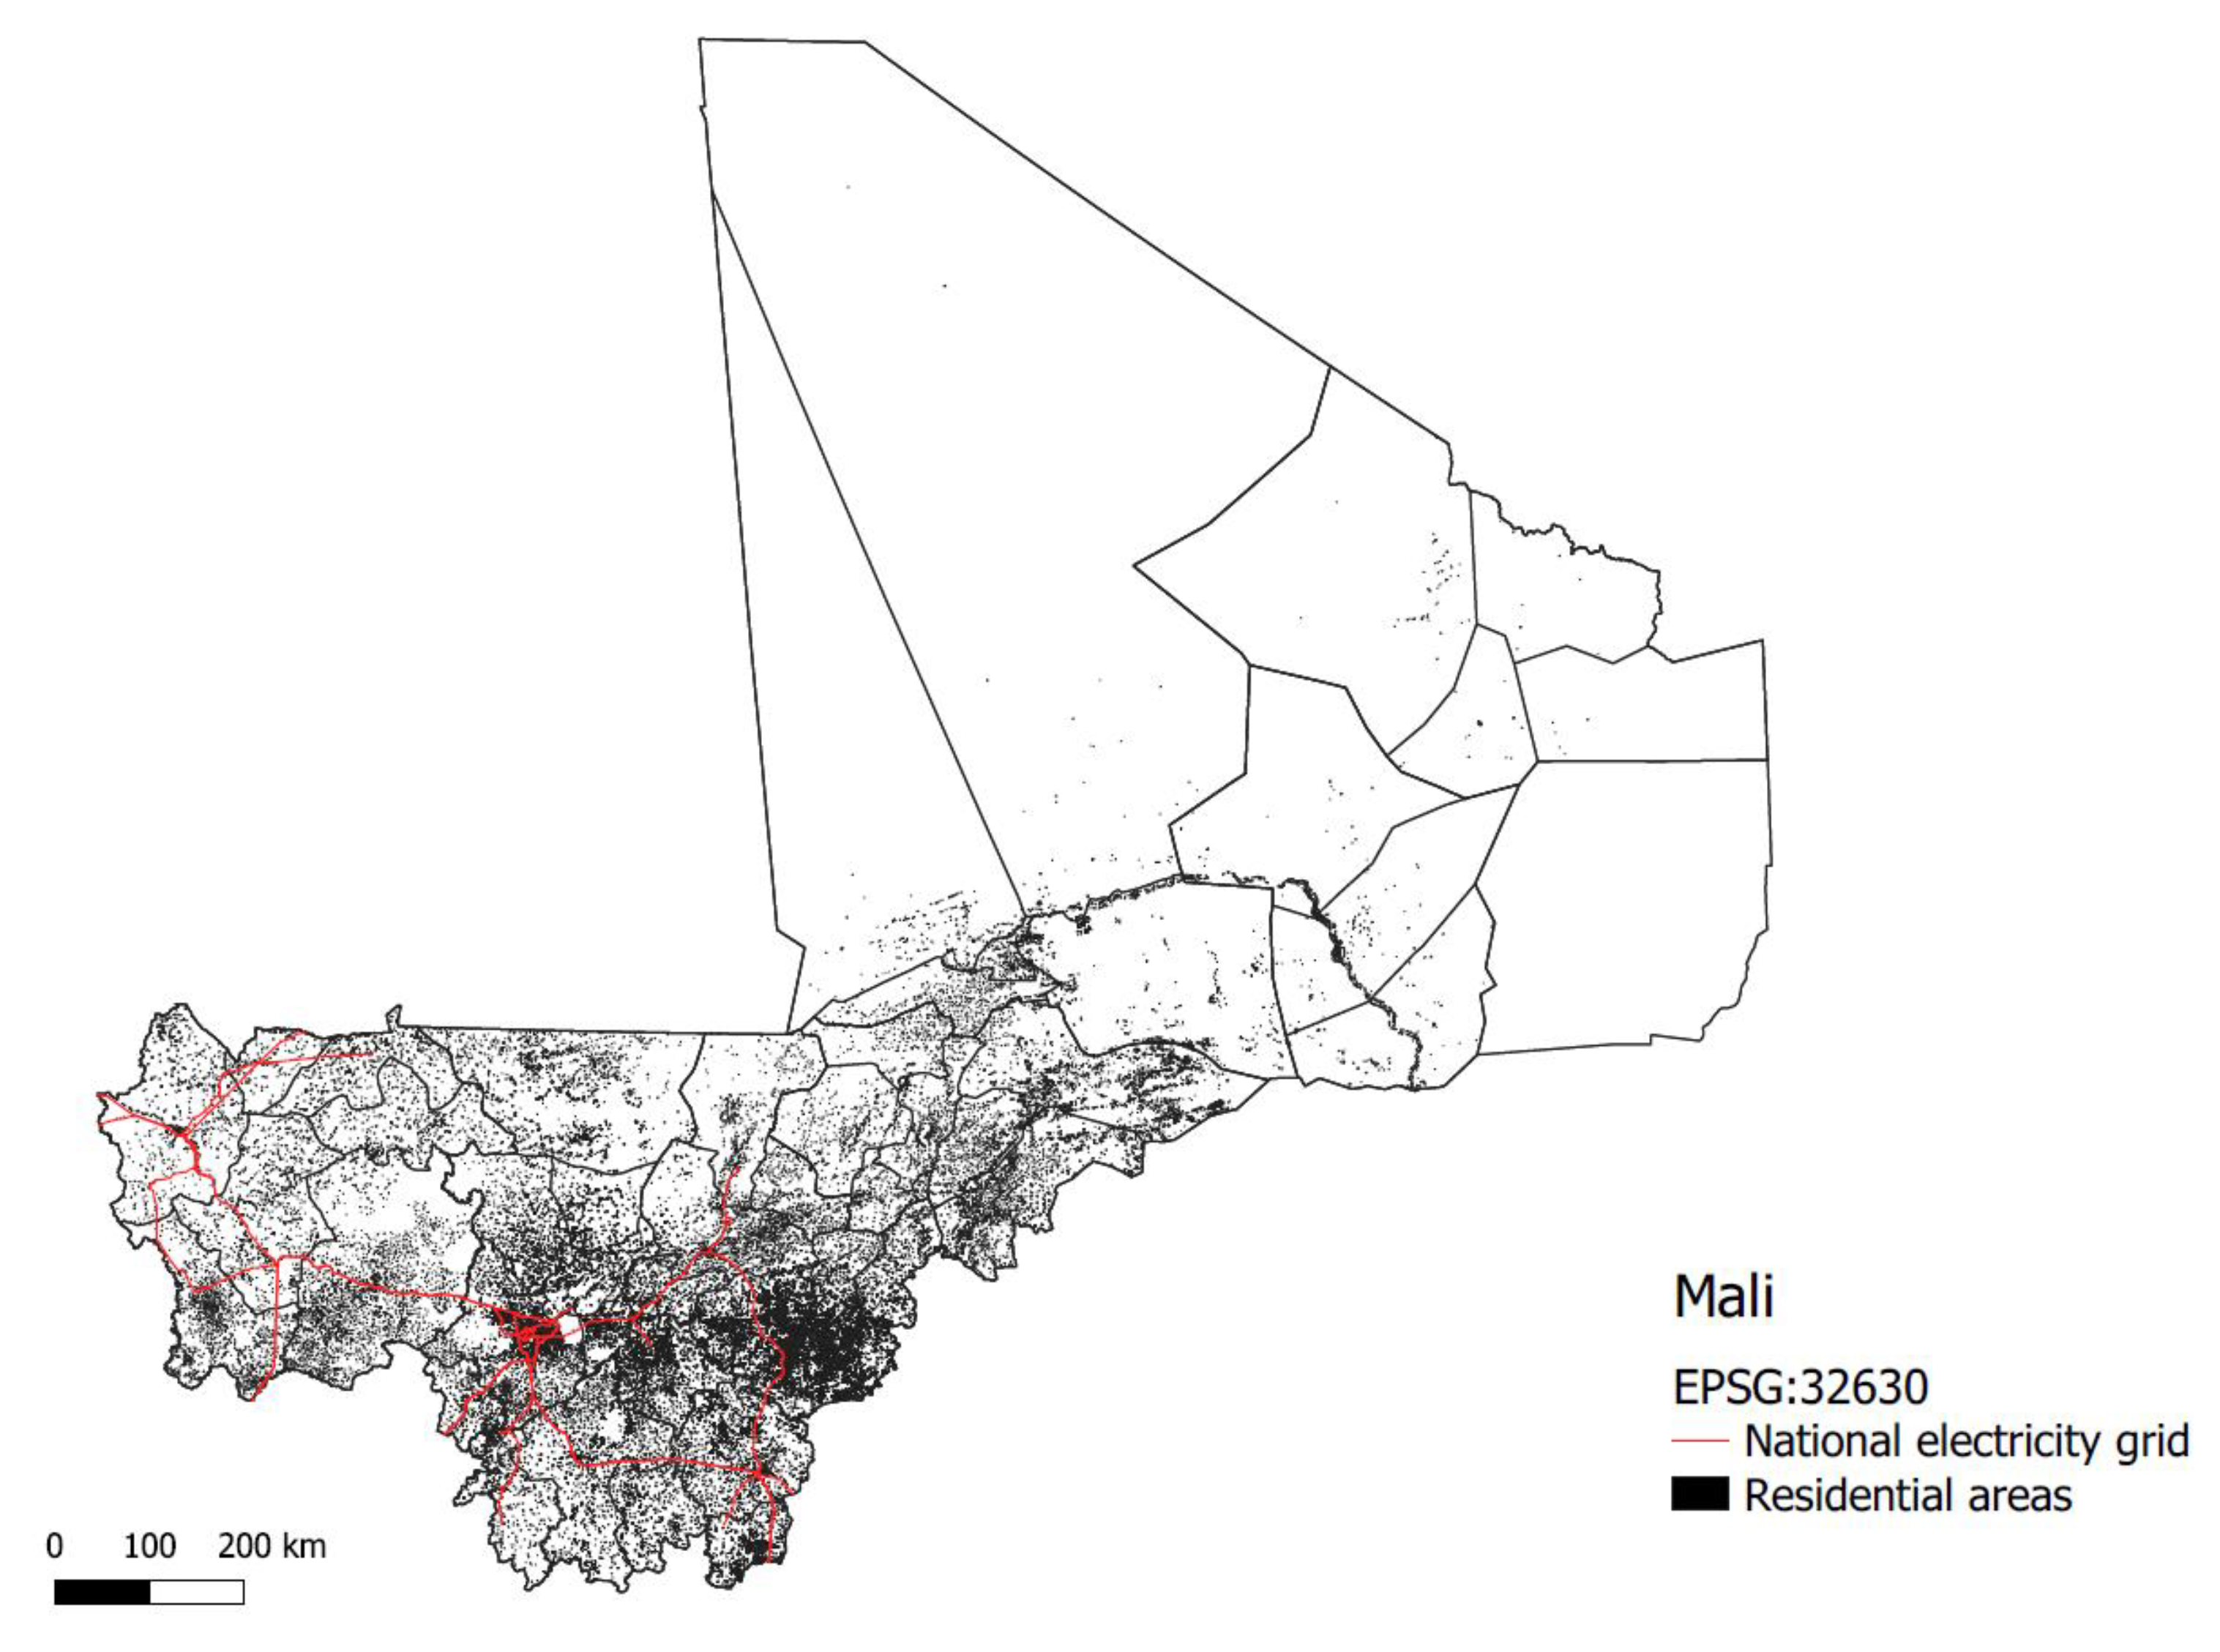
In 2016, the population of Mali was 17,994,837 [35] with a population growth of 2.98% [36]. Of them, 41% lived in urban areas. According to Institut National de la Statistique (INSAT) 2012 [37], the average household size in Mali in 1998 was 6.1, being 6.2 in 2009, and 6.12 in 2016. In 2016, 86% of the urban population and 19.39% of the rural population of Mali had access to electricity [38]. Growing to 25.62% in rural areas, while remaining at 86% in urban areas by 2017. The population of Mali is distributed across a vast territory, and, as Figure 1 displays, the national electricity grid does not reach most of it.
Some of the factors that limit rural electrification are topographic, fuel, transportation, and socioeconomic factors [4]. Hard-to-reach locations make the building of grid poles, transportation of material, and fuel less cost-efficient. The cost of extending the grid in Mali has been increasing through the years. In 2000, the cost of grid extension, according to a report published by the United Nations Development Programme (UNDP) and the World Bank [39], was USD 4400 per km without accounting for labor and transportation; in 2014, the cost of grid extension including labor, materials, and other costs was of USD 19,070 per km [40]. In 2019, the cost of extending the grid ranged from USD 30,798 to 35,282 per km [41]. The increase in the cost of grid extension has yet to show saturation and might continue to grow, which would be expected when considering progressive growth in labor costs.
Anaerobic digestion has been described as an excellent alternative to convert waste to energy to meet environmental and energetic targets [44]. It can provide energy when weather-dependent sources would not be able to [45], balancing a grid of renewable energy systems [46]. When enough energy from other renewables is available, storage, co-generation, and other productive uses become possible such as co-generating electricity and cold storage to reduce agricultural losses [47]. Integration of biogas plants to renewable grids such as biomass, hydropower, solar photovoltaic (PV), etc., in the right amounts, can lead to vastly more viable costs than grid extension [48]. Locations such as Sub-Saharan Africa, and specifically Mali [49], in which solar radiation is abundant [50,51] could make use of solar PV supported by biomass [48]. In its spatial component, the present study takes only the solar portion and compares it to grid extension. This limitation is a result of the lack of availability of reliable countrywide data to include it within the calculations.
To argue that an increase in electricity consumption leads to an increase in income generation, the electricity available has to include productive uses. The multi-tiered framework proposed by [5], which is built considering access to the productive application of energy, is used as a base for scenario building throughout this paper.
Therefore, the objective that the present work tries to accomplish is to identify whether complete rural electrification is achievable in Mali and what are some of the requirements for this to occur. Two main steps are taken to achieve this. First, the current energy situation of Mali is modeled using LEAP to identify the present and provable future electricity needs. Then, tiered electrification scenarios are studied using both LEAP and GIS to consider the location and characteristics of the different populated areas of Mali, taking into account the effects of new or increased electricity access on income generation.
The present paper is divided into material and methods, results, discussion, and conclusions.
2. Materials and Methods
This study utilizes two software packages to produce the results needed to accomplish the set objectives. LEAP, or Low Emission Analysis Platform, version 2020.1.0.20 Dictionary Version: 463 [52] and the open-source Geographic Information System QGIS 3.16 (64 bit) [53].
LEAP is a software widely used for energy modeling that matches supply and demand and can compare the interactions between different policies and scenarios [54]. Scenario analyses from 2016 to 2050 were performed using this software to ascertain what Mali will need in terms of energy and propose possible ways to supply it.
The key assumptions used to model the energy scenario of Mali were a population of 17,994,837 [36] with a population growth of 3%, an average household size of 6.3 [36], and an urban share of 40.78% [36] (The data used to model Mali’s energy consumption and current supply was compiled from different sources including EDM-SA (Energie Du Mali SA) [55,56]; National Institute of Statistics INSAT (Institut National de la Statistique) [37]; System of energetic information SIE (Système d’Information Energetique) [38,55]; the Beninese Rural Electrification and Energy Management Agency ABERME/MIERT (Agence Beninoise d’Electrification Rurale et de Maitrise d’Energie) [41]; and ECOWAS Center for Renewable Energies and Energy Efficiency CEREEC (Centre pour les Energies Renouvelables et lÉfficacité Energetique de la CEDEAO CEREEC) [57].). The number of households was defined as the total population divided by the average household size. Urban and rural households were assumed to be represented by the number of total households multiplied by the urban and rural shares, respectively (e.g., the total population divided by average household size multiplied by the urban share equals the number of households in urban areas).
Certain assumptions were necessary to model the energy distribution between urban and rural sectors and between each of the electrified and non-electrified sub-sectors.
For biomass, the share of the total biomass consumed by urban and rural areas was found to be 50.36% consumed in rural areas and 49.63% consumed in urban areas [58]. These shares were multiplied by the total biomass consumption in 2016 (data provided by USTT-B). The share of electrified and non-electrified homes in each area was multiplied by the respective urban and rural biomass consumption to find the amounts used by electrified and non-electrified sub-sectors:
is the total consumption of biomass per sub-sector, is the sub-sector biomass consumption ratio (%), is the total residential biomass consumption, and is the sub-sector ratio.
The electricity access rates (26% rural electricity access and 86% urban electricity access) were normalized into 23.21% of the total electricity consumed in the residential sector consumed by rural households and 76.79% by urban households. This value was then multiplied by the total electricity consumed in the residential sector:
where is the normalized electricity access rate of each sub-sector (%) and SSec is the sub-sector electricity access rate.
For petroleum, the usage of lamp oil was taken as representative of the petroleum products consumed in the residential sector. The region of Kayes was found to use 98% of the total lamp oil consumption in Mali and therefore was used as representative of the whole country. In Kayes, 73% of the population live in rural areas and 27% in urban areas [59]. The consumption was multiplied by the normalized urban and rural electrification rates of Mali (77% of the electricity consumed in the residential sector is consumed by the urban electrified homes and 23% by the rural electrified homes) to find the shares of lamp oil consumption in the electrified and non-electrified sectors of both rural and urban areas. These shares were then multiplied by the total amount of petroleum products consumed in the residential sector. Table 1 presents the values assumed representative of the consumption in Mali:
is the normalized residential petroleum product consumption rate per sub-sector (%), is the petroleum products consumption of each sub-sector, and is the total consumption of petroleum products in each sub-sector.
According to The World Bank [36], the industrial sector’s growth (represented by the world development indicator: Industry, value added as % of GDP) has had a trend of 2.5% growth per year from 1967 to 2007, decreasing over the years between 2008 and 2016. The activity level of the industrial sector (percentage of the population working in the industrial sector) in Mali is set to grow in proportion to the total population [57]. The industrial sector grew from 0.24% of the total population in 2016 to 0.53% by 2020 and is further expected to grow to 1.02% by 2030. Both the commercial and the transportation sectors are assumed to follow the population growth of 3% per year.
Transmission and distribution losses are taken as 22% from Système D’information Energétique SIE 2018 [38]; this value remains unchanged throughout the calculation years.
The availability (maximum percentage of hours that the process is available in each dispatch period) of Hydropower was taken as 44.59%, of Thermal stations as 14.39%, and renewables (modeled as solar PV) as 25% [60]. The Process energy efficiency for the thermal stations was given the value of 37.71% [60]. Value assumed valid for Mali.
According to the KfW Development Bank report, the conversion efficiency of LPG stoves is about 60% [61], while the conversion efficiency of traditional firewood for cooking is about 15% [61]. This difference in efficiency was taken into account for biomass replacement scenarios. Electricity and LPG stoves are assumed to have the same conversion efficiency.
According to Fondation Energía sin Fronteras [62], the biomass production in Mali is mainly firewood (see Figure 2). Therefore, the biomass consumption of Mali has been modeled as solely firewood.
As Mali produces its firewood, the resource was considered non-finite for the calculation years.
LEAP facilitates the study of the interaction between different scenarios. This makes the effects of single measures and combinations of measures able to be studied. This paper takes advantage of this functionality and studies ten scenarios built by combining two base scenarios with different measures and targets (see Table 2).
NATa and NATb are the base scenarios presented in Table 3. COM represents complete rural electrification, and T1 to T5 represent different tiers of electrification, see Table 4. NxC_Tn, with x = (1, 2) and n ranging from 1 to 5, are the ten scenarios studied. Each of these ten indicators is built by combining the effects of the sub-scenarios a–c.
One of the current targets of Mali, as well as other sub-Saharan countries, is to reduce the consumption of biomass of the residential sector to help combat the encroaching desertification. In this sense, the scenarios NATa and NATb look to reduce the biomass consumption by replacing it with LPG in scenario NATa and with electricity in scenario NATb.
The scenarios T1 to T5 are scenarios where different electrification tiers are used. These electrification tiers were defined by [5,63], where the minimum daily capacity per household for different tiers of electrification was defined (see Table 4). As the tiers of electrification consider the eventual use of electric appliances for cooking and water heating purposes, biomass consumption has been assumed reduce according to the tier of electrification.
Currently, Mali does not have a countrywide electricity network. See Figure 1. The LEAP model used does not consider the distinction between locations where a grid or network is available to transmit and distribute the electricity. Further analysis was made using QGIS to account for grid extension [53].
QGIS enables the geographical component to be included in modeling and can account for the difference between locations. This enables the component of “presence of electricity grid” to be included in the study.
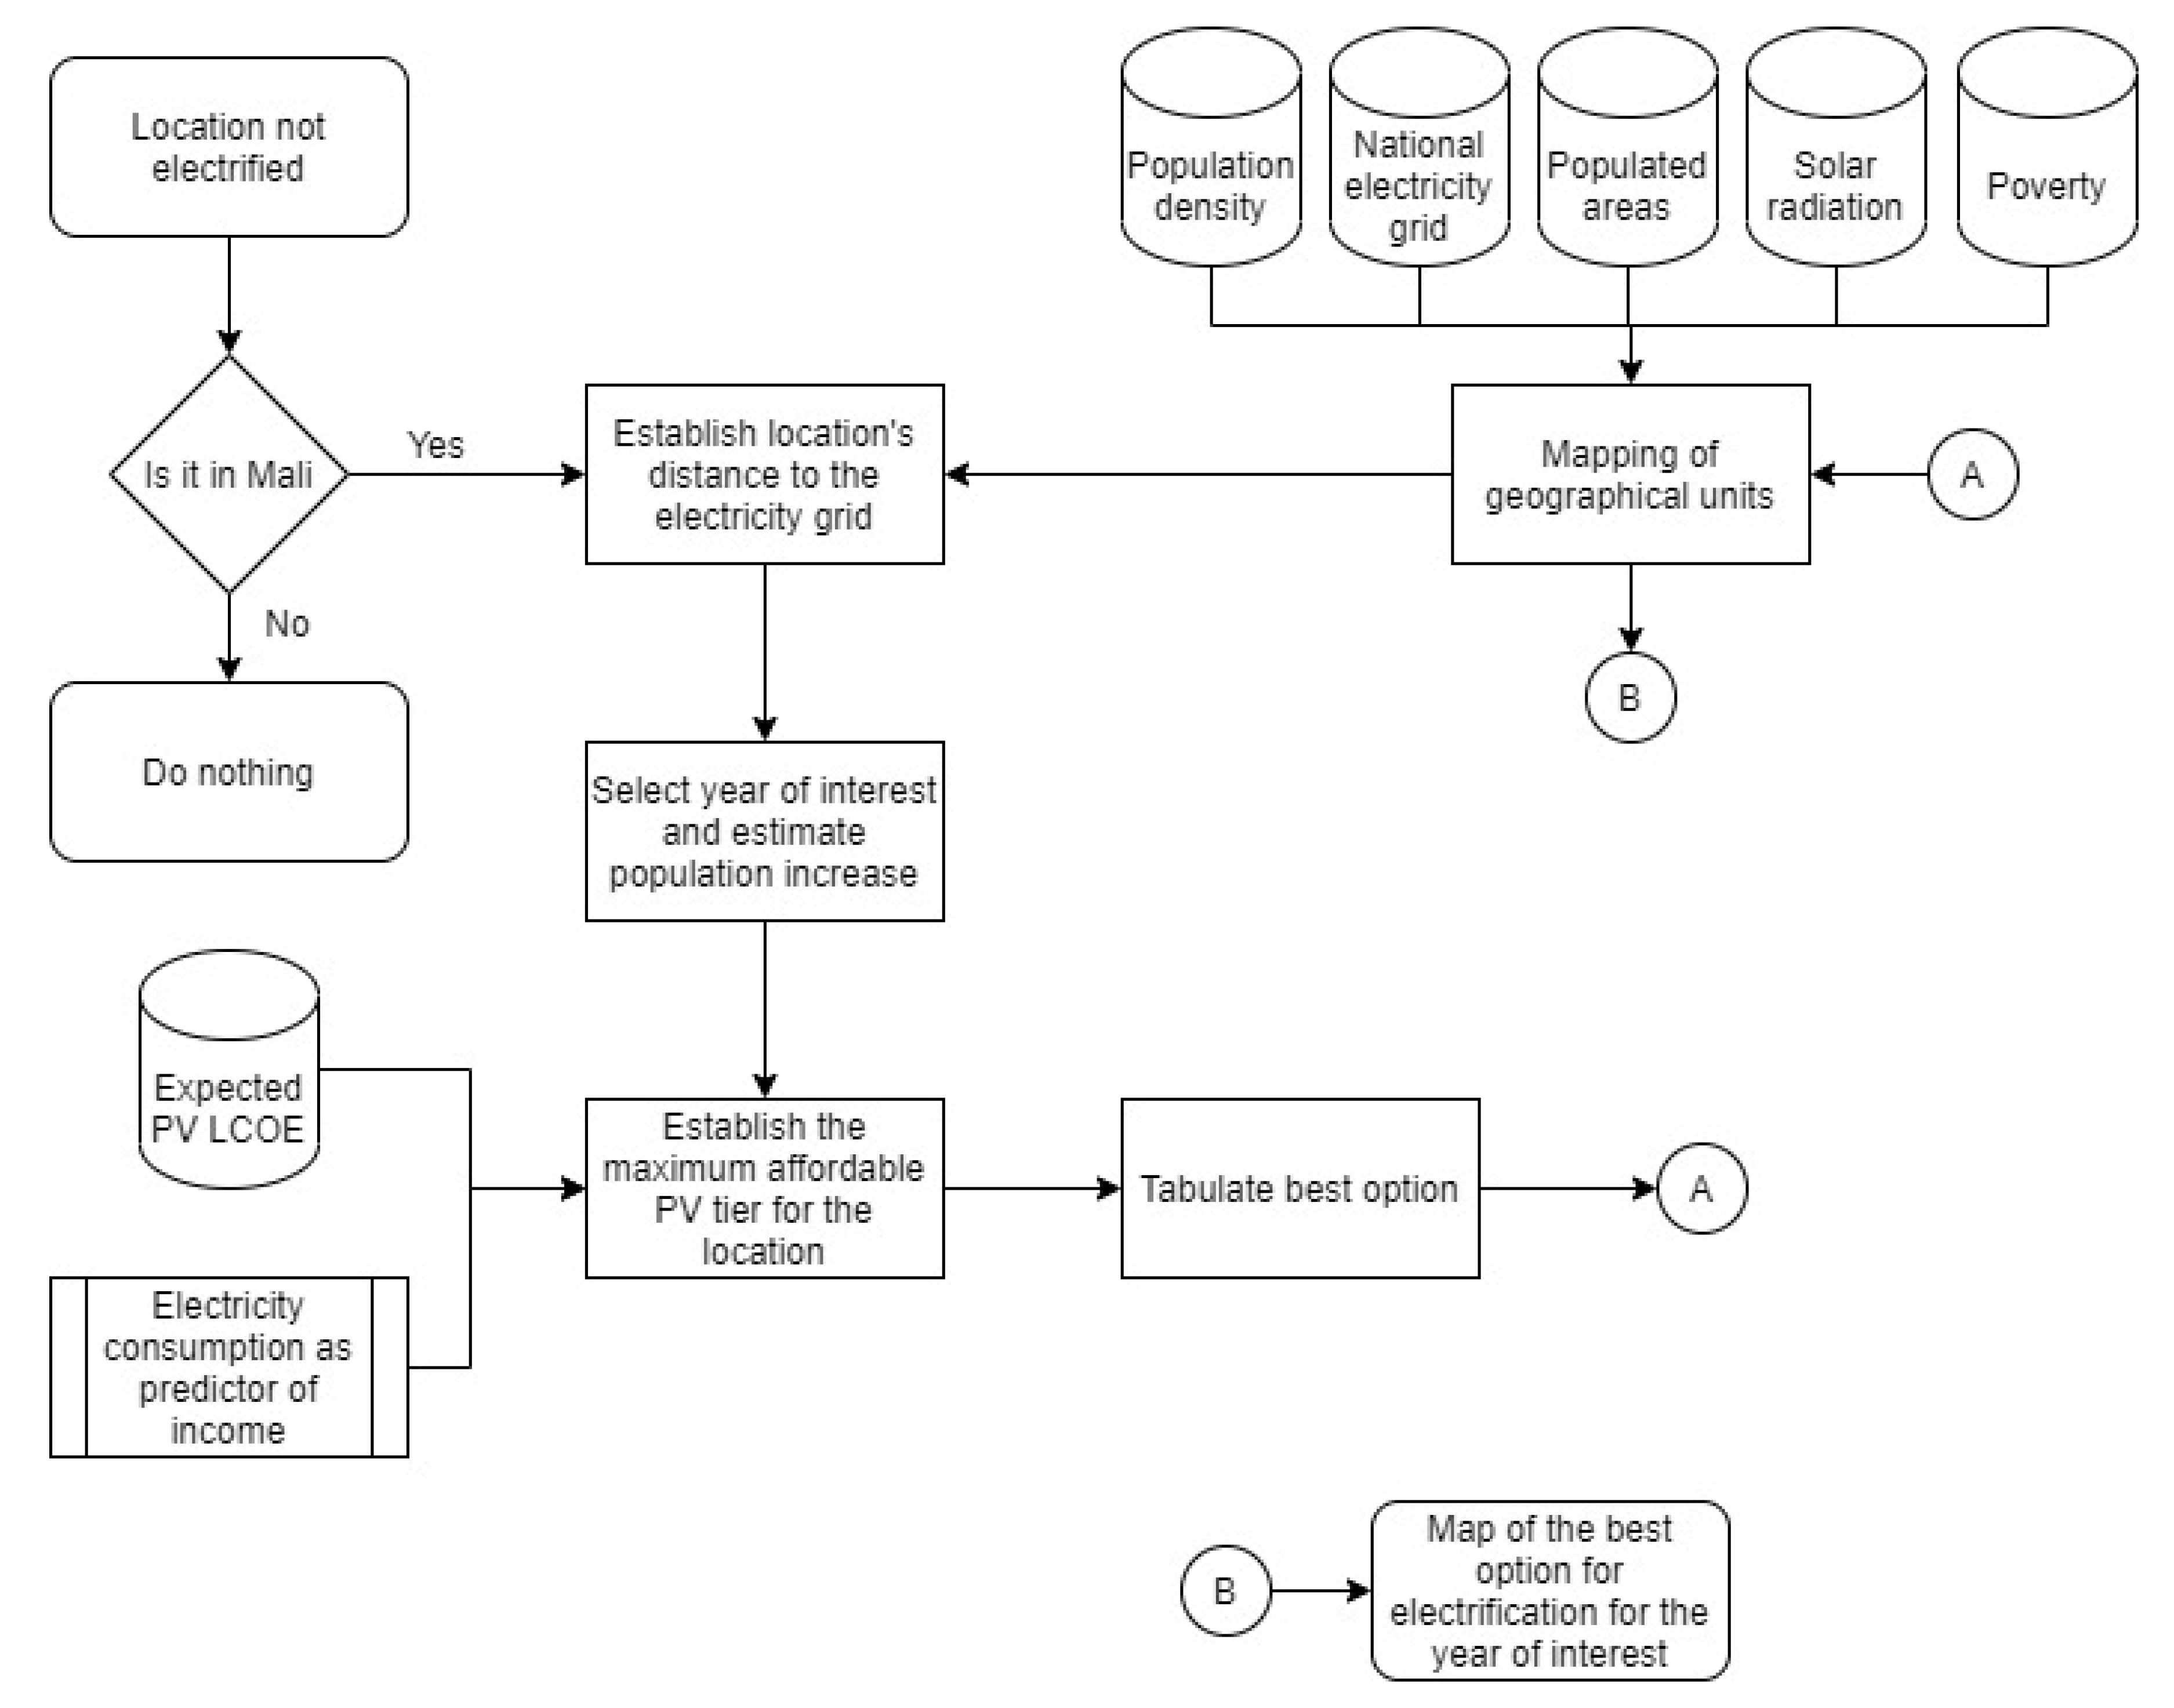
As previously mentioned, extending the grid is not always the best option; as such, the methodology depicted in Figure 3 was developed and followed.
Country data was compiled into what has been called geographical units. These units are the cells of a hexagonal grid, each with 5 km of internal diameter that covers the whole territory of Mali. Each of these cells or units contain resource and socio-economic data (References: Grid extension cost per km [41], Electricity grid [43], population density [65], specific photovoltaic output [66], wind power density [67], and main and secondary rivers [68]) specific to the area delimited by it. The final product expected is a map of Mali with the best possible electrification option cost-wise under the assumptions considered.
Besides those used on the previous step (LEAP), these assumptions include an expected decrease of the Levelized cost of Electricity (LCOE) for solar PV–battery systems and an increase in disposable income generated due to the increase in electricity access/consumption.
For each cell or unit, the tiered net present cost (NPC) for the solar PV system required to supply the demand of the relevant unit is calculated following Equation (6):
where is the net present cost per tier, is the levelized cost of electricity for solar PV, H is the number of households in the cell, is the minimum daily electricity consumption per tier of electrification (see Table 4), L is the lifetime of the project, DR is the discount rate, and PR is the performance ratio of the plant.
As the study presents scenarios up to 2050, three values of LCOE were used: 0.25 [17,69], 0.12 [16,70], and 0.069 [14]. These are meant to represent the gradual decrease in price for solar PV electricity generation throughout the study timeframe and are assumed to represent the LCOE for 2030, 2040, and 2050, respectively. The discount rate was assumed to be 8% [71], and the performance ratio to be 0.3 [72].
As mentioned before, this paper assumes that electricity consumption directly influences the increase of disposable income. The rate at which this increase is expected to occur follows the formula defined by EoI_Index 2. This formula was modified to fit Mali’s maximum average monthly salary [73] under the assumption that poor populations behave similarly on low electricity consumption levels.
where is the income per household (assuming one income maker per household), MAI is the maximum average monthly income taken as USD 2646 [73], = 0.01412 and = 0.98665, and x is the electricity consumption in kWh.
Affordability and viability were calculated to select which tier of solar electrification, if any, is best suited for each unit. In this paper, affordability is defined as the ability of the population to pay for the electricity services without compromising their ability to supply for their other needs after the effects of increased income generation due to increased electricity consumption are estimated (affordability is present when Equation (8) is true). Viability refers to whether the technology suggested is more or less expensive than the alternative.
where is the sustainable portion of the daily income used for electricity services, is the population growth in the year of interest, is the increase of income due to increased electricity consumption, is the number of households present in the geographical unit, is the minimum daily demand by tier of electrification (see Table 4), and is the assumed LCOE for the year of interest.
To calculate the sustainable portion of daily income to be used for electricity , the poverty levels per region [74] were used. The dataset contains the population living with less than USD 5.5 per day, less than USD 3.2 per day, and USD 1.9 per day. The calculation assumes that the number of people under each category has at least the amount of the category. Two percent of the daily income is taken as a sustainable quantity to be spent on electricity in Equation (9).
is the amount of population assumed to have at least USD 1.9 of daily income, is the amount of population assumed to have at least USD 3.2 of daily income, and is the total population living within the area delimited by the geographical unit.
This process was performed for each geographical unit and the years 2030, 2040, and 2050 taking into account population growth and decrease of PV LCOE.
3. Results
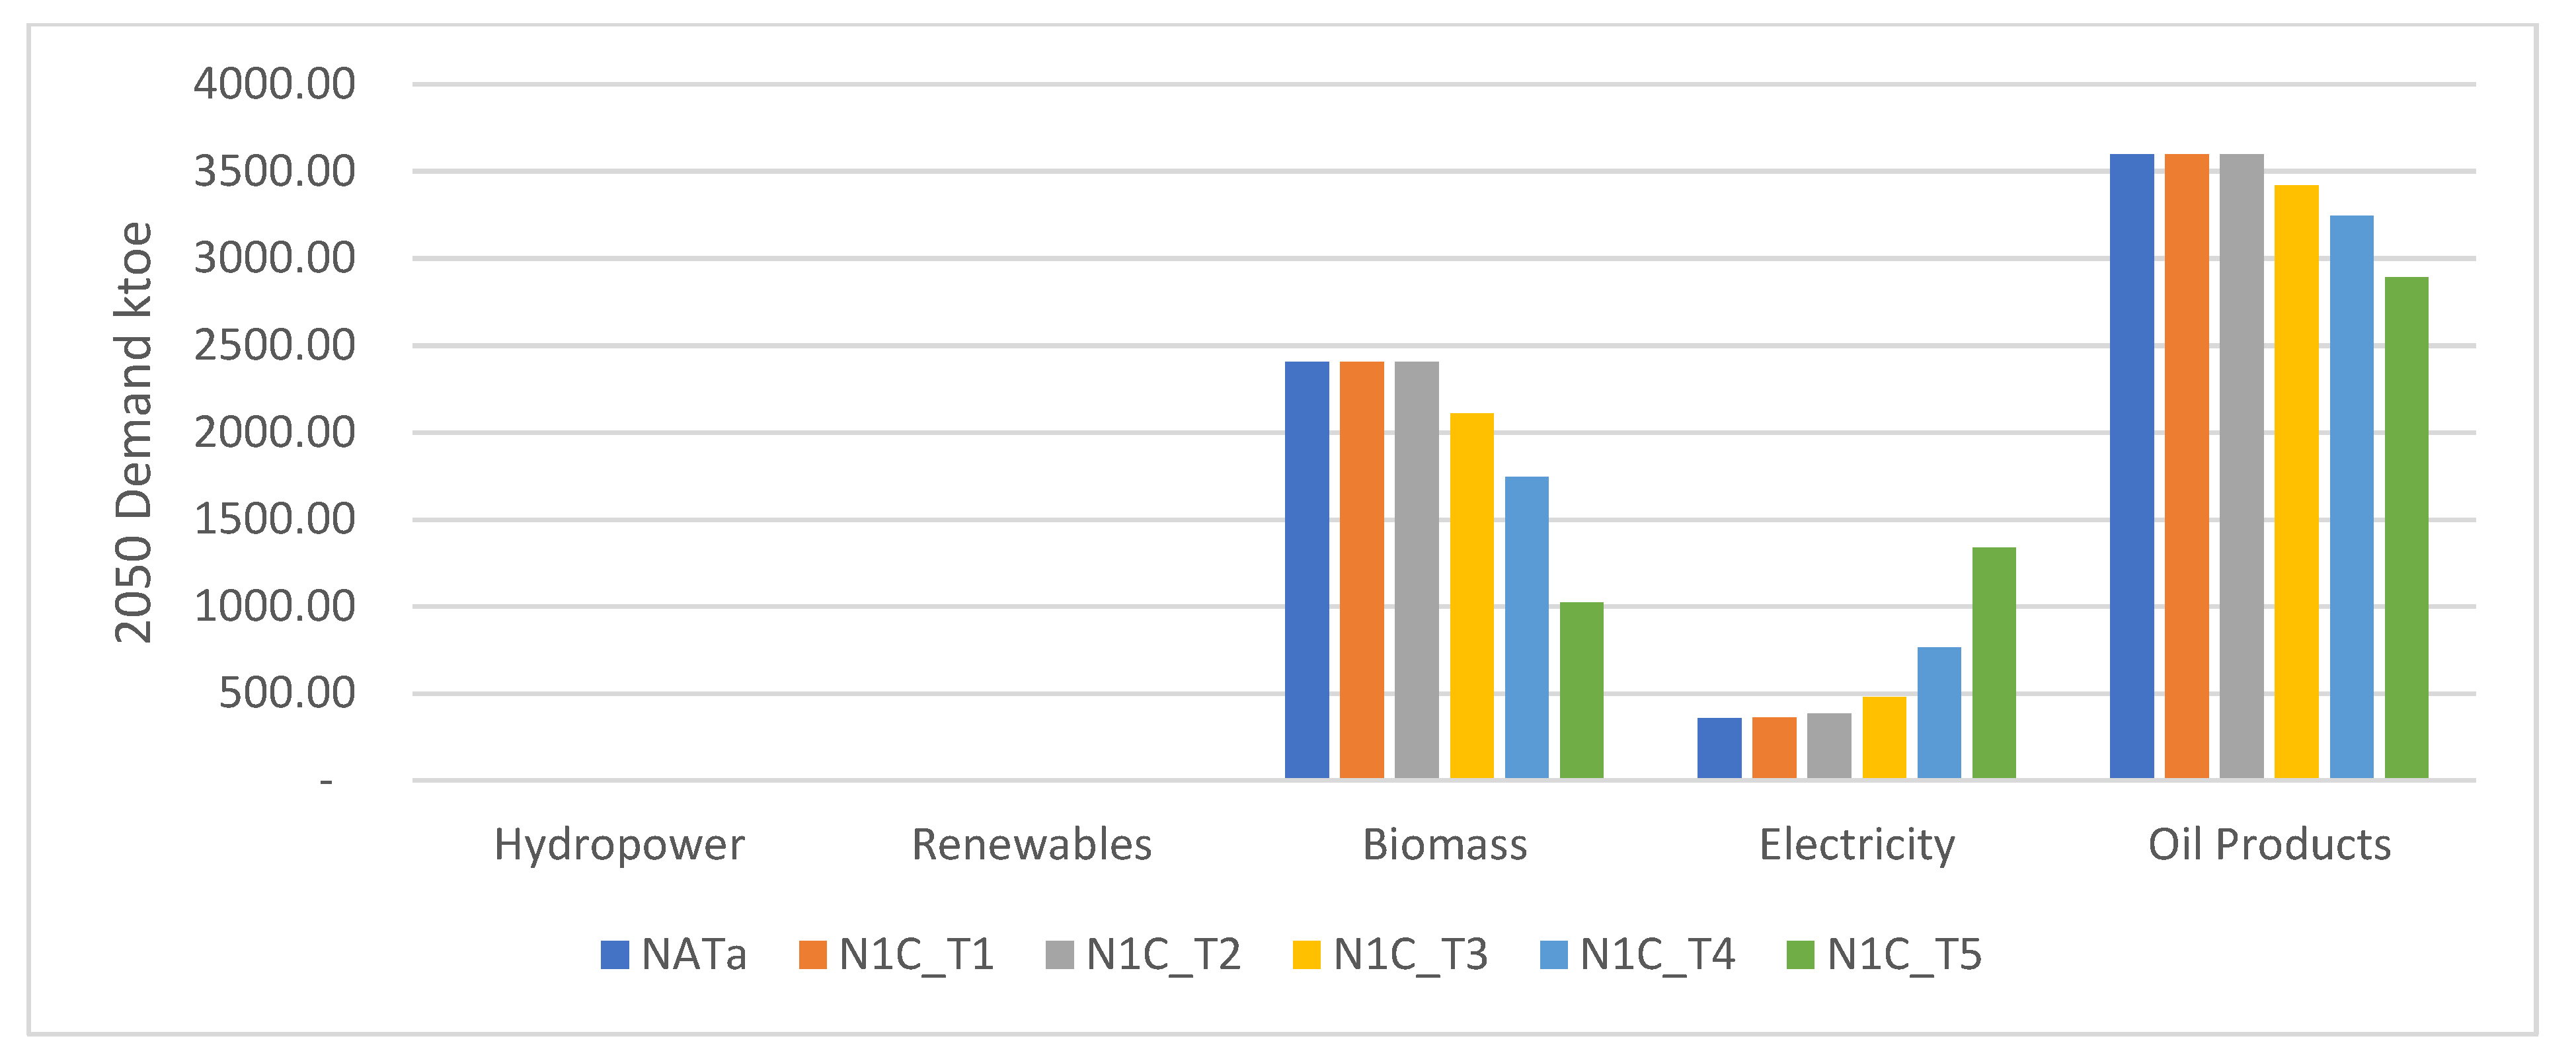
Scenario NATa considered the possibility of transitioning from biomass consumption in the rural residential sector to an LPG-dominated demand as a first step, to then transition to an electricity-dominated demand (scenarios N1C_T). Although this study does not provide a specific timeframe for the transition between tiers of electrification, the process can be inferred from the differences between the tiered electrification scenarios (see Figure 4). As the electrification tier increases, the demand for biomass and oil products decreases. As scenario NATa and following tiered scenarios (N1C) consider the biomass demand of the urban areas to transition to LPG as soon as 2030, by 2050, the demand for oil products will be great.
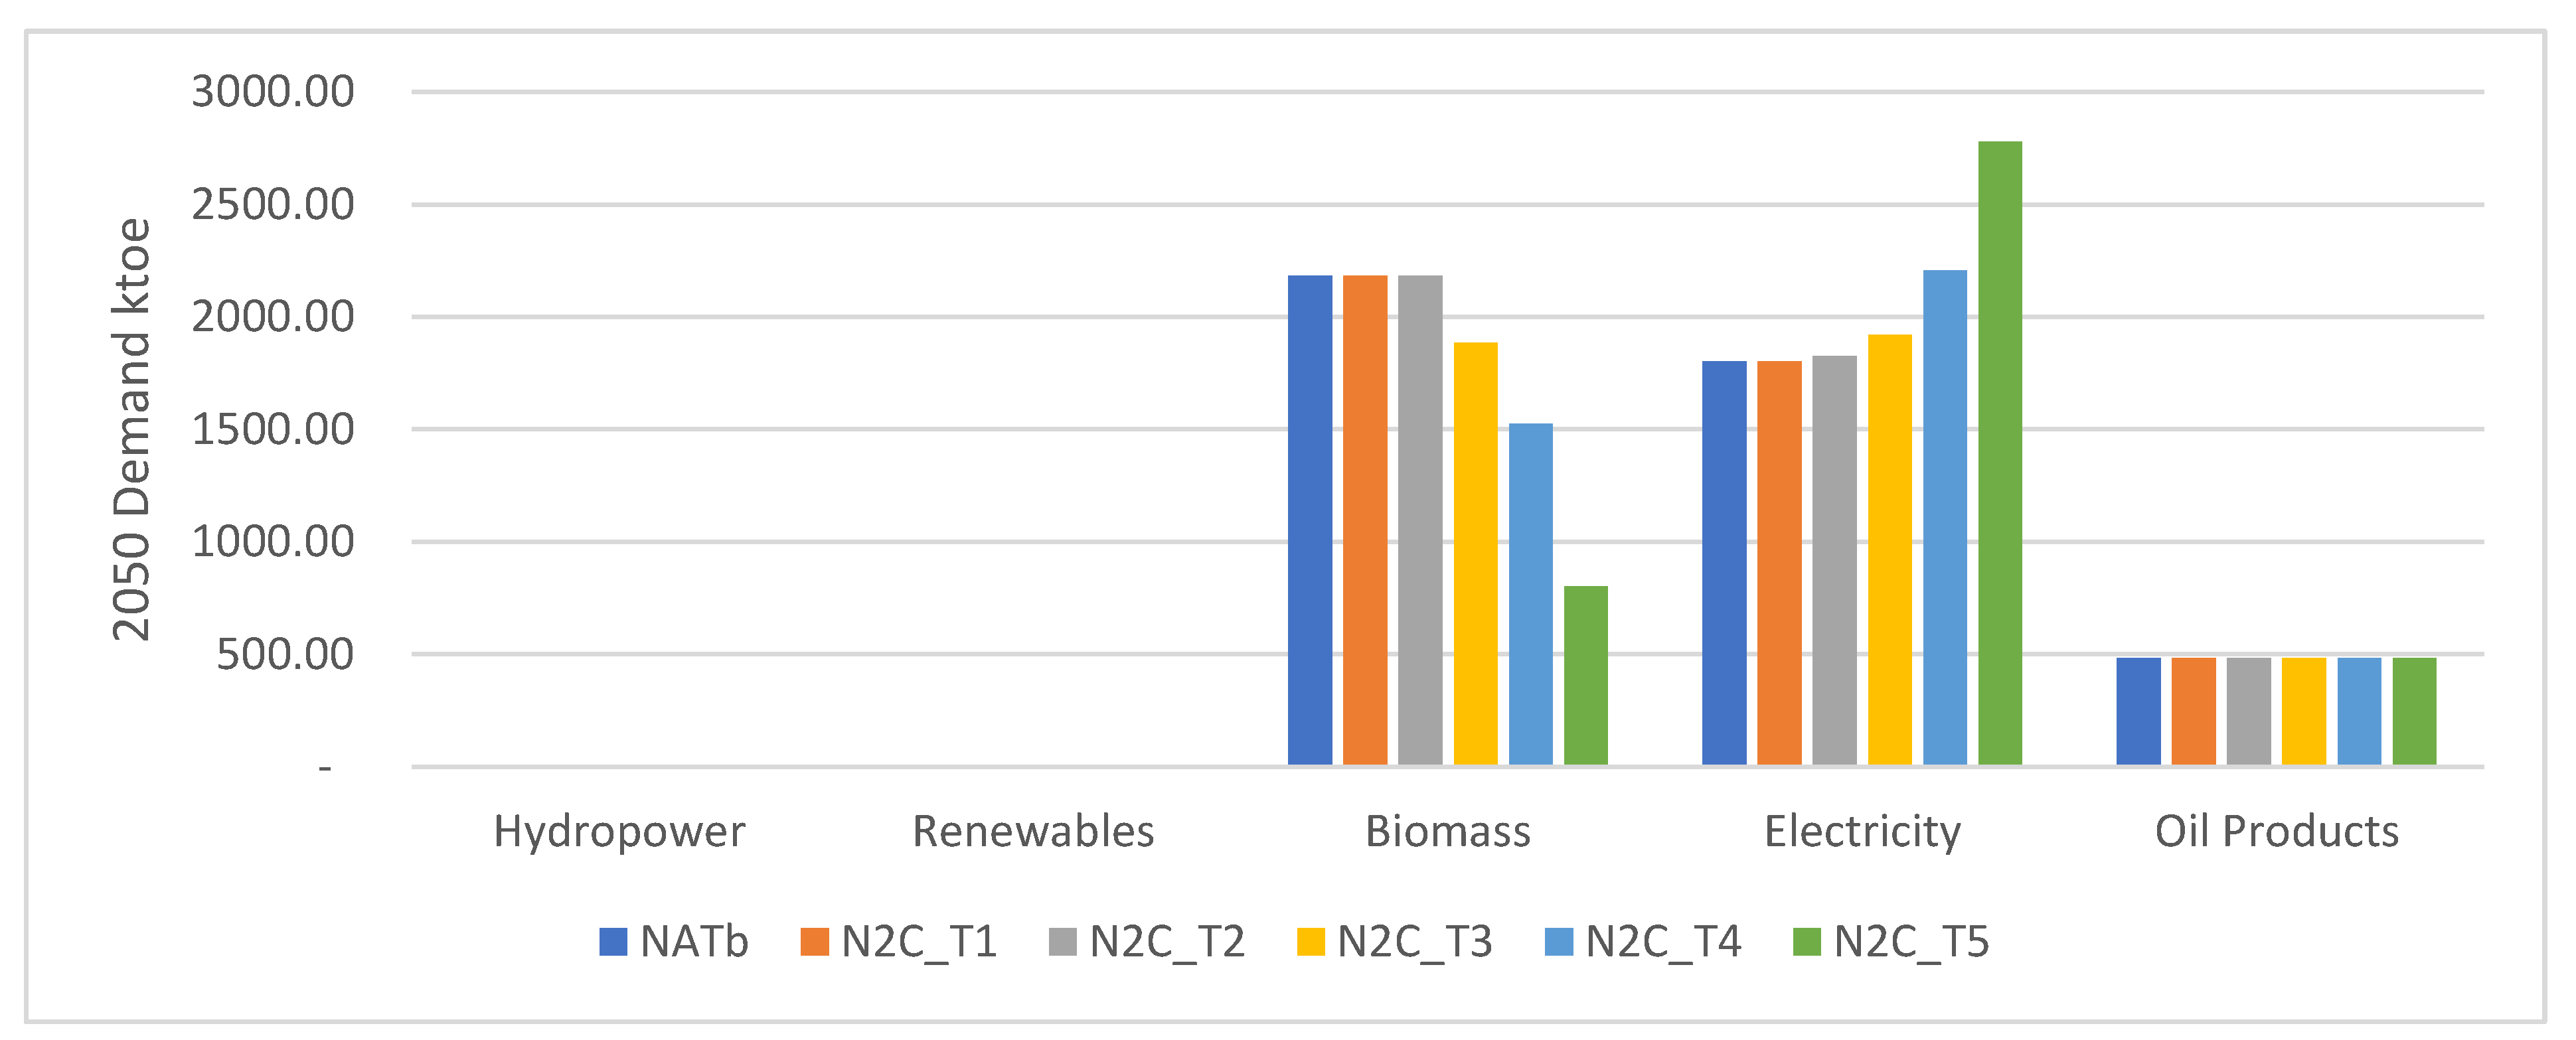
In scenario NATb, the urban residential sector does not transition to LPG usage by 2030 but rather to electricity by 2050; this results in an increased demand for electricity and lower demand for oil products. As this scenario does not consider a transition in the rural sector from biomass to LPG to electricity, by 2050, no variation in the oil product demands between electrification tiers is apparent (see Figure 5).
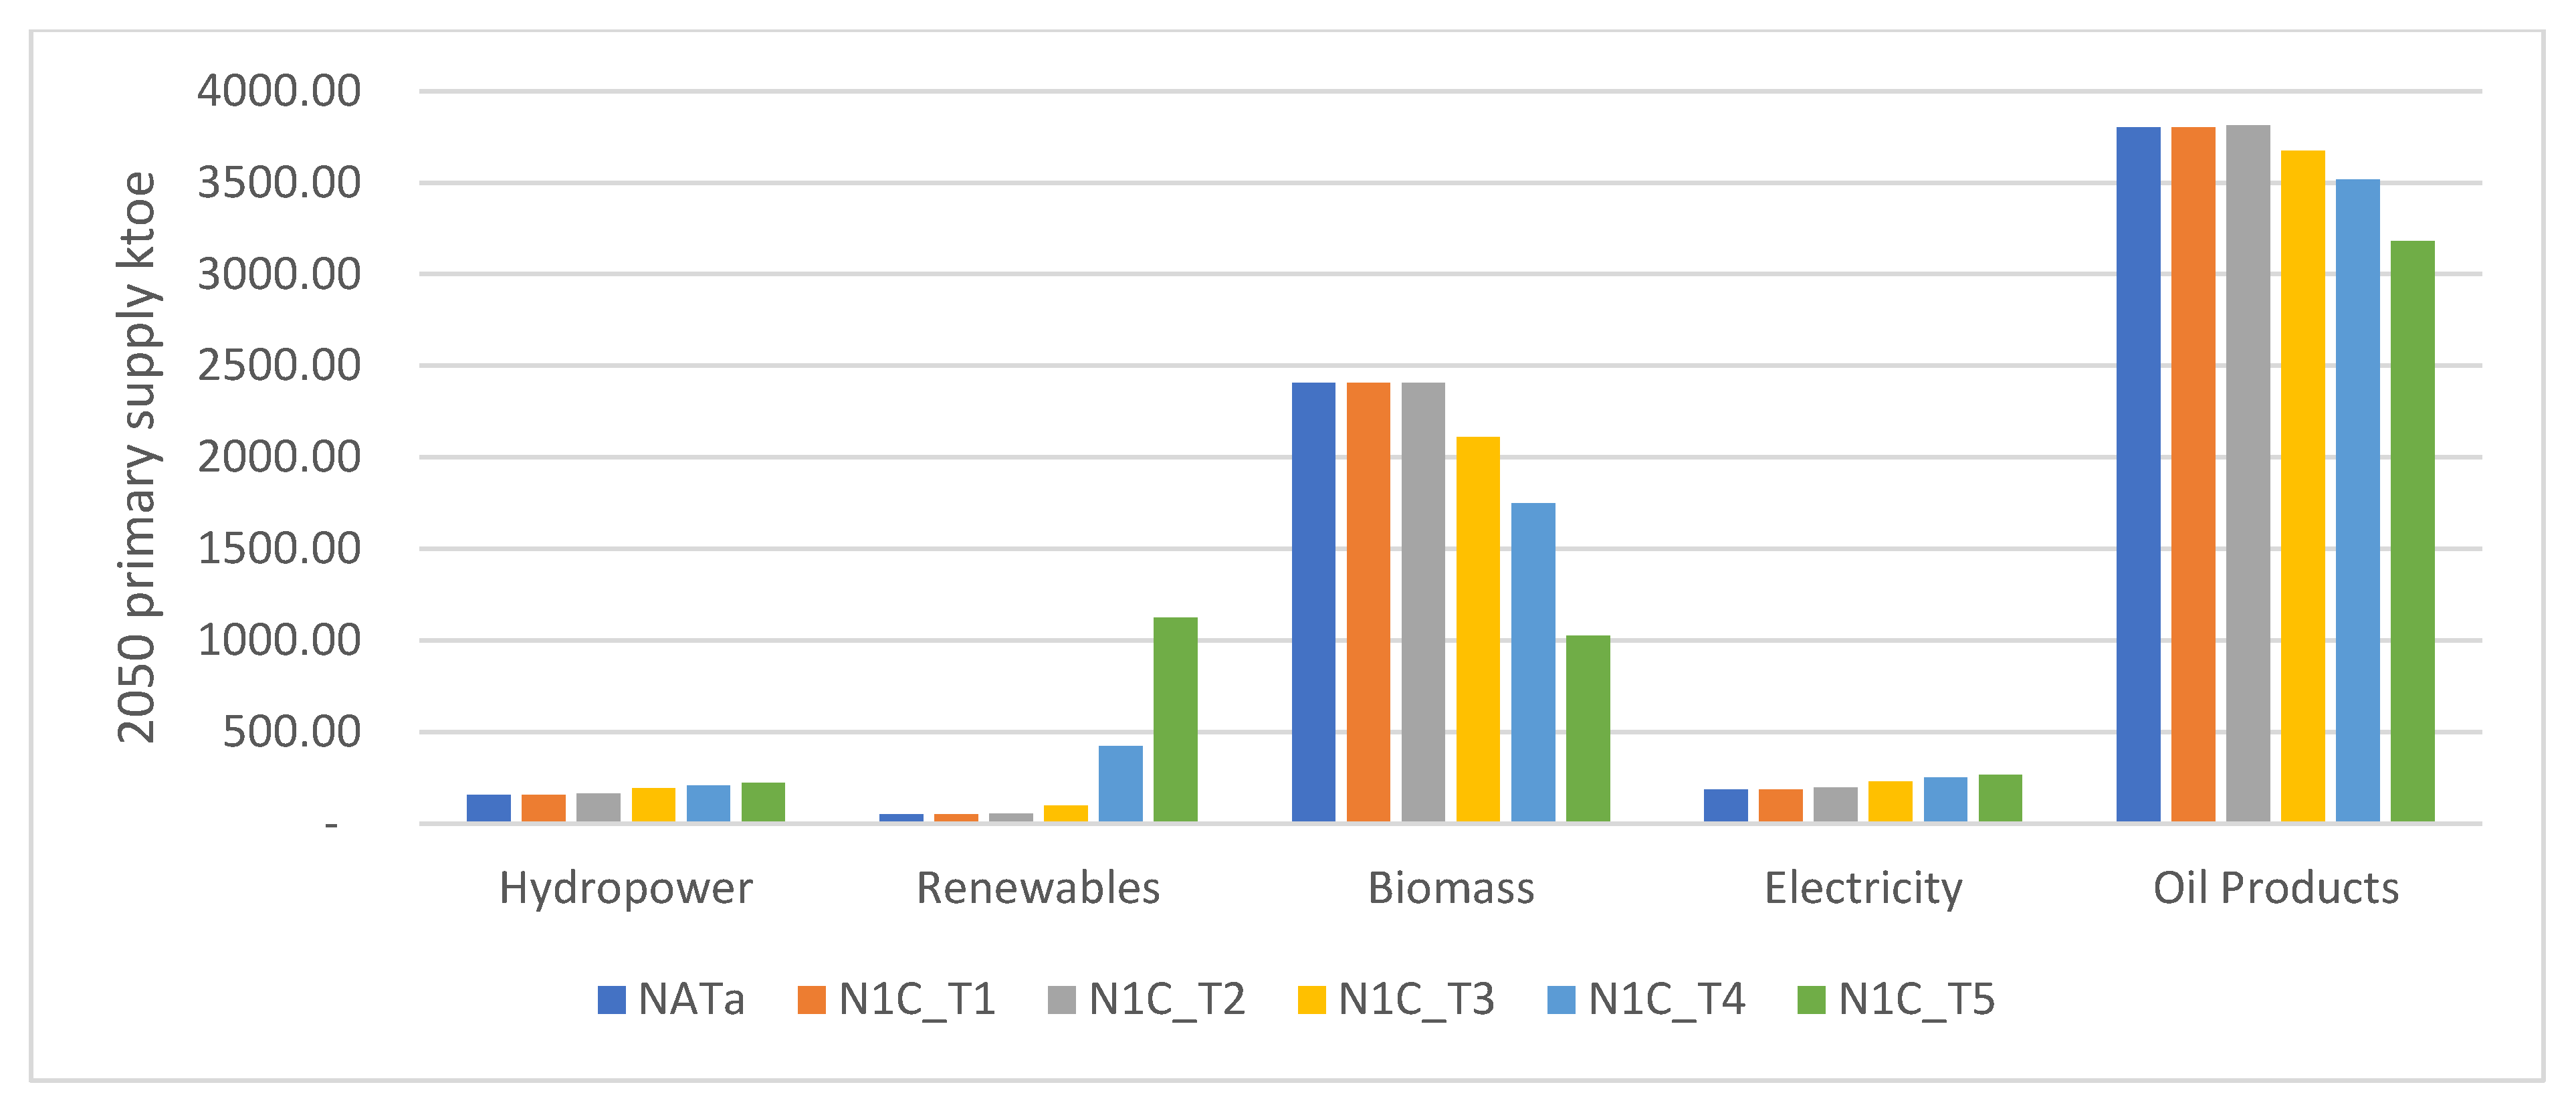
For Mali to supply the demand by 2050 of any of the scenarios mentioned above, see Table 2, considerable increases in electricity generation capacity will be needed, be it from renewable or non-renewable sources. This is highlighted by the extra electricity needed, labeled “Electricity” in Figure 6. Although, with the transition from biomass for cooking to oil products in the urban sector, this extra electricity is overtaken by the oil products requirement that will ensue, see Figure 6.
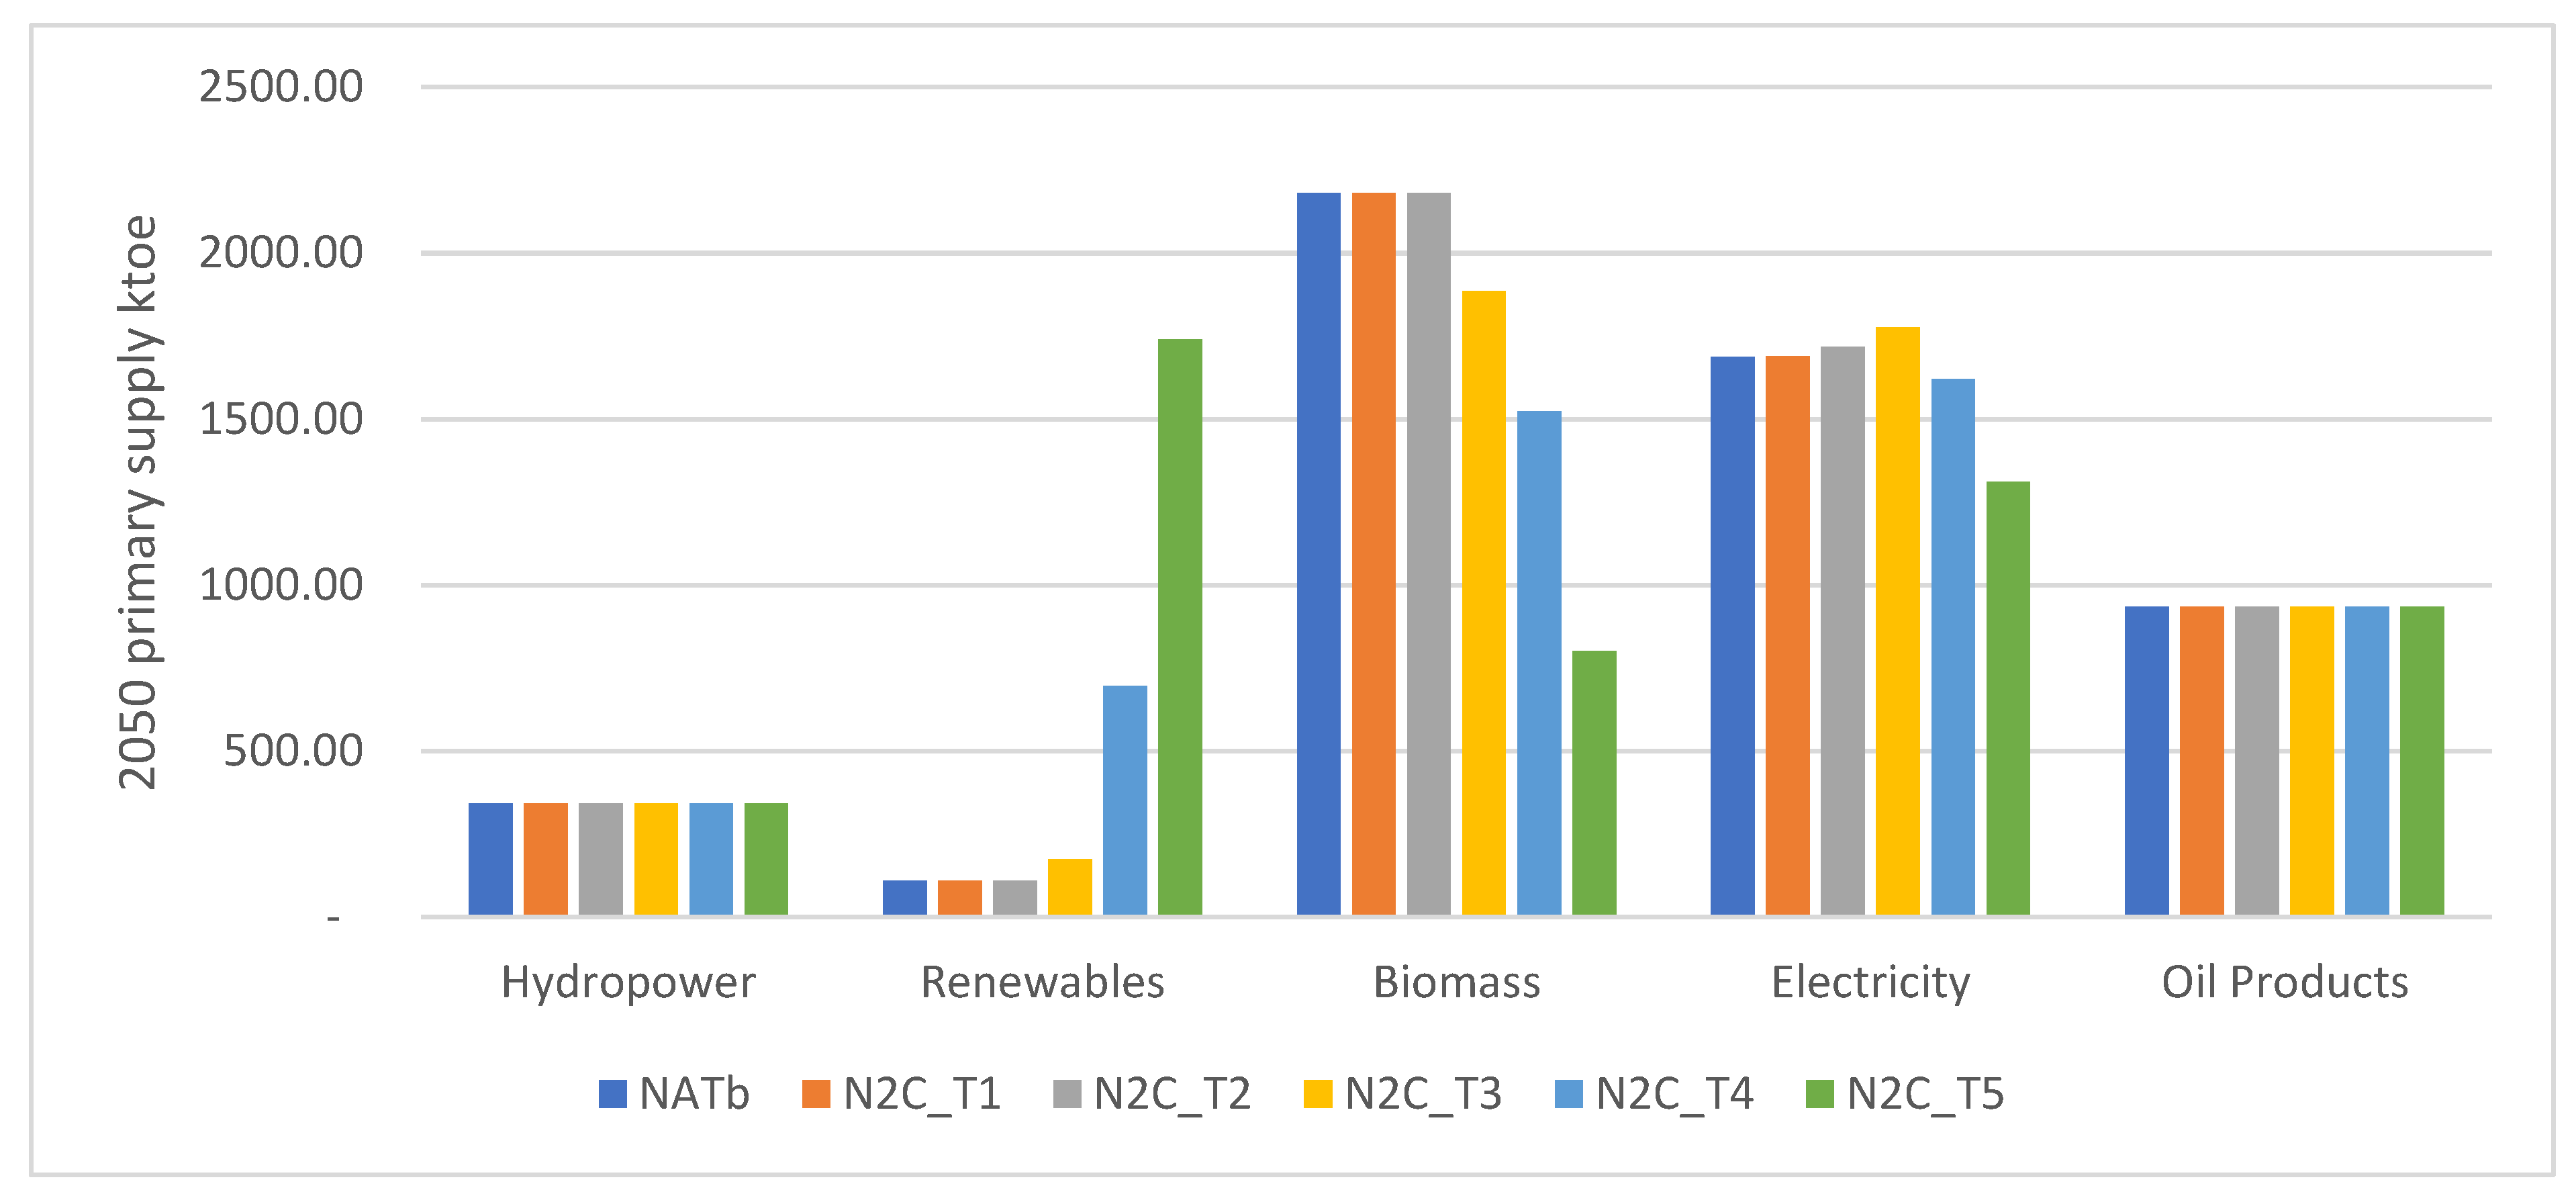
Similarly, when the urban residential sector transitions from biomass to electricity, the amount in electricity imports needed increases from less than the 500 ktoe needed in the previous scenarios to 1775 ktoe in N2C T3 and 1311 ktoe in N2C T5. Mali’s target for electricity expansion by 2030 considers a limit in electricity imports of up to 680 ktoe [57]. However, the requirements for a transition to electricity will require at least double this amount by 2050 even when T5 electrification/generation is available in the rural areas; see Figure 7.
While the results obtained with LEAP do not represent a timeline of events to reach rural electrification by 2050, it presents the picture of a possible future.
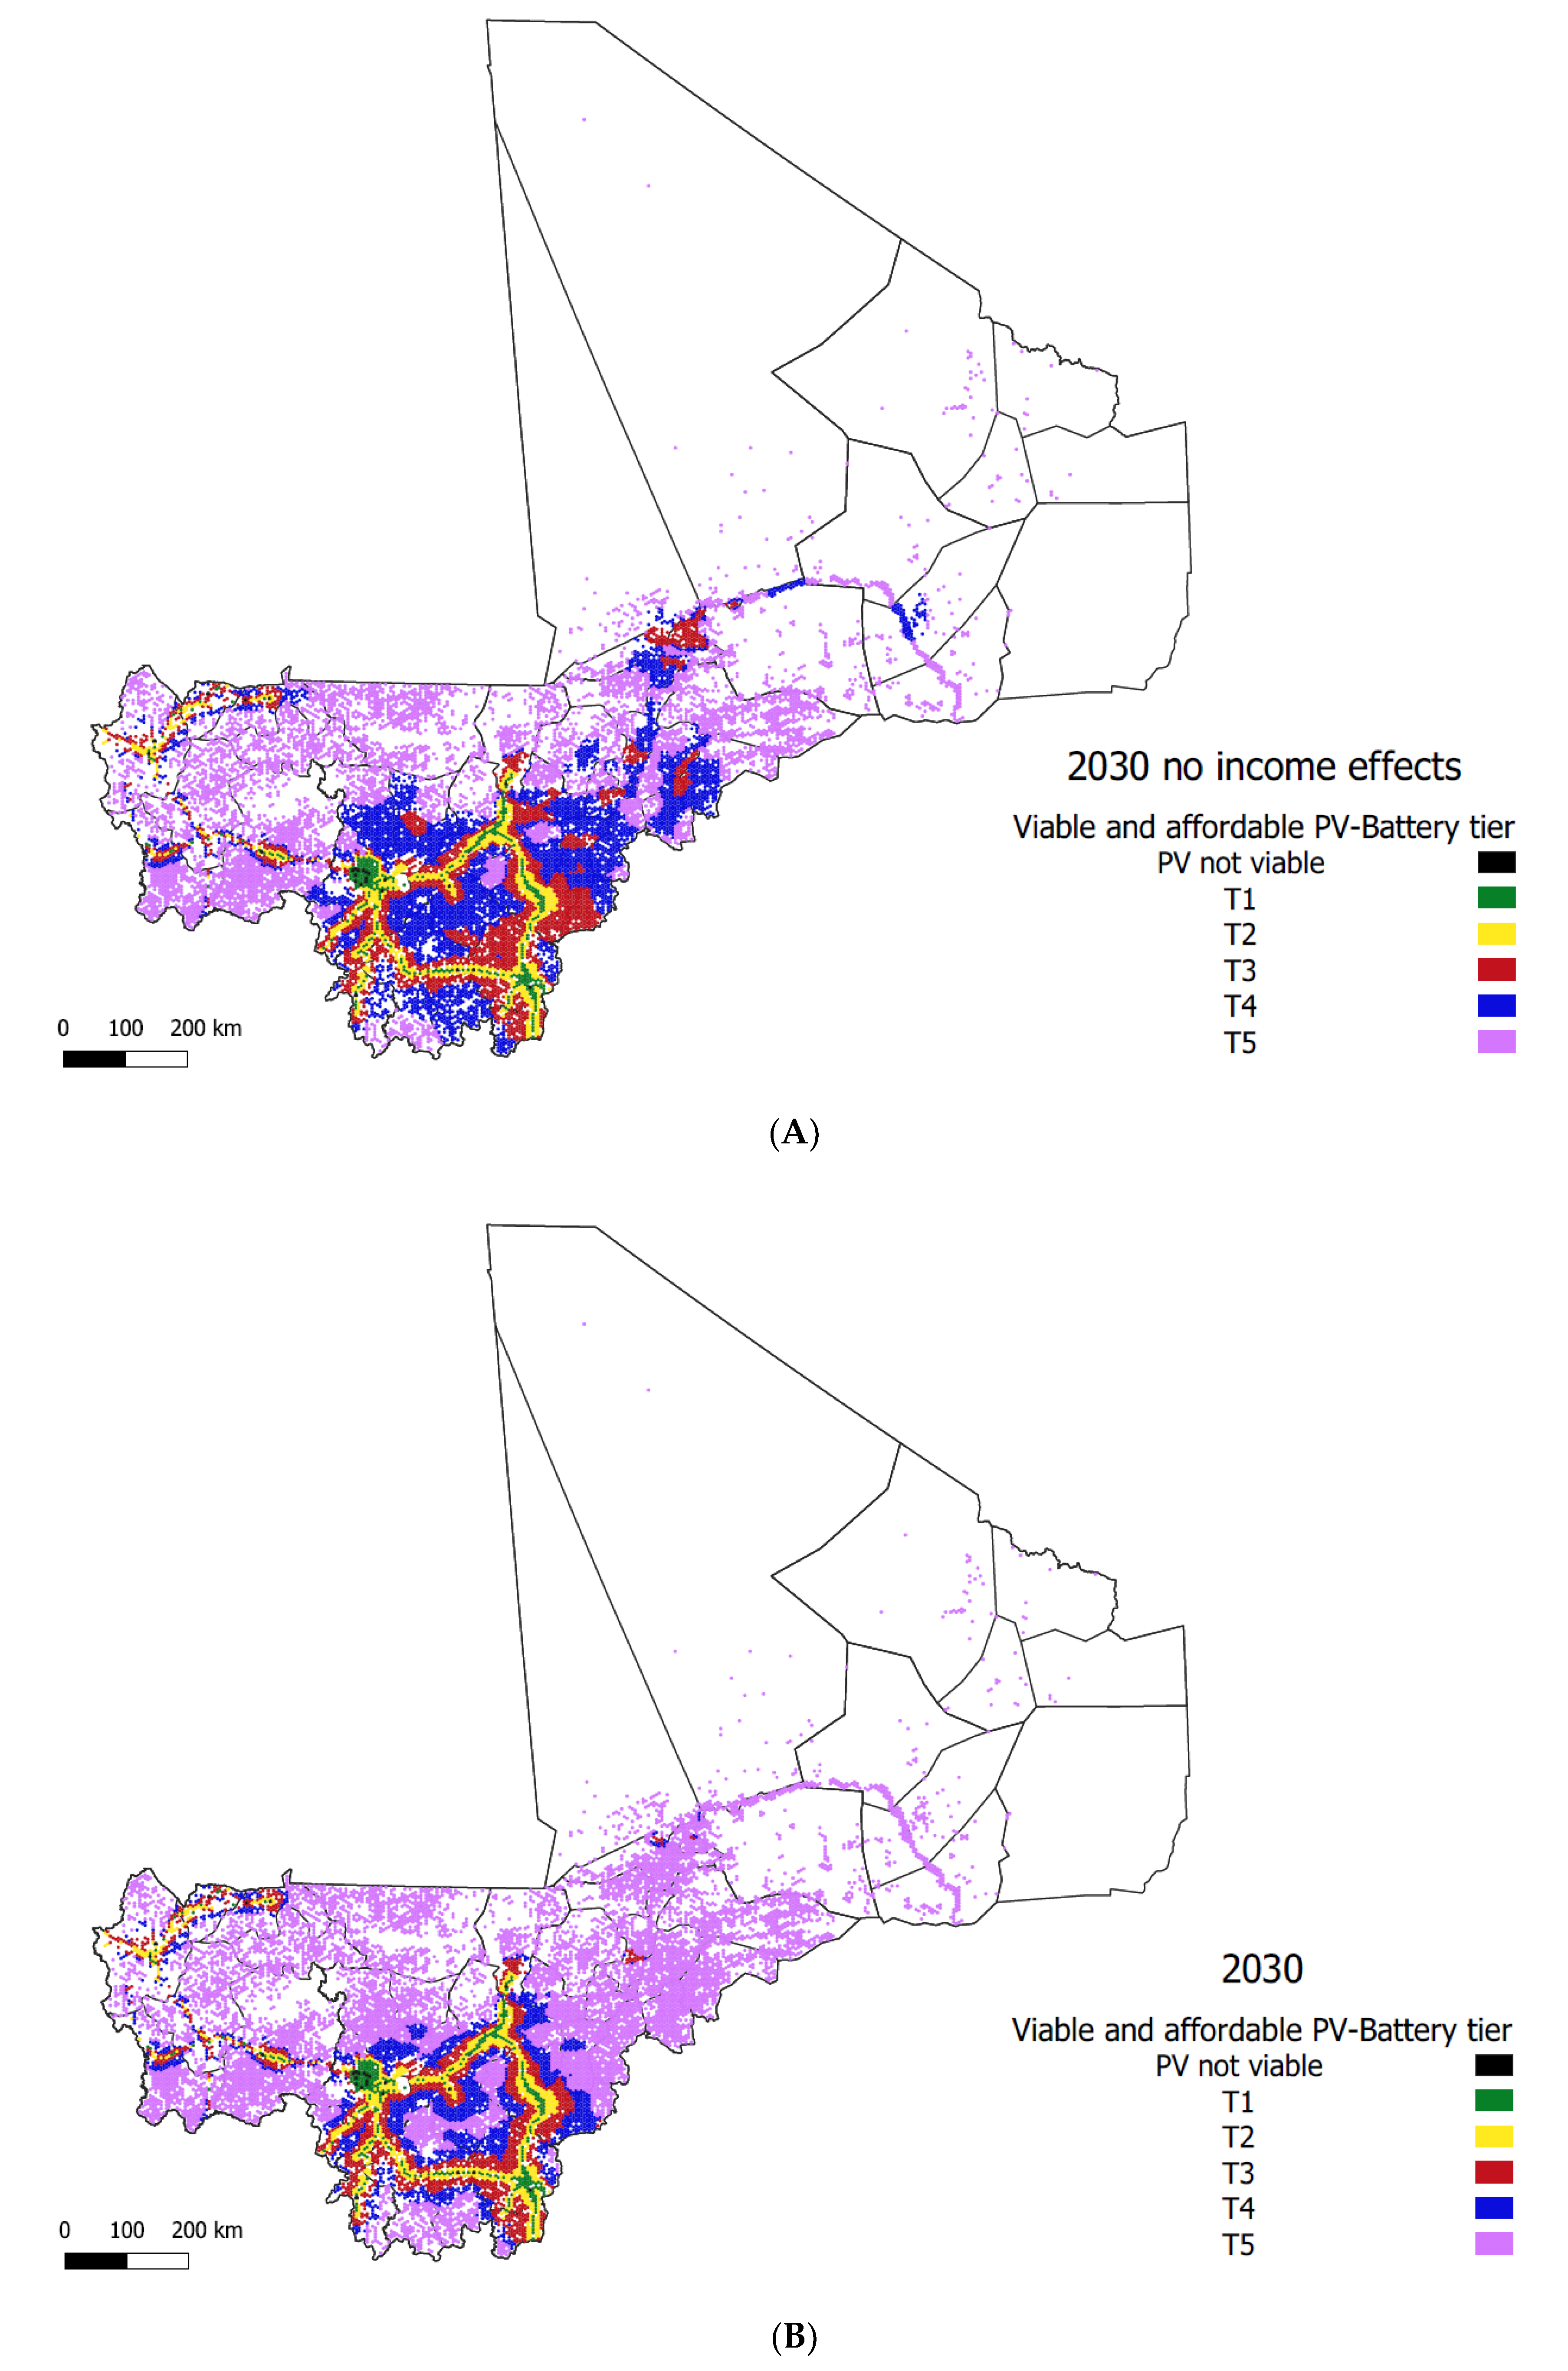
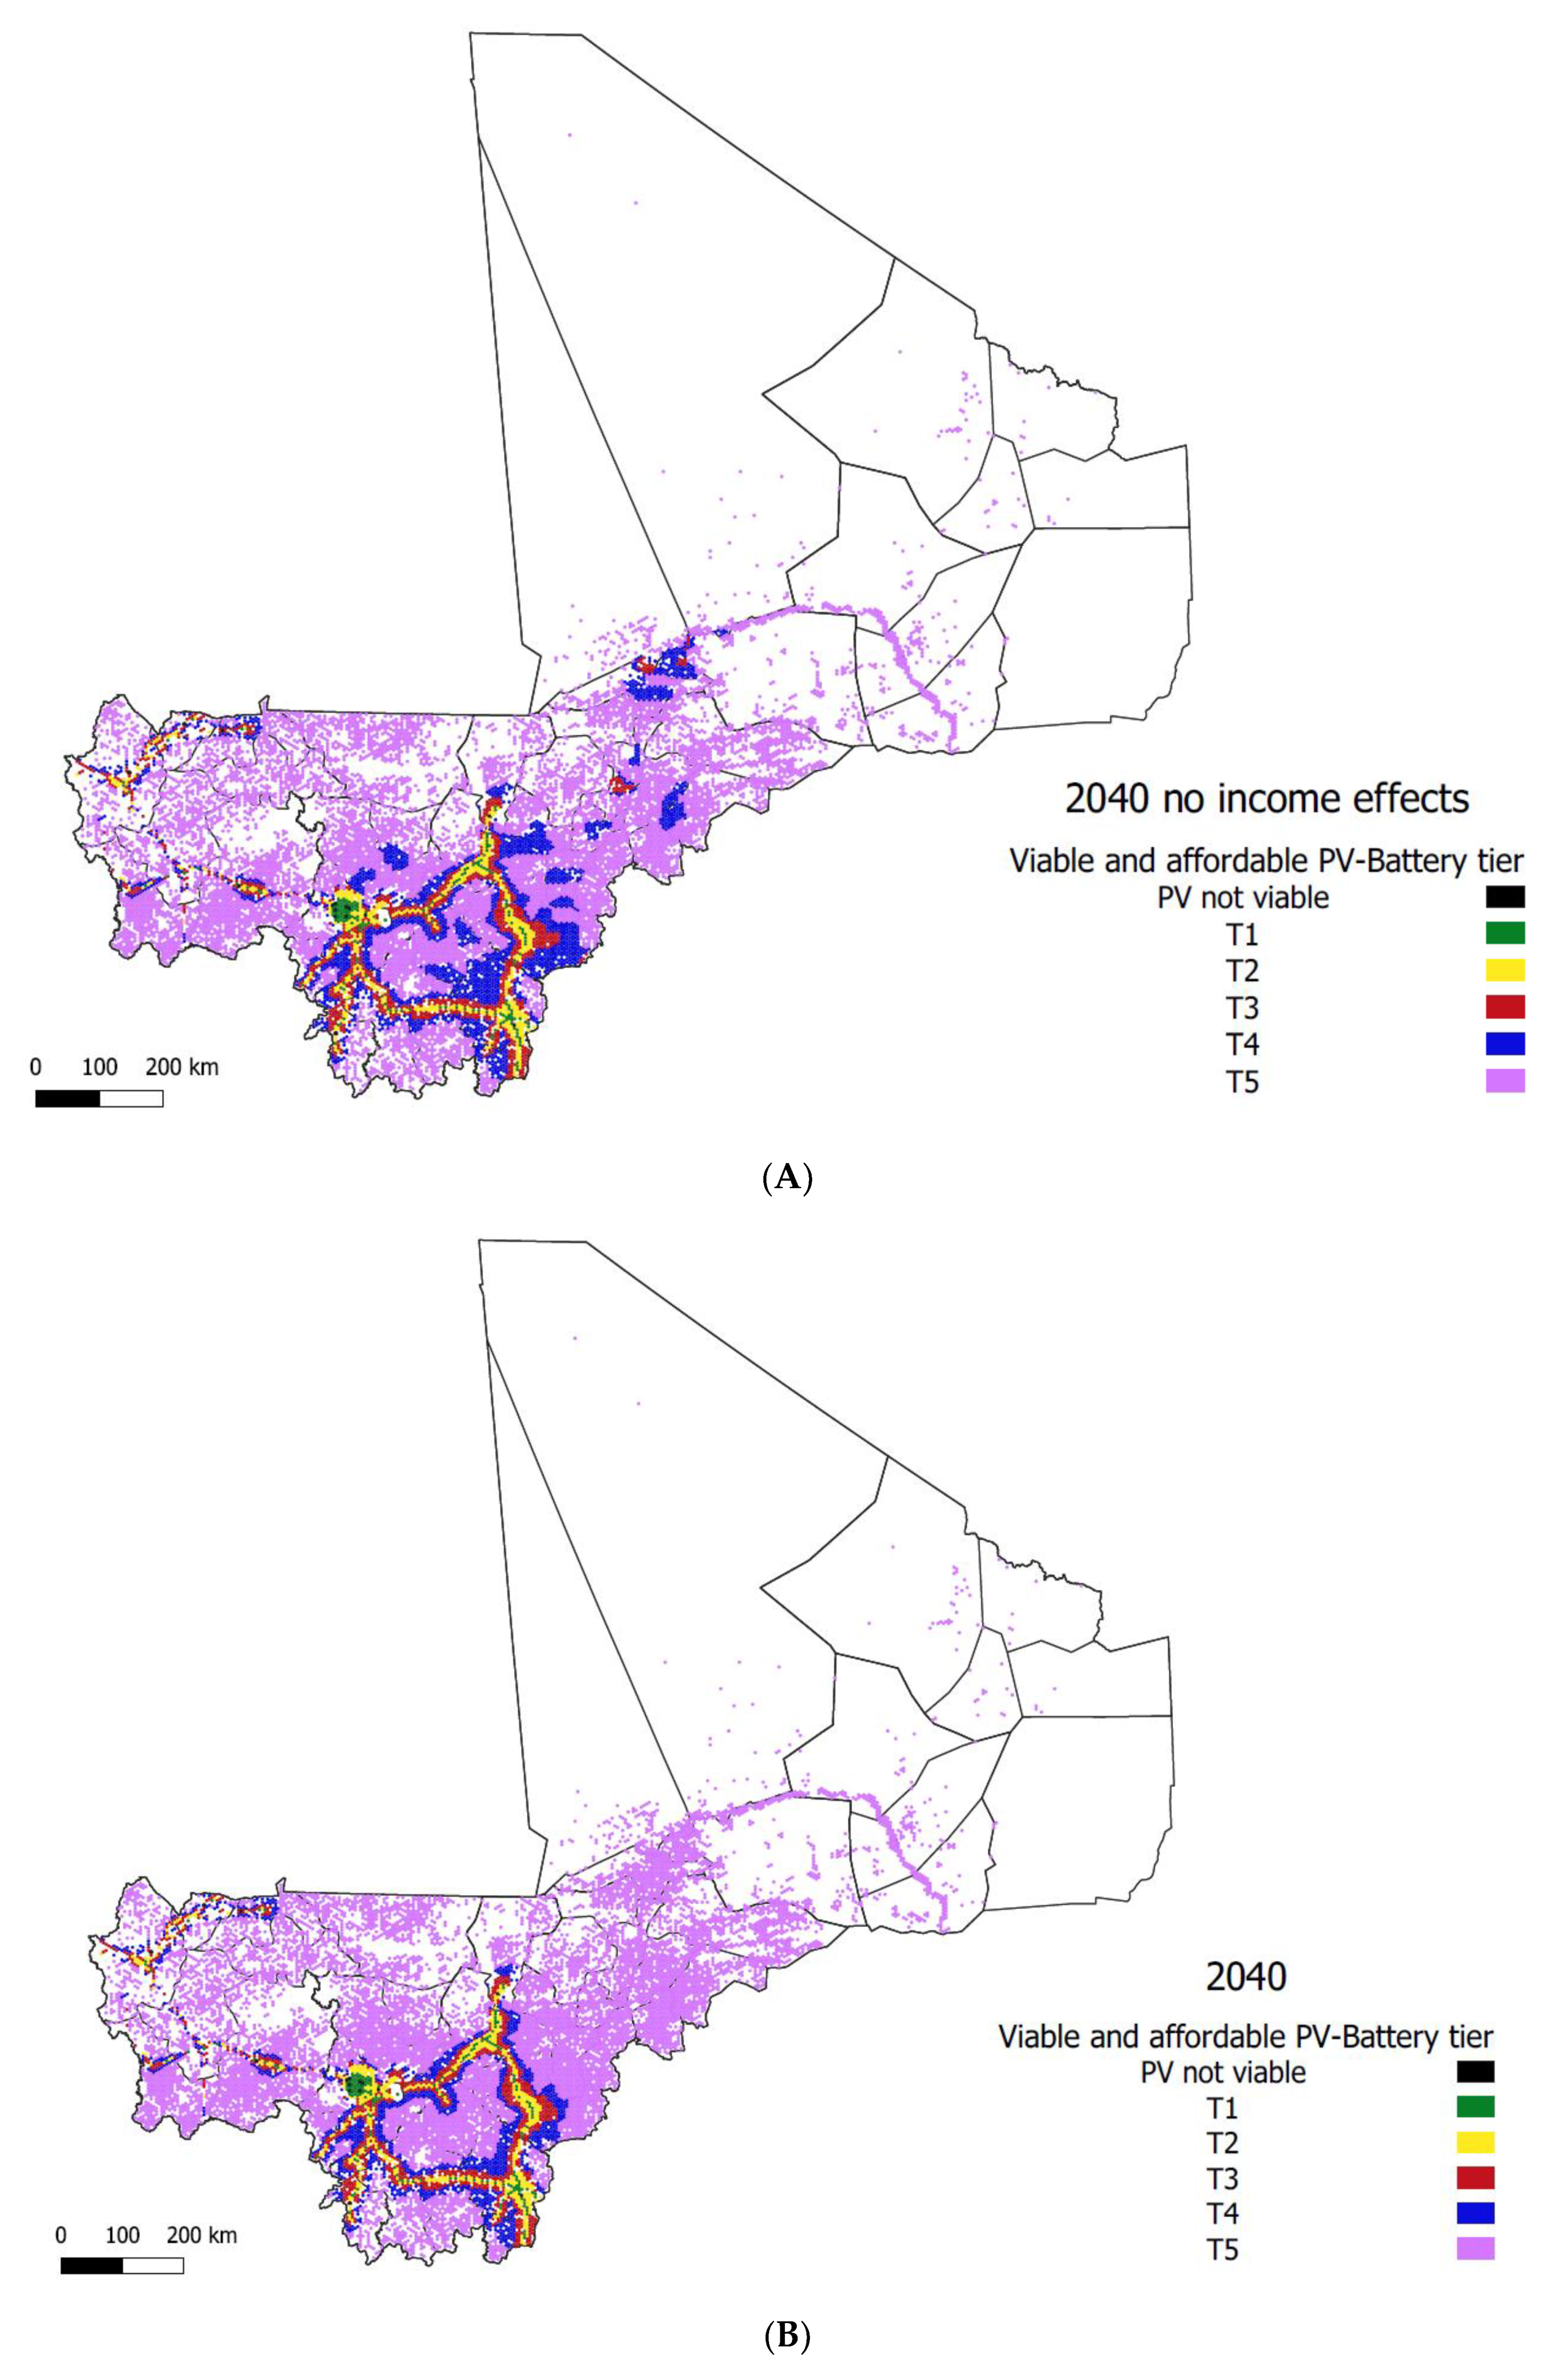
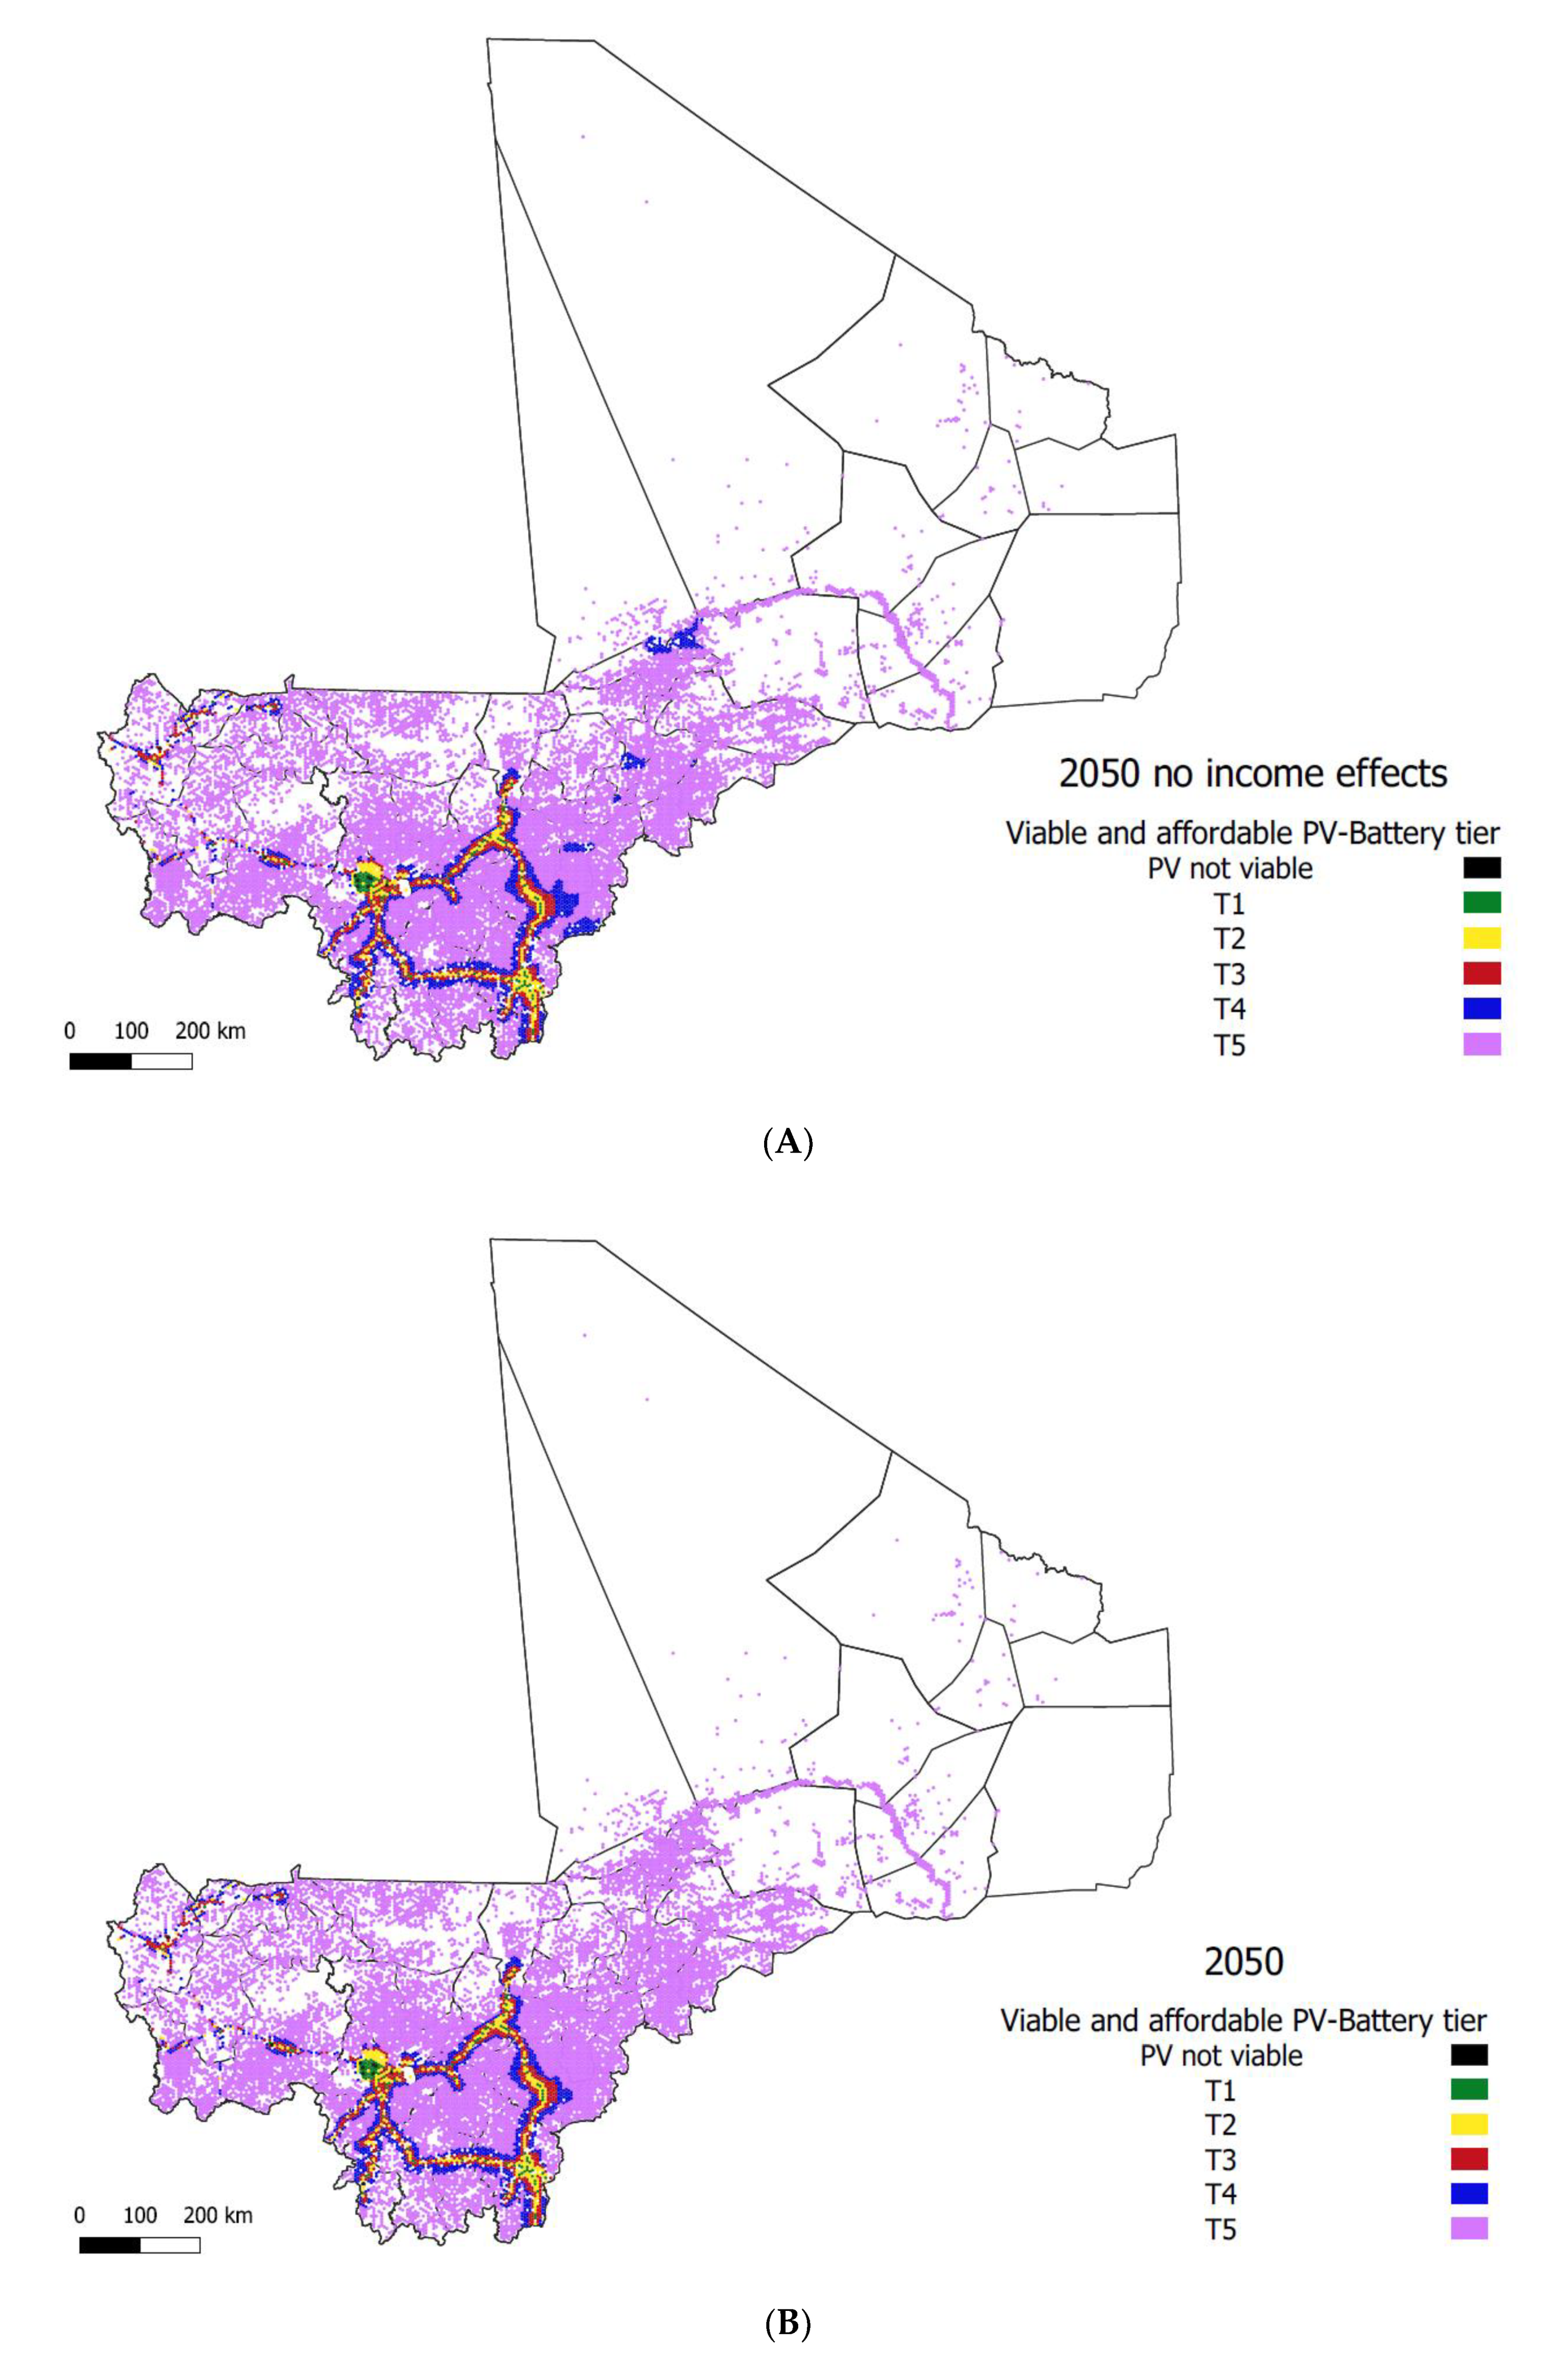
For the QGIS results, three timestamps were used: 2030, 2040, and 2050. These timestamps can be seen in Figure 8 for 2030, Figure 9 for 2040, and Figure 10 for 2050. As the methodology describes, each colored spot on the map is a hexagonal geographical unit of 5 km of internal diameter. Each colored unit represents which tier of electrification is both viable and affordable for the geographical unit.
The results indicate that installing higher tiers of electrification (i.e., T3, T4, or T5) is cheaper than extending the grid. Under the assumptions used, even when the effects of energy consumption on income generation are not accounted for, remote populations can meet the cost of installing solar systems without compromising their ability to purchase other essentials, see Figure 8A, Figure 9A and Figure 10A.
When the effects of electricity consumption on income generation are accounted for, most rural populations could afford higher tiers of solar electrification, see Figure 8B, Figure 9B and Figure 10B.
When all populated areas are electrified according to the tiers presented in the previous figures, the potential reduction of the biomass consumption reaches a minimum of 50% reduction from the normal (no tiers of electrification) biomass consumption on 2030 with no income effect; see Table 5. When the effects of increased income due to the increase of electricity consumption are accounted for, the possible reduction of biomass consumption reaches its maximum in 2050: 71%.
4. Discussion
Given the current electrification rates and generation capacity, substantial investment will be necessary to supply modern energy to the population of Mali. This study compared three approaches in which this could be done. The first focused on replacing traditional biomass consumption with LPG and using decentralized solar PV to electrify rural populations. The second considered progressive investments in decentralized solar PV to supply the rural population of Mali with electricity according to five stacking electrification tiers. The last approach considered grid extension and centralized electricity generation.
Both decentralized approaches showcase a need for an increased centralized generation to supply the urban population, the size of which varies depending on whether the biomass consumption of the urban residential sector is replaced with LPG or with electricity. In all approaches, the consumption of biomass was at least halved.
The provenance of the electricity generated for centralized distribution was not considered in this study, as the main focus was electrifying the rural population. Therefore, an environmental comparison between the transition to LPG or electricity in the residential sector of Mali was not performed. Consequently, a conclusion about which one is better is impossible without further study. As for cooking purposes alone, the increase in efficiency between switching from biomass to LPG or electricity provides no significant differences to ascertain which one is the best approach. Although it is a given that if the electricity is generated through green means, read renewable energy, transitioning to electricity would incur lower emissions than LPG.
Electrifying rural populations in countries where the national grid does not reach the vast majority of the populated areas, such as Mali, is no easy task. This study used five tiers of electrification and compared the economics of extending the grid versus installing solar PV plants on the locations where the electricity is needed using two scenarios. The first considers that electricity consumption has no direct effect on income generation. The second considers a direct influence. When this influence is considered, numerous populated regions can afford higher electrification tiers. Although, even when it is not considered (the influence of electricity consumption on income), installing decentralized solar PV instead of extending the grid incurs fewer costs when the tier of electrification, and therefore the amount of electricity consumed, is low. Decentralized systems become a better solution as the distance between the existing grid and the location of interest increases. For the vast majority of remote locations, installing solar PV even for the highest tier of electrification is more economically viable than extending the grid when the influence of electricity on income is considered.
As the prices for solar PV are expected to decrease in the future, the areas where the economic viability of solar PV over grid extension are set to increase. This reduction in prices opens the possibility of progressive grid extension and stacking solar PV installations for Mali to reach high electrification rates without the need for either expensive grid extension or fossil-based electricity generation.
When the benefits of new or increased electricity consumption are already present most of the populated areas of Mali could afford acceptable levels of electrification. It would be a matter of waiting for these benefits to ensue before they can start paying for either the service or the equipment. Therefore, any business or support model intended to electrify rural populations should consider providing a gap between the time when access to the electricity service starts and when the population begins to pay for it. Because this study did not include a demonstration site on its methodology, the time it would take for the discussed increase in disposable income to appear is uncertain.
5. Conclusions
In this study, the current electricity access and generation situation of Mali was used to generate multiple electrification scenarios. The scenarios were focused on providing electricity to the residential sector of Mali and mainly to the currently not electrified remote rural areas. In Section 1 of this study, the projected energy demand was met with different tiers of solar electrification. This shed light on the possible reduction of biomass consumption and fossil fuels.
In Section 2 of the study, the effects of new or increased electrification were taken into account. A spatial methodology was used to find which solar electrification tier was viable and affordable for different areas in Mali. This step was done for cases where the effects of electricity demand on income generation were present and were not present. This produced a graphical comparison of how, when enough time is given for the effects to ensue, the ability of the population to afford higher tiers of electrification increases. These results obtained through the methodology presented propose that the inclusion of the effects of electricity demand on income generation is an essential factor to consider for rural electrification modeling.
Most remote rural areas in developing countries lack the economic resources to pay a monthly fee for electricity; this is why the private sector is so reticent about investing in it. Pay-as-you-go financing with the proper data gathering tools could serve as both a viable way for the newly electrified populations to pay for the services and as an indicator on when the demand has increased and when a new expansion is required. With this, two objectives could be met. First, investment is only made when the need is proven/expected. Second, research-wise, this dataset could present a timescale for when precisely the benefits of increased or new electrification emerge, making a refinement of rural energy modeling considering the effects of electrification on income generation possible.
The inclusion of biogas production from rural waste is a possible improvement in the present work. Substituting the need for higher tiers of solar electrification with biogas sourced cooking and heating; could present faster and more affordable electrification for remote rural areas. In its current form, this study concludes that solar PV is the best option to electrify remote rural areas even when the effects of electrification on income are yet to emerge. When they are present, the potential of the population to afford higher tiers of electrification modify the results enough to consider it an essential factor to be considered in future studies.
Author Contributions
R.B. proposed the concept and research design and acquired the research funds. A.B. collected most of the data on site, where V.S. collected the literature data, supported the field data collection and analysis. Data and results analyses were done jointly by all authors. The same is true for the article writing part. All authors have read and agreed to the published version of the manuscript.
Funding
Funding was provided by the German Federal Ministry of Education and Research (BMBF).
Institutional Review Board Statement
Not Applicable.
Informed Consent Statement
Not Applicable.
Data Availability Statement
Publicly available datasets were analyzed in this study. This data can be found on the referenced sources.
Acknowledgments
Authors would like to acknowledge the financial support from German Federal Ministry of Education and Research through its Project Management Agency DLR under the framework of WESA-ITT project.
Conflicts of Interest
The authors declare no conflict of interest.
References
- World Bank. Rural Population (% of Total Population)|Data. Available online: https://data.worldbank.org/indicator/SP.RUR.TOTL.ZS (accessed on 24 February 2021).
- World Bank. Access to Electricity, Rural (% of Rural Population)|Data. Available online: https://data.worldbank.org/indicator/EG.ELC.ACCS.RU.ZS (accessed on 24 February 2021).
- World Bank. Access to Electricity, Rural (% of Rural Population)—Sub-Saharan Africa (Excluding High Income)|Data. Available online: https://data.worldbank.org/indicator/EG.ELC.ACCS.RU.ZS?locations=ZF (accessed on 24 February 2021).
- Kumar, A.; Sah, B.; Singh, A.R.; Deng, Y.; He, X.; Kumar, P.; Bansal, R. A review of multi criteria decision making (MCDM) towards sustainable renewable energy development. Renew. Sustain. Energy Rev. 2017, 69, 596–609. [Google Scholar] [CrossRef]
- Bhatia, M.; Angelou, N. Beyond Connections: Energy Access Redefined; Technical Report 008/15; World Bank: Washington, DC, USA, 2010; Available online: https://openknowledge.worldbank.org/handle/10986/24368 (accessed on 24 February 2021).
- Dinkelman, T. The Effects of Rural Electrification on Employment: New Evidence from South Africa. Am. Econ. Rev. 2011, 101, 3078–3108. [Google Scholar] [CrossRef] [Green Version]
- Yimen, N.; Hamandjoda, O.; Meva’A, L.; Ndzana, B.; Nganhou, J. Analyzing of a Photovoltaic/Wind/Biogas/Pumped-Hydro Off-Grid Hybrid System for Rural Electrification in Sub-Saharan Africa—Case study of Djoundé in Northern Cameroon. Energies 2018, 11, 2644. [Google Scholar] [CrossRef] [Green Version]
- Riva, F. When complexity turns into local prosperity: A system dynamics approach to meeting the challenges of the rural electricity-development nexus. Energy Sustain. Dev. 2020, 59, 226–242. [Google Scholar] [CrossRef]
- Falchetta, G.; Dagnachew, A.G.; Hof, A.F.; Milne, D.J. The role of regulatory, market and governance risk for electricity access investment in sub-Saharan Africa. Energy Sustain. Dev. 2021, 62, 136–150. [Google Scholar] [CrossRef]
- Kizilcec, V.; Parikh, P. Solar Home Systems: A comprehensive literature review for Sub-Saharan Africa. Energy Sustain. Dev. 2020, 58, 78–89. [Google Scholar] [CrossRef]
- van Els, R.H.; Vianna, J.N.D.S.; Brasil, A.C.P. The Brazilian experience of rural electrification in the Amazon with decentralized generation—The need to change the paradigm from electrification to development. Renew. Sustain. Energy Rev. 2012, 16, 1450–1461. [Google Scholar] [CrossRef]
- Baurzhan, S.; Jenkins, G.P. Off-grid solar PV: Is it an affordable or appropriate solution for rural electrification in Sub-Saharan African countries? Renew. Sustain. Energy Rev. 2016, 60, 1405–1418. [Google Scholar] [CrossRef]
- Szabó, S.; Bódis, K.; Huld, T.; Moner-Girona, M. Energy solutions in rural Africa: Mapping electrification costs of distributed solar and diesel generation versus grid extension. Environ. Res. Lett. 2011, 6, 034002. [Google Scholar] [CrossRef]
- Barasa, M.; Bogdanov, D.; Oyewo, A.S.; Breyer, C. A cost optimal resolution for Sub-Saharan Africa powered by 100% renewables in 2030. Renew. Sustain. Energy Rev. 2018, 92, 440–457. [Google Scholar] [CrossRef]
- Jahangiri, M.; Soulouknga, M.H.; Bardei, F.K.; Shamsabadi, A.A.; Akinlabi, E.T.; Sichilalu, S.M.; Mostafaeipour, A. Techno-econo-environmental optimal operation of grid-wind-solar electricity generation with hydrogen storage system for domestic scale, case study in Chad. Int. J. Hydrogen Energy 2019, 44, 28613–28628. [Google Scholar] [CrossRef]
- Parrado, C.; Girard, A.; Simon, F.; Fuentealba, E. 2050 LCOE (Levelized Cost of Energy) projection for a hybrid PV (photovoltaic)-CSP (concentrated solar power) plant in the Atacama Desert, Chile. Energy 2016, 94, 422–430. [Google Scholar] [CrossRef]
- Hernández-Moro, J.; Martínez-Duart, J. Analytical model for solar PV and CSP electricity costs: Present LCOE values and their future evolution. Renew. Sustain. Energy Rev. 2013, 20, 119–132. [Google Scholar] [CrossRef]
- Wamukonya, N.; Davis, M. Socio-economic impacts of rural electrification in Namibia: Comparisons between grid, solar and unelectrified households. Energy Sustain. Dev. 2001, 5, 5–13. [Google Scholar] [CrossRef]
- Sen, R.; Bhattacharyya, S.C. Off-grid electricity generation with renewable energy technologies in India: An application of HOMER. Renew. Energy 2014, 62, 388–398. [Google Scholar] [CrossRef]
- Bos, K.; Chaplin, D.; Mamun, A. Benefits and challenges of expanding grid electricity in Africa: A review of rigorous evidence on household impacts in developing countries. Energy Sustain. Dev. 2018, 44, 64–77. [Google Scholar] [CrossRef]
- Ehnberg, J.; Ahlborg, H.; Hartvigsson, E. Approach for flexible and adaptive distribution and transformation design in rural electrification and its implications. Energy Sustain. Dev. 2020, 54, 101–110. [Google Scholar] [CrossRef]
- Isa, Z.; al Sayed, A.R.M.; Kun, S.S. Review paper on economic growth—Aggregate energy consumption nexus. Int. J. Energy Econ. Policy 2015, 5, 385–401. [Google Scholar]
- Bridge, B.A.; Adhikari, D.; Fontenla, M. Household-level effects of electricity on income. Energy Econ. 2016, 58, 222–228. [Google Scholar] [CrossRef] [Green Version]
- Narayan, P.K.; Smyth, R. Electricity consumption, employment and real income in Australia evidence from multivariate Granger causality tests. Energy Policy 2005, 33, 1109–1116. [Google Scholar] [CrossRef]
- Zhu, X.; Li, L.; Zhou, K.; Zhang, X.; Yang, S. A meta-analysis on the price elasticity and income elasticity of residential electricity demand. J. Clean. Prod. 2018, 201, 169–177. [Google Scholar] [CrossRef]
- Obermaier, M.; Szklo, A.; La Rovere, E.L.; Rosa, L.P. An assessment of electricity and income distributional trends following rural electrification in poor northeast Brazil. Energy Policy 2012, 49, 531–540. [Google Scholar] [CrossRef]
- Francisco, E.D.R.; Aranha, F.; Zambaldi, F.; Goldszmidt, R. Electricity consumption as a predictor of household income: An spatial statistics approach. In Proceedings of the GEOINFO 2006—8th Brazilian Symposium on GeoInformatics, Campos do Jordão, Brazil, 19–22 November 2006. [Google Scholar]
- Opiyo, N.N. How basic access to electricity stimulates temporally increasing load demands by households in rural developing communities. Energy Sustain. Dev. 2020, 59, 97–106. [Google Scholar] [CrossRef]
- ONSSET. Available online: http://www.onsset.org/ (accessed on 27 May 2021).
- Bissiri, M.; Moura, P.; Figueiredo, N.C.; da Silva, P.P. A geospatial approach towards defining cost-optimal electrification pathways in West Africa. Energy 2020, 200, 117471. [Google Scholar] [CrossRef]
- Tesfahunegn, H.; Nwosu, N.; Lee, E.; Shirley, R. Unlocking Utilities of the Future in Sub-Saharan Africa: An Optimization Analysis of Grid Integration Opportunities in Uganda. In Proceedings of the 2020 IEEE PES/IAS PowerAfrica, Virtual Conference, 25–28 August 2020; pp. 1–5. [Google Scholar]
- Jean, W.; Arcela, A.; Van Els, R.H.; Junior, A.C.P.B.; Echeverry, S.M.V.; De Miranda, A.R.S.; De Souza, J.S.A. A GIS for Rural Electrification Strategies in the Brazilian Amazon. Pap. Appl. Geogr. 2021, 1–17. [Google Scholar] [CrossRef]
- Korkovelos, A.; Khavari, B.; Sahlberg, A.; Howells, M.; Arderne, C.; Mentis, D. The Role of Open Access Data in Geospatial Electrification Planning and the Achievement of SDG7. An OnSSET-Based Case Study for Malawi. Energies 2019, 12, 1395, Erratum in 2020, 13, 5044. [Google Scholar] [CrossRef] [Green Version]
- Menghwani, V.; Zerriffi, H.; Korkovelos, A.; Khavari, B.; Sahlberg, A.; Howells, M.; Mentis, D. Planning with justice: Using spatial modelling to incorporate justice in electricity pricing—The case of Tanzania. Appl. Energy 2020, 264, 114749. [Google Scholar] [CrossRef]
- World Bank. Population, Total—Mali|Data. Available online: https://data.worldbank.org/indicator/SP.POP.TOTL?locations=ML (accessed on 24 February 2021).
- World Bank. Mali|Data. Available online: https://data.worldbank.org/country/mali (accessed on 24 February 2021).
- Traore, V.; Tiéblé, D. Menages et Caracteristiques de L’habitat au Mali; Institut National de la Statistique INSAT: Bamako, Mali, 2012. [Google Scholar]
- SIE. Rapport D’activité de Système D’information Energétique (SIE); SIE: Bamako, Mali, 2018. [Google Scholar]
- NRECA International, Ltd. Reducing the Cost of Grid Extension for Rural Electrification; Energy Sector Management Assistance Programme (ESMAP): Washington, DC, USA, 2000; Volume ESM 227, Available online: https://openknowledge.worldbank.org/handle/10986/20326 (accessed on 26 April 2021).
- Jjaeger. Hybrid Mini-Grids for Rural Electrification—Lessons Learned; The Alliance for Rural Electrification (ARE): Brussels, Belgium, 3 April 2016; Available online: https://www.ruralelec.org/publications/hybrid-mini-grids-rural-electrification-lessons-learned (accessed on 26 April 2021).
- Agence Beninoise d’Electrification Rurale et de Maitrise d’Energie. Agence Beninoise d’Electrification Rurale et de Maitrise d’Energie; ABERME/MIERT: Cotonou, Benin, 2019. [Google Scholar]
- OpenStreetMap Contributors. Planet Dump. 2017. Available online: https://www.openstreetmap.org (accessed on 24 February 2021).
- ECOWREX. Mali—Electricity Transmission Network—ENERGYDATA.INFO 2018. Available online: https://energydata.info/dataset/mali-electricity-transmission-network-2014 (accessed on 24 February 2021).
- Thiruselvi, D.; Kumar, P.S.; Kumar, M.A.; Lay, C.-H.; Aathika, S.; Mani, Y.; Jagadiswary, D.; Dhanasekaran, A.; Shanmugam, P.; Sivanesan, S.; et al. A critical review on global trends in biogas scenario with its up-gradation techniques for fuel cell and future perspectives. Int. J. Hydrogen Energy 2021, 46, 16734–16750. [Google Scholar] [CrossRef]
- Pintér, G. The Potential Role of Power-to-Gas Technology Connected to Photovoltaic Power Plants in the Visegrad Countries—A Case Study. Energies 2020, 13, 6408. [Google Scholar] [CrossRef]
- Zepter, J.; Engelhardt, J.; Gabderakhmanova, T.; Marinelli, M. Empirical Validation of a Biogas Plant Simulation Model and Analysis of Biogas Upgrading Potentials. Energies 2021, 14, 2424. [Google Scholar] [CrossRef]
- Lamidi, R.O.; Jiang, L.; Wang, Y.; Pathare, P.B.; Aguilar, M.C.; Wang, R.; Eshoul, N.M.; Roskilly, A.P. Techno-Economic Analysis of a Cogeneration System for Post-Harvest Loss Reduction: A Case Study in Sub-Saharan Rural Community. Energies 2019, 12, 872. [Google Scholar] [CrossRef] [Green Version]
- Masip, Y.; Gutierrez, A.; Morales, J.; Campo, A.; Valín, M. Integrated Renewable Energy System based on IREOM Model and Spatial–Temporal Series for Isolated Rural Areas in the Region of Valparaiso, Chile. Energies 2019, 12, 1110. [Google Scholar] [CrossRef] [Green Version]
- Diarra, D.-C.; Akuffo, F. Solar photovoltaic in Mali: Potential and constraints. Energy Convers. Manag. 2002, 43, 151–163. [Google Scholar] [CrossRef]
- Mohammed, Y.; Mustafa, M.; Bashir, N.; Mokhtar, A. Renewable energy resources for distributed power generation in Nigeria: A review of the potential. Renew. Sustain. Energy Rev. 2013, 22, 257–268. [Google Scholar] [CrossRef]
- Thiam, D.-R. Renewable decentralized in developing countries: Appraisal from microgrids project in Senegal. Renew. Energy 2010, 35, 1615–1623. [Google Scholar] [CrossRef]
- SEI. LEAP. Available online: https://leap.sei.org/ (accessed on 24 February 2021).
- QGIS. Welcome to the QGIS Project! Available online: https://qgis.org/en/site/ (accessed on 24 February 2021).
- McPherson, M.; Karney, B. Long-term scenario alternatives and their implications: LEAP model application of Panama’s electricity sector. Energy Policy 2014, 68, 146–157. [Google Scholar] [CrossRef]
- SIE. Rapport D’activité de Système d’Information Energétique—Mali; SIE: Bamako, Mali, 2014. [Google Scholar]
- EDM SA. Rapport D’activité 2017; EDM SA: Bamako, Mali, 2017. [Google Scholar]
- Centre pour les Energies Renouvelables et lÉfficacité Energetique de la CEDEAO (CEREEC). Plans d’Action Nationaux des Energies Renouvelables (PANER) du Mali; CEREEC/CEDEAO ECOWAS: Bamako, Mali, 2015. [Google Scholar]
- African Development Bank Group. Renewable Energy in Africa—Mali Country Profile—2015; African Development Bank Group: Abidjan, Ivory Coast, 2015; Available online: https://www.afdb.org/fileadmin/uploads/afdb/Documents/Generic-Documents/Profil_ER_Mal_Web_light.pdf (accessed on 24 February 2021).
- Mamadou, B.B.; Seydou, M.T.; Vadnais, D.; Bartlett, N. Mali. Demographic and Health Survey 2001. Key Findings. Cellule de Planification et de Statistique of the Ministry of Health and the Direction Nationale de la Statistique et de l’Informatique, Mali, Survey Reports/Key Findings. 2001. Available online: https://dhsprogram.com/publications/publication-SR95-Summary-Reports-Key-Findings.cfm (accessed on 24 February 2021).
- Park, N.-B.; Yun, S.-J.; Jeon, E.-C. An analysis of long-term scenarios for the transition to renewable energy in the Korean electricity sector. Energy Policy 2013, 52, 288–296. [Google Scholar] [CrossRef]
- KfW Development Bank. Liquefied Petroleum Gas as a Clean Cooking Fuel for Developing Countries: Implications for Climate, Forests, and Affordability; KfW Development Bank: Frankfurt, Germany, 2017; Available online: https://ccacoalition.org/en/resources/liquefied-petroleum-gas-clean-cooking-fuel-developing-countries-implications-climate (accessed on 24 February 2021).
- Labriet, M. Électrification Rurale et Énergies Renouvelables au Mali: Deux Études et un Atelier—Médiaterre; Fondation Energía sin Fronteras: Madrid, Spain, 2016; Available online: https://www.mediaterre.org/droit/genpdf,20170209104438,5.html (accessed on 24 February 2021).
- Kyriakarakos, G.; Balafoutis, A.T.; Bochtis, D. Proposing a Paradigm Shift in Rural Electrification Investments in Sub-Saharan Africa through Agriculture. Sustainability 2020, 12, 3096. [Google Scholar] [CrossRef] [Green Version]
- Diagrams.Net. Available online: https://app.diagrams.net/ (accessed on 26 April 2021).
- Center for International Earth Science Information Network—CIESIN—Columbia University. Gridded Population of the World, Version 4 (GPWv4): Population Density, Revision 11; NASA Socioeconomic Data and Applications Center (SEDAC): Palisades, NY, USA, 2018. [Google Scholar] [CrossRef]
- World Bank. Global Solar Atlas. Available online: https://globalsolaratlas.info/map?c=16.370036,-2.290024,11&s=16.370036,-2.290024&m=site (accessed on 24 February 2021).
- World Bank. Global Wind Atlas Global Wind Atlas. Available online: https://globalwindatlas.info (accessed on 24 February 2021).
- SAP (Système d’Alerte Précoce) du Mali. Mali—Main, Secondary Rivers and Water Bodies Humanitarian Data Exchange. 2012. Available online: https://data.humdata.org/dataset/mali-water-bodies-water-courses (accessed on 24 February 2021).
- Ondraczek, J. Are we there yet? Improving solar PV economics and power planning in developing countries: The case of Kenya. Renew. Sustain. Energy Rev. 2014, 30, 604–615. [Google Scholar] [CrossRef]
- Kibaara, S.; Murage, D.K.; Musau, P.; Saulo, M.J. Analysis of the Levelized cost of Electricity (LCOE) of Solar PV Systems considering their Environmental impacts on Biodiversity. In Proceedings of the 2020 6th IEEE International Energy Conference (ENERGYCon), Gammarth, Tunisia, 28 September–1 October 2020; pp. 56–61. [Google Scholar]
- Lai, C.S.; McCulloch, M.D. Sizing of Stand-Alone Solar PV and Storage System with Anaerobic Digestion Biogas Power Plants. IEEE Trans. Ind. Electron. 2017, 64, 2112–2121. [Google Scholar] [CrossRef]
- Taziwa, R.; Meyer, E.L.; Buma, C. Performance parameters of an off-grid building integrated photovoltaic system in south Africa. In Proceedings of the 33rd European Photovoltaic Solar Energy Conference and Exhibition, Amsterdam, The Netherlands, 25–29 September 2017. [Google Scholar]
- Average Salary in Mali 2021—The Complete Guide. Available online: http://www.salaryexplorer.com/salary-survey.php?loc=132&loctype=1 (accessed on 26 April 2021).
- Poverty Maps (Admin 1—2012)—Mali—Poverty Map (Admin 1—2012)—‘FAO catalog’. Available online: https://data.apps.fao.org/catalog/dataset/poverty-map-admin-1-2012/resource/6b43bef3-6d09-4da2-a43c-ca60fdb79d6b?inner_span=True (accessed on 26 April 2021).

Figure 2.
Biomass production. Using data from [62].
Figure 2.
Biomass production. Using data from [62].

Figure 3.
GIS methodology. Developed by the authors using [64].
Figure 3.
GIS methodology. Developed by the authors using [64].

Figure 4.
Energy demand by 2050 for scenarios based on NATa.

Figure 5.
Energy demand by 2050 for scenarios based on NATb.

Figure 6.
Energy supply by 2050 for scenarios based on NATa.

Figure 7.
Energy supply by 2050 for scenarios based on NATb.

Figure 8.
Viable and affordable electrification tier of the geographical units for the assumptions valid for 2030. (A) Without the influence of electricity consumption on income. (B) Influences of electricity consumption on income are considered.
Figure 8.
Viable and affordable electrification tier of the geographical units for the assumptions valid for 2030. (A) Without the influence of electricity consumption on income. (B) Influences of electricity consumption on income are considered.

Figure 9.
Viable and affordable electrification tier of the geographical units for the assumptions valid for 2040. (A) Without the influence of electricity consumption on income. (B) Influences of electricity consumption on income are considered.
Figure 9.
Viable and affordable electrification tier of the geographical units for the assumptions valid for 2040. (A) Without the influence of electricity consumption on income. (B) Influences of electricity consumption on income are considered.

Figure 10.
Viable and affordable electrification tier of the geographical units for the assumptions valid for 2050. (A) Without the influence of electricity consumption on income. (B) Influences of electricity consumption on income are considered.
Figure 10.
Viable and affordable electrification tier of the geographical units for the assumptions valid for 2050. (A) Without the influence of electricity consumption on income. (B) Influences of electricity consumption on income are considered.


Table 1.
Assumed values representative for Mali.
| Ktoe | Status | Biomass | Electricity | Petroleum Products |
|---|---|---|---|---|
| Urban | Electrified | 986.86 | 40.83 | 2.95 |
| Non-elect. | 160.65 | 0 | 0.89 | |
| Rural | Electrified | 294.09 | 12.34 | 2.41 |
| Non-elect. | 837.02 | 0 | 7.97 |
Table 2.
Scenarios.
| Scenario | a | b | c | Scenario | a | b | c |
|---|---|---|---|---|---|---|---|
| N1C_T1 = | NATa + | COM + | T1 | N2C_T1 = | NATb + | COM + | T1 |
| N1C_T2 = | NATa + | COM + | T2 | N2C_T2 = | NATb + | COM + | T2 |
| N1C_T3 = | NATa + | COM + | T3 | N2C_T3 = | NATb + | COM + | T3 |
| N1C_T4 = | NATa + | COM + | T4 | N2C_T4 = | NATb + | COM + | T4 |
| N1C_T5 = | NATa + | COM + | T5 | N2C_T5 = | NATb + | COM + | T5 |
Table 3.
Base scenarios.
| Scenario | NATa | NATb | ||
|---|---|---|---|---|
| Urban electrification rates | 95% on 2021 | 95% on 2021 | ||
| Rural electrification rates | 45% on 2030, 77% by 2050 | 31% on 2030 | ||
| Urban consumption | Electricity | Electrified | 3%/year growth | 0.4 toe per household on 2030 |
| Biomass | Electrified | 0% on 2030 | 0% on 2030 | |
| Not electrified | 0% on 2030 | |||
| LPG | Electrified | 0.4 toe per household on 2030 | ||
| Not electrified | 0.4 toe per household on 2030 | |||
| Rural consumption | Electricity | Electrified | ||
| Biomass | Electrified | 0% on 2030 | 0% on 2030 | |
| Not electrified | ||||
| LPG | Electrified | 0.2 toe per household on 2030 | ||
| Not electrified | ||||
Table 4.
Electrification scenarios.
| Tier | Min Daily Capacity Per Household (W) | Biomass Reduced by Using Electricity (%) |
|---|---|---|
| T1 | 3 1 | 0 |
| T2 | 50 1 | 0 |
| T3 | 200 1 | 20 |
| T4 | 800 1 | 40 |
| T5 | 2000 1 | 80 |
Table 5.
Biomass reduction according to the year and scenario of income.
| Scenario | Year | Biomass Red |
|---|---|---|
| No income effects 1 | 2030 | 50% |
| 2040 | 64% | |
| 2050 | 70% | |
| With income effects 2 | 2030 | 60% |
| 2040 | 67% | |
| 2050 | 71% |
Publisher’s Note: MDPI stays neutral with regard to jurisdictional claims in published maps and institutional affiliations. |
© 2021 by the authors. Licensee MDPI, Basel, Switzerland. This article is an open access article distributed under the terms and conditions of the Creative Commons Attribution (CC BY) license (https://creativecommons.org/licenses/by/4.0/).
Share and Cite
MDPI and ACS Style
Sessa, V.; Bhandari, R.; Ba, A. Rural Electrification Pathways: An Implementation of LEAP and GIS Tools in Mali. Energies 2021, 14, 3338. https://0-doi-org.brum.beds.ac.uk/10.3390/en14113338
AMA Style
Sessa V, Bhandari R, Ba A. Rural Electrification Pathways: An Implementation of LEAP and GIS Tools in Mali. Energies. 2021; 14(11):3338. https://0-doi-org.brum.beds.ac.uk/10.3390/en14113338
Chicago/Turabian StyleSessa, Vittorio, Ramchandra Bhandari, and Abdramane Ba. 2021. "Rural Electrification Pathways: An Implementation of LEAP and GIS Tools in Mali" Energies 14, no. 11: 3338. https://0-doi-org.brum.beds.ac.uk/10.3390/en14113338
Note that from the first issue of 2016, this journal uses article numbers instead of page numbers. See further details here.