
Particulate Matter Reduction in Residual Biomass Combustion
by
 , and
, and
Maulana G. Nugraha
1,2 ,
,
Harwin Saptoadi
3,
Muslikhin Hidayat
2,
Bengt Andersson
1 and
Ronnie Andersson
1,* 1
Department of Chemistry and Chemical Engineering, Chalmers University of Technology, 41296 Gothenburg, Sweden
2
Department of Chemical Engineering, Universitas Gadjah Mada, Jl. Grafika No.2, Yogyakarta 55281, Indonesia
3
Department of Mechanical and Industrial Engineering, Universitas Gadjah Mada, Jl. Grafika No.2, Yogyakarta 55281, Indonesia
*
Author to whom correspondence should be addressed.
Energies 2021, 14(11), 3341; https://0-doi-org.brum.beds.ac.uk/10.3390/en14113341
Submission received: 19 May 2021
/
Revised: 31 May 2021
/
Accepted: 3 June 2021
/
Published: 7 June 2021
(This article belongs to the Special Issue Residual Biomass Conversion to Bioenergy)
Abstract
:Counteracting emissions of particulate matter (PM) is an increasingly important goal in sustainable biomass combustion. This work includes a novel approach to investigate the PM emissions, originating from residual biomass combustion, at different combustion conditions in a lab-scale grate-fired furnace and includes in situ PM measurements by using on-line sensors. The interior furnace design allows installation of baffles to suppress the emissions by controlling the residence time. Moreover, the two-thermocouple method is used to measure the true gas temperature, and an on-line spatially resolved PM measurement method is developed to study the evolution of the PM concentration throughout the furnace for different experimental conditions thereby allowing accurate in-situ measurement of the PM reactivity. Experimental results and computational fluid dynamics (CFD) analyses are utilized in the current work to develop a kinetic model for reduction of particulate matter emissions in biomass combustion. The discrete particle model (DPM) is utilized in CFD analysis to improve the understanding of the particle temperature and residence time distribution which are difficult to quantify experimentally. By combining the experimental measurements of real soot formed during biomass combustion and information from the CFD analyses, a predictive kinetic model for PM10 reduction in biomass combustion is successfully developed.
1. Introduction
Biomass energy source is attracting worldwide attention since it is renewable, environmentally friendly, and has low greenhouse effect [1]. The abundant resource of biomass energy, which has been recorded to be the fourth largest energy source in the world, shows its great potential to be exploited further in more optimum way [2]. However, further utilization of biomass energy source is still facing several obstacles. Those obstacles include slagging and deposition in the combustion facility and also emission of toxic material to the environment like particulate matter (PM).
In the past, smoke from factory stacks, which indicate PM emissions to the environment, was a sign of prosperity. In time, it became a nuisance and finally a health concern [3]. Particulate matter is proven to be hazardous for human health and it contributed to about 4.2 million premature death worldwide or 6.7% of all death cases in 2016 [4]. During the past decades PM has attracted a lot of interest in the scientific literature, including characterization of emissions in several combustion systems, for example, gasoline engine [5,6,7], diesel engine [8,9], and coal combustion system [10,11,12]. Studies have shown that more than 20% of the total PM2.5 emission in USA and east of China originated from biomass combustion [13,14]. In Europe, as much as 70% of the total organic PM in the air during winter season originated from residential biomass combustion [15].
Studies on the most widely used biomass furnace i.e., grate-fired biomass furnace, have in comparison attracted limited interest related to PM emissions. Limited number of studies focusing on the effect of air staging [16], grate vibration [17], fuel load [18], and fuel types [19,20,21] have been conducted independently but not providing a complete understanding of PM emissions. Recent studies related to PM characterization in biomass combustion systems reveal important PM properties i.e., micro-morphologies, chemical compositions, concentration, and mass and size distribution but provide no insight to reaction kinetics which benefits from spatial resolution measurement of PM inside the furnace [22,23,24,25].
Based on this knowledge gap, the present work aims at understanding the effect of different operating conditions on PM emission in a lab-scale grate-fired biomass furnace. As has been reported in the literature, substantial PM reduction can be reached by optimizing the conditions in the combustion system by controlling time, temperature, and mixing condition [26]. Therefore, in the current work, the exploration of different operating conditions includes variation of gas residence time in the furnace, gas temperature, and different mixing conditions by adjusting the stoichiometric condition.
In order to support the development of comprehensive understanding of PM reduction, advanced and robust measurement methods of different combustion parameters are introduced in the experimental setup. This includes utilization of the two-thermocouple method to accurately measure the true gas temperature distribution, and on-line measurements of the gas phase composition and the PM concentration throughout the furnace. On-line and spatially resolved PM measurements can be a direct route to determine the reaction kinetics and a remedy to the problem with sampling and off-line handling influence PM reactivity [27,28]. Moreover, the on-line measurement allows reaction kinetics determined directly using the real PM, which are formed from biomass combustion, instead of using the synthetic PM [29,30,31].
Computational fluid dynamics (CFD) analysis has previously been used to accelerate the understanding and design of biomass combustion technology [32,33,34]. In the current work, a CFD model is developed to allow quantification of parameters which are difficult to obtain by direct measurements in the experimental facility, for example, gas and particle residence time distributions and particle temperature. Thereby CFD analysis provides the necessary data to determine reaction kinetics and improves the understanding of PM reduction in biomass combustion. Accurate measurements in combination with detailed CFD simulations provide a comprehensive picture of processes in a biomass fired furnace. The result from the current study aims at providing a better understanding of how the conditions in the furnace affect PM formation and how emissions can be reduced in the biomass combustion system.
2. Theory
2.1. Biomass Combustion
Thermal decomposition of biomass consists of several stages i.e., drying of moisture, devolatilization, combustion of volatile matter in gas phase, and char burning [35]. Water is present within the biomass matrix as bound water, free water, and water vapor. Bound water occupies all available adsorption sites and additional free water occupies biomass pores. Free water evaporates easier compared to bound water since the latter has a stronger bond with the solid matrix [36].
At sufficiently high temperature, biomass starts to devolatilize and generates volatile gases, tar, and char. This process is governed by several physicochemical processes i.e., shrinking and swelling of the biomass particle, transport processes within the pores and at the surface, heat transport during pyrolysis, and secondary reactions of pyrolysis products. The volatile compounds are formed from several functional groups, which separate further into CH4, H2, CO, and HCN. Breaking of chemical bonds in the biomass simultaneously leads to fragments, which produce tar by rearrangements and reactions. The volatile and tar compounds are transported to the surface of the biomass particle, where they are released, mixed with ambient air, and burn subsequently [3].
The solid char surface is oxidized to CO and CO2 due to the reaction with O2. Char may also react with CO2 to produce CO as an entropy driven reaction but only at high temperatures due to thermodynamics [37]. Char burning includes several phenomena i.e., adsorption of molecules on the surface, surface reactions, desorption of the products. Additionally, diffusion and reaction within the pores of char may be accounted for [38].
2.2. PM Formation in Biomass Combustion
Particulate matter consists of three main components i.e., ash, soot, and polycyclic aromatic compounds (PAC). Coconut shell material that is used in the current work has a low ash content (0.6%). About 50% of this ash is K and Na, which vaporizes and is expected to contribute to the particulate matter. In the commercial grate-fired biomass furnace, it was estimated that the mean mass fraction of fly ash is about 33% of the total ash content in the fuel [39]. Ash particles from biomass combustion usually have a mass size distribution with a maximum around 0.3 µm [40].
A wide range of organic compounds are formed during devolatilization, from small molecules like methane and acetylene to larger molecules like tar. PAC is formed via different mechanisms e.g., directly from devolatilized tar and stepwise via formation of aromatic compounds from smaller molecules in the combustion zone. The PAC is an intermediate compound in the soot formation process. It may also decompose and form stable gas components, which will be burnt subsequently.
Soot is formed from tar, PAC, and lower molecules in the high temperature region in the flame. In general, lignin content in biomass is considered as the main source of PAC and soot [41]. Both the amount of PAC and soot depend on the temperature during biomass devolatilization and the conditions in the flame region i.e., temperature and oxygen concentration.
3. Experimental Methodology
3.1. Furnace Design
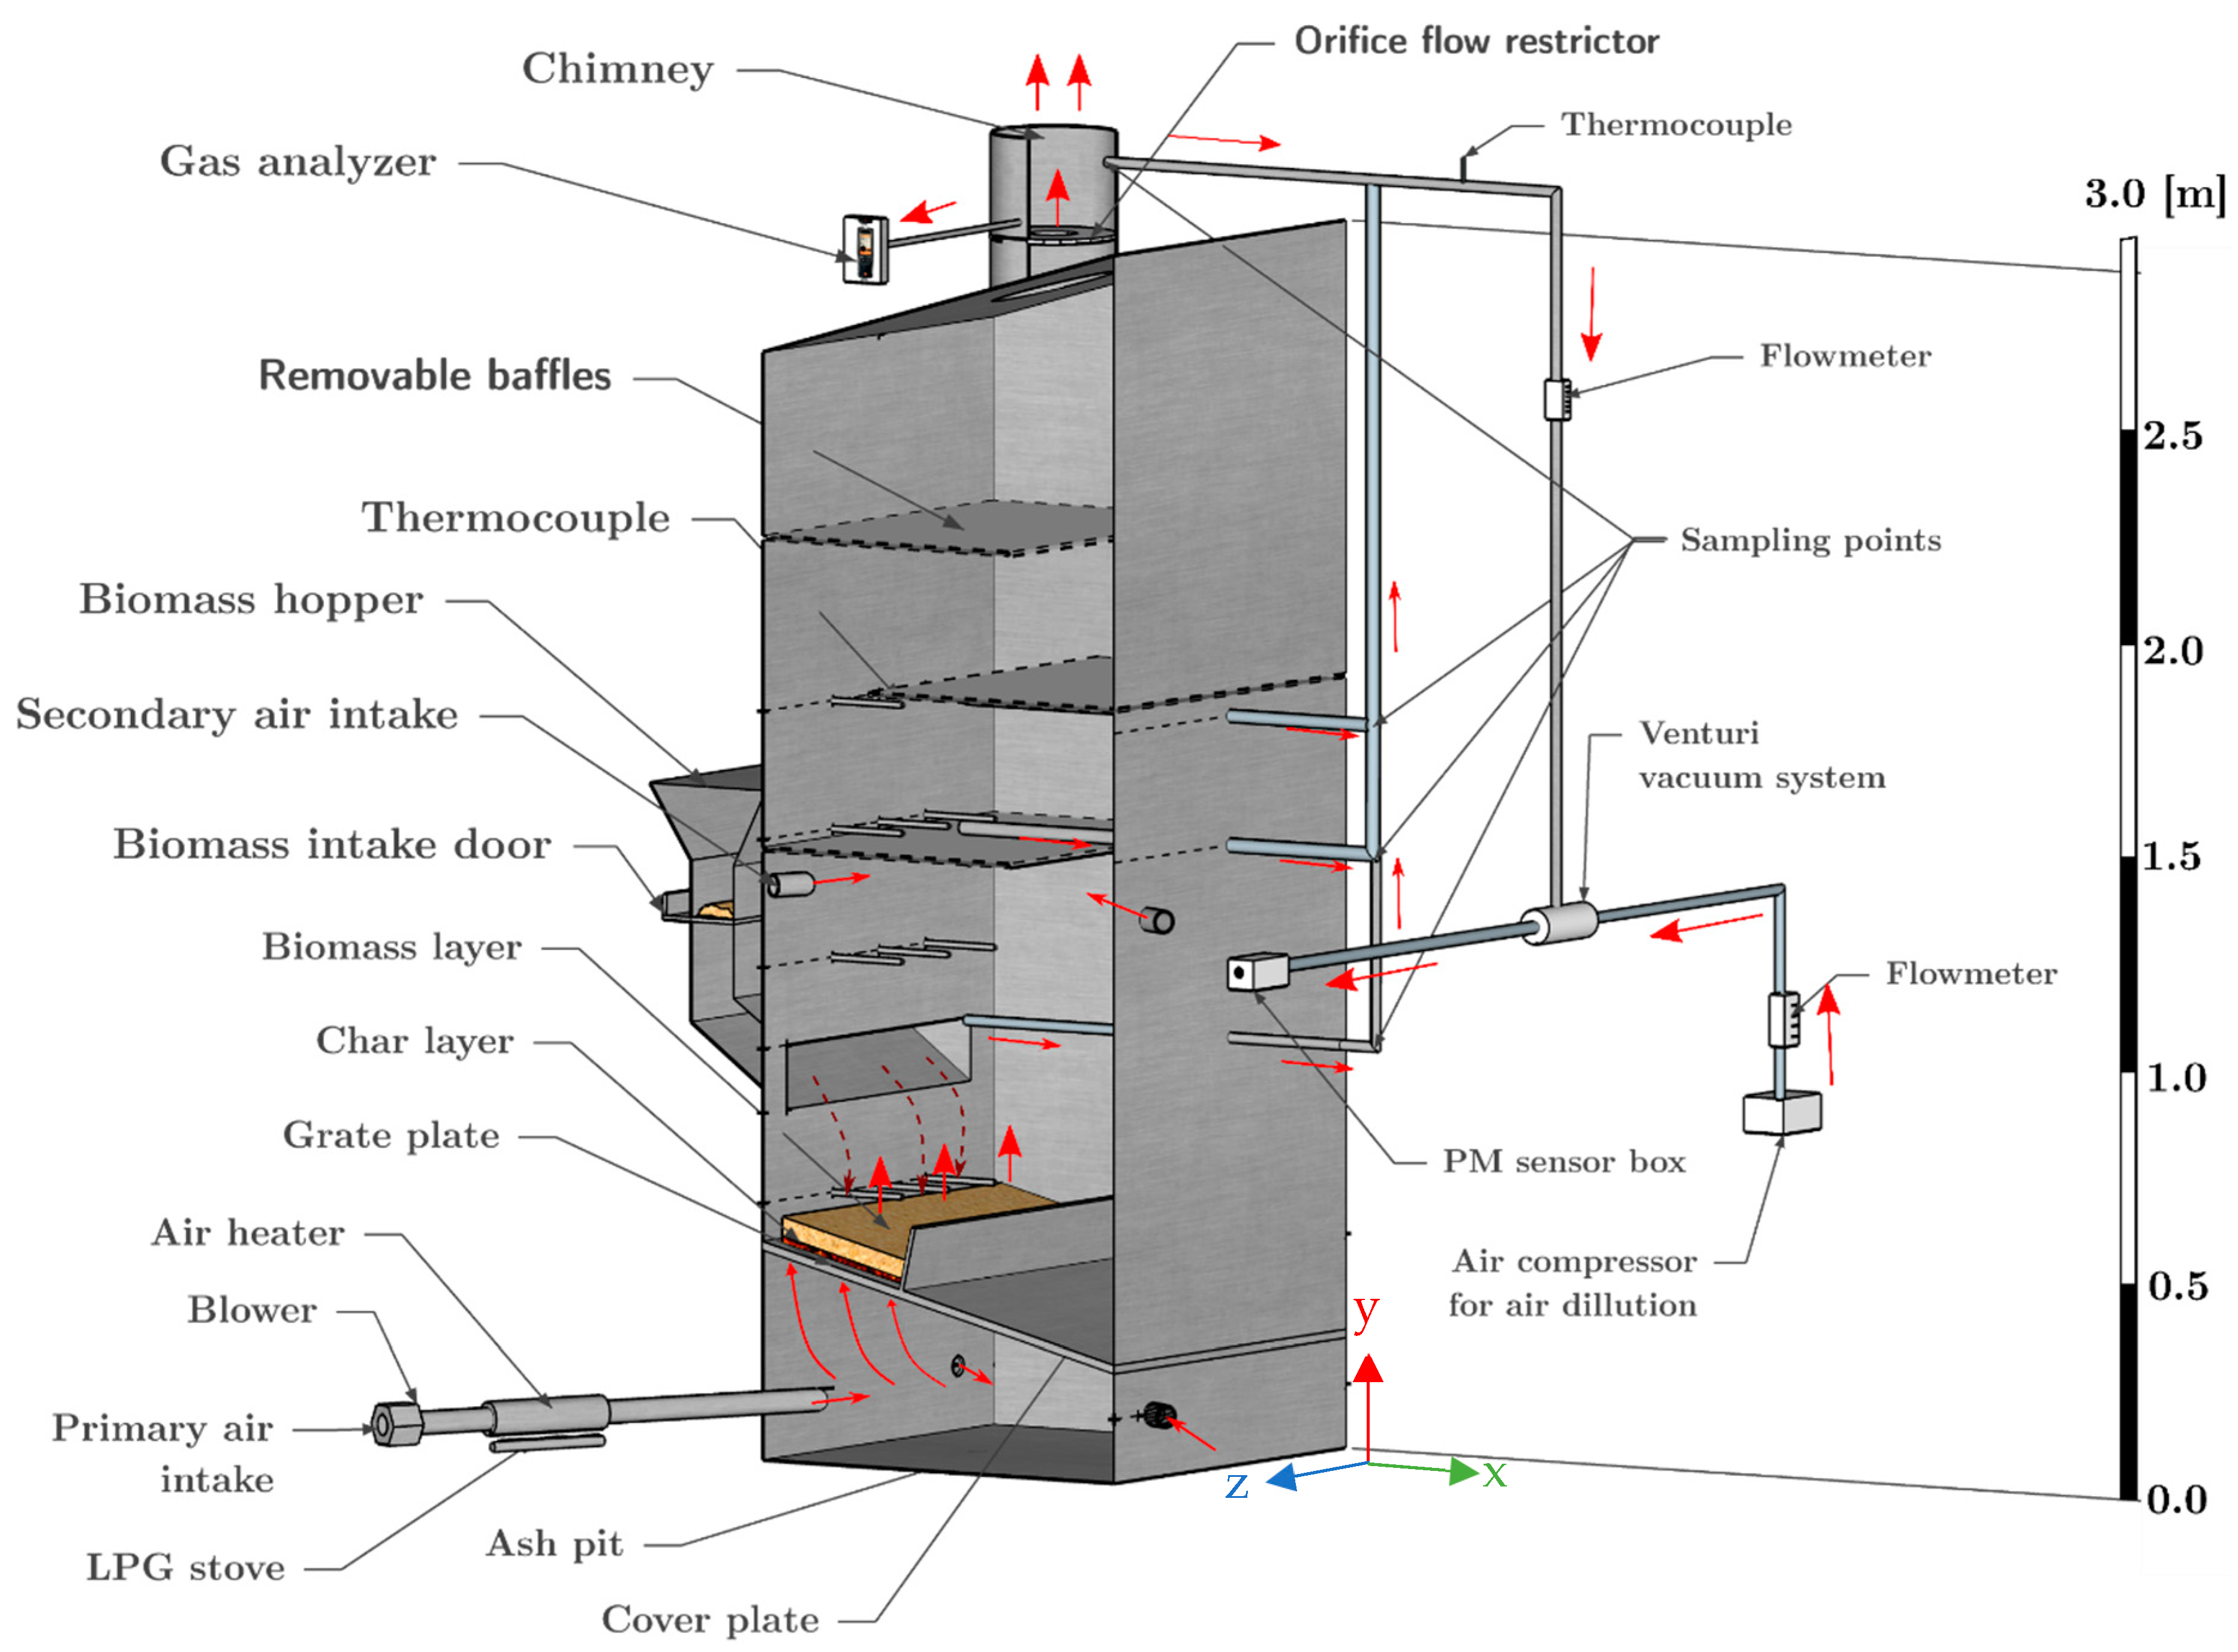
A fixed-bed grate furnace was designed to allow detailed observation of different combustion parameters and characteristics of particulate matter. The grate furnace has several advantages over other common commercial furnace types. These advantages include lower investment cost, lower operating cost, lower dust load in the flue gas, and less sensitivity to slagging compared to the fluidized-bed furnace [42]. The experimental setup is depicted in Figure 1.
As shown in Figure 1, primary air is supplied from below the grate plate, and the air reaches the solid biomass, which is distributed above the perforated plate (0.8 cm × 0.8 cm holes size with 50% open volume). Secondary air is prepared in the furnace design, but it has not been utilized in the current work. The primary air flowrates are monitored using a calibrated pressure drop meter. The solid biomass is introduced to the furnace through a hopper. The furnace’s freeboard volume is 3 m × 1 m × 1 m (H × W × L). The gas temperature in the freeboard is measured by several K type thermocouples. The thermocouples have been calibrated to accurately measure temperature up to 1100 °C.
The exhaust gas is emitted to the environment via a 3-m high chimney, while minor fraction (0.04%) was withdrawn into the PM measuring system. The PM measuring system is equipped with a controlled air dilution system to allow measurement of PM throughout the furnace even in the region with high concentration i.e., in the region close to the flame. In order to minimize air leaking into the furnace, a 13 cm orifice flow restrictor is installed inside the chimney to build neutral pressure condition in the freeboard compared to ambient pressure condition. The comparison between air flowrate measurement and the oxygen level at the chimney shows 15% air leaking, which has been accounted for in the analysis. Two layers of insulation are attached to the furnace wall, i.e., 5 cm of ceramic wool and 20 cm of glass wool, to limit the heat loss from the furnace. This insulation is sufficient to reduce heat losses through the walls to below 2%.
In order to understand the influence of different operating conditions on PM emissions, the furnace design includes the following features:
- Baffle(s) that can be installed/removed in the freeboard to modify the gas residence time.
- Adjustable primary air flowrates.
- Adjustable level of air pre-heating for primary air.
- Multiple on-line PM sampling points located at 100 cm, 145 cm, 175 cm, and 325 cm (at the chimney) from the ash pit.
Thermocouples signals are acquired using a DataTaker DT85 (Thermo Fisher Scientific, Scoresby, Australia), while PM sensor readings are directly transferred via USB connection to the control computer.
3.2. Experimental Design
Each experiment was initiated by igniting the biomass using an LPG burner. Then, the specific biomass feed rate, 20 kg biomass per hour, was reloaded 1/60 every minute i.e., 1/3 kg/minute, until the end of the experiments. Due to the large thermal mass of the furnace, it required four hours operation to reach steady state condition. Data acquisition started after the combustion process reached steady state operating conditions which was identified by constant thermocouple reading both in the gas phase and in the furnace walls. Experimental measurement inside the chimney show that this operating condition produced stable combustion condition where the standard deviation of oxygen concentration varied less than ±2% and the standard deviation of temperature varied ±7 °C.
During the experiments, all combustion parameters were being recorded i.e., temperature profile, gas composition using a gas analyzer, and PM concentration using a PM sensor and a PM filter. The accumulated char was measured after the last biomass was fed to the furnace from integration of the CO2 concentration at the outlet until no CO2 was observed.
Different operating conditions were explored in order to gain detail information related to PM reduction in the combustion system. PM levels in exhaust gases are influenced by residence time, temperatures, and oxygen concentration inside the furnace [3]. Therefore, in the current work, the experimental design includes the following operating conditions:
- Gas residence time (furnace with and without baffles installed)
- Air preheating temperature (using LPG fueled air preheater)
- Different stoichiometric condition (by varying excess air level)
Additional operating conditions explored to assure the measurement sensitivity include:
- Biomass sizes
- Biomass distribution on top of the grate
In total, the current work includes experiments at eight different operating conditions, including different furnace design. Each experiment contains 5–10 biomass re-loadings and the measurement results are presented as the average of these re-loadings. The different experiments and corresponding operating conditions are summarized in Table 1 and Table 2.
3.3. Biomass Fuel
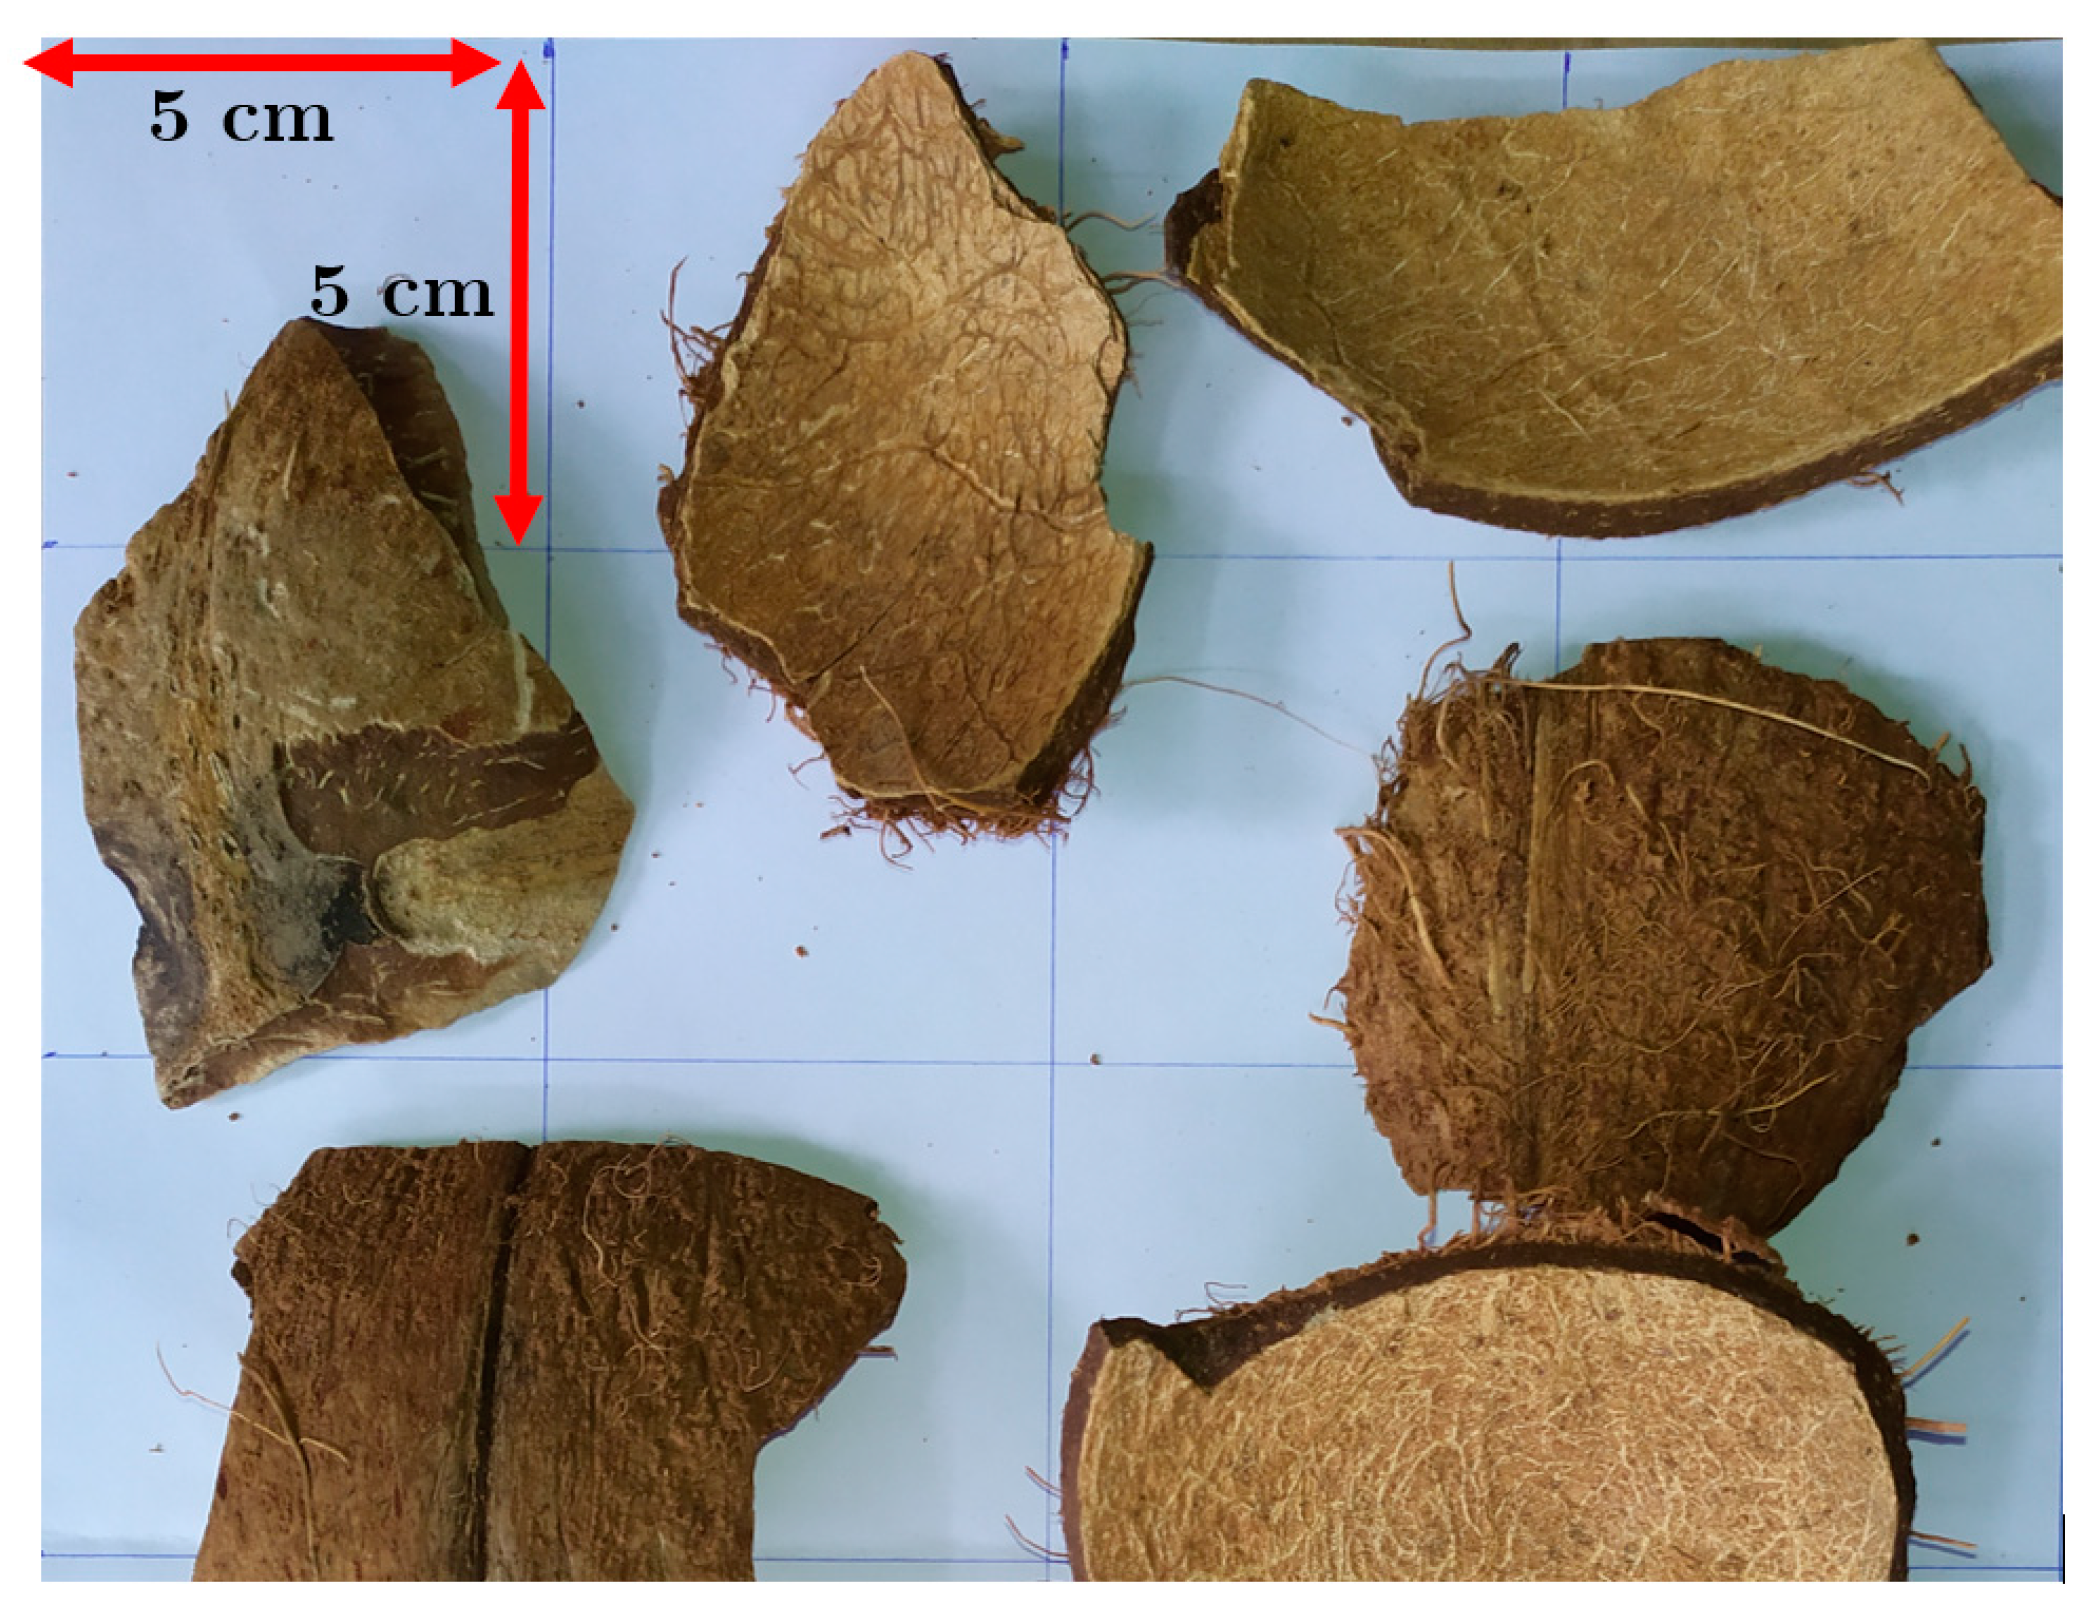
Coconut shell is used in the current study as shown in Figure 2. It is a waste product of the coconut fruit and represents around 20% of the total mass of a coconut. Indonesia is the world leader in coconut production with about 18 million tons produced in 2017 [43], which corresponds to approximately 3.6 million tons of coconut shell. Thereby, the coconut shell has high potential as renewable energy sources for power generation as an abundant resource with high energy content (16–18 MJ/kg). The low moisture and low ash content in the coconut shell is also beneficial in a combustion furnace. This residual biomass resource is a promising energy source, especially for rural households in the developing countries where they grow [44].
For experimental purposes, commercial dried 5 mm thick coconut shells (Yogyakarta, Indonesia) were crushed and flakes about 5 × 5 cm up to 10 × 10 cm size was selected. Proximate and ultimate analyses of the dried coconut shells are summarized in Table 3, which is consistent with results reported in the literature for the same biomass source [45,46,47,48].
3.4. Characterization Method
3.4.1. Gas Composition
The CO2 composition in the exhaust gas was recorded by a Kane 457 gas analyzer (Kane International Limited, Welwyn Garden City, UK). This infrared CO2 sensor provides 0.1%vol resolution, 20 s response time, and ±0.3%vol accuracy.
3.4.2. PM Concentration
The PM concentration is measured by SDS011 (Shandong Nova Fitness Co., Ltd., Jinan, China), which measures particles from 0.3 μm in size and gives concentrations of both PM2.5 and PM10. The working principle of SDS011 is based on optical light scattering when the particles flow through the sensor inlet and is channeled through a laser beam. Light is scattered and absorbed as the particles cross the beam and a photodetector mounted at the bottom of the sensor detects the reflected light. The sensor is designed with an integrated fan, supplying a gas flow rate of 0.5 L min–1 to the measurement area [49]. SDS011 can measure PM concentrations up to 999.9 mg/m3 for PM2.5 and 1999.9 for PM10 at working temperature and humidity up to 50 °C and 70%, respectively. The sensor has a maximum relative error of measurements up to ±15% [50].
Gravimetric analysis was also conducted in order to confirm the PM sensor measurement. Particulate respirator filter 8210, N95 160 EA/Case, from (3M, St. Paul, MI, USA) was utilized to capture the PM particles. This filter captures 95% of all particles with size larger than 0.3 μm [51,52]. The filter mounted on its adaptor was placed in the PM trapping system during the sampling period. Subsequently, the moisture content in the filter was removed by drying the filter at 90 °C in an oven. 5 h drying in the oven was confirmed to be sufficient time to dry the filter completely. The filter mass before sampling and after filter drying were recorded to determine the total amount of deposited PM during the sampling period.
Furthermore, the PM deposited on the filter was analyzed by SEM using a FEI Quanta 650 Scanning Electron Microscopy (SEM) (Thermo Fisher Scientific, Waltham, MA, USA) [53]. The very small particles burn very fast and SEM analysis was conducted to confirm that the particle sizes are in the range of the PM sensor measurement i.e., 0.3 μm to 10 μm.
3.4.3. Temperature Measurement Using the Two-Thermocouple Method
Measurement of the gas temperature in a combustion furnace using thermocouples may significantly differ from the real gas temperature for several reasons. The temperature of a regular thermocouple is influenced by the balance between convective heat transfer due to the flow and radiative heat transport from or to the surroundings, including the furnace walls [54]. This problem can be diminished if the surrounding wall temperature reaches the same temperature as the gas phase, which is quite hard to achieve in a furnace.
In order to ensure accurate measurements of the gas temperature, the two-thermocouple method was used [54]. Thereby the gas temperature is obtained using two-thermocouple with the same material but different bead sizes. Based on the difference between measurements from the two-thermocouple, accurate gas temperature can be determined. The gas temperature is calculated using Equation (2), which originates from the steady state energy balance equation on the thermocouple for smaller and larger thermocouples as shown in Equation (1). Here, corresponds to the large diameter thermocouple and denotes the smaller thermocouple. In the current work, the large and small thermocouples have 5 mm and 0.8 mm diameters, respectively.
4. Simulation Methodology
4.1. Global Mass Balance Analysis
Mass balance calculation was formulated based on the reaction steps (R.1–R.3) and the ultimate and proximate analyses in Table 3. These reactions include biomass thermal decomposition, vaporization of bound water (7.6%), formation of volatile matter (72.4%), and solid char (19.4%) in R.1, burning of volatile gas in R.2 and char burning in R.3. The chemical formula of biomass was determined from the ultimate analysis of the biomass shown in Table 3. The mass balance analysis provides information related to the air leakage into/out from the furnace.
The volatile gas is expected to be completely combusted in the system due to the very high temperature present in the system, i.e., more than 1200 °C, and lean condition i.e., 80 to 90% excess air. At this high temperature, the volatiles present in the combustion chamber are allowed to be completely oxidized [55]. Therefore, the proposed global gas combustion in R.2. is expected to be sufficient to predict the local temperature and oxygen concentration distribution inside the furnace, required for the analysis of the PM reduction kinetics.
4.2. CFD Simulations
A CFD analysis was performed in order to estimate key combustion parameters which are difficult to measure accurately using the experimental facilities i.e., particle and gas residence time distributions (RTD) and the particle temperature distribution in the furnace. ANSYS 2020 R1 was utilized to build the geometry and generate the computational mesh. The CFD simulation was conducted using ANSYS Fluent.
In the current analysis, a two-dimensional CFD model with adjustment for additional cooling at the removed walls in the third dimension was proven to be sufficient, which is expected since the grate has a high aspect ratio. Experimental results also confirmed insignificant gradients of temperature and species concentration in the third dimension. The geometry construction relies on normalization of the chimney and orifice dimensions to give correct gas velocities and pressure drop in the 2D planar model. Biomass flakes were distributed above the layer of char and unreacted biomass; these were defined as 5 cm pieces, with a 2 cm distance between each piece. Char, which burn much slower, is accumulated from several previous loadings, and is defined as a layer below the biomass that is devolatilizing. The thickness of the char layer was calculated from the experiments based on CO2 formation after the last loading i.e., the total char accumulated and thereby present during steady phase combustion.
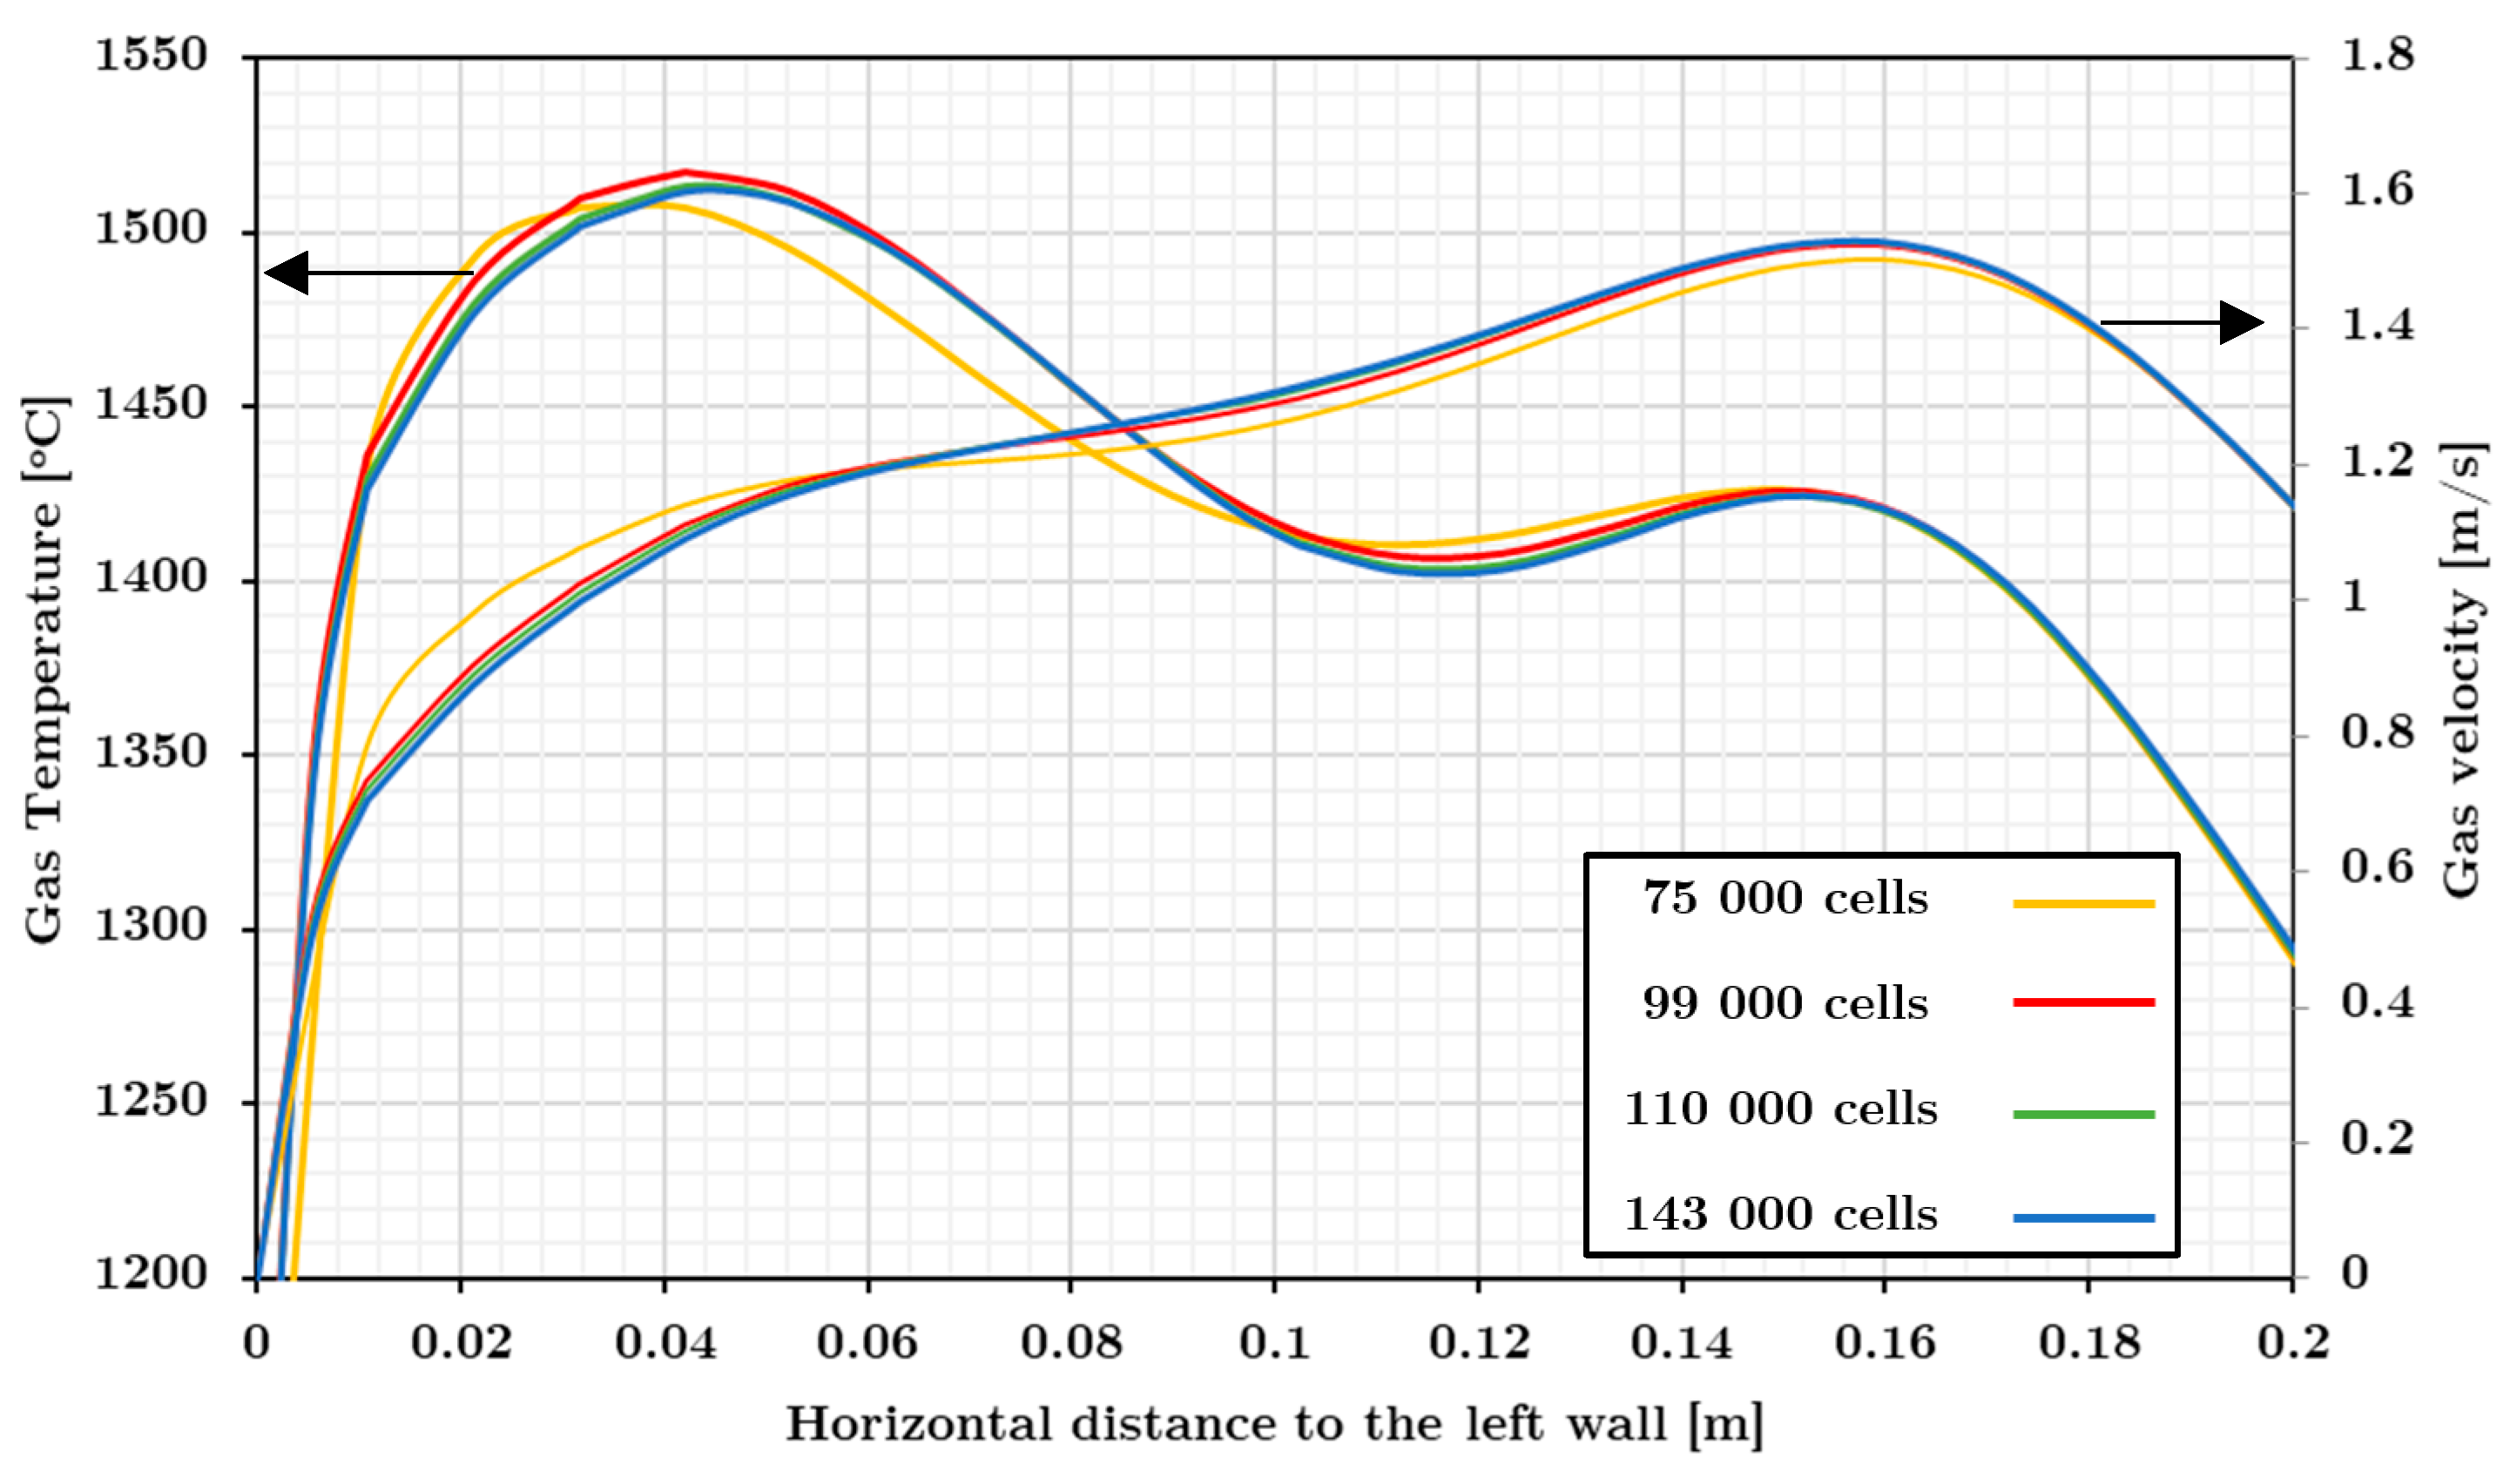
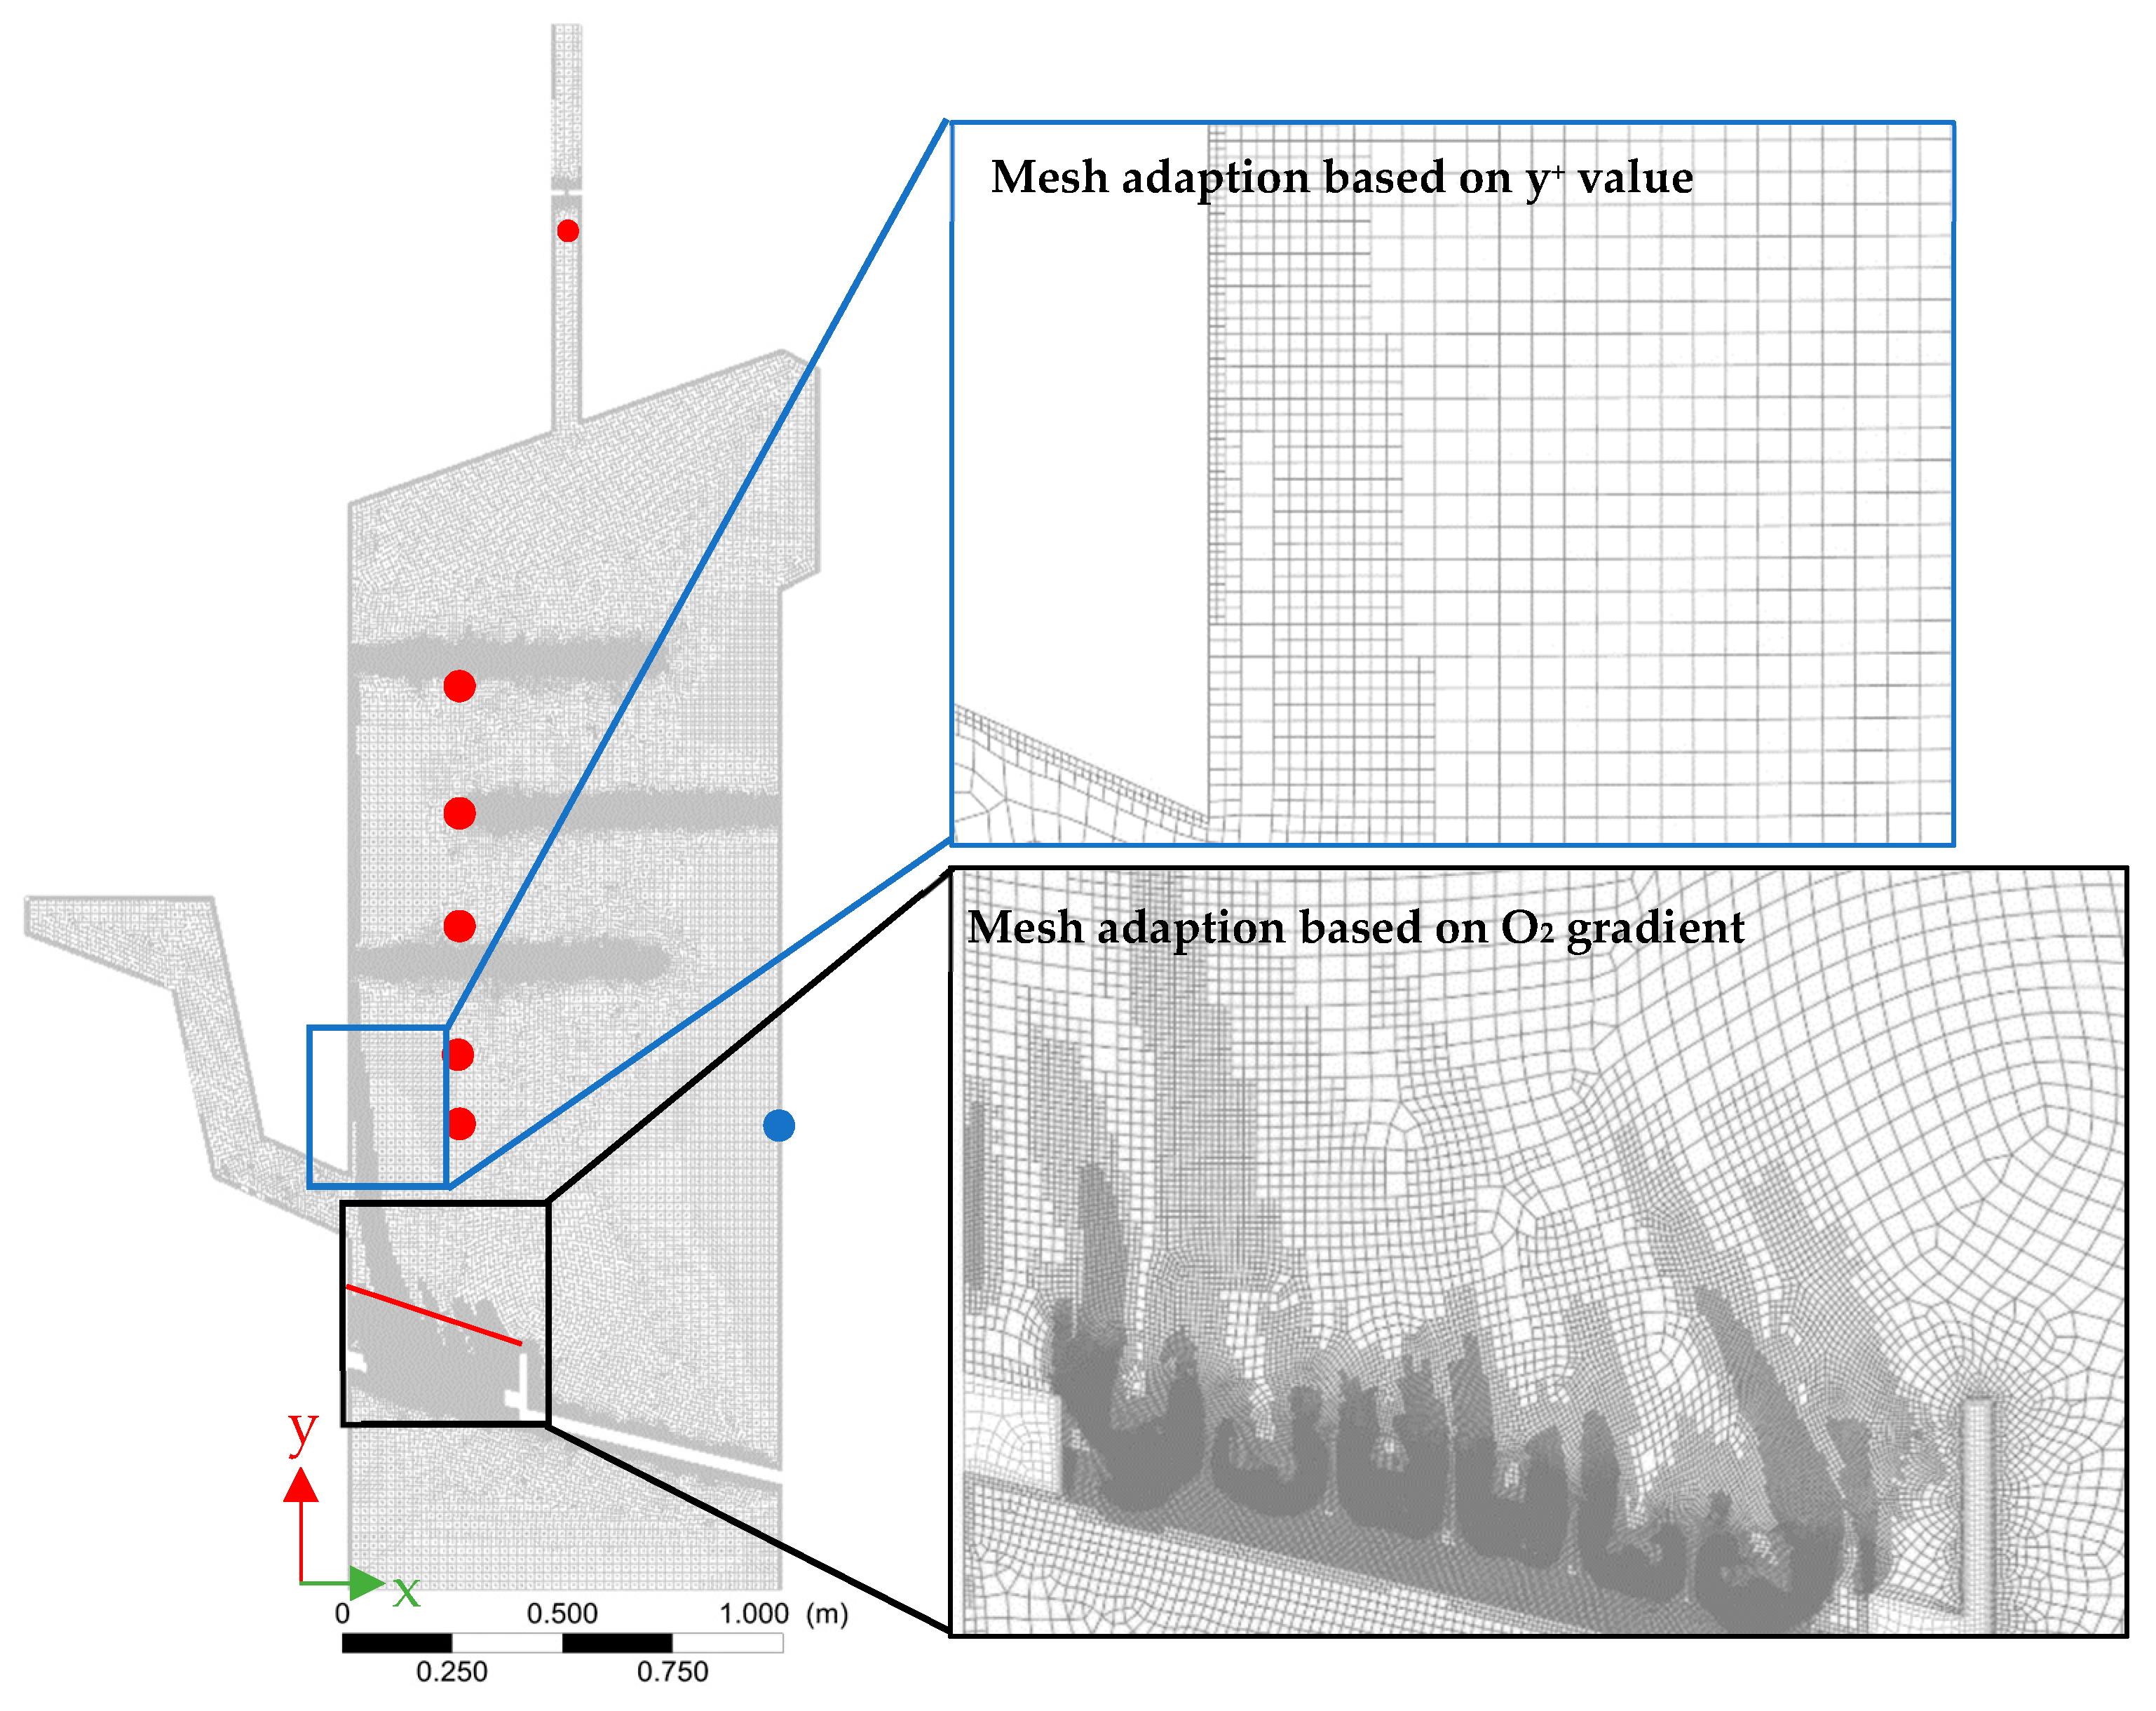
The computational domain was initially discretized into 75,000 computational cells. Subsequently, mesh refinement was conducted in regions with large oxygen gradients and in regions with large y+ values to accurately resolve the flow field, gas mixing, and gas combustion. Mesh independence study was conducted to ensure that the mesh resolution did not affect the simulation results. The final mesh fulfills mesh independence with respect to insignificant change of temperature and velocity profiles, as depicted in Figure 3. The final meshed domain contained 143,000 cells and is depicted in Figure 4. This final mesh provided a wall y+ average value around 2.5 at the furnace freeboard.
4.2.1. Simulation of Combustion in the Furnace
Steady state simulation was performed to predict the biomass combustion in the furnace by solving the continuity, momentum, turbulence, energy, and species balance equations. Several parameters from the simulation were validated against the average experimental value, i.e., CO2 concentration and temperature, to ensure the simulation accuracy. The governing equations were discretized using second-order accurate schemes, and the pressure-velocity coupling was handled using the SIMPLE algorithm [56]. Transition SST model was utilized in combination with the eddy dissipation concept (EDC) model for the volumetric volatile gas reaction (R.2), which has been proven to produce reasonable prediction of gas emission and temperature profile in biomass combustion for the fixed bed furnace [57,58]. The discrete ordinates (DO) radiation method is used to solve the radiative transfer equation (RTE) numerically and a transport equation is solved for the radiation intensity in the spatial coordinates. Here, the radiation absorption coefficient for the gas is calculated using the weighted-sum-of-gray-gases (WSGG) model, which considers the optical length and the composition of grey gases [34,59].
In the simulations, biomass, char, and grate were defined as porous bodies. Inertial and viscous resistance in the grate were defined by Ergun equation in order to introduce pressure drop for the incoming flow. Grate porosity was set to 0.25 as observed in the experimental facility. Volatile matter together with bound and free water vapor are released from biomass layer. The effective diffusivity of gas in the biomass layer was set to be very small using user defined function (UDF), and a high flow resistance was set in order to hinder air penetration into it. Heat of combustion includes energy source in char bed and the exothermic heat of reaction due to burning the volatile gas, calculated using EDC-model, in the gas bulk as local source. Char combustion was modelled using a sink term for the O2 species and source term for the CO2 species and energy.
Boundary conditions for the primary air flow were defined based on the volumetric flow and turbulence length scale and turbulence intensity based on the conditions of the flow in the cylindrical pipe of the air inlet. Following best practices in CFD analysis, the turbulent length scale is specified as 7% of the hydraulic diameter and the turbulent intensity is calculated from the Reynolds number at the inlet, i.e., [56]. Steel wall boundary condition was defined to allow heat loss to the environment by conduction through 5 mm steel wall and 20 cm insulation, and a heat sink to account for a small increase in wall temperature based on experimental observation. Heat is transferred by free convection to the environment at the outer side of the furnace walls and the heat transfer coefficients were compensated to account for the walls in the third dimension as described previously. The emissivity of the inner walls equals unity since the walls are black due to rust, soot, and ash that stick in the walls. The CFD simulations were validated with the temperature distribution inside the furnace by specifying temperature probes at the same positions as in the experiments, as depicted in Figure 4.
4.2.2. Discrete Particle Model (DPM) Model
Particulate matter in the furnace were simulated using Lagrangian time resolved particle tracking including the particle radiation and convection heat transfer models along with the Discrete Random Walk (DRW) model to account for the dispersive transport of particles due to turbulence using the Discrete Particle Model (DPM). Particle surface reaction is excluded from the DPM simulations due to the large particle surface area per volume and the particle residence time.
Inert particles, with 1 μm diameter size, were introduced to the system from a surface 10 cm above the biomass layer, as depicted in Figure 4 as a solid red line. Particles are injected equidistantly along the injection surface. The particle injection surface is in the flame area where PM on the average were generated. This allows the particle time history to the outlet to be analyzed. Particle history data (residence time distribution and temperature) from DPM simulation for different combustion conditions is utilized further in the PM reduction kinetic study.
4.3. PM Reduction Kinetics
The kinetic study of PM reduction in the furnace is conducted based on DPM simulation results and PM measurements from the experiments. The particle history data from the DPM simulation, which consists of particle time, temperature, and coordinates are recorded and utilized to calculate the PM concentration in the furnace and determine the reaction kinetics of PM. In order to ensure stability and accuracy of kinetic study, 3000 particles were injected in the DPM simulation. Based on the particle history data from the DPM simulation, particles that reached a certain measurement position can be traced and detected. All particles that reached the respective measurement positions are used in the kinetic study. The governing equation that is used in the present kinetic study is presented in Equations (3) and (4).
The PM reduction rate is controlled by the remaining mass of PM, the local oxygen concentration, and the particle temperature, as shown in Equation (3). The pre-exponential factor i.e., the rate constant at the reference temperature, and the activation energy ) in the centered Arrhenius kinetic form in Equation (4) were determined using non-linear regression analysis. in Equation (4) is selected to be close to the mean particle temperature i.e., 900 °C. A variance stabilized transformation of the sum of squares error (SSE) is utilized in the regression analysis by considering the uniform distribution of the relative error in experimental data. The variance stabilized SSE presented in Equation (5) includes both calculated and measured PM concentrations at the all sampling locations in the experiment i.e., 100 cm, 145 cm for non-baffle system or 175 cm for baffle system, and 325 cm (at the chimney).
5. Results and Discussions
5.1. Measurement Accuracy and Simulation Validation
5.1.1. PM Morphology
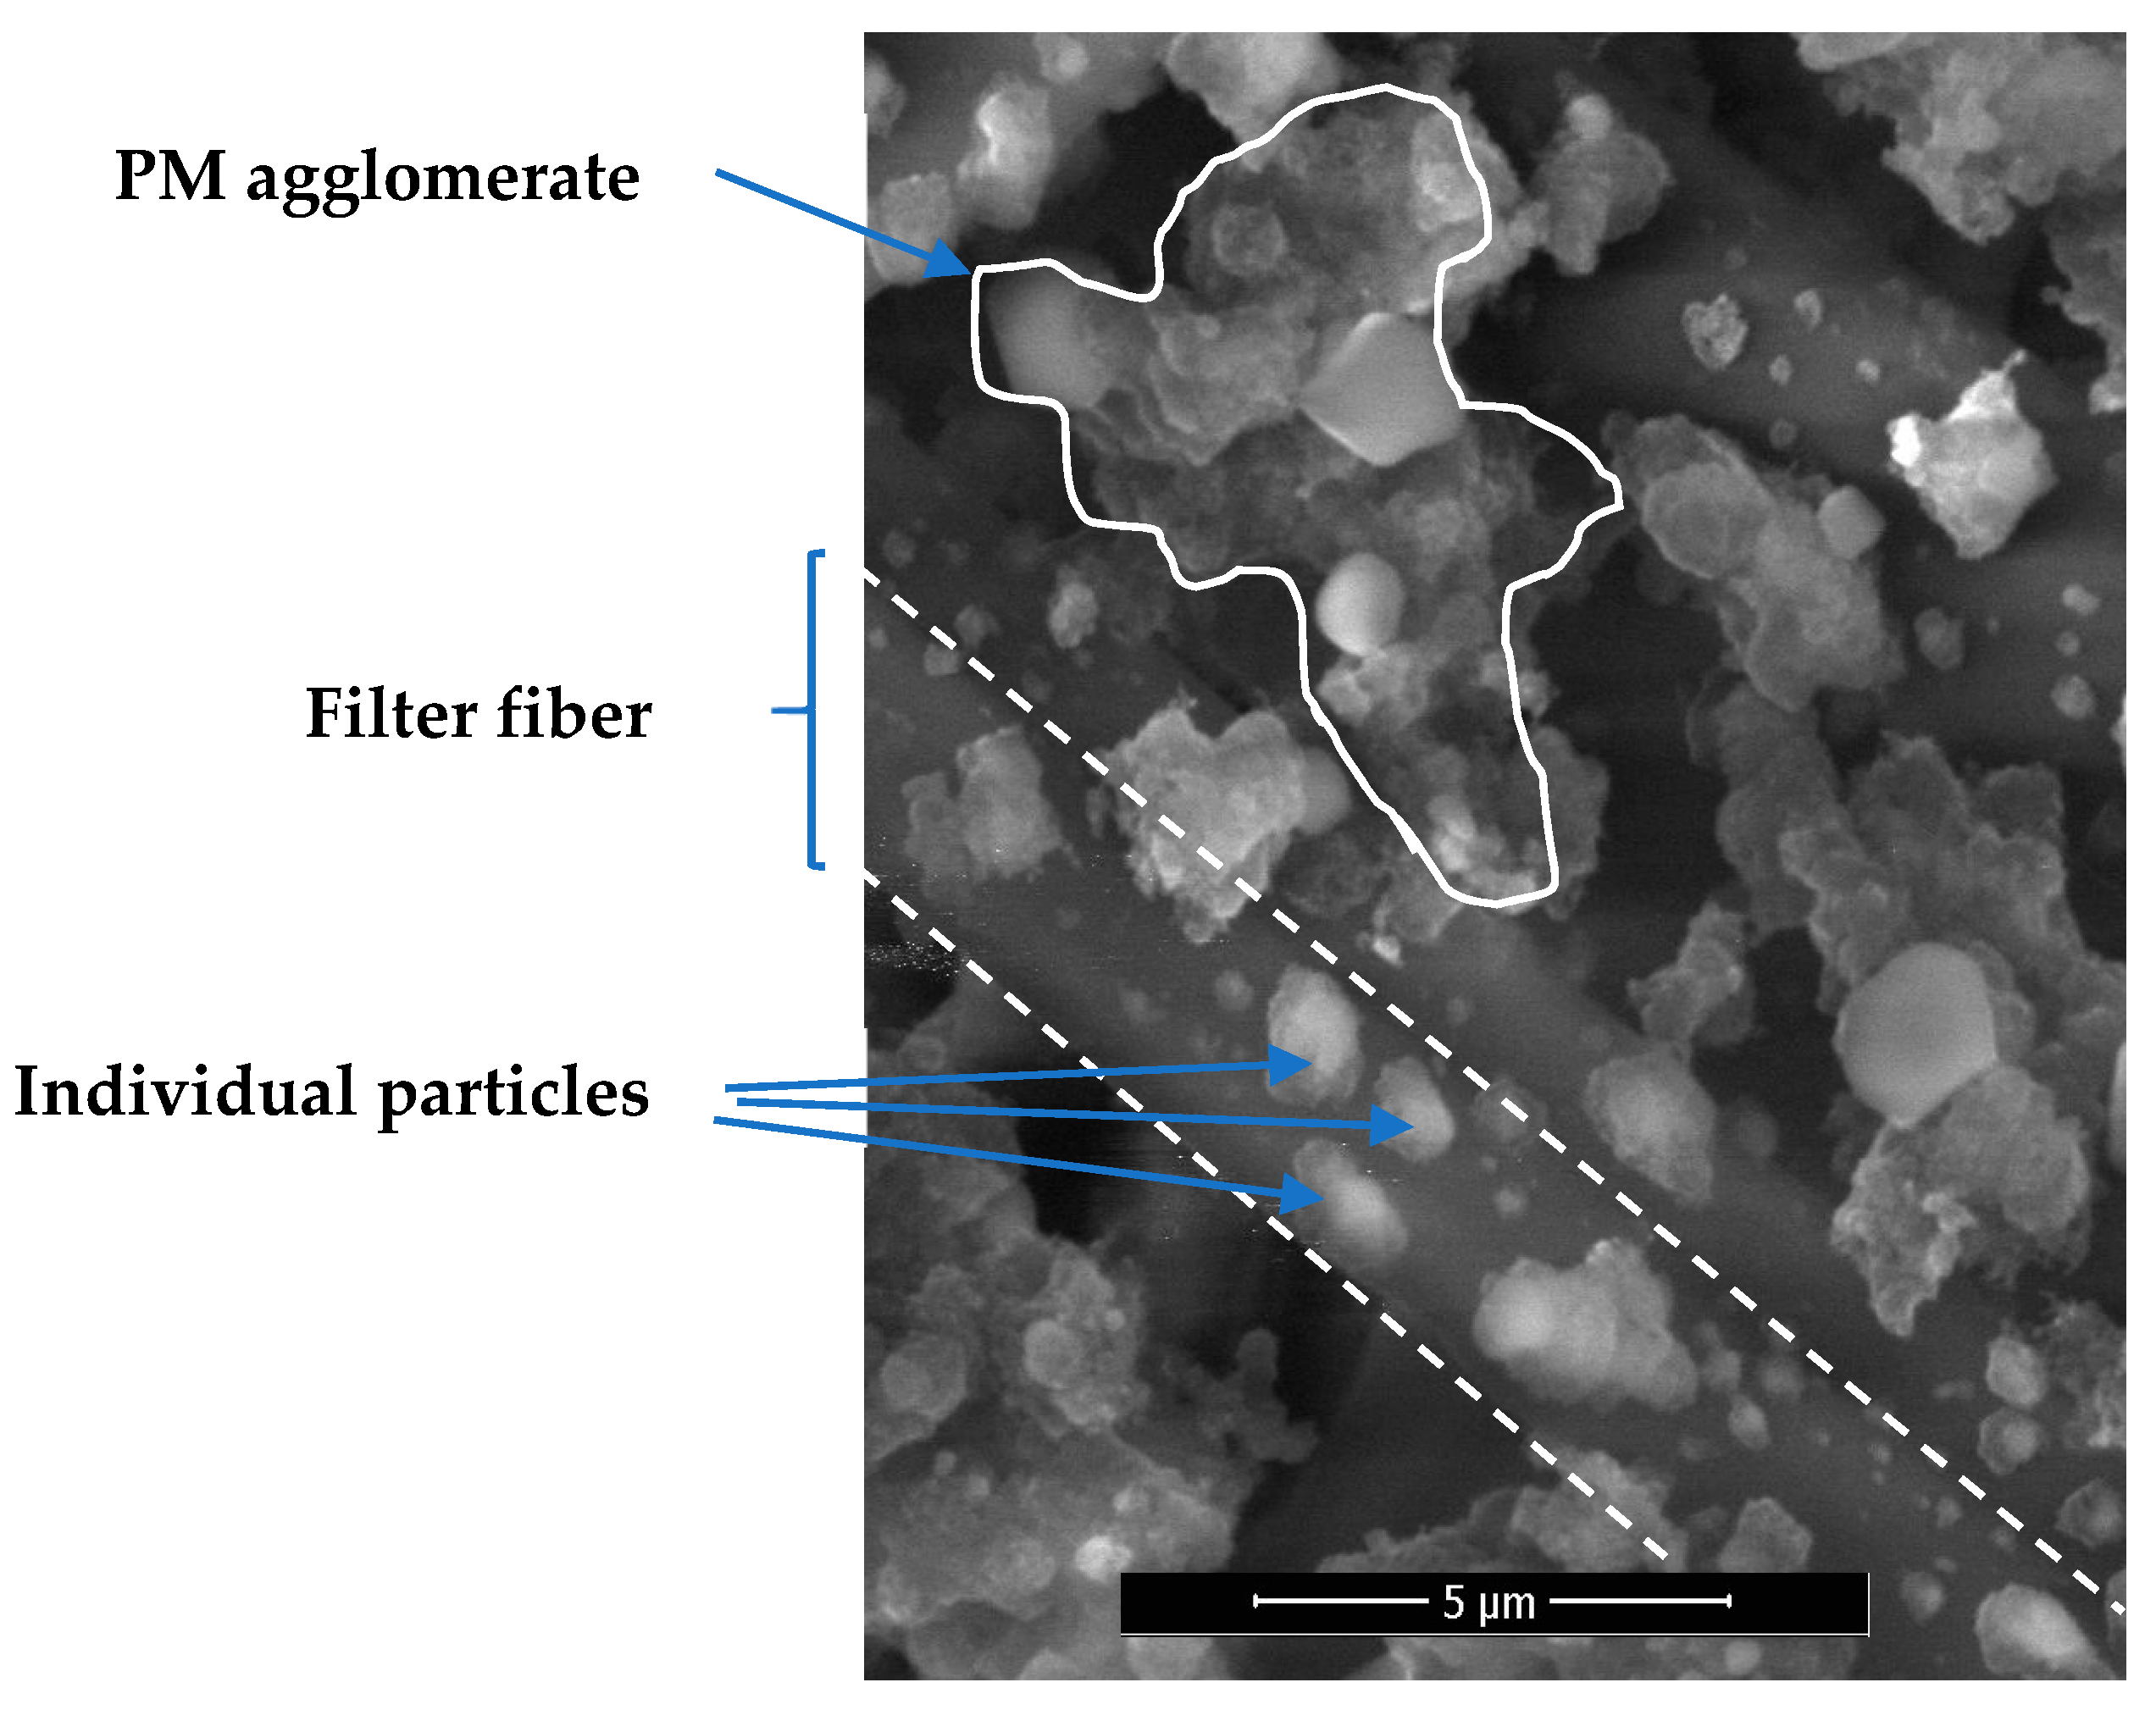
Typical SEM result of PM collected on the fibrous filter is depicted in Figure 5. The SEM analysis result shows both individual particles and particle agglomerates present on the filter. Depending on the sampling time, PM accumulated on the filter may appear as agglomerates and after sufficiently long time even a PM cake can be formed on top of the filter. In the SEM analysis (Figure 5), several individual particles are identified attached to the filter fiber, which indicates the original form of PM in the system. These individual particles on the filter fiber are recorded to be averagely 1 µm in size; this confirms the working range of SDS011 PM sensor to measure PM concentration in the current combustion system.
The measurements from the PM sensor indicates that PM2.5, i.e., particle in the size range of 0.3 to 2.5 µm, represents about 80% of total measured concentration of PM10, i.e., size range of 0.3 to 10 µm. In order to include the contribution from all measured particles, the reported PM concentrations in the present study includes the size range 0.3 to 10 µm or PM10.
5.1.2. Accuracy of the PM Sensor
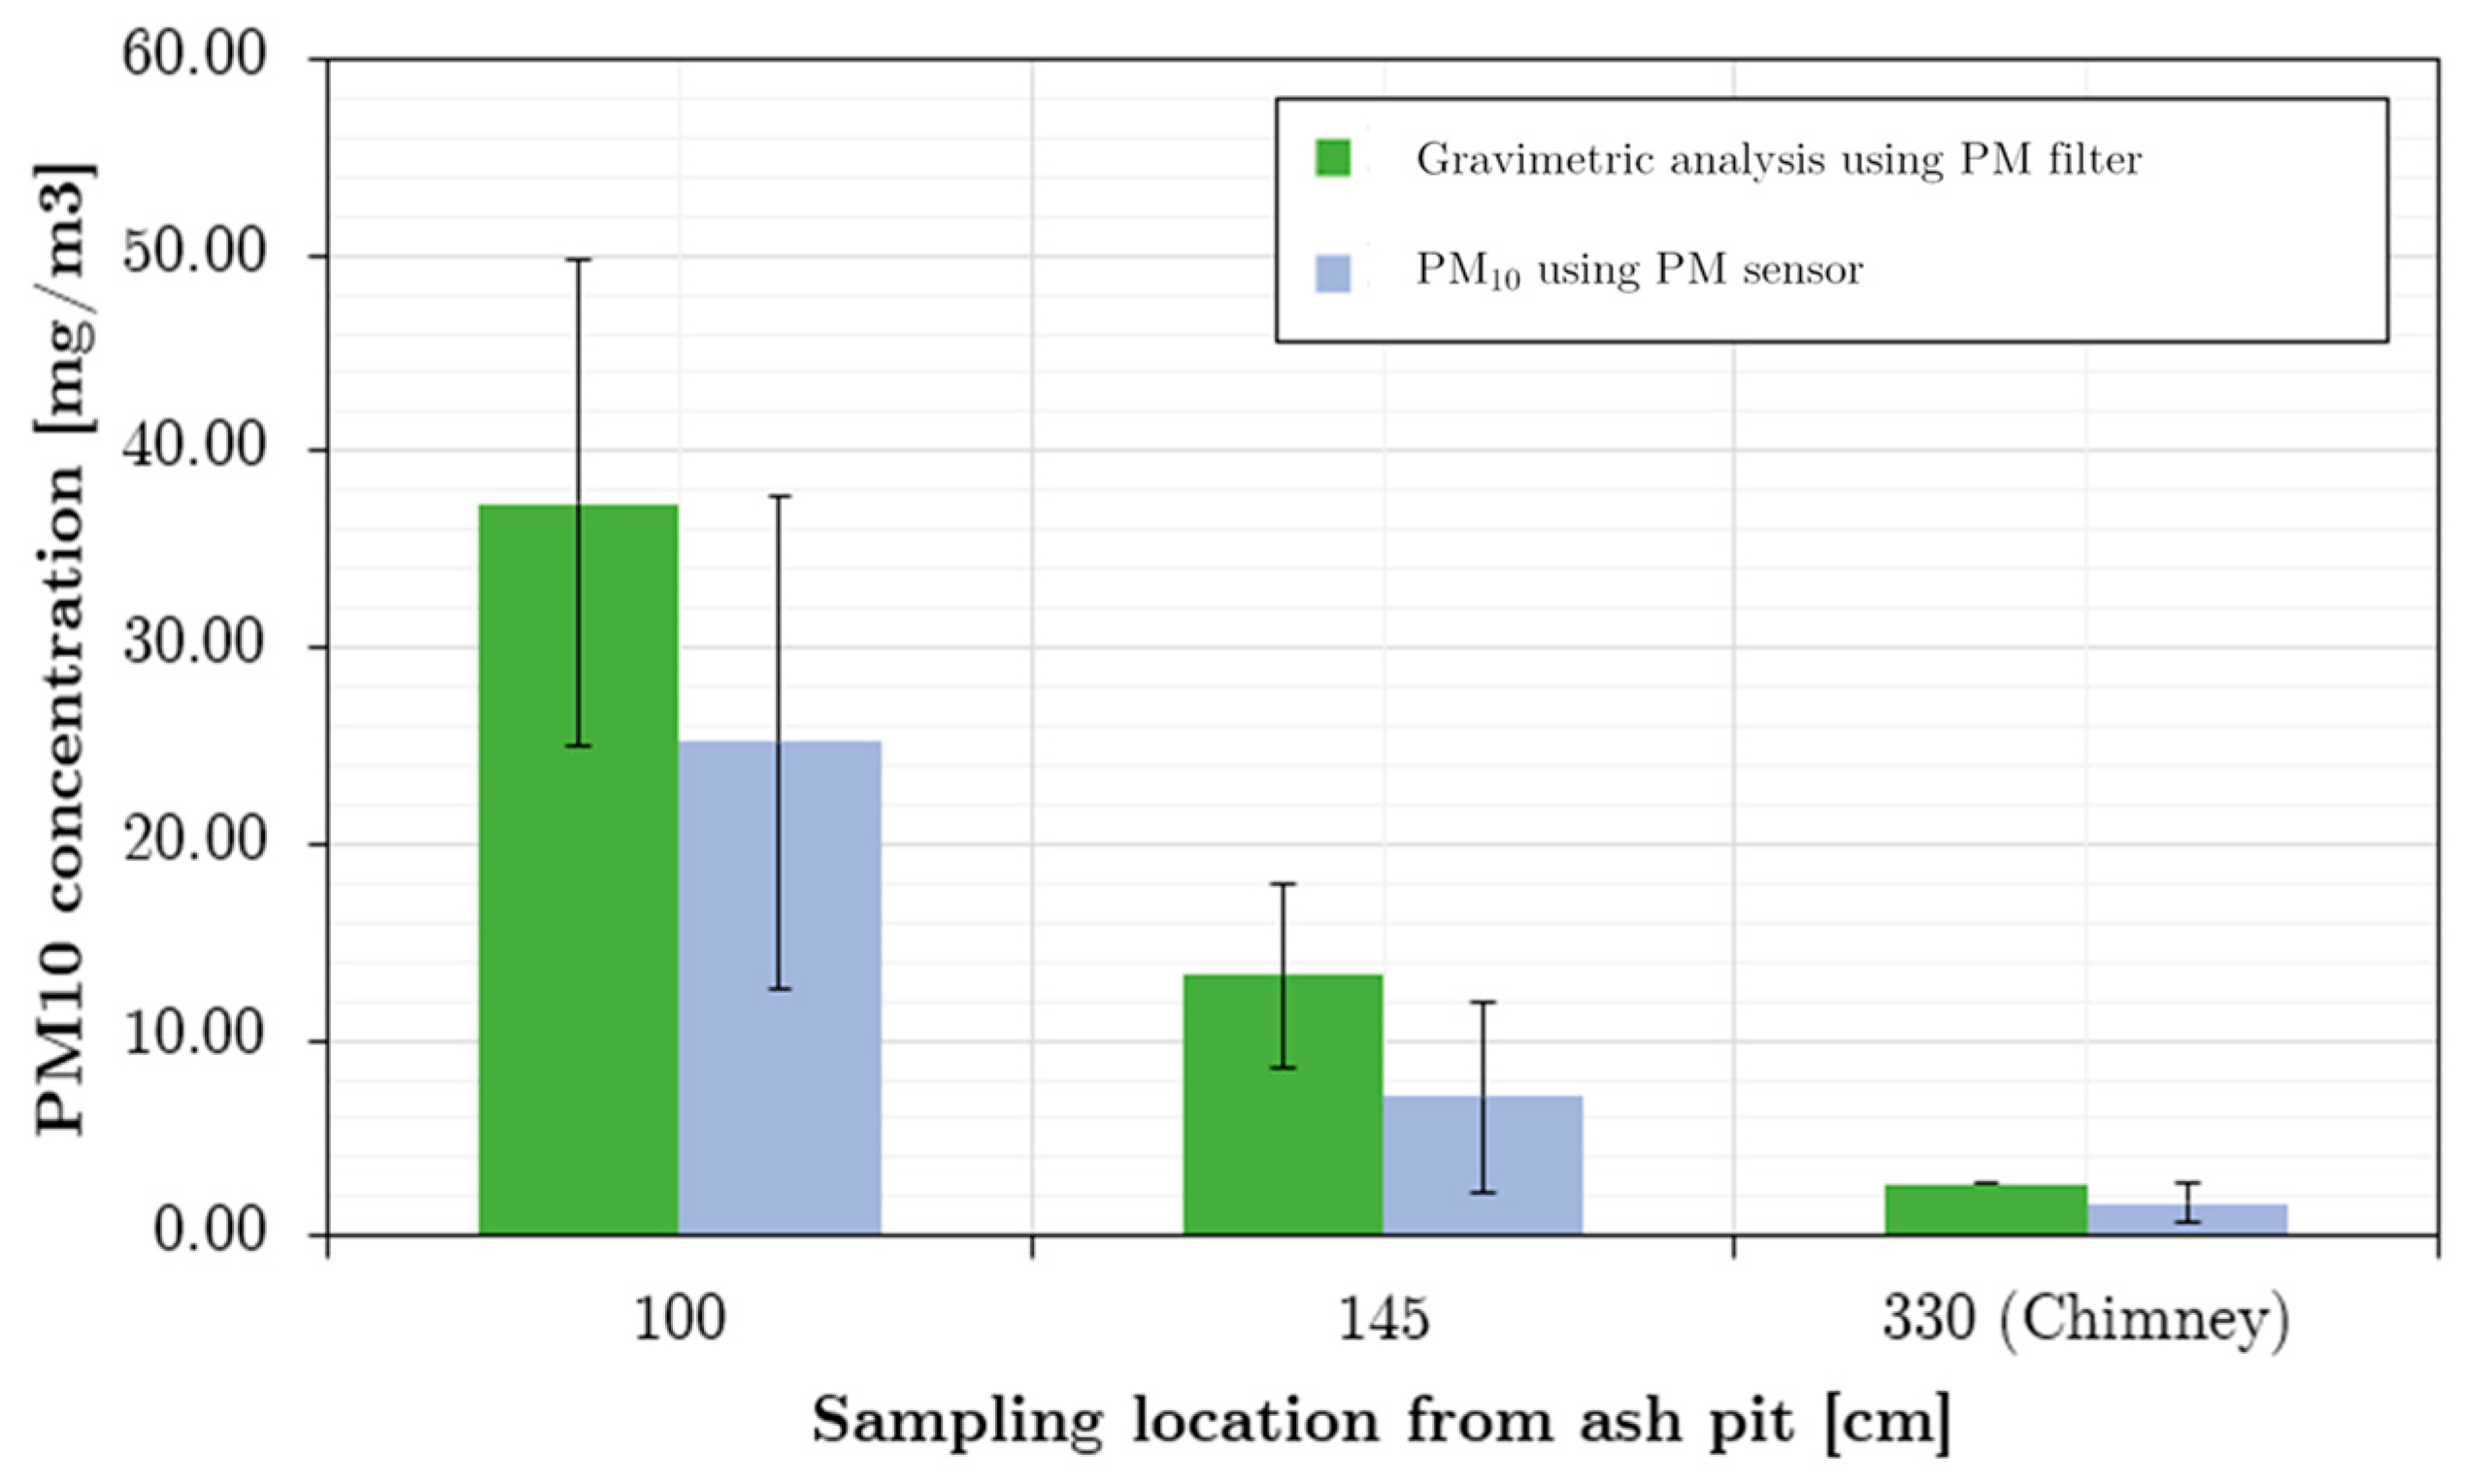
A filter-based PM trapping system was designed to assess the measurement accuracy of the SDS011 PM sensor. A comparison between both measurement methods is made for the combustion condition in experiment 1 (see Table 1), and the results are presented in Figure 6 for several sampling positions within the furnace. Results from the three sampling positions i.e., at 100 cm, 145 cm, and 325 cm (chimney) from ash pit, show that the PM sensor provides systematic somewhat lower values compared to the PM filter. The ratio between the PM filter measurement to the PM sensor measurement were 1.45, 1.88, and 1.55, respectively, for the three different sampling positions. These values are consistent with results reported by Schwarz et al. [49]. Schwarz and co-workers used a PM2.5 sharp cut cyclone combined with a glass fiber filter to collect the filtered PM for gravimetric analysis. They found that the gravimetric analysis measurement gives 1.56 times higher PM compared to measurement from the SDS011 PM sensor. Results from Schwarz and the present study both indicate that the PM sensor gives slightly lower PM concentrations. The main objective of the current work is to understand the evolution of PM concentration inside the furnace. Therefore, the PM measurements using online sensor, SDS011, and continuous sampling from the furnace is considered sufficiently accurate to be used in the current work.
Comparison with results from the system by Schwarz et al. [49] also indicates that the PM sampling system is reliable and there is no significant influence of rapid cooling in the sampling pipe to the final PM concentration. Moreover, this confirms that the volatile gas has been completely burnt at the first PM measurement location i.e., 100 cm (from ash pit) or about 50 cm above the bed. Otherwise, the volatile might condense and absorb in the PM filter, which could interfere with the measurement of the filter mass since the absorbed volatile needs temperature higher than 90 °C to be evaporated. Therefore, it is expected that from the first PM measurement location to the furnace outlet, the PM reduction dominates the PM concentration profile inside the furnace.
5.1.3. Sensitivity Analysis of PM Measurement
In the present work, a sensitivity analysis was conducted to analyze factors which could lead to differences in the PM measurements. The sensitivity study includes different experimental conditions, which are summarized in Table 2.
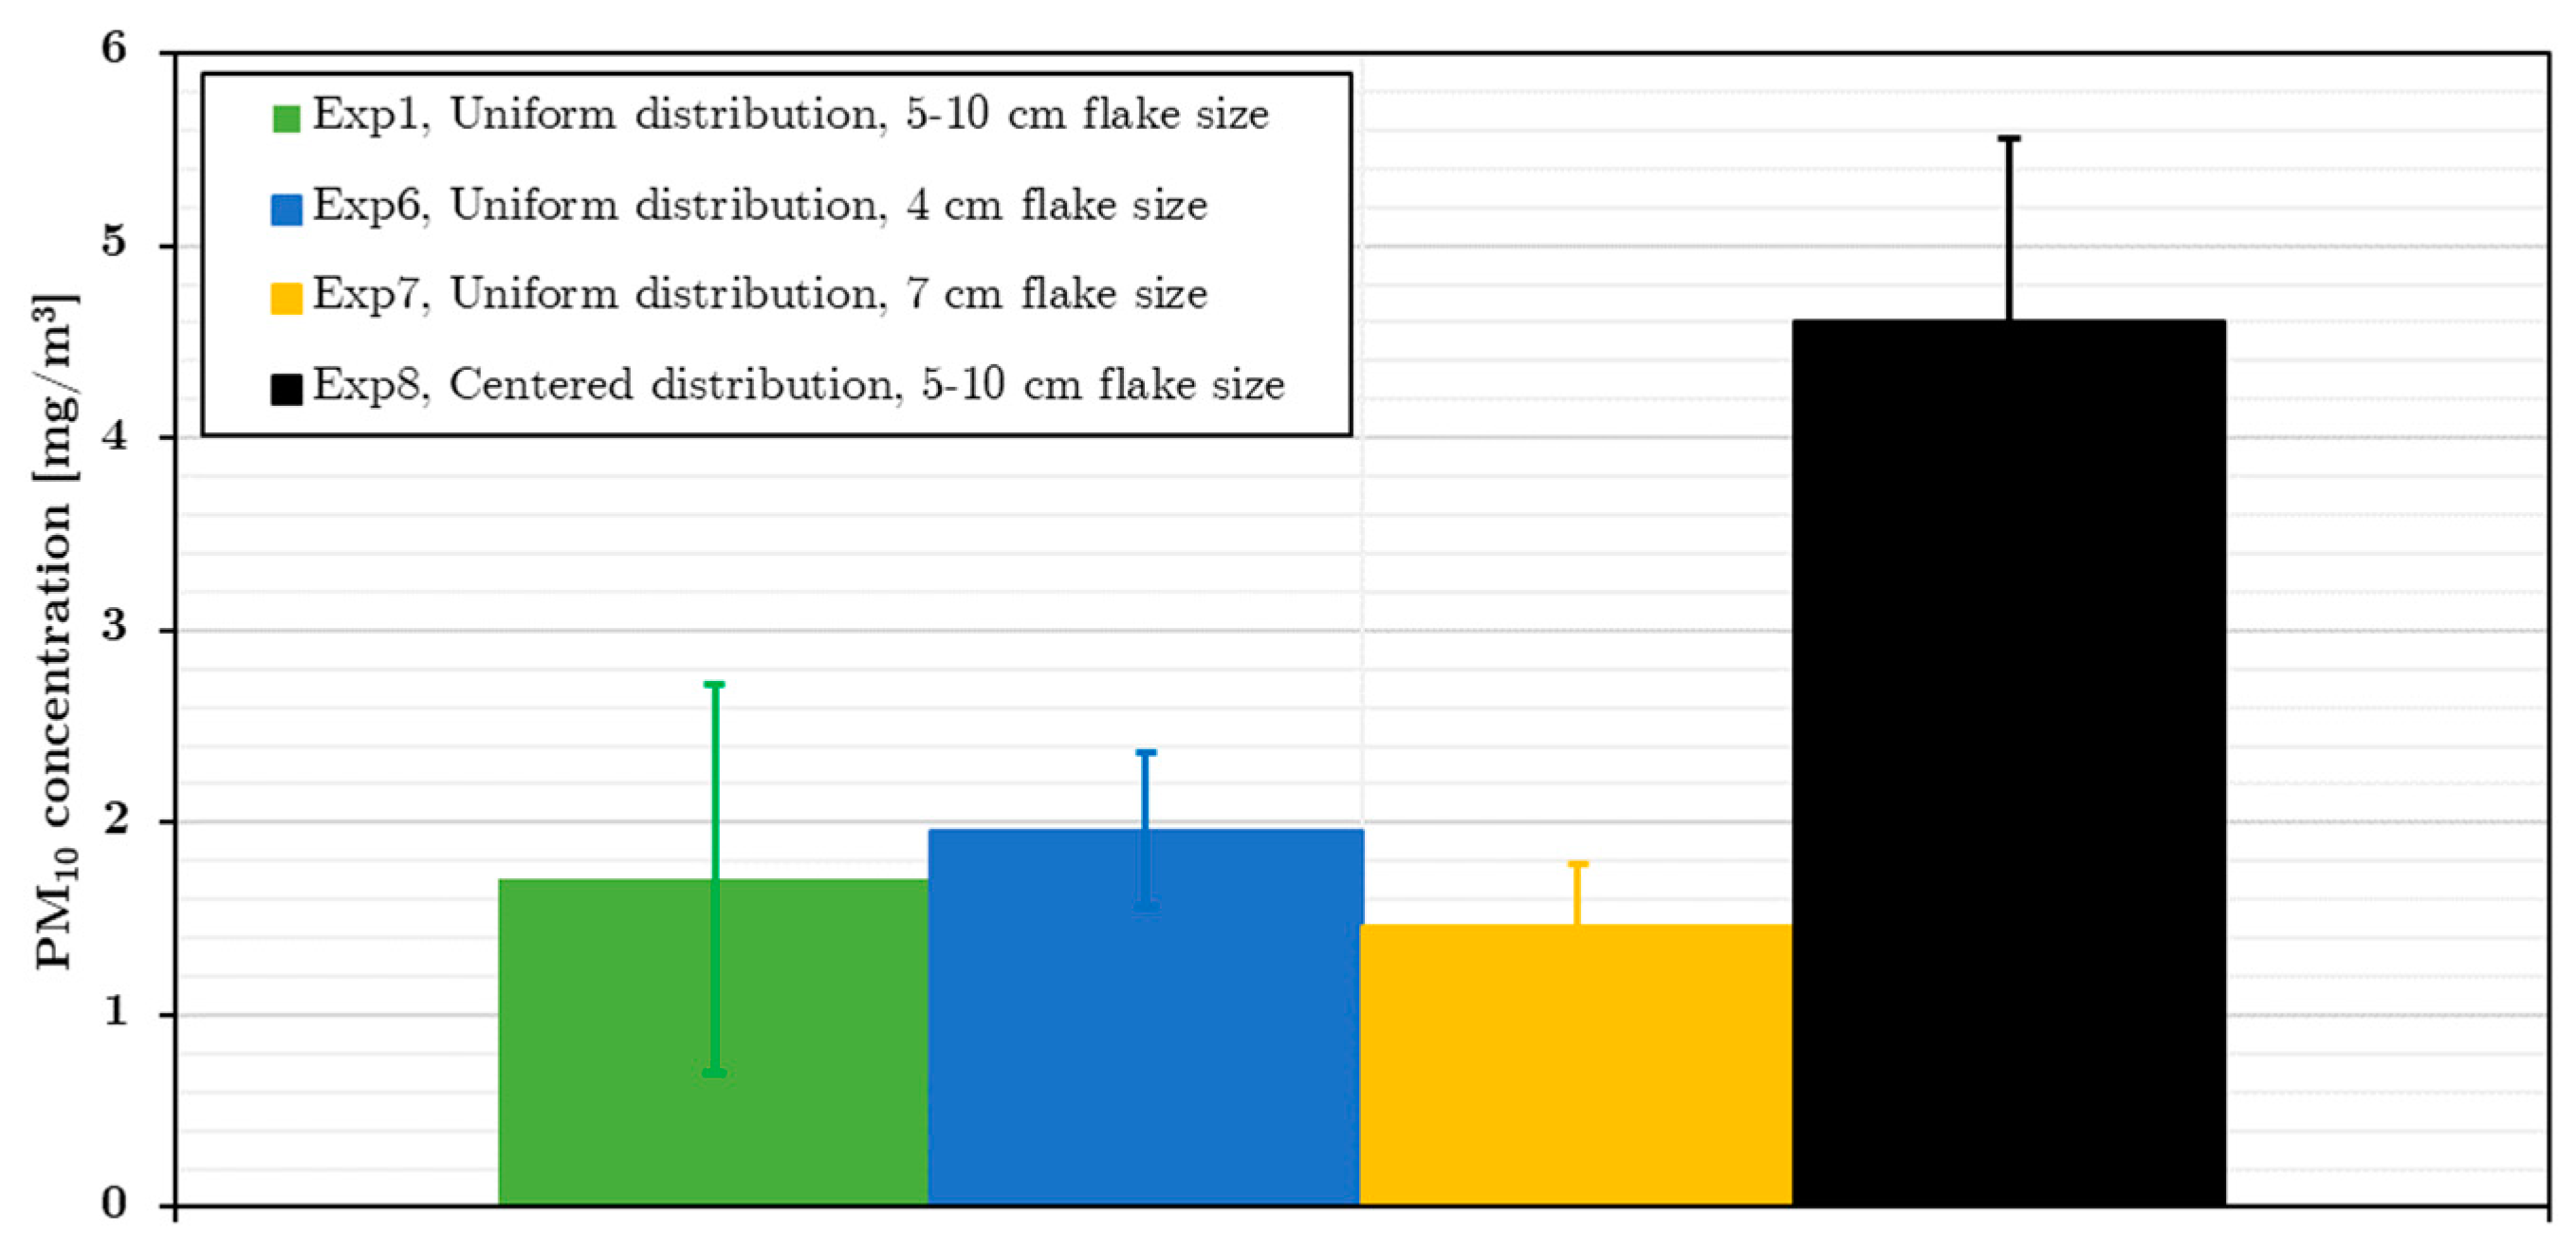
This includes experiments to understand the influence of different biomass size (Exp 6 and Exp 7) and the influence of the biomass distribution on the grate (Exp 8). The results from PM concentration measurements in the chimney for these experiments are presented in Figure 7.
In the case of centered biomass distribution (Exp8), poor mixing in between flue gas and air, and unfavorable air/fuel ratio in the centered pile of biomass is expected to cause higher PM concentration compared to the evenly distributed biomass system (Exp 1). Based on PM concentration measurement results, shown in Figure 7, it is clear that the PM10 concentration is highly sensitive to how the biomass particles are distributed above the grate. Based on these results, all the main experiments were conducted by distributing biomass as uniform as possible on the grate by ensuring even biomass distribution on the hopper lid. However, slightly different PM10 concentrations are still observed between one reloading to another. In order to minimize the random effect of the reloading variations, several measurement repetitions were conducted in the main experiment. Meanwhile, different biomass sizes are found to have no significant impact on the final PM10 concentration in the range of the explored conditions. Therefore, the system with distributed biomass flakes size, i.e., 5–10 cm, is used for all the main experiments.
5.1.4. Mass and Heat Balance Analysis
Mass balance analyses were conducted by comparing the measurement of air flowrate using pressure drop meter, the total mass of biomass inserted into combustion chamber, and the CO2 measurement from CO2 sensor at the chimney. Oxygen from the supplied air reacts with volatile gas and char from the biomass, as shown in the reaction scheme (R.2 and R.3). The total CO2 can thereby be calculated from total supplied biomass and air. The analysis shows that air leaking into the furnace should be accounted for to close the mass balance, which is accounted for the in the boundary condition for the air inlet in the CFD analysis.
Global heat balance analyses, including the inlet, the walls, and the chimney up to the restrictor (325 cm from the ash pit), were performed to validate the biomass heat of combustion and estimate the heat losses through the furnace walls. The results agree well for all experimental conditions using 2% heat loss through the insulated walls, the airflow rate given by the mass balance analysis, and using literature data for heat of combustion of 18 MJ/kg biomass. The measured outlet temperatures in the chimney are also consistent with the variations in experimental conditions i.e., preheating and air fuel ratio, as shown in Table 4.
5.1.5. Steady State CFD Analysis
CFD simulation of biomass combustion is required to quantify the properties that are difficult to obtain experimentally. For example, thermocouples cannot stand temperatures in the high temperature flame region, but the temperature distribution inside the entire furnace can easily be estimated using CFD. Additionally, CFD provides insight into the flow field inside the furnace, and it also provides information about the particle temperature and particle residence time distribution throughout the furnace.
Validation of the CFD simulation results includes both measurements of the temperature distribution inside the furnace and measurement of CO2 in the chimney. The temperature probes in the CFD analysis are defined at the same positions as in the experiments, which are depicted in Figure 4. A summary of the results is presented in Table 4. Here the measured gas temperature is corrected using the two-thermocouple method given by Equation (2), and the uncertainty in the experimental data is reported as the standard deviation in each measurement position.
In general, the measured and simulated temperatures and CO2 concentration in the exhaust gas agrees well for all the observations points. Comparison between the concentration of CO2 shows that the reaction schemes R1–R3 provides accurate prediction of CO2 concentration in the exhaust gas from the biomass combustion process, including the variations in the air/fuel ratio. With respect to temperature in the furnace, both chimney temperature and furnace wall temperatures agrees well for all the operating conditions. The CFD simulations also predict the correct temperature trends for the variations in air/fuel ratio, air pre-heating, and installation of baffles in the furnace. There are large temperature gradients in the lower part of the freeboard and the thermocouple readings depend on the position of the thermocouple in relation to the flame. CFD simulations show that 5 cm movement in the x and y-axis direction around the thermocouple position could change the temperature up to ±50 °C. However, measurements in the chimney are accurate due to small temperature gradients in this region. Similarly, the measurements of the wall temperature are considered accurate due to the thermal mass of the wall and also because the lateral heat conduction diminishes the influence of the exact flame position.
The weighted-sum-of-gray-gases (WSGG) model for radiative heat transfer may give errors close to walls. Johansson et al. [60] concluded that the error mainly occurs close to walls where there is a large temperature difference between the bulk gas and the solid surface. In the present work, all solid surfaces have temperature difference less than 200 °C from the average bulk temperature observed both from experiment and simulation CFD simulation data. This supports the accuracy of the wall temperature measurements. However, biomass was fed to the system at room temperature, i.e., about 30 °C, while the flame was recorded to have temperatures up to 1700 °C. Regions with fresh biomass is continuously heated by conduction from the hot char layer, by convection from heated primary air, and by radiation from above. In general, the error in the radiative heat flux in the current system is estimated to be below 10% except for heat transfer to the newly feed biomass during the first few seconds.
Validation of the CFD simulations was performed by comparing the temperature measurement from the thermocouples in the furnace with the calculated value and from total heat balance. Overall, the validation of the CFD simulations give confidence that further analysis can be made using the CFD data i.e., the distribution of gas temperature, particle temperature, and particle residence time distribution in the furnace, required to determine the PM reduction kinetics.
5.2. Analysis of Experiment Results
5.2.1. Influence of Residence Time
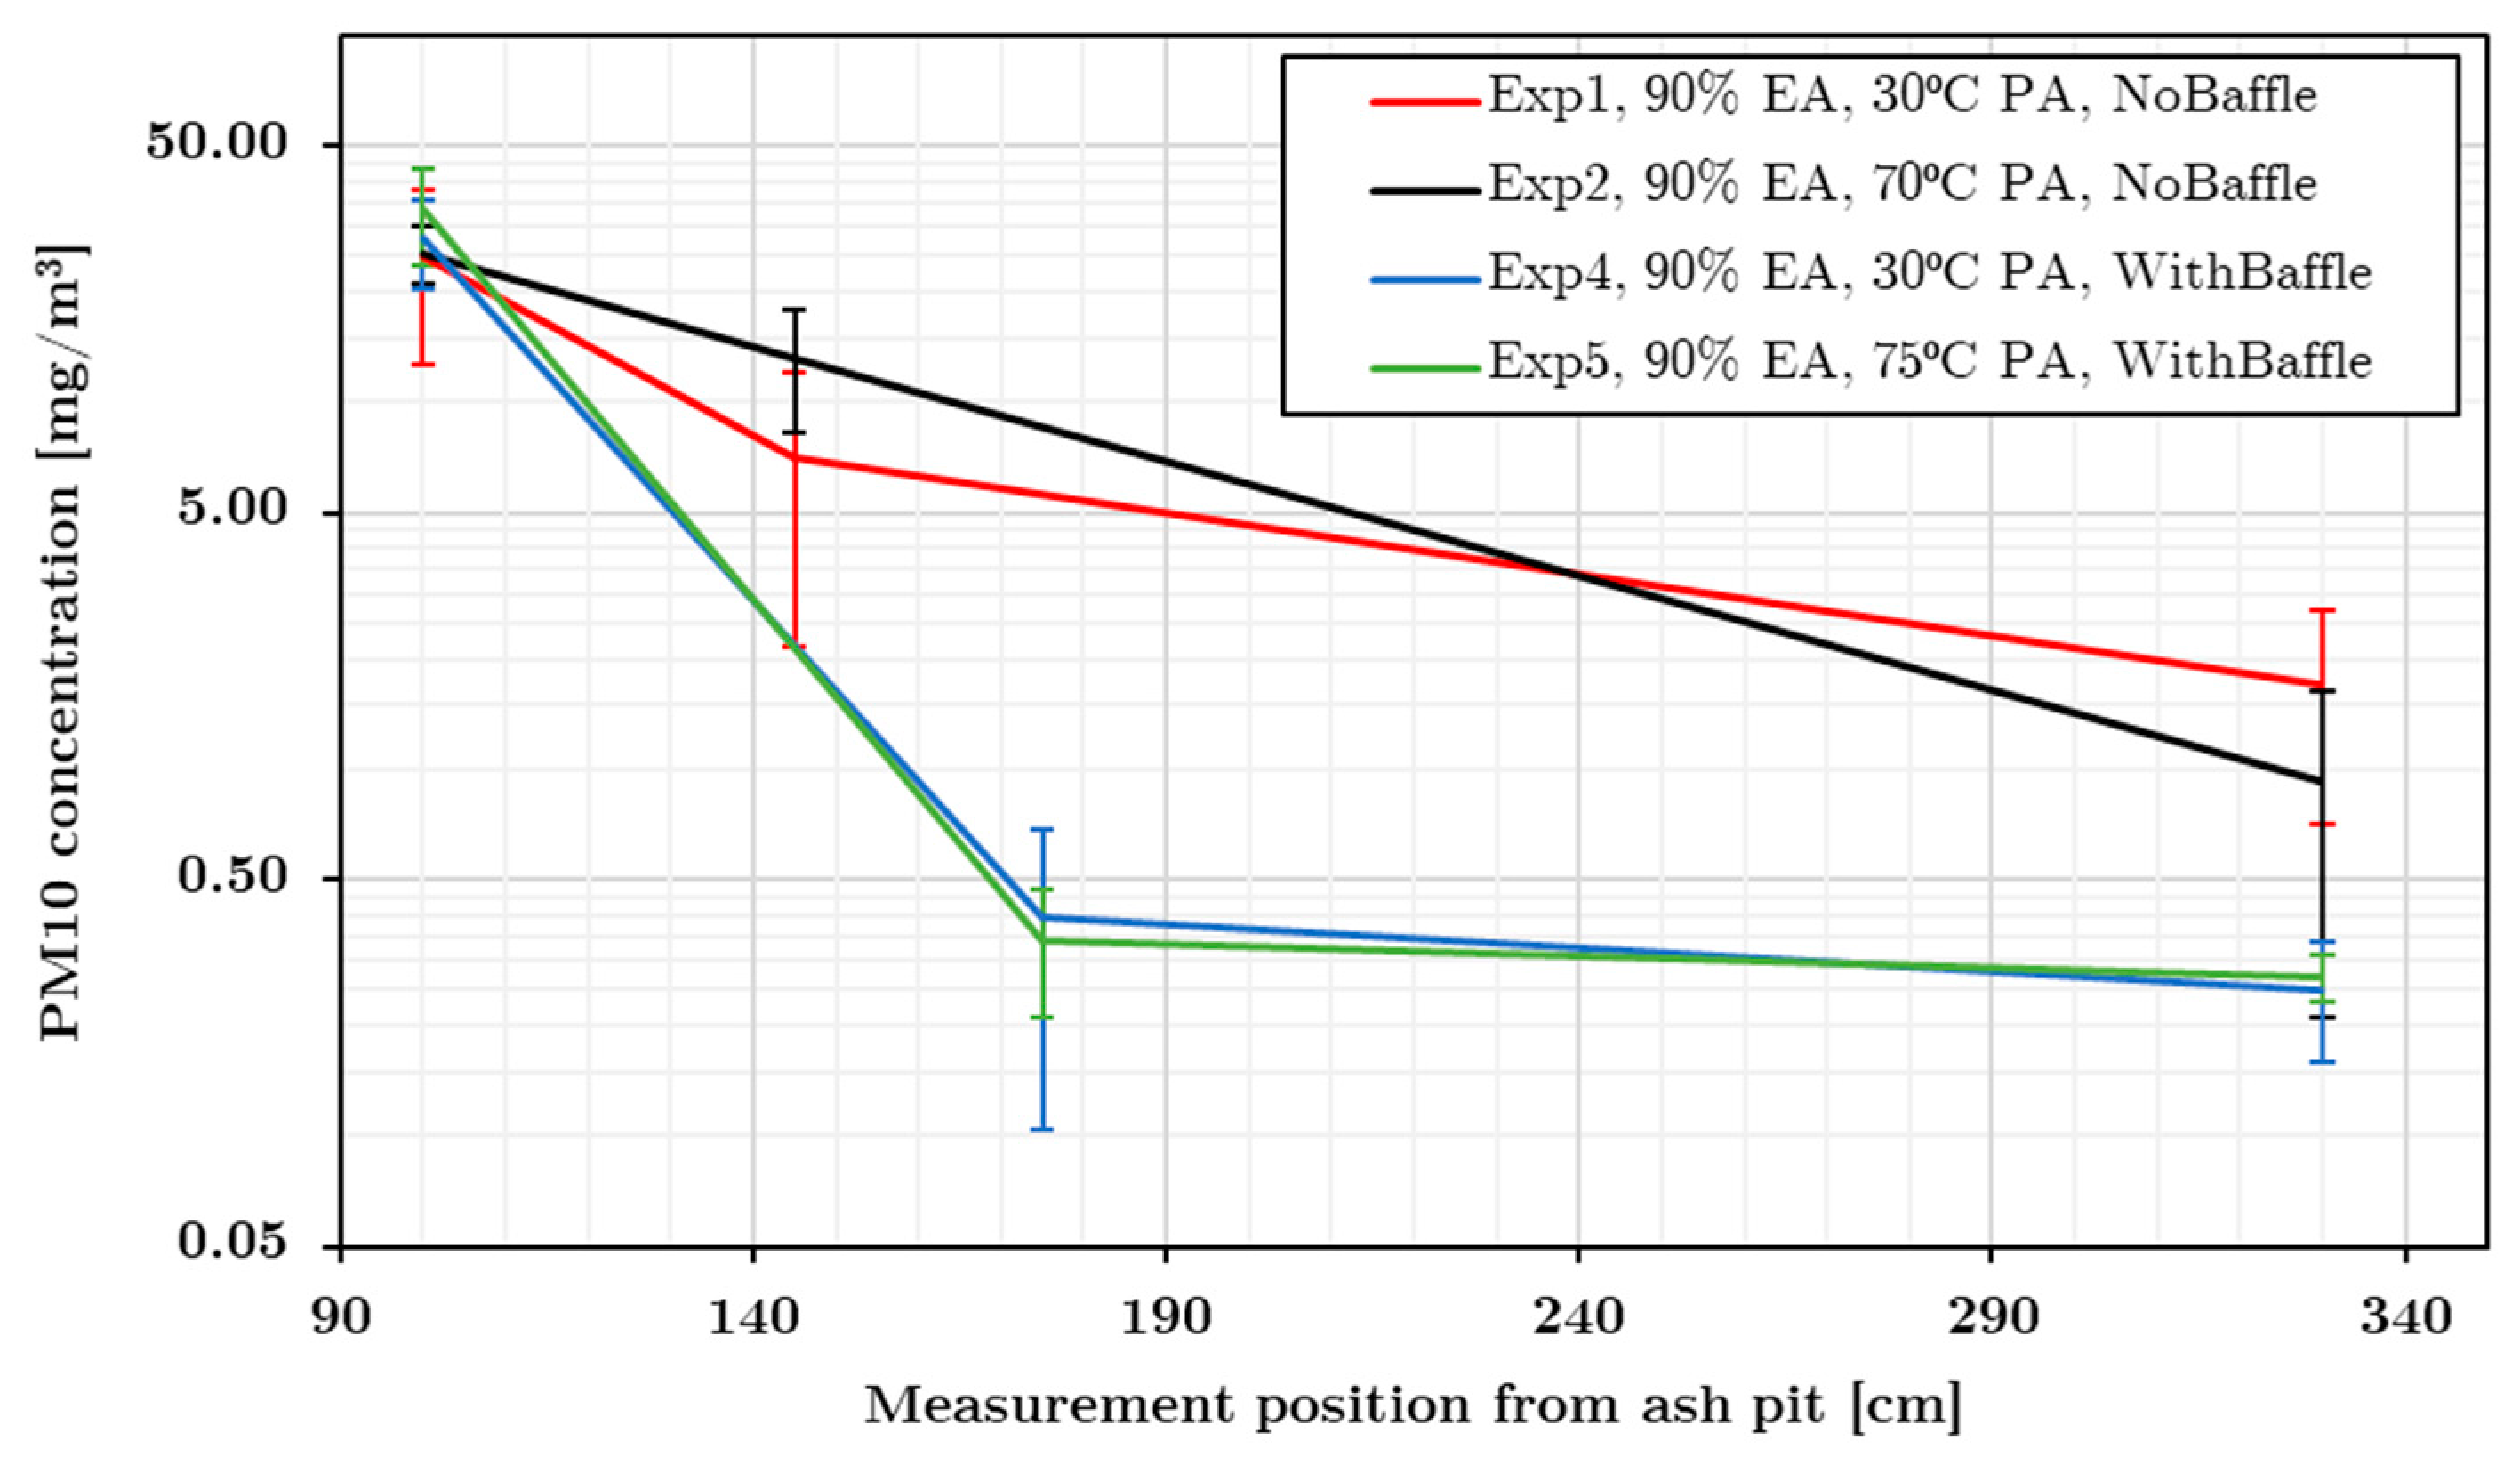
In order to understand the influence of residence time on PM emission, baffles were prepared to allow adjustment of the gas residence time. The momentum response time of the PM (<10 μm) is very low and the corresponding Stokes number if far below unity, which means that all particles are in equilibrium and follows the flow field of the gas bulk. In general, furnace baffles do not only increase residence time but also provide additional advantages to the combustion system i.e., increase the radiation heat flux density, shorten drying time of solid fuel, accelerate ignition of fuel, and introduce better air-fuel mixing [61,62,63]. Three baffles were installed in the experimental setups 4 and 5. The experimental results of temperature and PM10 concentrations for the two systems with and without baffles using two different levels of primary air pre-heating are presented in Table 4 and Figure 8. The uncertainty in the experimental data is reported as the standard deviation in each measurement position. Direct comparison of the temperature in the lower regions of the furnace for the baffled and non-baffled system is difficult due to changes in the flame position (c.f. Figure 9). Experimental results and CFD simulations show higher gas temperature in the lower part of the furnace for the systems with baffles. Measurements also show increased wall temperatures below the first baffle. This can be attributed to an increase in radiation heat transfer from the lowest baffle. Analysis of CFD results indicate that the baffle accounts for 20% of the radiative heat transfer in that region.
The lowest baffle plays an important role in increasing the radiation heat transfer to the fresh reloaded biomass. This gives a higher heating rate and devolatilization rate. Consequently, somewhat higher PM concentrations in the lower part of the furnace is expected. Figure 8 shows that the system with baffles produce slightly more PM10 in the lower regions compared to the system without baffles. However, at higher positions in the freeboard, PM10 concentration is reduced significantly by a combination of increased residence time, higher particle temperature, and better air-fuel mixing due to baffles. Overall, the PM10 concentrations in the chimney are reduced by more than a factor 6 due to installation of baffles.
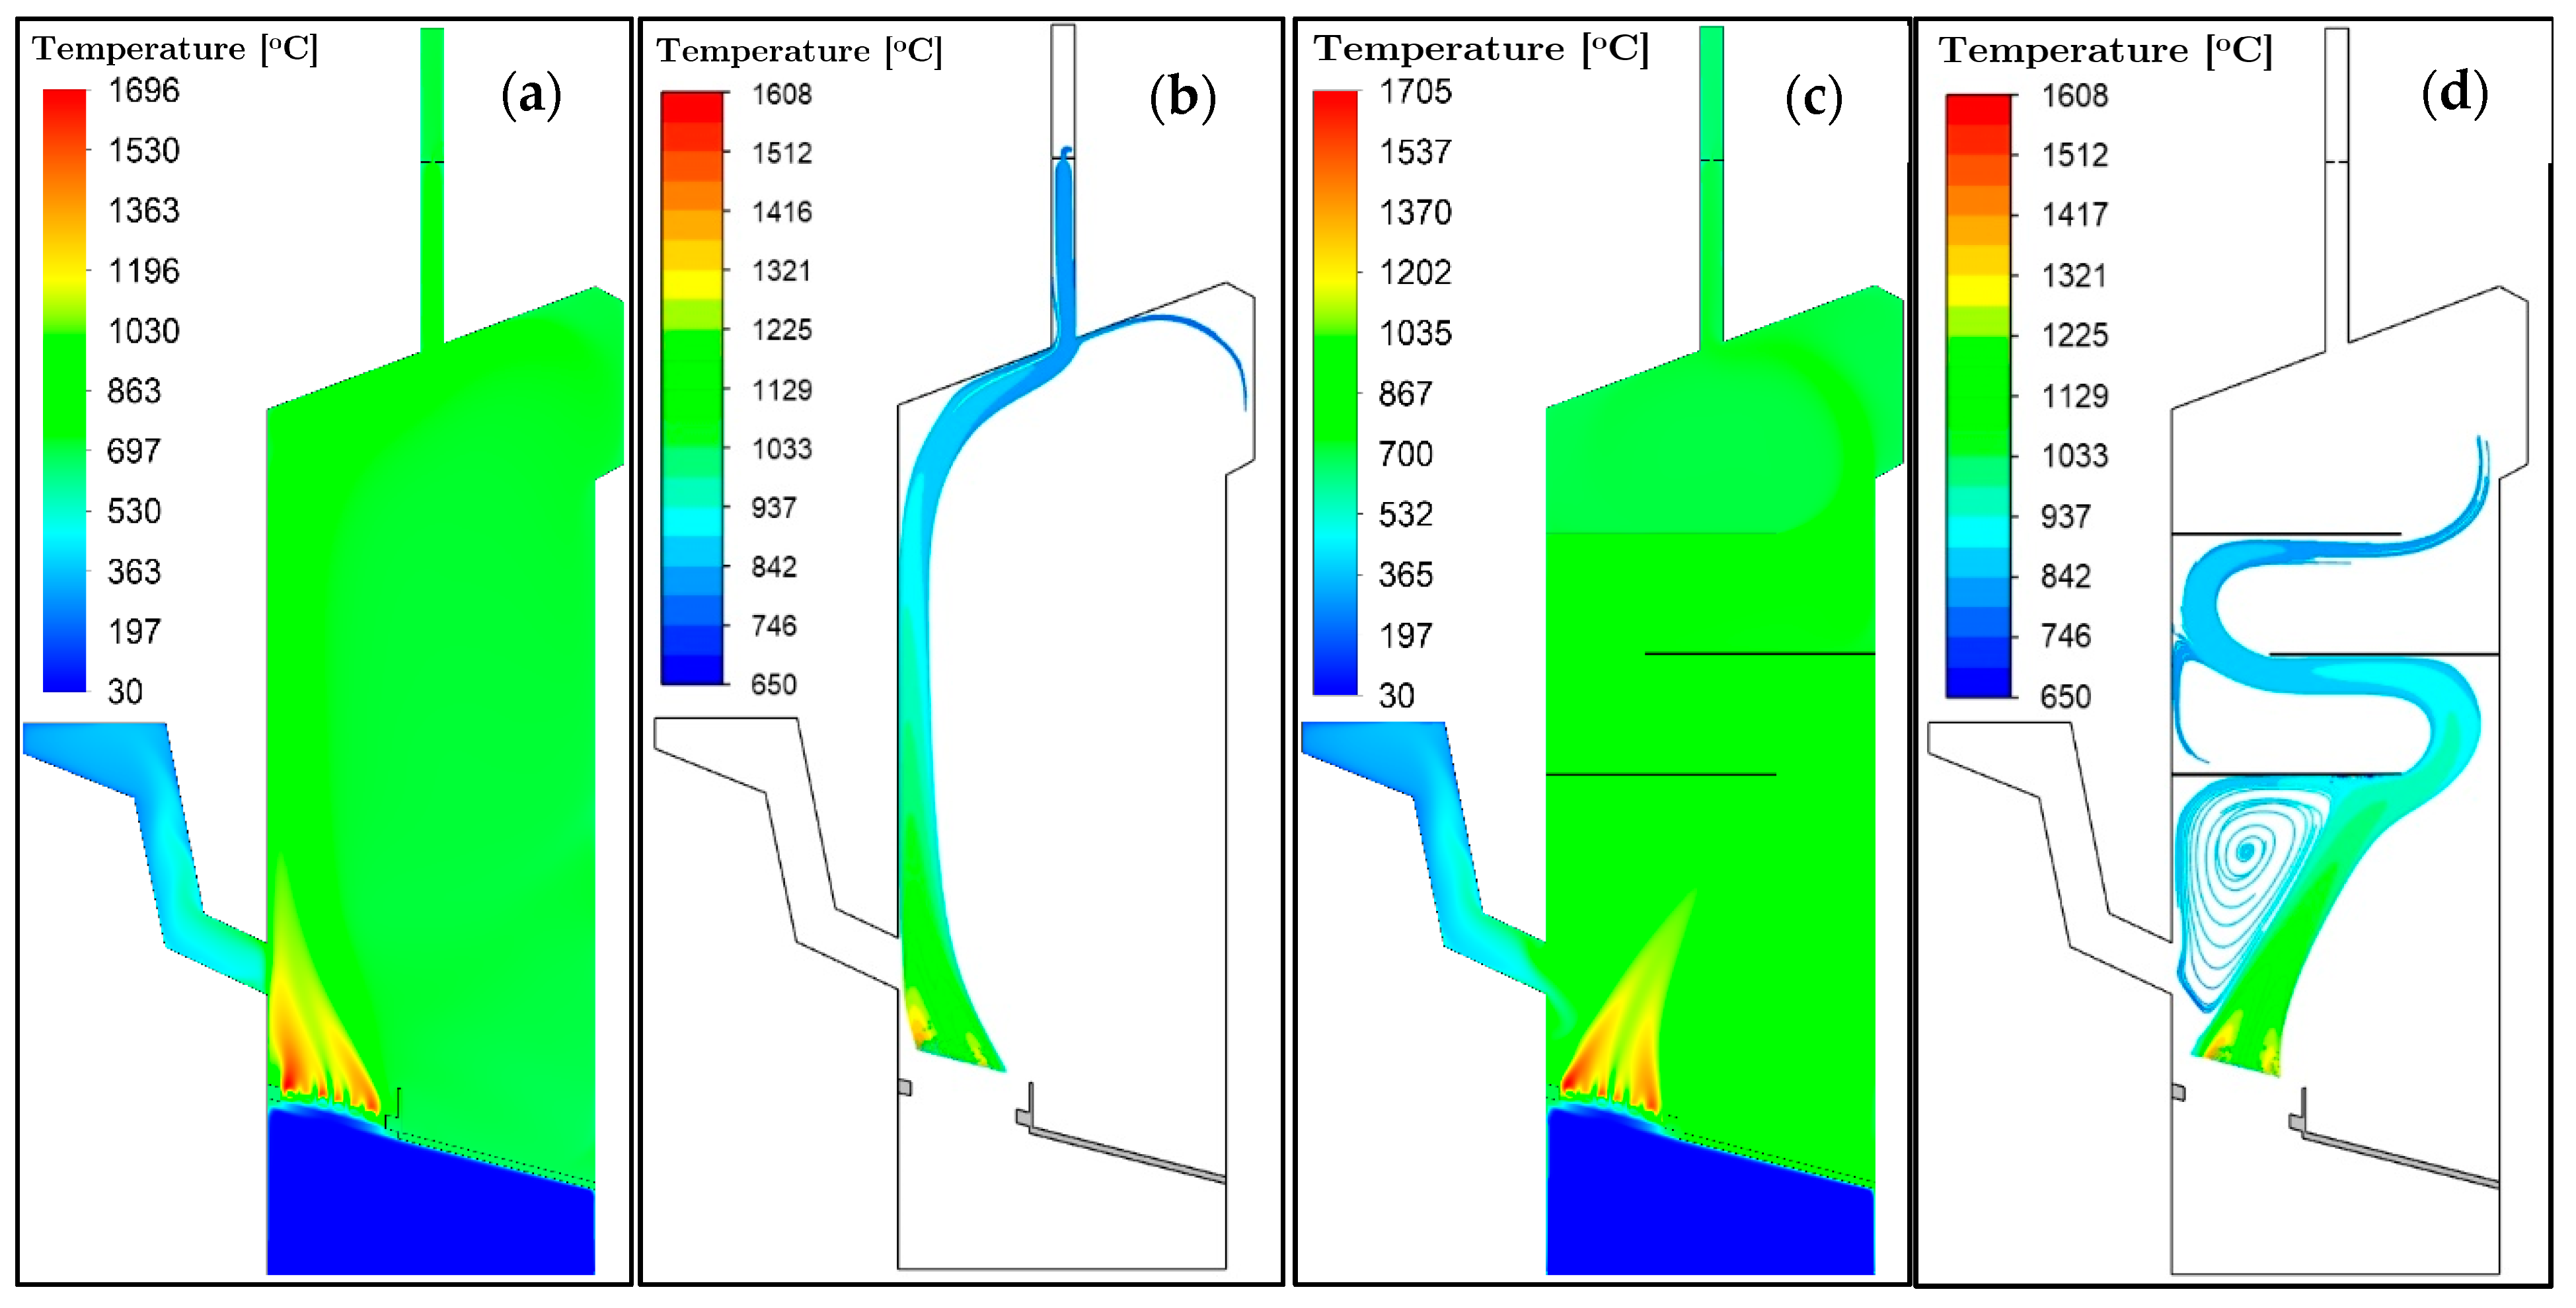
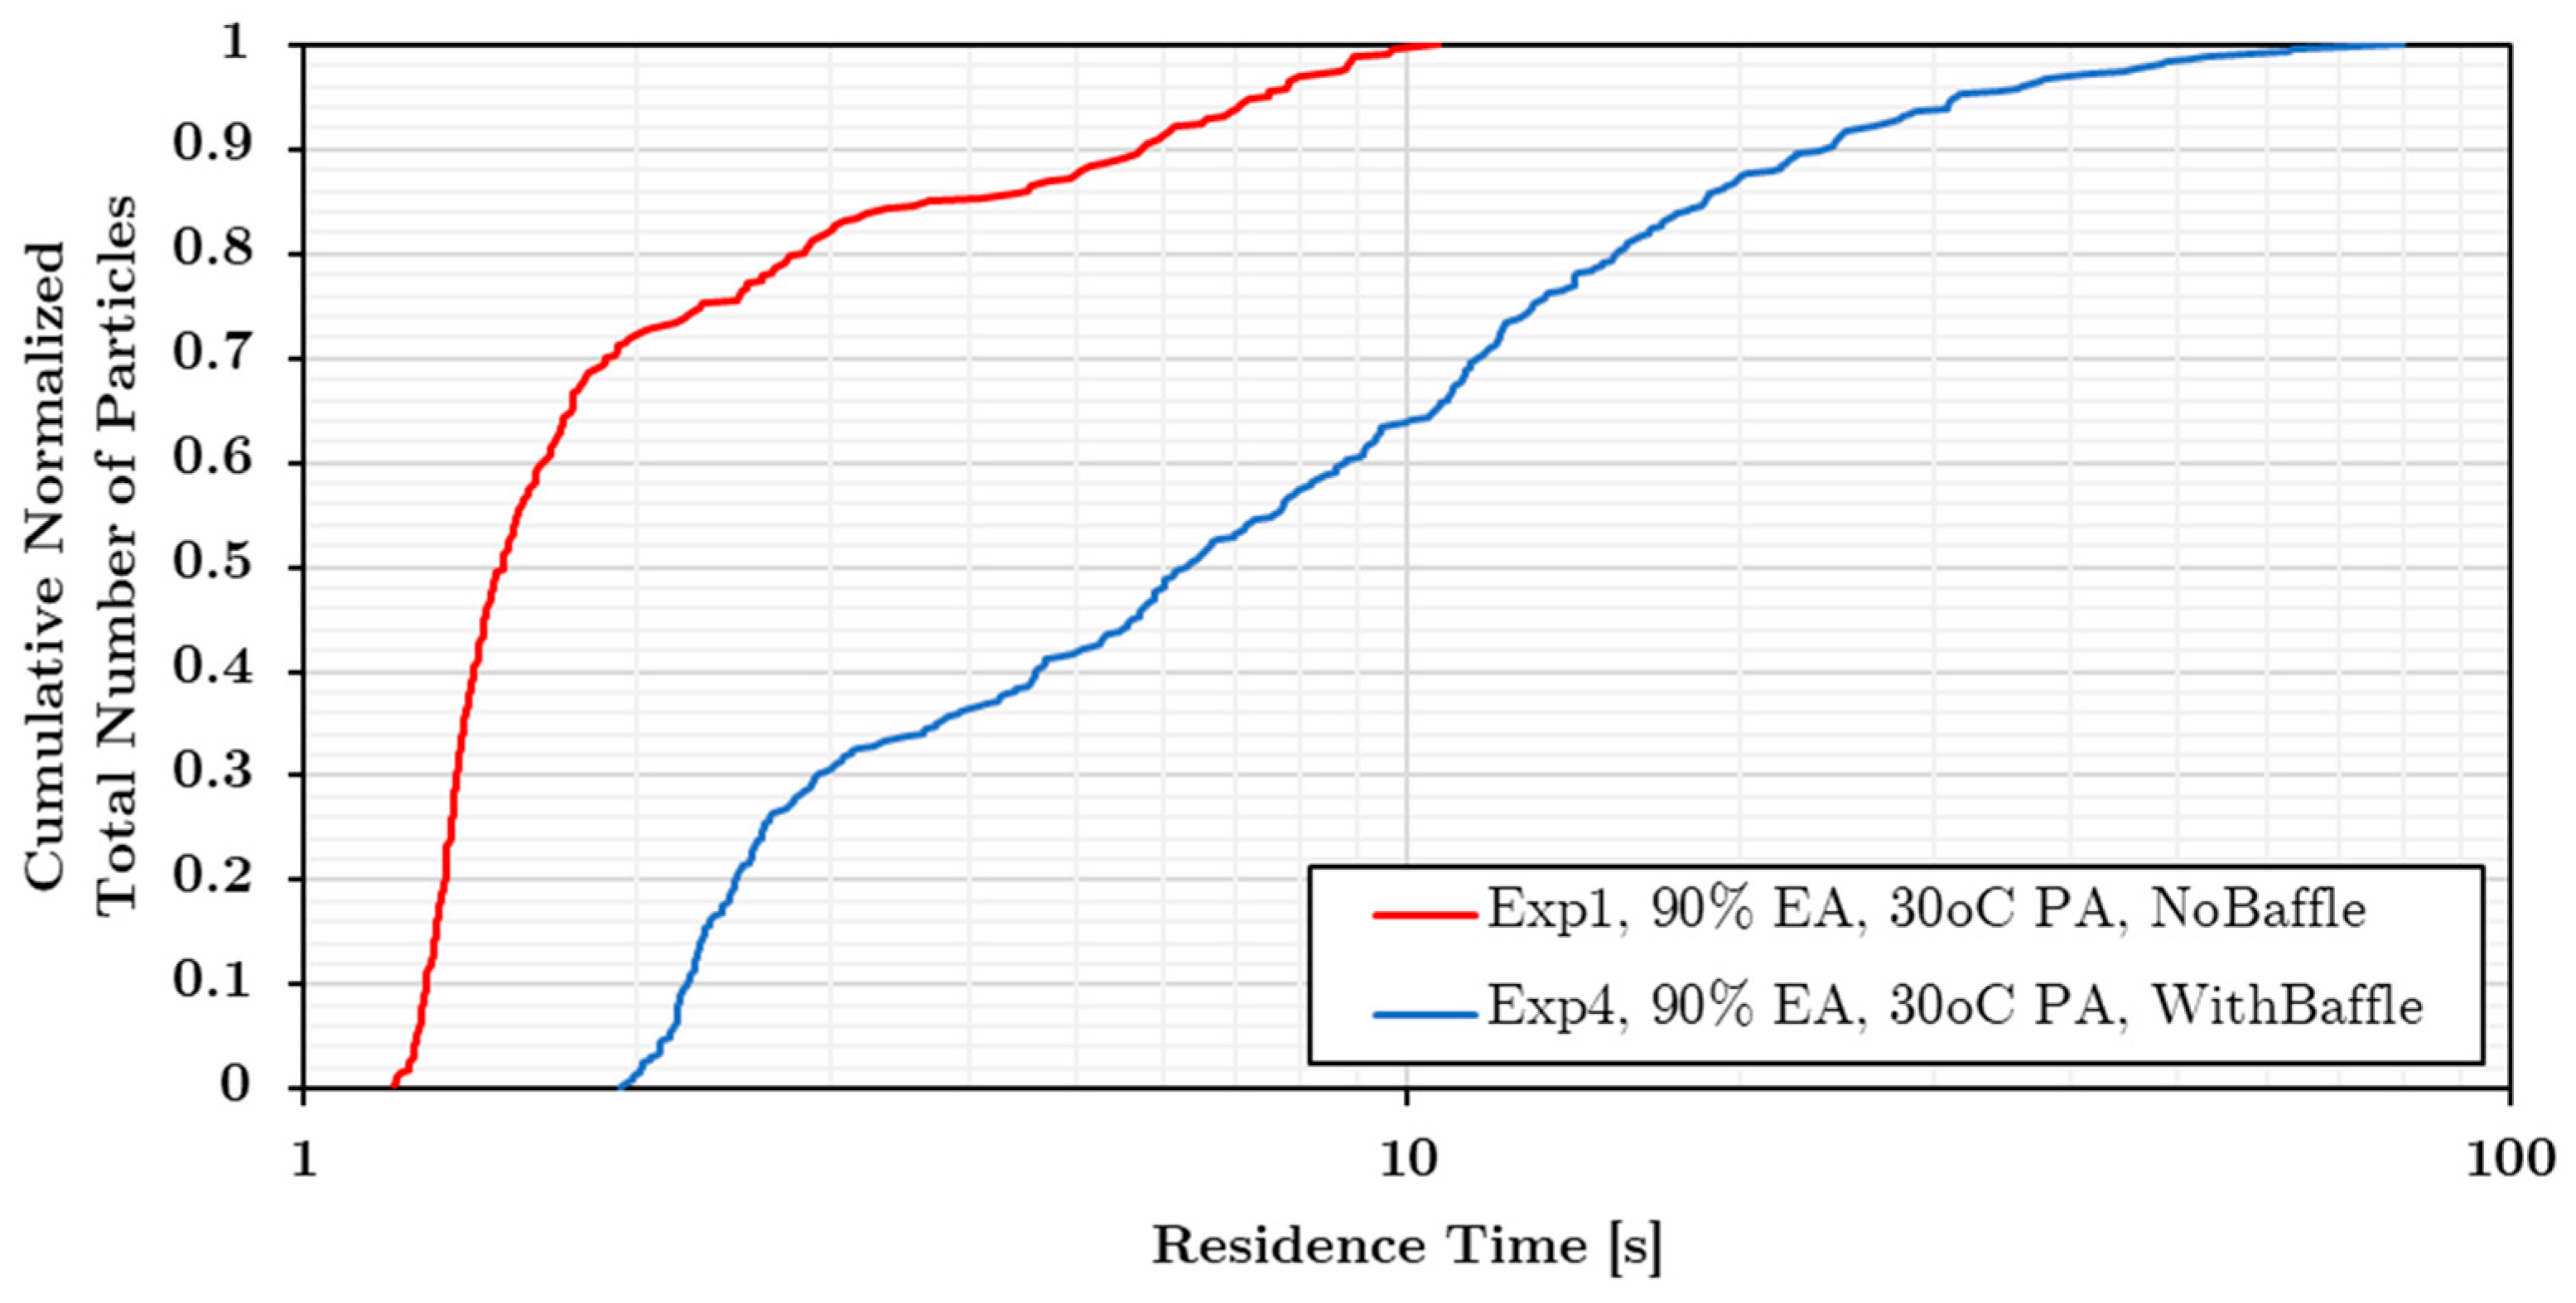
The difference in residence time between the two systems is investigated by CFD simulations using Lagrangian particle tracking. Figure 10 summarizes the particle residence time for inert particles passing the chimney. Figure 8 and Figure 10 indicate that the soot particles are completely burnt after 2 s and it is only the front part of the RTD that carries unburnt soot particles. In the non-baffled system, 70% of the flow is moving quickly to the outlet. This part of the flue gas contains unburnt soot particles to varying fraction while the remaining 30% is mixed with the bulk gas in the furnace. This part (30%) remains in the furnace for a longer time and contains no or very little unburnt soot when leaving the furnace. Similarly, the RTD for the baffled system indicates that only 30% of the flow moves directly to the outlet while 70% is mixed with the gas bulk in the furnace. With baffles installed in the furnace, the flow experiences a longer path and almost all soot is burnt when the exhaust gas reaches the outlet.
5.2.2. Influence of Air Pre-Heating
Experiments with different levels of primary air pre-heating were conducted in order to understand the significance of increased temperature on PM10 emission. Two different levels of primary air temperature were explored in the current study i.e., 30 °C in Exp1 and Exp4 and 70–75 °C in Exp2 and Exp5. The air pre-heating results in elevated temperatures inside the furnace, as summarized in Table 4. However, the influence of air pre-heating on the heating rate and devolatilization rate of the biomass due to increased convective heat transfer is not significant as shown in Figure 8. Consequently, the PM concentration in the lower part of the furnace is unaffected. In contrast, the elevated temperature has a significant effect on the outlet PM concentration and leads to approximately 50% reduction in the outlet. However, this effect is only noticeable for the system with short residence time. Meanwhile, constant PM10 concentration is observed, irrespective of the primary air temperature in the outlet of the system with long residence time (baffled system). This phenomenon could be accredited to the fact that the carbonaceous content in the PM is completely burnt in the baffled system at the outlet even without utilizing preheated air. This is supported by the slightly higher temperature experienced by the particles in the baffled system, which leads to higher reaction rates. In addition, the longer residence time in the baffled system provides ample time to burn the particles to a higher degree of conversion. The remaining PM10 in the outlet could be attributed to unburnt materials like inorganic fly ash, contained in the biomass fuel and evaporated during devolatilization. The same phenomenon was also observed in a previous work by Yang W. et.al. [25] who analyzed the PM characteristics from biomass combustion system in drop tube furnace. At the high temperature combustion condition i.e., more than 900 °C, the carbon-containing compounds were observed to completely diminish and the key inorganic elements (Na, K, and Cl) were dominating compounds in the deposited PM at the furnace outlet.
5.2.3. Influence of the Air/Fuel Ratio
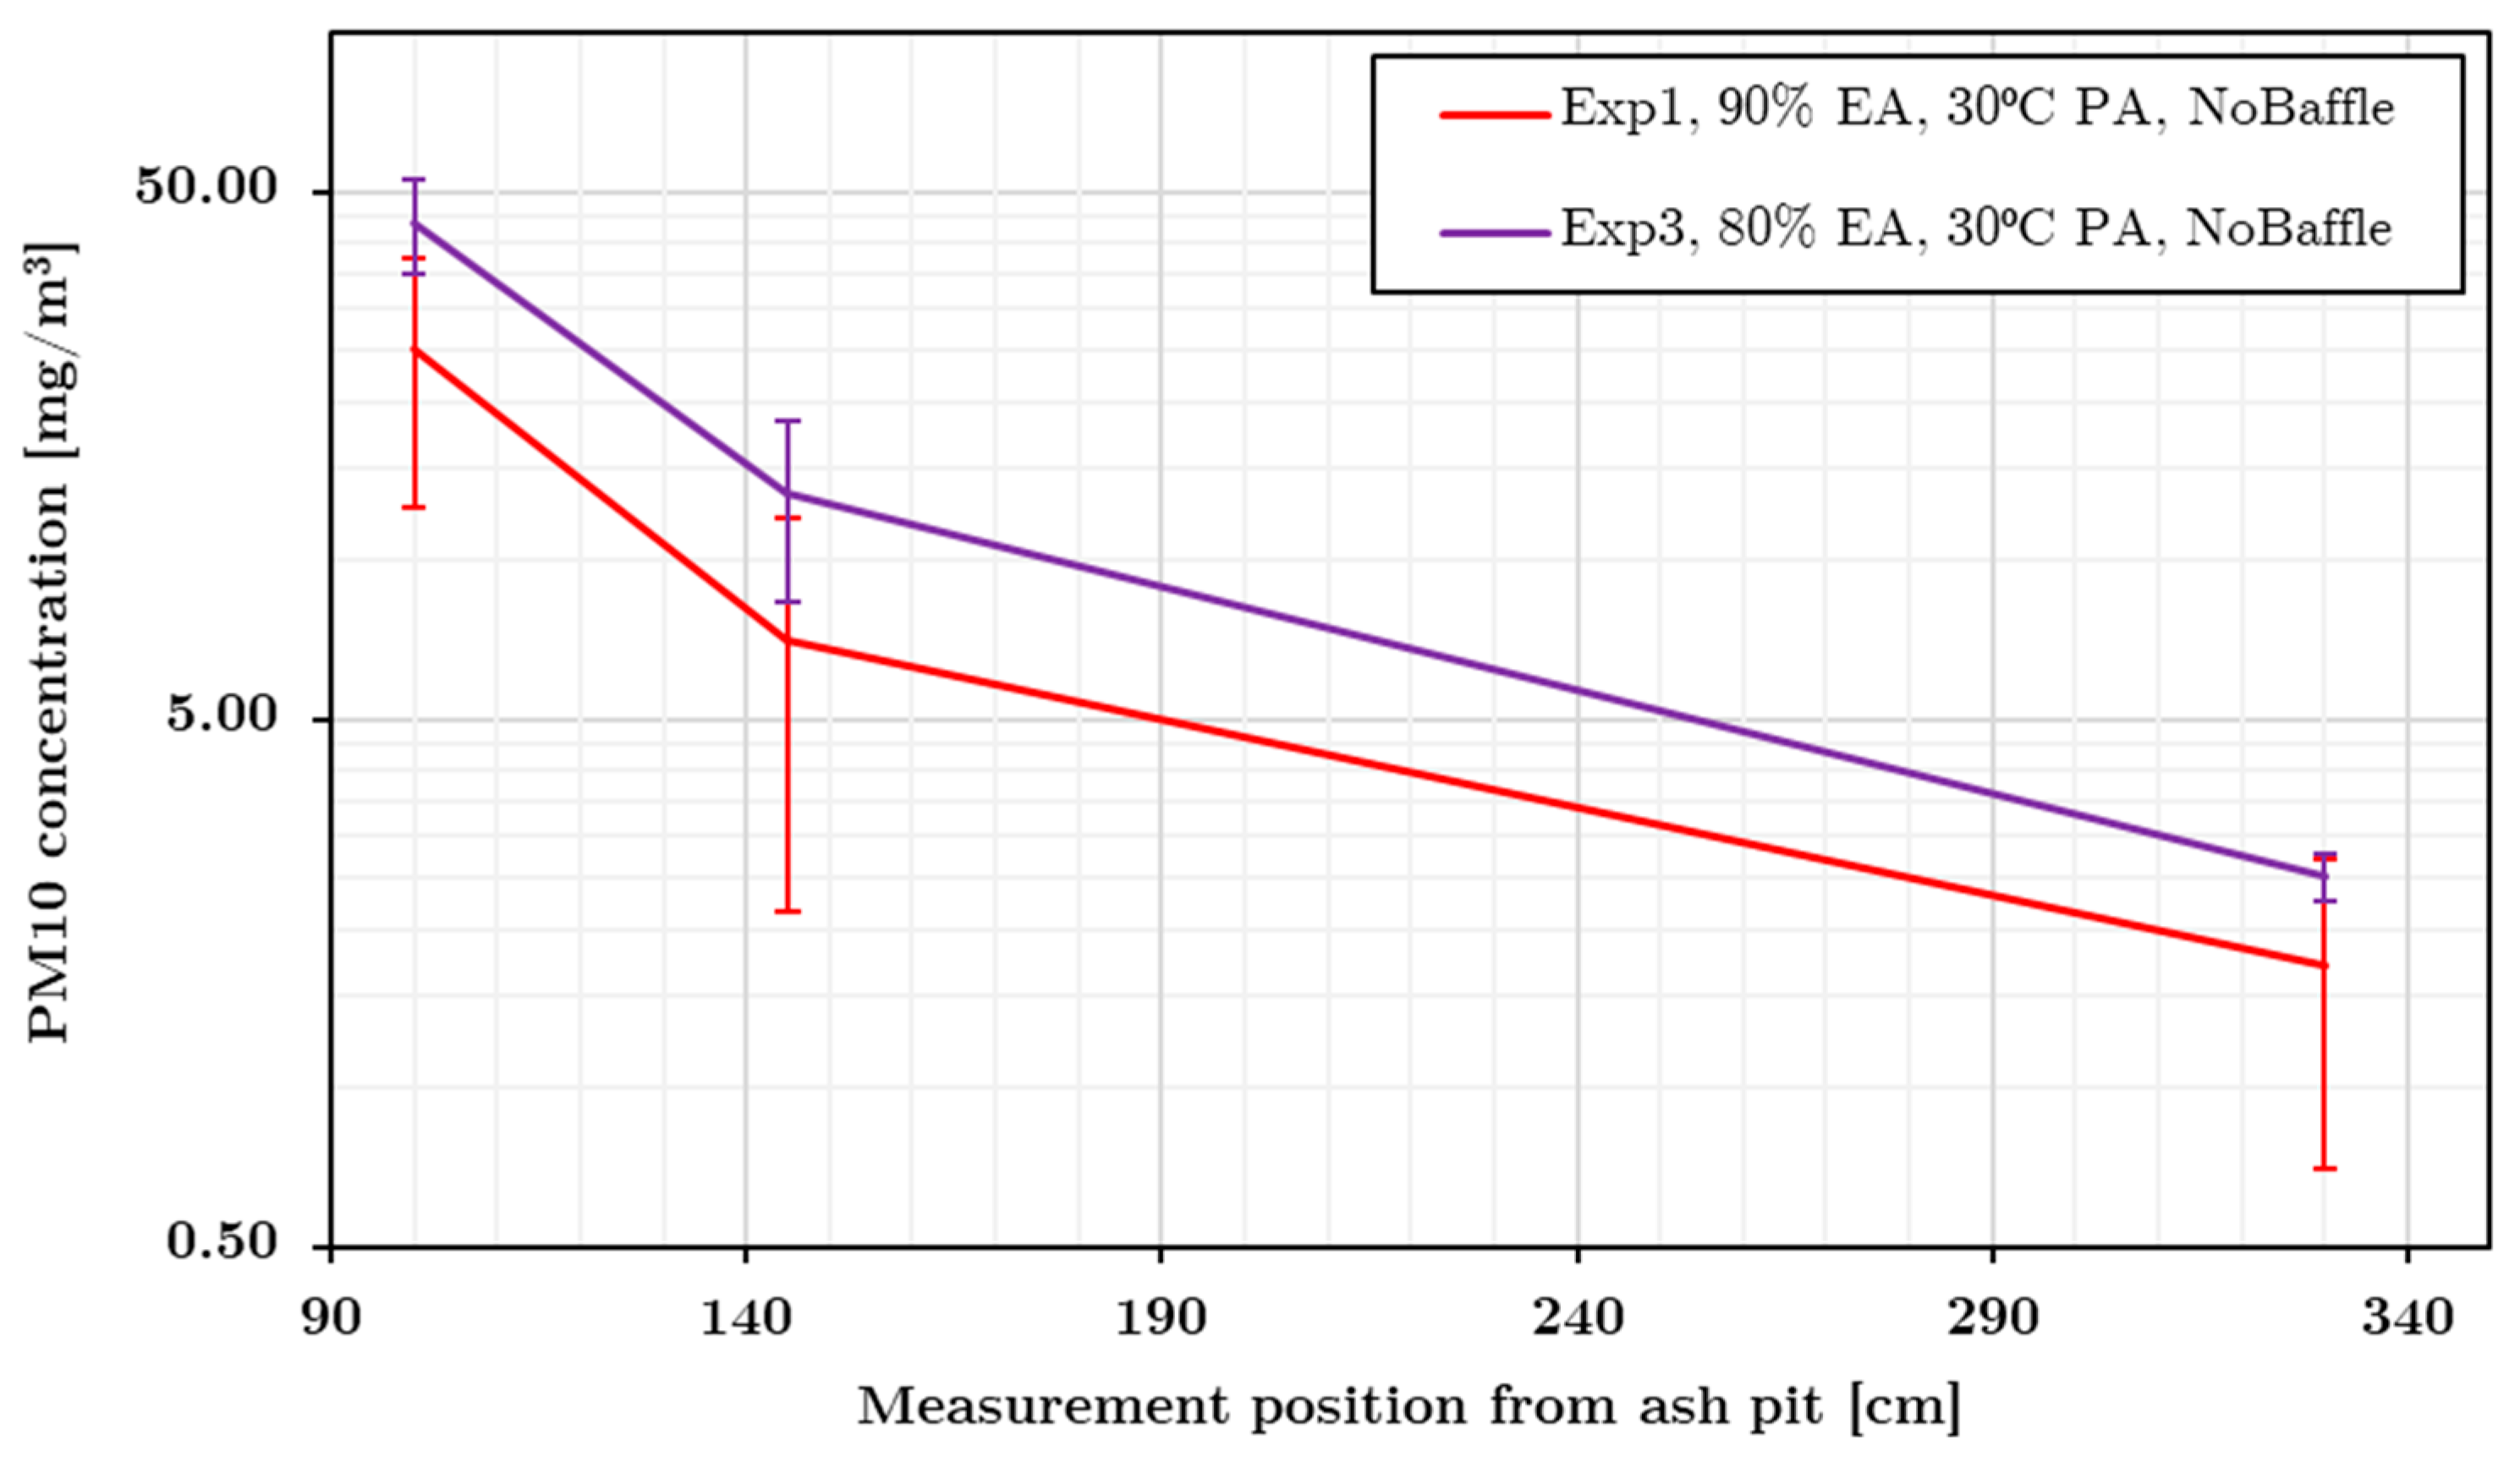
Different combustion conditions were explored to reveal the significance of the air/fuel ratio i.e., different levels of excess air (90 vs. 80% of excess air), which are represented as Exp 1 and Exp 3.
Table 4 and Figure 11 show the results of the average temperature and PM10 concentration of the aforementioned experimental conditions. The temperature of the system with a lower amount of excess air, i.e., Exp 3, is higher in all measurement positions as expected, since a less amount of inert gas needs to be heated compared to the system with a higher level of excess air. However, the higher temperature in the experiments with lower air/fuel ratio appears to have no significant effect on PM10 reduction, as shown in Figure 11. This indicates that the increased temperature in the experiments with lower air/fuel ratio could not remedy the oxygen deficiency to reduce PM concentration at least for the range of the explored experimental conditions.
5.3. Kinetic Study of PM10 Reduction
In this study, biomass initially at room temperature is feed to a bed of burning char and the unreacted biomass. The char bed has a temperature of about 800 °C. The devolatilization of biomass, which has a peak at 500–600 °C, is soon reached on the particle surface and devolatilization occurs fast and continues to generate volatile gases while the thermal front moves towards the center of the biomass. In the present study the PM concentration is measured above the flame i.e., 50 cm above the grate (corresponding to the 100 cm measurement position). The residence time from the biomass bed to this measuring point is 0.4–0.5 s and the average particle temperature is approximately 1100 °C in this region based on the results from the CFD analysis. Soot formation is fast at this high temperature [64] and at the position 50 cm above the grate, soot particles are formed and partly burnt with oxygen. Most of the PAC has burnt and the soot particles are considered mature and the molar H/C ratio is expected to be below 0.1 [41]. From this position to the outlet, the main soot reaction is combustion. Therefore, the kinetic analysis of PM10 reduction is conducted based on a model for soot combustion.
A minor fraction of ash is expected to end up in the PM measurement system and influence the kinetic study. However, due to the very fast cooling of the exhaust gas in the thin 8 mm PM sampling pipes, the nucleation is much faster than particle growth rate and the final ash particles are smaller than the detection limit of the PM sensor i.e., particle with size less than 0.3 µm. In addition, a small fraction of the ash is expected to end up in the soot particles, but in all the PM measurements, we only detect particles that might be ash when the soot particle concentration is very low.
A detailed model of soot combustion is not possible since the soot particles have an unknown size distribution. Soot formed from cellulose, hemicellulose, and lignin may have different reactivity and each of the particles may also have different ash content that can catalyze the soot burning. Here we assume that the particles are porous and the reaction rate is proportional to the remaining mass of soot, local oxygen concentration, and that the kinetics follow an Arrhenius temperature dependence, as presented in Equations (3) and (4). The Weiss-Prater criterion is below 0.1 with an effective diffusivity of m2/s and mass transfer to and inside such small particles with a very large surface per volume can be neglected even with Sherwood number equal to 2. The CFD simulation results indicate that the oxygen mole fraction along the particle trajectories are relatively constant i.e., around 0.09. Due to the low concentration of soot, the consumption of oxygen due to soot oxidation will hardly change the oxygen concentration. Therefore, the PM reduction model in Equation (3) can be simplified and described by a pseudo first order reaction.
The experiments showing the most significant effect on soot combustion include Exp 1 and Exp 4 that also correspond to the largest variation in residence time and temperature. Data from these systems are utilized further in the current PM10 kinetic study. In addition, the particle history data from DPM simulations contain information about particle temperature, residence time, and coordinates, that are needed for the kinetic study. By injecting 3000 particles on the injection line, the results are found to be number-independent i.e., the residence time and kinetic parameters are found to be stable.
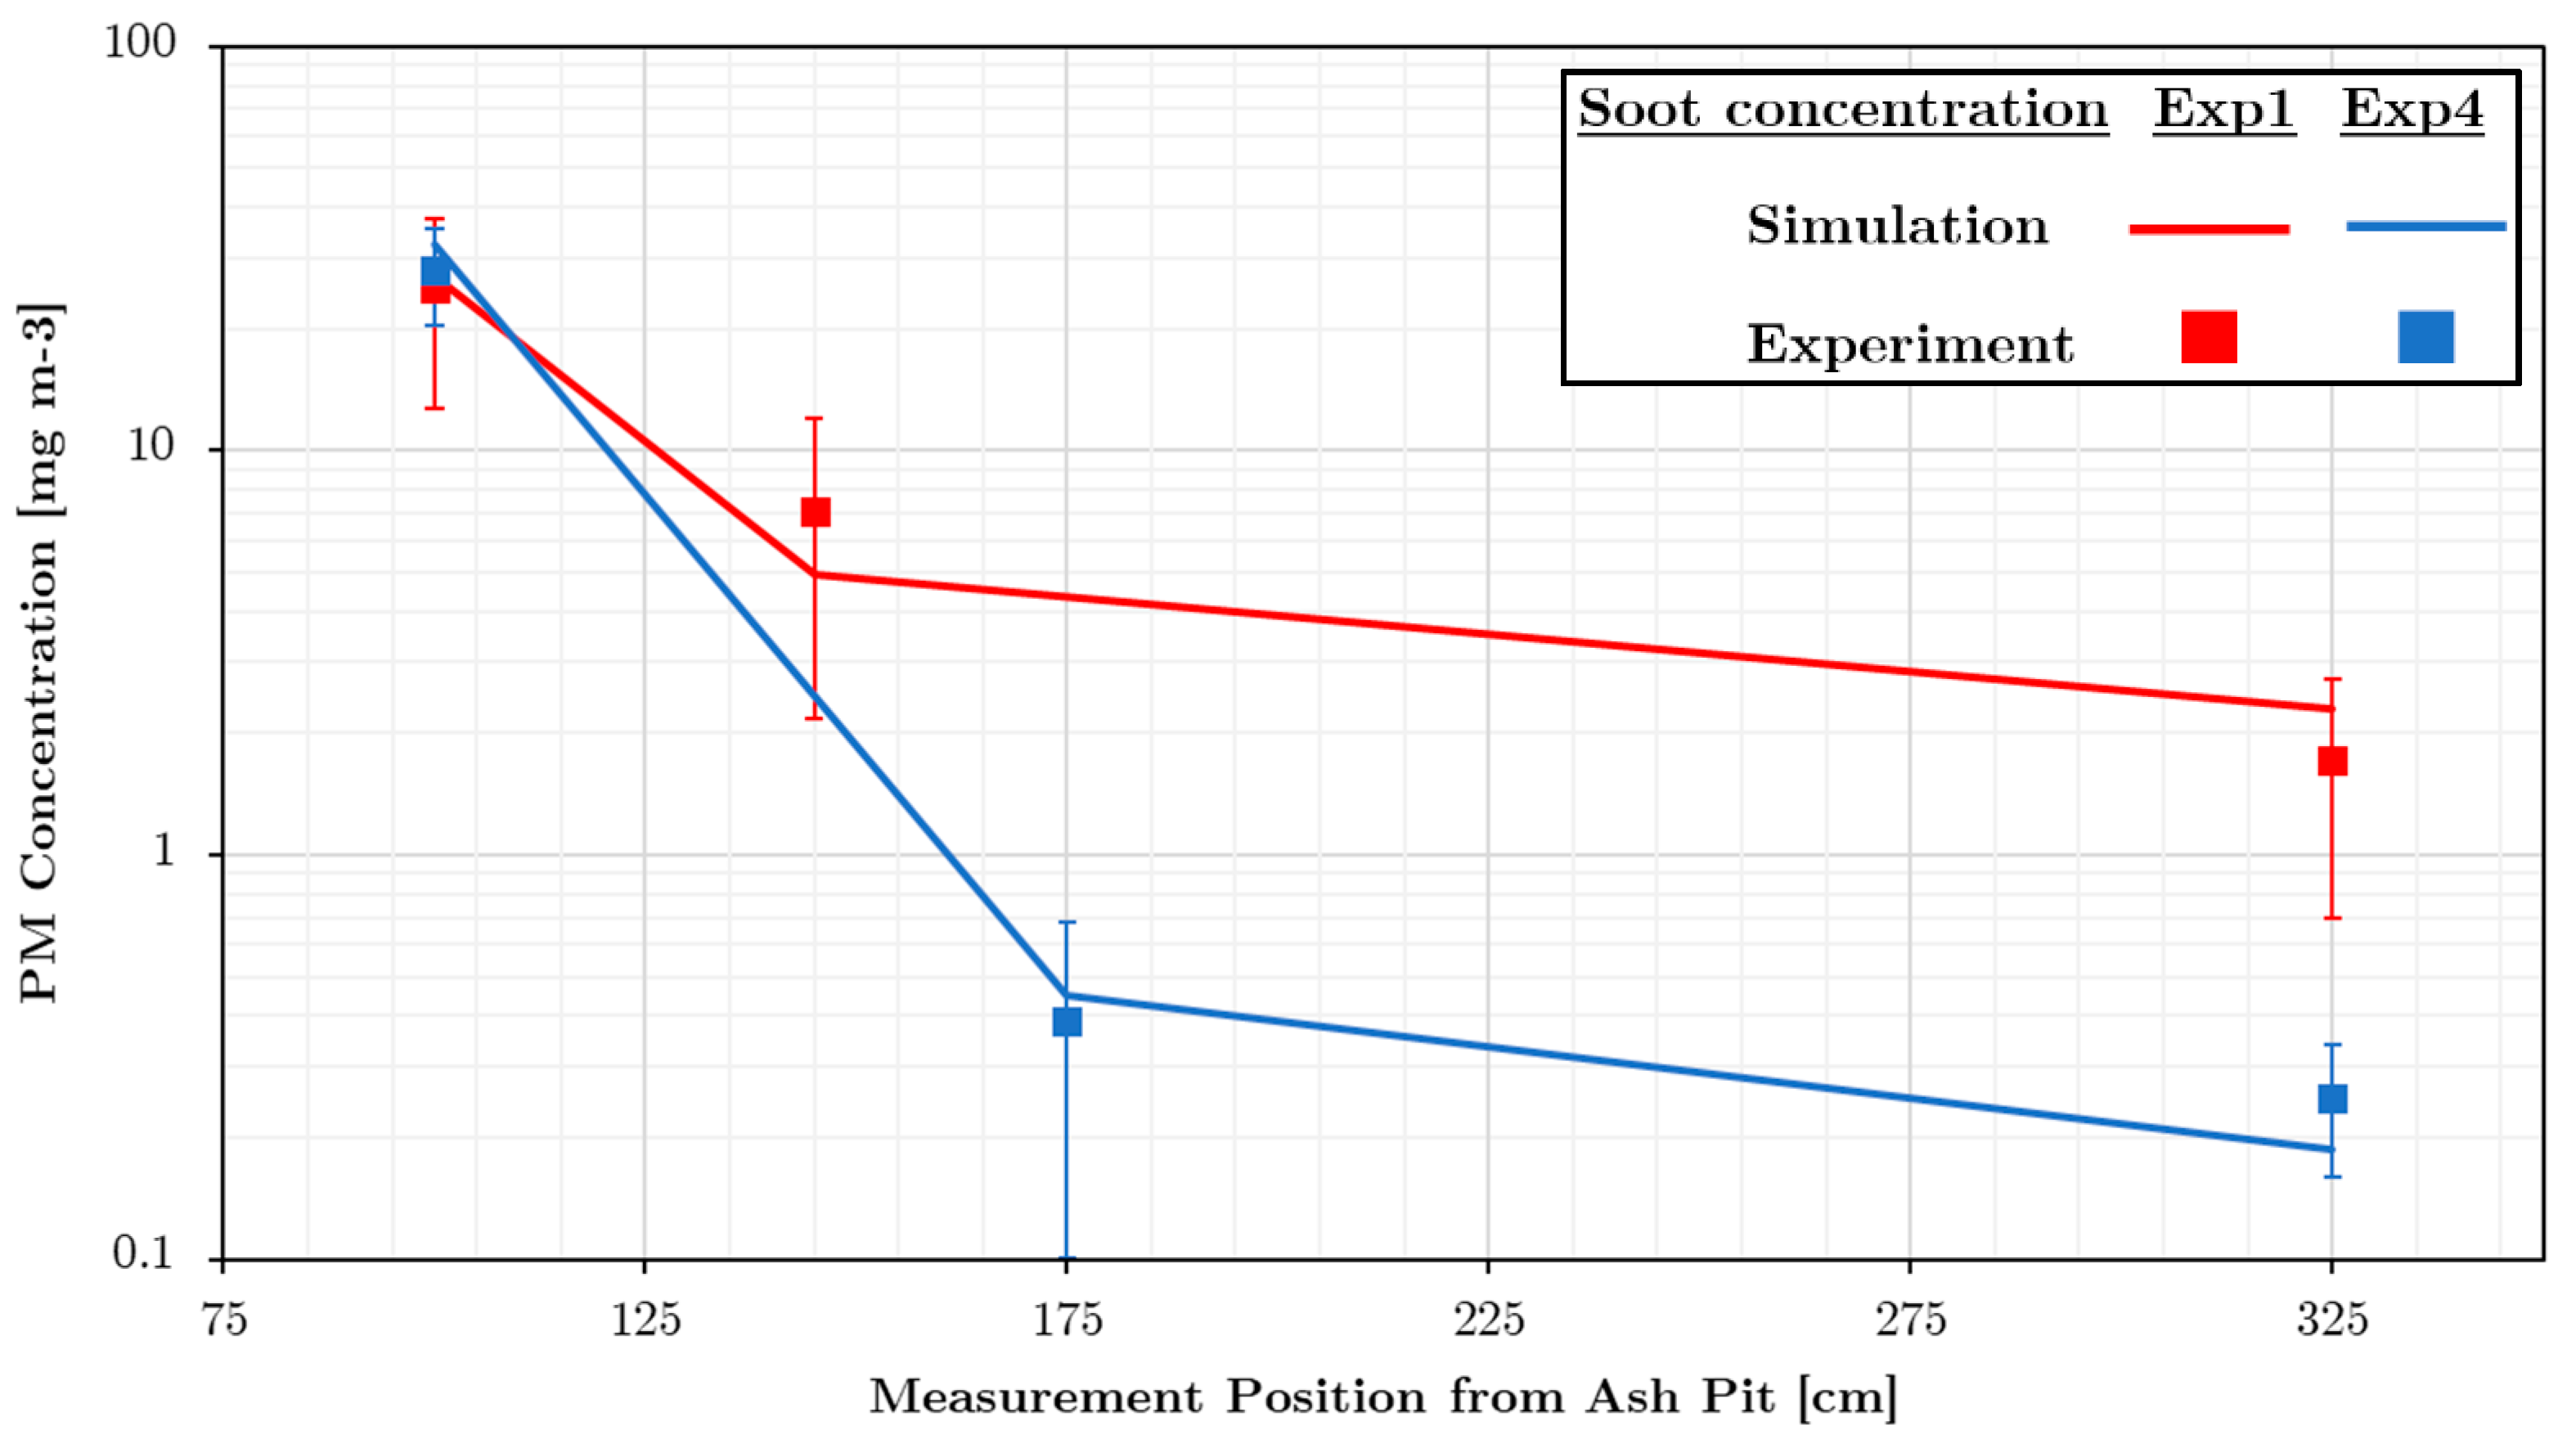
The kinetic parameters, i.e., the rate constant at reference temperature and the activation energy ), were evaluated by use of non-linear regression analysis. Equation (3) is used as a governing equation to calculate PM10 concentration based on the particle history data from the DPM simulation. For this purpose, the non-linear regression algorithm (lsqnonlin) in Matlab 2018b (The MathWorks, Natick, MA, USA) was used. The parameters in the reaction kinetic model for PM reduction are obtained to for the rate constant at reference temperature (900 °C) and for the activation energy. It is noted that the observed activation energy is consistent with the range of activation energies for soot oxidation, which has been reported in previous studies i.e., 102 to 210 [65]. A comparison between calculated and experimentally measured PM10 concentrations is presented in Figure 12. These experimental data include large degree of PM10 conversion inside the furnace up to 99.2%. This reveals the that a first order kinetic model allows the soot conversion inside the furnace to be predicted accurately for different operating conditions and wide range of conversion.
Statistical analysis shows that the correlation coefficient for the overall model equals 99.0%. This confirms that the model fulfills the purpose to predict the PM reduction throughout the furnace. At the same time, the standard errors for the rate constant at the reference temperature and the activation energy ), are 2.22 and 1.83, respectively. This means that both parameters are statistically significant on more than 95% confidence level. The results from the statistical analysis do not exclude that more complex kinetic models can be developed. However, it suggests that the proposed model is sufficient for most purposes.
6. Conclusions
A lab-scale grate-fired furnace is successfully designed and equipped with on-line sensors to study emissions of particulate matter originating from residual biomass combustion at different combustion conditions. The present work improves the understanding of PM reduction by combining analyses from experimental work and from computational fluid dynamics (CFD) simulations. Different measurement techniques are developed and used in the experimental facility to allow the main combustion parameters i.e., gas temperature, gas composition and PM concentration to be measured accurately. A novel methodology using on-line spatially resolved PM measurements is presented to study the evolution of the PM concentration throughout the furnace for different experimental conditions, thereby allowing accurate in-situ measurement of the PM reactivity. The two-thermocouple method is utilized and proven to enhance the accuracy of the gas temperature measurements.
The experimental results are in line with the current understanding of PM emission under different combustion conditions, i.e., residence time, temperature of combustion, and air/fuel ratio significantly affect the emissions. PM10 concentration measurements at different experimental conditions and different locations inside the furnace show the importance of the combustion conditions on the formation and reduction of PM10. The PM10 emissions, for the range of experimental conditions explored, are further reduced up to 80% by increasing the residence time, primary air temperature, and air/fuel ratio.
In addition to the experimental work, CFD analyses of biomass combustion and transport of particulate matter inside the furnace are conducted to quantify parameters which are difficult to measure directly in the experimental facility i.e., flow field, particle history data including particle temperature, trajectories, and residence time distribution inside the furnace. The insights from simulations are proven to give better understanding about PM10 reduction inside the furnace.
In general, the CFD model predicts the combustion behavior accurately based on the good agreement between temperature measurement and CO2 measurements and simulation results. CFD analysis also provides insight related to the temperature measurement i.e., the thermocouple readings in the freeboard depend on the flame position and the gas bulk pathway and that the flame temperature can reach up to 1700 °C. Moreover, the CFD simulations reveal the importance of baffles, which leads to approximately 20% higher radiation heat flux, improved air-fuel mixing, and increased particle residence time (four times longer based on the mean particle residence time). This explains the significant reduction of PM observed in the measurements.
By combining the results from measurements of real soot formed during biomass combustion and information from the CFD simulations, the kinetic parameters of PM10 reduction in biomass combustion are successfully determined. The parameters of the reaction kinetic model for PM reduction, relying on an Arrhenius temperature dependency, are obtained to 23.1 (s−1) for the rate constant at reference temperature (900 °C) and 126.2 (kJ mol−1) for the activation energy. Good agreement between the calculated and experimentally measured PM10 concentrations inside the furnace is obtained using the proposed model. The proposed model shows a high level of predictability based on different statistical parameters i.e., the correlation coefficient for the overall model and the standard errors for the kinetic parameters. Thereby, it is concluded that the first order kinetic model allows the soot conversion inside the furnace to be predicted accurately for different operating conditions and a PM10 conversion up to 99.2% within the furnace.
Author Contributions
Conceptualization, R.A. and B.A.; methodology, M.G.N., H.S., R.A. and B.A.; software, M.G.N., R.A. and B.A.; validation, M.G.N., R.A. and B.A.; formal analysis, M.G.N., and H.S.; resources, R.A. and H.S.; data curation, M.G.N., R.A. and B.A.; writing—original draft preparation, M.G.N.; writing—review and editing, M.G.N., H.S., M.H., R.A. and B.A.; visualization, M.G.N.; supervision, R.A., H.S. and M.H.; project administration, R.A. and M.H.; funding acquisition, R.A. All authors have read and agreed to the published version of the manuscript.
Funding
This research was supported by the Swedish Research Council (Grant: 348-2014-3522).
Institutional Review Board Statement
Not applicable.
Informed Consent Statement
Not applicable.
Data Availability Statement
Not applicable.
Conflicts of Interest
The authors declare no conflict of interest.
Abbreviations
| CFD | Computational fluid dynamic |
| EA | Excess air |
| Exp | Experiment |
| PA | Primary air |
| SSE | Sum of squares error |
| STDEV | Standard deviation |
| Latin letters | |
| C | Concentration [mg/m3] |
| EA | Activation energy [kJ/mol] |
| h | Convective heat transfer coefficient [W/(m2 K)] |
| k | Kinetic rate [1/s] |
| PM10 | Particulate matter with size 10 μm |
| PM2.5 | Particulate matter with size 2.5 μm |
| t | Time [s] |
| T | Temperature [°C] |
| y+ | Non-dimensional wall distance [-] |
| y | Mole fraction [-] |
| Greek letters | |
| ε | Emissivity factor [-] |
| σ | Stefan-Boltzmann constant [W/(m2 K4)] |
| Subscript | |
| ∞ | Surrounding condition |
| b | Thermocouple bead |
| calc | Calculated value |
| exp | Experimental value |
| g | Gas |
| l | Large thermocouple |
| ref | Reference |
| s | Small thermocouple |
References
- Wang, X.; Hu, Z.; Adeosun, A.; Liu, B.; Ruan, R.; Li, S.; Tan, H. Particulate matter emission and K/S/Cl transformation during biomass combustion in an entrained flow reactor. J. Energy Inst. 2018, 91, 835–844. [Google Scholar] [CrossRef]
- Anca-Couce, A. Reaction mechanisms and multi-scale modelling of lignocellulosic biomass pyrolysis. Prog. Energy Combust. Sci. 2016, 53, 41–79. [Google Scholar] [CrossRef]
- Warnatz, J.; Mass, U.; Dibble, R.W. Combustion: Physical and Chemical Fundamentals, Modelling and Simulation, Experiments, Pollutant Formation, 4th ed.; Springer: Berlin, Germany, 1999; ISBN 9783540259923. [Google Scholar]
- WHO. Ambient Air Pollution. Available online: https://www.who.int/gho/phe/outdoor_air_pollution/en/#:~:text=Particulate matter pollution is an,countries disproportionately experience this burden.&text=In 2016%2C indoor and outdoor,one in nine deaths globally (accessed on 12 August 2020).
- Raza, M.; Chen, L.; Leach, F.; Ding, S. A review of particulate number (PN) emissions from gasoline direct injection (gdi) engines and their control techniques. Energies 2018, 11, 1417. [Google Scholar] [CrossRef] [Green Version]
- Sciortino, D.D.; Bonatesta, F.; Hopkins, E.; Yang, C.; Morrey, D. A combined experimental and computational fluid dynamics investigation of particulate matter emissions from a wall-guided gasoline direct injection engine. Energies 2017, 10, 1408. [Google Scholar] [CrossRef]
- Luo, M.; El-Faroug, M.O.; Yan, F.; Wang, Y. Particulate matter and gaseous emission of hydrous ethanol gasoline blends fuel in a port injection gasoline engine. Energies 2017, 10, 1263. [Google Scholar] [CrossRef] [Green Version]
- Verma, P.; Stevanovic, S.; Zare, A.; Dwivedi, G.; Van, T.C.; Davidson, M.; Rainey, T.; Brown, R.J.; Ristovski, Z.D. An overview of the influence of biodiesel, alcohols, and various oxygenated additives on the particulate matter emissions from diesel engines. Energies 2019, 12, 1987. [Google Scholar] [CrossRef] [Green Version]
- Viskup, R.; Wolf, C.; Baumgartner, W. Qualitative and quantitative characterisation of major elements in particulate matter from in-use diesel engine passenger vehicles by LIBS. Energies 2020, 13, 368. [Google Scholar] [CrossRef] [Green Version]
- Zhao, L.; Du, Q.; Gao, J.; Wu, S. Contribution of minerals in different occurrence forms to PM10 emissions during the combustion of pulverized zhundong coal. Energies 2019, 12, 3629. [Google Scholar] [CrossRef] [Green Version]
- McConnell, J.; Sutherland, J.C. Assessment of various tar and soot treatment methods and a priori analysis of the steady laminar flamelet model for use in coal combustion simulation. Fuel 2020, 265, 116775. [Google Scholar] [CrossRef]
- Wang, W.; Wen, C.; Liu, T.; Li, C.; Chen, L.; Wu, J.; Shao, Y.; Liu, E. Effects of various occurrence modes of inorganic components on the emissions of PM10 during torrefied biomass combustion under air and oxy-fuel conditions. Appl. Energy 2020, 259, 114153. [Google Scholar] [CrossRef]
- Final Report|The Contribution of Biomass Combustion to Ambient Fine Particle Concentrations in the United States|Research Project Database|Grantee Research Project|ORD|US EPA. Available online: https://cfpub.epa.gov/ncer_abstracts/index.cfm/fuseaction/display.abstractDetail/abstract/104/report/F (accessed on 30 June 2020).
- Chen, J.; Li, C.; Ristovski, Z.; Milic, A.; Gu, Y.; Islam, M.S.; Wang, S.; Hao, J.; Zhang, H.; He, C.; et al. A review of biomass burning: Emissions and impacts on air quality, health and climate in China. Sci. Total Environ. 2017, 579, 1000–1034. [Google Scholar] [CrossRef] [Green Version]
- Puxbaum, H.; Caseiro, A.; Sánchez-Ochoa, A.; Kasper-Giebl, A.; Claeys, M.; Gelencsér, A.; Legrand, M.; Preunkert, S.; Pio, C.A. Levoglucosan levels at background sites in Europe for assessing the impact of biomass combustion on the European aerosol background. J. Geophys. Res. Atmos. 2007, 112, 1–11. [Google Scholar] [CrossRef] [Green Version]
- Nussbaumer, T. Combustion and co-combustion of biomass: Fundamentals, technologies, and primary measures for emission reduction. Energy Fuels 2003, 17, 1510–1521. [Google Scholar] [CrossRef]
- Hu, Z.; Wang, X.; Zhang, L.; Yang, S.; Ruan, R.; Bai, S.; Zhu, Y.; Wang, L.; Mikulčić, H.; Tan, H. Emission characteristics of particulate matters from a 30 MW biomass-fired power plant in China. Renew. Energy 2020, 155, 225–236. [Google Scholar] [CrossRef]
- Pagels, J.; Strand, M.; Rissler, J.; Szpila, A.; Gudmundsson, A.; Bohgard, M.; Lillieblad, L.; Sanati, M.; Swietlicki, E. Characteristics of aerosol particles formed during grate combustion of moist forest residue. J. Aerosol Sci. 2003, 34, 1043–1059. [Google Scholar] [CrossRef] [Green Version]
- Christensen, K.A.; Livbjerg, H. A field study of submicron particles from the combustion of straw. Aerosol Sci. Technol. 1996, 25, 185–199. [Google Scholar] [CrossRef]
- Wiinikka, H.; Gebart, R.; Boman, C.; Boström, D.; Öhman, M. Influence of fuel ash composition on high temperature aerosol formation in fixed bed combustion of woody biomass pellets. Fuel 2007, 86, 181–193. [Google Scholar] [CrossRef]
- Zeuthen, J.H.; Jensen, P.A.; Jensen, J.P.; Livbjerg, H. Aerosol formation during the combustion of straw with addition of sorbents. Energy Fuels 2007, 21, 699–709. [Google Scholar] [CrossRef]
- Regueiro, A.; Patiño, D.; Porteiro, J.; Granada, E.; Míguez, J.L. Effect of air staging ratios on the burning rate and emissions in an underfeed fixed-bed biomass combustor. Energies 2016, 9, 940. [Google Scholar] [CrossRef] [Green Version]
- Patiño, D.; Pérez-Orozco, R.; Porteiro, J.; Lapuerta, M. Characterization of biomass PM emissions using thermophoretic sampling: Composition and morphological description of the carbonaceous residues. J. Aerosol Sci. 2019, 127, 49–62. [Google Scholar] [CrossRef]
- Zhang, Y.; Zhang, Z.; Zhou, Y.; Dong, R. The influences of various testing conditions on the Evaluation of household biomass pellet fuel combustion. Energies 2018, 11, 1131. [Google Scholar] [CrossRef] [Green Version]
- Yang, W.; Zhu, Y.; Cheng, W.; Sang, H.; Yang, H.; Chen, H. Characteristics of Particulate Matter Emitted from Agricultural Biomass Combustion. Energy Fuels 2017, 31, 7493–7501. [Google Scholar] [CrossRef]
- Babcock & Wilcox Company. Steam: Its Generation and Use, 38th ed.; Babcock & Wilcox Company: Brooklyn, NY, USA, 1972. [Google Scholar]
- Soltani, S.; Andersson, R.; Andersson, B. The effect of exhaust gas composition on the kinetics of soot oxidation and diesel particulate filter regeneration. Fuel 2018, 220, 453–463. [Google Scholar] [CrossRef]
- Wang-Hansen, C.; Soltani, S.; Andersson, B. Kinetic analysis of O2-and NO2-based oxidation of synthetic soot. J. Phys. Chem. C 2013, 117, 522–531. [Google Scholar] [CrossRef]
- Kastrinaki, G.; Lorentzou, S.; Konstandopoulos, A.G. Soot oxidation kinetics of different ceria nanoparticle catalysts. Emiss. Control Sci. Technol. 2015, 1, 247–253. [Google Scholar] [CrossRef] [Green Version]
- Tighe, C.J.; Twigg, M.V.; Hayhurst, A.N.; Dennis, J.S. The kinetics of oxidation of diesel soots and a carbon black (printex U) by O2 with reference to changes in both size and internal structure of the spherules during burnout. Carbon 2016, 107, 20–35. [Google Scholar] [CrossRef]
- Perraudin, E.; Budzinski, H.; Villenave, E. Kinetic study of the reactions of ozone with polycyclic aromatic hydrocarbons adsorbed on atmospheric model particles. J. Atmos. Chem. 2007, 56, 57–82. [Google Scholar] [CrossRef]
- Gómez, M.A.; Comesaña, R.; Feijoo, M.A.Á.; Eguía, P. Simulation of the effect of water temperature on domestic biomass boiler performance. Energies 2012, 5, 1044–1061. [Google Scholar] [CrossRef]
- Gómez, M.A.; Martín, R.; Collazo, J.; Porteiro, J. CFD steady model applied to a biomass boiler operating in air enrichment conditions. Energies 2018, 11, 2513. [Google Scholar] [CrossRef] [Green Version]
- Motyl, P.; Król, D.; Poskrobko, S.; Juszczak, M. Numerical modelling and experimental verification of the low-emission biomass combustion process in a domestic boiler with flue gas flow around the combustion chamber. Energies 2020, 13, 5837. [Google Scholar] [CrossRef]
- Morrone, B. Residual biomass resources: An invaluable reservoir of energy and matter. In Innovations in Sustainable Energy and Cleaner Environment; Gupta, A.K., De, A., Aggarwal, S.K., Kushari, A., Runchal, A., Eds.; Springer: Singapore, 2020; pp. 149–170. ISBN 978-981-13-9012-8. [Google Scholar]
- Nugraha, M.G.; Saptoadi, H.; Hidayat, M.; Andersson, B.; Andersson, R. Particle modelling in biomass combustion using orthogonal collocation. Appl. Energy 2019, 255, 113868. [Google Scholar] [CrossRef]
- Lu, H.; Robert, W.; Peirce, G.; Ripa, B.; Baxter, L.L. Comprehensive study of biomass particle combustion. Energy Fuels 2008, 22, 2826–2839. [Google Scholar] [CrossRef]
- Moilanen, A.; Saviharju, K.; Harju, T. Steam gasification reactivities of various fuel chars. Adv. Thermochem. Biomass Convers. 1993, 1, 131–141. [Google Scholar] [CrossRef]
- Yin, C.; Rosendahl, L.A.; Kær, S.K. Grate-firing of biomass for heat and power production. Prog. Energy Combust. Sci. 2008, 34, 725–754. [Google Scholar] [CrossRef]
- Tissari, J.; Lyyränen, J.; Hytönen, K.; Sippula, O.; Tapper, U.; Frey, A.; Saarnio, K.; Pennanen, A.S.; Hillamo, R.; Salonen, R.O.; et al. Fine particle and gaseous emissions from normal and smouldering wood combustion in a conventional masonry heater. Atmos. Environ. 2008, 42, 7862–7873. [Google Scholar] [CrossRef]
- Deng, C.; Liaw, S.B.; Gao, X.; Wu, H. Differences in soot produced from rapid pyrolysis of xylan, cellulose and lignin under pulverized-fuel conditions. Fuel 2020, 265, 116991. [Google Scholar] [CrossRef]
- Koppejan, J.; van Loo, S.; van Loo, S. The Handbook of Biomass Combustion and Co-Firing; Routledge: Oxford, UK, 2012; ISBN 9781849773041. [Google Scholar]
- Coconut Production in Indonesia. Available online: www.tridge.com/intelligences/coconut/ID/production (accessed on 18 December 2018).
- Tsamba, A.J.; Yang, W.; Blasiak, W. Pyrolysis characteristics and global kinetics of coconut and cashew nut shells. Fuel Process. Technol. 2006, 87, 523–530. [Google Scholar] [CrossRef]
- Vassilev, S.V.; Baxter, D.; Andersen, L.K.; Vassileva, C.G. An overview of the chemical composition of biomass. Fuel 2010, 89, 913–933. [Google Scholar] [CrossRef]
- Neves, D.; Thunman, H.; Matos, A.; Tarelho, L.; Gómez-Barea, A. Characterization and prediction of biomass pyrolysis products. Prog. Energy Combust. Sci. 2011, 37, 611–630. [Google Scholar] [CrossRef]
- Tsai, W.T.; Lee, M.K.; Chang, Y.M. Fast pyrolysis of rice straw, sugarcane bagasse and coconut shell in an induction-heating reactor. J. Anal. Appl. Pyrolysis 2006, 76, 230–237. [Google Scholar] [CrossRef]
- Werther, J.; Saenger, M.; Hartge, E.U.; Ogada, T.; Siagi, Z. Combustion of agricultural residues. Prog. Energy Combust. Sci. 2000, 26, 1–27. [Google Scholar] [CrossRef]
- Schwarz, A.D.; Meyer, J.; Dittler, A. Opportunities for low-cost particulate matter sensors in filter emission measurements. Chem. Eng. Technol. 2018, 41, 1826–1832. [Google Scholar] [CrossRef] [Green Version]
- Nova Fitness Co., Ltd. Laser PM2.5 Sensor Specification Product Model: SDS011, version: V1.3; Nova Fitness Co., Ltd.: Shandong, China, 2015; pp. 1–11. [Google Scholar]
- Masks and N95 Respirators|FDA. Available online: https://www.fda.gov/medical-devices/personal-protective-equipment-infection-control/masks-and-n95-respirators (accessed on 18 February 2020).
- 3M™ Particulate Respirator 8210, N95 160 EA/Case|3M United States. Available online: https://www.3m.com/3M/en_US/company-us/all-3m-products/~/3M-Particulate-Respirator-8210-N95-160-EA-Case/?N=5002385+3294780268&rt=rud (accessed on 12 February 2020).
- FEI Quanta 650 SEM. Available online: https://www.fei.com/products/sem/Quanta-SEM-for-Materials-Science/ (accessed on 20 March 2020).
- Brohez, S.; Delvosalle, C.; Marlair, G. A two-thermocouples probe for radiation corrections of measured temperatures in compartment fires. Fire Saf. J. 2004, 39, 399–411. [Google Scholar] [CrossRef]
- Williams, A.; Jones, J.M.; Ma, L.; Pourkashanian, M. Pollutants from the combustion of solid biomass fuels. Prog. Energy Combust. Sci. 2012, 38, 113–137. [Google Scholar] [CrossRef]
- Andersson, B.; Andersson, R.; Håkansson, L.; Mortensen, M.; Sudiyo, R.; van Wachem, B. Computational Fluid Dynamics for Engineers; Cambridge University Press: Cambridge, UK, 2011; ISBN 9781107018952. [Google Scholar]
- Kantová, N.Č.; Sładek, S.; Jandačka, J.; Čaja, A.; Nosek, R. Simulation of biomass combustion with modified flue gas tract. Appl. Sci. 2021, 11, 1278. [Google Scholar] [CrossRef]
- Farokhi, M.; Birouk, M. Application of eddy dissipation concept for modeling biomass combustion, part 2: Gas-phase combustion modeling of a small-scale fixed bed furnace. Energy Fuels 2016, 30, 10800–10808. [Google Scholar] [CrossRef]
- Modest, M.F. Radiative Heat Transfer, 2nd ed.; Elsevier: Amsterdam, The Netherlands, 2003; ISBN 9780125031639. [Google Scholar]
- Johansson, R.; Leckner, B.; Andersson, K.; Johnsson, F. Account for variations in the H2O to CO2 molar ratio when modelling gaseous radiative heat transfer with the weighted-sum-of-grey-gases model. Combust. Flame 2011, 158, 893–901. [Google Scholar] [CrossRef]
- Yu, H.; Liu, F.; Chen, Y.; Liu, Y.; Zhang, Z. The influence of baffle on furnace heat transfer in municipal waste incinerator. In Proceedings of the 2011 International Conference on Materials for Renewable Energy & Environment, Piscataway, NJ, USA, 2011, 20–22 May; Volume 2, pp. 2044–2048. [CrossRef]
- Chalermsinsuwan, B.; Samruamphianskun, T.; Piumsomboon, P. Effect of operating parameters inside circulating fluidized bed reactor riser with ring baffles using CFD simulation and experimental design analysis. Chem. Eng. Res. Des. 2014, 92, 2479–2492. [Google Scholar] [CrossRef]
- Stepanov, B.L.; Pešenjanski, I.K.; Spasojević, M.D. Scandinavian baffle boiler design revisited. Therm. Sci. 2015, 19, 305–316. [Google Scholar] [CrossRef]
- Josephson, A.J.; Linn, R.R.; Lignell, D.O. Modeling soot formation from solid complex fuels. Combust. Flame 2018, 196, 265–283. [Google Scholar] [CrossRef]
- Stanmore, B.R.; Brilhac, J.F.; Gilot, P. The oxidation of soot: A review of experiments, mechanisms and models. Carbon 2001, 39, 2247–2268. [Google Scholar] [CrossRef]
Figure 1.
Schematic view of the grate-fired furnace (red arrows indicate the gas flow and dashed brown arrows show biomass movement).
Figure 1.
Schematic view of the grate-fired furnace (red arrows indicate the gas flow and dashed brown arrows show biomass movement).

Figure 2.
Raw coconut shell.

Figure 3.
Confirmation of mesh independent CFD results (profiles defined along a sampling line at y = 0.8 m and x = 0 to 0.2 m).
Figure 3.
Confirmation of mesh independent CFD results (profiles defined along a sampling line at y = 0.8 m and x = 0 to 0.2 m).

Figure 4.
Simulation model for CFD analysis ( ![Energies 14 03341 i001]() : temperature probes located at 100, 115, 145, 175, 205, and 305 cm from ash pit;
: temperature probes located at 100, 115, 145, 175, 205, and 305 cm from ash pit; ![Energies 14 03341 i002]() : wall temperature probe at 100 cm from ash pit; solid red line: particle injection surface).
: wall temperature probe at 100 cm from ash pit; solid red line: particle injection surface).
 : temperature probes located at 100, 115, 145, 175, 205, and 305 cm from ash pit;
  : wall temperature probe at 100 cm from ash pit; solid red line: particle injection surface).
Figure 4.
Simulation model for CFD analysis ( ![Energies 14 03341 i001]() : temperature probes located at 100, 115, 145, 175, 205, and 305 cm from ash pit;
: temperature probes located at 100, 115, 145, 175, 205, and 305 cm from ash pit; ![Energies 14 03341 i002]() : wall temperature probe at 100 cm from ash pit; solid red line: particle injection surface).
: wall temperature probe at 100 cm from ash pit; solid red line: particle injection surface).
: temperature probes located at 100, 115, 145, 175, 205, and 305 cm from ash pit; : wall temperature probe at 100 cm from ash pit; solid red line: particle injection surface).
Figure 5.
SEM result of PM collected on the filter for Exp 1 at 325 cm (chimney) measurement position.
Figure 5.
SEM result of PM collected on the filter for Exp 1 at 325 cm (chimney) measurement position.

Figure 6.
Comparison between PM filter N95 and PM sensor SDS011 at different sampling locations inside the furnace.
Figure 6.
Comparison between PM filter N95 and PM sensor SDS011 at different sampling locations inside the furnace.

Figure 7.
Average PM10 concentration in the chimney for the supplementary experiments.

Figure 8.
PM10 measurement result for the system with and without baffle and for the system with and without primary air preheater (EA: excess air, PA: primary air).
Figure 8.
PM10 measurement result for the system with and without baffle and for the system with and without primary air preheater (EA: excess air, PA: primary air).

Figure 9.
Gas temperature distribution (a,c) and particle path lines colored by particles temperature (b,d) for the system without (Exp 1) and with baffles (Exp 4).
Figure 9.
Gas temperature distribution (a,c) and particle path lines colored by particles temperature (b,d) for the system without (Exp 1) and with baffles (Exp 4).

Figure 10.
Residence time distributions of inert particles for the baffled and no-baffled furnace.

Figure 11.
PM10 measurement for different levels of excess air, and by utilization of secondary air injection (EA: excess air, PA: primary air).
Figure 11.
PM10 measurement for different levels of excess air, and by utilization of secondary air injection (EA: excess air, PA: primary air).

Figure 12.
Comparison of experimental and calculated PM10 concentration value from kinetic study.


Table 1.
Operating conditions in the main experimental plan.
| Experiment ID | % Excess Air | Air Temperature (°C) | Baffle | Number of Repeated Experiments | Total Number of Measurement Data |
|---|---|---|---|---|---|
| Exp 1 | 90 | 30 | No | 5 | 35 |
| Exp 2 | 90 | 70 | No | 3 | 22 |
| Exp 3 | 80 | 30 | No | 2 | 12 |
| Exp 4 | 90 | 30 | Yes | 2 | 14 |
| Exp 5 | 90 | 75 | Yes | 2 | 14 |
Table 2.
Supplementary experiments to assess measurement sensitivity *.
| Experiment ID | Biomass Size (cm) | Biomass Distribution | Number of Repeated Experiments | Total Number of Measurement Data |
|---|---|---|---|---|
| Exp 6 | 4 | Uniform | 1 | 10 |
| Exp 7 | 7 | Uniform | 1 | 8 |
| Exp 8 | 5–10 | Centered | 1 | 5 |
* All experiments in Table 2 use 90% excess air, no baffle, and primary air at 30 °C.
Table 3.
Ultimate and proximate analysis results (%adb) *.
| Ultimate Analysis (%Mass) | Proximate Analysis (%Mass) | ||||||
|---|---|---|---|---|---|---|---|
| Carbon | Hydrogen | Oxygen | Nitrogen | Volatile | Ash | Fixed Carbon | Moisture |
| 47.5 | 6.23 | 45.47 | 0.11 | 72.4 | 0.6 | 19.4 | 7.6 |
* adb: air dried basis or without free moisture content.
Table 4.
Temperature and CO2 composition measurement and calculation result *.
| Experiment ID | % Mole CO2 | 100 cm (°C) | 115 cm (°C) | Thermocouples Average (°C) | Chimney (°C) | Wall (°C) | ||||||||||||
|---|---|---|---|---|---|---|---|---|---|---|---|---|---|---|---|---|---|---|
| Exp | CFD | Exp | CFD | Exp | CFD | Exp | CFD | Exp | CFD | Exp | CFD | |||||||
| Exp 1 | 9.59 | ±0.35 | 10.2 | 763 | ±2 | 780 | 775 | ±8 | 767 | 772 | ±7 | 771 | 819 | ±9 | 813 | 733 | ±5 | 732 |
| Exp 2 | 9.95 | ±0.77 | 10.2 | 823 | ±10 | 812 | 835 | ±15 | 796 | 828 | ±11 | 800 | 854 | ±31 | 833 | 761 | ±7 | 763 |
| Exp 3 | 10.5 | ±0.4 | 10.6 | 800 | ±10 | 805 | 789 | ±7 | 792 | 795 | ±8 | 796 | 846 | ±12 | 828 | 789 | ±3 | 759 |
| Exp 4 | 10.1 | ±0.78 | 10.2 | 835 | ±26 | 879 | 818 | ±25 | 853 | 810 | ±25 | 847 | 770 | ±7 | 759 | 764 | ±5 | 797 |
| Exp 5 | 9.78 | ±0.43 | 10.2 | 825 | ±30 | 908 | 842 | ±19 | 877 | 833 | ±24 | 871 | 801 | ±4 | 783 | 764 | ±4 | 823 |
* Chimney temperature sampled at 305 cm from ash pit; thermocouples average is the average value of 100, 115, 145, 175, and 205 cm thermocouple measurement. See Figure 4 for detail thermocouple coordinate.
Publisher’s Note: MDPI stays neutral with regard to jurisdictional claims in published maps and institutional affiliations. |
© 2021 by the authors. Licensee MDPI, Basel, Switzerland. This article is an open access article distributed under the terms and conditions of the Creative Commons Attribution (CC BY) license (https://creativecommons.org/licenses/by/4.0/).
Share and Cite
MDPI and ACS Style
Nugraha, M.G.; Saptoadi, H.; Hidayat, M.; Andersson, B.; Andersson, R. Particulate Matter Reduction in Residual Biomass Combustion. Energies 2021, 14, 3341. https://0-doi-org.brum.beds.ac.uk/10.3390/en14113341
AMA Style
Nugraha MG, Saptoadi H, Hidayat M, Andersson B, Andersson R. Particulate Matter Reduction in Residual Biomass Combustion. Energies. 2021; 14(11):3341. https://0-doi-org.brum.beds.ac.uk/10.3390/en14113341
Chicago/Turabian StyleNugraha, Maulana G., Harwin Saptoadi, Muslikhin Hidayat, Bengt Andersson, and Ronnie Andersson. 2021. "Particulate Matter Reduction in Residual Biomass Combustion" Energies 14, no. 11: 3341. https://0-doi-org.brum.beds.ac.uk/10.3390/en14113341
Note that from the first issue of 2016, this journal uses article numbers instead of page numbers. See further details here.